Techno-Economic Assessment of Whey Protein-Based Plastic Production from a Co-Polymerization Process


Abstract
1. Introduction
2. Materials and Methods
2.1. Software
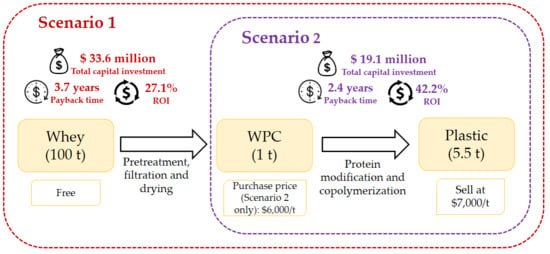
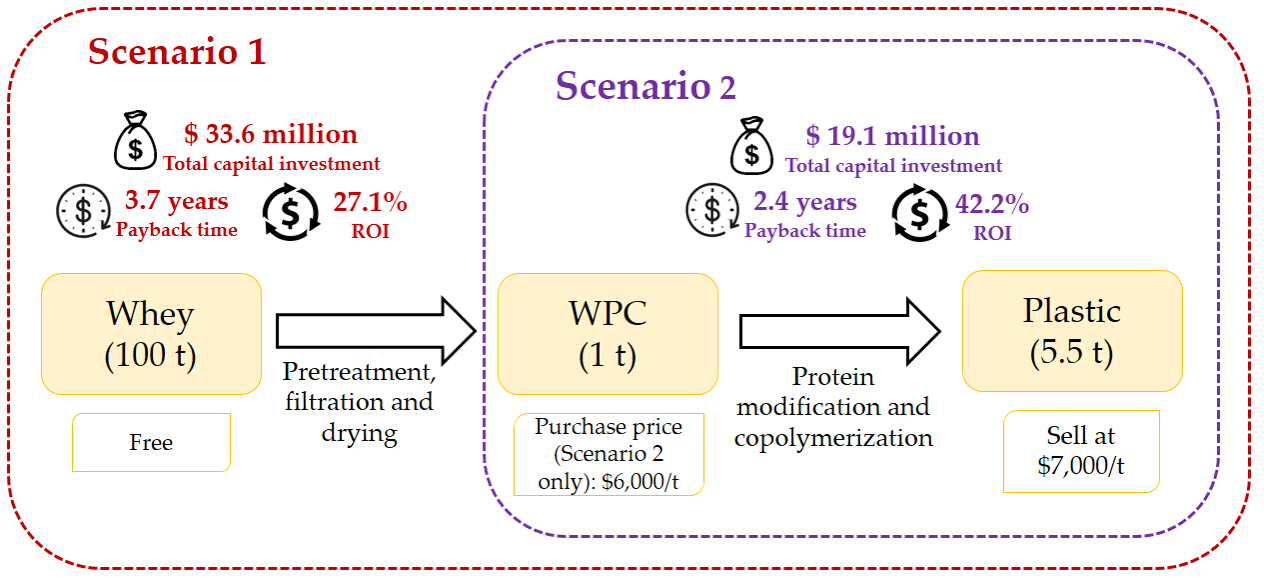
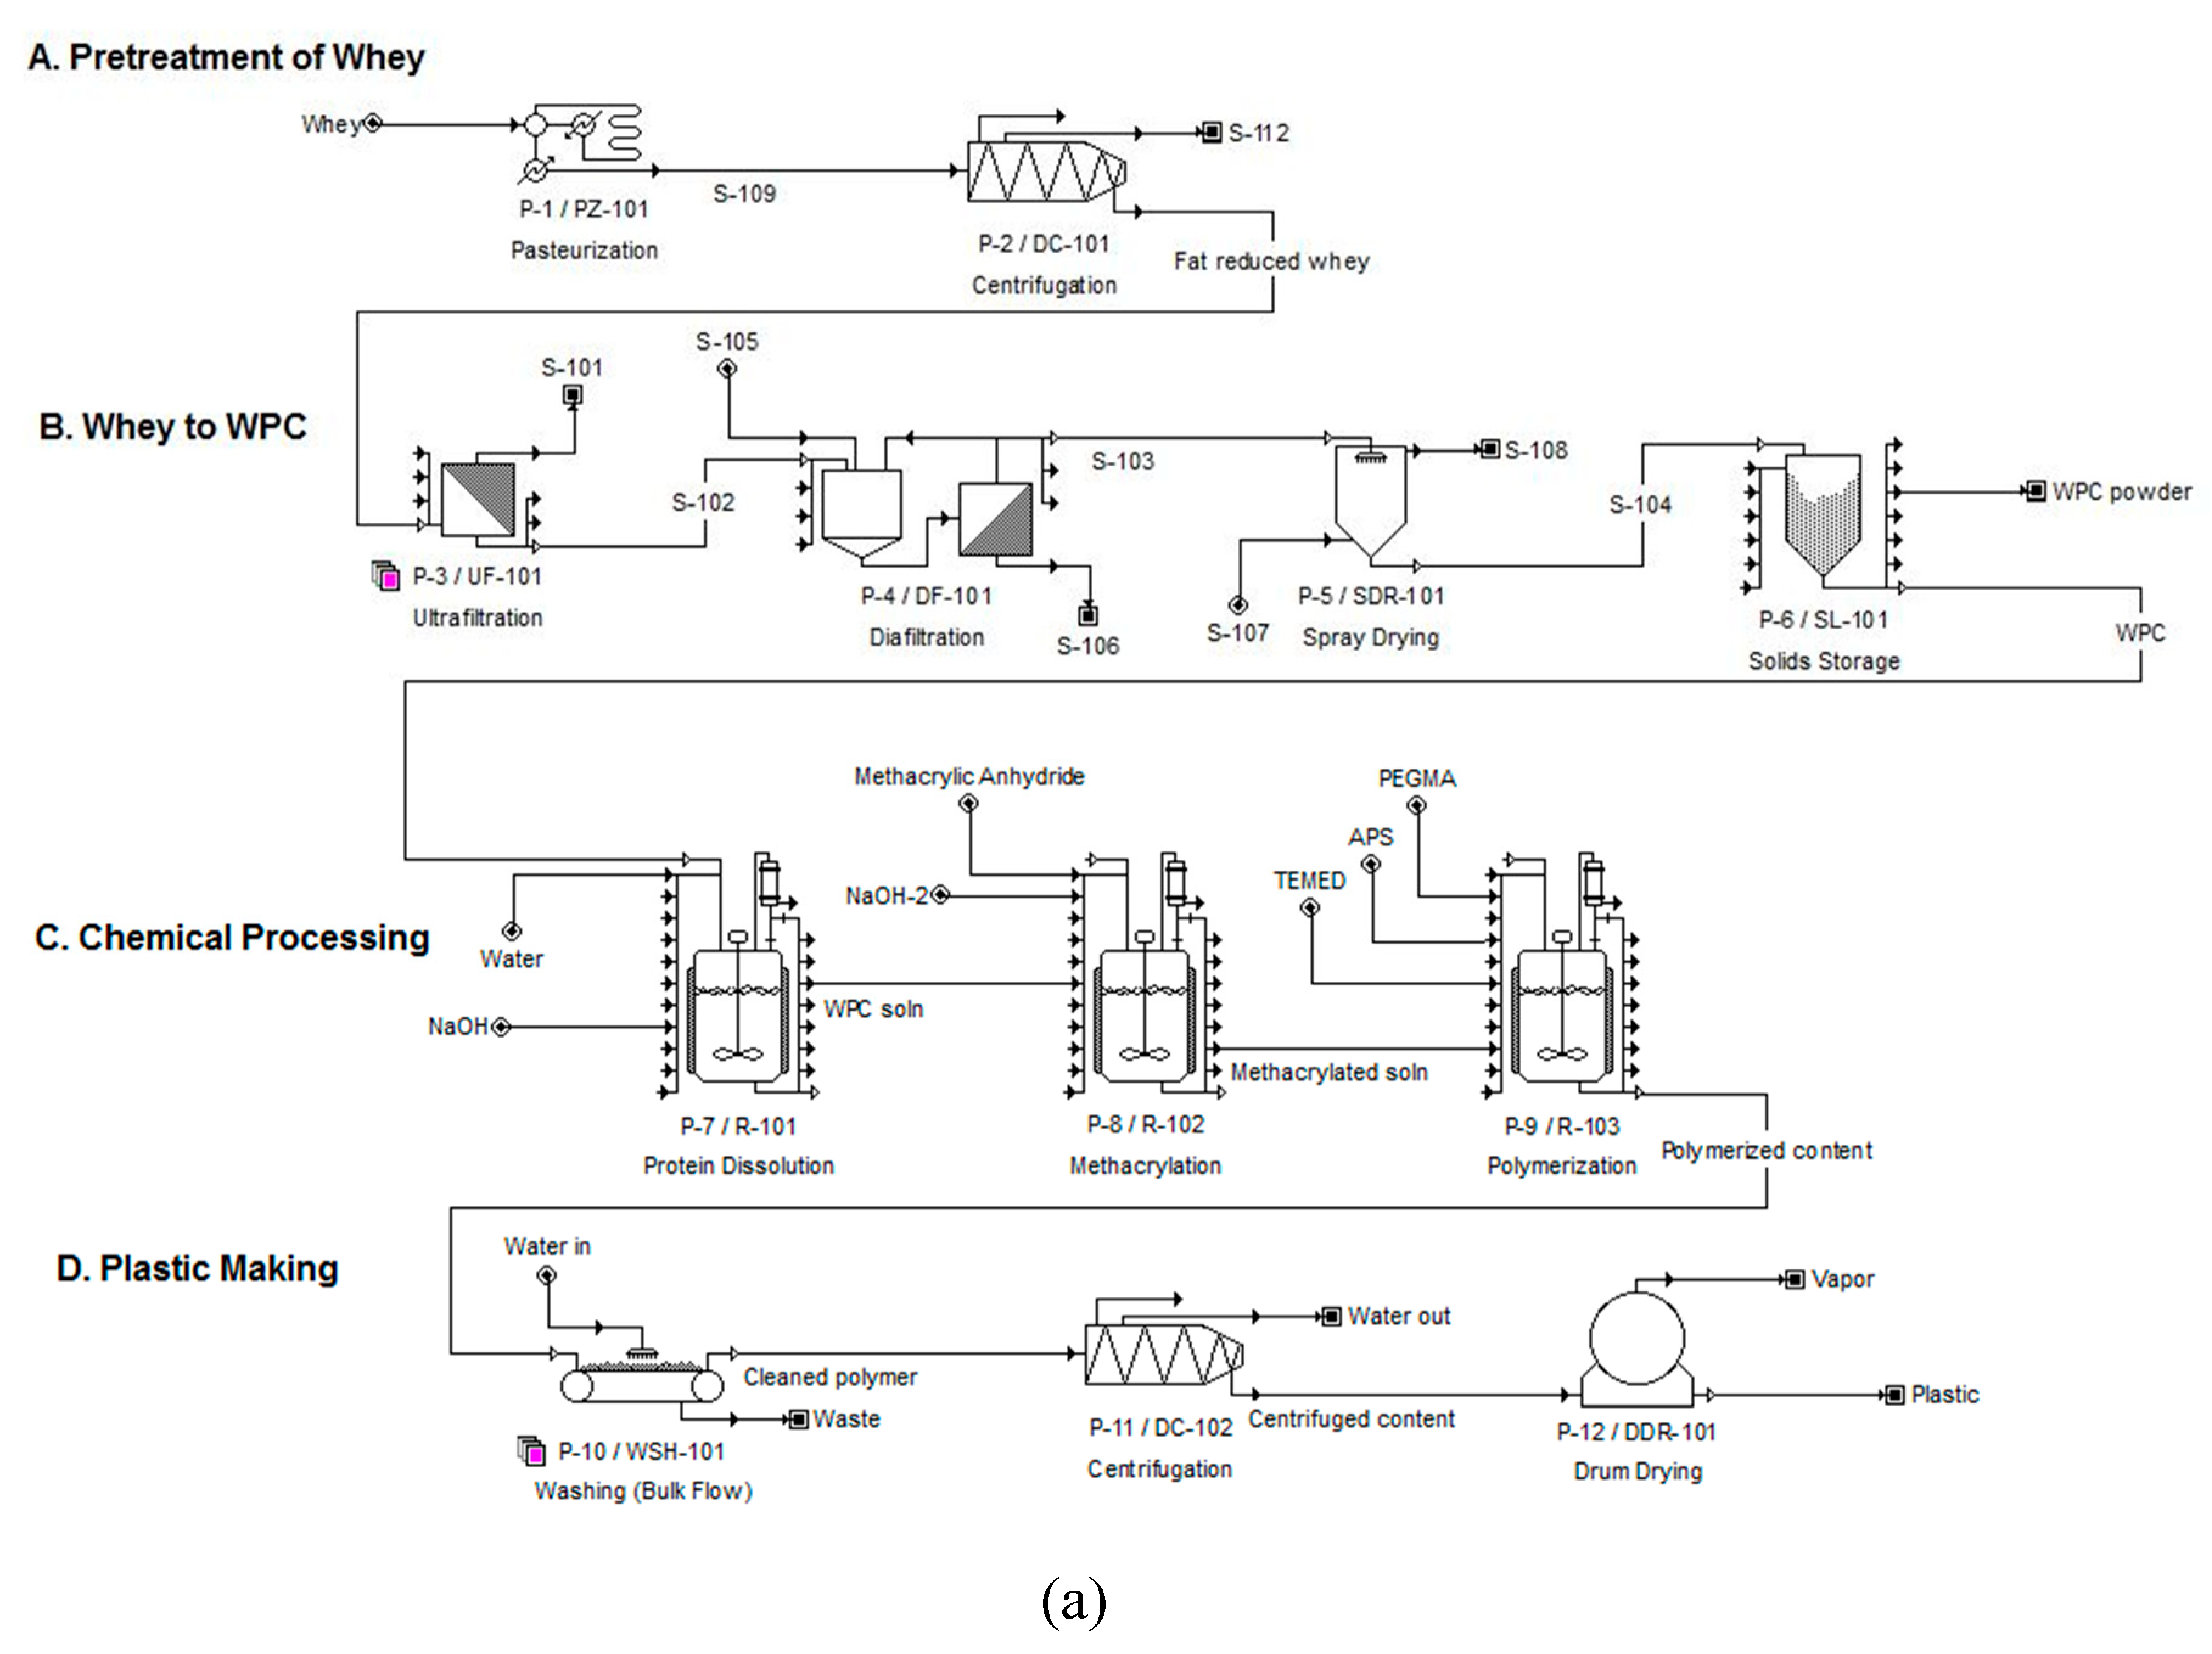
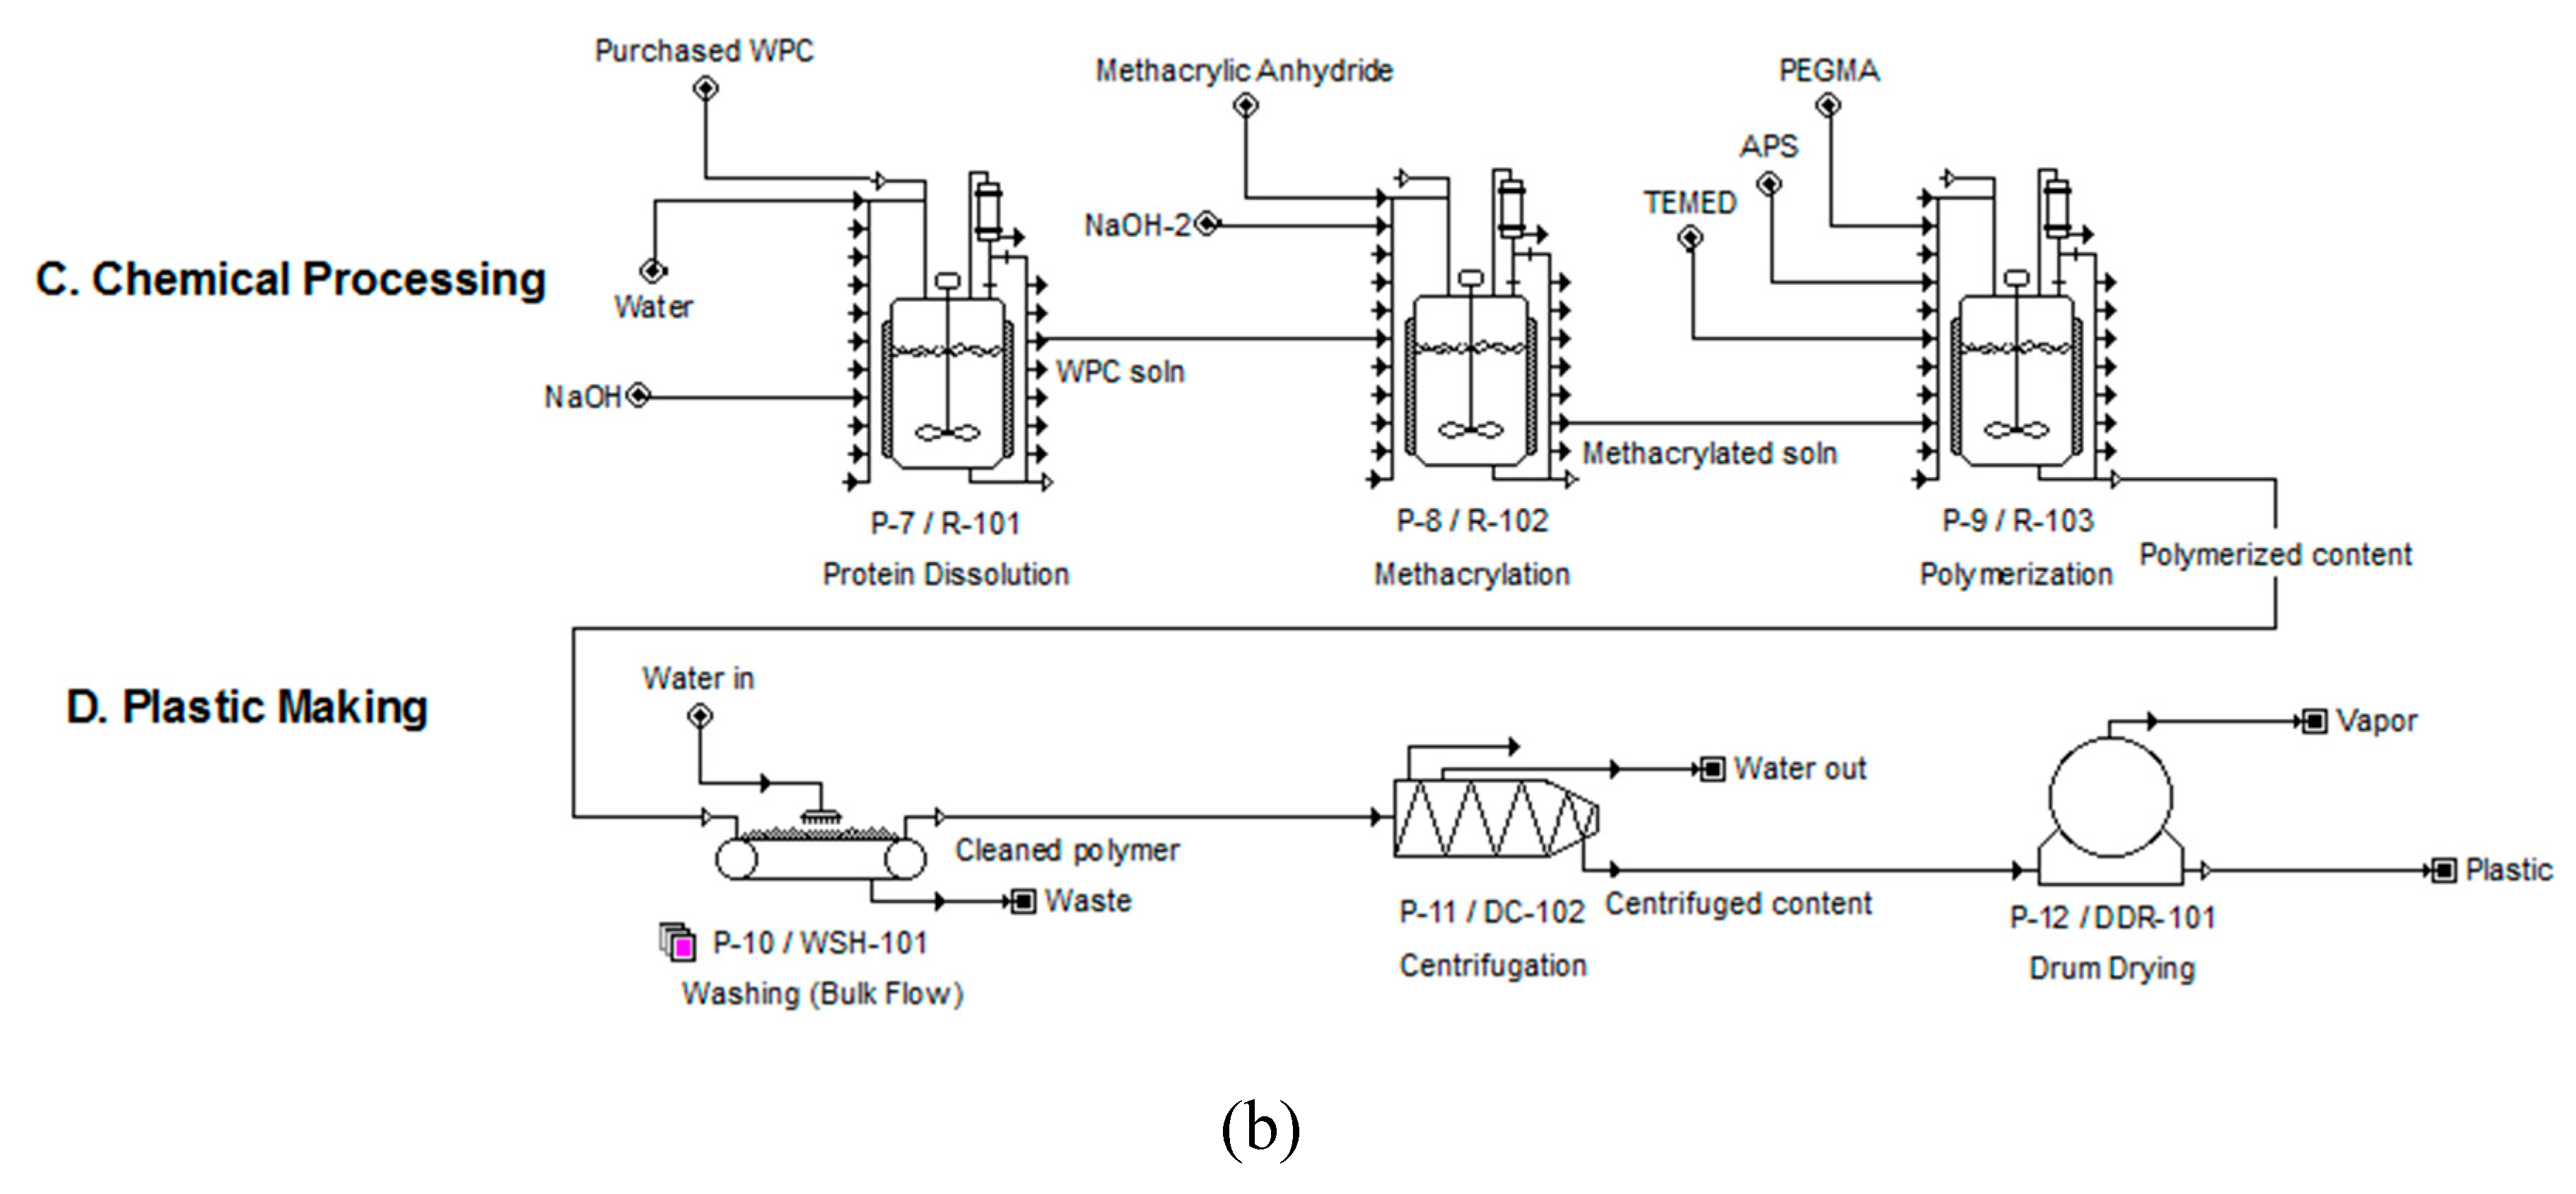
2.2. Process Description
2.2.1. Step A: Pretreatment of Whey
P-1/PZ-101 Pasteurization
P-2/DC-101 Centrifugation
2.2.2. Step B: Production of WPC from Whey
P-3/UF-101 Ultrafiltration
P-4/DF-101 Diafiltration
P-5/SDR-101 Spray Drying
P-6/SL-101 Solids Storage
2.2.3. Step C: Chemical Processing
P-7/R-101 Protein Dissolution
P-8/R-102 Methacrylation
P-9/R-103 Polymerization
2.2.4. Step D: Plastic Making
P-10/WSH-101 Washing
P-11/DC-102 Centrifugation
P-12/DDR-101 Drum Drying
2.3. Feedstocks
2.4. Other chemicals
2.5. Economic Evaluation
3. Results and Discussion
3.1. Economic Results
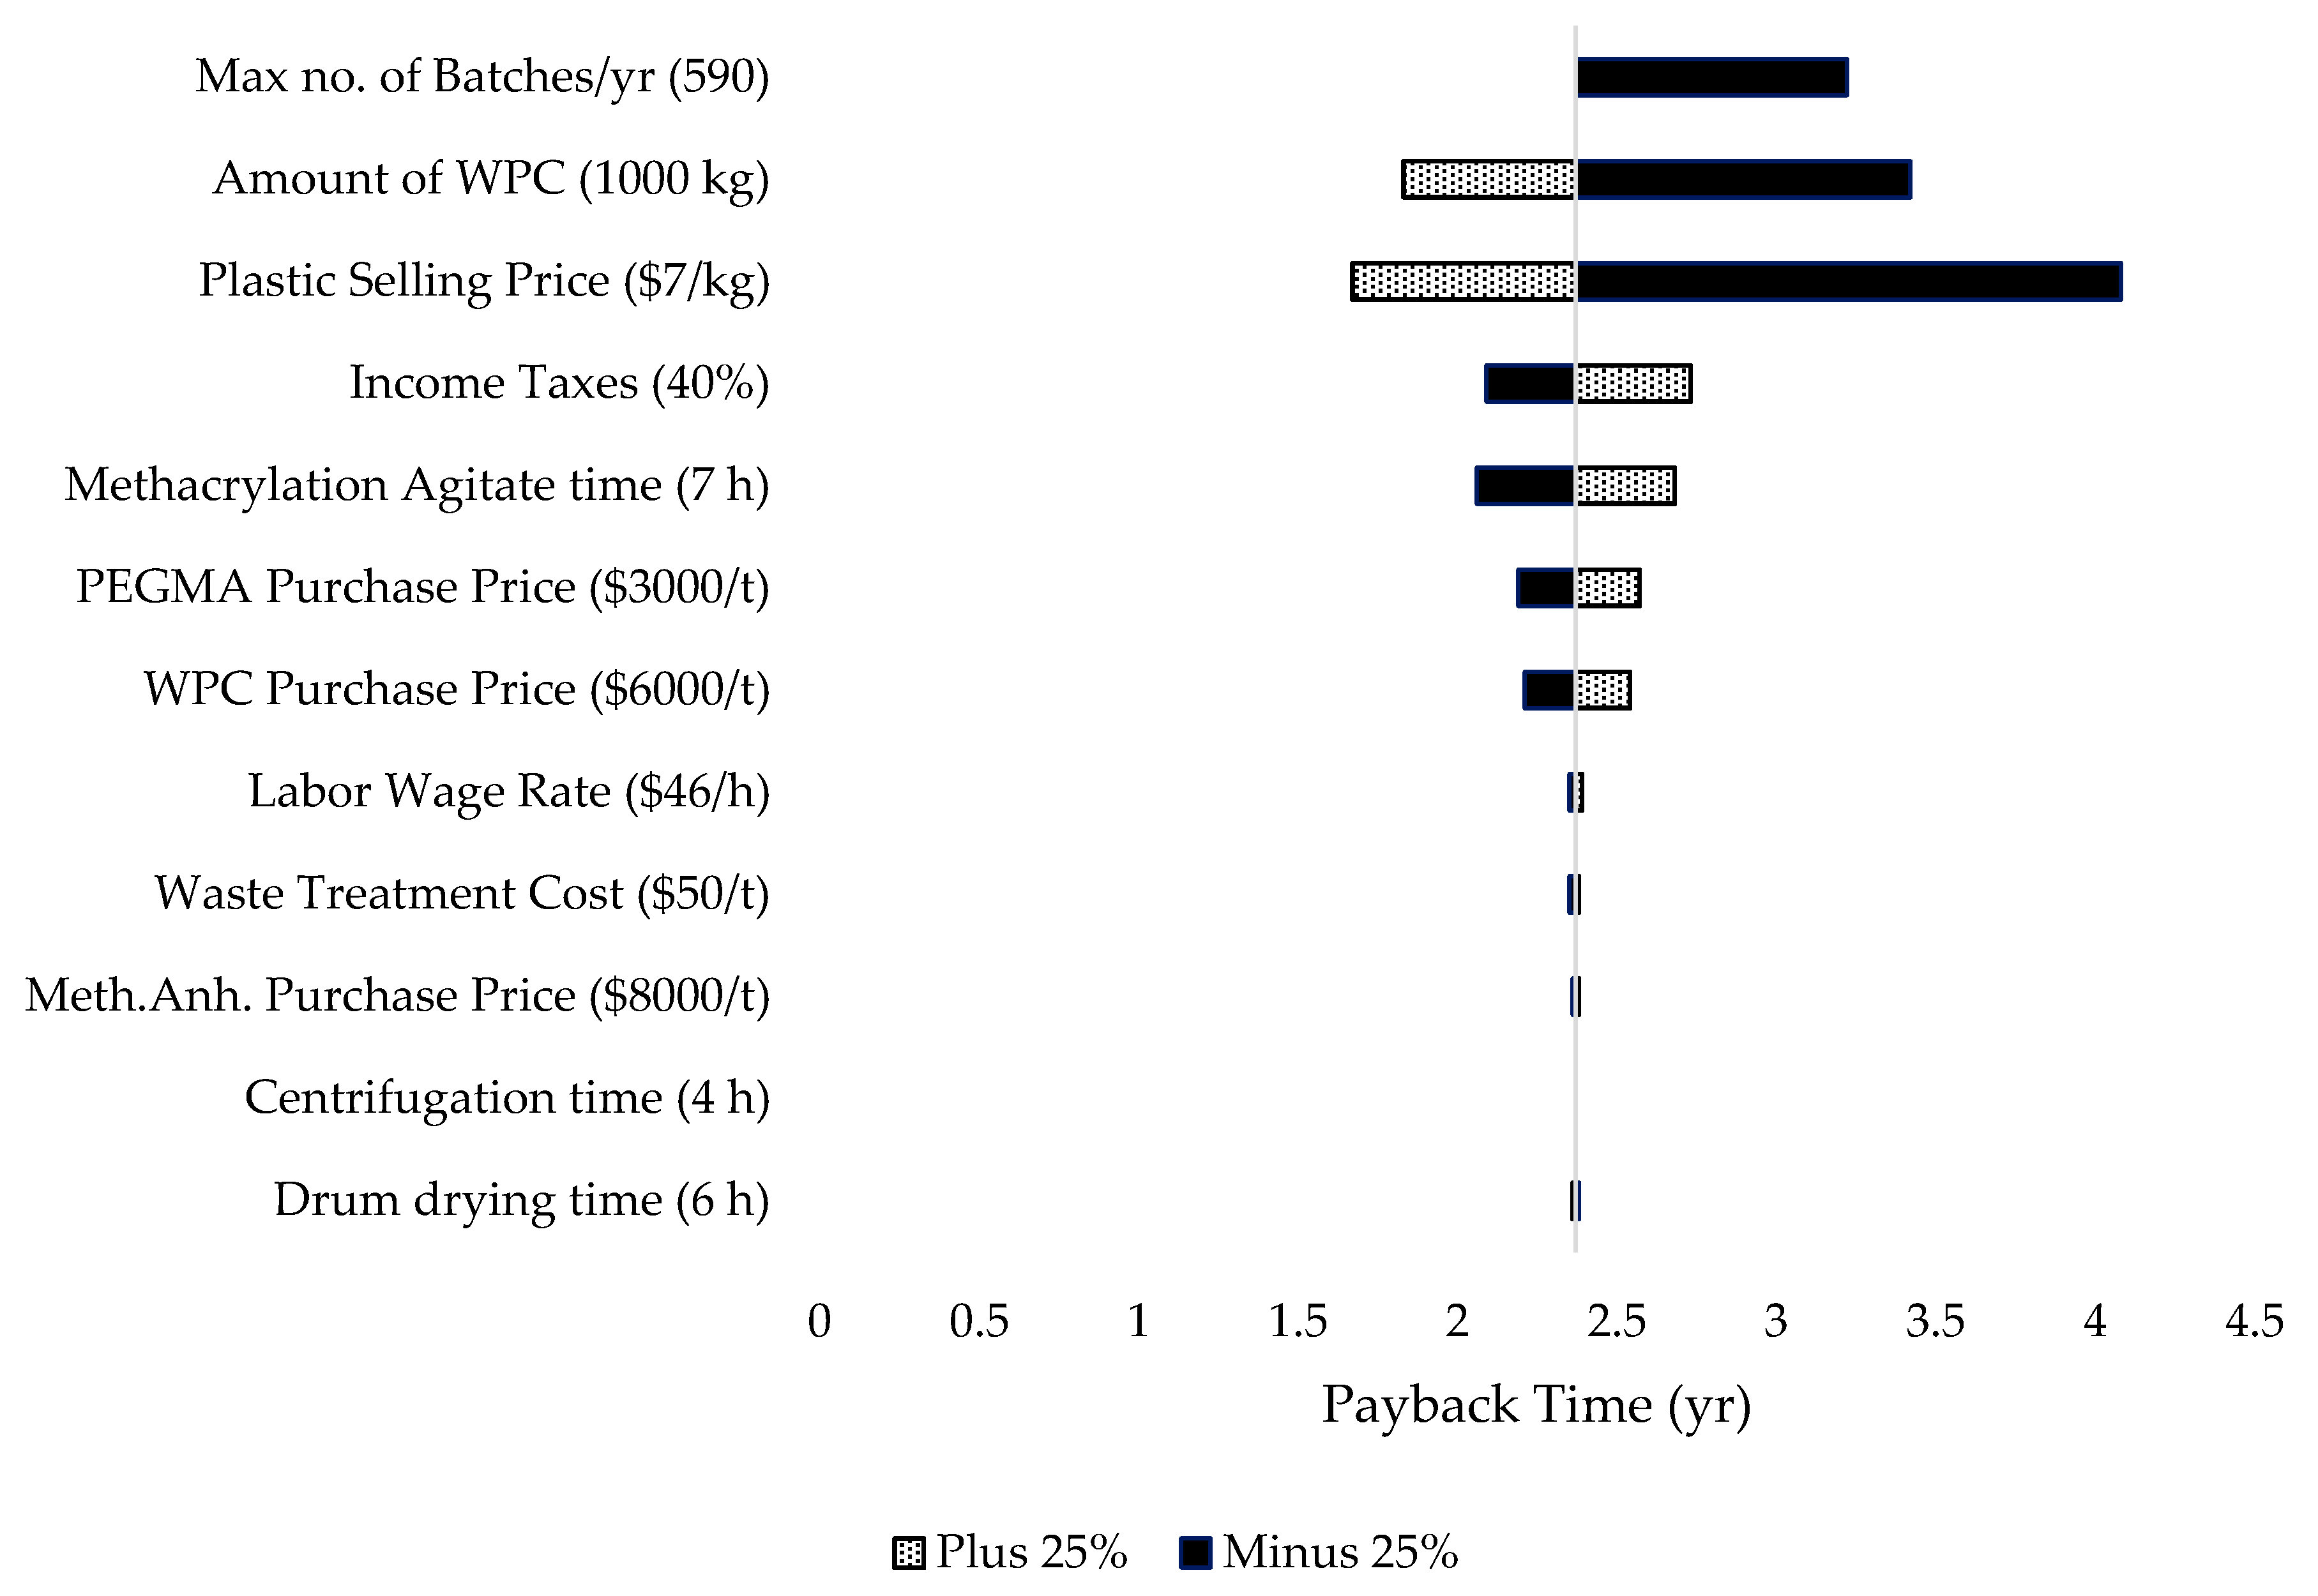
3.2. Sensitivity and Parametric Analyses
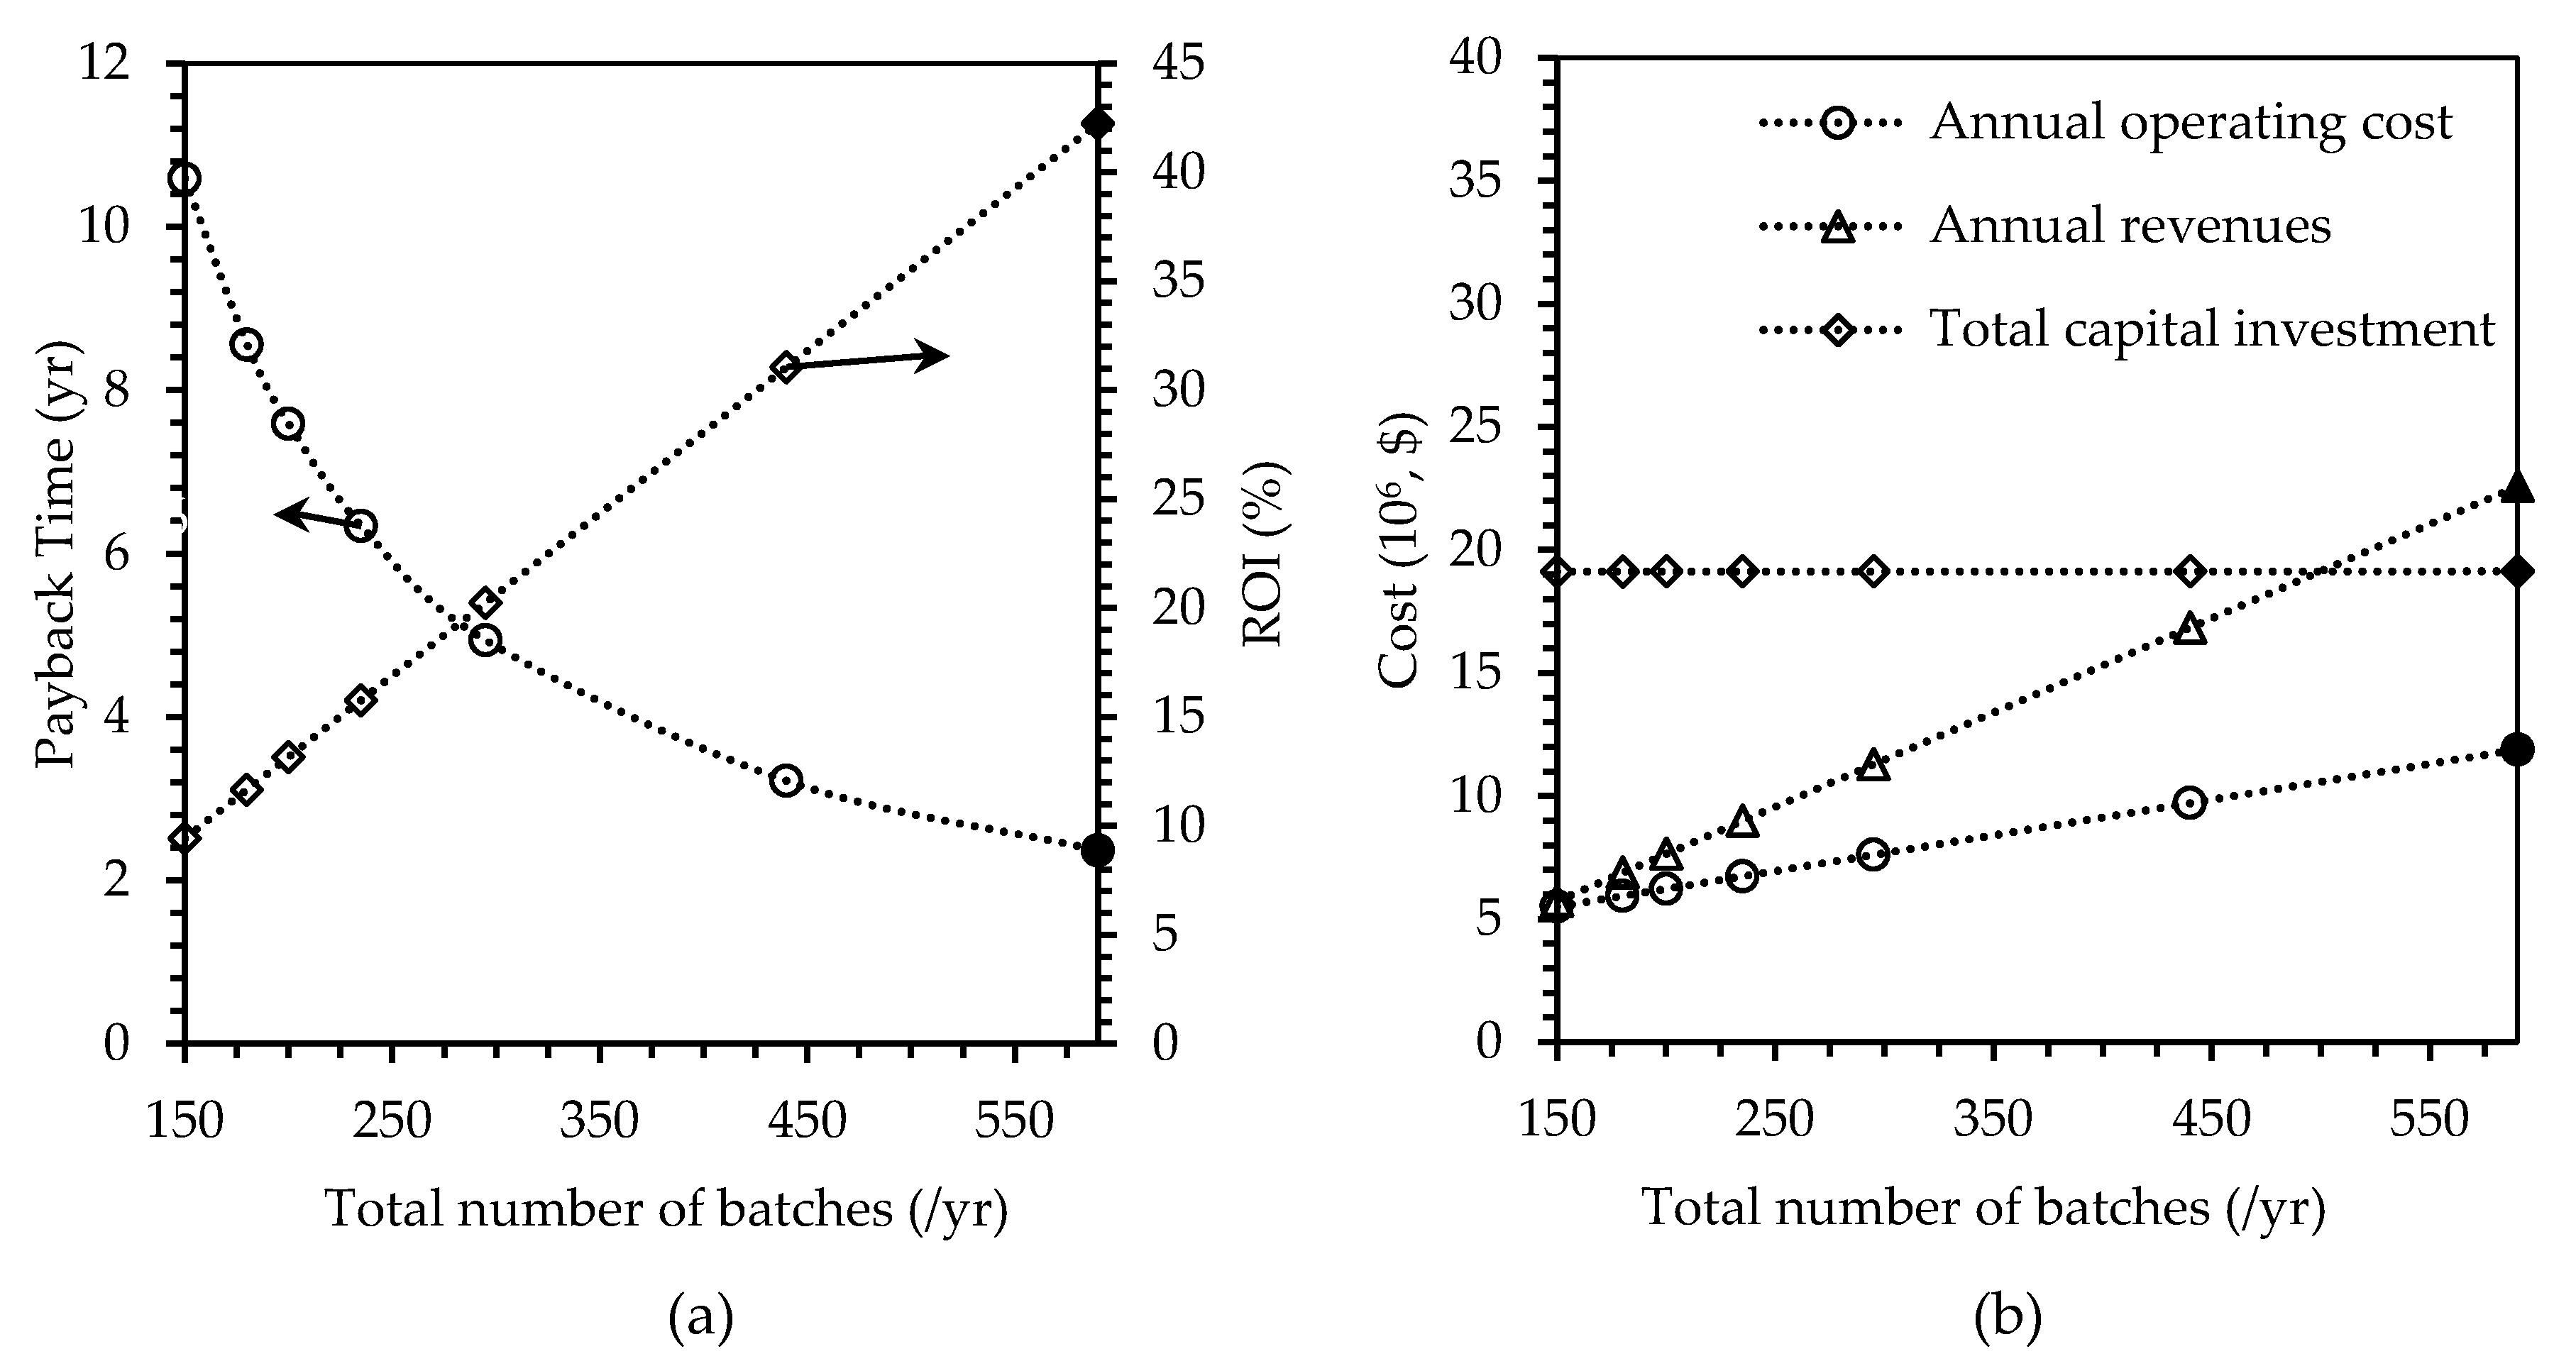
3.2.1. Internal Parameters
Number of Batches
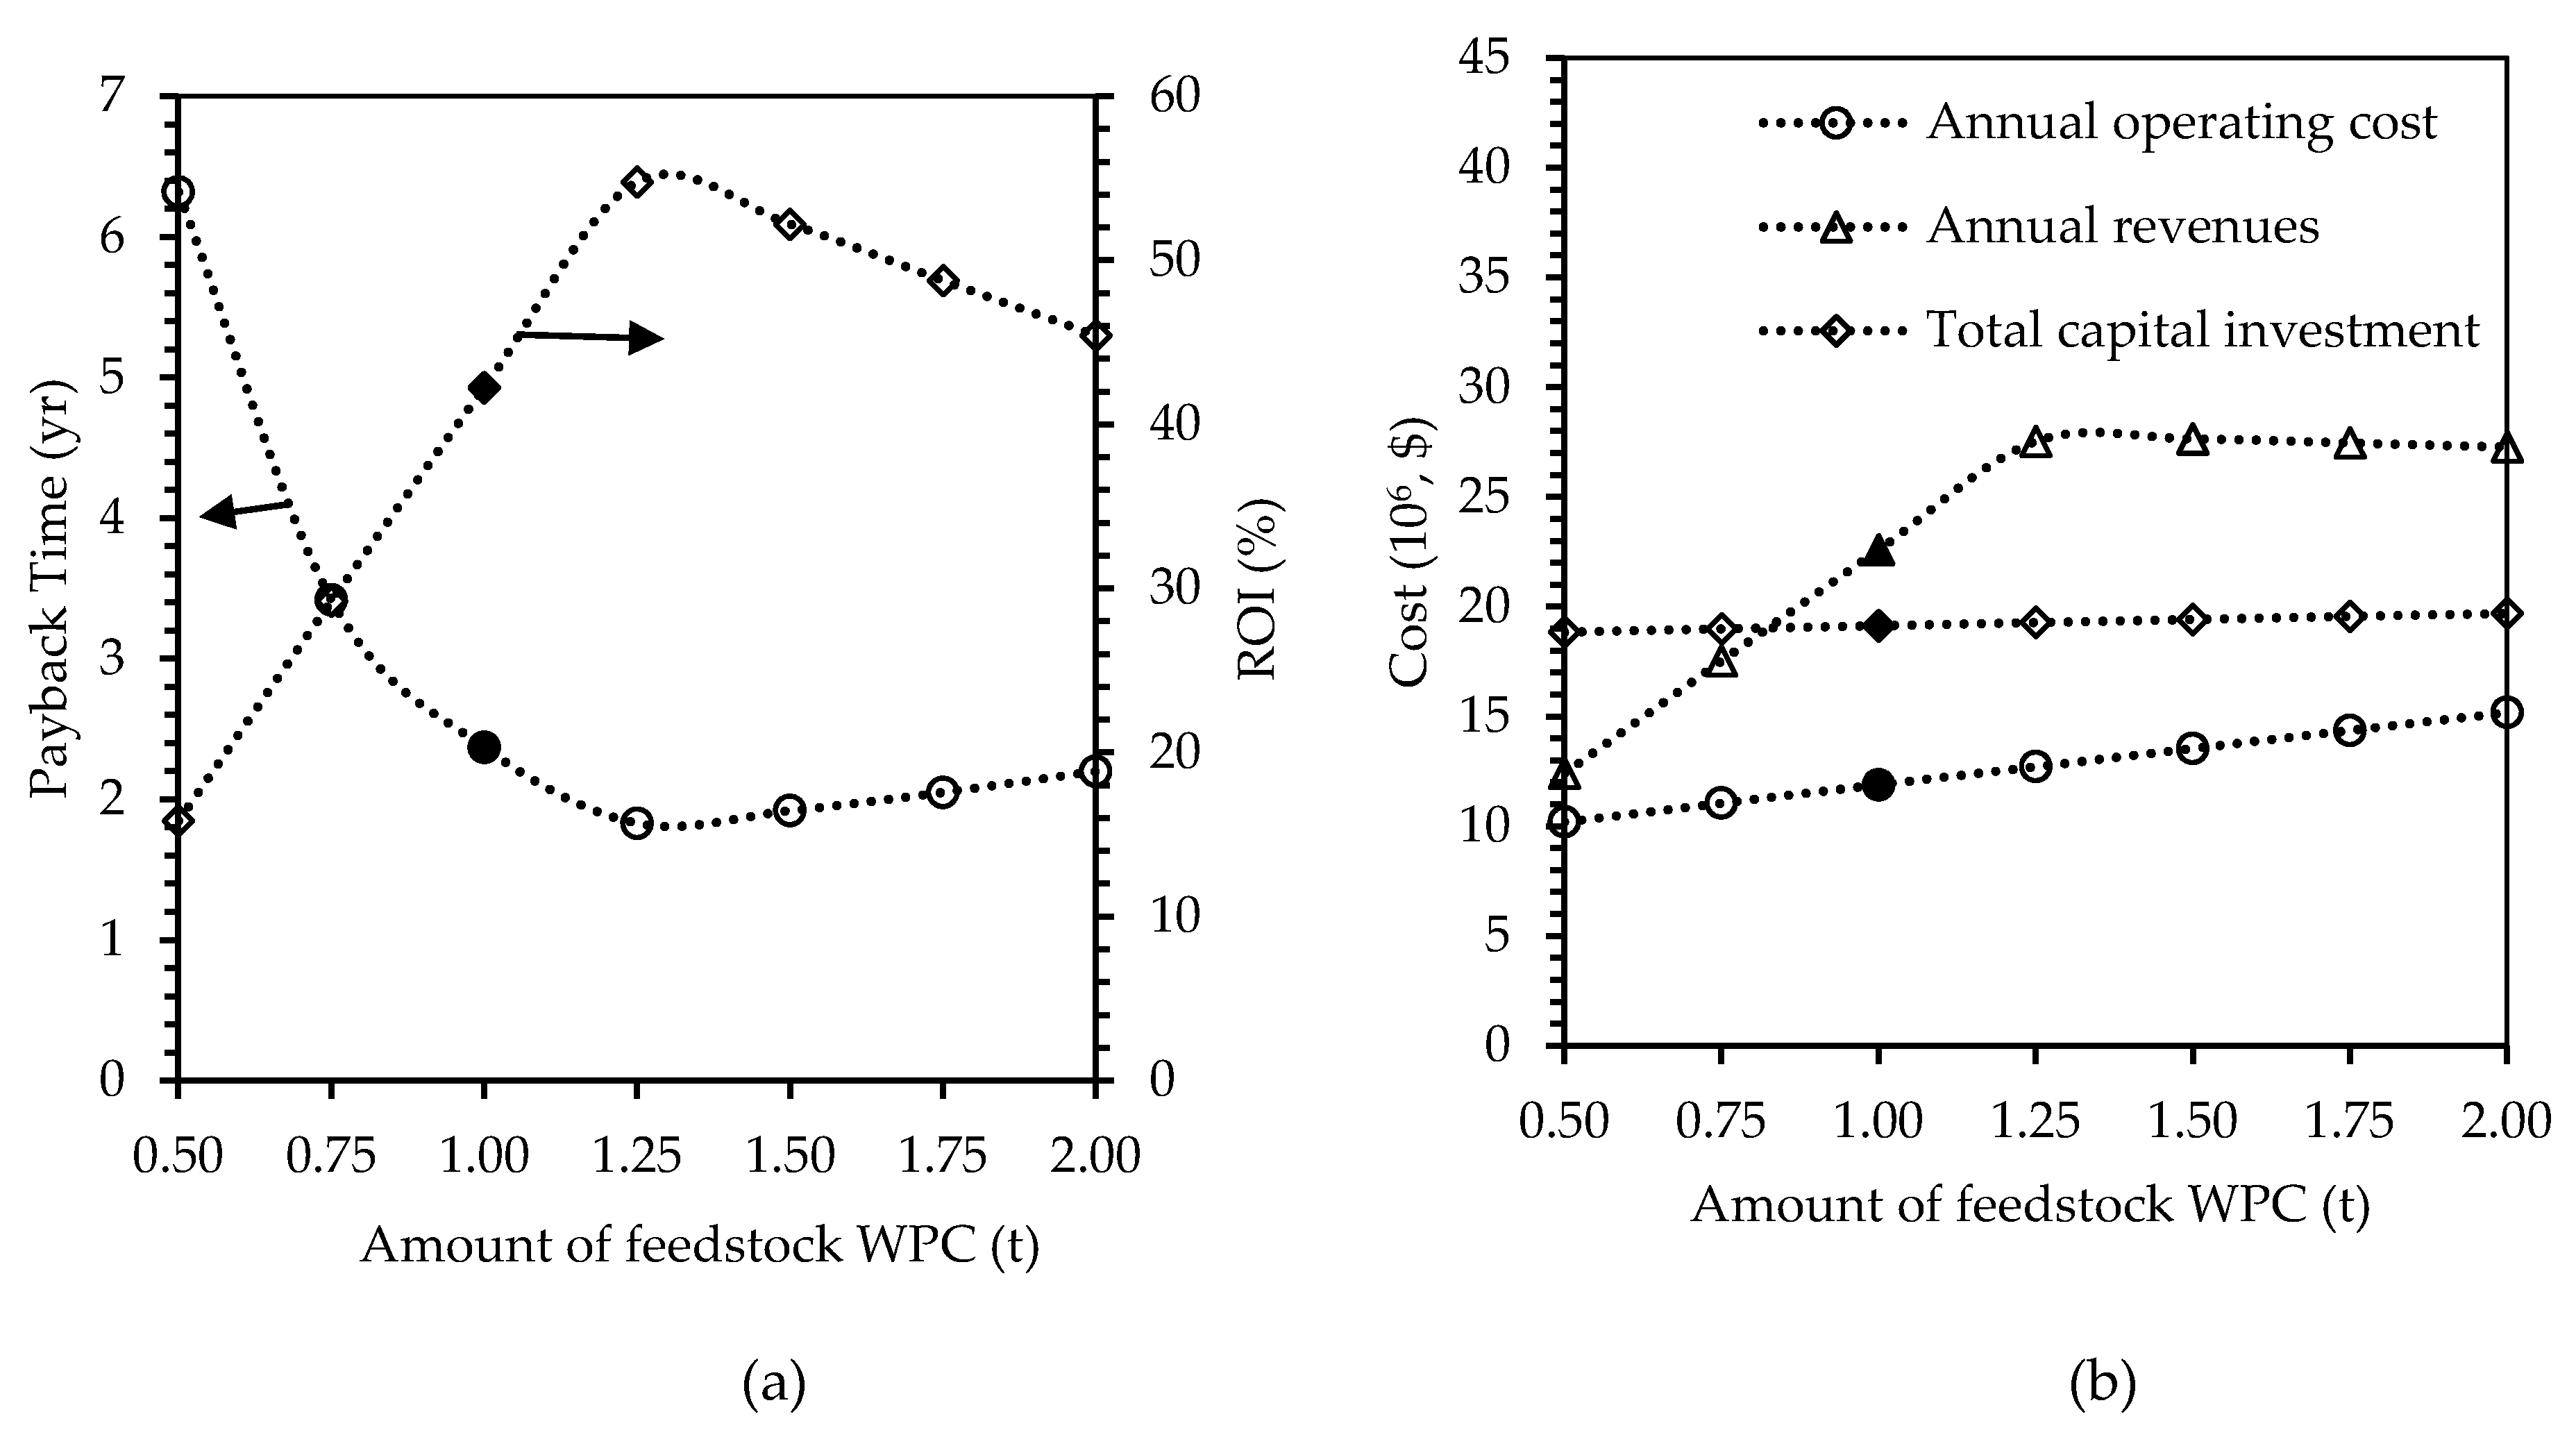
Amount of Feedstock
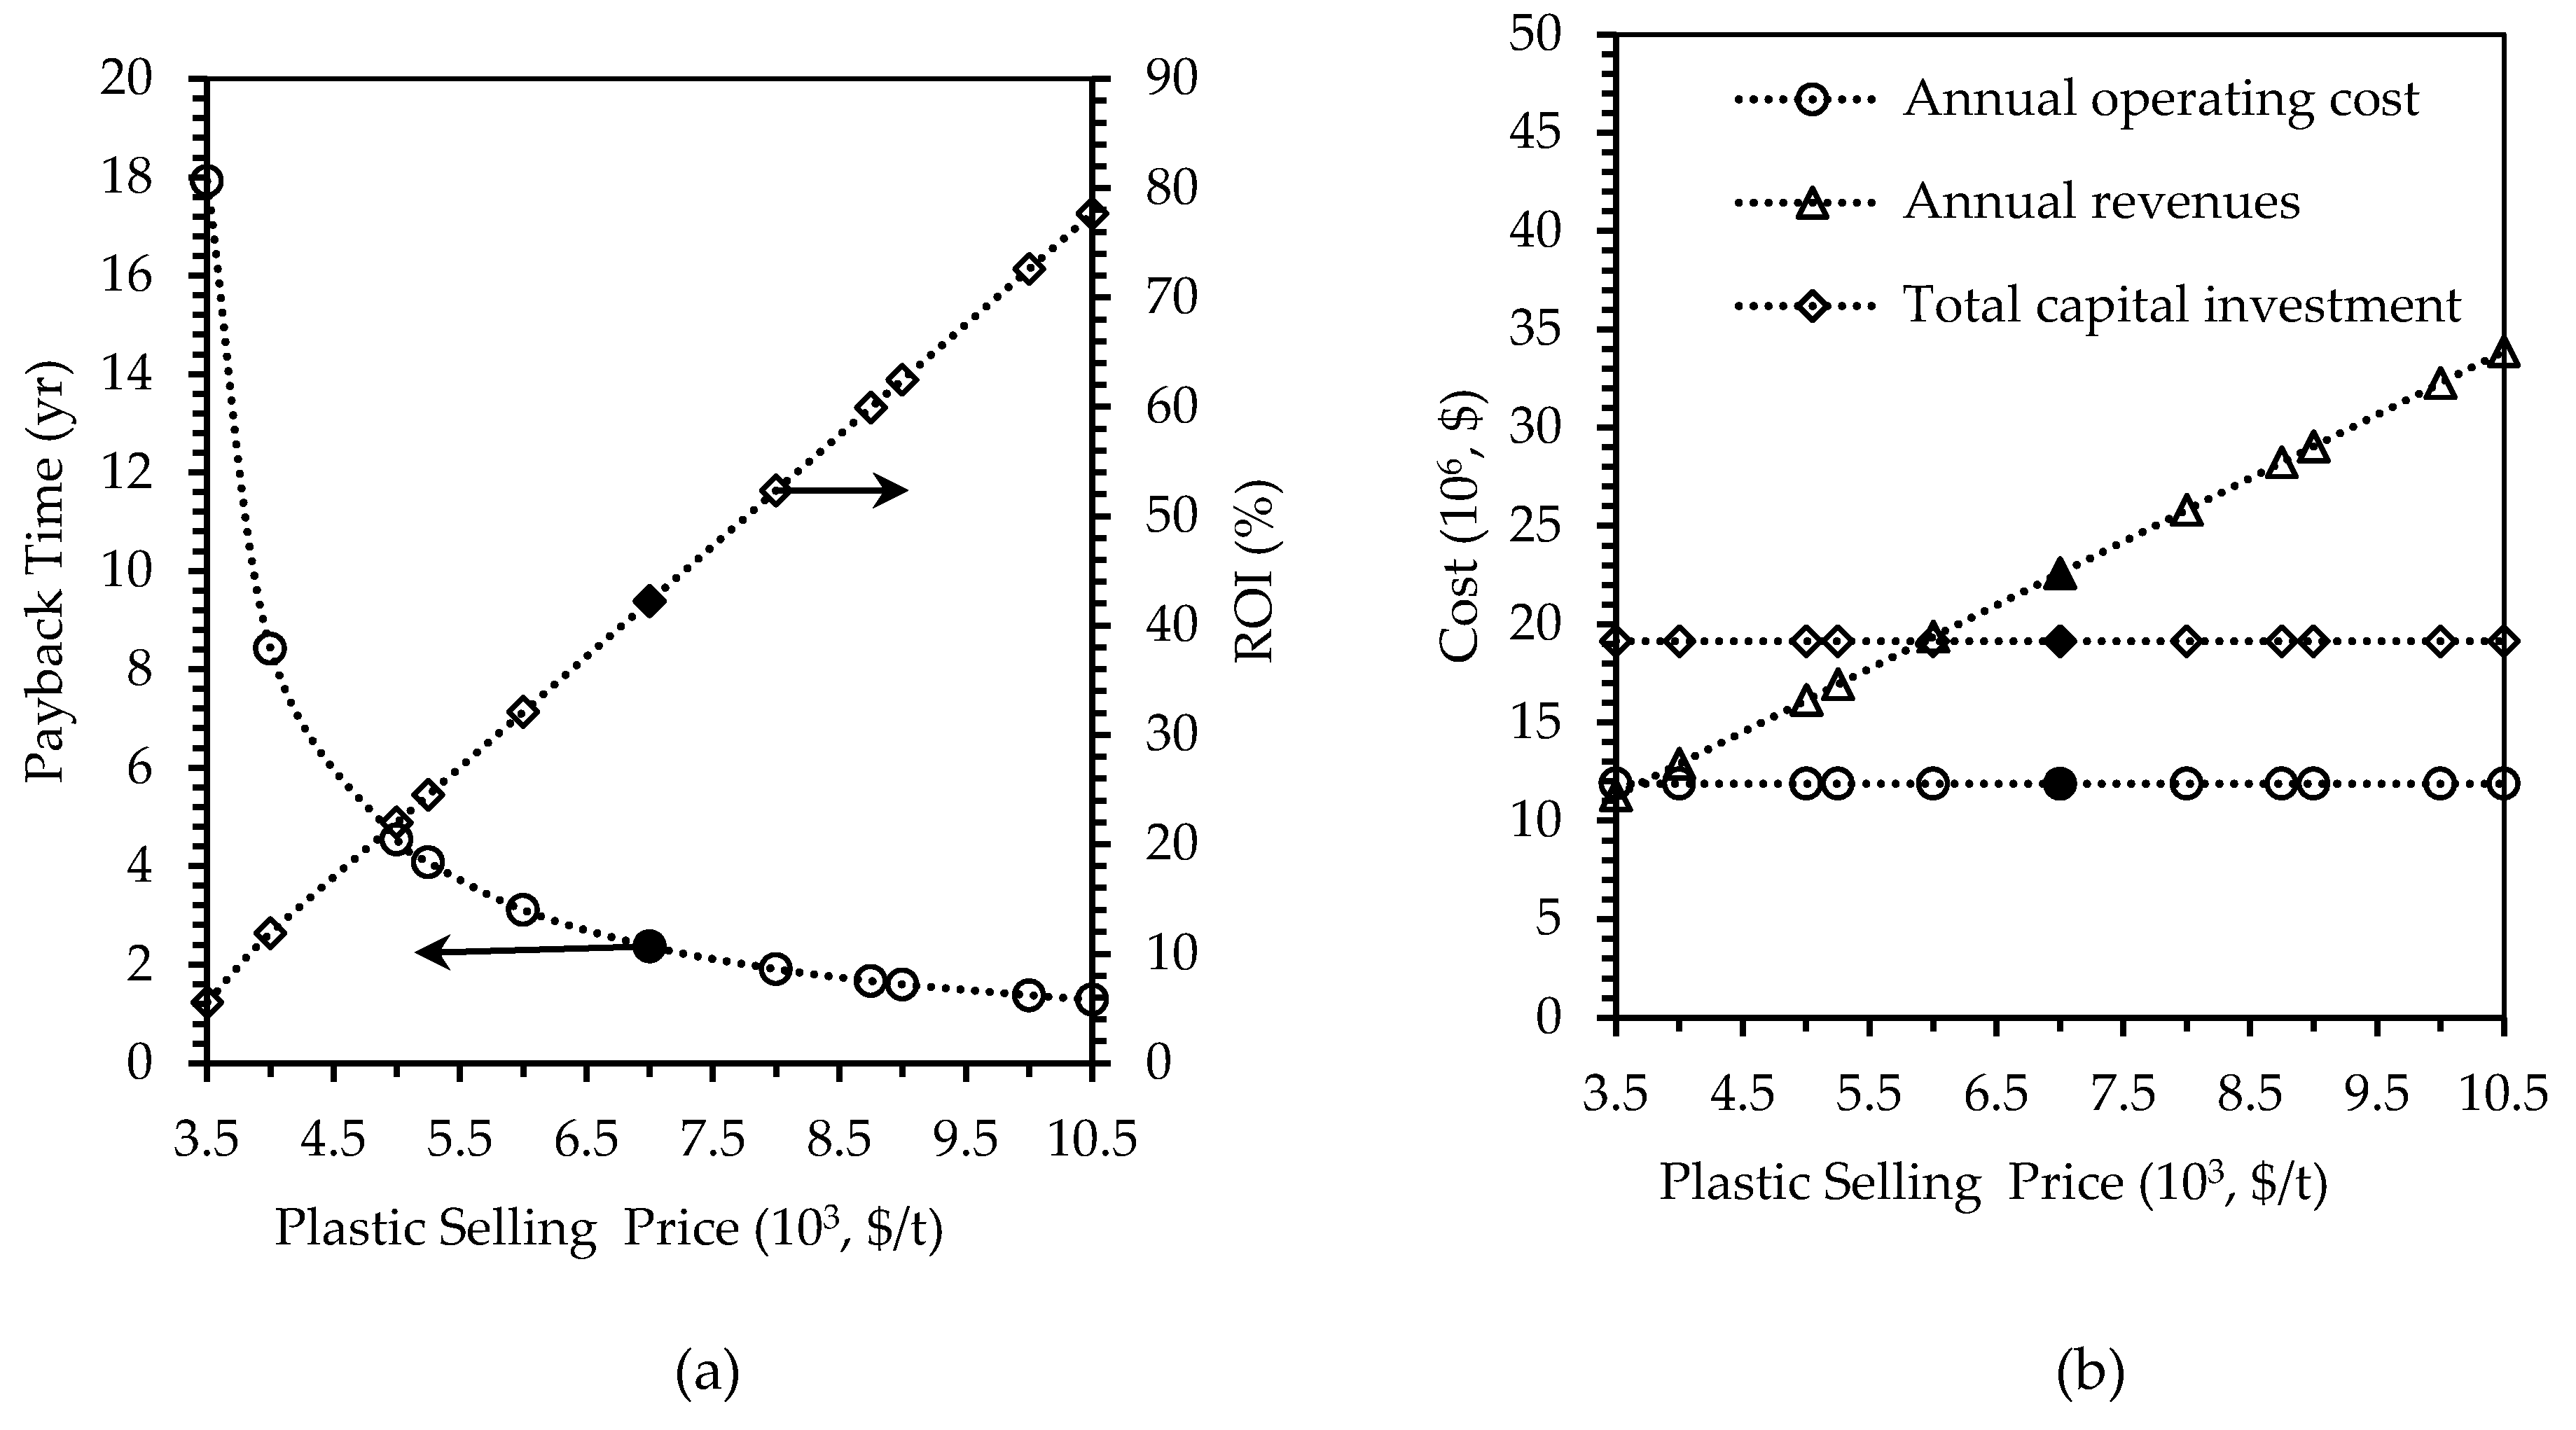
Selling Price of Plastic Product
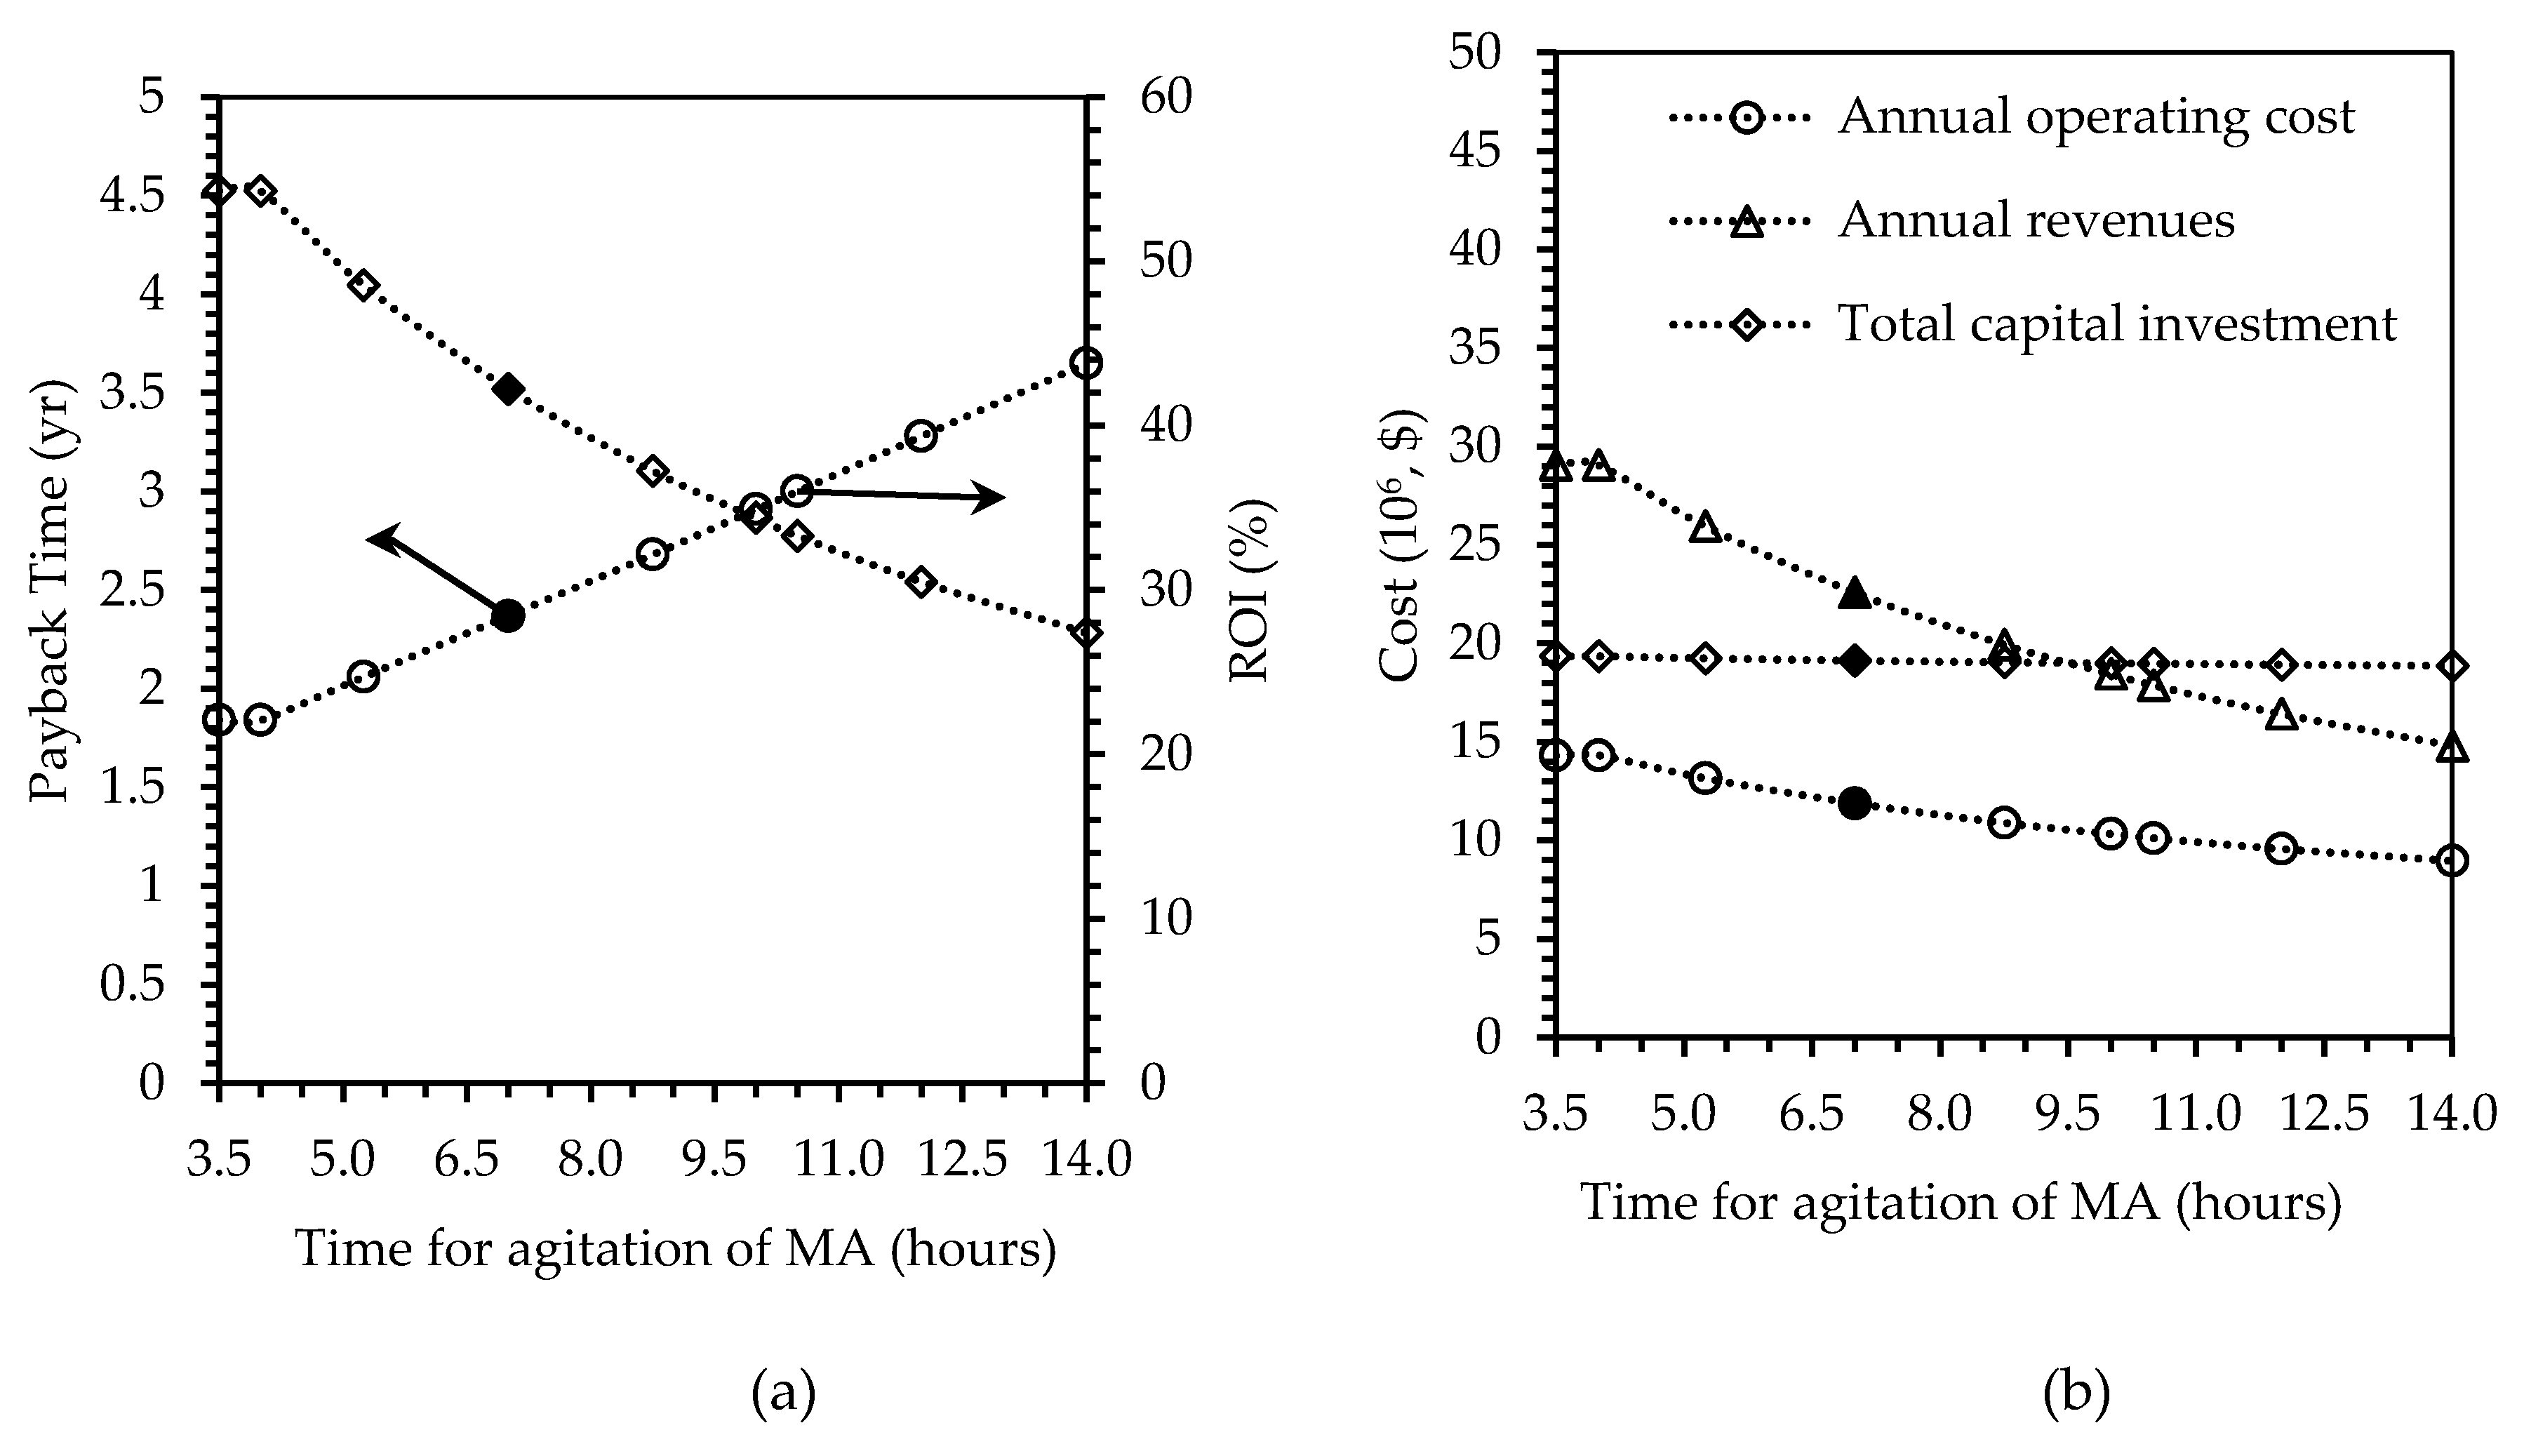
Process Time
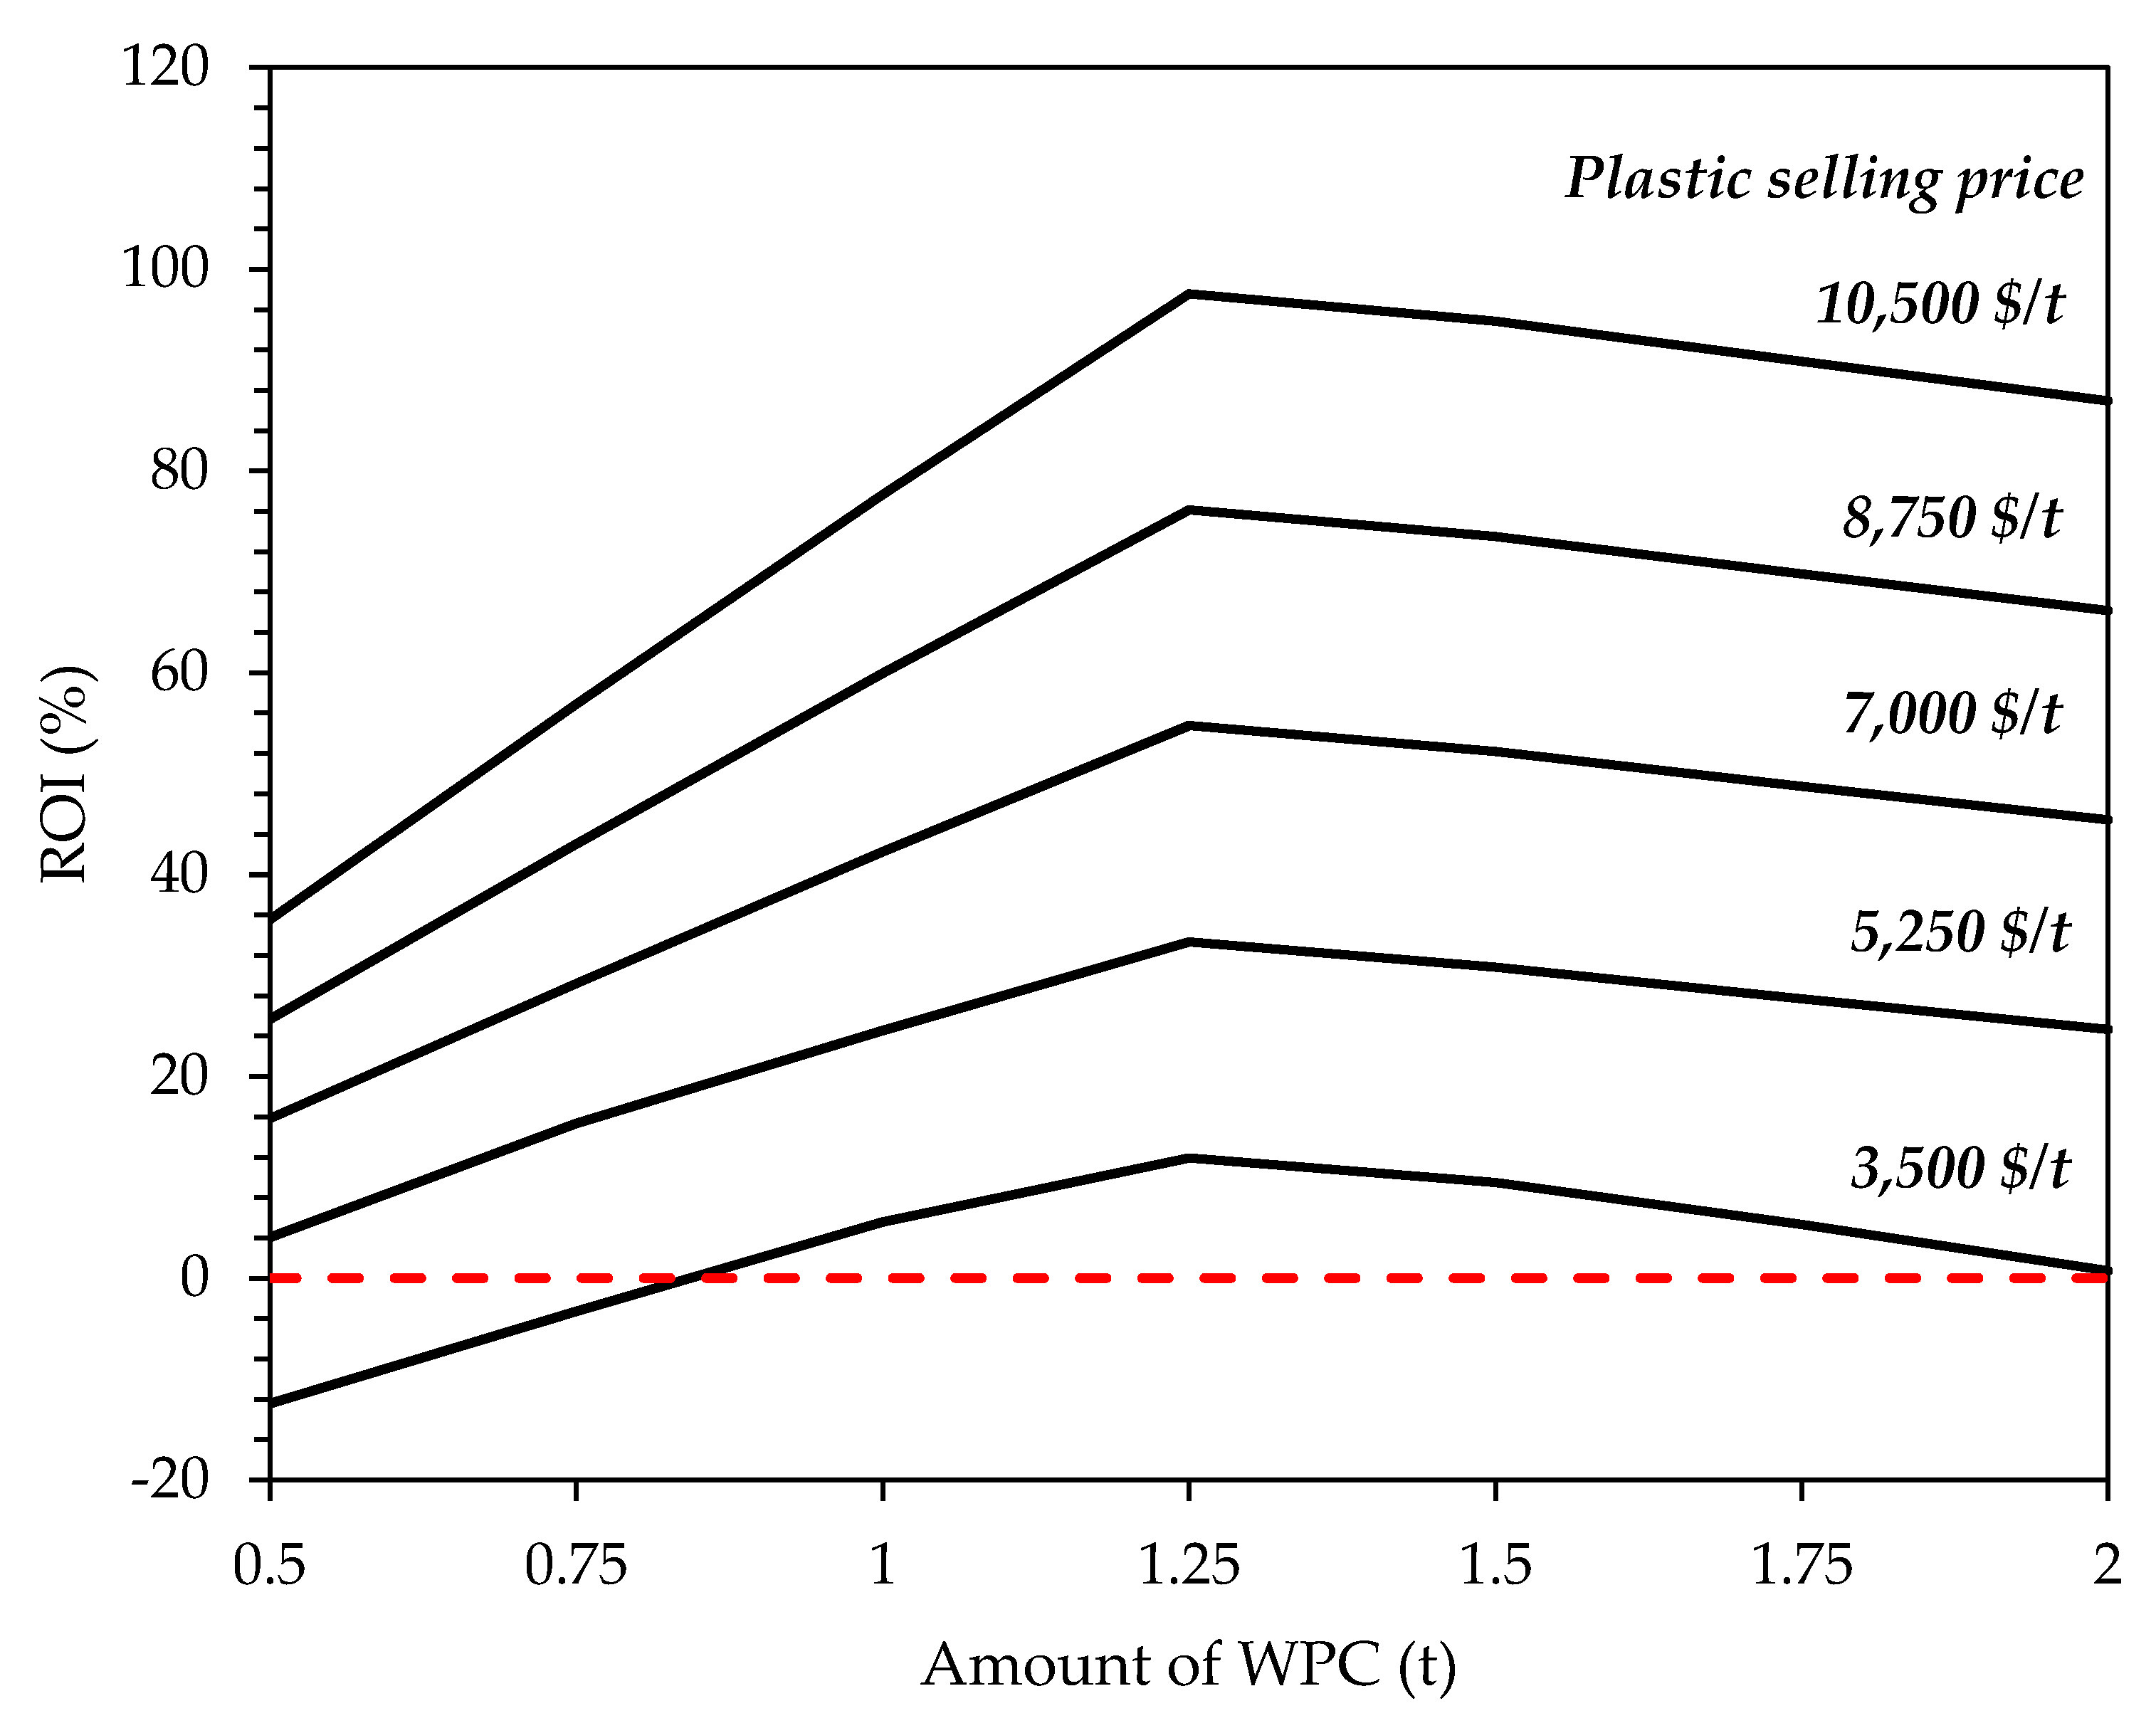
Selling Price of Plastic and Amount of WPC
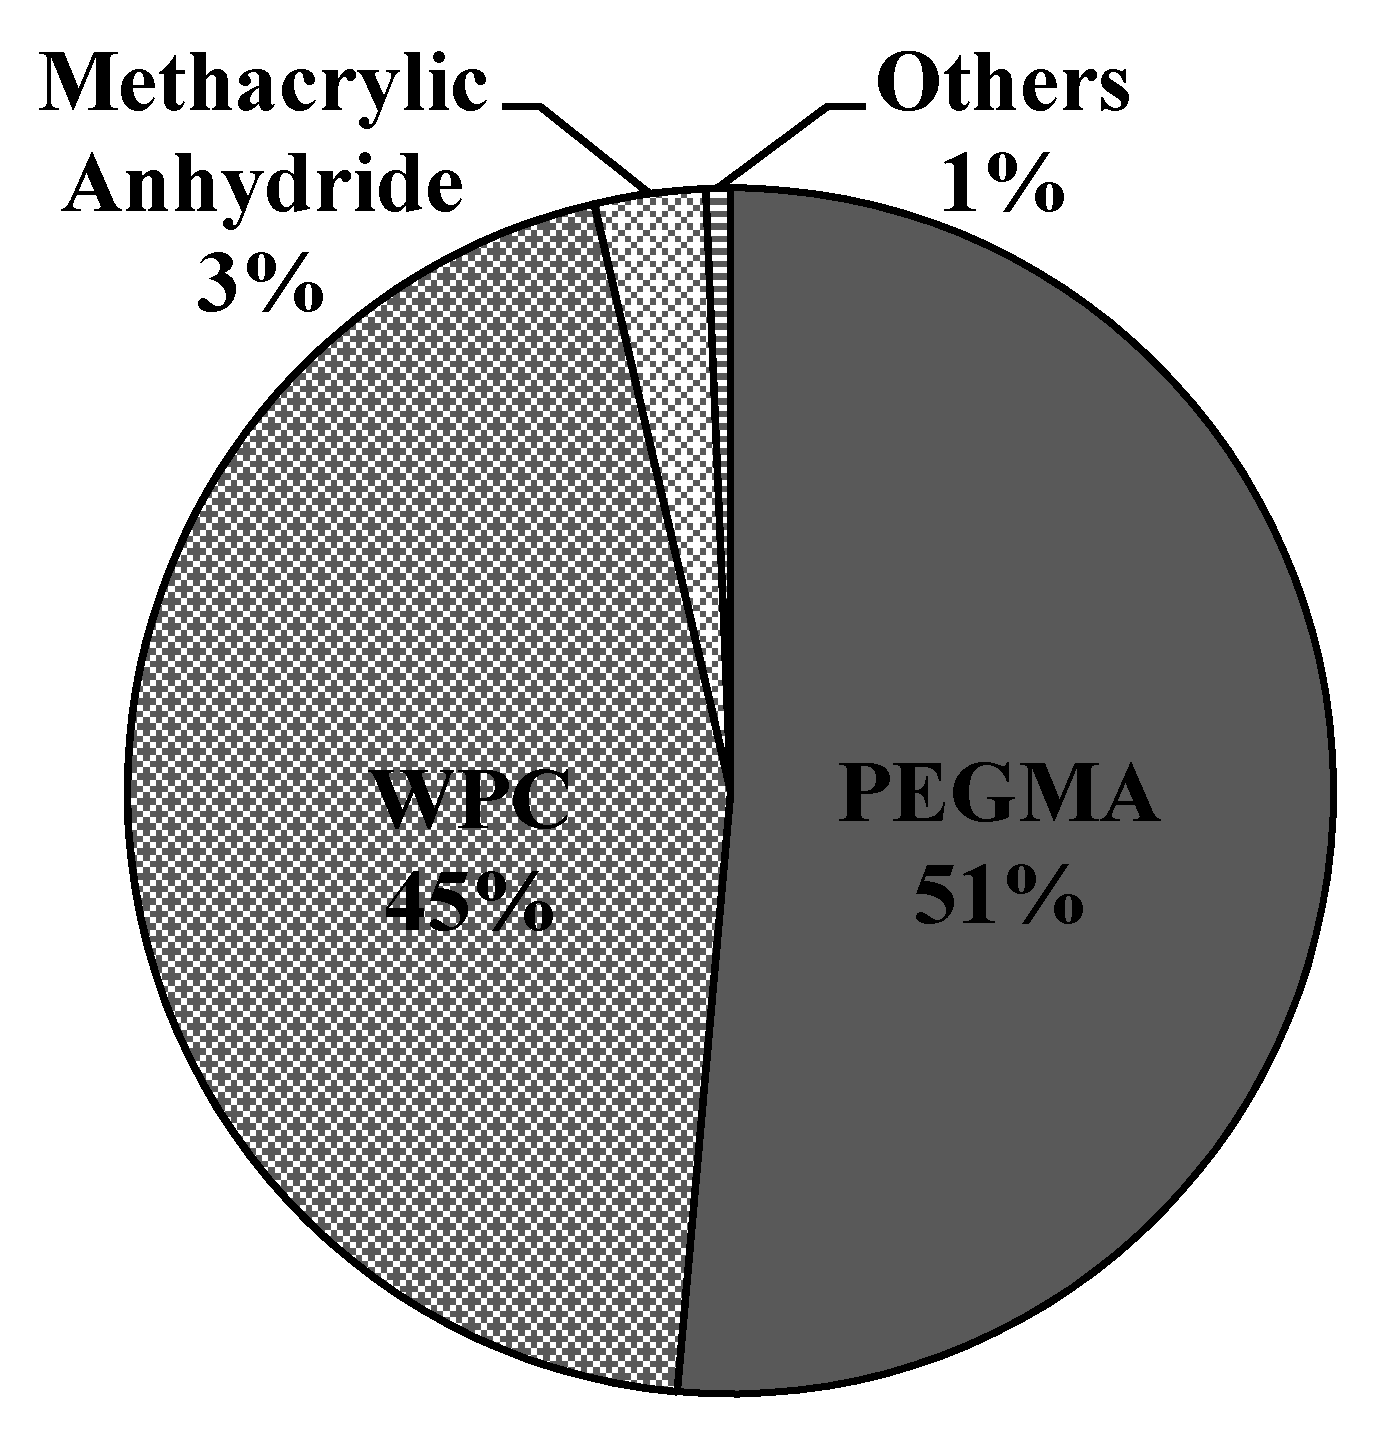
3.2.2. External Parameters
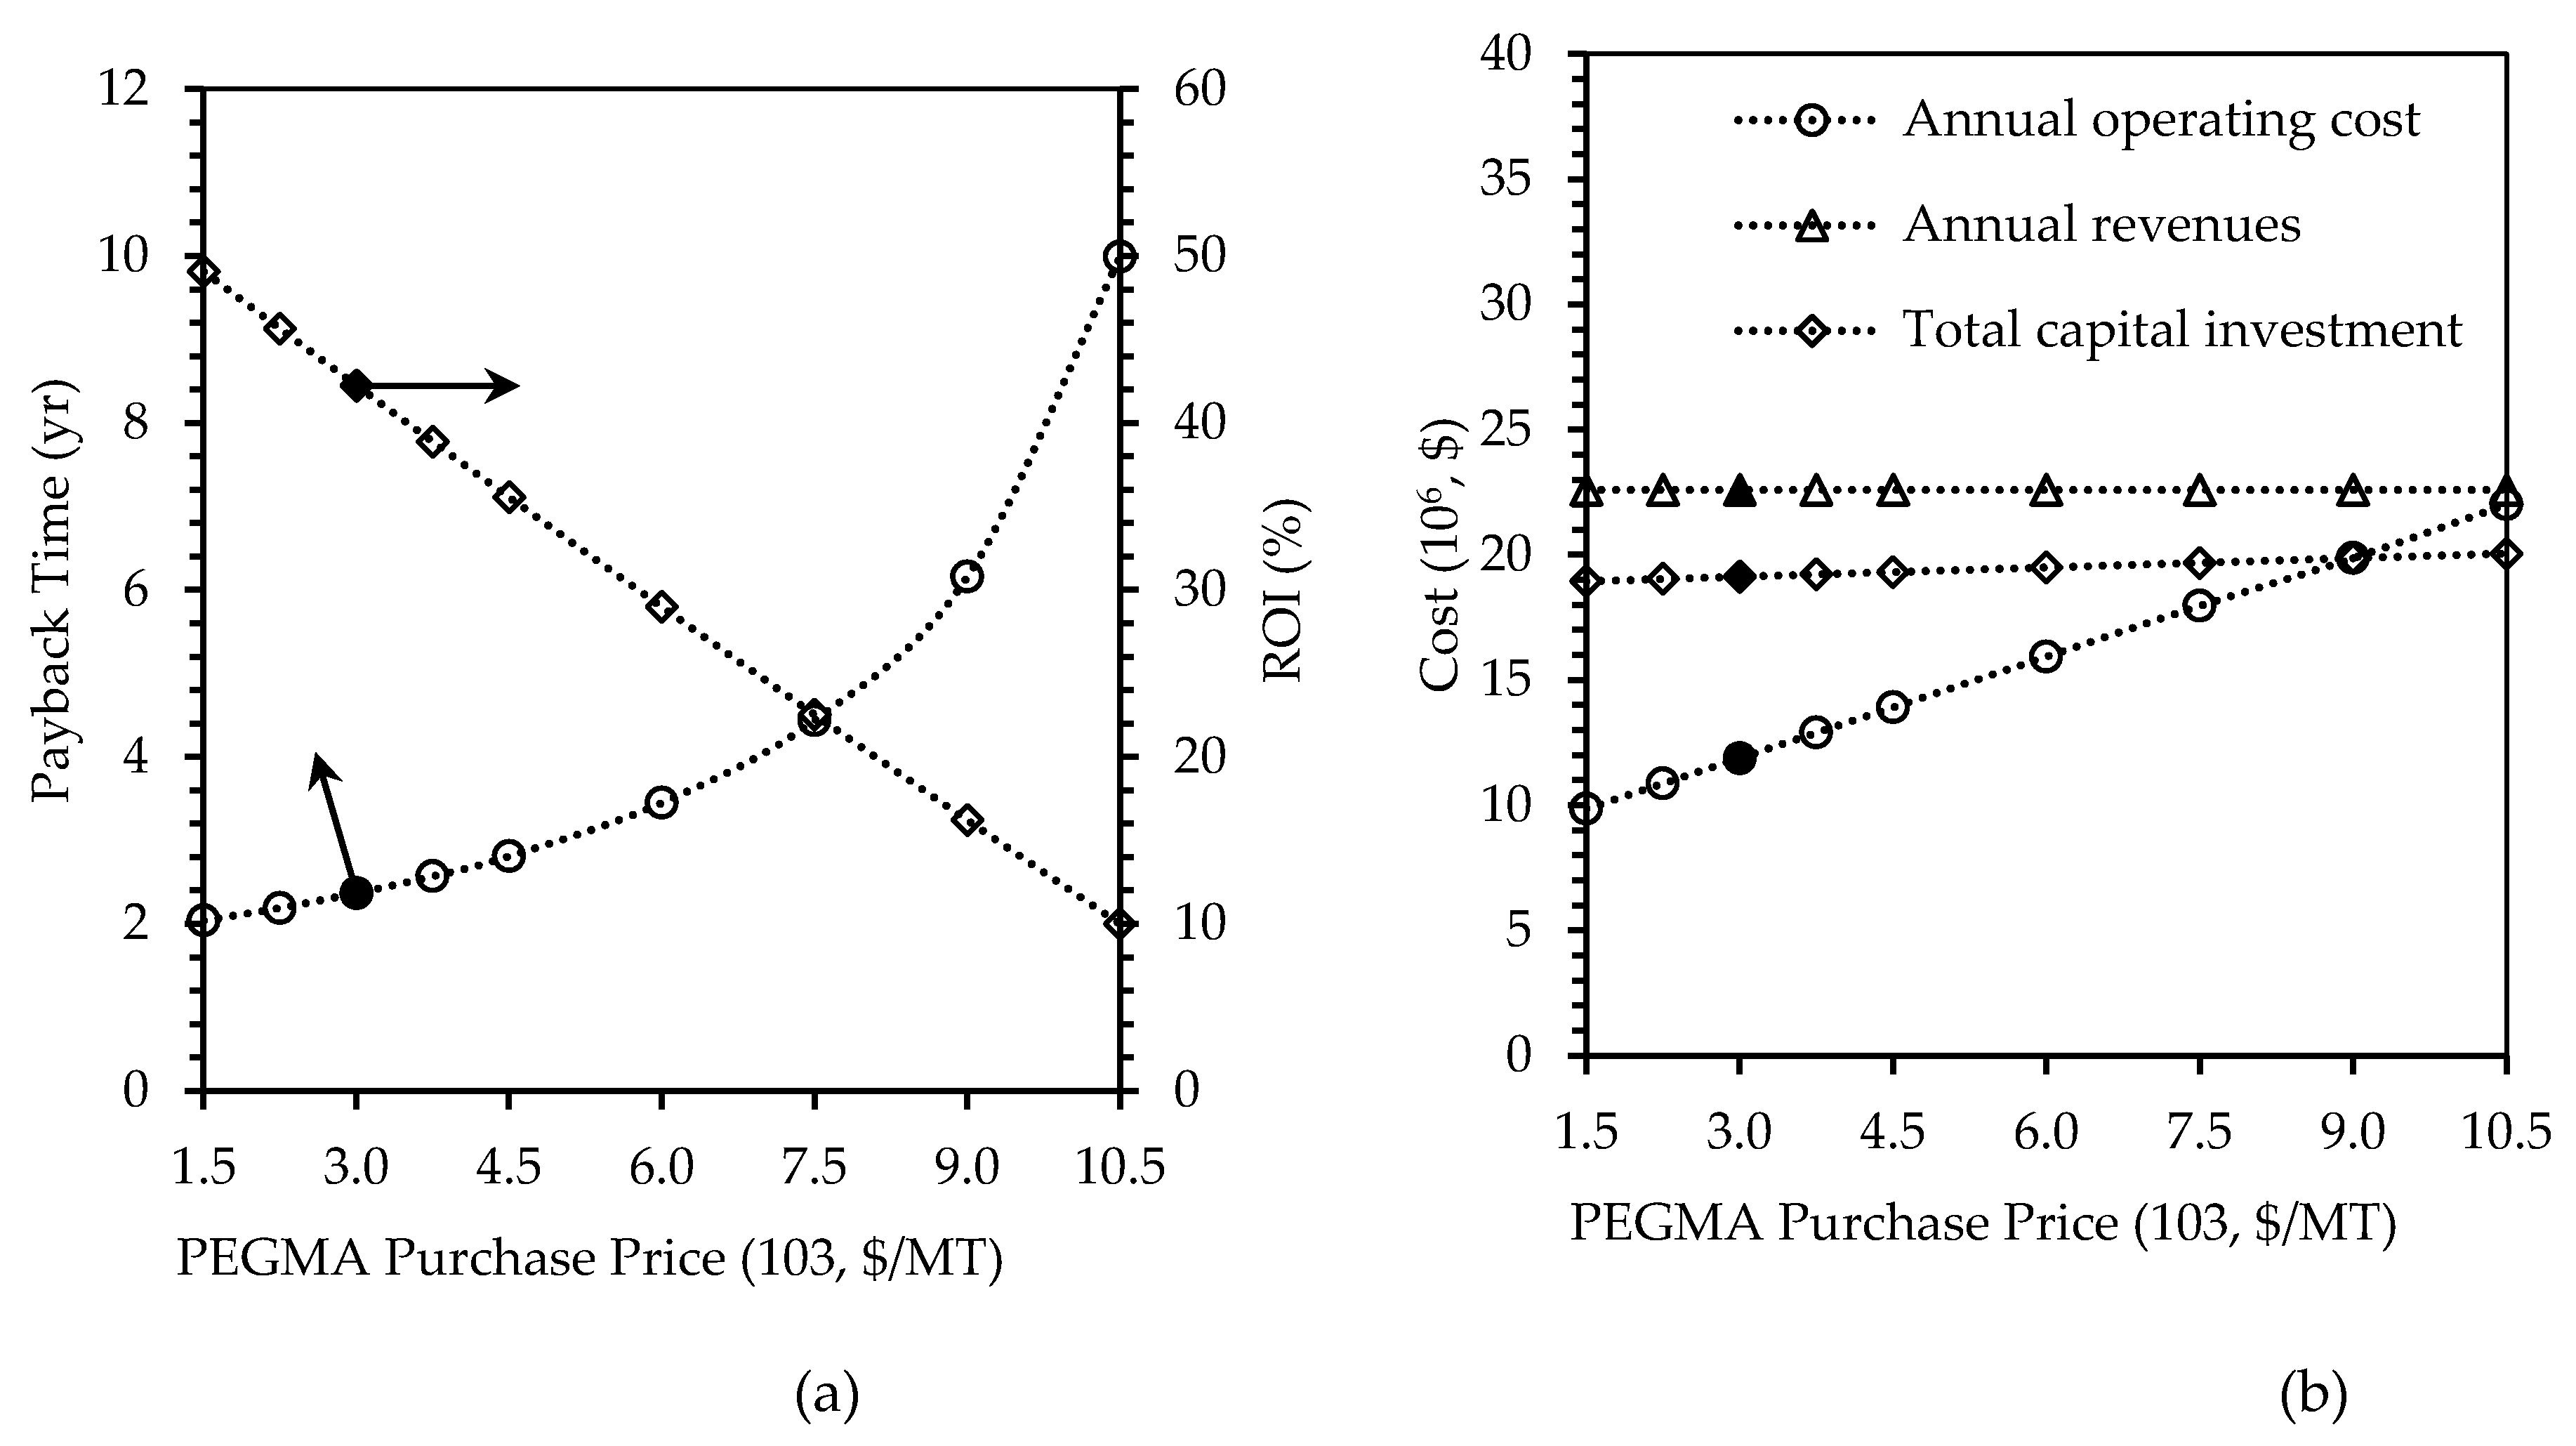
Purchase Price of PEGMA
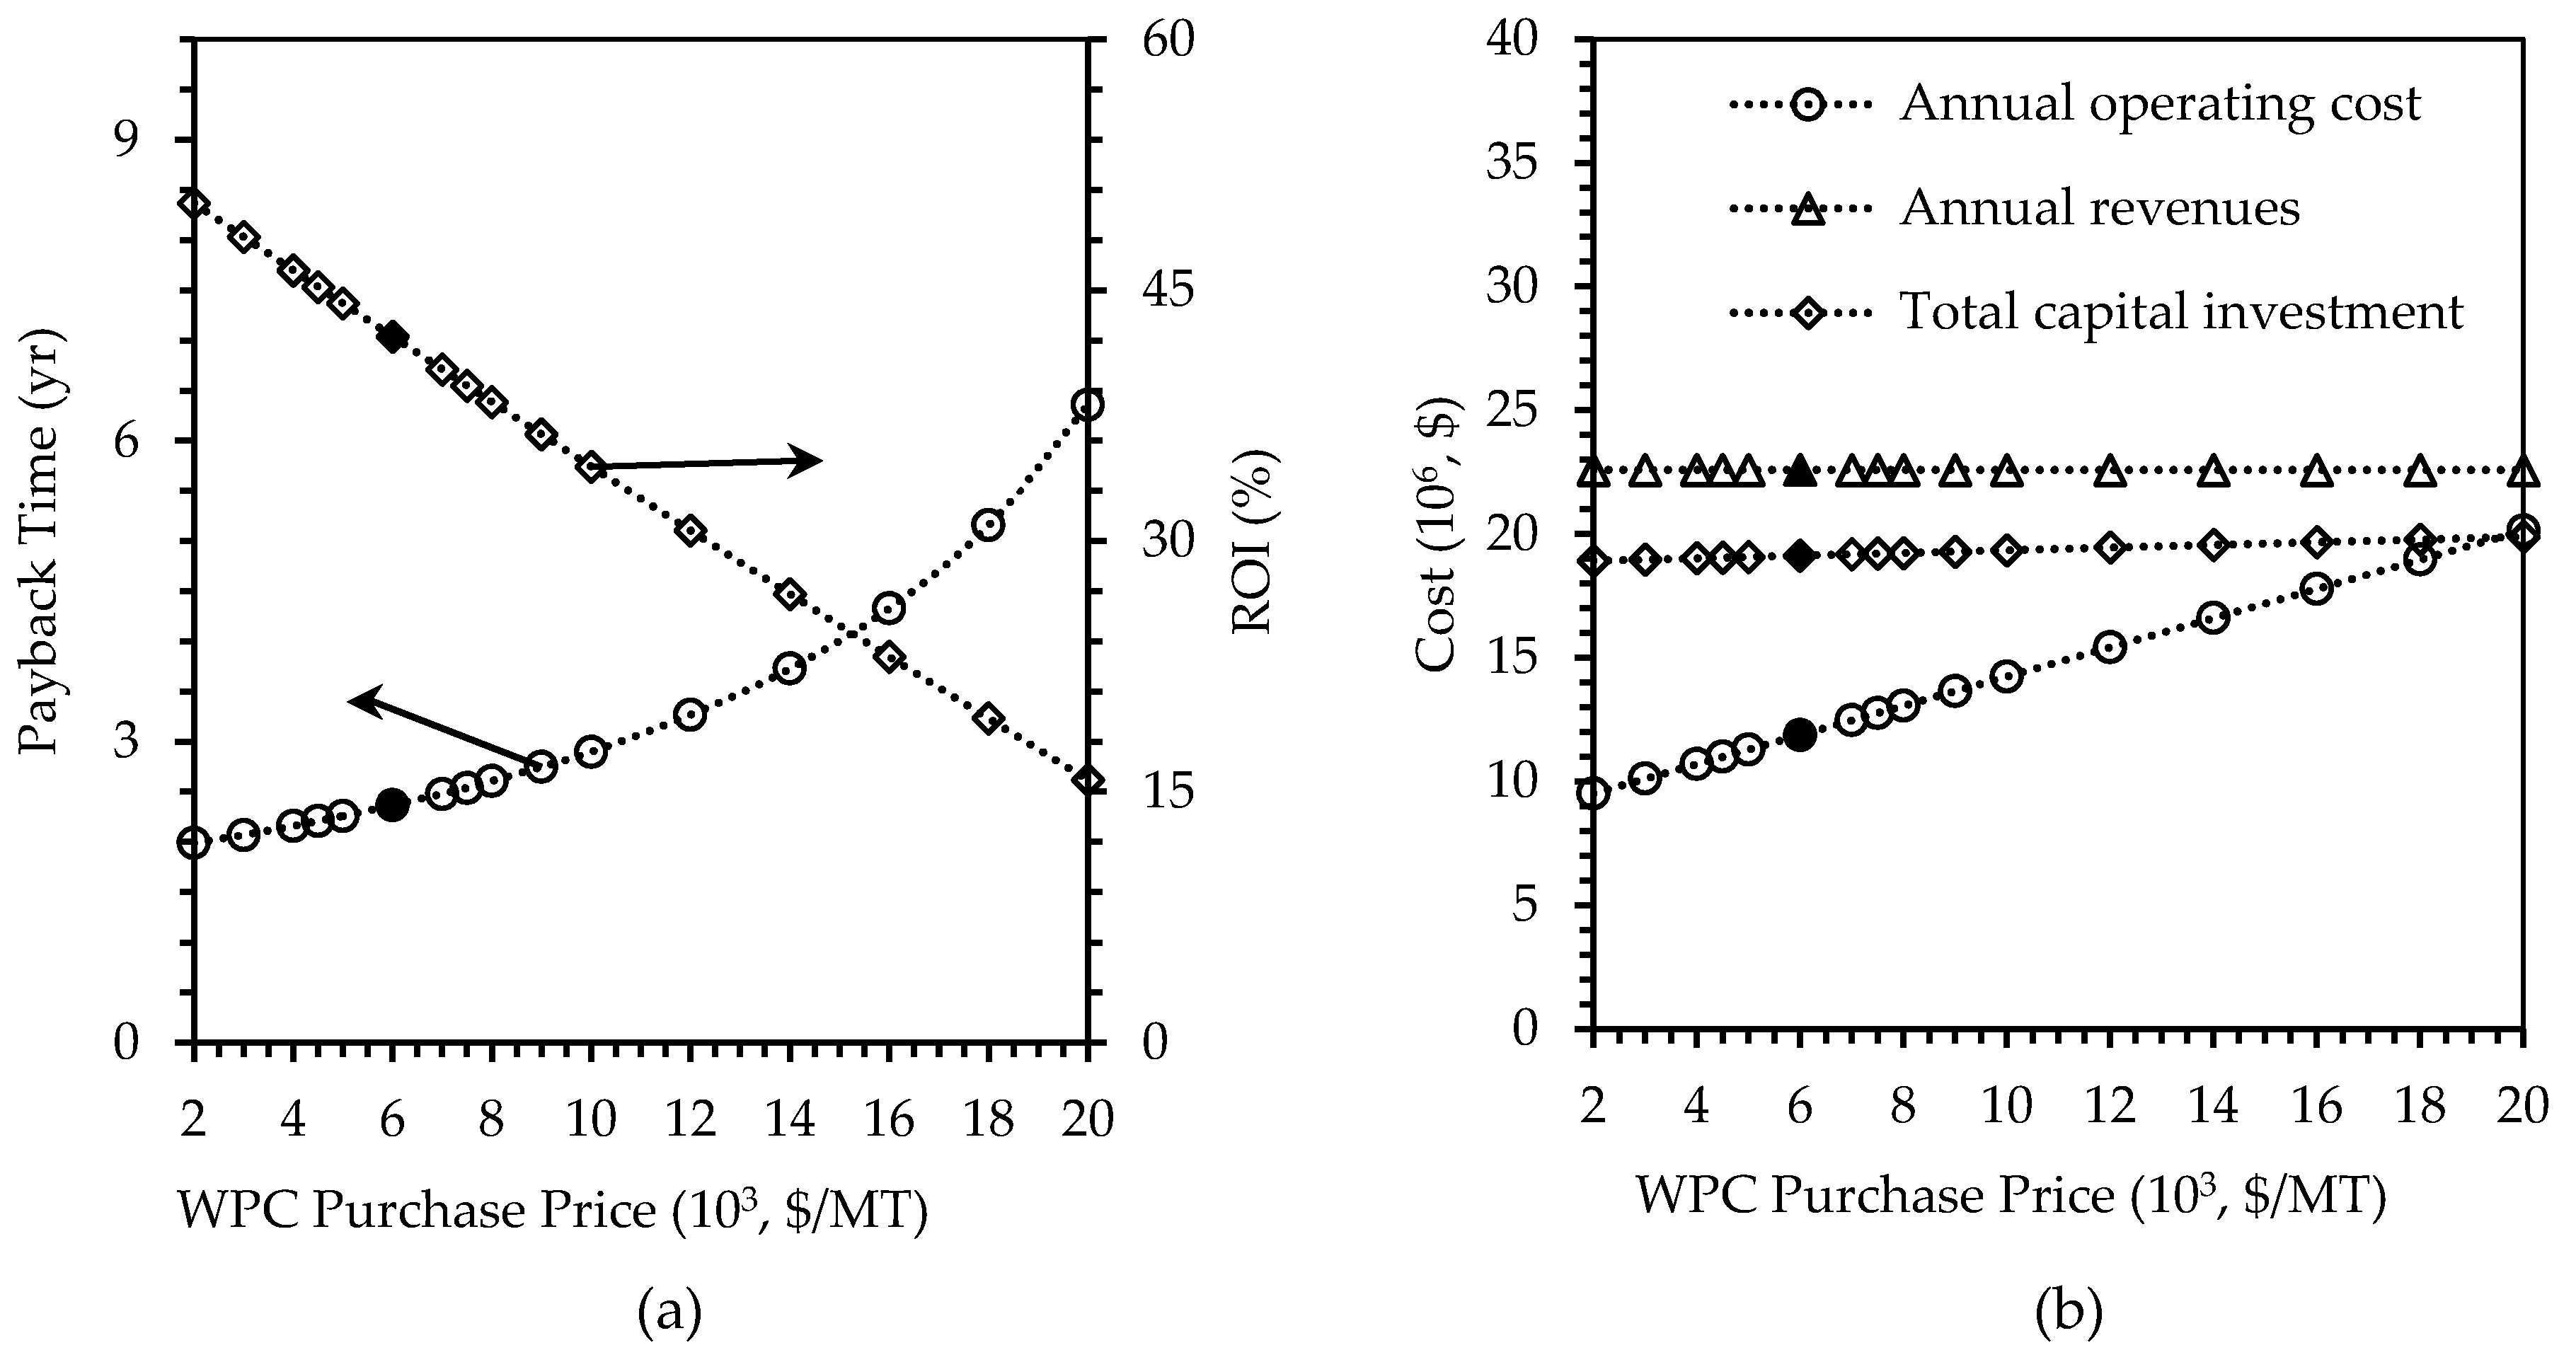
Purchase Price of WPC
4. Conclusions
Supplementary Materials
Author Contributions
Funding
Conflicts of Interest
References
- Xanthos, D.; Walker, T.R. International policies to reduce plastic marine pollution from single-use plastics (plastic bags and microbeads): A review. Mar. Pollut. Bull. 2017, 118, 17–26. [Google Scholar] [CrossRef] [PubMed]
- Andrady, A.L. Microplastics in the marine environment. Mar. Pollut. Bull. 2011, 62, 1596–1605. [Google Scholar] [CrossRef] [PubMed]
- Vegter, A.C.; Barletta, M.; Beck, C.; Borrero, J.; Burton, H.; Campbell, M.L.; Costa, M.F.; Eriksen, M.; Eriksson, C.; Estrades, A.; et al. Global research priorities to mitigate plastic pollution impacts on marine wildlife. Endanger. Species Res. 2014, 25, 225–247. [Google Scholar] [CrossRef]
- Jambeck, J.R.; Geyer, R.; Wilcox, C.; Siegler, T.R.; Perryman, M.; Andrady, A.; Narayan, R.; Law, K.L. Plastic waste inputs from land into the ocean. Science 2015, 347, 768–771. [Google Scholar] [CrossRef]
- Geyer, R.; Jambeck, J.R.; Law, K.L. Production, use, and fate of all plastics ever made. Sci. Adv. 2017, 3, e1700782. [Google Scholar] [CrossRef]
- Álvarez-Chávez, C.R.; Edwards, S.; Moure-Eraso, R.; Geiser, K. Sustainability of bio-based plastics: General comparative analysis and recommendations for improvement. J. Clean. Prod. 2012, 23, 47–56. [Google Scholar] [CrossRef]
- Patel, M.K.; Bechu, A.; Villegas, J.D.; Bergez-Lacoste, M.; Yeung, K.; Murphy, R.; Woods, J.; Mwabonje, O.N.; Ni, Y.; Patel, A.D.; et al. Second-generation bio-based plastics are becoming a reality—Non-renewable energy and greenhouse gas (GHG) balance of succinic acid-based plastic end products made from lignocellulosic biomass. Biofuel Bioprod. Biorefining 2018, 12, 426–441. [Google Scholar] [CrossRef]
- European-Bioplastics. Bioplastics Market Data. Available online: https://www.european-bioplastics.org/market/ (accessed on 9 October 2019).
- Raghunath, B.V.; Punnagaiarasi, A.; Rajarajan, G.; Irshad, A.; Elango, A.; Mahesh kumar, G. Impact of Dairy Effluent on Environment—A Review. In Integrated Waste Management in India: Status and Future Prospects for Environmental Sustainability; Prashanthi, M., Sundaram, R., Eds.; Springer International Publishing: Cham, Switzerland, 2016; pp. 239–249. [Google Scholar] [CrossRef]
- Slavov, A.K. General characteristics and treatment possibilities of dairy wastewater—A review. Food Technol. Biotechnol. 2017, 55, 14–28. [Google Scholar] [CrossRef]
- Macwan, S.R.; Dabhi, B.K.; Parmer, S.C.; Aparnathi, K.D. Whey and its utilization. Int. J. Curr. Microbiol. Appl. Sci. 2016, 5, 134–155. [Google Scholar] [CrossRef]
- EDA. European Dairy Association Economic Report 2016/2017; European Dairy Association: Brussels, Belgium, 2016. [Google Scholar]
- Morr, C.V.; Ha, E.Y. Whey protein concentrates and isolates: Processing and functional properties. Crit. Rev. Food Sci. Nutr. 1993, 33, 431–476. [Google Scholar] [CrossRef]
- Smithers, G.W. Whey and whey proteins—From ‘gutter-to-gold’. Int. Dairy J. 2008, 18, 695–704. [Google Scholar] [CrossRef]
- da Silva, A.N.; Perez, R.; Minim, V.P.R.; Martins, D.D.S.A.; Minim, L.A. Integrated production of whey protein concentrate and lactose derivatives: What is the best combination? Int. Food Res. J. 2015, 73, 62–74. [Google Scholar] [CrossRef]
- USDA. Dairy Market News. Available online: https://www.ams.usda.gov/market-news/dairy (accessed on 22 January 2019).
- Amazon. Whey Protein Concentrate. Available online: https://www.amazon.com/Nutricost-Whey-Protein-Concentrate-Unflavored/dp/B01KITQG0A/ref=sr_1_1_a_it?ie=UTF8&qid=1548775474&sr=8-1-spons&keywords=whey%2Bprotein%2Bconcentrate&th=1 (accessed on 22 January 2019).
- Danovich, T. One pound of Cheese Makes Nine Pounds of Whey. Where Does it All Go? Available online: https://newfoodeconomy.org/whey-disposal-reuse-cheese-dairy-byproduct/ (accessed on 31 March 2019).
- Charles, D. Why Greek Yogurt Makers Want Whey to Go Away. Available online: https://www.npr.org/templates/transcript/transcript.php?storyId=165478127 (accessed on 31 March 2019).
- Milan. Italy, Milan—Average Prices of Liquid Whey Cooled for Industrial Use (Cod. 191). Available online: https://www.clal.it/en/index.php?section=siero_milano#industriale (accessed on 31 March 2019).
- Wagh, Y.R.; Pushpadass, H.A.; Emerald, F.M.; Nath, B.S. Preparation and characterization of milk protein films and their application for packaging of Cheddar cheese. J. Food Sci. Technol. 2014, 51, 3767–3775. [Google Scholar] [CrossRef] [PubMed]
- Jones, A.; Mandal, A.; Sharma, S. Protein-based bioplastics and their antibacterial potential. J. Appl. Polym. Sci. 2015, 132. [Google Scholar] [CrossRef]
- Chalermthai, B.; Chan, W.Y.; Bastidas-Oyanedel, J.-R.; Taher, H.; Olsen, B.D.; Schmidt, J.E. Preparation and characterization of whey protein-based polymers produced from residual dairy streams. Polymers 2019, 11, 722. [Google Scholar] [CrossRef] [PubMed]
- Khan, M.M.-U.-H.; Jain, S.; Vaezi, M.; Kumar, A. Development of a decision model for the techno-economic assessment of municipal solid waste utilization pathways. J. Waste Manag. 2016, 48, 548–564. [Google Scholar] [CrossRef] [PubMed]
- Yang, Y.; Wang, J.; Chong, K.; Bridgwater, A.V. A techno-economic analysis of energy recovery from organic fraction of municipal solid waste (MSW) by an integrated intermediate pyrolysis and combined heat and power (CHP) plant. Energy Convers. Manag. 2018, 174, 406–416. [Google Scholar] [CrossRef]
- Han, W.; Fang, J.; Liu, Z.; Tang, J. Techno-economic evaluation of a combined bioprocess for fermentative hydrogen production from food waste. Bioresour. Technol. 2016, 202, 107–112. [Google Scholar] [CrossRef]
- Mahmood, R.; Parshetti, G.K.; Balasubramanian, R. Energy, exergy and techno-economic analyses of hydrothermal oxidation of food waste to produce hydro-char and bio-oil. Energy J. 2016, 102, 187–198. [Google Scholar] [CrossRef]
- Patel, M.; Zhang, X.; Kumar, A. Techno-economic and life cycle assessment on lignocellulosic biomass thermochemical conversion technologies: A review. Renew. Sustain. Energy Rev. 2016, 53, 1486–1499. [Google Scholar] [CrossRef]
- Malek, A.B.M.A.; Hasanuzzaman, M.; Rahim, N.A.; Al Turki, Y.A. Techno-economic analysis and environmental impact assessment of a 10 MW biomass-based power plant in Malaysia. J. Clean. Prod. 2017, 141, 502–513. [Google Scholar] [CrossRef]
- Ashraf, M.T.; Schmidt, J.E. Process simulation and economic assessment of hydrothermal pretreatment and enzymatic hydrolysis of multi-feedstock lignocellulose—Separate vs combined processing. Bioresour. Technol. 2018, 249, 835–843. [Google Scholar] [CrossRef] [PubMed]
- Cherubini, F. The biorefinery concept: Using biomass instead of oil for producing energy and chemicals. Energy Convers. Manag. 2010, 51, 1412–1421. [Google Scholar] [CrossRef]
- Lazarev, V.; Tikhonov, S.; Karh, D. Modern technologies of milk whey processing in the conditions of new techno-economic paradigm. In Proceedings of the 2nd International Scientific conference on New Industrialization: Global, national, regional dimension (SICNI 2018), Ekaterinburg, Russia, 4–5 December 2018. [Google Scholar]
- Bochenski, T.; Chan, W.Y.; Olsen, B.D.; Schmidt, J.E. Techno-economic analysis for the production of novel, bio-derived elastomers with modified algal proteins as a reinforcing agent. Algal Res. 2018, 33, 337–344. [Google Scholar] [CrossRef]
- Doyle, M.P.; Glass, K.A.; Beery, J.T.; Garcia, G.A.; Pollard, D.J.; Schultz, R.D. Survival of Listeria monocytogenes in milk during high-temperature, short-time pasteurization. Appl. Environ. Microbiol. 1987, 53, 1433–1438. [Google Scholar] [CrossRef] [PubMed]
- Berk, Z. Chapter 9—Centrifugation. In Food Process Engineering and Technology; Berk, Z., Ed.; Academic Press: San Diego, CA, USA, 2009; pp. 217–232. [Google Scholar] [CrossRef]
- Stephenson, F.H. Chapter 12—Centrifugation. In Calculations for Molecular Biology and Biotechnology (Third Edition); Stephenson, F.H., Ed.; Academic Press: Boston, MA, USA, 2016; pp. 431–438. [Google Scholar] [CrossRef]
- Glover, F.A. Principles of Ultrafiltration and the Concentration and Fractionation of Cow’s Milk; Reading RG2 9AT; Process Technology Department, National Institute for Research in Dairying: Shinfield, Reading, UK, 1984. [Google Scholar]
- Ostojić, S.; Pavlović, M.; Živić, M.; Filipović, Z.; Gorjanović, S.; Hranisavljević, S.; Dojčinović, M. Processing of whey from dairy industry waste. Environ. Chem. Lett. 2005, 3, 29–32. [Google Scholar] [CrossRef]
- Kukučka, M.Đ.; Kukučka, N.M. Investigation of whey protein concentration by ultrafiltration elements designed for water treatment. Hem. Ind. 2013, 67, 835–842. [Google Scholar]
- Harrison, R.G.; Todd, P.W.; Rudge, S.R.; Petrides, D.P. Bioseparations Science and Engineering; Oxford University Press: Oxford, UK, 2015. [Google Scholar]
- ADPI. Whey Protein Concentrate (WPC) Standard; American Dairy Products Institute: Elmhurst, IL, USA, 2019; pp. 16–17. [Google Scholar]
- Chan, W.Y.; Bochenski, T.; Schmidt, J.E.; Olsen, B.D. Peptide domains as reinforcement in protein-based elastomers. ACS Sustain. Chem. Eng. 2017, 5, 8568–8578. [Google Scholar] [CrossRef]
- Diwekar, U. Polymer resin manufacturing example. In Batch Processing: Modeling and Design; CRC Press: Boca Raton, FL, USA, 2014. [Google Scholar]
- Tadweer. SOP for Final Disposal of Solid Hazardous Waste in the Engineered Cells in Al Dhafra Landfill; Hazardous Facilities Section, Projects & Facilities Department: Abu Dhabi, UAE, 2017. [Google Scholar]
- Khamrui, K.; Rajorhia, G.S. Making profit from whey. Indian Dairym. 1998, 50, 13–17. [Google Scholar]
- Csighy, A.; Koris, A.; Vatai, G. Modelling the Partial Demineralization Process of Cow Milk by Superpro Designer. Hung. J. Ind. Chem. 2017, 9–12. [Google Scholar] [CrossRef]
- de Carvalho-Silva, L.B.; Vissotto, F.Z.; Amaya-Farfan, J. Physico-chemical properties of milk whey protein agglomerates for use in oral nutritional therapy. Food Sci. Nutr. 2013, 04, 10. [Google Scholar] [CrossRef]
- ADDC. Water and Electricity Tariffs; Abu Dhabi Distribution Company: Abu Dhabi, UAE, 2018. [Google Scholar]
- Peters, M.S.; Timmerhaus, K.D.; West, R. Plant Design and Economics for Chemical Engineers, 5th ed.; McGraw-Hill: New York, NY, USA, 2003. [Google Scholar]
- Mudliar, S.N.; Vaidya, A.N.; Suresh Kumar, M.; Dahikar, S.; Chakrabarti, T. Techno-economic evaluation of PHB production from activated sludge. Clean Technol. Environ. 2007, 10, 255. [Google Scholar] [CrossRef]
- Fernández-Dacosta, C.; Posada, J.A.; Kleerebezem, R.; Cuellar, M.C.; Ramirez, A. Microbial community-based polyhydroxyalkanoates (PHAs) production from wastewater: Techno-economic analysis and ex-ante environmental assessment. Bioresour. Technol. 2015, 185, 368–377. [Google Scholar] [CrossRef] [PubMed]
- Zahari, M.A.K.M.; Ariffin, H.; Mokhtar, M.N.; Salihon, J.; Shirai, Y.; Hassan, M.A. Case study for a palm biomass biorefinery utilizing renewable non-food sugars from oil palm frond for the production of poly(3-hydroxybutyrate) bioplastic. J. Clean. Prod. 2015, 87, 284–290. [Google Scholar] [CrossRef]


| Steps | Equipment | Unit Operation | Characteristics |
|---|---|---|---|
| A. Pretreatment of Whey | P-1/PZ-101 | Pasteurization |
|
| P-2/DC-101 | Centrifugation |
| |
| B. Production of WPC | P-3/UF-101 (6 units) | Ultrafiltration |
|
| P-4/DF-101 | Diafiltration |
| |
| P-5/SDR-101 | Spray Drying |
| |
| P-6/SL-101 | Solids Storage |
| |
| C. Chemical Processing | P-7/R-101 | Protein Dissolution |
|
| P-8/R-102 | Methacrylation |
| |
| P-9/R-103 | Polymerization |
| |
| D. Production of plastic | P-10/WSH-101 (2 units) | Washing |
|
| P-11/DC-102 | Centrifugation |
| |
| P-12/DDR-101 | Drum Drying |
|
| Parameter | Scenario 1 | Scenario 2 |
|---|---|---|
| Annual Operating Time (h) | 7909.8 | 7918.1 |
| Unit Production Ref. Rate (t MP1/y) | 3216.3 | 3227.2 |
| Batch Size (kg MP) | 5469.9 | 5469.9 |
| Recipe Batch Time (h) | 52.4 | 34.4 |
| No. of Batches (/y) | 588 | 590 |
| Total Capital Investment ($) | 33,563,000 | 19,132,000 |
| Operating Cost ($/y) | 12,375,000 | 11,889,000 |
| Total Revenues ($/y), from: | 22,538,000 | 22,591,000 |
| Plastic stream (MP) | 22,514,000 | |
| WPC Powder | 23,520 | |
| Cost Basis Annual Rate (t MP/y) | 3216.3 | 3227.3 |
| Unit Production Cost ($/t MP) | 3850 | 3680 |
| Unit Production Revenue ($/t MP) | 7010 | 7000 |
| Gross Margin (%) | 45.1 | 47.4 |
| Net Profit ($/y) | 9,087,000 | 8,082,000 |
| Return On Investment (ROI) (%) | 27.1 | 42.2 |
| Payback Time (y) | 3.69 | 2.37 |
| Scenario | Protein:PEGMA | Payback Time (yrs) | ROI (%) | Total Capital Investment ($) | Operating Cost ($/y) | Revenues ($/y) |
|---|---|---|---|---|---|---|
| 1 | 30:70 | 3.69 | 27.1 | 33,563,000 | 12,375,000 | 22,538,000 |
| 20:80 | 5.56 | 17.99 | 34,254,000 | 17,285,000 | 22,538,000 | |
| 2 | 30:70 | 2.37 | 42.24 | 19,132,000 | 11,889,000 | 22,591,000 |
| 20:80 | 3.85 | 25.95 | 19,789,000 | 16,787,000 | 22,545,000 |
© 2020 by the authors. Licensee MDPI, Basel, Switzerland. This article is an open access article distributed under the terms and conditions of the Creative Commons Attribution (CC BY) license (http://creativecommons.org/licenses/by/4.0/).
Share and Cite
Chalermthai, B.; Ashraf, M.T.; Bastidas-Oyanedel, J.-R.; Olsen, B.D.; Schmidt, J.E.; Taher, H. Techno-Economic Assessment of Whey Protein-Based Plastic Production from a Co-Polymerization Process. Polymers 2020, 12, 847. https://doi.org/10.3390/polym12040847
Chalermthai B, Ashraf MT, Bastidas-Oyanedel J-R, Olsen BD, Schmidt JE, Taher H. Techno-Economic Assessment of Whey Protein-Based Plastic Production from a Co-Polymerization Process. Polymers. 2020; 12(4):847. https://doi.org/10.3390/polym12040847
Chicago/Turabian StyleChalermthai, Bushra, Muhammad Tahir Ashraf, Juan-Rodrigo Bastidas-Oyanedel, Bradley D. Olsen, Jens Ejbye Schmidt, and Hanifa Taher. 2020. "Techno-Economic Assessment of Whey Protein-Based Plastic Production from a Co-Polymerization Process" Polymers 12, no. 4: 847. https://doi.org/10.3390/polym12040847
APA StyleChalermthai, B., Ashraf, M. T., Bastidas-Oyanedel, J.-R., Olsen, B. D., Schmidt, J. E., & Taher, H. (2020). Techno-Economic Assessment of Whey Protein-Based Plastic Production from a Co-Polymerization Process. Polymers, 12(4), 847. https://doi.org/10.3390/polym12040847