Isothermal Crystallization Kinetics and Morphology of Double Crystalline PCL/PBS Blends Mixed with a Polycarbonate/MWCNTs Masterbatch


Abstract

1. Introduction
2. Experimental
2.1. Materials
2.2. Sample Characterization
3. Results and Discussion
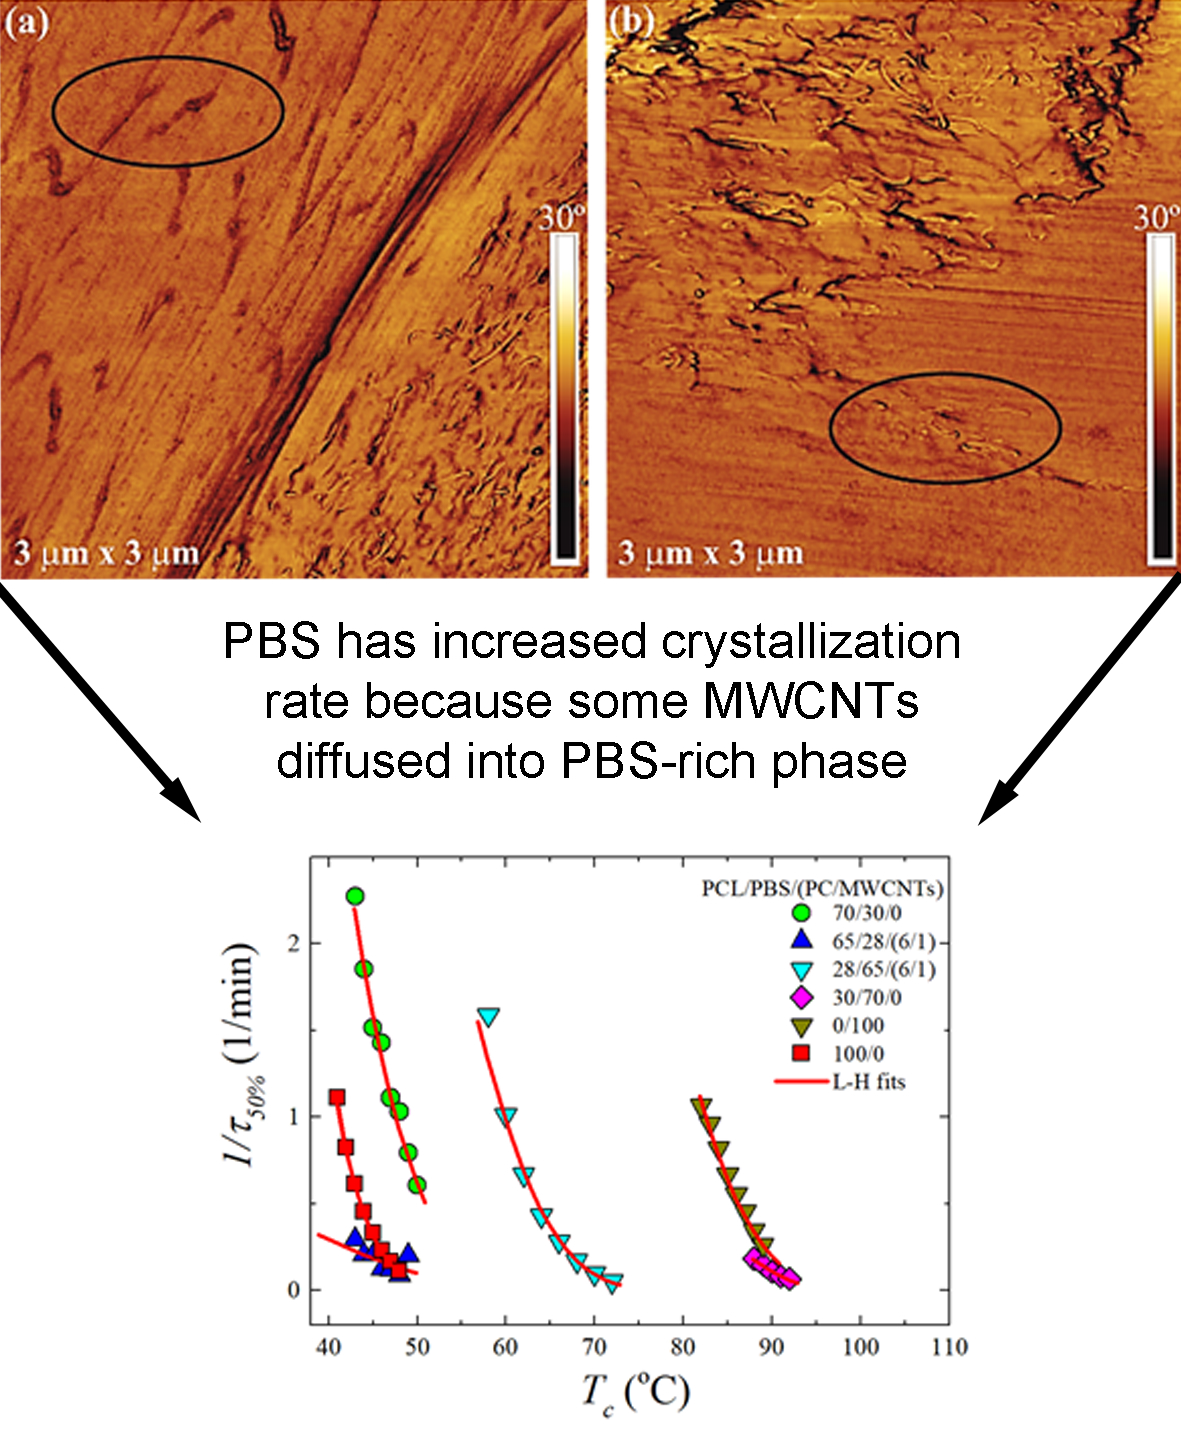
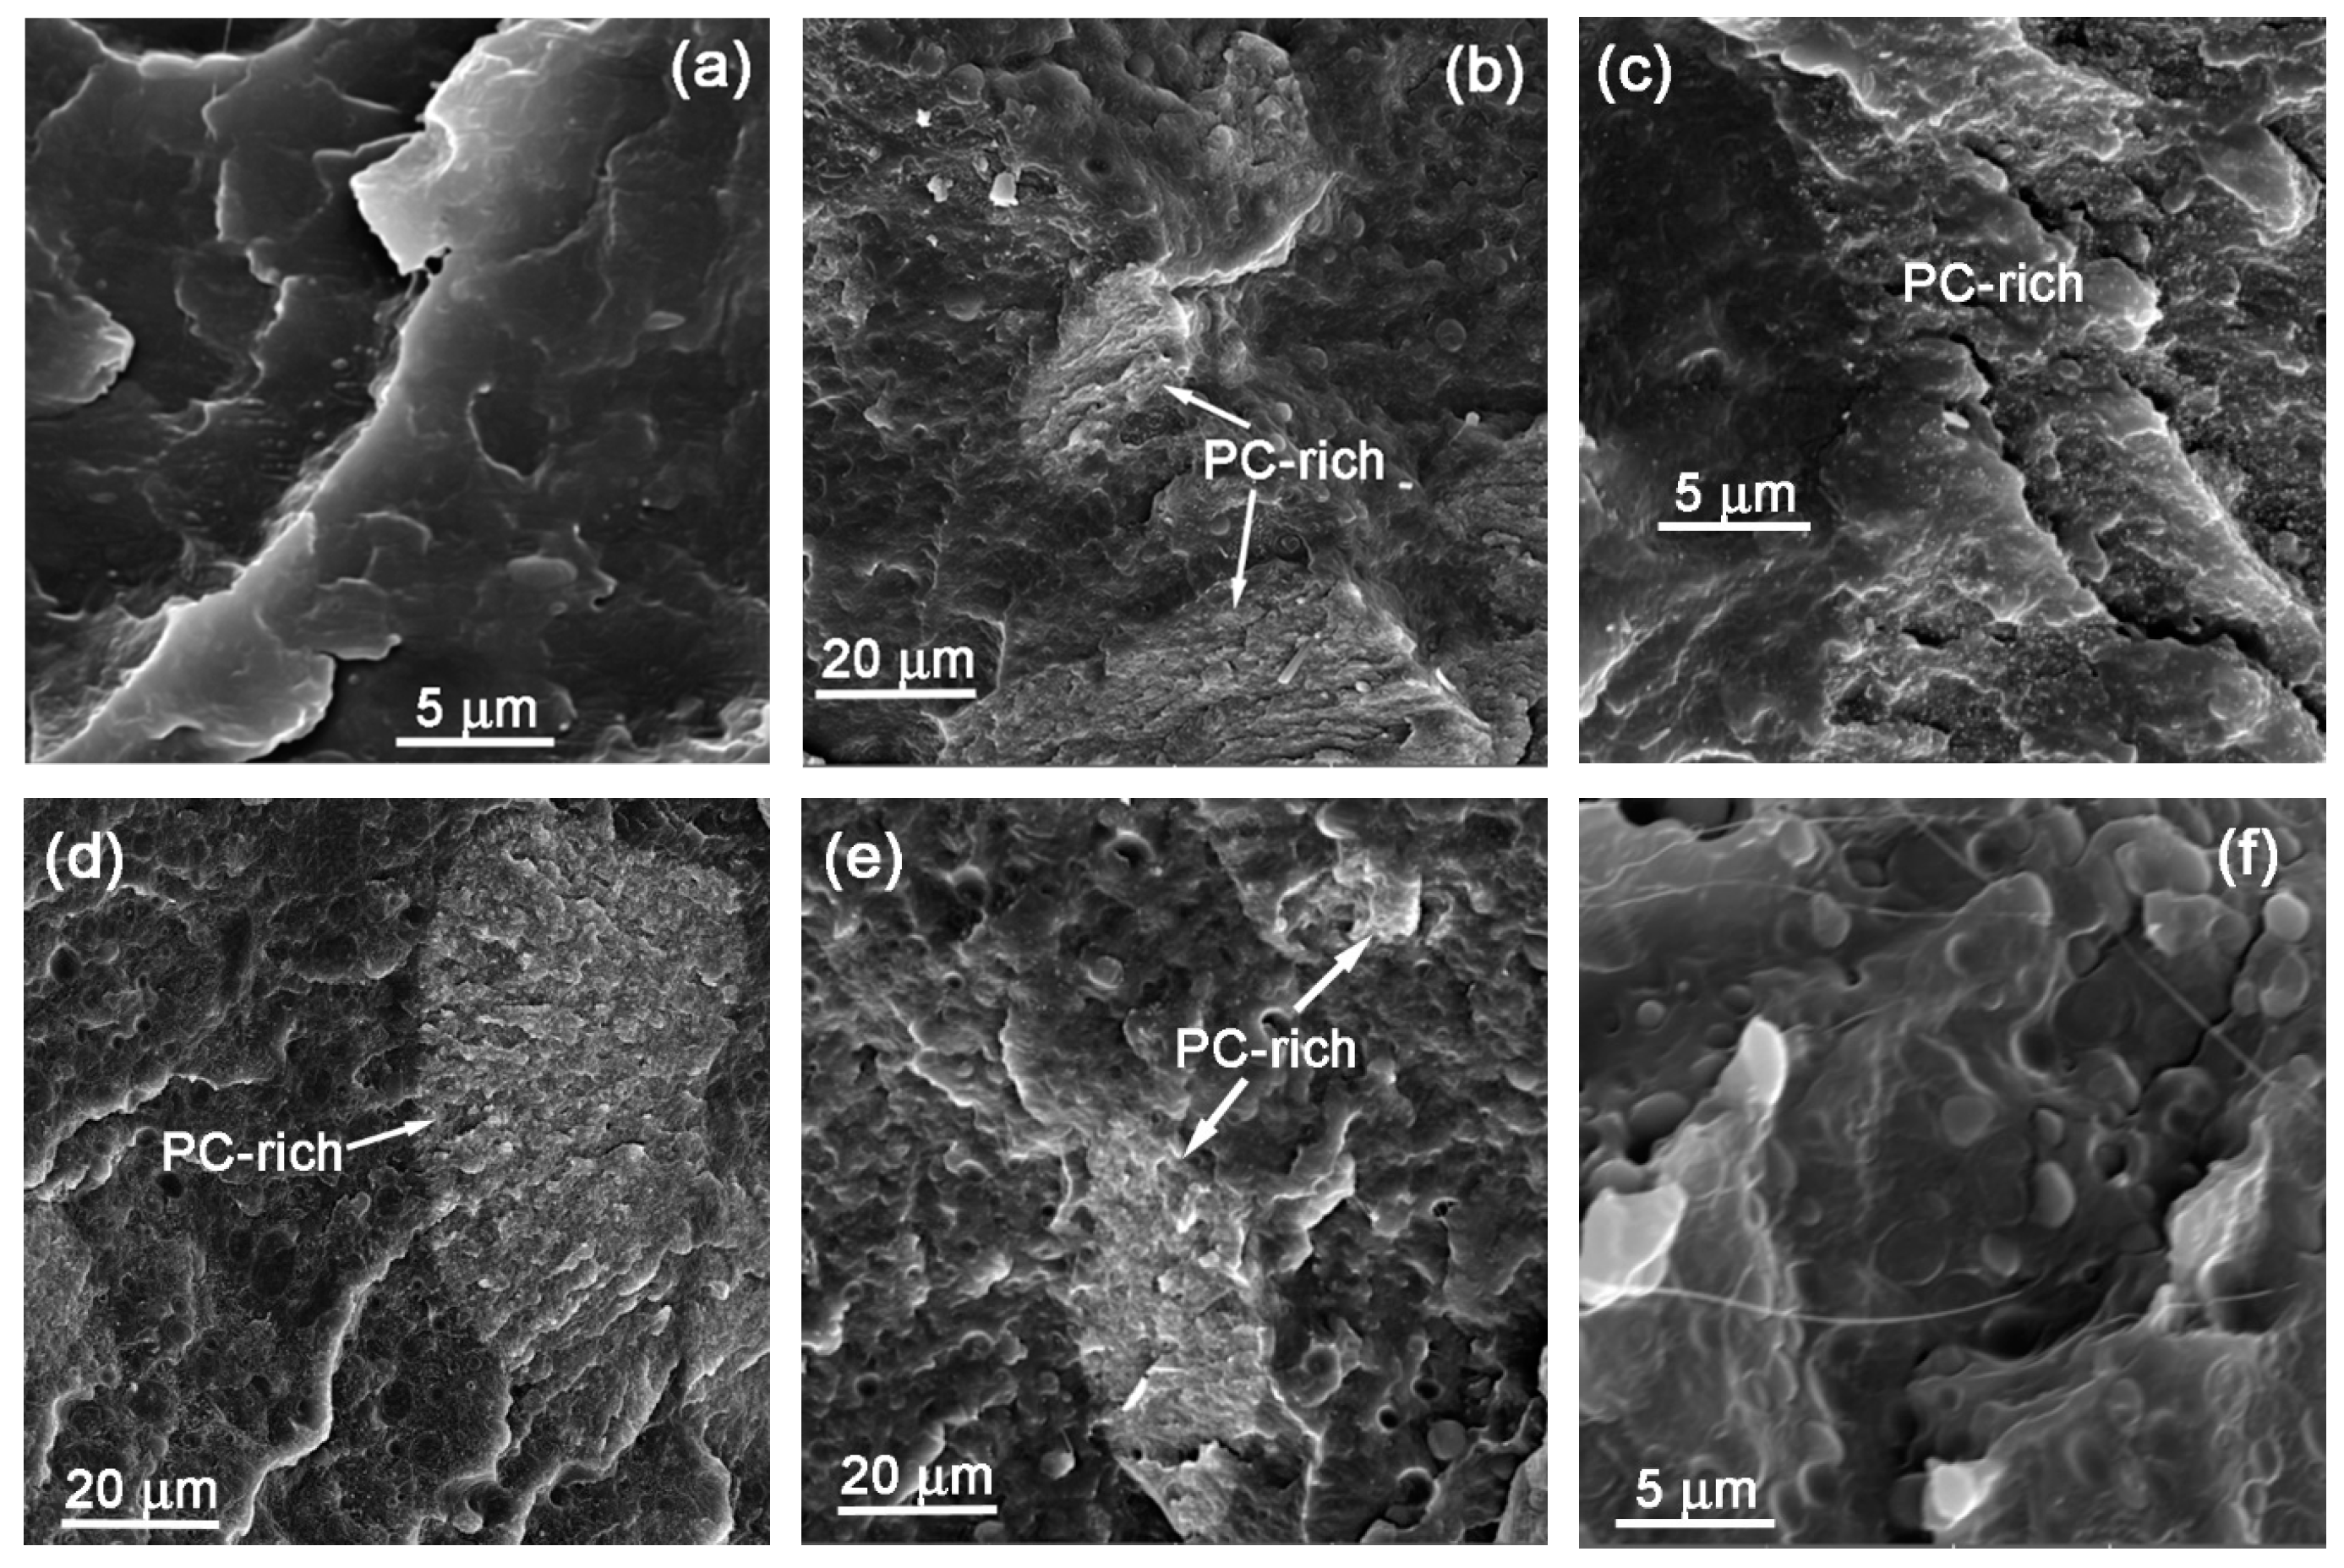
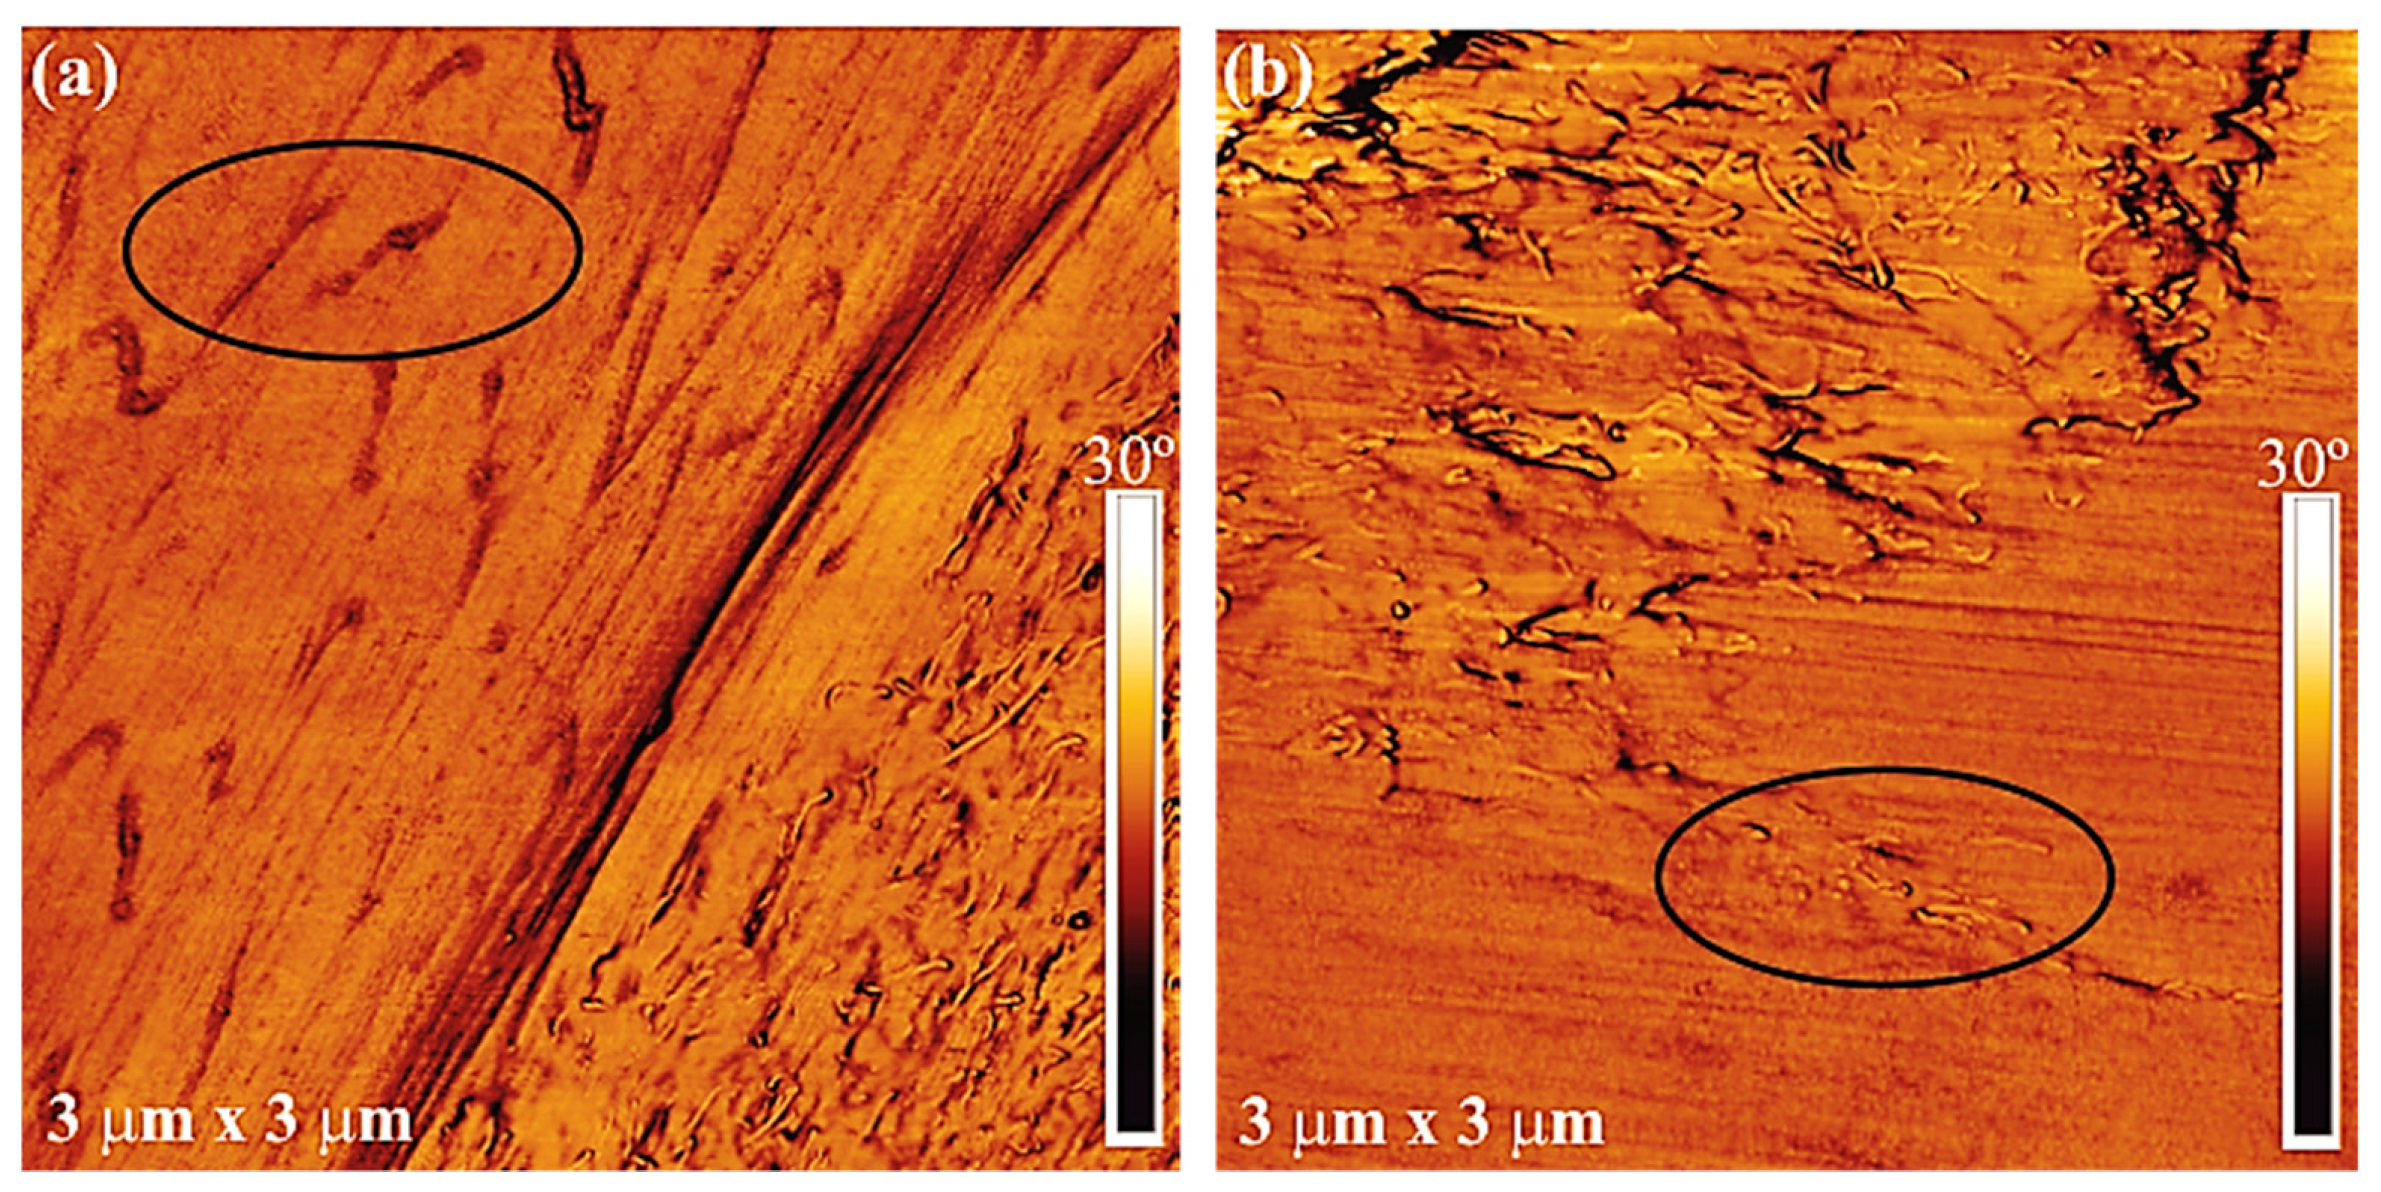
3.1. Phase Morphology of PCL/PBS Blends and PCL/PBS/(PC/MWCNTs) Blend Nanocomposites
3.2. Dynamic Mechanical Analysis (DMA)
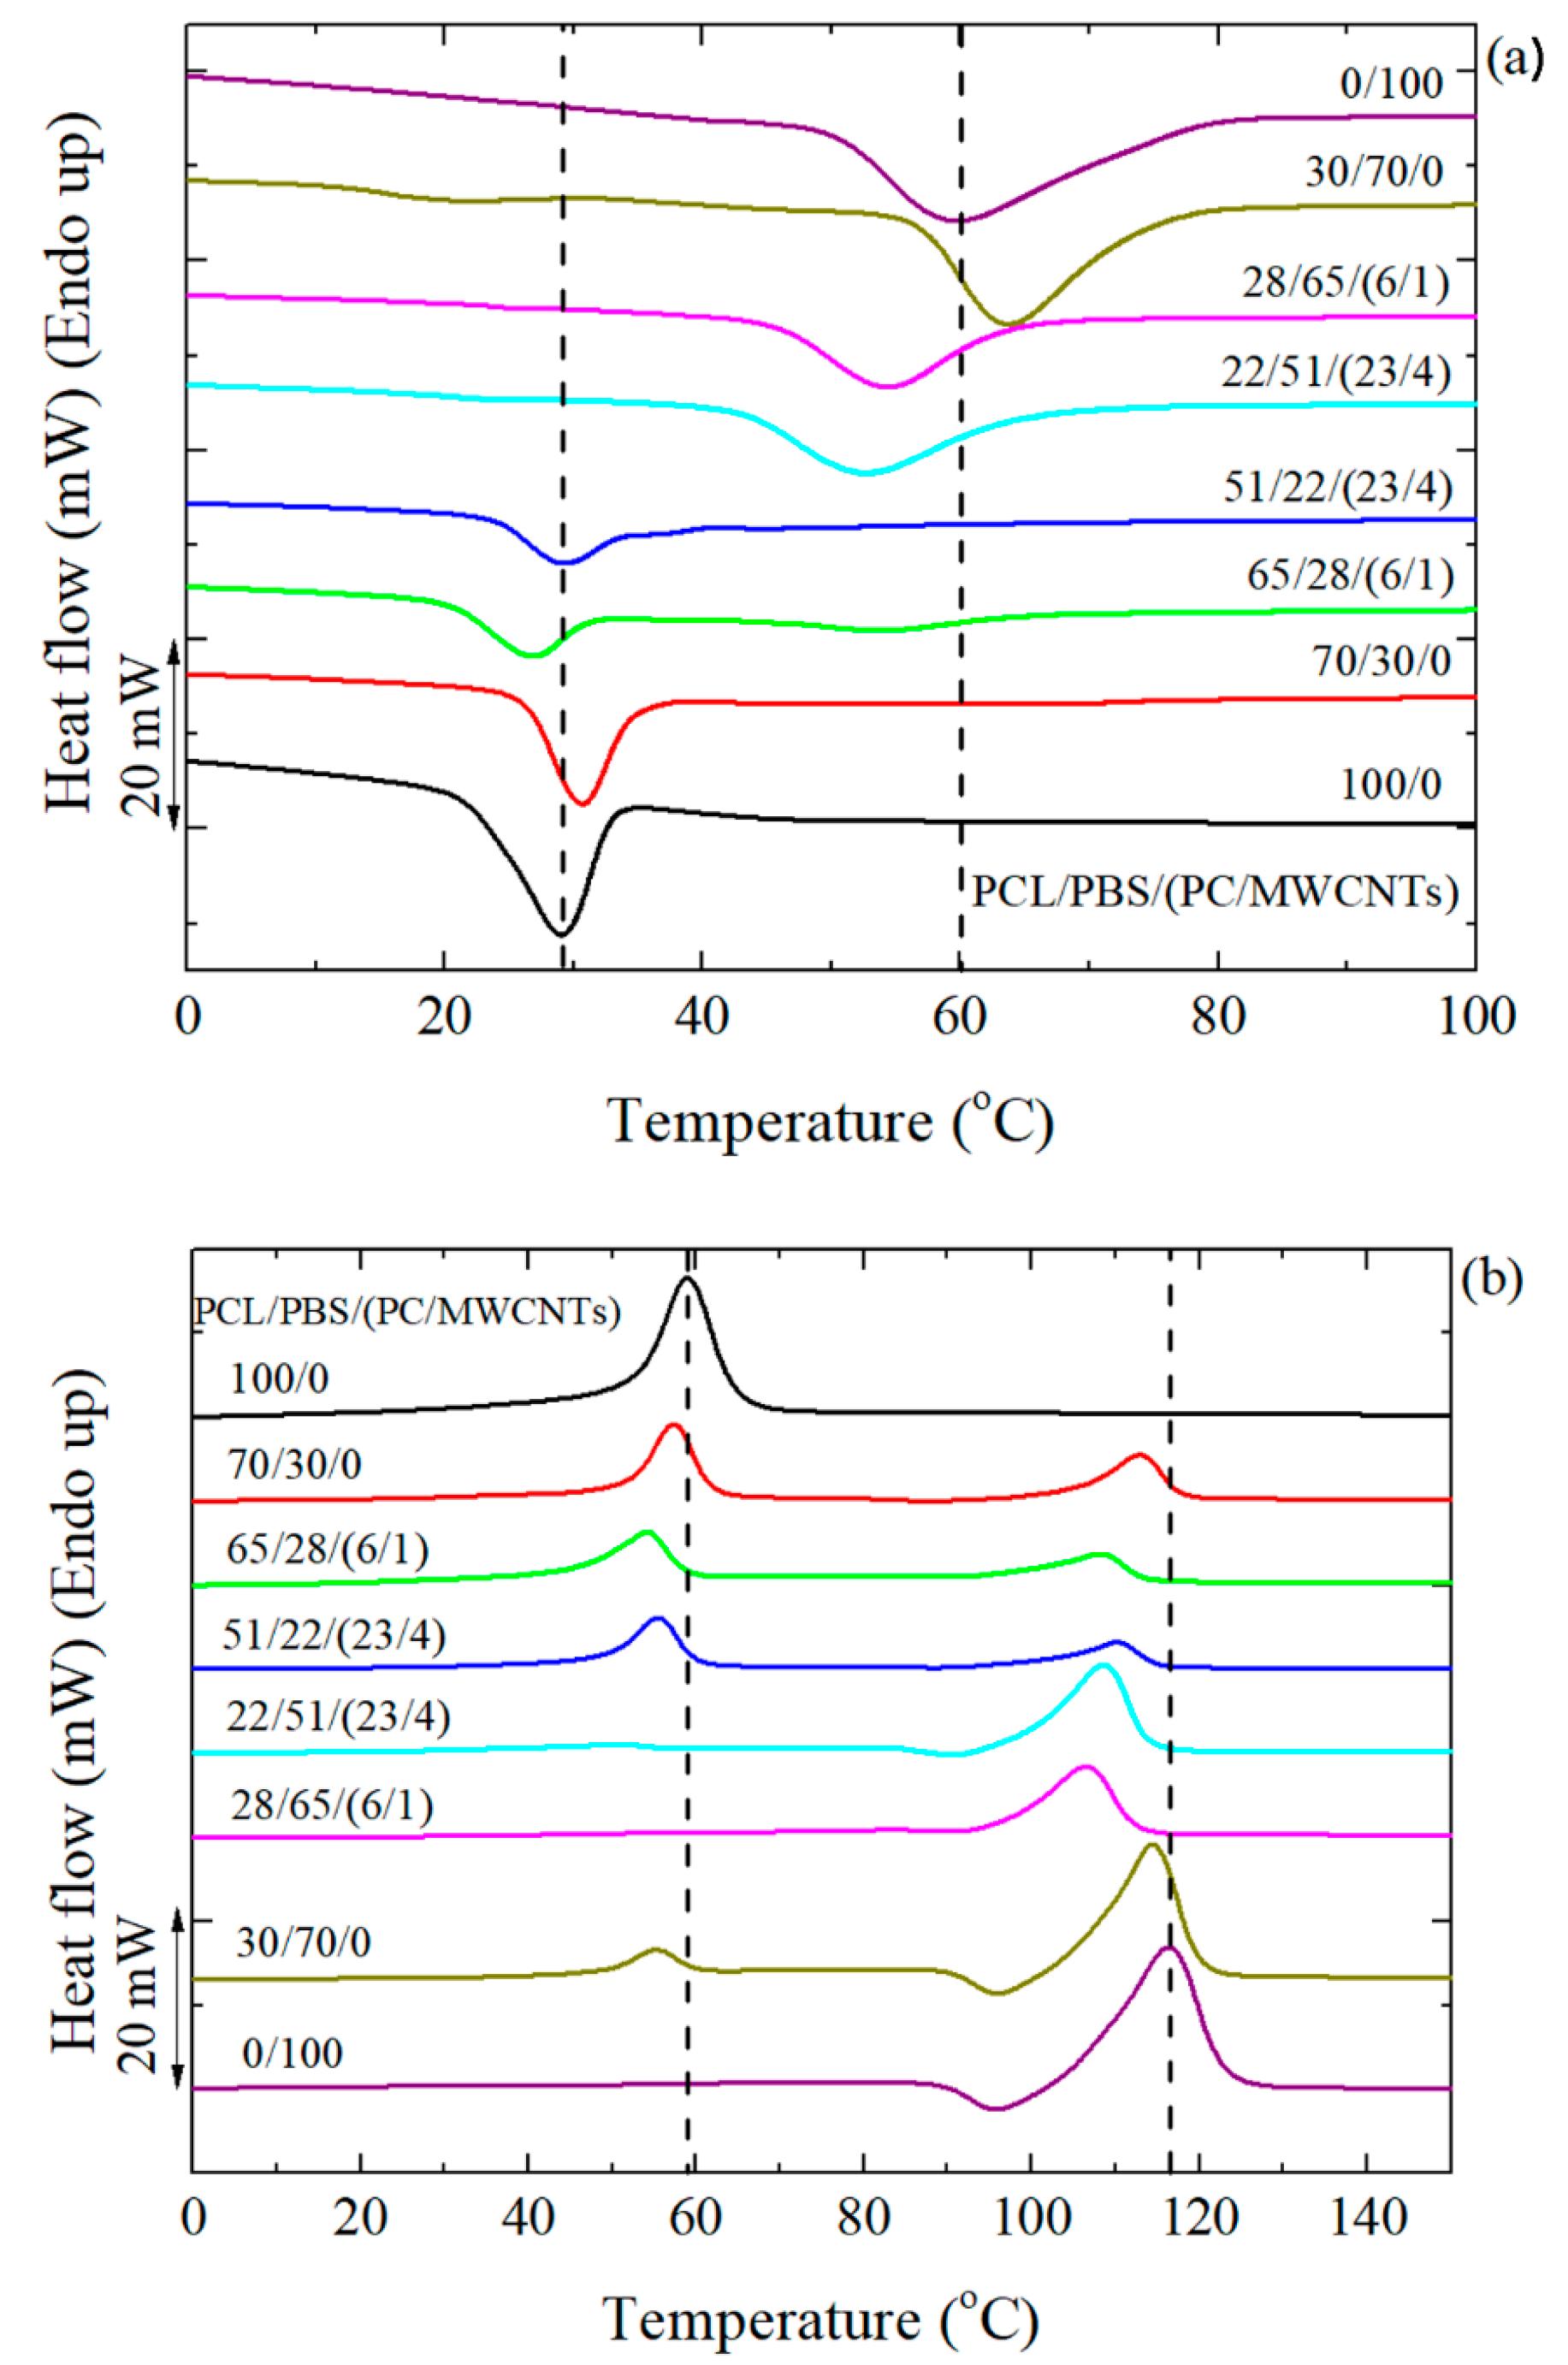
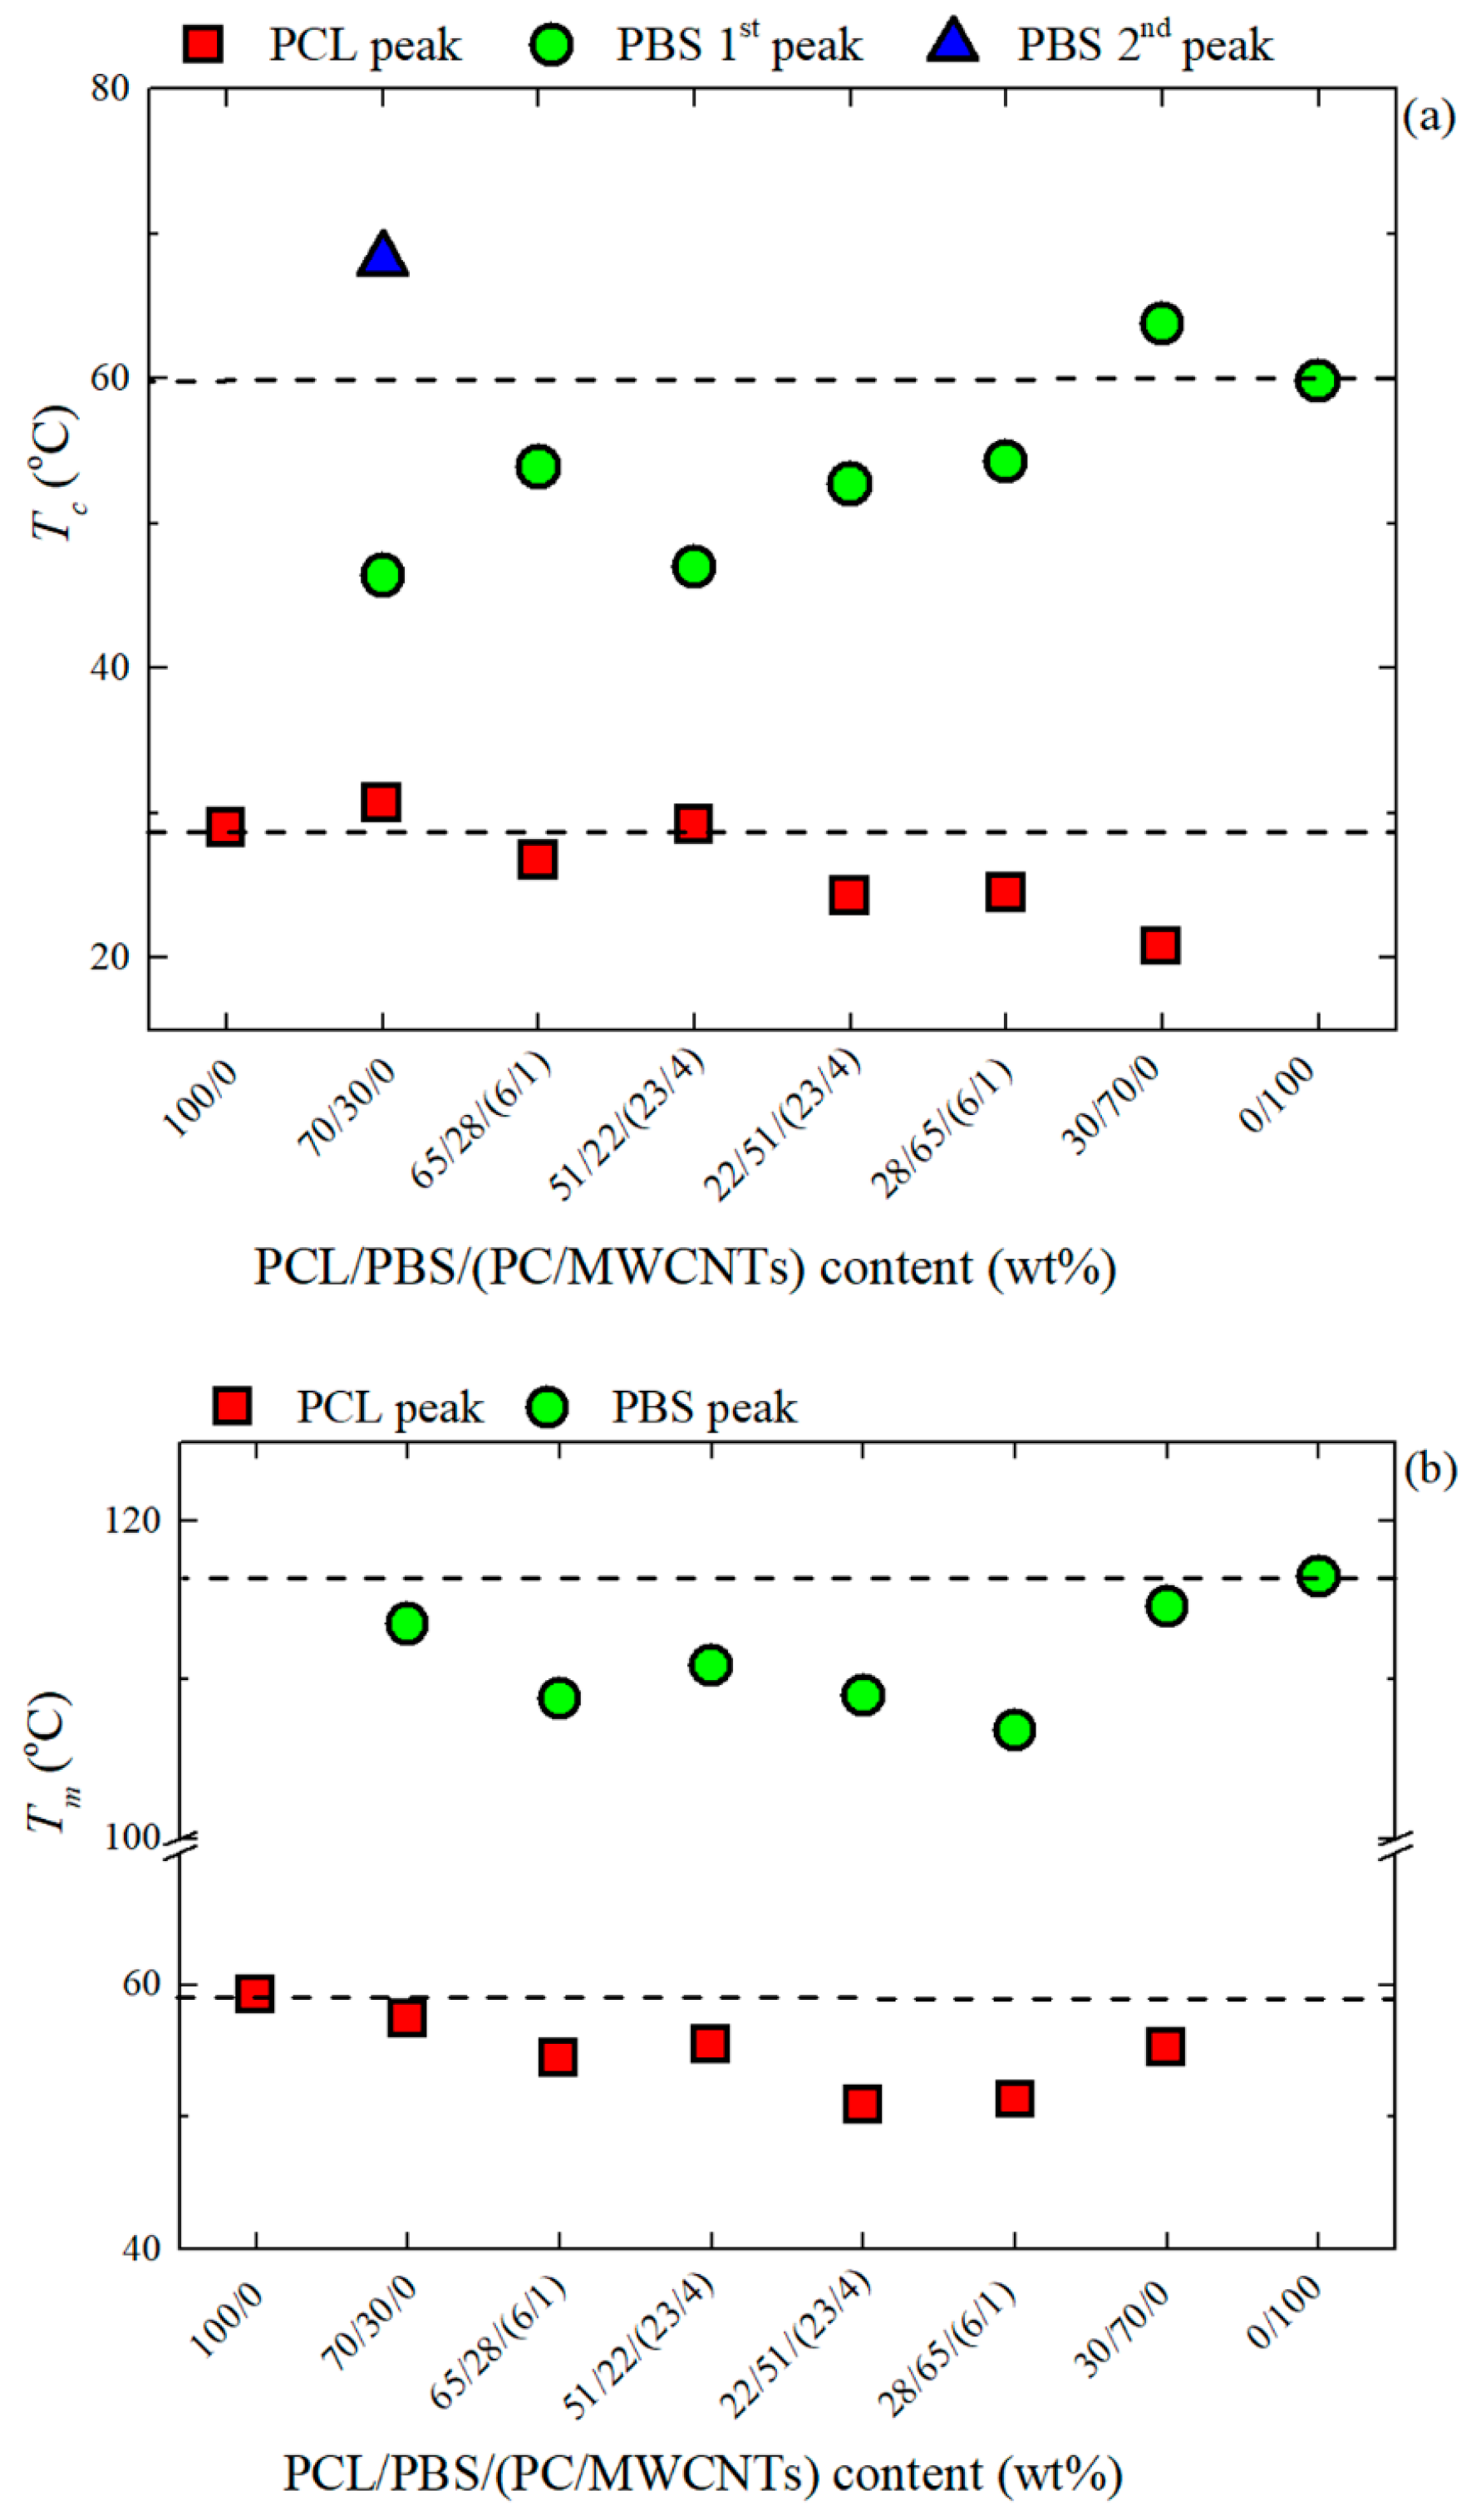
3.3. Non-Isothermal DSC
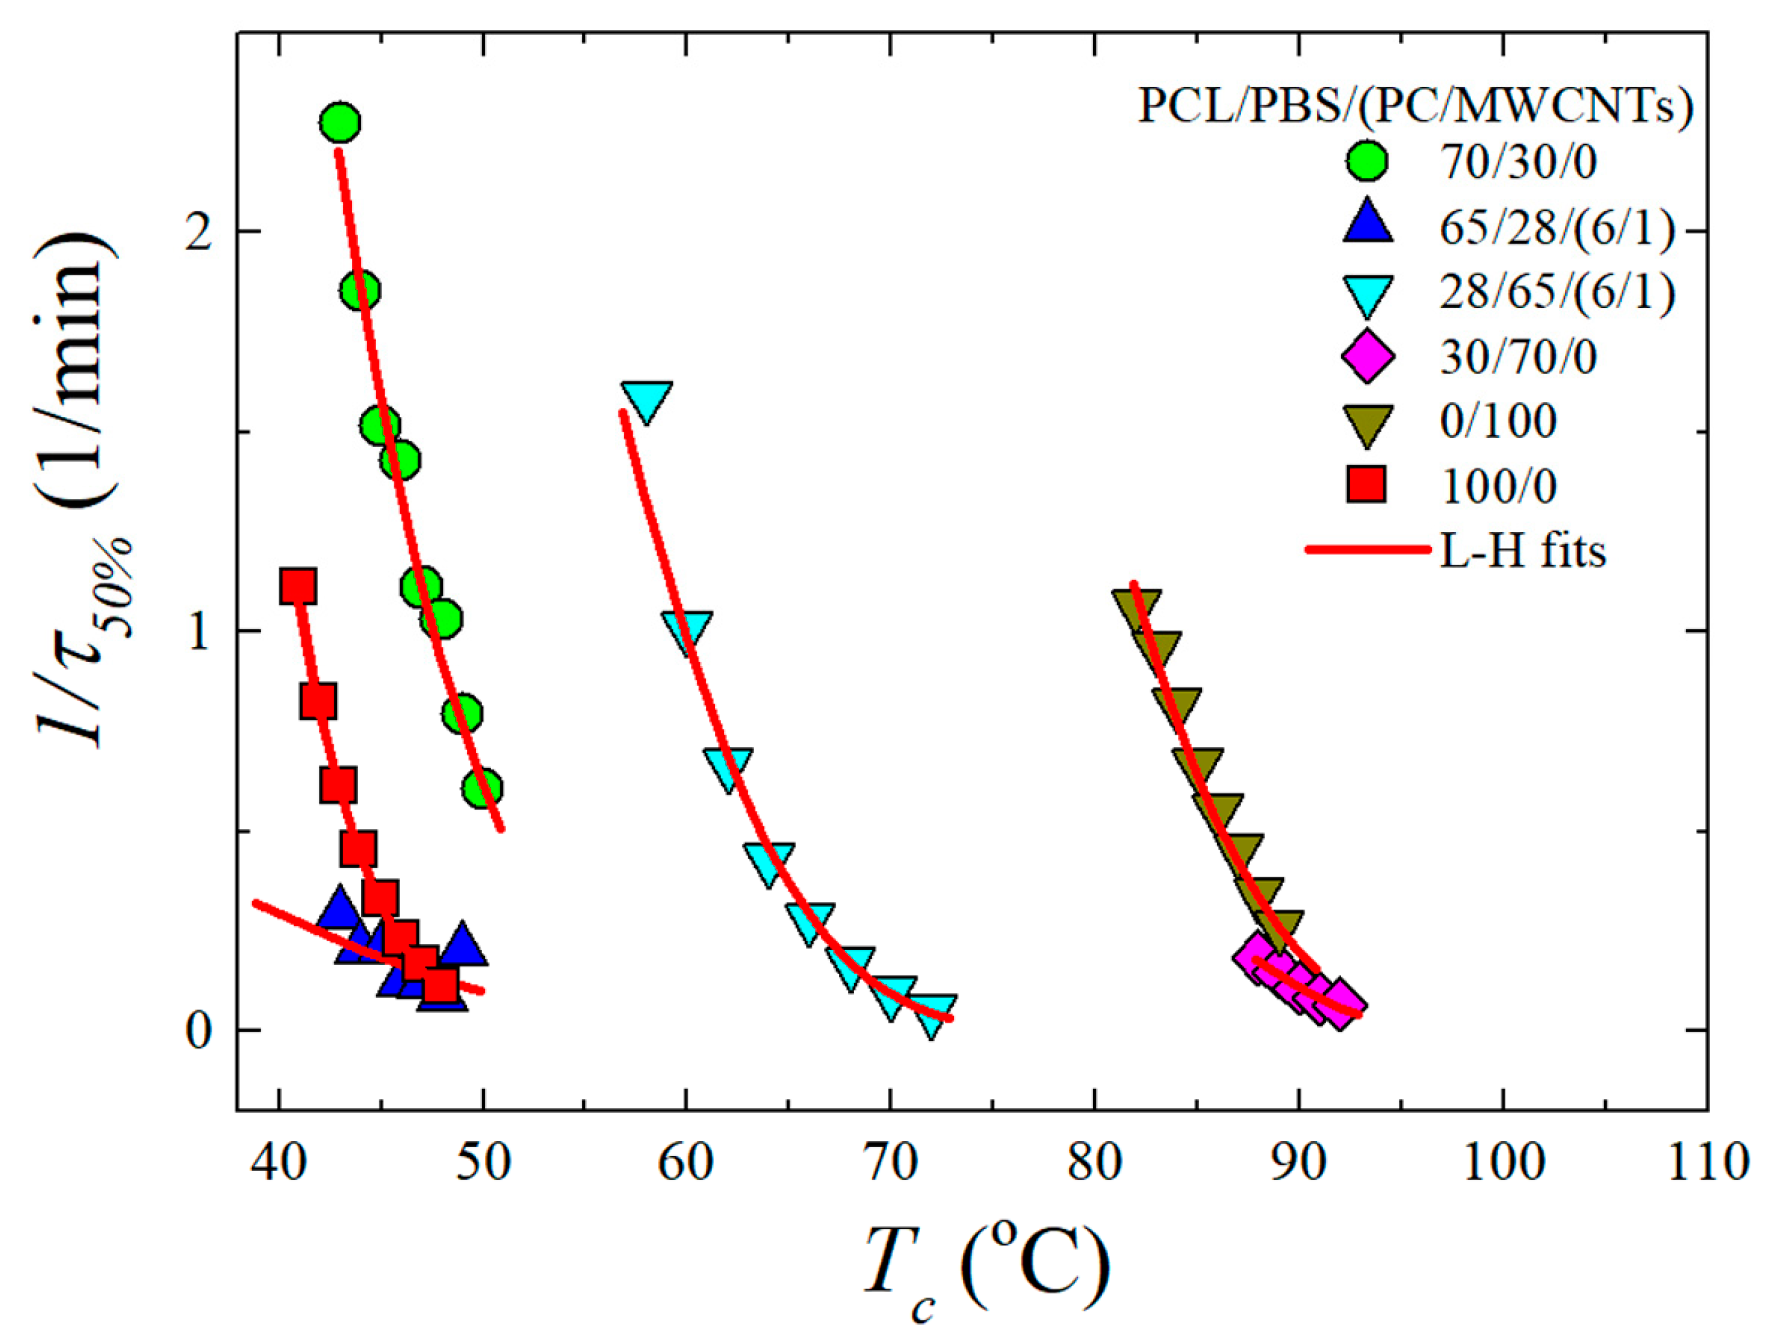
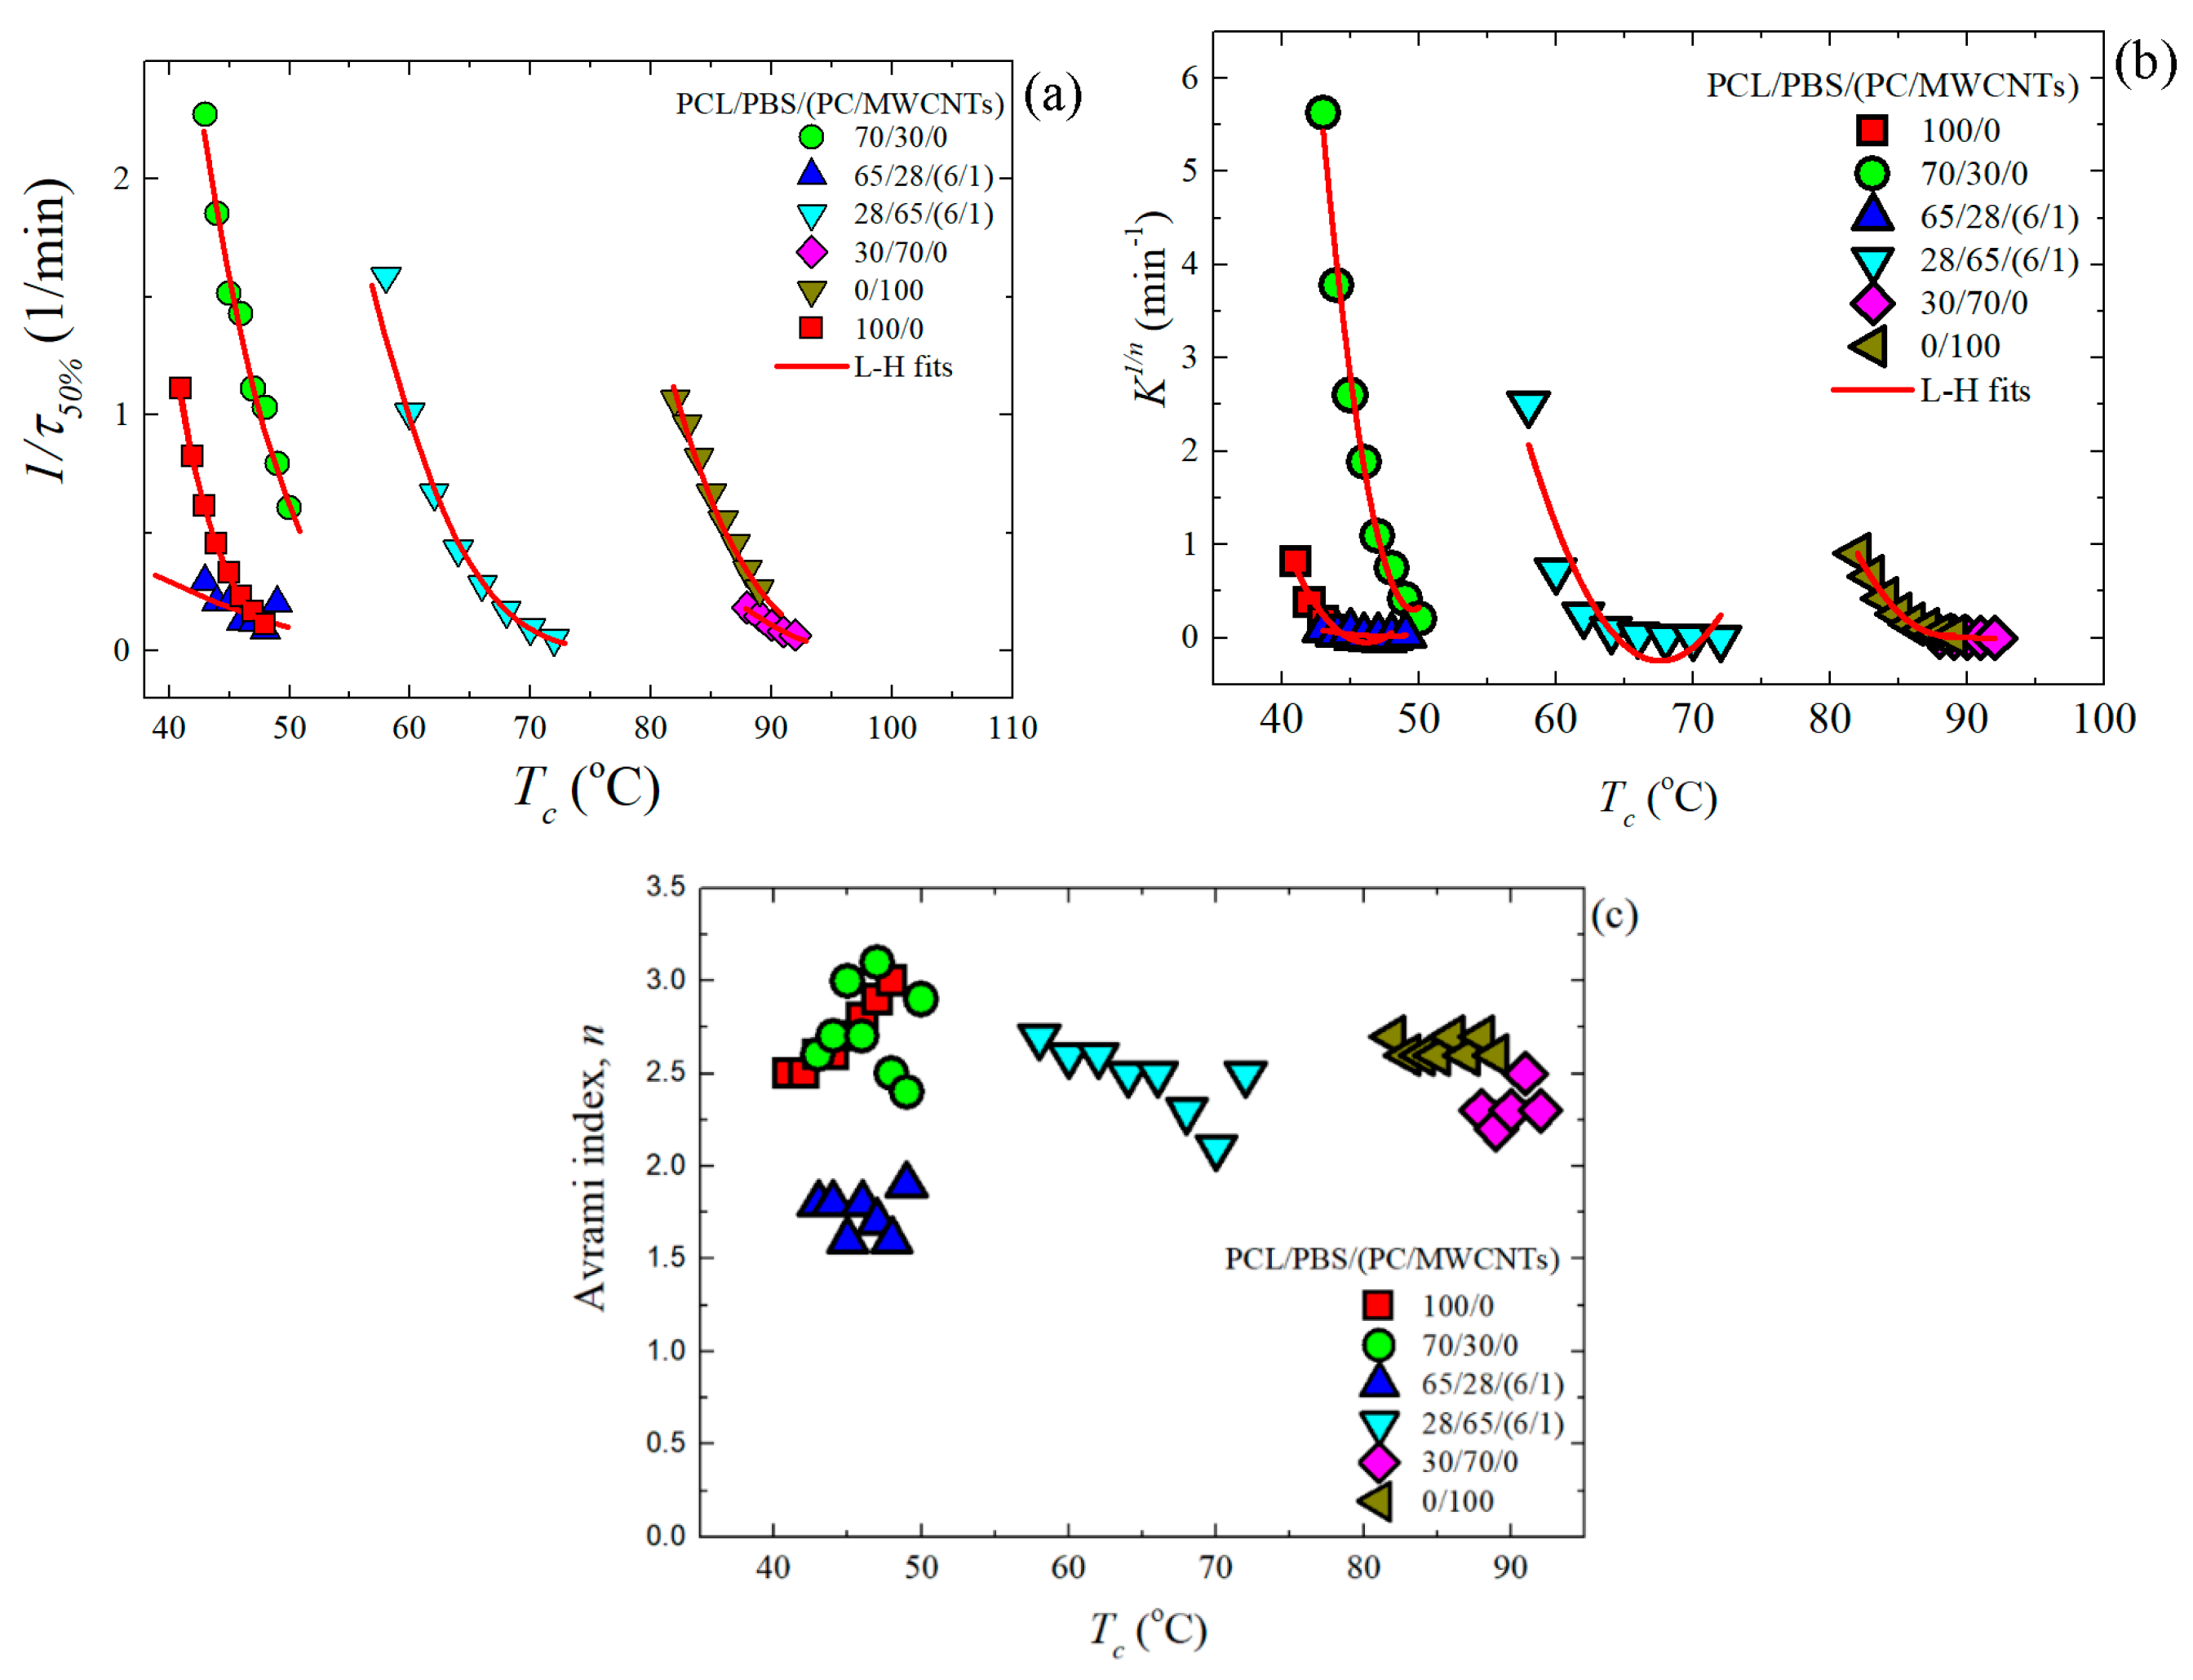
3.4. Overall Isothermal Crystallization Studied by DSC
Fitting DSC Isothermal Data to the Avrami Model
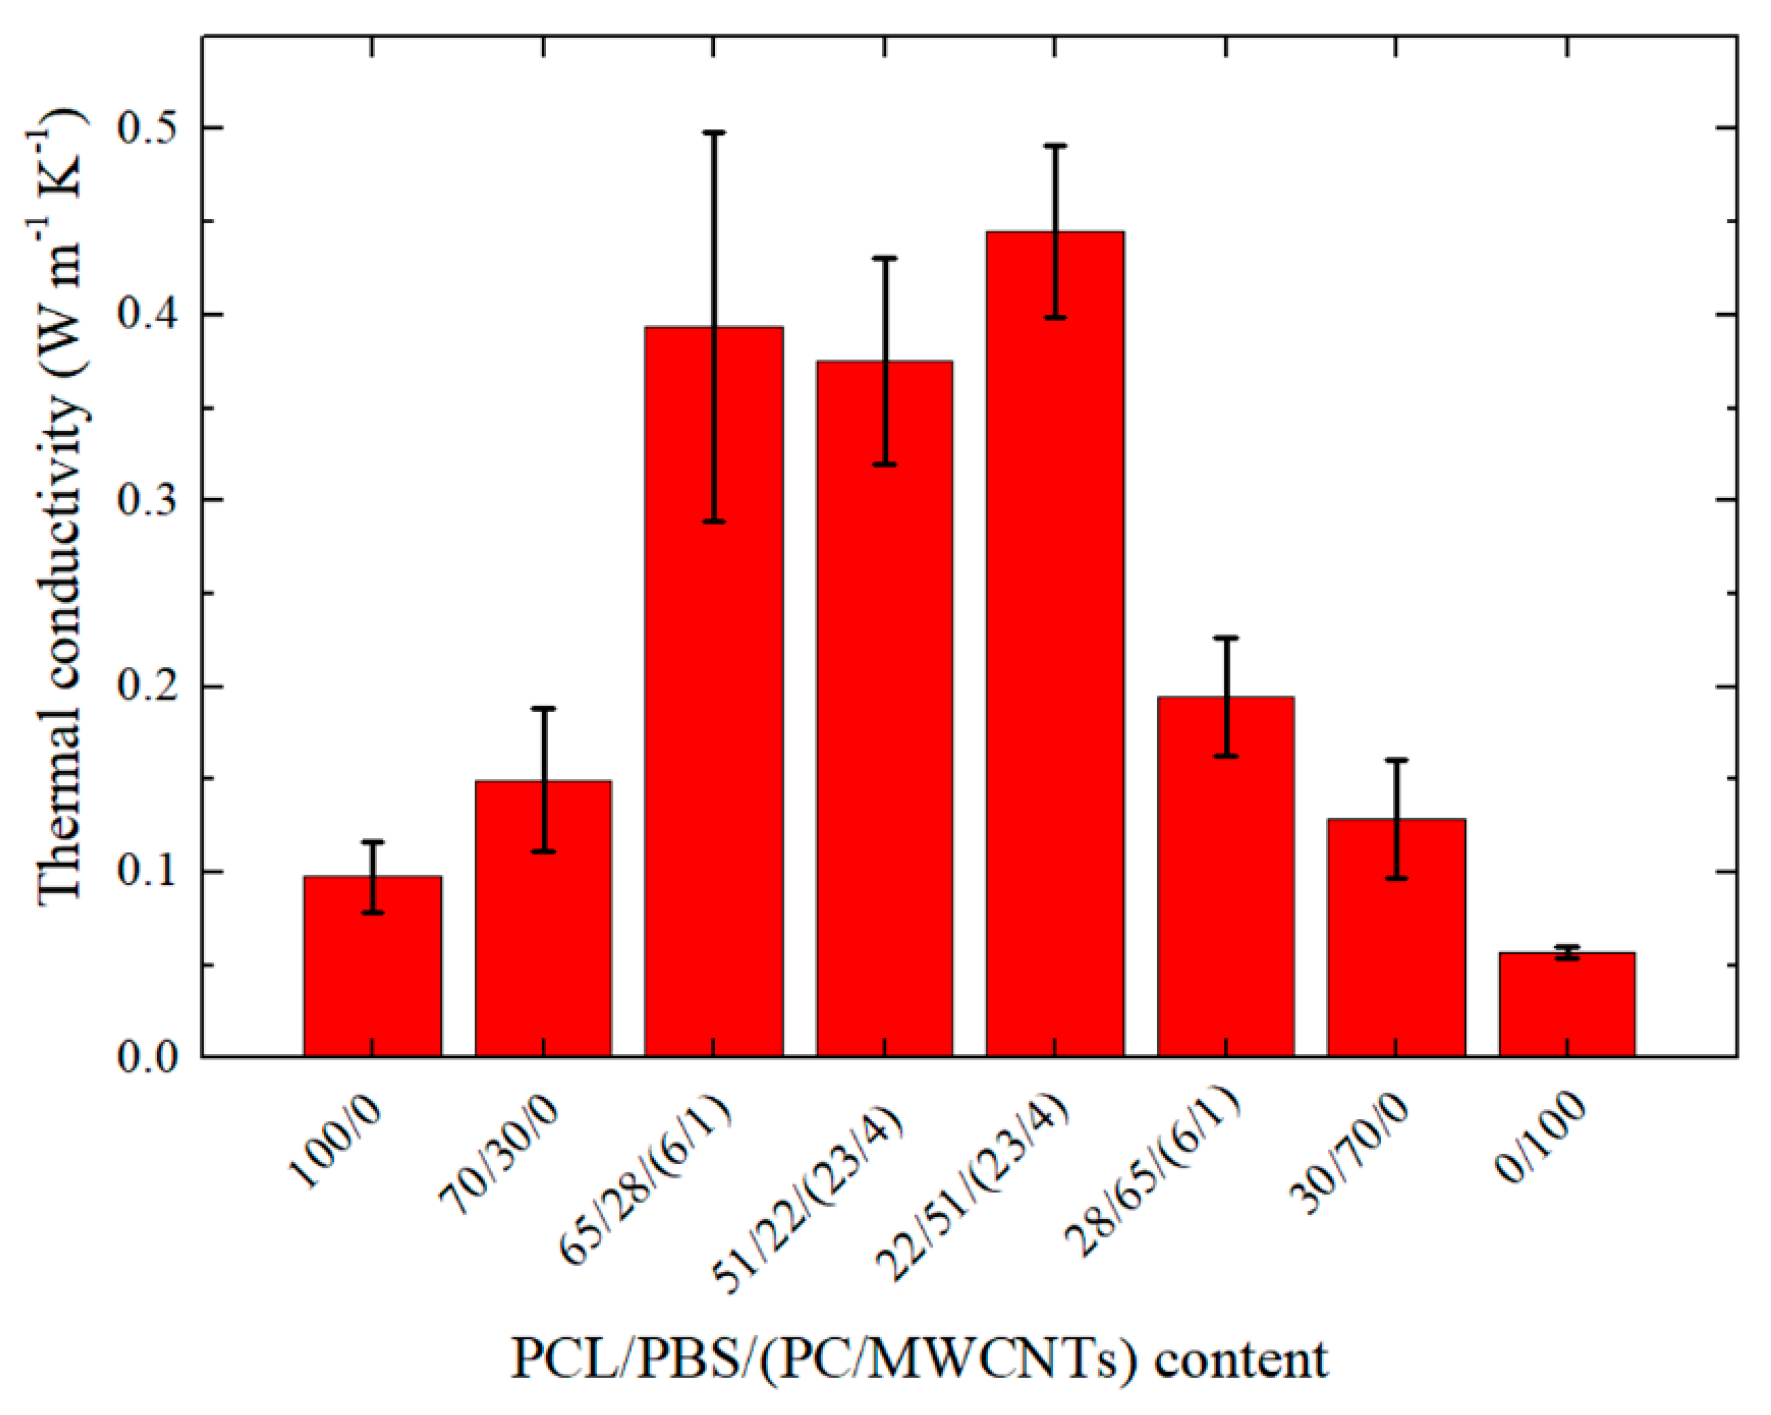
3.5. Thermal Conductivity
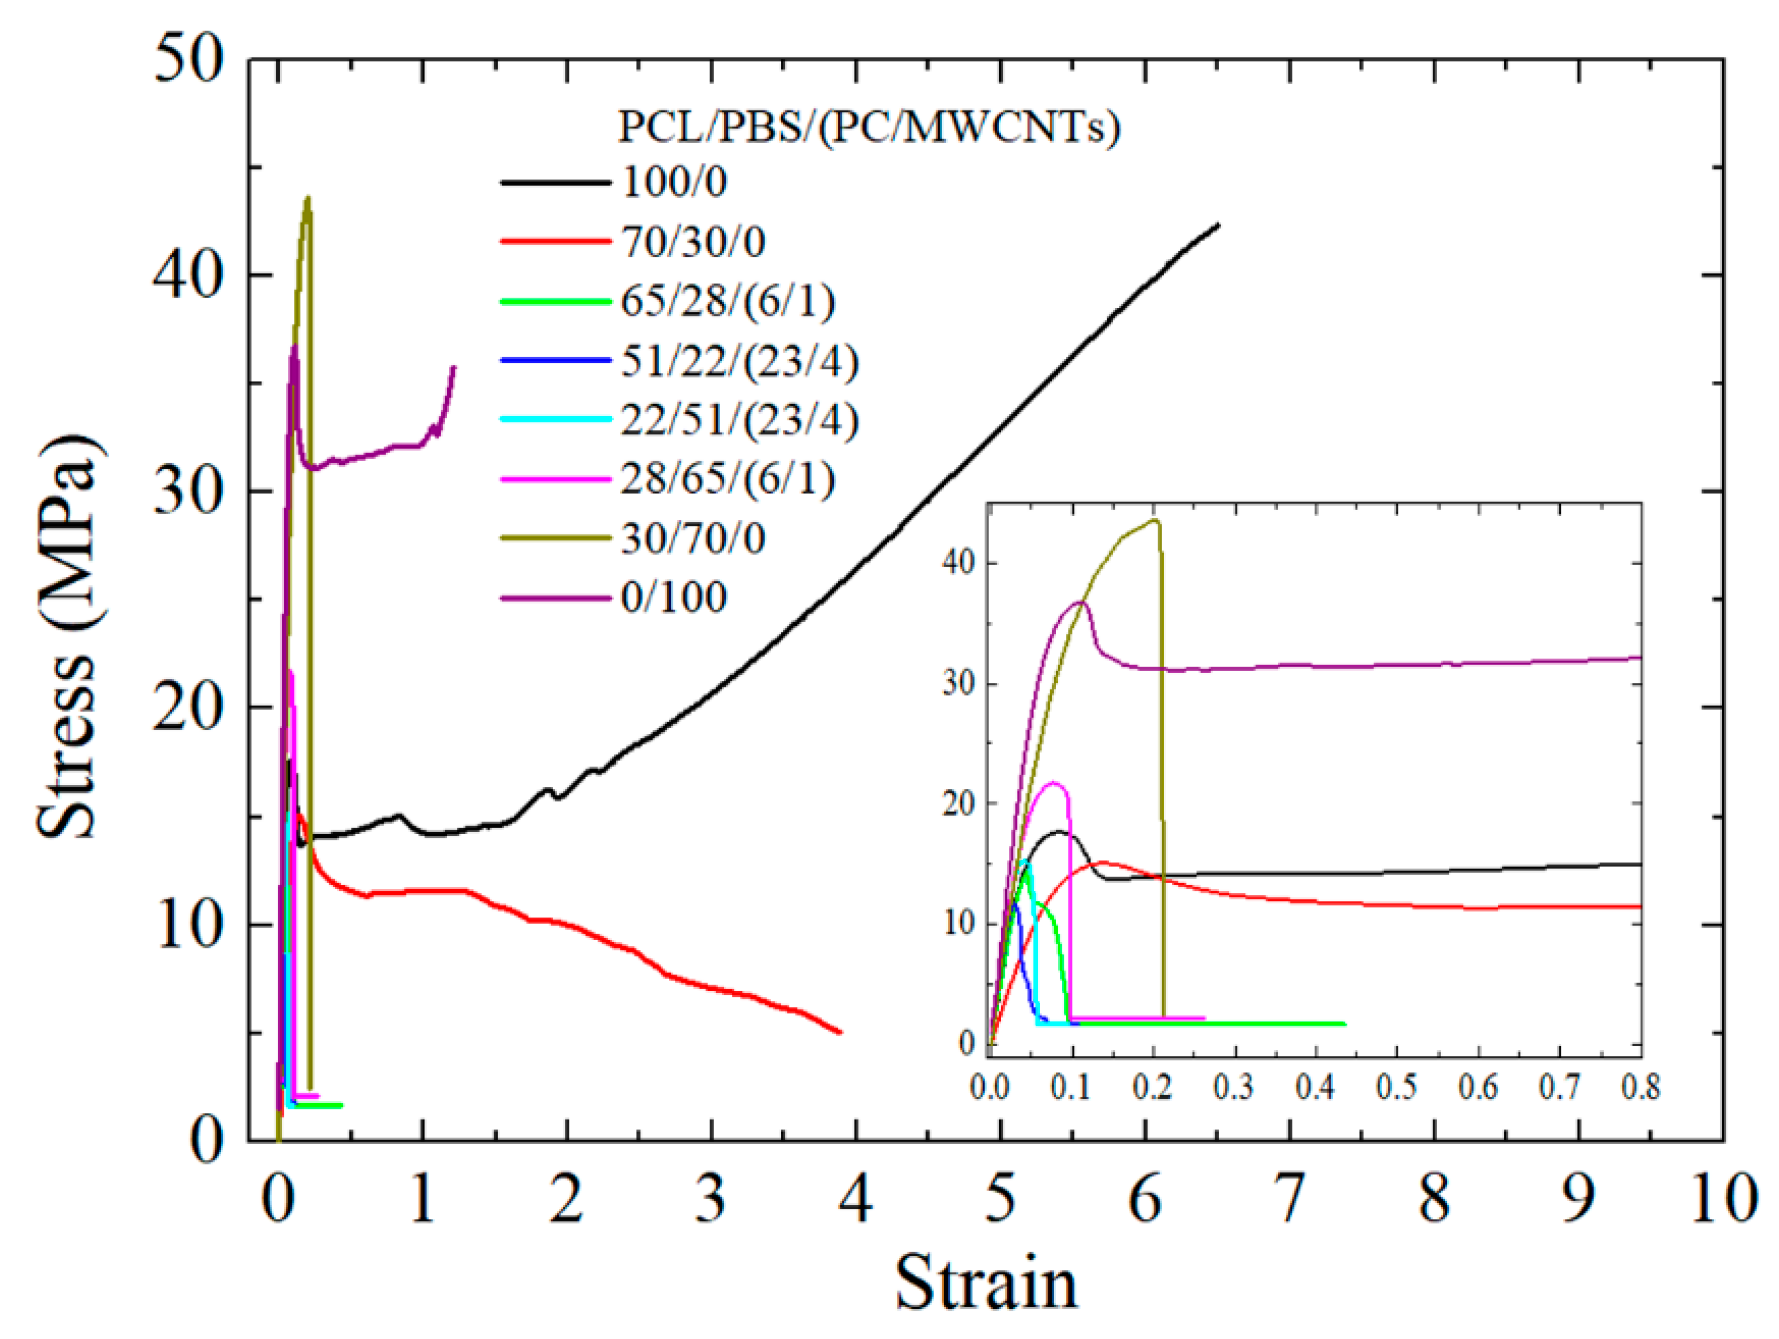
3.6. Tensile Properties
4. Conclusions
Supplementary Materials
Author Contributions
Funding
Acknowledgments
Conflicts of Interest
References
- Song, J.H.; Murphy, R.J.; Narayan, R.; Davies, G.B.H. Biodegradable and compostable alternatives to conventional plastics. Philos. Trans. R. Soc. B 2009, 364, 2127–2139. [Google Scholar] [CrossRef]
- Bhatia, A.; Gupta, R.K.; Bhattacharya, S.N.; Choi, H.J. Compatibility of biodegradable poly(lactic acid) (PLA) and poly(butylene succinate) (PBS) blends for packaging application. Korea-Aust. Rheol. J. 2007, 19, 125–131. [Google Scholar]
- Gigli, M.; Negroni, A.; Zanaroli, G.; Lotti, N.; Fava, F.; Munari, A. Environmentally friendly PBS-copolyesters containing PEG-like subunit: Effect of block length on solid-state properties and enzymatic degradation. React. Funct. Polym. 2013, 73, 764–771. [Google Scholar] [CrossRef]
- Robeson, L.M. Polymer Blends; A Comprehensive Review; Carl Hanser Verlag: München, Germany, 2007. [Google Scholar]
- Nugroho, P.; Mitomo, H.; Yoshii, F.; Kume, T.; Nishimura, K. Improvement of processability of PCL and PBS blend by irradiation and its biodegradability. Macromol. Mater. Eng. 2001, 286, 316–323. [Google Scholar] [CrossRef]
- John, J.; Mani, R.; Bhattacharya, M. Evaluation of compatibility and properties of biodegradable polyester blends. J. Polym. Sci. Part A Polym. Chem. 2002, 40, 2003–2014. [Google Scholar] [CrossRef]
- Qiu, Z.; Komura, M.; Ikehara, T.; Nishi, T. Miscibility and crystallization behavior of biodegradable blends of two aliphatic polyesters. Poly(butylene succinate) and poly(ε-caprolactone). Polymer 2003, 44, 7749–7756. [Google Scholar] [CrossRef]
- Reddy, M.M.; Mohanty, A.K.; Misra, M. Biodegradable blends from plasticized soy meal, polycaprolactone, and poly(butylene succinate). Macromol. Mater. Eng. 2012, 297, 455–463. [Google Scholar] [CrossRef]
- Can, E.; Bucak, S.; Kınacı, E.; Çalıkoğlu, A.C.; Köse, G.T. Polybutylene succinate (PBS)-polycaprolactone (PCL) blends compatibilized with poly(ethylene oxide)-block poly(propylene oxide)-blockpoly(ethylene oxide) (PEO-PPO-PEO) copolymer for biomaterial applications. Polym.-Plast. Technol. Eng. 2014, 53, 1178–1193. [Google Scholar] [CrossRef]
- Liu, Q.; Zhou, X.M. Preparation of poly(butylene succinate)/poly(ε-caprolactone) blends compatibilized with poly(butylene succinate-co-ε-caprolactone) copolymer. J. Macromol. Sci. Part A Pure Appl. Chem. 2015, 52, 625–629. [Google Scholar] [CrossRef]
- He, M.J.; Xiao, W.X.; Xie, H.; Fan, C.J.; Du, L.; Deng, X.Y.; Yang, K.K.; Wang, Y.Z. Facile fabrication of ternary nanocomposites with selective dispersion of multi-walled carbon nanotubes to access multi-stimuli-responsive shape-memory effects. Mater. Chem. Front. 2017, 1, 343–353. [Google Scholar] [CrossRef]
- Wu, D.; Lin, D.; Zhang, J.; Zhou, W.; Zhang, M.; Zhang, Y.; Wang, D.; Lin, B. Selective localization of nanofillers: Effect on morphology and crystallization of PLA/PCL blends. Macromol. Chem. Phys. 2011, 212, 613–626. [Google Scholar] [CrossRef]
- Li, L.; Ruan, W.H.; Zhang, M.Q.; Rong, M.Z. Studies on the selective localization of multi-walled carbon nanotubes in blends of poly(vinylidene fluoride) and polycaprolactone. Express Polym. Lett. 2015, 9, 77–83. [Google Scholar] [CrossRef]
- Wurm, A.; Lellinger, D.; Minakov, A.A.; Skipa, T.; Pötschke, P.; Nicula, R.; Alig, I.; Schick, C. Crystallization of poly(ε-caprolactone)/MWCNT composites: A combined SAXS/WAXS, electrical and thermal conductivity study. Polymer 2014, 55, 2220–2232. [Google Scholar] [CrossRef]
- Chin, S.J.; Vempati, S.; Dawson, P.; Knite, M.; Linarts, A.; Ozols, K.; McNally, T. Electrical conduction and rheological behaviour of composites of poly(ε-caprolactone) and MWCNTs. Polymer 2015, 58, 209–221. [Google Scholar] [CrossRef]
- Pötschke, P.; Villmow, T.; Krause, B. Melt mixed PCL/MWCNT composites prepared at different rotation speeds: Characterization of rheological, thermal, and electrical properties, molecular weight, MWCNT macrodispersion, and MWCNT length distribution. Polymer 2013, 54, 3071–3078. [Google Scholar] [CrossRef]
- Wang, T.; Wang, H.; Li, H.; Gan, Z.; Yan, S. Banded spherulitic structures of poly(ethylene adipate), poly(butylene succinate) and in their blends. Phys. Chem. Chem. Phys. 2009, 11, 1619–1627. [Google Scholar] [CrossRef]
- Kasaliwal, G.R.; Göldel, A.; Pötschke, P.; Heinrich, G. Influences of polymer matrix melt viscosity and molecular weight on MWCNT agglomerate dispersion. Polymer 2011, 52, 1027–1036. [Google Scholar] [CrossRef]
- Lorenzo, A.T.; Arnal, M.L.; Albuerne, J.; Müller, A.J. DSC isothermal polymer crystallization kinetics measurements and the use of the Avrami equation to fit the data: Guidelines to avoid common problems. Polym. Test. 2007, 26, 222–231. [Google Scholar] [CrossRef]
- Hoffman, J.D.; Weeks, J.J. Melting process and the equilibrium melting temperature of polychlorotrifluoroethylene. J. Res. Nat. Bur. Stand. A. Phys. Chem. 1962, 66, 13–28. [Google Scholar] [CrossRef]
- Utracki, L.A.; Wilkie, C. Polymer Blends Handbook, 2nd ed.; Springer: Dordrecht, The Netherlands, 2014. [Google Scholar]
- Huneault, M.A.; Mighri, F.; Ko, G.H.; Watanabe, F. Dispersion in high viscosity ratio polyolefin blends. Polym. Eng. Sci. 2004, 41, 672–683. [Google Scholar] [CrossRef]
- Gumede, T.P.; Luyt, A.S.; Hassan, M.K.; Pérez-Camargo, R.A.; Tercjak, A.; Müller, A.J. Morphology, nucleation, and isothermal crystallization kinetics of poly(ε-caprolactone) mixed with a polycarbonate/MWCNTs masterbatch. Polymers 2017, 9, 709. [Google Scholar] [CrossRef] [PubMed]
- Gumede, T.P.; Luyt, A.S.; Pérez-Camargo, R.A.; Tercjak, A.; Müller, A.J. Morphology, nucleation, and isothermal crystallization kinetics of poly(butylene succinate) mixed with a polycarbonate/MWCNT masterbatch. Polymers 2018, 10, 424. [Google Scholar] [CrossRef]
- Balsamo, V.; Calzadilla, N.; Mora, G.; Müller, A.J. Thermal characterization of polycarbonate/polycaprolactone blends. J. Polym. Sci. Part B Polym. Phys. 2001, 39, 771–785. [Google Scholar] [CrossRef]
- Ketelaars, A.A.J.; Papantoniou, Y.; Nakayama, K. Analysis of the density and the enthalpy of poly(ε-caprolactone)-polycarbonate blends: Amorphous phase compatibility and the effect of secondary crystallization. J. Appl. Polym. Sci. 1997, 66, 921–927. [Google Scholar] [CrossRef]
- Xiu, H.; Bai, H.W.; Huang, C.M.; Xu, C.L.; Li, X.Y.; Fu, Q. Selective localization of titanium dioxide nanoparticles at the interface and its effect on the impact toughness of poly(Llactide)/poly(ether)urethane blends. Express Polym. Lett. 2013, 7, 261–271. [Google Scholar] [CrossRef]
- Yang, H.; Zhang, X.; Qu, C.; Li, B.; Zhang, L.; Zhang, Q.; Fu, Q. Largely improved toughness of PP/EPDM blends by adding nano-SiO2 particles. Polymer 2007, 48, 860–869. [Google Scholar] [CrossRef]
- Owens, D.K.; Wendt, R.C. Estimation of the surface free energy of polymers. J. Appl. Polym. Sci. 1969, 13, 1741–1747. [Google Scholar] [CrossRef]
- Wang, X.; Xu, K.J.; Xu, X.B.; Park, S.J.; Kim, S. Selective particle distribution and mechanical properties of nano-CaCO3/ethylene-propylene-diene terpolymer/polypropylene composites with high content of nano-CaCO3. J. Appl. Polym. Sci. 2009, 113, 2485–2491. [Google Scholar] [CrossRef]
- Fenouillot, F.; Cassagnau, P.; Majeste, J.C. Uneven distribution of nanoparticles in immiscible fluids: Morphology development in polymer blends. Polymer 2009, 50, 1333–1350. [Google Scholar] [CrossRef]
- Pracella, M. Crystallization of Polymer Blends. In Handbook of Polymer Crystallization; Piorkowka, E., Rutledge, G.C., Eds.; John Wiley: Hoboken, NJ, USA, 2013; pp. 287–307. [Google Scholar]
- Bikiaris, D.N.; Papageorgiou, G.Z.; Achilias, D.S.; Pavlidou, E.; Stergiou, A. Miscibility and enzymatic degradation studies of poly(ε-caprolactone)/poly(propylene succinate) blends. Eur. Polym. J. 2007, 43, 2491–2503. [Google Scholar] [CrossRef]
- Avrami, M. Granulation, phase change, and microstructure kinetics of phase change III. J. Chem. Phys. 1941, 9, 177–184. [Google Scholar] [CrossRef]
- Pérez, R.A.; López, J.V.; Hoskins, J.N.; Zhang, B.; Grayson, S.M.; Casas, M.T.; Puiggalí, J.; Müller, A.J. Nucleation and antinucleation effects of functionalized carbon nanotubes on cyclic and linear poly(ε-caprolactones). Macromolecules 2014, 47, 3553–3566. [Google Scholar] [CrossRef]
- Bhattacharya, M. Review: Polymer nanocomposites—A Comparison between carbon nanotubes, graphene, and clay as nanofillers. Materials 2016, 9, 262. [Google Scholar] [CrossRef] [PubMed]


| PCL (%) | PBS (%) | PC (%) | MWCNTs (%) |
|---|---|---|---|
| 100 | 0 | 0 | 0 |
| 70 | 30 | 0 | 0 |
| 65 | 28 | 6 | 1 |
| 51 | 22 | 23 | 4 |
| 22 | 51 | 23 | 4 |
| 28 | 65 | 6 | 1 |
| 30 | 70 | 0 | 0 |
| 0 | 100 | 0 | 0 |
| w/w PCL/PBS/(PC/MWCNTs) | Dispersed Polymer Droplets (dn (µm)/dv (µm)/D) |
|---|---|
| 30/70/0 | 0.4/0.6/1.4 |
| 28/65/(6/1) | 3.1/3.8/1.2 |
| 22/51/(23/4) | 0.5/0.6/1.2 |
| 51/22/(23/4) | 2.9/4.3/1.5 |
| 65/28/(6/1) | 2.0/3.4/1.7 |
| 70/30/0 | 1.3/1.5/1.2 |
| Sample | Contact Angle/Degree | Surface Energy/mN m−1 | MFI (g/10 min) | |||
|---|---|---|---|---|---|---|
| H2O | CH2I2 | Γ | γd | γp | ||
| Neat PCL | 59.7 ± 1.3 | 16.1 ± 0.2 | 58.4 | 48.8 | 9.6 | 11.5 |
| Neat PBS | 35.9 ± 0.7 | 14.8 ± 0.3 | 70.7 | 49.1 | 21.6 | 20.9 |
| PC/MWCNTs masterbatch | 47.6 ± 1.1 | 23.7 ± 1.0 | 63.2 | 46.6 | 16.6 | 5.6 |
| Component Pair | Interfacial Tension/mN m−1 |
|---|---|
| PCL/PBS | 2.38 |
| PCL/(PC/MWCNTs) | 0.97 |
| PBS/(PC/MWCNTs) | 0.36 |
| Wetting coefficient (wα) | −0.26 |
| PCL/PBS/(PC/MWCNTs) | Tg (°C) from E’ vs. T | Tg (°C) from E” vs. T | Tg (°C) from tan δ vs. T | |||
|---|---|---|---|---|---|---|
| 100/0 | −60.8 | - | −47.9 | - | −40.0 | - |
| 70/30/0 | −58.2 | −16.9 | −49.0 | −25.1 | −43.4 | −16.9 |
| 65/28/(6/1) | −54.4 | −16.3 | −41.2 | −22.2 | −36.6 | −16.3 |
| 51/22/(23/4) | −55.8 | −25.5 | −44.9 | −23.6 | −43.9 | −25.5 |
| 22/51/(23/4) | −53.8 | −25.5 | −48.6 | −22.6 | −49.2 | −25.5 |
| 28/65/(6/1) | −56.3 | −31.9 | −50.2 | −22.9 | −49.6 | −31.9 |
| 30/70/0 | −52.4 | −29.9 | −51.2 | −23.3 | −49.0 | −29.9 |
| 0/100 | - | −35.5 | - | −27.6 | - | −35.5 |
| w/w PCL/PBS/(PC/MWCNTs) | E/MPa | ||||
|---|---|---|---|---|---|
| 100/0 | 16 ± 2 | 14 ± 8 | 34 ± 13 | 578 ± 151 | 388 ± 29 |
| 70/30/0 | 15 ± 2 | 12 ± 13 | 12 ± 4 | 520 ± 142 | 274 ± 2 |
| 65/28/(6/1) | 16 ± 1 | 4.4 ± 0.2 | 8 ± 1 | 7.7 ± 0.3 | 457 ± 39 |
| 51/22/(23/4) | - | - | 11 ± 2 | 4.0 ± 0.8 | 432 ± 43 |
| 22/51/(23/4) | - | - | 9 ± 3 | 5.8 ± 0.4 | 484 ± 35 |
| 28/65/(6/1) | - | - | 19.7 ± 0.3 | 9 ± 1 | 448 ± 22 |
| 30/70/0 | - | - | 28 ± 8 | 50 ± 1 | 438 ± 11 |
| 0/100 | - | - | 38 ± 2 | 210 ± 110 | 579 ± 139 |
© 2019 by the authors. Licensee MDPI, Basel, Switzerland. This article is an open access article distributed under the terms and conditions of the Creative Commons Attribution (CC BY) license (http://creativecommons.org/licenses/by/4.0/).
Share and Cite
Gumede, T.P.; Luyt, A.S.; Tercjak, A.; Müller, A.J. Isothermal Crystallization Kinetics and Morphology of Double Crystalline PCL/PBS Blends Mixed with a Polycarbonate/MWCNTs Masterbatch. Polymers 2019, 11, 682. https://doi.org/10.3390/polym11040682
Gumede TP, Luyt AS, Tercjak A, Müller AJ. Isothermal Crystallization Kinetics and Morphology of Double Crystalline PCL/PBS Blends Mixed with a Polycarbonate/MWCNTs Masterbatch. Polymers. 2019; 11(4):682. https://doi.org/10.3390/polym11040682
Chicago/Turabian StyleGumede, Thandi P., Adriaan S. Luyt, Agnieszka Tercjak, and Alejandro J. Müller. 2019. "Isothermal Crystallization Kinetics and Morphology of Double Crystalline PCL/PBS Blends Mixed with a Polycarbonate/MWCNTs Masterbatch" Polymers 11, no. 4: 682. https://doi.org/10.3390/polym11040682
APA StyleGumede, T. P., Luyt, A. S., Tercjak, A., & Müller, A. J. (2019). Isothermal Crystallization Kinetics and Morphology of Double Crystalline PCL/PBS Blends Mixed with a Polycarbonate/MWCNTs Masterbatch. Polymers, 11(4), 682. https://doi.org/10.3390/polym11040682