Author Contributions
Conceptualization, W.K. (Wonho Kim), W.K. (Woong Kim); data curation, W.K. (Woong Kim); investigation, E.Y., G.R.; formal analysis, B.A., D.K.; Visualization, H.M., K.H.; project administration, W.K. (Wonho Kim); Supervision, W.K. (Wonho Kim); Writing—original draft, W.K. (Woong Kim).
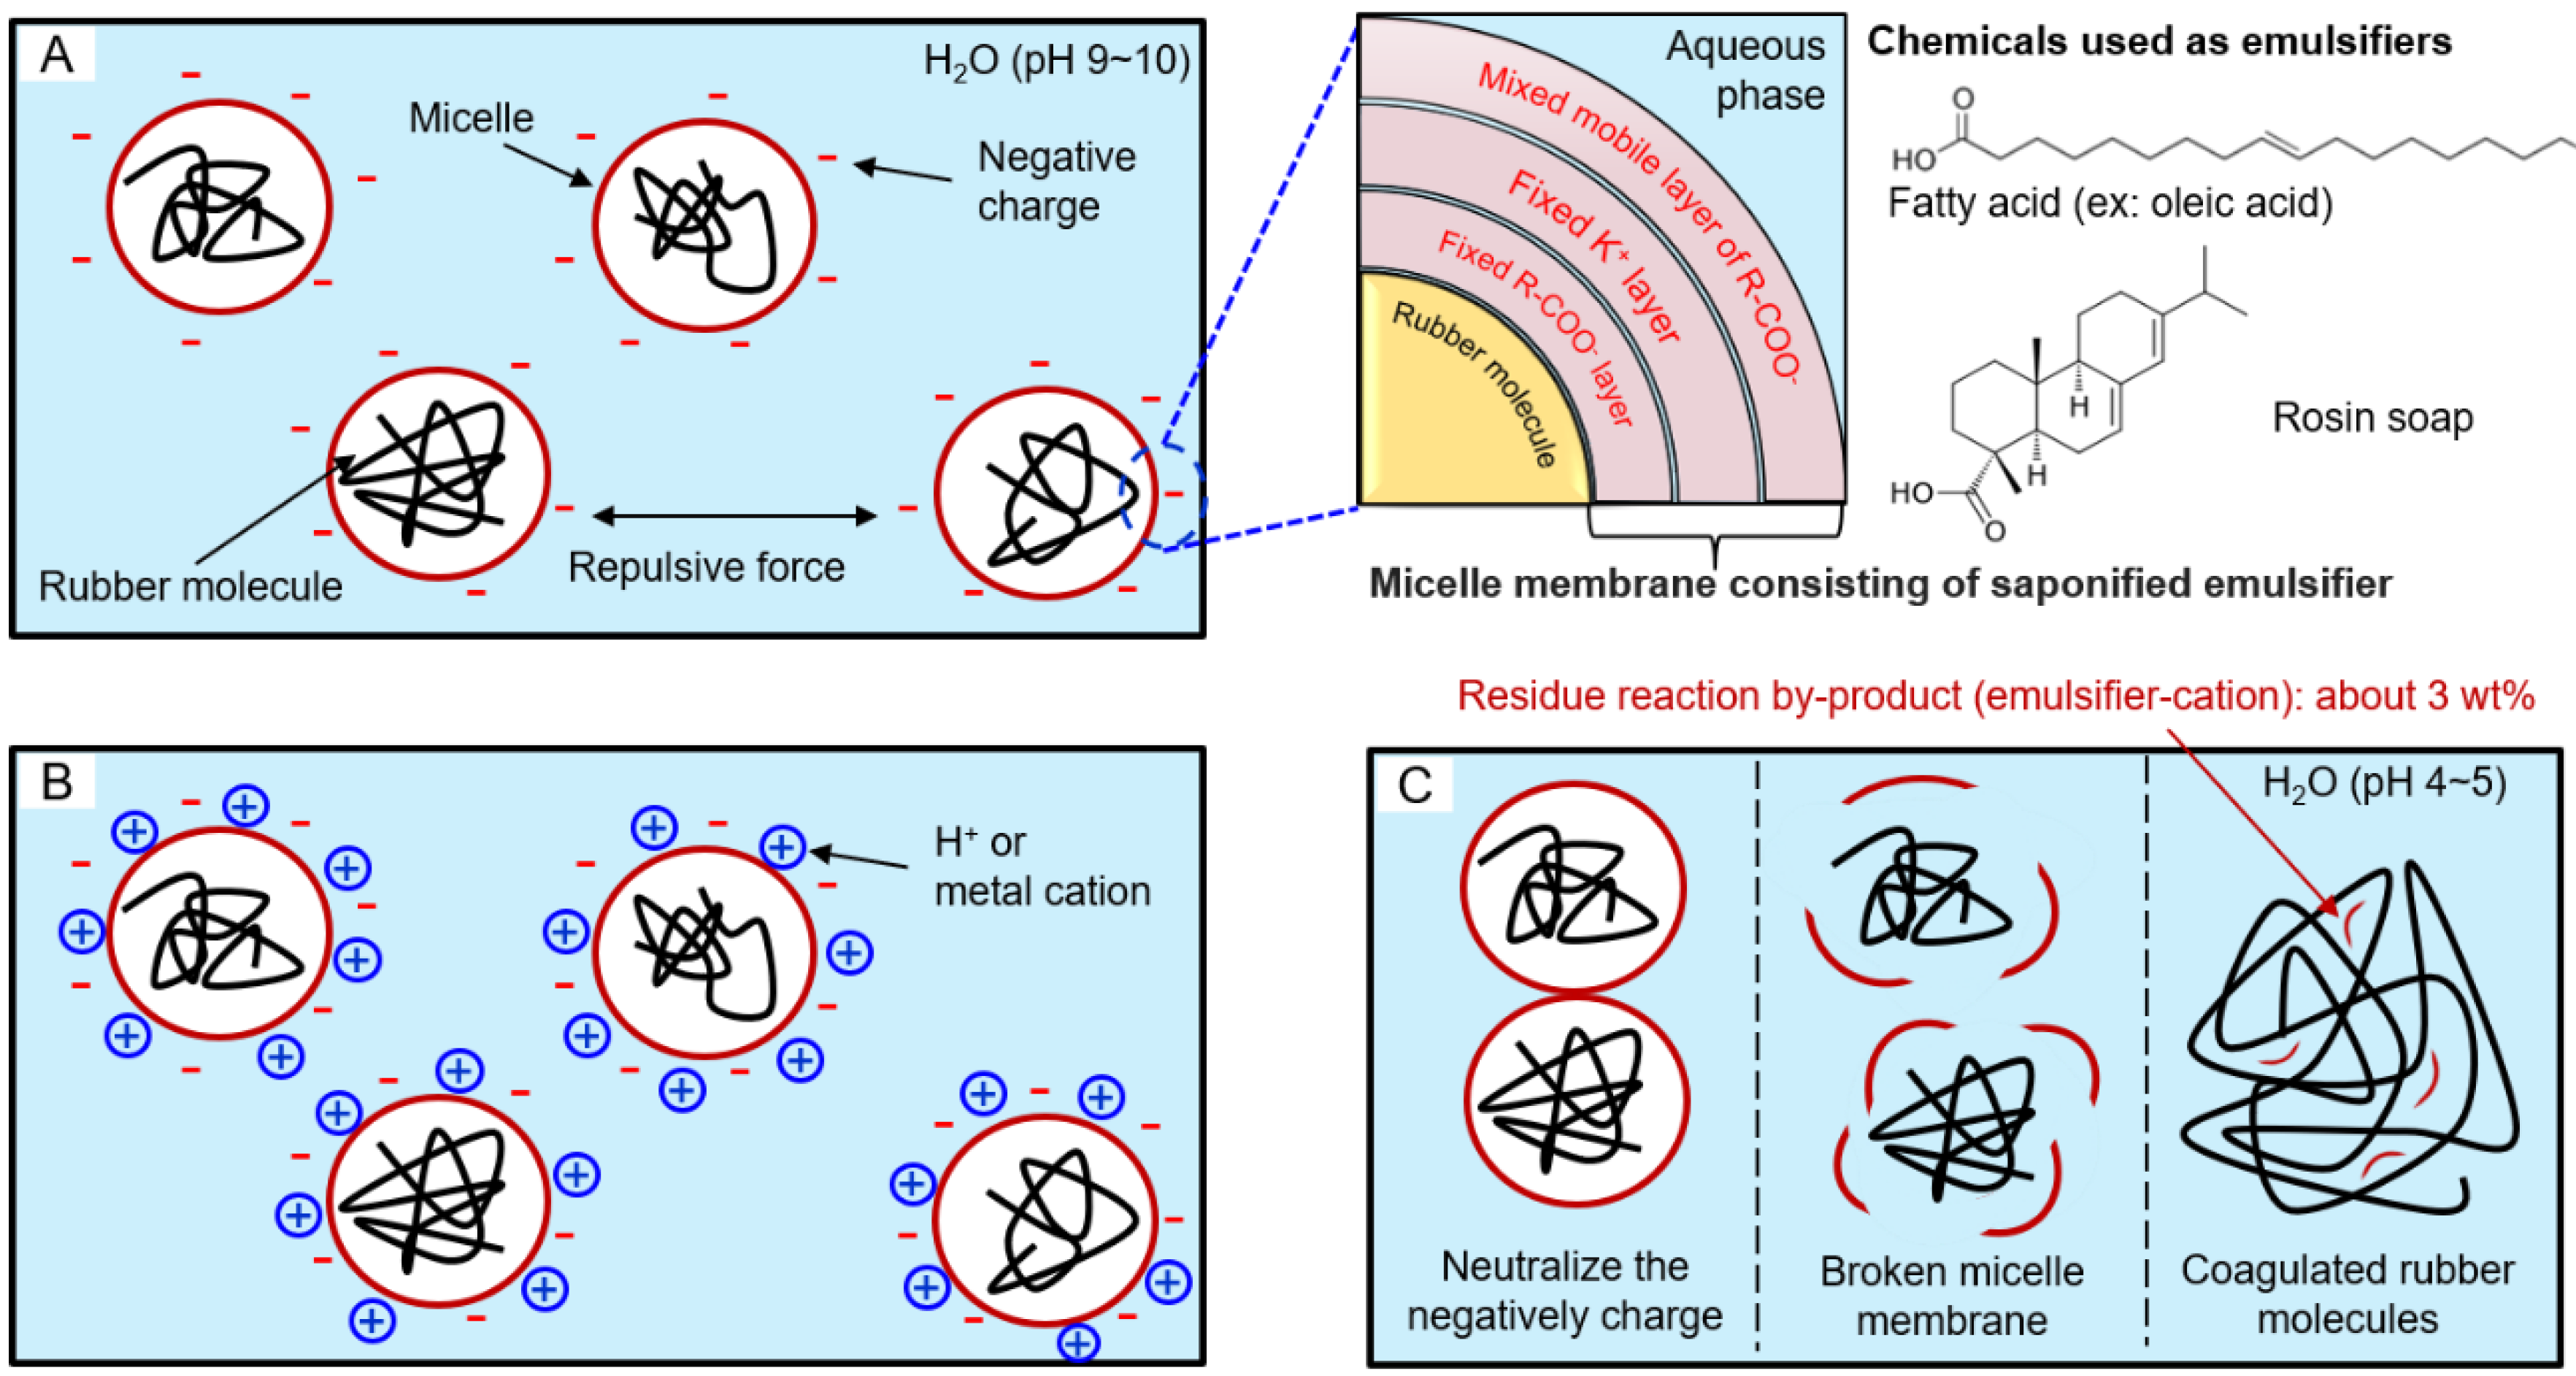
Figure 1.
Coagulation mechanism of synthetic rubber such as emulsion styrene-butadiene rubber (ESBR): (A) a state in which a micelle having a negative surface charge is dispersed in water, (B) a state after adding coagulant in latex, and (C) a state of micelle destruction due to collision between neutralized micelles.
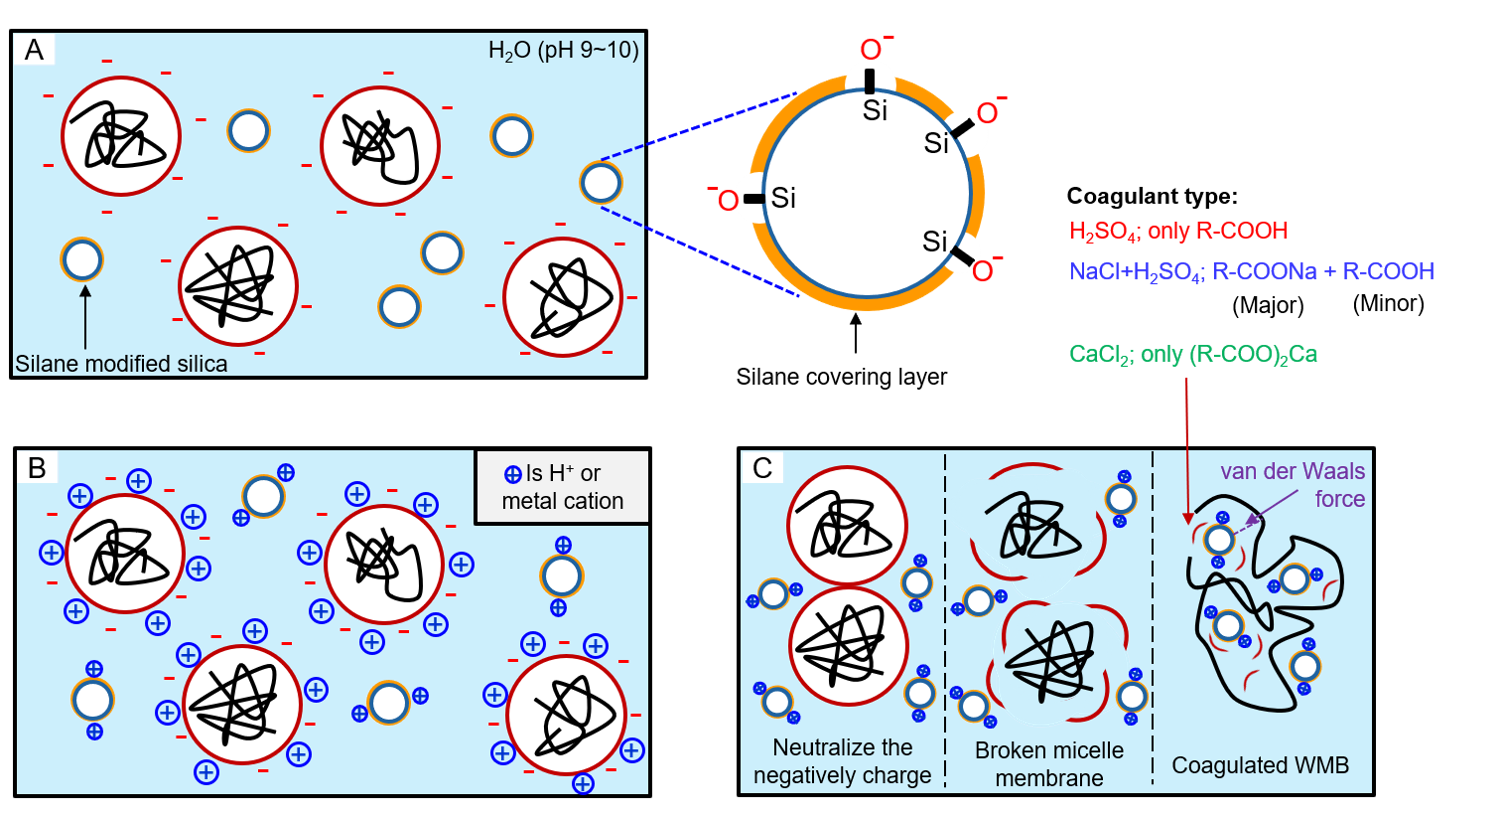
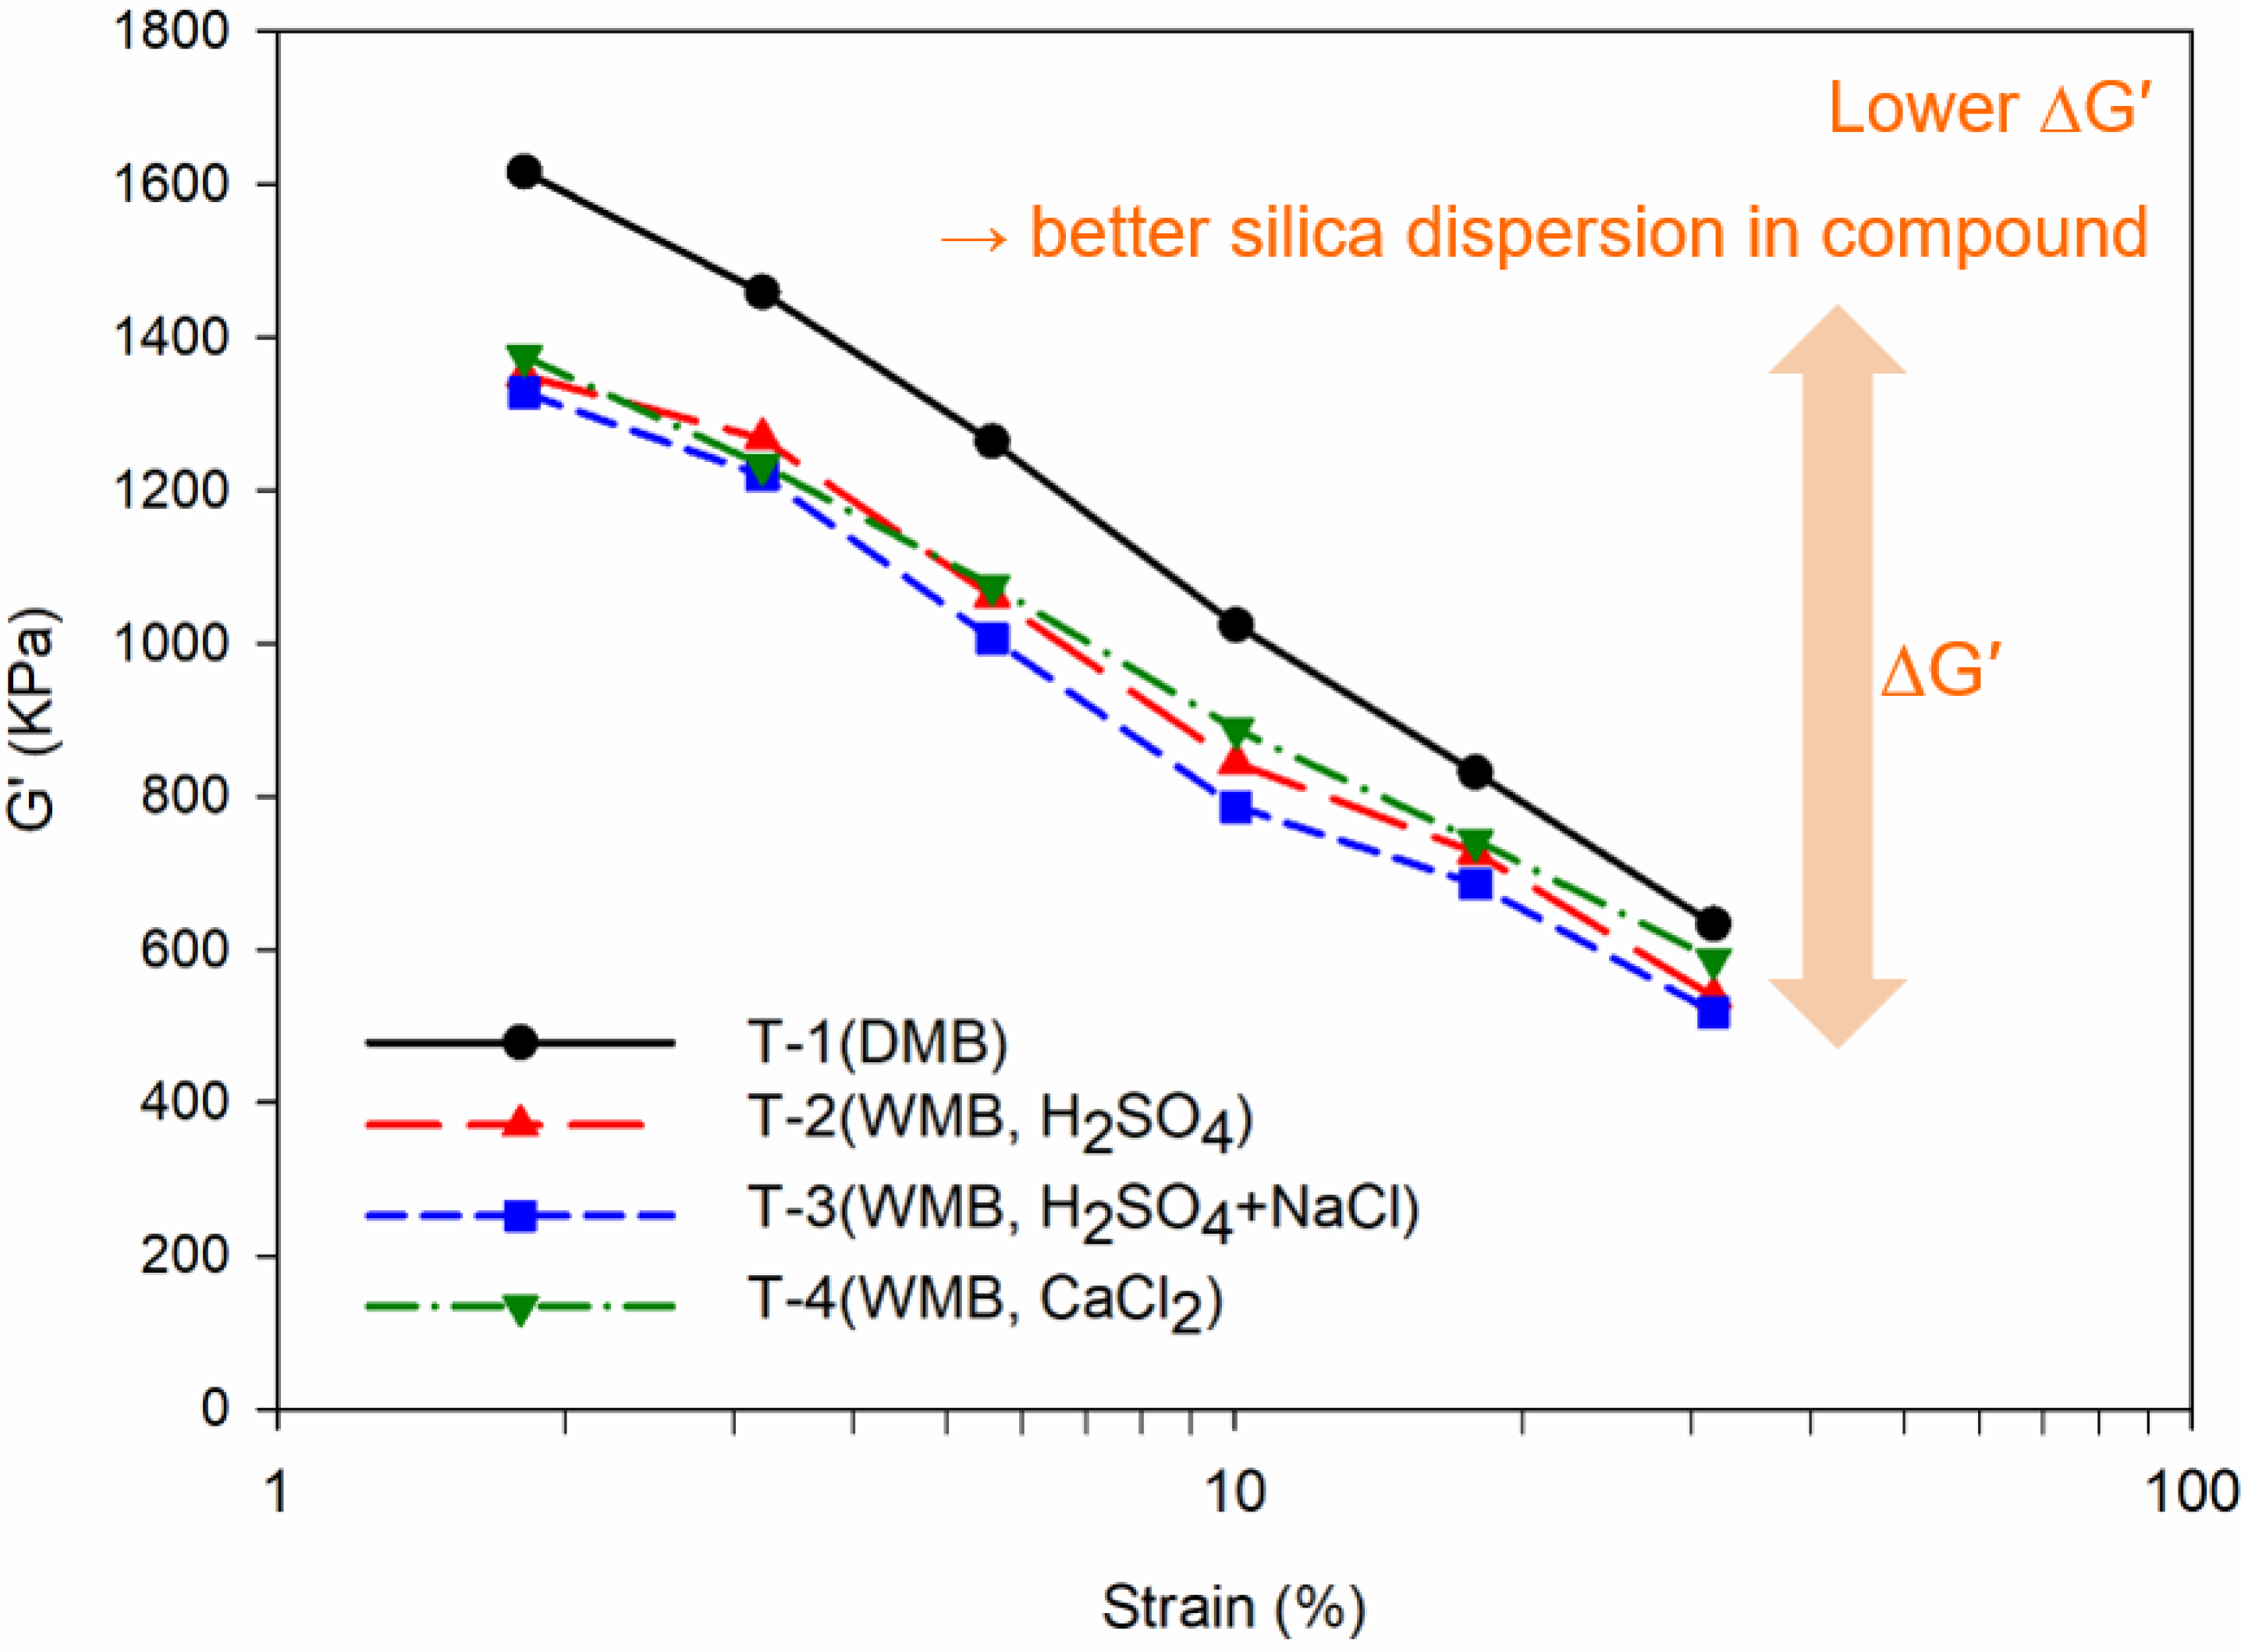
Figure 2.
Illustration of the reaction among surface-modified silica, surfactant, and coagulant during WMB manufacturing process: (A) a state in which micelles and modified silica having a negative charge surface are dispersed in water, (B) a state after coagulants were added, and (C) a state in which modified silica and ESBR were coagulated. Also, by-products between emulsifier and cation remained, for example, carboxy acid, sodium carboxylate, and calcium carboxylate, according to the coagulant type.
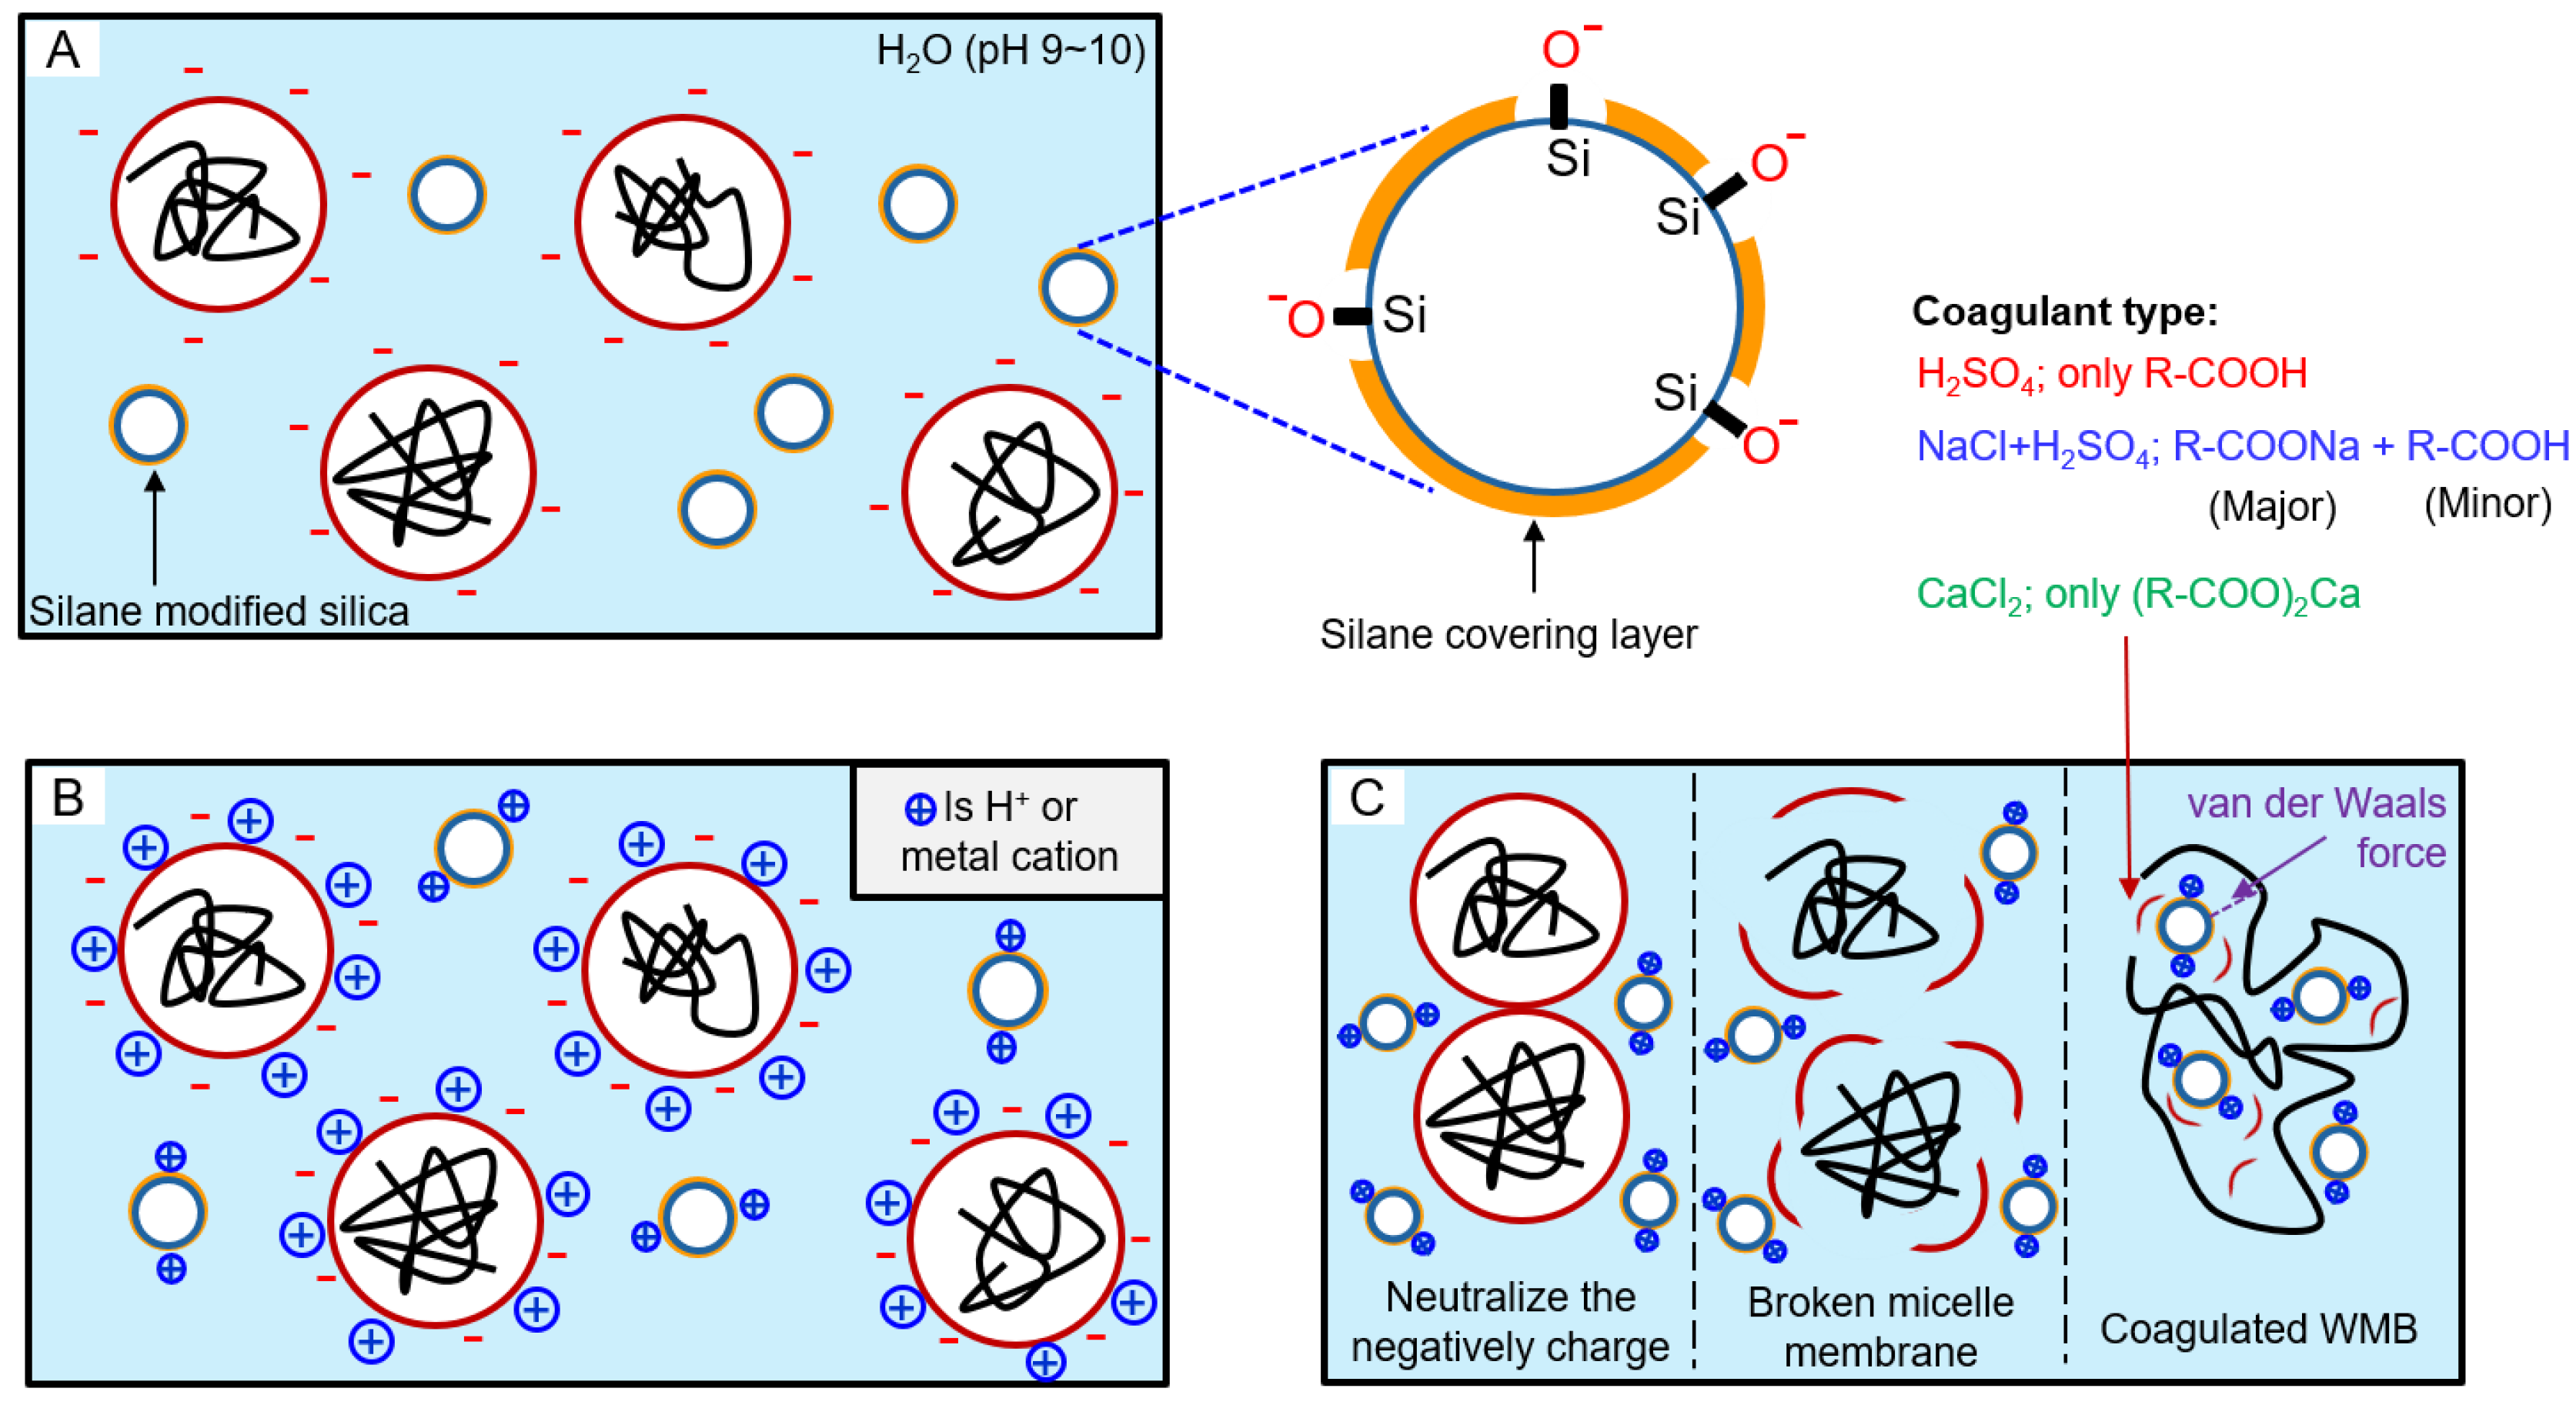
Figure 3.
Payne effect (ΔG′) of the T-1 to T-4 compounds, which mean degree of filler dispersion in a compound: the black line graph is the Payne effect result of the T-1 DMB compound, the red line is the Payne effect result of the T-2 WMB compound, the blue line is the Payne effect result of the T-3 WMB compound, and the green line is the Payne effect result of the T-4 WMB compound.
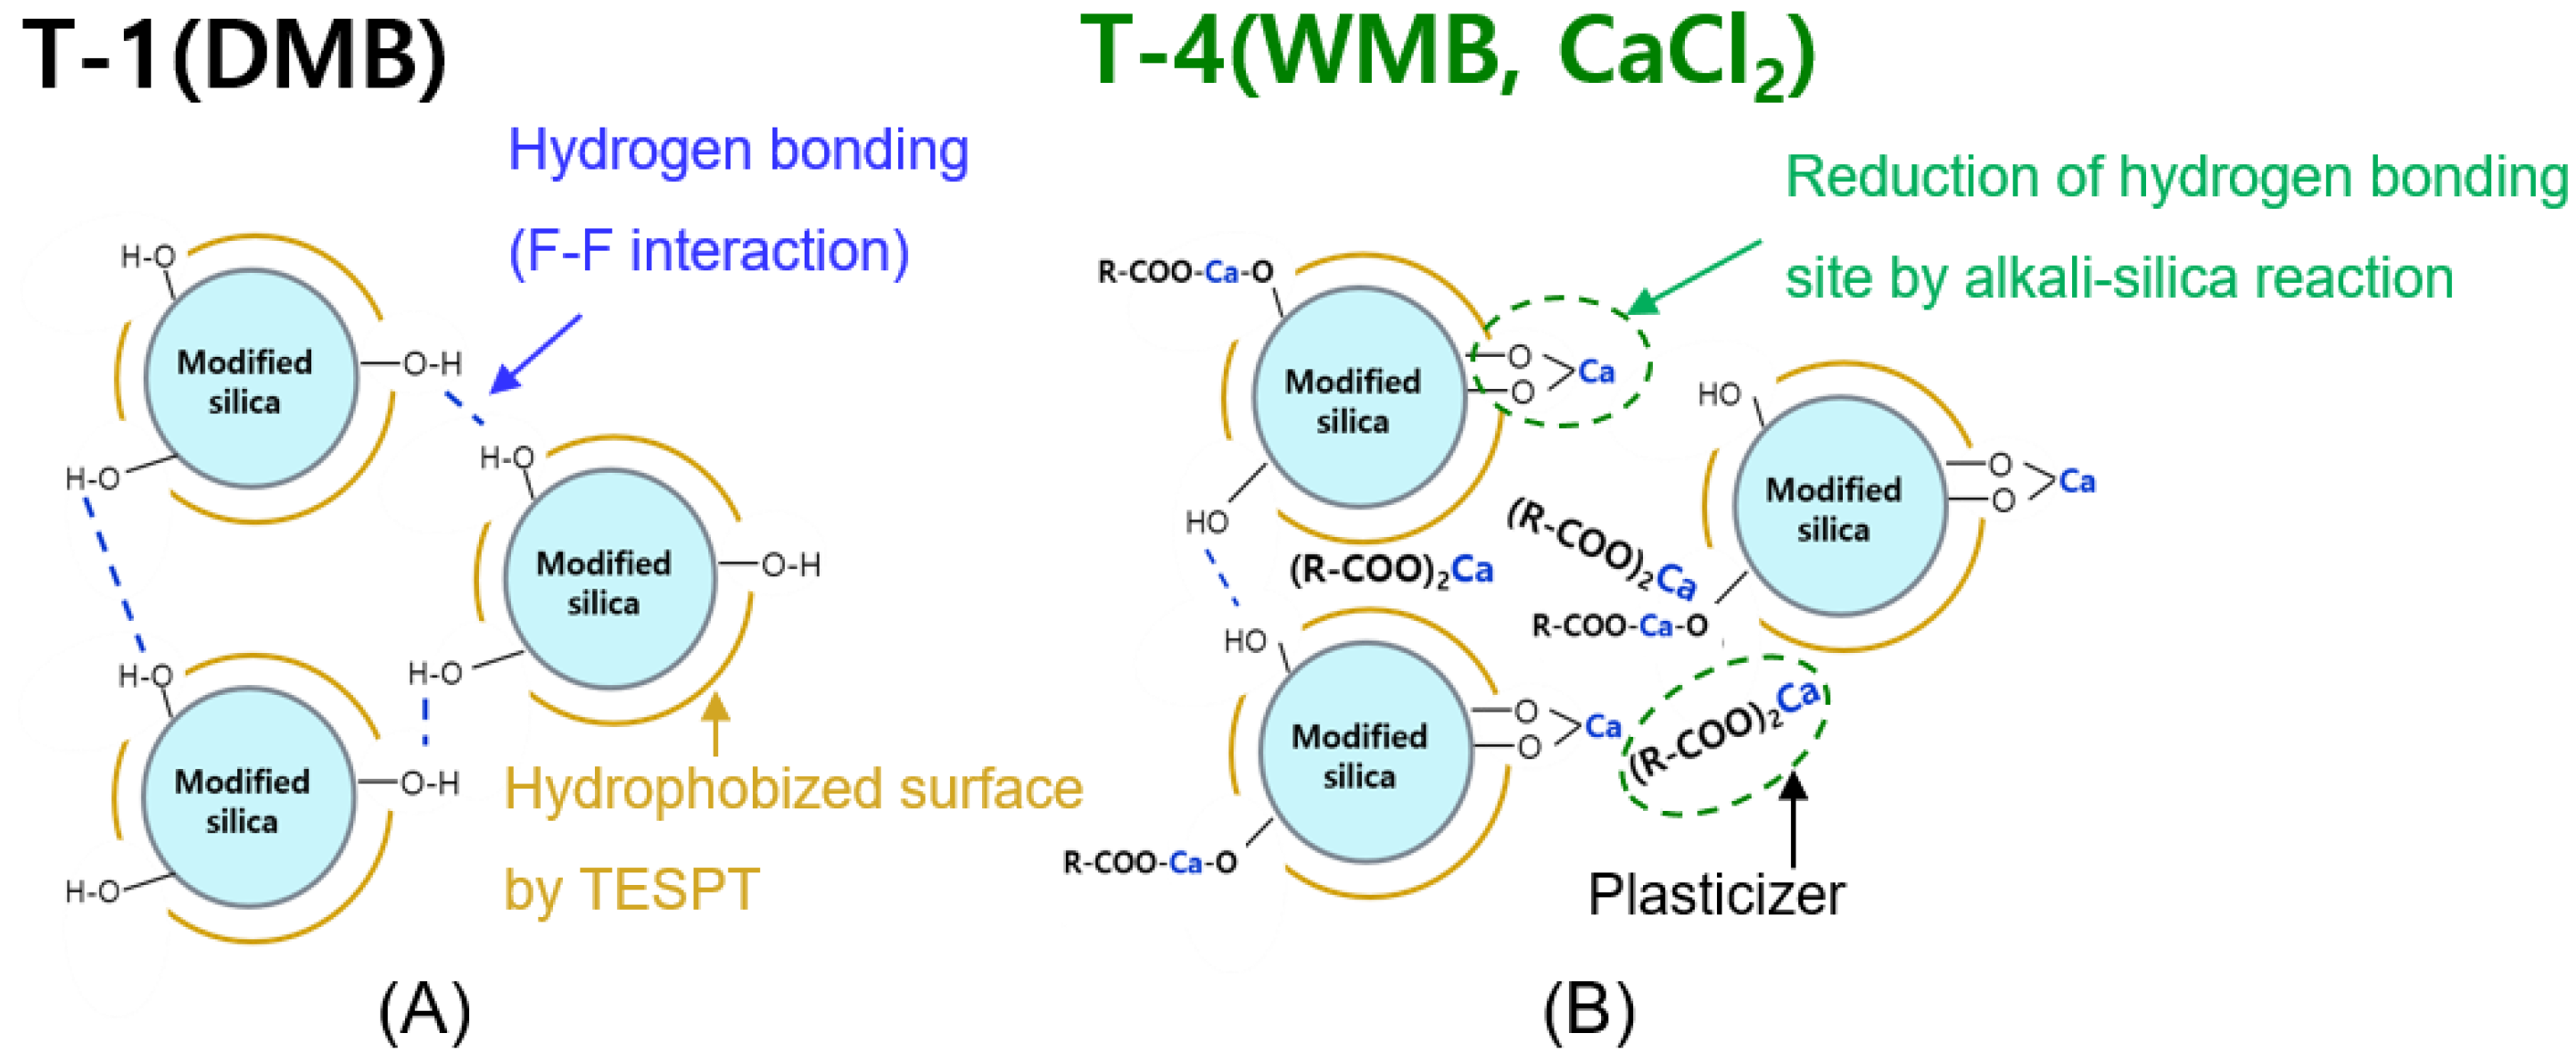
Figure 4.
Illustration of expected filler network structure in the silica filled compounds: (A) the T-1 (DMB) compound, which has a residue silanol group and interaction between silica by hydrogen bonding and (B) The T-4 WMB compound using CaCl2, which has fewer silanol groups than the DMB compound by alkali-silica reaction.
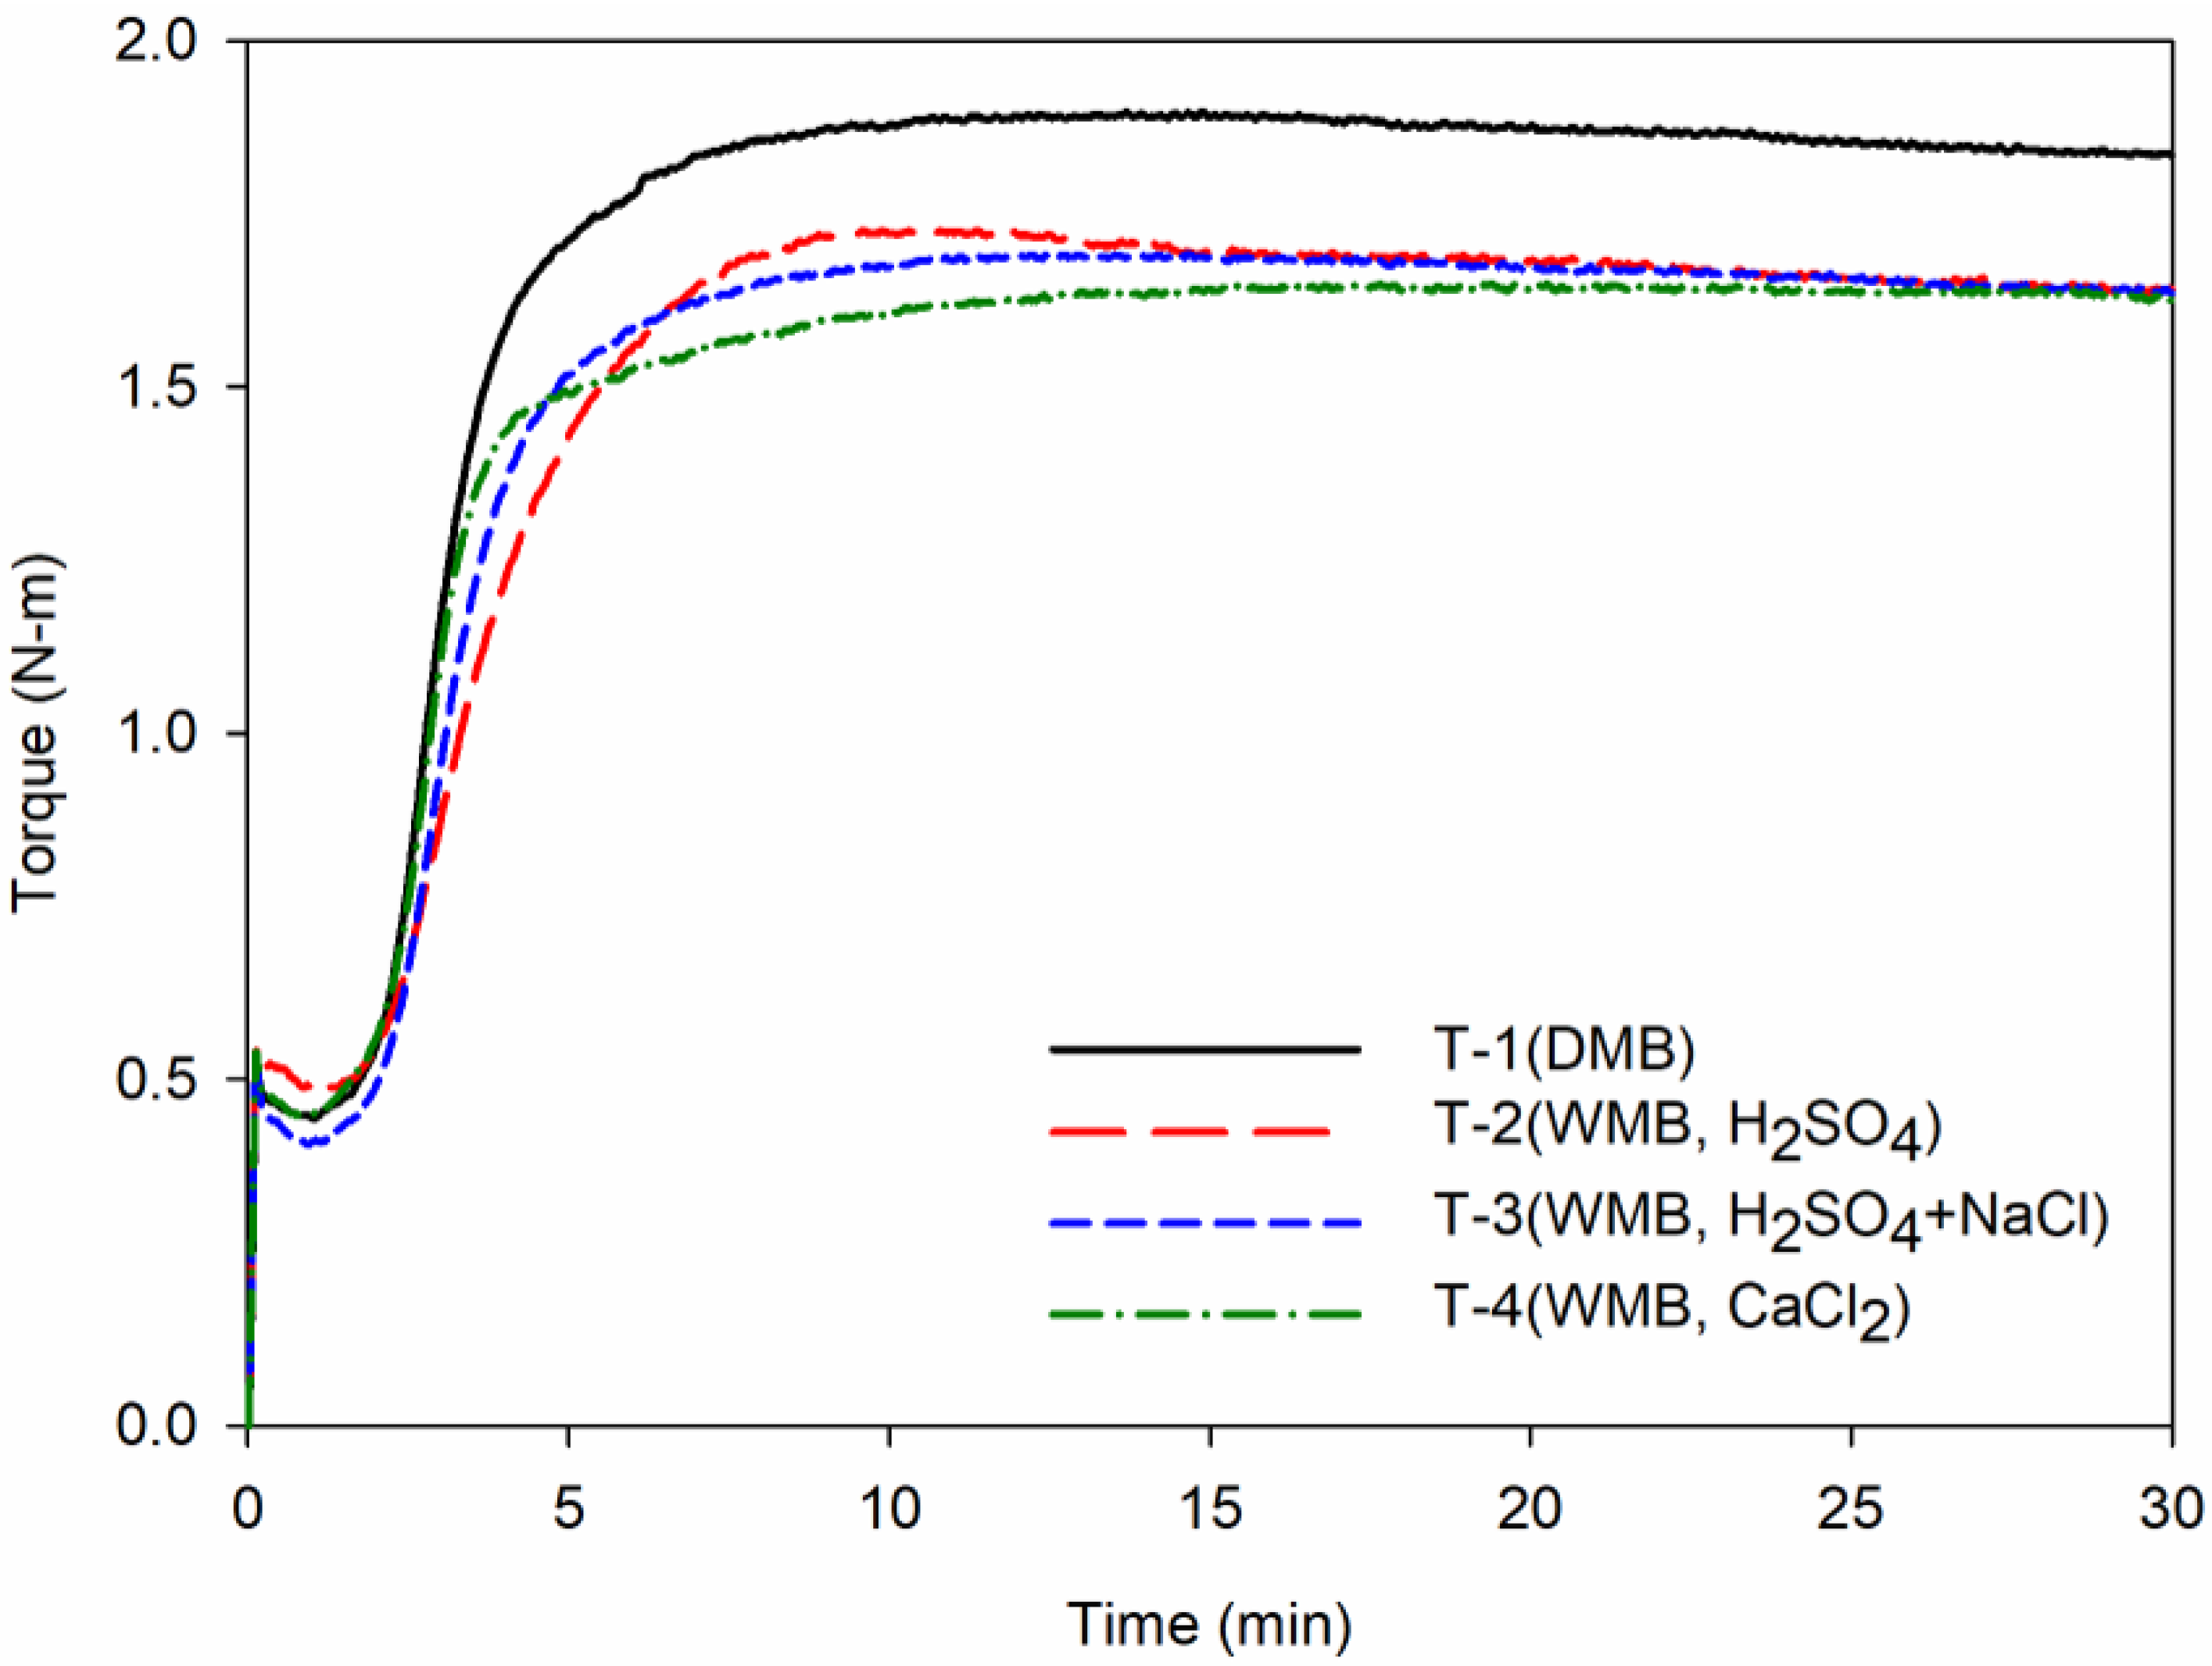
Figure 5.
Cure characteristics of the T-1 to T-4 compounds: Each graph shows cure characteristics behavior of compounds according to the cure time. The black line shows the cure behavior of the T-1 DMB compound, the red line shows the T-2 WMB compound, the blue line shows the T-3 WMB compound, and the green line shows the T-4 WMB compound.
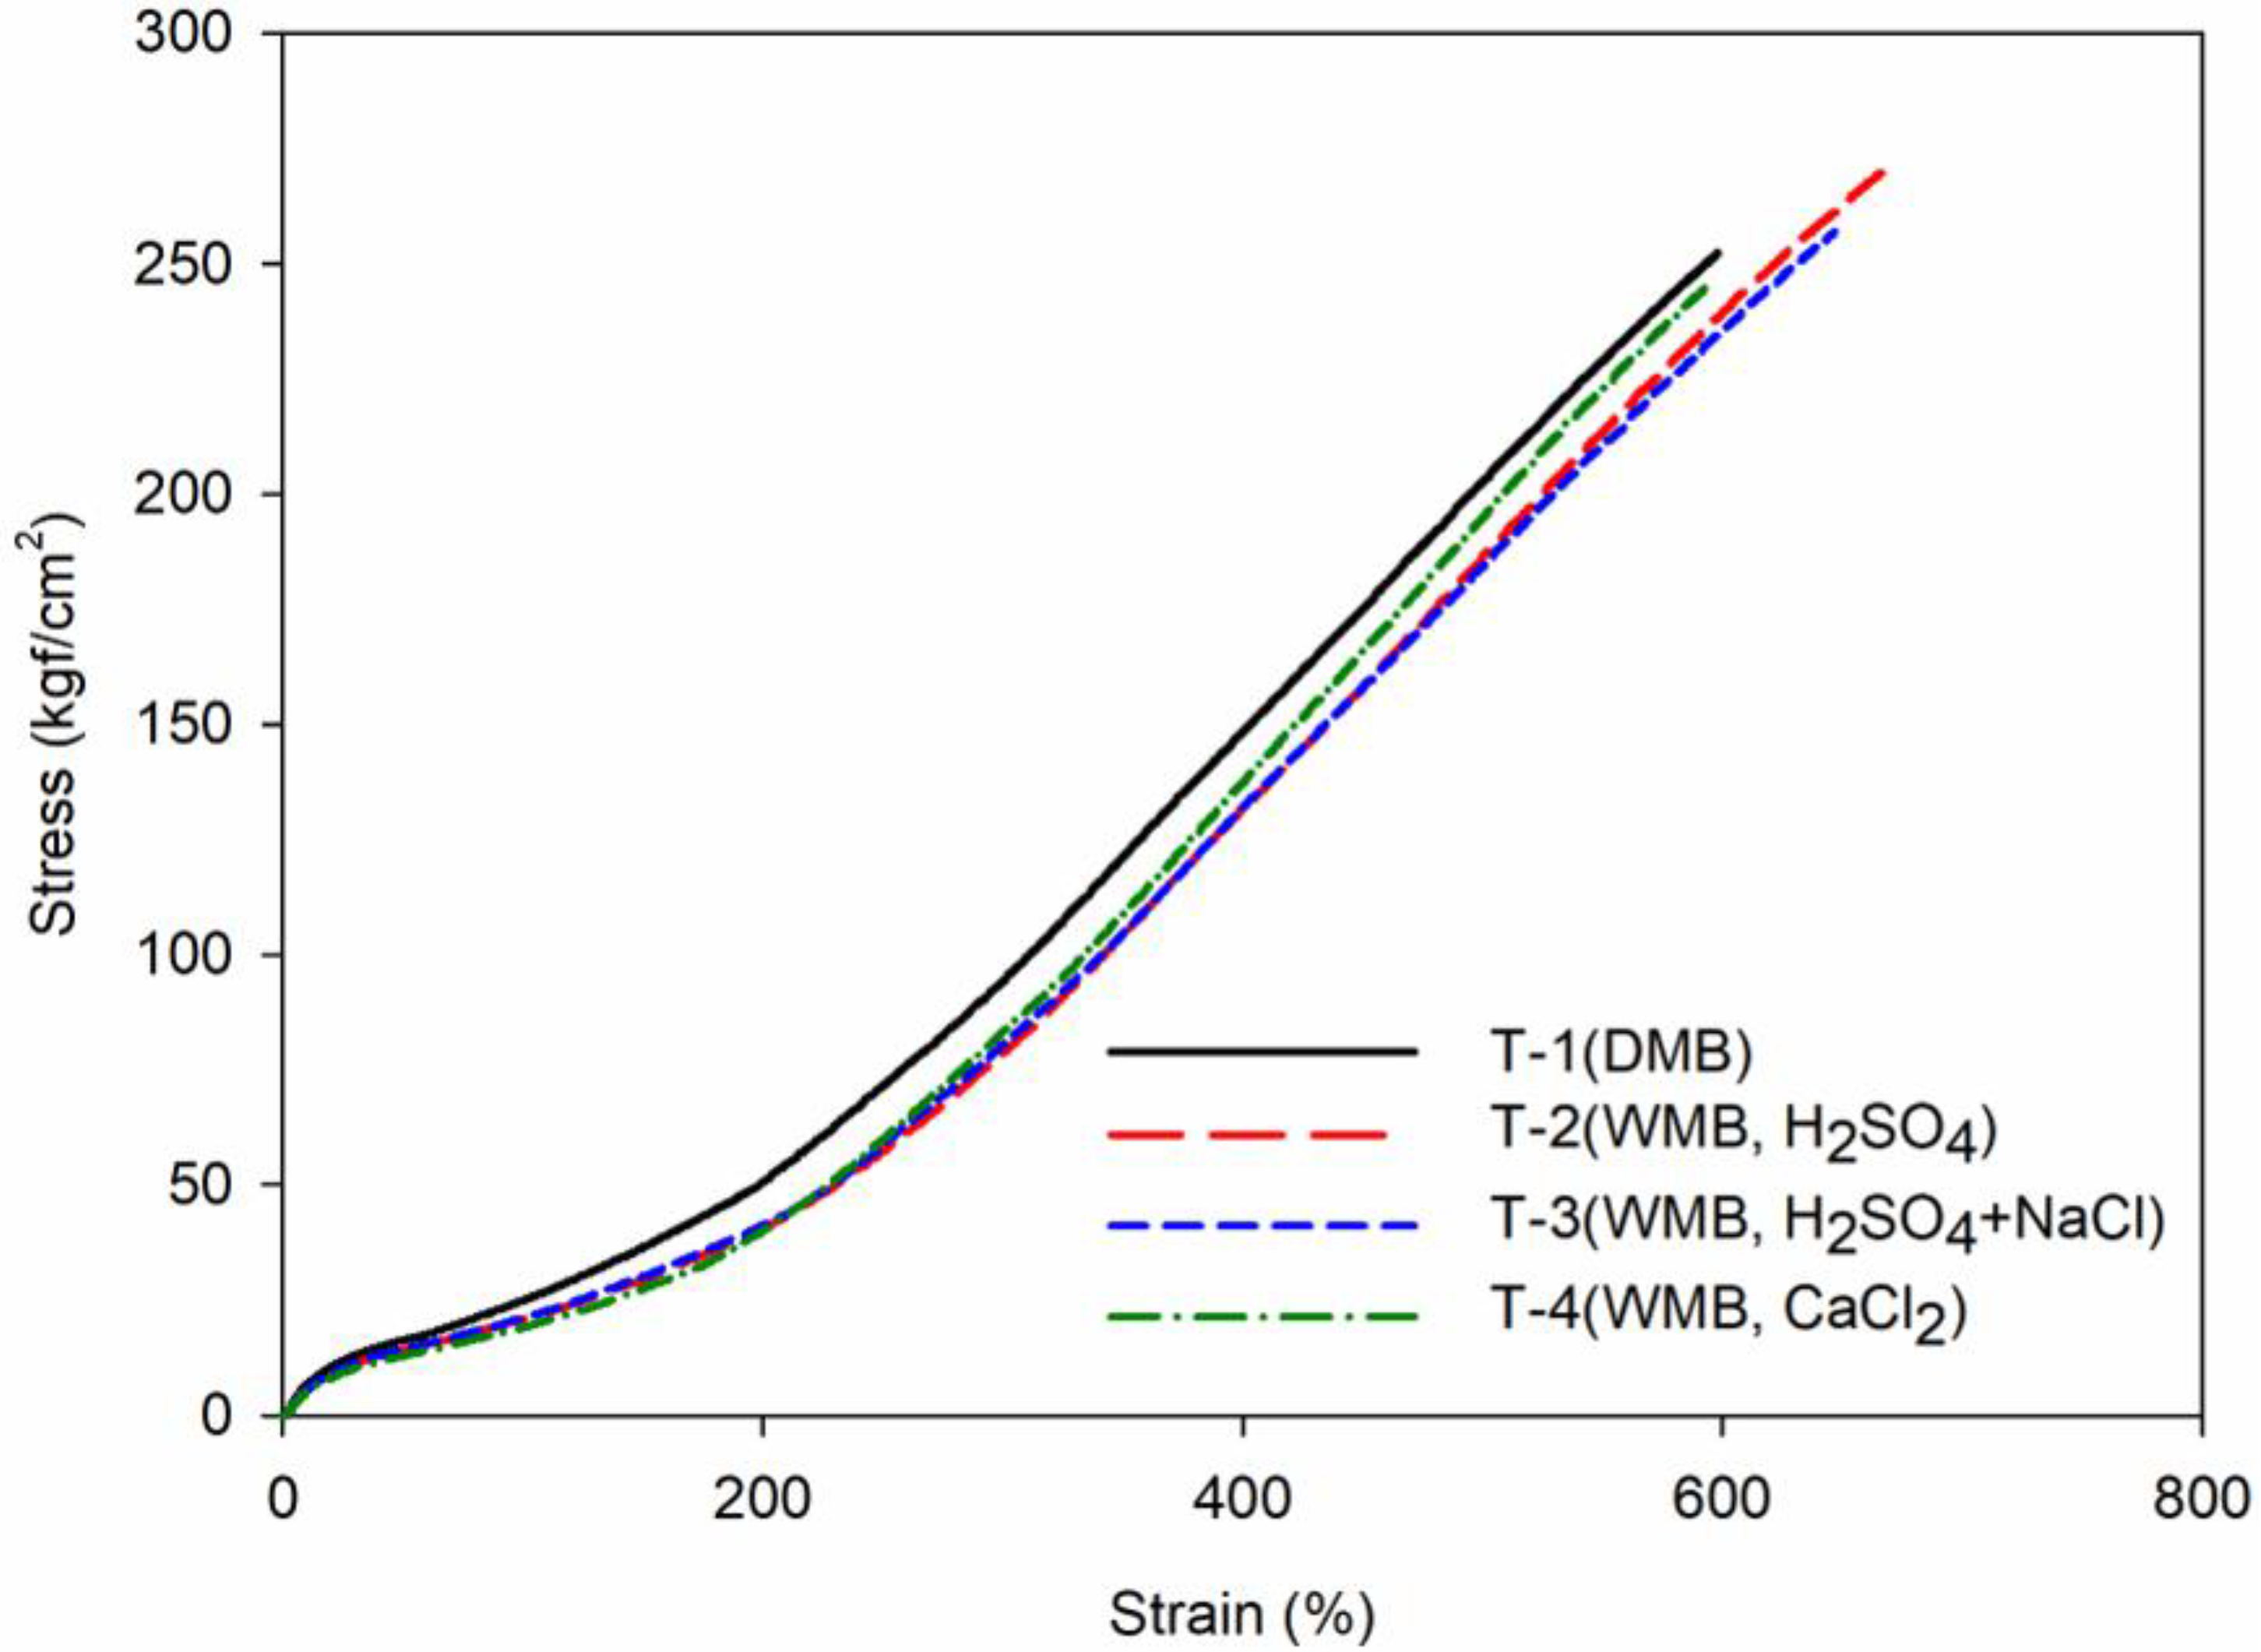
Figure 6.
Mechanical properties of the T-1 to T-4 compounds: the black line shows the mechanical property of the DMB T-1 compound, the red line shows the mechanical property of the WMB T-2 compound, the blue line shows the mechanical property of the WMB T-3 compound, and the green line shows the mechanical property of the WMB T-4 compound.
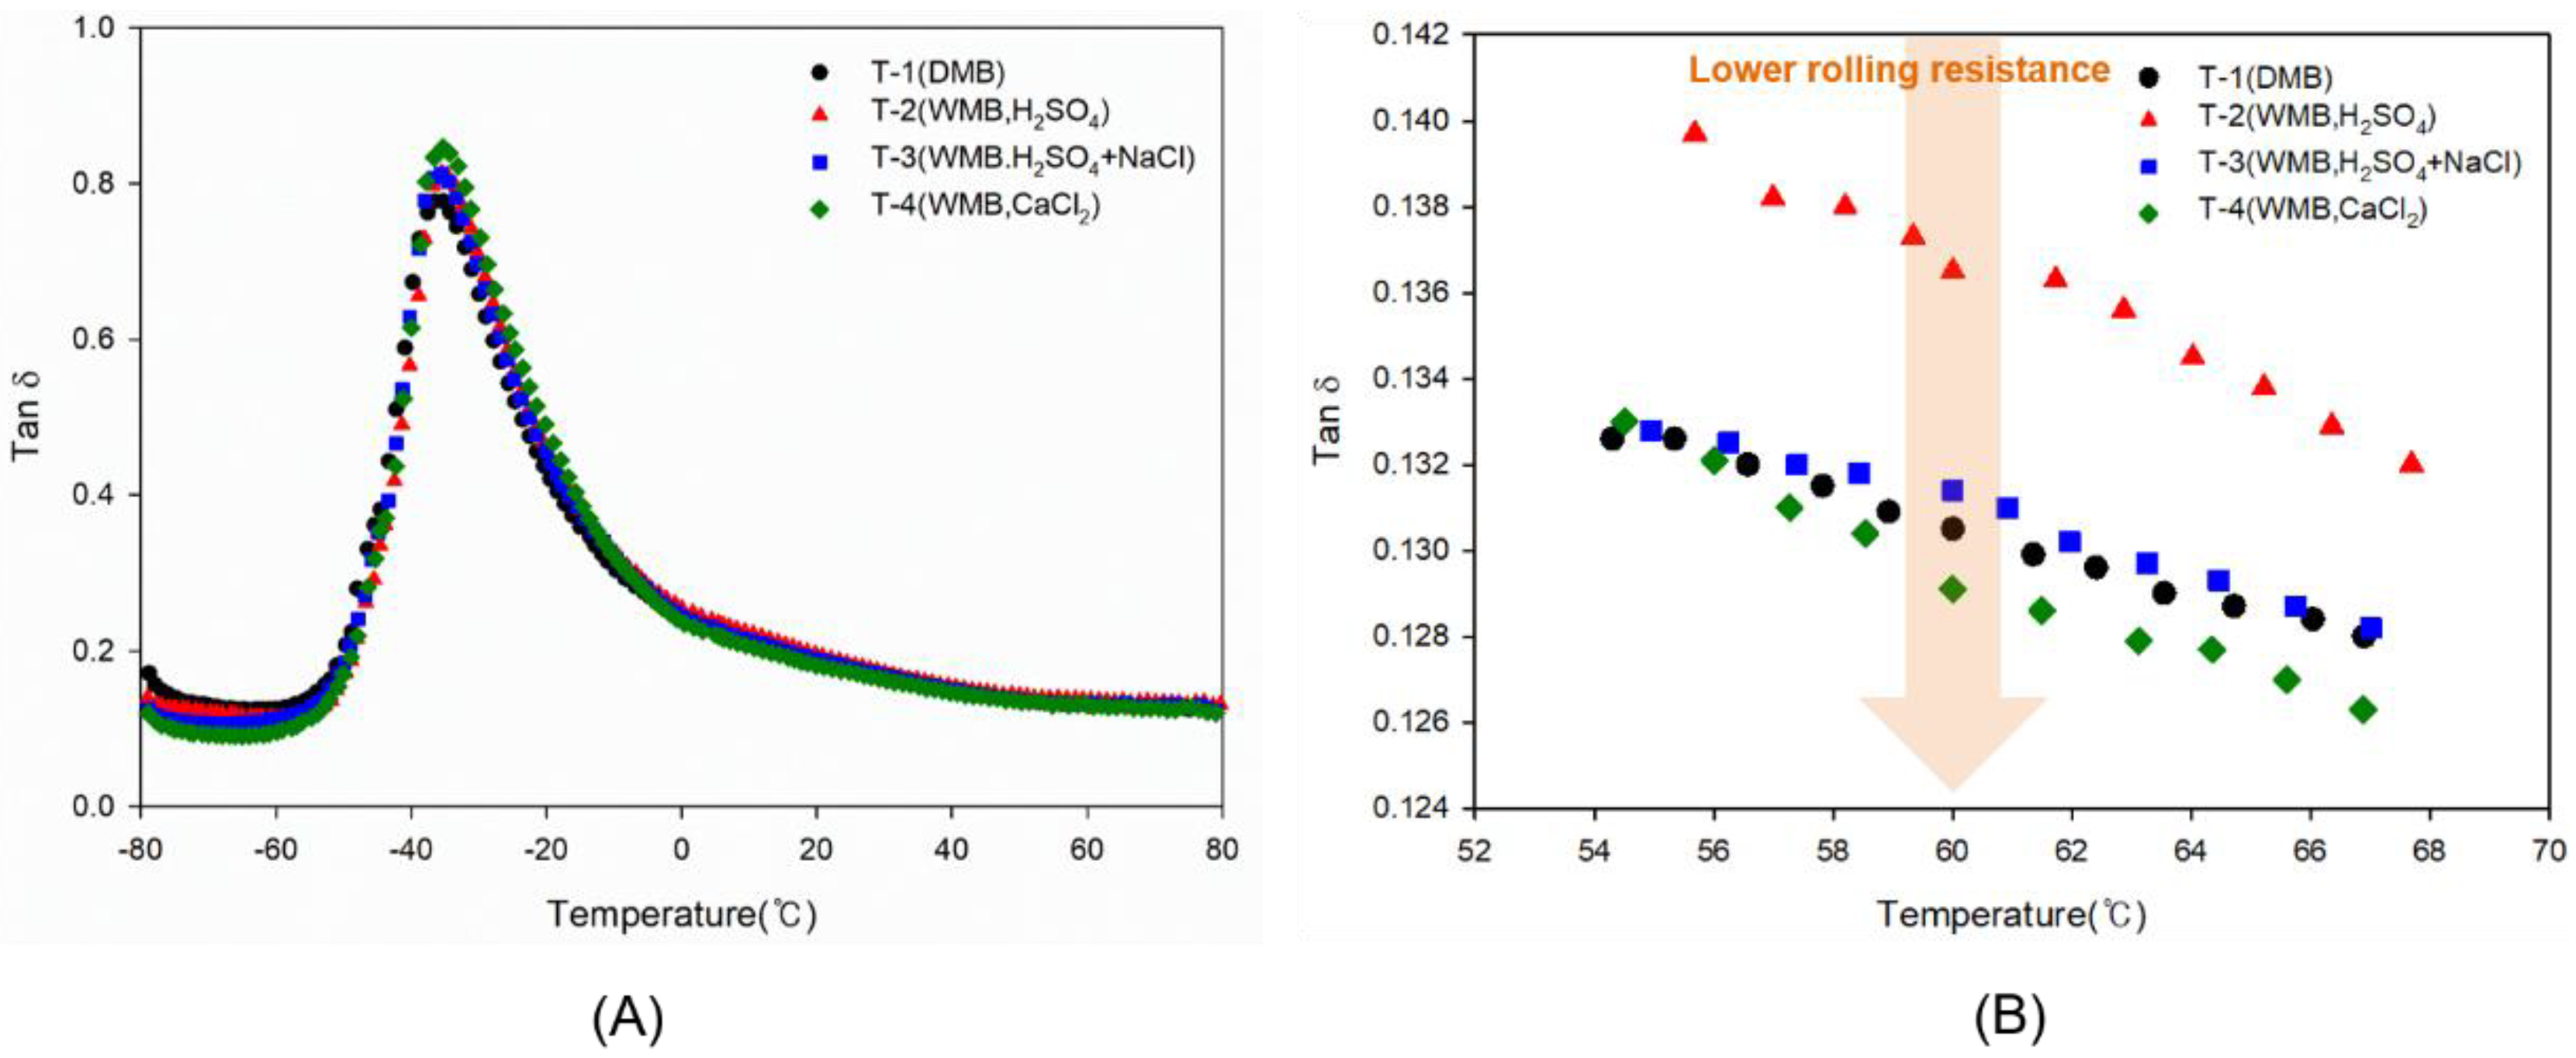
Figure 7.
Tan δ graphs of the T-1 to T-4 compounds as a function of temperature: (A) from −80 to 80 °C and (B) from 54 to 68 °C. These graphs show that rolling resistance and wet traction performance: the black color symbol shows the hysteresis behavior of the T-1 DMB compound, the red symbol shows the hysteresis behavior of the T-2 WMB compound, the blue symbol shows the hysteresis behavior of the T-3 WMB compound, and the green symbol shows the hysteresis behavior of the T-4 WMB compound.
Table 1.
BET surface area of TESPT modified silica according to TESPT content.
Table 1.
BET surface area of TESPT modified silica according to TESPT content.
| Commercial product name | Commercial source | TESPT (wt %) | BET surface area (m2/g) |
|---|
| NK136 | Miraesi Inc., Gwangju, Korea | 8 | 126 |
| NK137 | 10 | 120 |
| NK153 | 12 | 116 |
| NK138 | 15 | 120 |
Table 2.
Formulation of wet masterbatch (WMB) compounds and dry masterbatch (DMB) compound according to the coagulant type.
Table 2.
Formulation of wet masterbatch (WMB) compounds and dry masterbatch (DMB) compound according to the coagulant type.
| Components (phr) | DMB | WMB |
|---|
| T-1 | T-2 | T-3 | T-4 |
|---|
| SBR-1723 | 137.5 | - | - | - |
| WMB T-2 (H2SO4) | - | 219.4(a) | - | - |
| WMB T-3 (H2SO4 + NaCl) | - | - | 220.2(b) | - |
| WMB T-4 (CaCl2) | - | - | - | 223.0(c) |
| Pure silica | 80 | - | - | - |
| TESPT | 9.6 | - | - | - |
| ZnO | 3 | 3 | 3 | 3 |
| St/A | 2 | 2 | 2 | 2 |
| 6PPD | 1 | 1 | 1 | 1 |
| | FMB step |
| Sulfur | 1.5 | 1.5 | 1.5 | 1.5 |
| CBS | 1.5 | 1.5 | 1.5 | 1.5 |
| DPG | 1.5 | 1.5 | 1.5 | 1.5 |
Table 3.
Mixing procedures for the DMB compound and WMB compounds.
Table 3.
Mixing procedures for the DMB compound and WMB compounds.
| Mixing time (min:sec) | Action of SMB step |
|---|
| Compound type | DMB | WMB |
|---|
| 0:00 | Add rubber | Add WMB |
| 0:40 | Add 1/2 silica, 1/2 TESPT | - |
| 1:40 | Add 1/2 silica, 1/2 TESPT | - |
| 3:40 | Sweep |
| 5:40 | Add ZnO, St/A, 6PPD |
| 12:00 | Dump |
| | Action of FMB step |
| 0:00 | Add SMB |
| 0:20 | Add sulfur, cure accelerators |
| 2:00 | Dump |
Table 4.
Degree of hydrophobation of the modified silica according to the content of TESPT.
Table 4.
Degree of hydrophobation of the modified silica according to the content of TESPT.
| Silica types | Without silica | Pure silica | 8% TESPT | 10% TESPT | 12% TESPT | 15% TESPT |
|---|
| Acid-base titration solution amount (mL) | 2.22 | 0.95 | 1.25 | 1.68 | 1.85 | 1.91 |
| Hydrophobation (%) | - | 0 | 23.6 | 57.5 | 70.9 | 75.6 |
Table 5.
pH value of WMBs according to the coagulant type.
Table 5.
pH value of WMBs according to the coagulant type.
WMB code
(Coagulant) | WMB T-2
(H2SO4) | WMB T-3
(NaCl + H2SO4) | WMB T-4
(CaCl2) |
|---|
| pH | 5.5 | 6.4 | 7.7 |
Table 6.
Silica content in the ESBR WMB according to the type of coagulant.
Table 6.
Silica content in the ESBR WMB according to the type of coagulant.
| WMBs | WMB T-2 (H2SO4) | WMB T-3 (NaCl + H2SO4) | WMB T-4 (CaCl2) |
|---|
| Ash (wt %) | 35.1 | 35.7 | 36.4 |
| SBR (wt %) | 48.0 | 48.4 | 47.7 |
| Silica content (phr) | 73.1 | 73.8 | 76.3 |
| Silica loss (%) | 8.6 | 7.8 | 4.6 |
Table 7.
Payne effect (ΔG′) and Mooney viscosity (ML1+4@100 °C) of the T-1 to T-4 compounds.
Table 7.
Payne effect (ΔG′) and Mooney viscosity (ML1+4@100 °C) of the T-1 to T-4 compounds.
| Compounds | T-1 | T-2 | T-3 | T-4 |
|---|
| Coagulant type | - | H2SO4 | H2SO4 + NaCl | CaCl2 |
| ∆G′ (KPa) (G′ at 1.8% strain −G′ at 31.7% strain) | 983.1 | 812.0 | 810.0 | 788.1 |
| ML1+4@100 °C | 114 | 107 | 104 | 103 |
Table 8.
Bound rubber content of the T-1 to T-4 compounds.
Table 8.
Bound rubber content of the T-1 to T-4 compounds.
| Compounds | T-1 | T-2 | T-3 | T-4 |
|---|
| Bound rubber (%) | 31.3 | 29.5 | 28.5 | 36.6 |
Table 9.
Hydrophobation and calcium content according to the type of modified silica.
Table 9.
Hydrophobation and calcium content according to the type of modified silica.
| Silica type | Pure silica (un-modified) | 12 wt % TESPT modified silica | Ca-coated 12 wt % TESPT-silica |
|---|
| Hydrophobation (%) | 0 | 70.9 | 81.0 |
| Ca atom content by XRF (%) | 0.029 | 0.031 | 0.427 |
Table 10.
Cure characteristics and crosslink density of the T-1 to T-4 compounds.
Table 10.
Cure characteristics and crosslink density of the T-1 to T-4 compounds.
| Compounds | T-1 | T-2 | T-3 | T-4 |
|---|
| t10 | min:sec | 3:32 | 2:17 | 2:10 | 2:02 |
| t90 | min:sec | 5:35 | 6:27 | 5:38 | 6:02 |
| Cure rate | N-m·min−1 | 0.656 | 0.325 | 0.512 | 0.690 |
| Tmin | N-m | 0.444 | 0.483 | 0.406 | 0.449 |
| Tmax | N-m | 1.898 | 1.726 | 1.694 | 1.649 |
| Tmax − Tmin | N-m | 1.454 | 1.243 | 1.288 | 1.200 |
| Crosslink density | 10−4 mol·g−1 | 1.2178 | 1.1128 | 1.1504 | 1.1446 |
Table 11.
Mechanical properties and DIN abrasion of the T-1 to T-4 compounds.
Table 11.
Mechanical properties and DIN abrasion of the T-1 to T-4 compounds.
| Compounds | Unit | T-1 | T-2 | T-3 | T-4 |
|---|
| M100% | kgf·cm−2 | 24.8 | 20.8 | 21.0 | 18.9 |
| M300% | kgf·cm−2 | 94.1 | 78.5 | 80.3 | 83.4 |
| M300%/M100% | - | 3.79 | 3.77 | 3.82 | 4.41 |
| Elongation at break | % | 600 | 670 | 650 | 590 |
| Tensile strength | kgf·cm−2 | 252 | 270 | 257 | 244 |
| DIN abrasion | mg | 115.1 | 120.5 | 118.2 | 114.0 |
Table 12.
Viscoelastic properties of the T-1 to T-4 compounds.
Table 12.
Viscoelastic properties of the T-1 to T-4 compounds.
| Compounds | T-1 | T-2 | T-3 | T-4 |
|---|
| Coagulant type | - | H2SO4 | H2SO4 + NaCl | CaCl2 |
| Tg (°C) | −35.3 | −35.3 | −35.6 | −35.6 |
| tan δ at Tg | 0.7772 | 0.8134 | 0.8122 | 0.8461 |
| tan δ at 0 °C | 0.2452 | 0.2536 | 0.2430 | 0.2369 |
| Wet traction index (%) | 100 | 103 | 99 | 97 |
| tan δ at 60 °C | 0.1305 | 0.1365 | 0.1314 | 0.1291 |
| Rolling resistance index (%) | 100.0 | 95.6 | 99.3 | 101.8 |

 ,
, 


