Article

The Microstructure of Yellow River Ice in the Freezing Period

1
School of Water Conservancy Engineering, Zhengzhou University, Zhengzhou 450001, China
2
Yellow River Institute of Hydraulic Research, Zhengzhou 450003, China
*
Author to whom correspondence should be addressed.
Crystals 2019, 9(9), 484; https://doi.org/10.3390/cryst9090484
Submission received: 8 August 2019 / Revised: 13 September 2019 / Accepted: 15 September 2019 / Published: 18 September 2019
(This article belongs to the Section Crystalline Materials)

Abstract

:
Accurately determining true ice microstructure and material parameters is a basis for ice disaster theoretical research on the Yellow River. In this work, natural Yellow River ice was collected, and ice crystals parallel and perpendicular to the ice surface were photographed using an orthogonal polarizing mirror. Morphologies of ice microstructure were extracted, and equivalent ice grain sizes were calculated. The results show that Yellow River ice mainly consists of granular ice and columnar ice and vary greatly in different time and space ranges. The ice crystal shape is irregular, and the ice crystal size is larger span, and mainly between 1 mm and 10 mm. Ice crystal initial defects come from bubbles, sediment particles, impurities, and microcracks; among them, bubbles are the most common and have a relatively large impact. In addition, a calculation model of the Yellow River ice microstructure was constructed according to the ice crystal test results. Based on the experimental data and numerical model, the obtained Yellow River ice parameters provide help for analyzing ice disaster mechanisms along the Yellow River.

1. Introduction

Generally, the ice microstructure reflects the ice growth process and determines the basic physical and mechanical properties of river ice. Therefore, studying ice microstructure characteristics contributes to promoting the understanding and recognition of river ice. The microstructure of natural river ice is directly related to its thermomechanical force. In addition, the evolution of ice microstructure is closely related to impurities, grain growth and recrystallization. The relationship between the density of granular ice and the size of ice crystals was quantitatively measured with a uniaxial compression test and slicing method by Cole [1,2]. It is an important milestone in ice microstructure observation. The X-ray photography of polycrystalline ice was studied during ice deformation and the grain boundary interactions of polycrystalline ice was discussed by Liu et al. [3] and Baker et al. [4]. The micropurity of polar ice was observed and studied with an electrical method by Baker and Cullen et al. [5,6]. The experiments of isotropic polycrystalline ice were carried out by Currier et al. [7], and the results show that the bubble diameter is approximately 0.06 mm when the grain diameter is between 1 mm and 2 mm and approximately 0.12 mm when the grain diameter is between 2 mm and 7 mm [7]. In recent years, research results on ice microstructures, such as polar ice [8,9], plateau ice [10], glacier ice [11], sea ice [12], reservoir ice [13,14], and atmospheric ice [15], have been emerging and have obtained improved experimental results. Compared with the above ice types, the research of river ice is still in the early stage on structural performances and physical properties due to the particularity of river ice materials, the complexity of influence factors and formation process, and the difficulty in obtaining valid data.
For Yellow River ice, the ice structure parameters of the Yellow River were analyzed by Deng et al. [16]. The ice crystal density and sediment in the Bayannaoer section of the Yellow River were investigated by Zhang et al. [17]. However, influenced by a complex external environment, different structural forms such as granular ice and columnar ice appear, Yellow River ice is different in crystal shape, crystal size, crystal axis orientation, bubble shape, bubble size and bubble content. A large number of basic data in different space-time conditions are needed for analysis. At present, little research has been conducted on the ice crystals of the Yellow River, and many problems still need to be studied further, including how to effectively observe the ice microstructure and how to understand and describe the distribution and evolution of ice structure for the Yellow River.
In this paper, ice samples obtained in the Inner Mongolia reach of the Yellow River during the freezing period were chosen as test specimens. The ice sample handling process is introduced and analyzed in Section 2, which includes ice sample collection, slice formation of ice crystal, and ice crystal observation. The experimental results for ice crystals are further analyzed in Section 3. Furthermore, ice crystals change in different locations, and an attempt to construct a numerical model of ice microstructure are discussed in Section 4. Finally, some conclusions are drawn in Section 5.

2. Materials and Methods

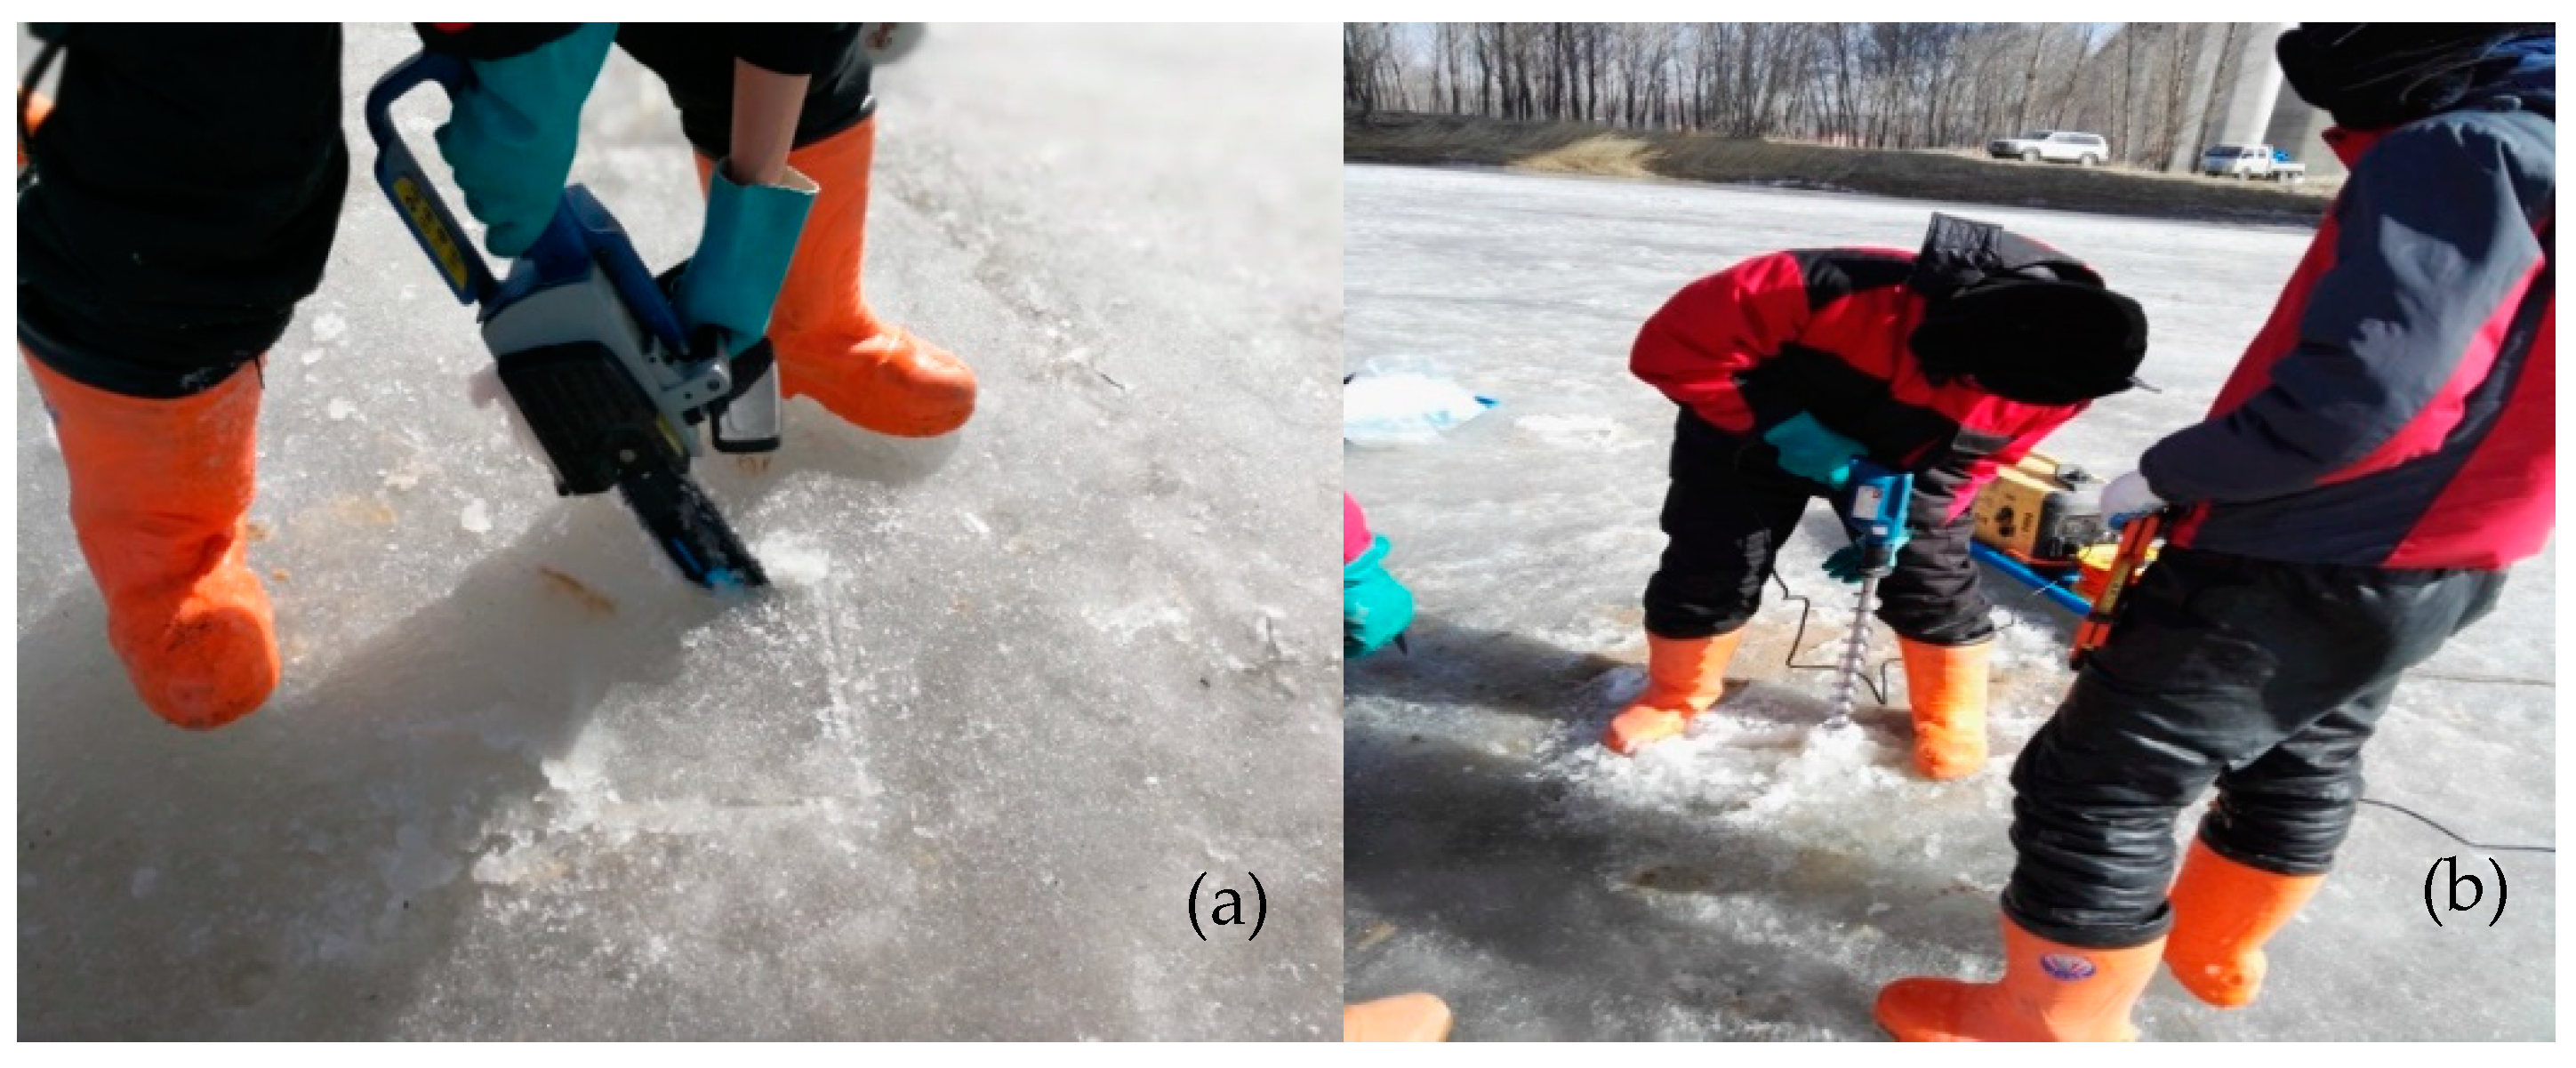
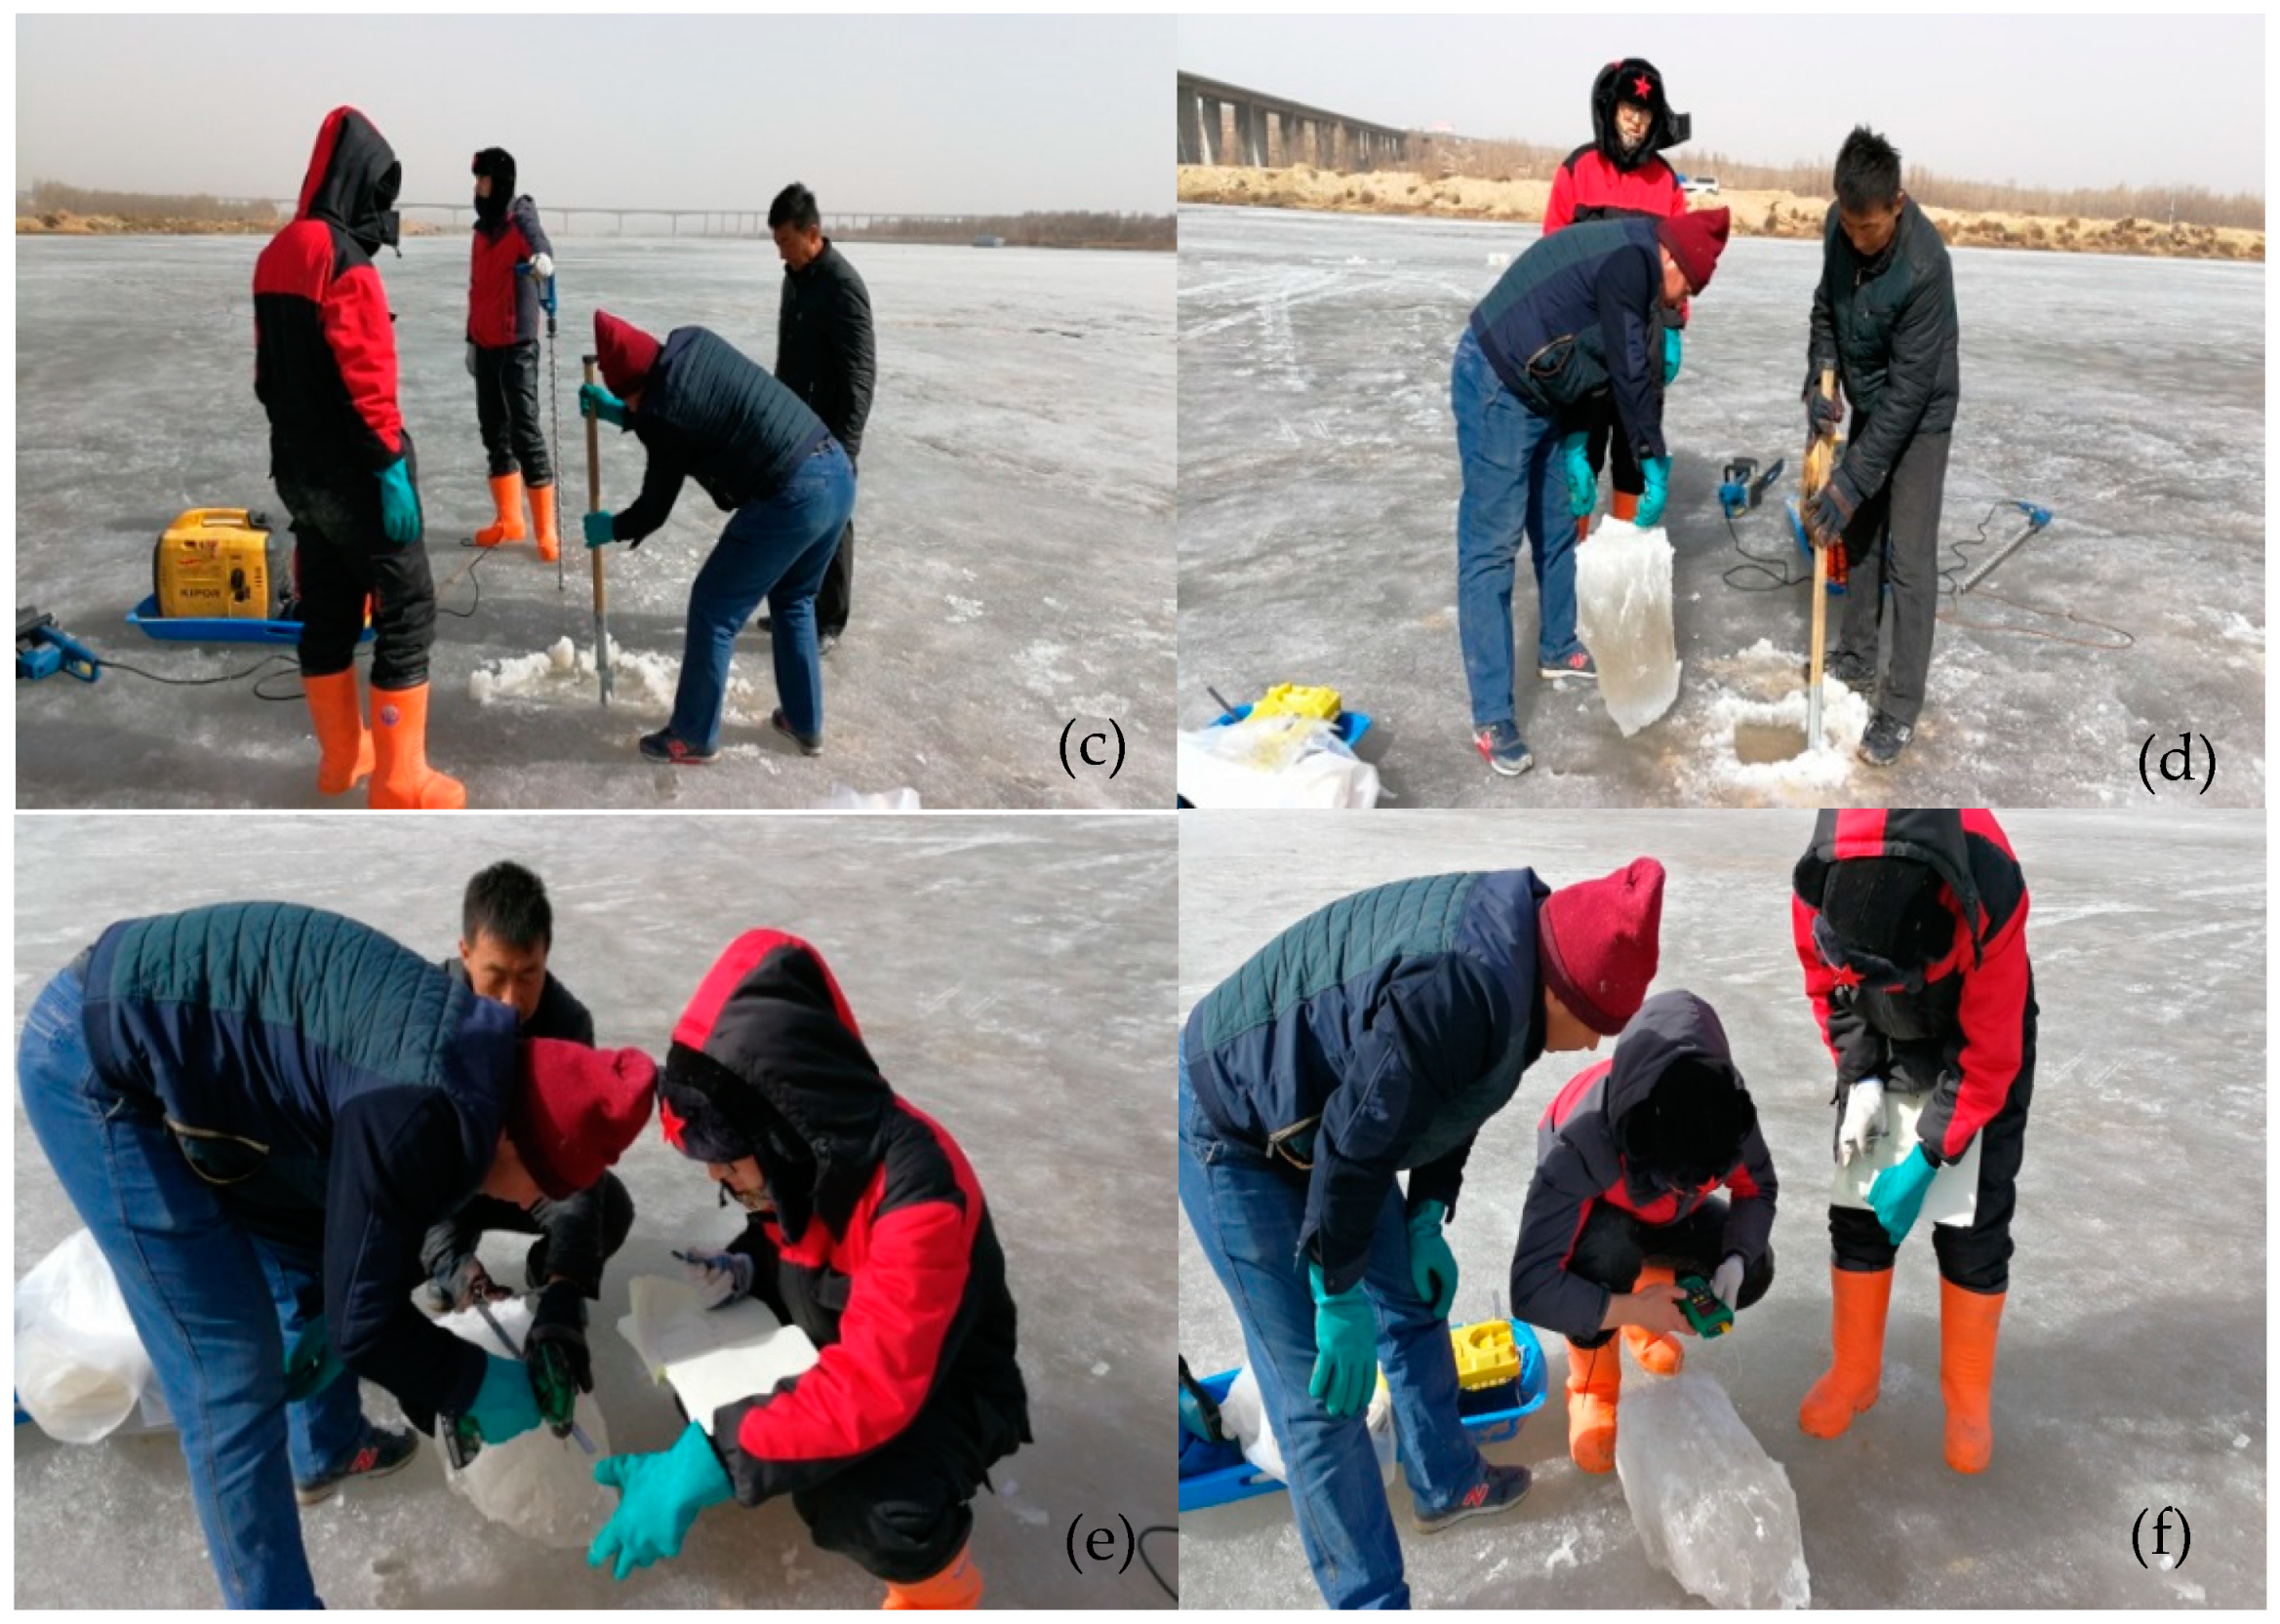
2.1. Yellow River Ice Materials Preparation

The acquisition of natural ice from the Yellow River is mainly concentrated along the Inner Mongolia reach during the ice freezing season. A stable and reliable ice microstructure forms in winter and is variable, which provides the possibility of analyzing the characteristics of the ice microstructure of the Yellow River. The whole process of ice sample collection is shown in Figure 1. First, the appropriate ice extraction position was selected, the grid was drawn at the ice extraction position, and this position was marked with GPS. Second, the ice surface was cut along the grid lines through the ice bottom with a chain saw. Third, the ice sample was drilled at the grid top with a gasoline engine ice core drill to separate the ice sample. If the ice sample had still not separated, an artificial plate saw could be used to cut the grid line edge. In the next step, the center point of the ice sample was acquired by a hand ice drill, and the ice sample was extracted vertically and steadily; the ice sample was placed horizontally, the thickness of the ice sample was measured by steel plate ruler, and the temperature of the ice sample was measured every 5 cm along the water depth direction of the ice sample. Finally, the ice sample was encapsulated and stored with thermal insulation film and transported to the laboratory.

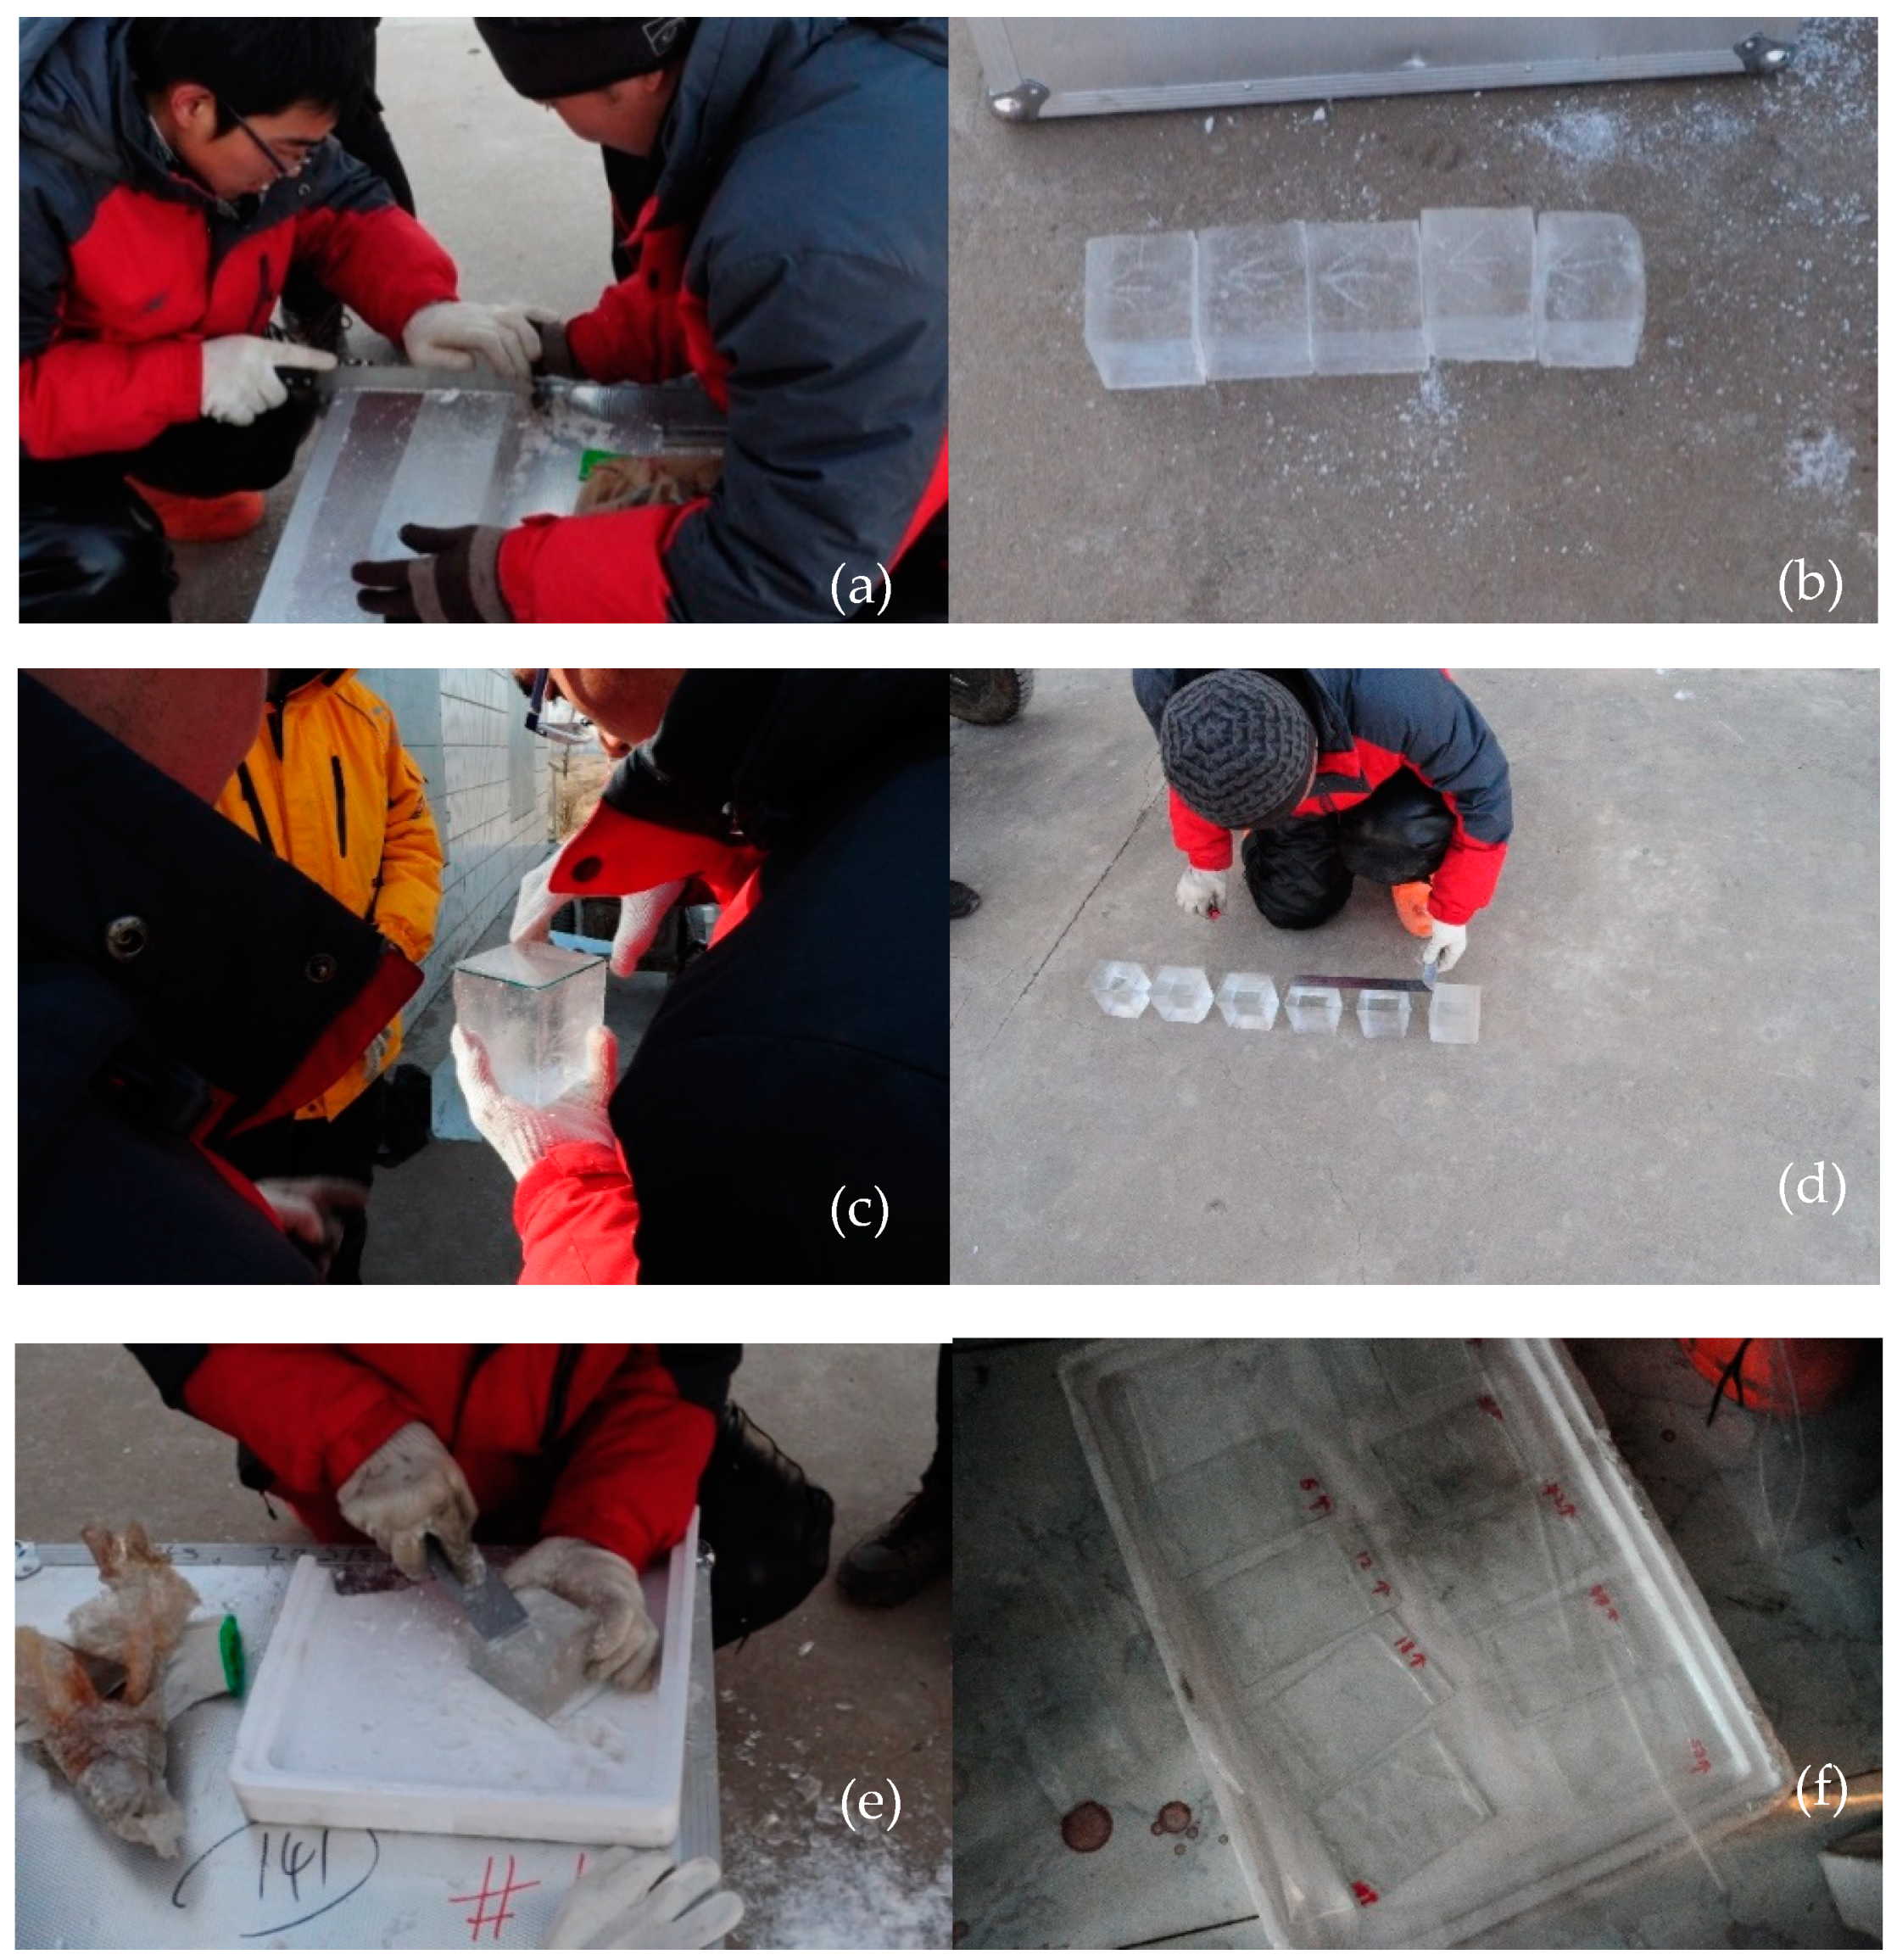
2.2. Preparation of Ice Crystal Slices

To effectively observe the ice microstructure of the Yellow River, the ice samples need to be cut into approximately 1 mm-thick ice sheets. The thinner the ice crystal is, the brighter the color under the orthogonal polarizing mirror (Leitz, Wetzlar, Hessen, Germany), which conveniently differentiates the crystal boundaries and clarifies the shape of a single bubble in the ice. In a low-temperature environment, the ice sample was stratified according to the directions perpendicular and parallel to the ice surface, and the perpendicular and parallel ice samples were extracted from the ice sample with a hand saw. Then, one side of the ice sample was corrected and flattened using a planer to allow full contact with a glass sheet. The glass sheets were heated slightly, and the ice samples adhered to the glasses. Then, the ice samples were cut into 1 mm-thick ice slices using a planer. The ice crystal type and size were observed under a polarizing mirror, and the bubble distribution and size were observed under normal light at the Ferris Observatory (Leitz, Wetzlar, Hessen, Germany). Figure 2 shows the preparation process for ice slices.

2.3. Observation Method for Ice Crystals

Ice crystals must be observed in dark environments. The prepared ice slices were placed on a Feldstein platform according to the number order, and the ice crystals of the parallel ice surface and the perpendicular ice surface were photographed under an orthogonal polarizing mirror. The colors of adjacent grains in the image were different; that is, a color region represents a grain. For grain where the adjacent color contrast is not obvious, the grain boundary was delineated manually. The microstructure of river ice were divided into main two types: granular ice and columnar ice. The bubbles in ice crystals were observed using the same ice slices. The ice slices were placed on a universal rotating table without a polarizing mirror. The original images of bubbles were captured under normal light projection. The area, equivalent diameter and total percentage content of bubbles in ice crystals were extracted by image processing.

3. Results

In this experiment, the microstructures of river ice were obtained from two observation points at three different times.

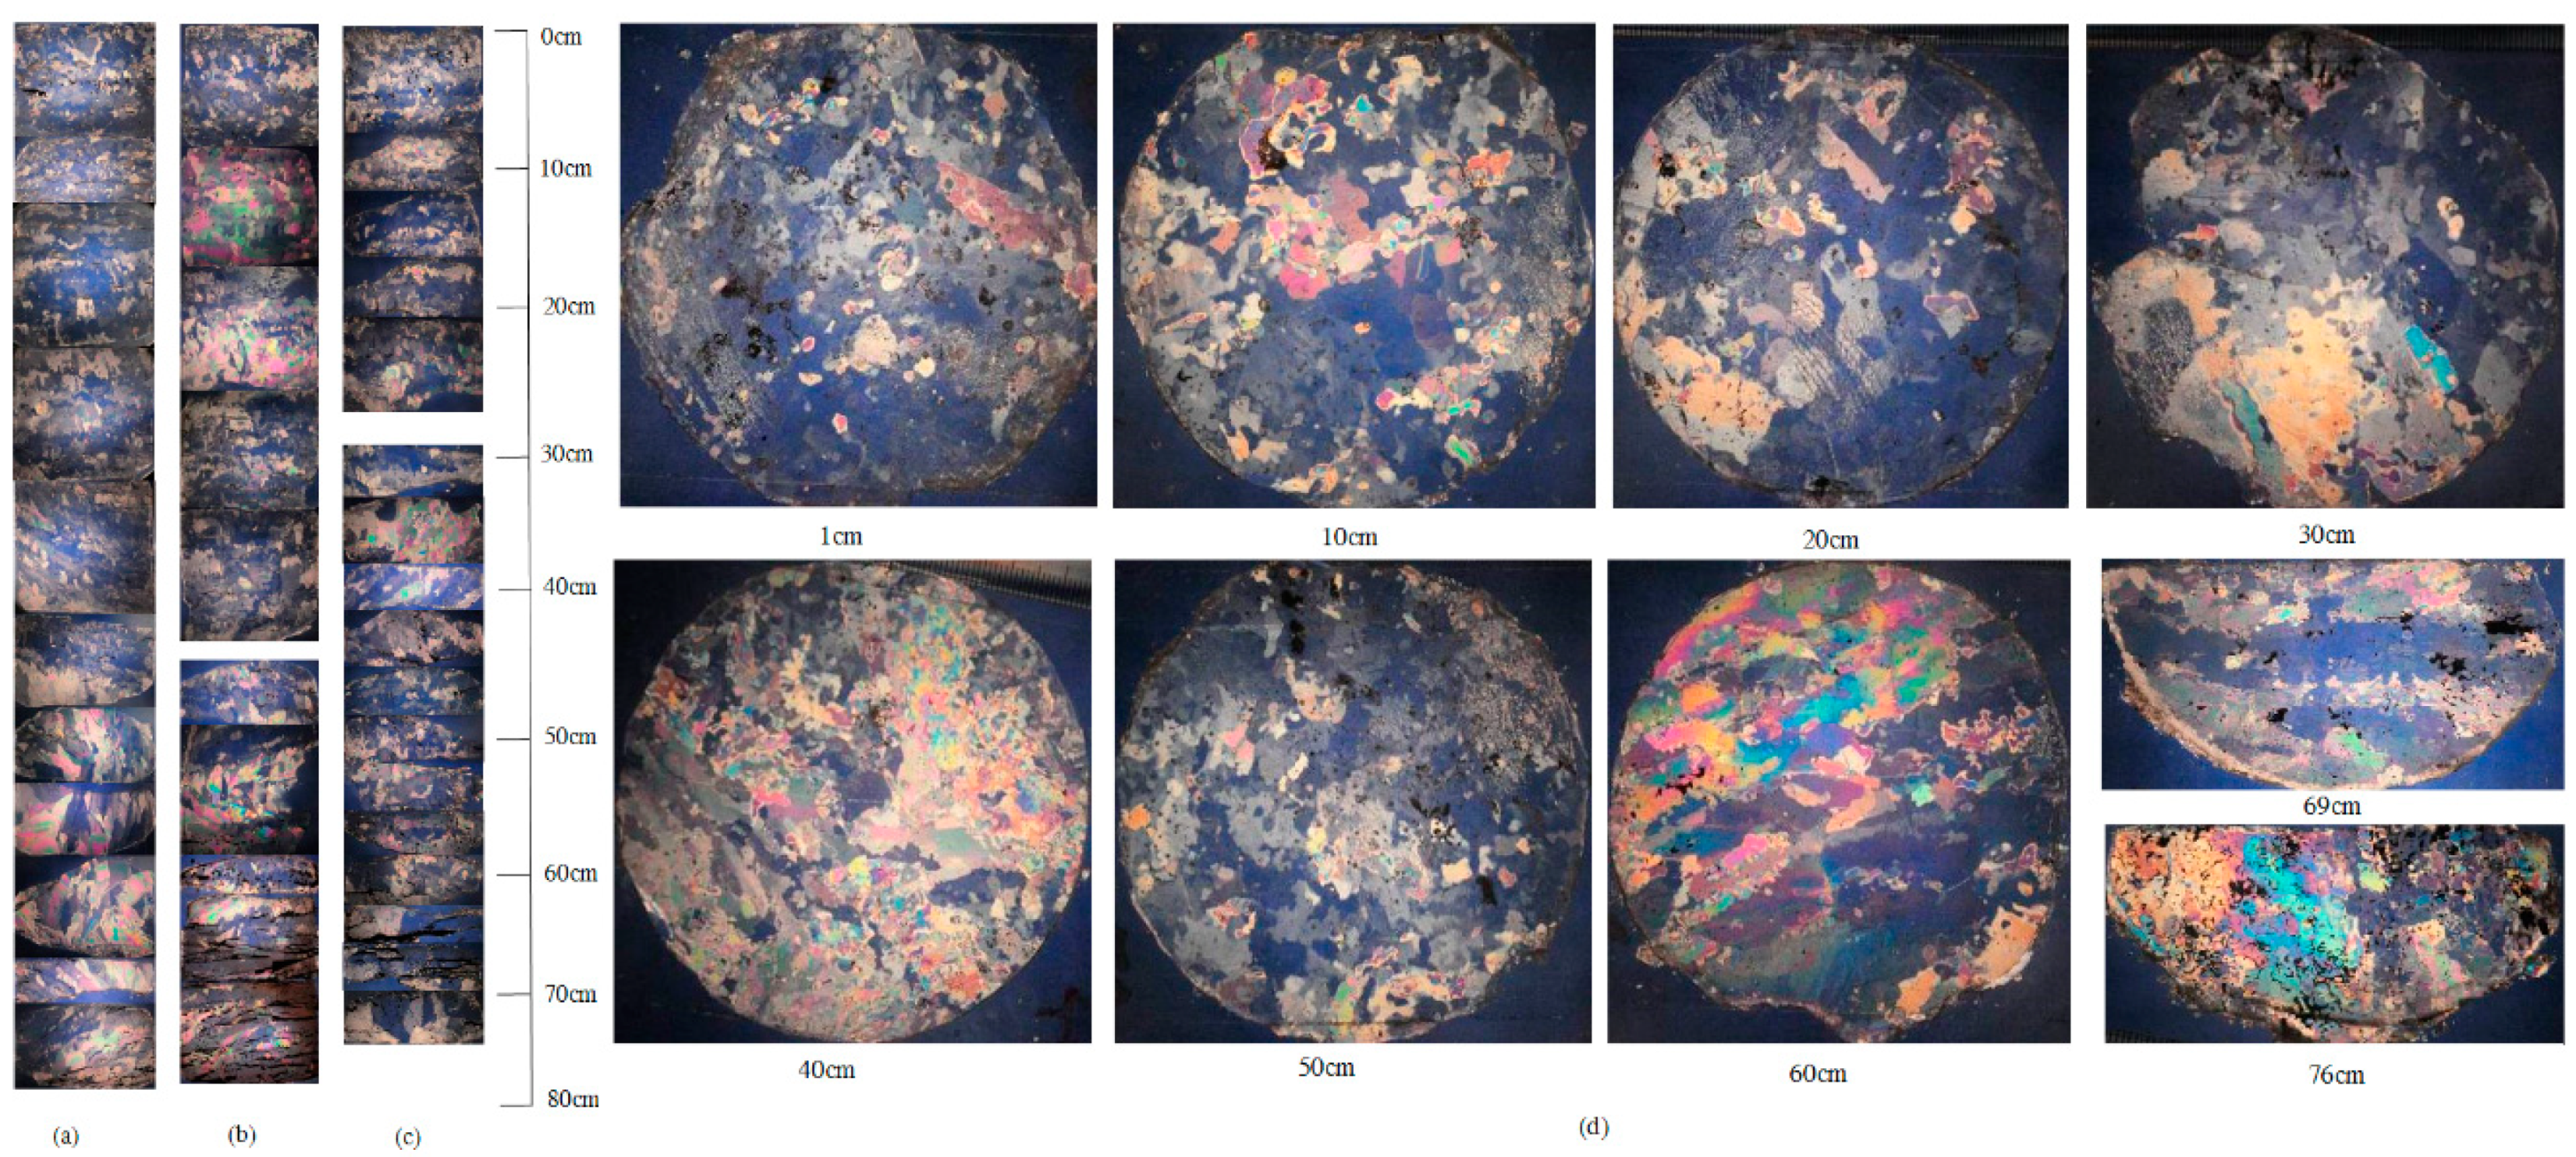
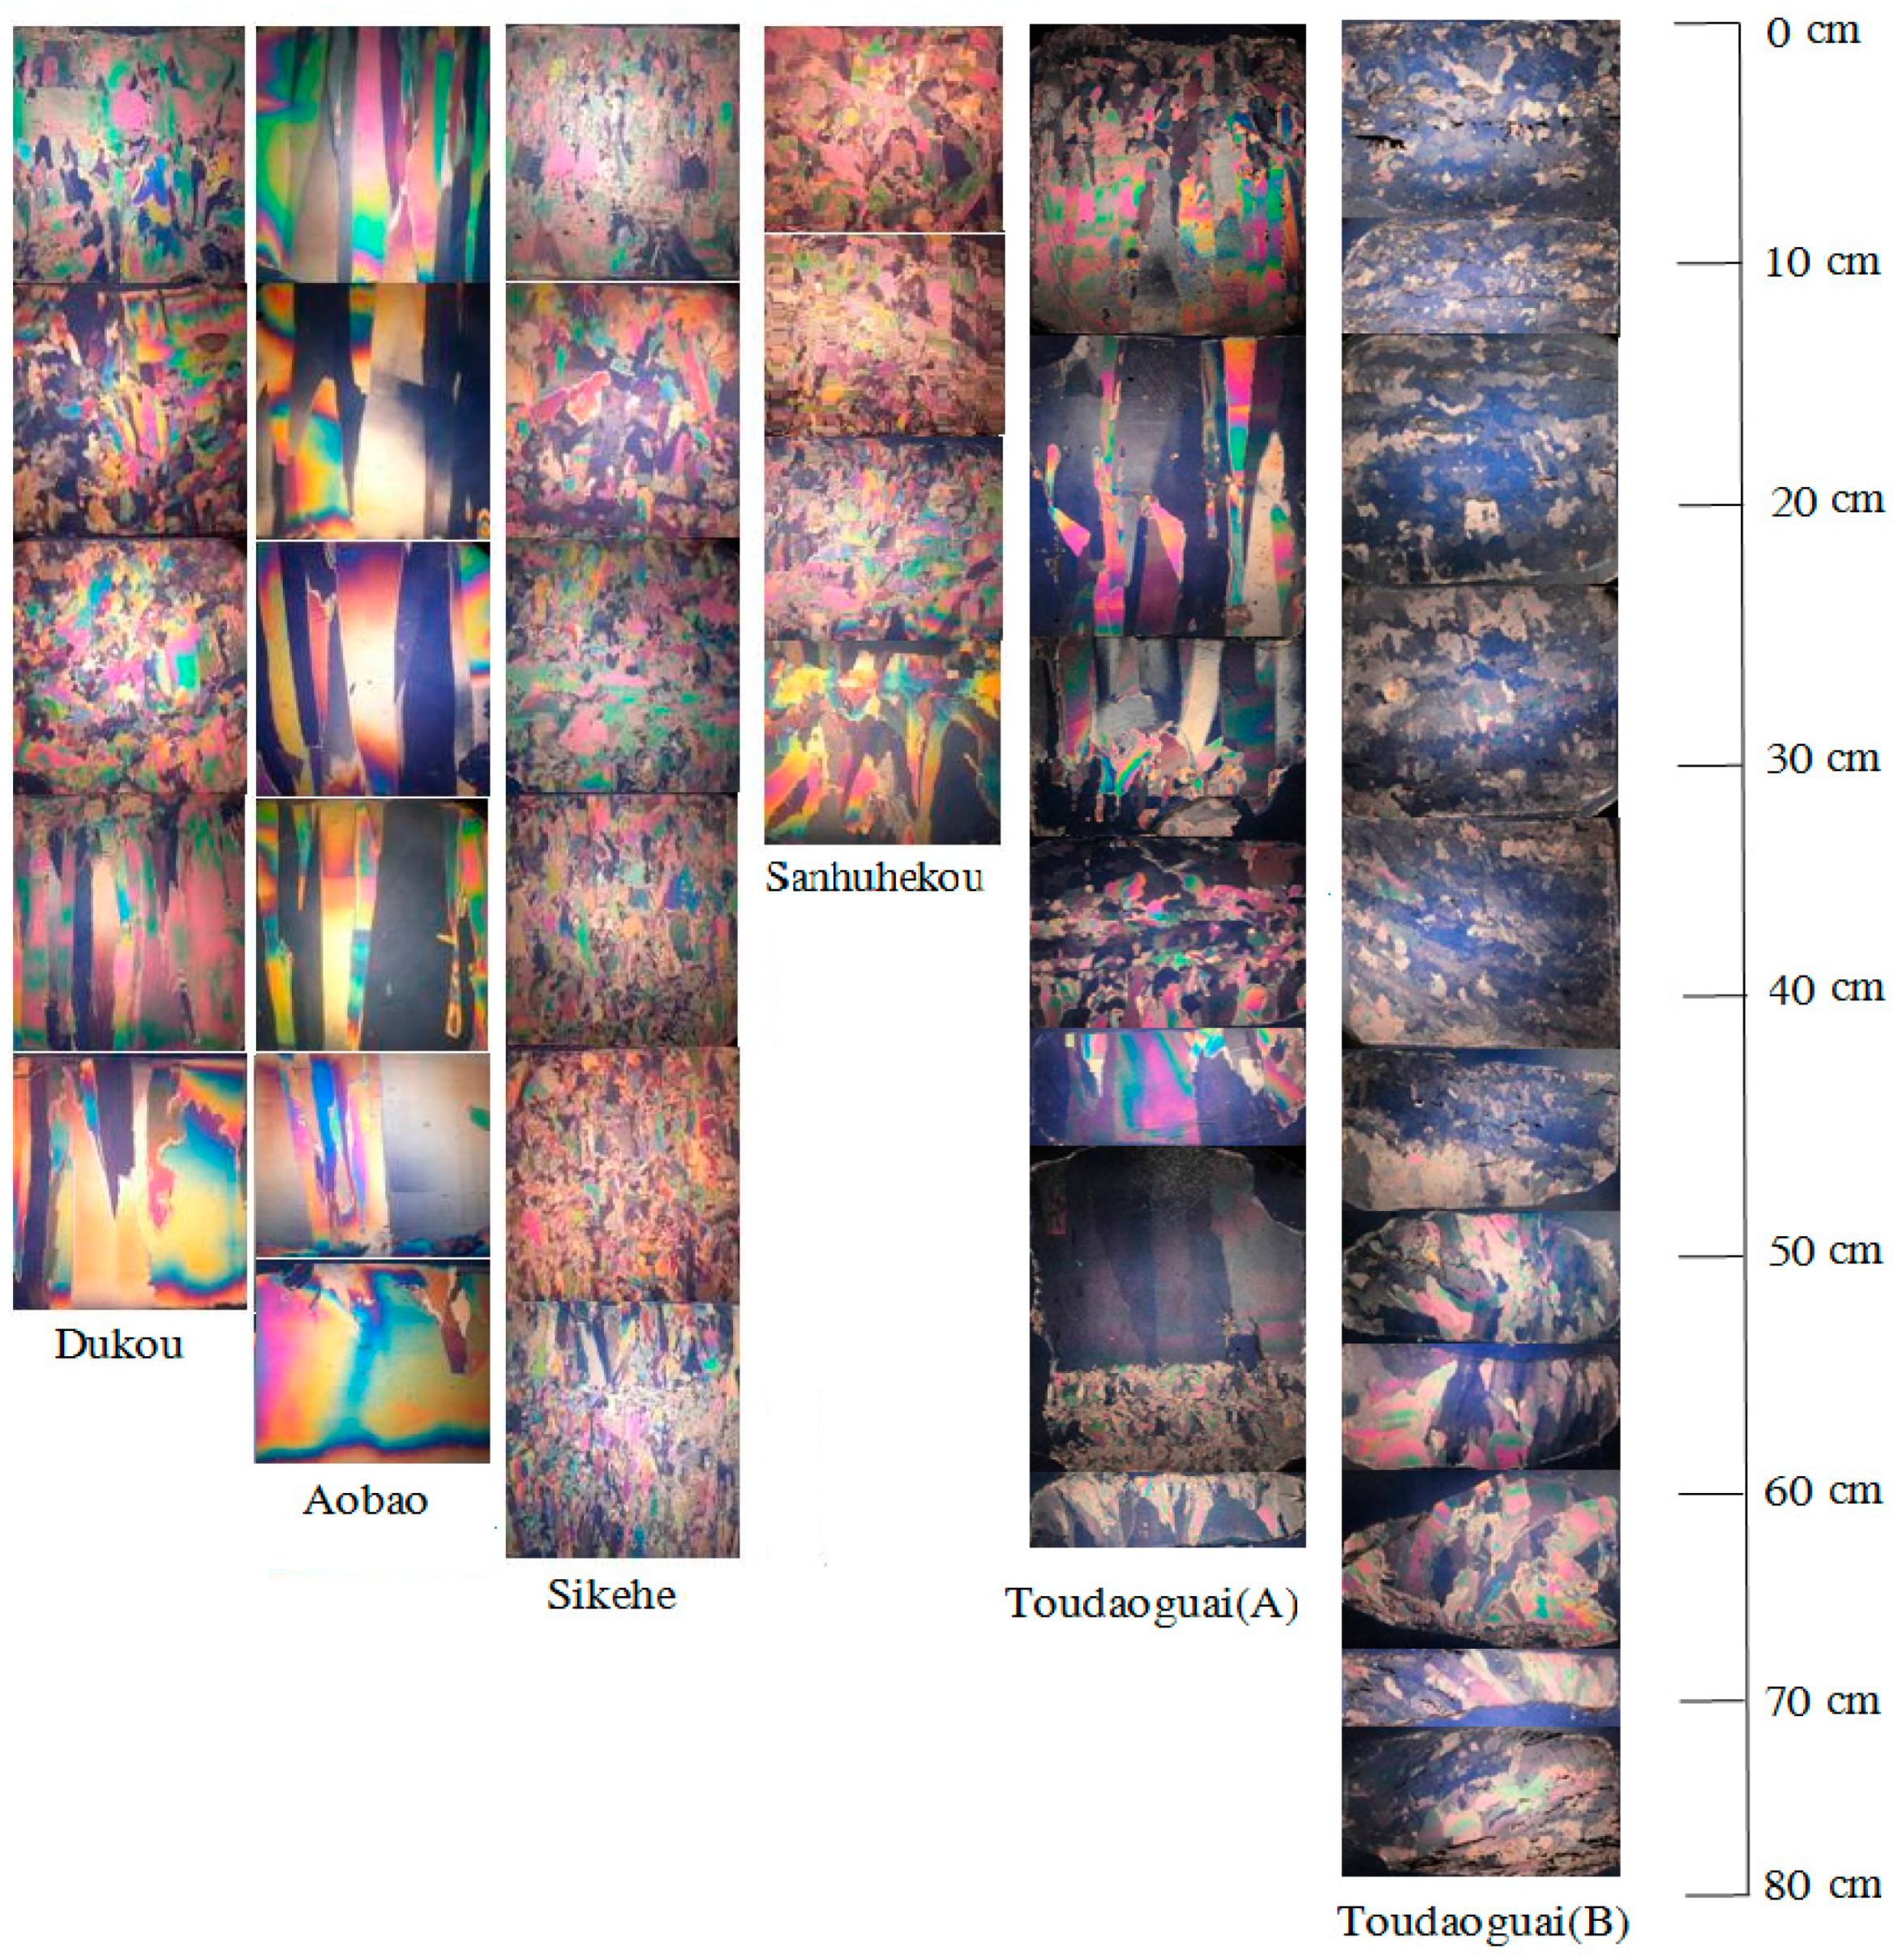
3.1. Ice Microstructure

The ice microstructures of the Yellow River are shown in Figure 3 and Figure 4. In the process of making ice slices, some ice slices were broken, and some of the data were lost (Figure 3c and Figure 4c,d). However, these losses do not affect the whole analysis of the ice microstructures of the Yellow River. By comparison, the ice thickness at Point B is greater than that at Point A. Because Point B is on the outside curve of the river and Point A is on the inside curve of the river, under the action of centrifugal force, the contents of fragile ice and drift ice are higher on the outside curve, the freezing speed is faster, and the ice is thicker. Therefore, granular ice dominates the ice microstructure at Point B, and most ice covers are composed of granular ice with frozen fragile ice and drift ice. While columnar ice dominates the ice microstructure at Point A, most ice covers are composed of columnar ice formed by thermodynamic growth.

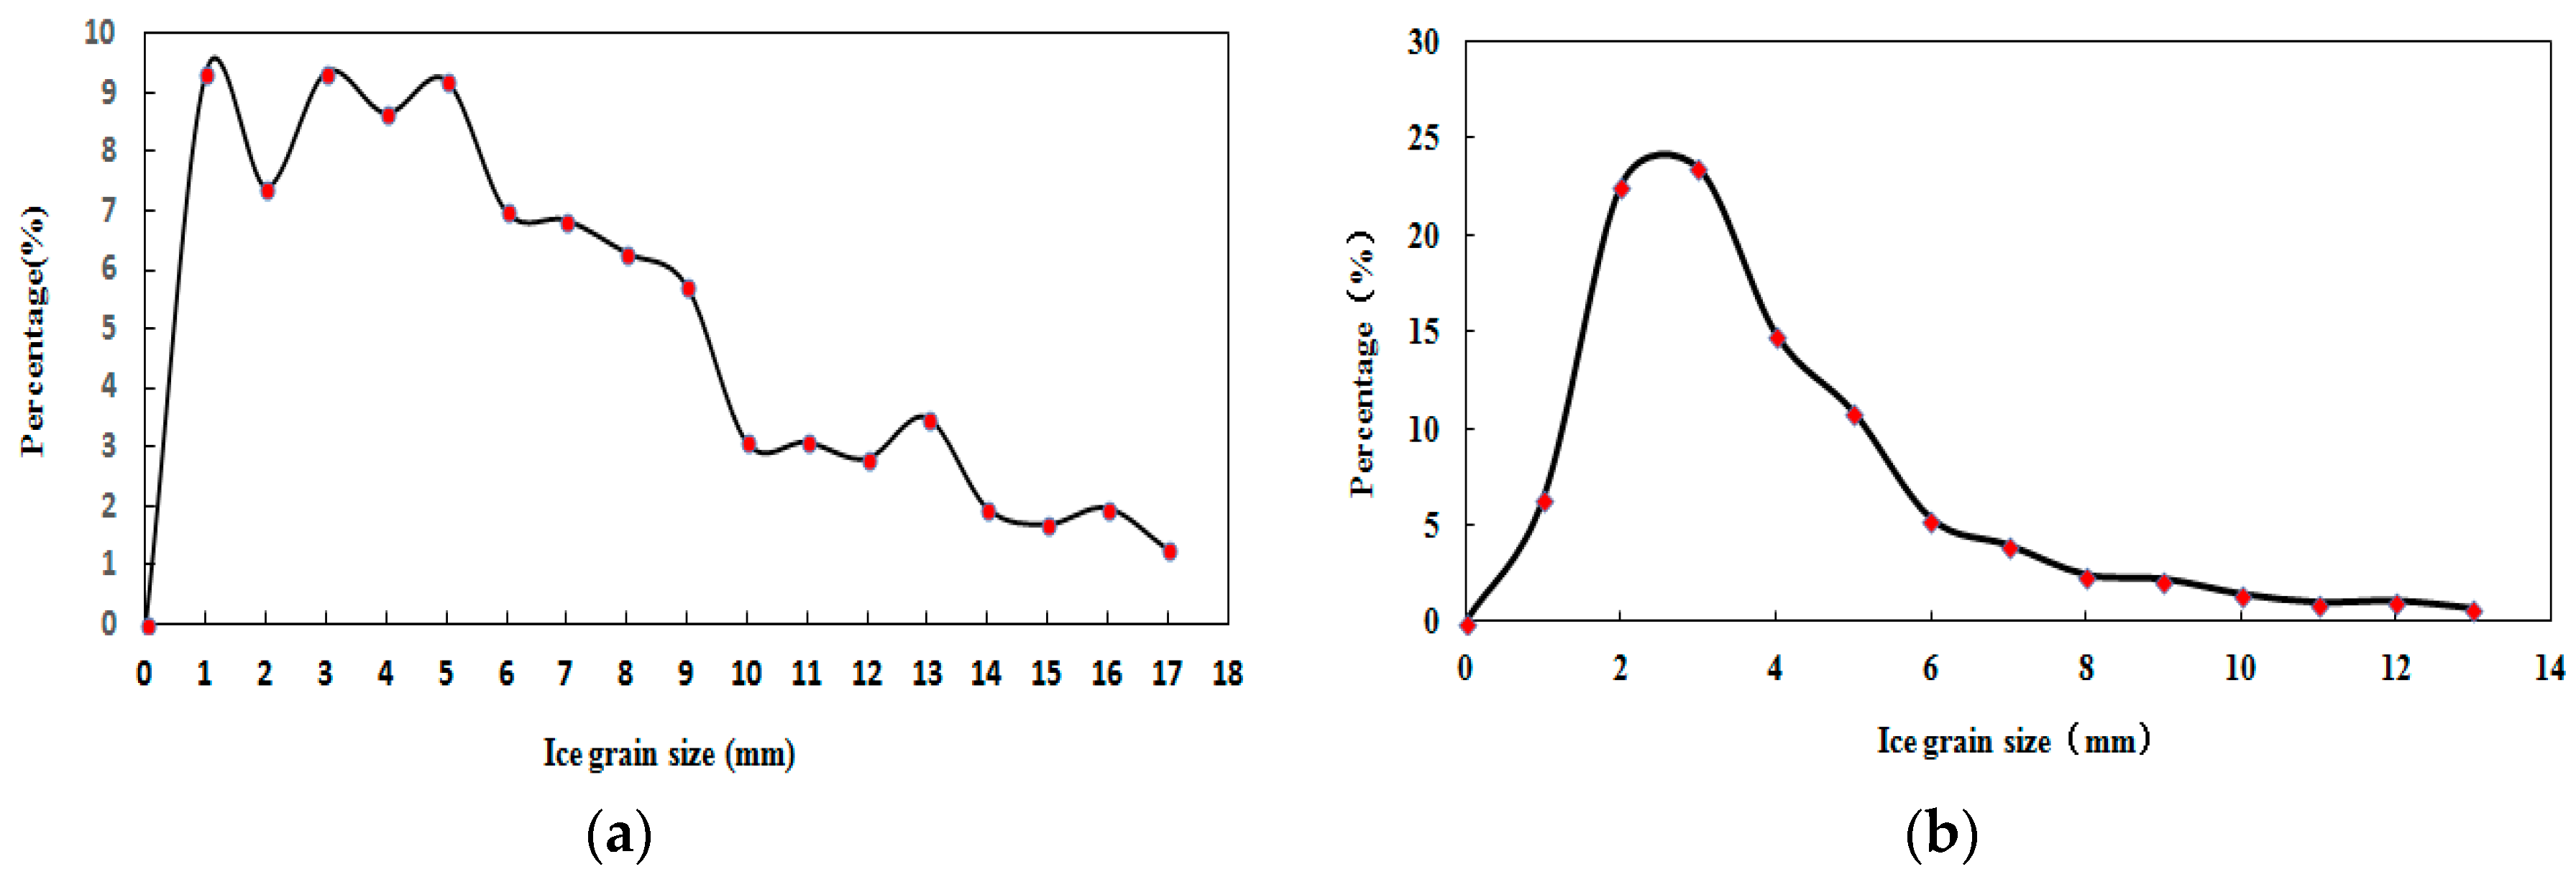
3.2. Ice Crystal Shape and Size

The crystal shapes of ice from the Yellow River are affected by many factors, such as climate conditions, flow conditions and river channel conditions. For ice crystals at Point A, in the direction perpendicular to the ice surface, the ice crystals show varied granular shapes and columnar shapes, while in the direction parallel to the ice surface, they show irregular granular shapes. Ice crystals at Point B show irregular granular shapes in the directions both perpendicular and parallel to the ice surface.
To analyze ice grain size changes, the morphologies of ice grains were extracted and the equivalent ice grain sizes were calculated by MATLAB (MathWorks, Natick, MA, USA,). First, the images of ice microstructure were gray-scale processed. Second, the images were denoised with median filtering method. Third, the edges of ice crystal images were extracted by Canny operator edge detection method. Then, the number of pixels in each connected area and boundary was calculated. According to the actual width of the images, the area and perimeter of the pixels were converted to the actual area and perimeter of ice grain. The equivalent grain diameters were used to describe the ice grain sizes due to the irregular shape of the ice grain. The distribution of different grain sizes is shown in Figure 5. Although the shapes of ice grains are not very close to circular, the circumference of ice grains can quantitatively reflect the shape difference of ice crystals. Figure 5 shows that the grain size of columnar ice crystals is larger at Point A, with an average grain size of 5.8 mm. The grain size of granular ice crystals is smaller at Point B, and the average grain size is 3.8 mm.

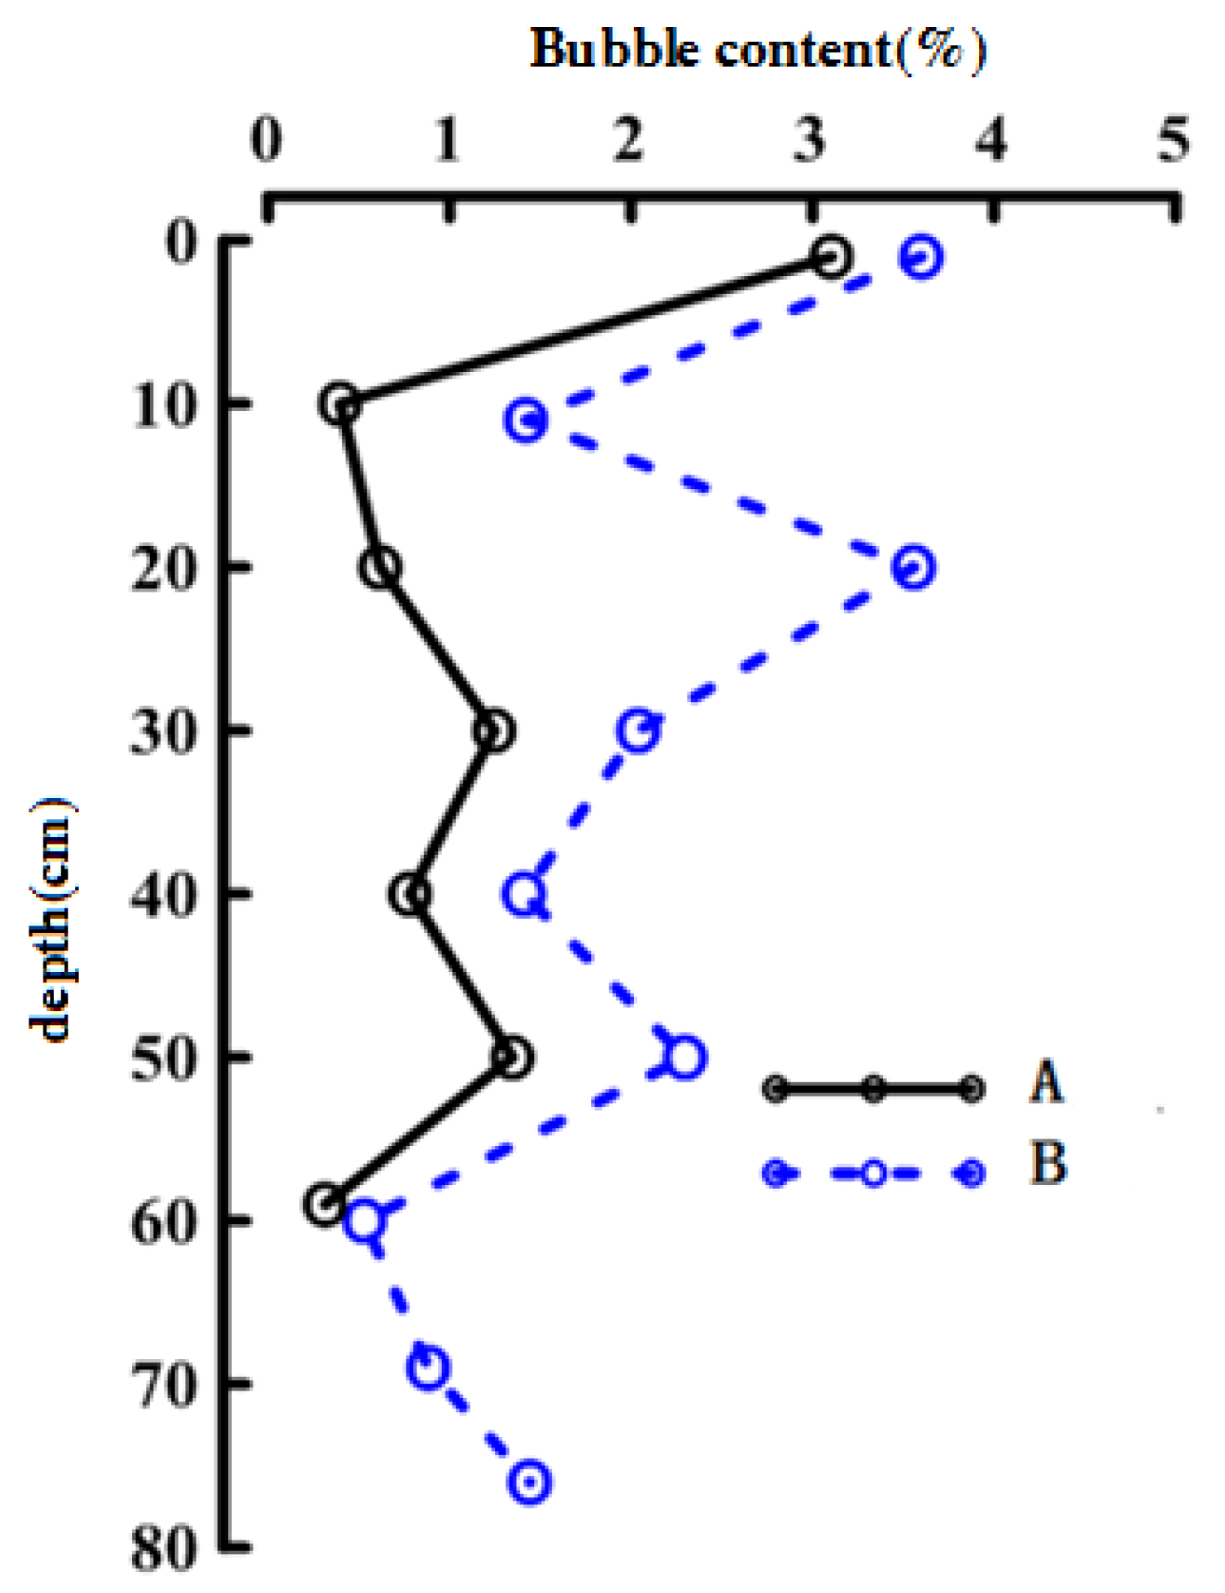
3.3. Initial Defects in Ice Crystals

Ice crystal itself is a porous material. Its internal initial defects come from bubbles, sediment particles, impurities, microcracks and so on. Among them, bubbles are the most common and have a relatively large impact.
The average bubble contents at Point A and Point B are shown in Figure 6. As a result of different microstructures, the bubble content at Point A is less than that at Point B at different depths. In addition, with the passage of time, the bubble content at the same point gradually increased, and the ice strength gradually decreased. The two field tests were conducted in the last stage of winter. Because of the deep color of the bubbles, the melting speed around the bubbles was fast, the volume of the bubbles gradually increased and the ice strength gradually decreased during the ice melting process.
Sediment content is also an index of ice crystals that affects their mechanical properties and density. During the ice melting period, an ice crystal with high sediment content melts fast because of the strong heat absorption effect. The sediment contents of ice samples at Point B are higher than those at Point A. Because of the fragile ice accumulation, the sediment began to precipitate, gather in the ice, and then freeze into ice blocks; meanwhile, the sediment could not be deposited at Point A, so the sediment content was low.

4. Discussion

4.1. Ice Microstructure Changes in Different Locations

The frozen reach of the Yellow River during winter is several hundred kilometers long. The ice microstructure of the Toudaoguan reach in Inner Mongolia was analyzed in detail in the preceding section. To analyze the characteristics of ice microstructures in different sections of the Yellow River, the ice microstructure of the Toudaoguan reach was compared with those observed in Dukou, Aobao, Sikehe, and Sanhuhekou, four other river sections in Inner Mongolia. Figure 7 shows that the ice microstructure types are different at different sampling points along the Yellow River. As a whole, the ice microstructures of the Yellow River can be divided into three types: columnar ice as the dominant microstructure, granular ice as the dominant microstructure, and columnar ice and granular ice alternating in the microstructure.

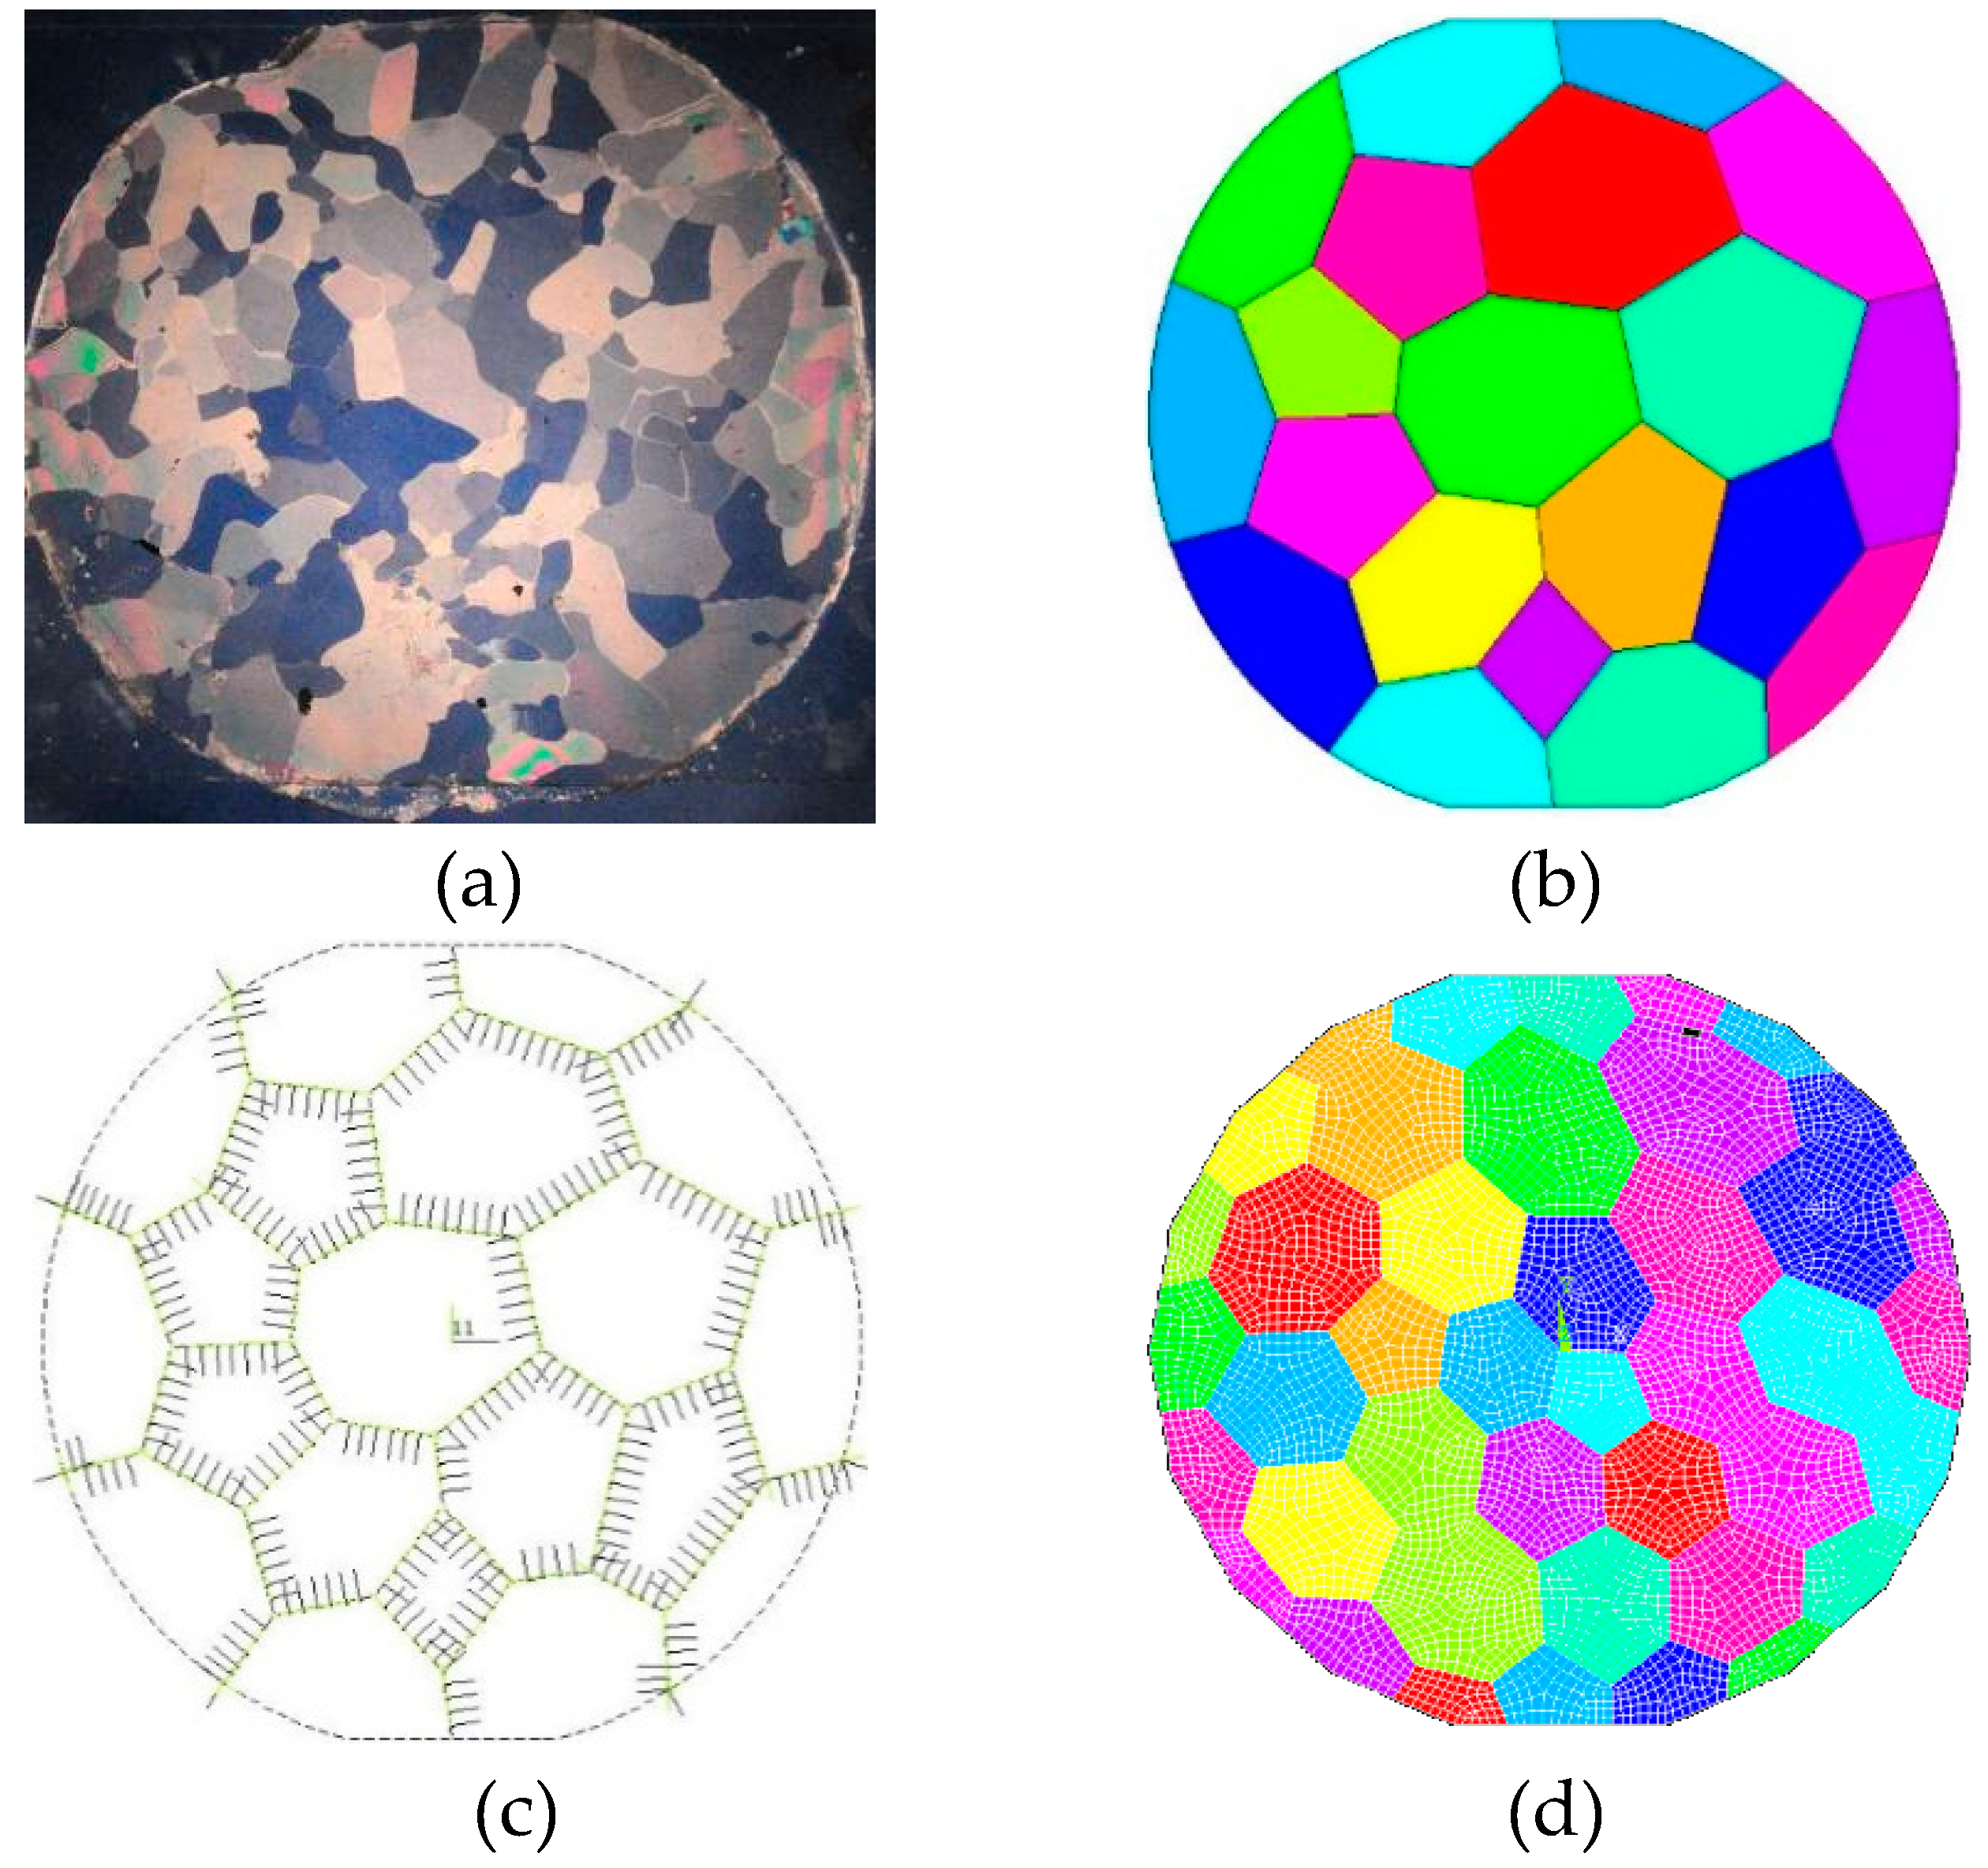
4.2. Granular Ice Crystals and Columnar Ice Crystals

The microstructure types of Yellow River ice mainly contain granular ice and columnar ice. The formations of different types of ice microstructures involve many factors, such as thermodynamics, hydraulics, river conditions and human influence. The growth of granular ice is mainly the result of fragile ice, drift ice, sediment and temperature change. Granular ice crystals are commonly not compact and contain many pores, bubbles and mud. In contrast, the growth of columnar ice is relatively stable and is mainly dominated by thermodynamics. Columnar ice has fewer grain boundaries, fewer pores and less mud than granular ice. Based on the observations and statistical analysis for the frozen period, granular ice is found to account for the majority, and columnar ice accounts for a small portion of the Yellow River ice.

4.3. Microstructure Model of Yellow River Ice

Referring to relevant numerical models of river ice [18,19,20], a calculation model of Yellow River ice microstructure was constructed based on the data and results of the physical tests of Yellow River ice. The crystal microstructure of Yellow River ice mainly consists of ice grain size and distribution, ice crystal boundaries and initial defects.
To simulate random and irregular polycrystalline grains, Voronoi polygons were adopted. Based on the development platform of the ANSYS software (ANSYS, Pittsburgh, PA, USA), a numerical model of river ice was established by programming, and the size and distribution of grains were simulated. A non-thickness spring element was adopted to simulate the grain boundary due to its small size: the slippage between grains was simulated by a tangential spring; the compression between grains was simulated by a normal spring. River ice is a porous material, and internal initial defects include bubbles, impurities, and microcracks. Bubbles are the most common, and their proportion is relatively large. The initial defects were simulated by weakening spring elements and were randomly distributed in the grain boundary surface. The effective unit area of the weakening spring was the initial defect area. Sketch maps are shown in Figure 8. The microstructure model provides a reference for in-depth analysis of the physical properties of Yellow River ice.
Yellow River ice involve complex processes. Among the bottleneck problems are clarifying the microstructure and material parameters of river ice and then understanding the failure process of river ice, which urgently need to be solved for the mechanism analysis of Yellow River ice disasters. Here, we analyzed the ice microstructure of samples obtained in the Inner Mongolia reach of the Yellow River during the freezing period. The results show that Yellow River ice crystals mainly consist of granular ice and columnar ice. However, the microstructure greatly varies in different time and space ranges. As a whole, the ice microstructure of the Yellow River can be divided into three types: columnar ice as the dominant microstructure, granular ice as the dominant microstructure, and columnar ice and granular ice alternating in the microstructure. In addition, the crystal shapes are irregular, and the crystal sizes are varied, mainly between 1 mm and 10 mm. Ice crystal initial defects come from bubbles, sediment particles, impurities, and microcracks; bubbles are the most common and have a relatively large impact.

5. Conclusions

The formation and evolution of Yellow River ice involve complex processes. Among the bottleneck problems are clarifying the microstructure and material parameters of river ice and then understanding the failure process of river ice, which urgently need to be solved for the mechanism analysis of Yellow River ice disasters. Here, we analyzed the ice microstructure of samples obtained in the Inner Mongolia reach of the Yellow River during the freezing period. The results show that Yellow River ice crystals mainly consist of granular ice and columnar ice. However, the microstructure greatly varies in different time and space ranges. As a whole, the ice microstructure of the Yellow River can be divided into three types: columnar ice as the dominant microstructure, granular ice as the dominant microstructure, and columnar ice and granular ice alternating in the microstructure. In addition, the crystal shapes are irregular, and the crystal sizes are large, mainly between 1 mm and 10 mm. Ice crystal initial defects come from bubbles, sediment particles, impurities, and microcracks; bubbles are the most common and have a relatively large impact.

Author Contributions

Y.D. conceived the original idea; Y.D. and L.X. analyzed the data; J.W. built the model; Z.L. contributed useful and deep discussions and modified the manuscript.

Funding

This research was funded by the National Key R&D Program of China (Grant No. 2018YFC1508401), the National Natural Science Foundation of China (Grant No. 51879116, 51579028, 51639003), and the Special Funds for Basic Scientific Research of the Yellow River Institute of Hydraulic Research (Grant No. HKY-JBYW-2018-05 and HKY-JBYW-2017-01).

Acknowledgments

We thank Zhijun Li and her students for their contributions to the field work. We are grateful to anonymous reviewers of this manuscript for helpful comments.

Conflicts of Interest

The authors declare that they have no conflicts of interest.

References

  1. Cole, D.M. Effect of grain size on the internal fracturing of polycrystalline ice. Cold Reg. Res. Eng. Lab. Hanover Nh Rep. 1986, 4, 35–40. [Google Scholar]
  2. Cole, D.M. Crack nucleation in polycrystalline ice. Cold Reg. Sci. Technol. 1988, 15, 79–87. [Google Scholar] [CrossRef]
  3. Liu, F.P.; Baker, I.; Dudley, M. Dislocation-grain boundary interaction in ice under creep conditions. Int. Assoc. Hydraul. Res. Ice Symp. 1994, 1, 484–494. [Google Scholar]
  4. Baker, I.; Liu, F.; Dudley, M.; Black, D. In-situ synchrotron X-ray topographic studies of polycrystalline ice. Int. Assoc. Hydraul. Res. Ice Symp. 1994, 1, 416–425. [Google Scholar]
  5. Baker, I.; Cullen, D. SEM/EDS observations of impurities in polar ice: Artifacts or not? J. Glaciol. 2003, 49, 184–190. [Google Scholar] [CrossRef]
  6. Iliescu, D.; Baker, I. The structure and mechanical properties of river and lake ice. Cold Reg. Sci. Technol. 2007, 48, 202–217. [Google Scholar] [CrossRef]
  7. Currier, J.H.; Schulson, E.M. The tensile strength of ice as a function of grain size. Acta Metall. 1983, 30, 1511–1514. [Google Scholar] [CrossRef]
  8. Thorsteinsson, T.; Kipfstuhl, J.; Miller, H. Microstructures and fabrics in the GRIP ice core. J. Geophys. Res. 1997, 102, 26583–26599. [Google Scholar] [CrossRef]
  9. Benjamin, R.; Markus, J.; Rainer, G. Under-ice turbulent microstructure and upper ocean vertical fluxes in the Makarov and Eurasian Basins, Arctic Ocean, During Late Spring and Late Summer/Autumn in 2015. In Proceedings of the EGU General Assembly Conference, Vienna, Austria, 23–28 April 2017; Volume 19. [Google Scholar]
  10. Yuan, L.; Sepp, K.; Maohuan, H. Ice microstructure and fabric of Guliya ice cap in Tibetan plateau, and comparisons with vostok3G-1, EPICA DML, and north GRIP. Crystals 2017, 7, 97. [Google Scholar]
  11. Li, Y.; Du, Z.; Cunde, X. Analyzing characteristically on ice fabric and microstructure of Miaoergou glacier top-flatted, East Tangshan. J. Glaciol. Geocryol. 2017, 39, 273–280. [Google Scholar]
  12. RM, L.; EJ, G.; RW, O. Metrics for interpreting the microstructure of sea ice using X-ray micro-computed tomography. Cold Reg. Sci. Technol. 2017, 138, 24–35. [Google Scholar]
  13. Wang, G.; Huang, W.; Li, Z.; Jia, Q. Observations on the inner structures of Hongqi-pao reservoir ice in daqing. J. Heilongjiang Hydraul. Eng. 2009, 12, 75–79. [Google Scholar]
  14. Li, Z.; Jia, Q.; Huang, W. Characteristics of ice crystals bubbles and densities of fresh ice in a reservoir. J. Hydraul. Eng. 2009, 40, 1333–1338. [Google Scholar]
  15. Pervier, M.A.; Pervier, H.; Hammond, D.W. Observation of microstructures of atmospheric ice using a new replica technique. Cold Reg. Sci. Technol. 2017, 140, 54–57. [Google Scholar] [CrossRef] [Green Version]
  16. Deng, Y.; Wang, J.; Xiao, Z. The selection of microscopic parameters in building fracture microscopic model of River Ice. Yellow River 2017, 10, 27–31. [Google Scholar]
  17. Zhang, Y.; Gao, G.; Deng, Y.; Li, Z.; Li, G.; Guo, W. Investigation on ice crystal density and sediment content in ice at different positions in Bayannaoer section of the Yellow River. Yellow River 2018, 11, 44–48. [Google Scholar]
  18. Lebensohn, R.; Montagnat, M.; Mansuy, P.; Duval, P.; Meysonnier, J.; Philip, A. Modeling viscoplastic behavior and heterogeneous intracrystalline deformation of columnar ice polycrystals. Acta Mater. 2009, 57, 1405–1415. [Google Scholar] [CrossRef]
  19. Montagnat, M.; Castelnau, O.; Bons, P.; Faria, S.; Gagliardini, O.; Gillet-Chaulet, F. Multiscale modeling of ice deformation behavior. J. Struct. Geol. 2014, 61, 78–108. [Google Scholar] [CrossRef]
  20. Suquet, P.; Moulinec, H.; Castelnau, O.; Montagnat, M.; Lahellec, N.; Grennerat, F. Multi-scale modeling of the mechanical behavior of polycrystalline ice under transient creep. Procedia IUTAM 2012, 3, 76–90. [Google Scholar] [CrossRef] [Green Version]
Figure 1. The whole process of ice sample collection: (a) cutting with an electric saw; (b) drilling ice; (c) cutting with a plate saw; (d) ice sample; (e) ice thickness measurement; (f) temperature measurement in ice.
Crystals 09 00484 g001aCrystals 09 00484 g001b
Figure 2. Preparation process of ice slices: (a) sawing ice; (b) labeling ice samples; (c) adhering ice samples to glass sheets; (d) checking adhesion of ice blocks; (e) planning an ice slice; (f) well-polished ice slices.
Crystals 09 00484 g002
Figure 3. Ice microstructure at Point A in the Yellow River: (a) ice microstructure in the direction perpendicular to the ice surface (15th February); (b) ice microstructure in the direction perpendicular to the ice surface (24th February); (c) ice microstructure in the direction perpendicular to the ice surface (27th February); (d) ice microstructure of different ice layers parallel to the ice surface (24th February).
Crystals 09 00484 g003
Figure 4. Ice microstructure at Point B in the Yellow River: (a) ice microstructure in the direction perpendicular to the ice surface (15th February); (b) ice microstructure in the direction perpendicular to the ice surface (24th February); (c) ice microstructure in the direction perpendicular to the ice surface (27th February); (d) ice microstructure of different ice layers parallel to the ice surface (24th February)
Crystals 09 00484 g004
Figure 5. The grain size distribution of ice crystals: (a) Point A; (b) Point B.
Crystals 09 00484 g005
Figure 6. Bubble content distribution at Points A and B.
Crystals 09 00484 g006
Figure 7. Ice microstructure at different points along the Yellow River.
Crystals 09 00484 g007
Figure 8. The finite element model of river ice microstructure: (a) a typical sample diagram of the microstructure of Yellow River ice; (b) a structure diagram of the numerical model; (c) a spring unit diagram of ice crystal boundaries; (d) a sketch map of the whole model.
Crystals 09 00484 g008

