Abstract
The isothermal compression tests of the nickel-based superalloy Waspaloy were carried out under various temperatures from 1040 to 1120 °C and strain rates from 0.01 to 10 s−1 with the height reduction of 60% and the flow stress curves were obtained. The curves show that the flow stress is greatly affected by the temperature and strain rates. Regression analysis of the experimental results was carried out to learn about the deformation behavior through the Arrhenius equation and came to the conclusion that the activation energy of Waspaloy is 669.7 kJ/mol. The constitutive equation of the Waspaloy was constructed. Meanwhile, the processing maps of the Waspaloy for the power dissipation and the flow instability were constructed. The processing map of the power dissipation and the flow instability depicts that the strain plays a major role in the processing maps. The instability zone is prone to appear at higher strain rates with the increasing strains. According to the instability processing map, there are three unsafe regimes around 1040–1120 °C/1.5–10 s−1, 1040–1080 °C/0.02–0.1 s−1 and 1110–1120 °C/0.02–0.3 s−1 that should be avoided during deformation process. The power dissipation maps show that the maximum dissipation is prone to appear at low strain rates (0.01 s−1) when the strain is about 0.1~0.6 while at middle strain rates (0.1–1 s−1) when the strain is over 0.6, and when the true strain is 0.9, the optimum processing condition is around 1060–1120 °C/0.1–1 s−1. The dynamic microstructures under different temperatures and strain rates were also obtained. We concluded that lower strain rates and higher temperatures are more applicable to obtain fully-recrystallized microstructures. Based on the instability maps and the power dissipation maps and the dynamic microstructures, the optimum deformation conditions are determined to be around 1080–1100 °C/0.1–1 s−1 and 1040–1120 °C/0.01 s−1.
1. Introduction
The superalloy Waspaloy is a nickel-based precipitation strengthened superalloy. Compared to the widely used nickel-based superalloy Inconel 718, Waspaloy does not contain Nb element, but has more Al and Ti elements to constitute the γ′ phase which is the main strengthened phase of the Waspaloy [1,2], and hence the strength property of Waspaloy is superior to that of Inconel 718 [3,4]. Waspaloy possesses high strength together with excellent oxidation resistance and fatigue properties [1]. Waspaloy is widely used in the rotating parts of aviation engine turbine discs and high temperature fasteners due to its high degree of alloying and high resistance to the corrosion of the gas [2].
There have been many problems in gas turbines, such as the surge, poor stability and the short life of the combustion engine [4]. As Waspaloy is the main high temperature alloy of the gas turbine, and there is frequent occurrence of non-uniform grains in the microstructure [5,6,7,8,9], the research on the forging process of Waspaloy is constantly being enhanced.
As for deformation, the stress of the deformation should be taken into consideration firstly to obtain suitable processing parameters. The relationship between flow stress and strain rates under specific strain is described by a constitutive equation. The hot deformation of the metal and alloy is a thermally activated process, and hence it is usually analyzed by the Arrhenius equation [10,11,12,13]. The parameters of the Arrhenius equation were obtained through the results of the experiment and the equation. Many impacts that affect the deformation were taken into account in order to obtain the appropriate microstructure, such as temperature, strain rate and strain. The most commonly experimental means to combine them is isothermal hot compressing. Otherwise, the study of the stress of the alloy is not sufficient and it is necessary to consider the microstructure evolution of the alloy. The processing map is a powerful method for designing the processing technology of the alloy and evaluating the feasibility of the processing, and it can be used to analyze and predict the deformation characteristics under various deformation conditions. The processing map contains the Raj processing map based on the atomic model and the processing map based on the dynamic material model (DMM). However, the Raj processing map is only applicable to pure metal and simple alloy and is only effective in the steady state while the process of the deformation of the alloy tends to be unsteady. The dynamic material model is usually used as a reflection to evaluate the deformation of the alloy [14,15].
Prasad et al. [16] developed the dynamic material model (DMM) on the basis of the combination of large plastic continuum mechanics, the physical system simulation and the irreversible thermodynamics theory. It is the pivot of the plastic deformation and the microstructure, and can depict the consumption of the energy provided outside. The processing map has been widely used in superalloy [17,18,19,20,21], titanium alloy [22,23,24,25,26], aluminum alloy [27,28,29] and even all kinds of steels [30,31,32,33]. Gupta et al. [17] studied the processing map of the Co-base superalloy Co20Cr15W10Ni, and it was found that the suitable range of the processing temperature and strain rate could prevent the unstable regions. Ghasemi et al. [25] studied the processing map of the BT9 titanium alloy and concluded the optimum deformation condition to acquire the maximum efficiency of power dissipation and the refined grains. Yang et al. [27] divided the processing map into five regions and the suitable processing window for the as-cast 7075 aluminum alloy was obtained.
In this paper, the activation energy and suitable processing windows of Waspaloy were obtained through the establishment of the constitutive equation and the processing map of the alloy.
2. Experimental Procedure
The experimental material Waspaloy was provided by the Baoshan steel Co special steel branch (Shanghai, China) with the dimensions of φ 314 mm × 60 mm. The main chemical compositions are listed in Table 1. The ingot bar was melted in the vacuum induction-melting (VIM) furnace with electro arc remelting (EAR) and was forged into a wrought billet in the diameter of 230 mm. It was cut into small cylindrical samples 8 mm in diameter and 12 mm long by means of an electric park wire on the edge of the wrought billet. The initial microstructure of the Waspaloy was obtained on optical microscope (OM) after a series of grinding, mechanical polishing and chemical etching for 5 s in a solution of modified Kalling reagent (60 ml HCl + 40 mL HNO3 + 40 mL CH3COOH) [34]. The sample for the scanning electron microscope (SEM) was electronically etched in a solution of 150 ml phosphoric acid + 10 ml sulphuric acid + 15 g chromium oxide at 5 V, for 10 s. The initial microstructures of the Waspaloy are shown in the Figure 1. Figure 1a shows the initial microstructure of the grains and it can be derived that the grain size is homogeneous with the average grain size of 46 μm (ASTM6) in diameter. Figure 1b displays that the duplex-sized spherical γ’ phases were uniformly distributed in the γ matrix with the average diameters of 256 nm and 52 nm respectively.

Table 1.
Chemical composition of the Waspaloy.
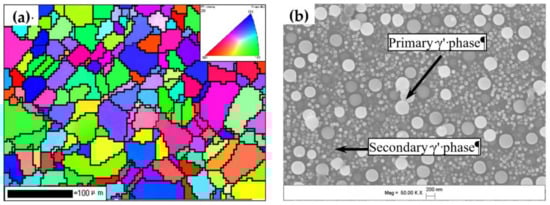
Figure 1.
The initial microstructure of the specimens (a) EBSD (Electron Backscattered Diffraction), (b) SEM.
The isothermal compression for the experimental material was conducted on a Gleeble-3500 thermal simulation compression-testing machine. The compression temperatures ranged from 1040 to 1120 °C and the strain rates ranged from 0.01 to 10 s−1. It was heated to the experimental temperature at the speed of 10 °C/s by electromagnetic induction heating and with a heat preservation of 5 minutes, then the cylindrical sample was pressed to 40% height with the strain rate of 0.01 to 10 s−1. It was immediately quenched in water to maintain the microstructure under the deformation state.
3. Results and Analysis
3.1. Stress–Strain Curves
The true stress-true strain curves under different temperatures and strain rates through the isothermal compression were presented in Figure 2. It can be obtained from the figure that the true flow stress increased to the peak value promptly at the initial stage, was then followed by a relatively steady state and subsequently decreased gradually.
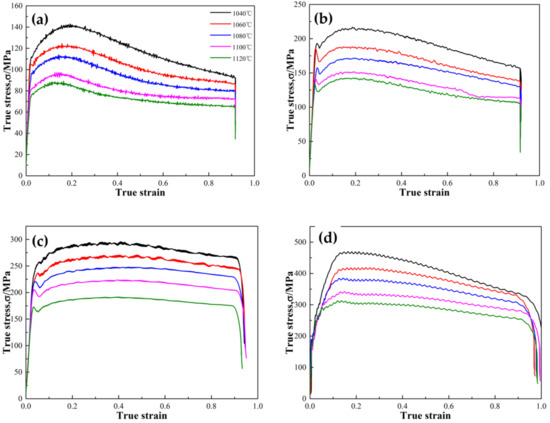
Figure 2.
True stress-True strain curves under elevated temperatures and strain rates. (a) ; (b) ; (c) ; (d) .
It is well known that the flow stress rises quickly at the first stage resulting from the multiplication and the pile-up of the dislocation. Then the flow stress comes to peak stress owing to the competition between the work hardening and the softening induced by the dynamic recovery (DRV) and the dynamic recrystallization (DRX). The peak stress appeared at the strains from 0.1 to 0.2. The peak stress corresponds to the temperature and the strain rates increases with the increase of the strain rates and decline of the temperatures. Finally the flow stress curve declines slowly and gets to a steady state due to the counterbalance between strain hardening and softening [22,35].
It can be seen that the phenomenon of softening is much more apparent under the high strain rate owing to the sensitivity of the Waspaloy to the strain rate.
It can be obtained from the figures that there exists apparent fluctuations and serration under the strain rate of 10 s−1, owing to the discontinuous DRX under the high strain rate. While the DRV created by the cross-slip of the screw dislocation and the climb of the edge dislocation was limited due to the short time of the deformation, and the subgrain boundary was not well formed, the density of dislocation remained relatively high level, which caused the internal storage of the alloy to increase rapidly. While the internal storage achieves the required driving force of the DRX and ultimately leads to the occurrence of DRX, there exists enough time to form the subgrain boundaries while the DRX occurs. The dynamic equilibrium of the work hardening and dynamic softening leads to the fluctuation and the serration of the curves.
3.2. Deformation Behavior
The deformation behavior of the Waspaloy was established on account of the isothermal compression. As we know, the deformation of the metal and alloy is a thermal activation process. Arrhenius equation was usually adopted to analyze the relationship among the flow stress, temperature and strain rate. The effects of temperature and strain rate on the deformation behavior are usually represented by the parameter Z (Zener–Hollomon) in an exponential function. There are three kinds of commonly used Arrhenius equation shown in Equations (1)–(3) and the hyperbolic law in the Arrhenius type equation (Equation (3)) was widely believed to give a better approximation between parameter Z and flow stress [33]:
Among the three equations, the and σ represent the strain rate and true stress respectively, Q and R represent the deformation activation energy and the gas constant (8.314 J·mol−1·K−1) respectively, the other parameters are constants related to the material and the relationship between α, β and n1 is α=β/n1 [36]. The parameters of the equation were determined by the linear regression of the experimental results to establish the constitutive equation.
The peak flow stress under the different temperatures and strain rates were picked out to study the constitutive equation. First take a natural logarithm of the Equation (1) and gain the second Equation (4) and conclude that there is a linear relationship between lnσ and ln, the slope of the straight line presented in Figure 3 is 1/n1. Based on the linear fitting, the slope under different temperatures can be obtained, and then take the average of the n1 under different temperatures and then obtain that n1 = 5.72134. Equation (5) was obtained through taking a natural logarithm of the Equation (2) and obtained β is 0.025946 MPa-1 from Figure 4 as 1/β is the slope of the line between σ and ln. Then α can be calculated by the formula: α=β/n1=0.0041 MPa-1.
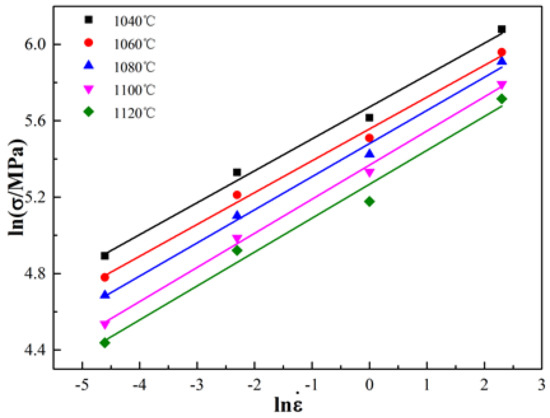
Figure 3.
The relationship between and .
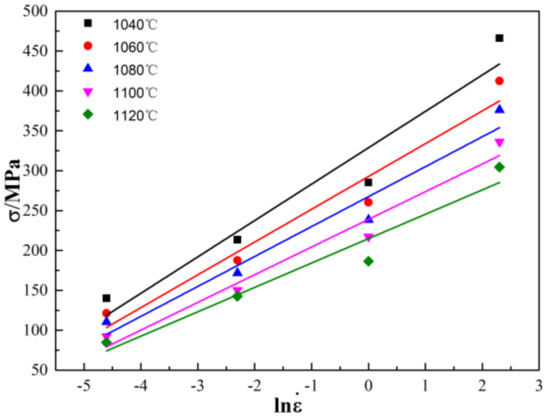
Figure 4.
The relationship between σ and .
The Equation (3) is applicable for the deformation under the high strain rate and low strain rate of the alloy. When the deformation temperature is a constant, and both sides of the Equation (3) can take a partial derivative to the strain rate and obtained the Equation (6):
It can be obtained from Equation (6) that there exists a linear relationship between the and when the deformation temperature is a constant. Figure 5 shows the linear relationship of and and the slope of the line is 1/n. From Figure 5, the value of the parameter n can be determined as 4.35.
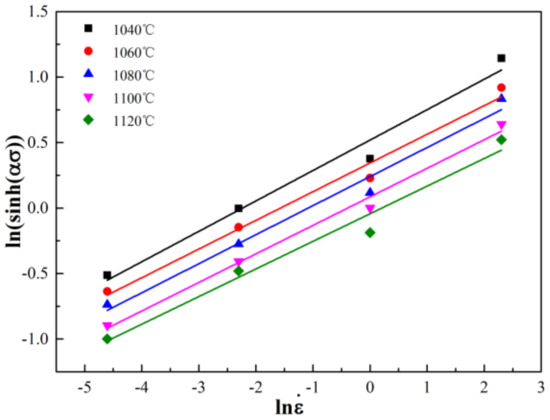
Figure 5.
The relationship between and .
When the strain rate is a constant, taking both sides of the Equation (3) a partial derivative to the reciprocal of temperature 1/T and obtained the Equation (7).
It can be obtained from Equation (7) that there exists a linear relationship between and 1/T when the strain rate is a constant. Figure 6 shows the linear relationship of and 1/T and the slope of the line is Q/nR. From Figure 6, the value of the parameter Q can be determined as 669.7 kJ/mol.
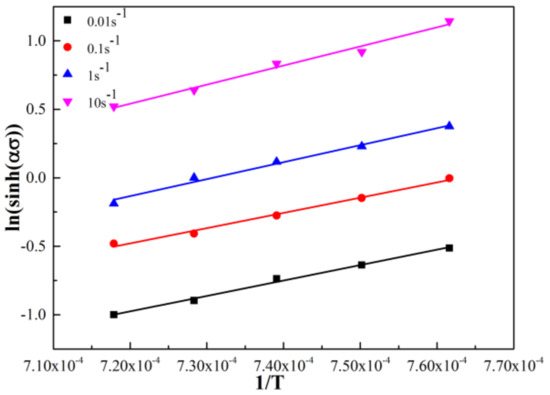
Figure 6.
The relationship between and 1/T.
Z (Zener–Hollomon) parameter was widely used to combine the effect of temperature and strain rates on the deformation behavior, as is shown below:
Hence, the hyperbolic law in the Arrhenius type equation Equation (3) can be taken a natural logarithm as below:
It can be obtained from Equation (9) that the lnA is the intercept of the linear relationship of the lnZ and . Figure 7 presents the linear relationship of the lnZ and and the value of lnA can be determined to be 58.34.
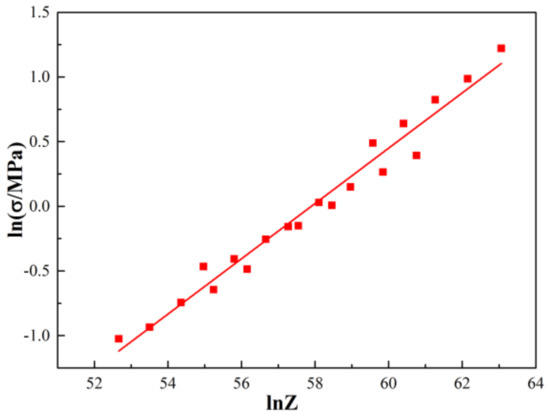
Figure 7.
The relationship between and lnZ.
Based on the experimental results and linear fitting analysis, a constitutive equation that describes the flow stress as a function of the strain rate and deformation temperature for isothermal hot working of Waspaloy was obtained and presented as below:
3.3. Processing Maps
The dynamic material model (DMM) has been employed extensively to study the deformation behavior, the microstructure controlling and the optimization of the processing parameters [21]. On the basis of the DMM, the hot deformation behavior of the material can be regarded as a kind of nonlinear energy dissipation. It assumes that the total instantaneous power (P) from the equipment is dissipated by temperature rise and microstructure evolution, which is named content G and co-content J. Most of the instantaneous power (P) was dissipated by the content G via plastic deformation, and then dissipated by co-content J via various mechanisms such as DRV, DRX and phase transformation. Hence, the total instantaneous power (P) can be expressed as [37]:
In which σ and represent flow stress and strain rate respectively. The ratio of dJ/dG is equivalent to the strain rate sensitivity exponent m. Hence, it can be expressed as follows [37]:
J can be expressed as follows:
Generally the value of the m varies with the change of temperature and strain rate. It comes to the minimum value 1 when the material is under the ideal linear dissipative state and then the J comes to the maximum value [36]. Then Jmax can be expressed as Equation (14). By normalizing the instantaneous J with the maximum value, the efficiency of power dissipation η can be expressed as Equation (15).
Based on the Equation (15), the values of the efficiency of power dissipation were obtained under different temperatures and strain rates and the contour map of the power dissipation were presented in Figure 8 at the strain from 0.1 to 0.9. The green regime corresponds to the power dissipation η ranging from 30 to 40%, the blue and red regimes from 40 to 50% and above 50% respectively, and the white regime corresponds to η < 30%.
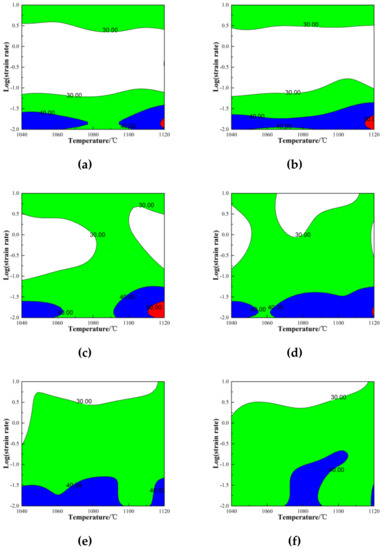
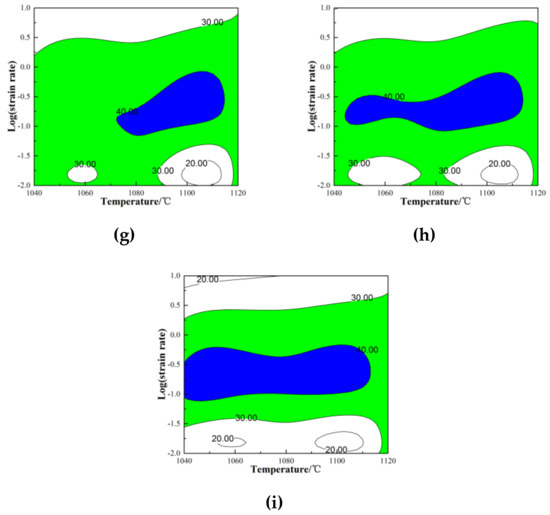
Figure 8.
The processing map of efficiency of power dissipation (%) under strains of 0.1~0.9: The blue regime: 30% < η < 40%, the green regime: 40% < η < 50%, the red regime: η > 50%. (a) ε = 0.1; (b) ε = 0.2; (c) ε = 0.3; (d) ε = 0.4; (e) ε = 0.5; (f) ε = 0.6; (g) ε = 0.7; (h) ε = 0.8; (i) ε = 0.9.
Figure 8 presents that the larger efficiency of power dissipation is prone to appear at lower strain rates (0.01 s−1) at the strains 0.1~0.6. When the strain is over 0.6, the larger efficiency of power dissipation is prone to appear at the strain rates 0.1~1 s−1. The maximum efficiency of power dissipation at the whole deformation occurs around 1120 °C/0.01 s−1 at the strain of 0.3.
Based on the Equations (14) and (15), the instability criterion of the alloy under deformation can be obtained [37]:
The instability criterion in Equation (16) is also a function of temperature and strain rates. The continuum instability criterion given by Equation (16) demands that the material will exhibit flow instability if the dimensionless parameter is negative. The values at different strains were calculated based on the Equation (16) and the contour maps under the strains of 0.1~0.9 were illustrated in Figure 9. The green domains correspond to the flow instability .
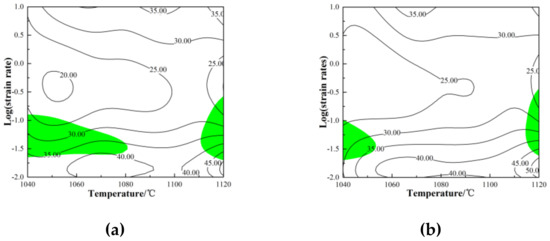
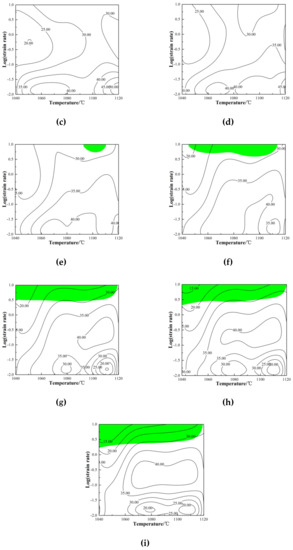
Figure 9.
The processing map of flow instabilities under strains of 0.1~0.9. (a) ε = 0.1; (b) ε = 0.2; (c) ε = 0.3; (d) ε = 0.4; (e) ε = 0.5; (f) ε = 0.6; (g) ε = 0.7; (h) ε = 0.8; (i) ε = 0.9.
Meanwhile, the efficiency of power dissipation increases with the rise of temperature as the recrystallization is a thermally activated process, which is associated with the value of Z and hence it is more conductive to acquire fully recrystallized grains with the increase of temperature. As for the impact of the strain rate to the efficiency of power dissipation, the efficiency of power dissipation is greater as the deformation is under lower strain rate (0.01 s−1) when the strain is below 0.6, resulting from the fact that the traction of the DRX is associated with the dislocation density. The flow stress is proportional to the square root of dislocation density with the equation followed, and hence the critical flow stress was generally used to express the condition of the initial stage of recrystallization. It is prone to attain the critical flow stress when the strain rate is low as the critical flow stress increases with the increasing of the strain rates.
As the hot deformation process is a continuous working process, the flow instability of Waspaloy at different true strains should be considered. Figure 10 illustrates the superimposed processing maps of the flow instability under varying strains. The instability criterion in Equation (16) is also a function of temperature and strain rate. It presents that under the continuous deformation process there are three flow instability domains. The first flow instability regime occurred around 1040–1120 °C/1.5–10 s−1. This means that the high strain rates are not applicable in Waspaloy. The second flow instability regime occurred around 1040–1080 °C/0.02–0.1 s−1. The third flow instability regime occurred around 1110–1120 °C/0.02–0.3 s−1. Thus these flow instability domains should be avoided during deformation process.
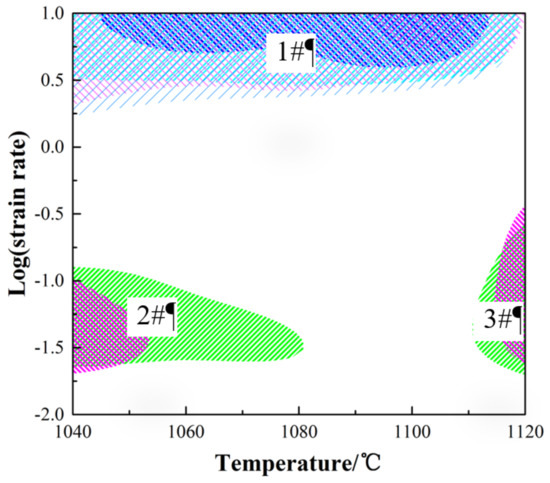
Figure 10.
The processing map under different strains.
Figure 11 presents the microstructure of the sample under different temperatures and strain rates. It can be seen from the figure that there is much more adequate recrystallization with the increase of temperature, which is consistent with the processing map where the efficiency of power dissipation increases with the increase of temperature. It can be obtained from Figure 10 that there are fully recrystallized microstructures under the strain rates of 0.01, resulting from the fact that the power efficiency η under this deformation state is above 30% at the strain below 0.6. The power efficiency η ranging from 30 to 40% corresponds to the DRX process [38]. Concurrently, the fully recrystallized microstructures occur at the temperature of 1120 °C for the same reasons as the power efficiency η is above 30% where the strain is above 0.3.
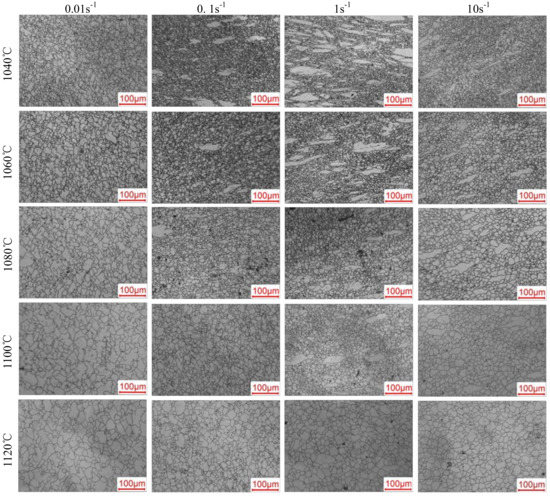
Figure 11.
The microstructures of Waspaloy under different temperatures and strain rates.
As for the strain rates ranging from 0.1 to 1 and temperature ranging from 1040 to 1060 °C the microstructures appear to be severely non-uniform. The power efficiency η presented in Figure 7 appears to be 20 to 30% even at the strain of 0.6. The power efficiency η ranging from 20 to 30% corresponds to the dynamic recovery (DRV) process [38]. Dynamic recovery is the dominating softening mechanism in the hot deformation at this process. Accordingly, these regimes should be avoided to obtain fully recrystallized uniform microstructures.
Based on the combination of processing maps and the microstructures of the Waspaloy under different deformation temperatures and strain rates, the optimum deformation conditions should be determined to be two regimes to obtain the larger power efficiency η to obtain uniform microstructures and avoid the flow instabilities domains. The first regime should be around 1040–1120 °C/0.01 s−1; and the second regime should be around 1080–1100 °C/0.1–1 s−1.
4. Conclusions
The isothermal compressing tests of Waspaloy was carried out under the temperatures ranging from 1000 to 1120 °C and the strain rates ranging from 0.01 to 10 s−1. The constitutive equation and the processing maps were constructed to evaluate the deformation behavior. The following conclusions can be made:
(1) The mathematical expression of the constitutive equation at the peak stress for Waspaloy was obtained and established the constitutive equation which provides a theoretical basis for the forging process. Concluding that the activation energy of deformation is 669.7 kJ/mol. The constitutive equation by which the flow stress is represented as a function of the strain rate and deformation temperature can be described as:
(2) The processing maps consists of efficiency of power dissipation and instability map were established and concluded that larger efficiency of power dissipation is prone to appear at lower strain rates (0.01s−1) when the strains is 0.1–0.6 and at the strain rates 0.1–1 s−1 when the strains is over 0.6. There are three regimes that instability may occur around, 1040–1120 °C/1.5–10 s−1, 1040–1080 °C/0.02–0.1 s−1 and 1110–1120 °C/0.02–0.3 s−1. These flow instability domains should be avoided during the deformation process.
(3) Based on the combination of the processing maps and the microstructures of the Waspaloy under different deformation temperatures and strain rates, the optimum deformation conditions should be determined to be two regimes to obtain the larger power efficiency η, to obtain uniform microstructures and avoid the flow instabilities domains. The first regime should around 1040–1120 °C/0.01 s−1; and the second regime should be around 1080–1100 °C/0.1–1 s−1.
Author Contributions
Conceptualization, D.L. and H.W.; methodology, H.W.; software, H.W.; validation, H.W., J.W. and Y.S.; formal analysis, H.W.; investigation, H.W.; resources, J.W.; data curation, Y.H.; writing—original draft preparation, H.W.; writing—review and editing, H.W.; visualization, D.L.; supervision, J.W.; project administration, D.L.; funding acquisition, D.L.
Acknowledgments
The authors would like to acknowledge the National Natural Science Fundamental of China (No. 51504195) and Fundamental Research Funds for the Central Universities (No.3102015 BJ2MZ20) for the support given to this research.
Conflicts of Interest
The authors declare no conflict of interest.
References
- Chang, K.; Liu, X. Effect of γ′ content on the mechanical behavior of the WASPALOY alloy system. Mater. Sci. Eng. A 2001, 308, 1–8. [Google Scholar] [CrossRef]
- Weber, J.H.; Banerjee, M.K. Nickel-Based Superalloys: Alloying Reference Module in Materials Science and Materials Engineering; Elsevier: Amsterdam, The Netherlands, 2016. [Google Scholar]
- Stone, H.J.; Holden, T.M.; Reed, R.C. On the generation of microstrains during the plastic deformation of Waspaloy. Acta Mater. 1999, 47, 4435–4448. [Google Scholar] [CrossRef]
- Olovsj, S.; Nyborg, L. Influence of microstructure on wear behaviour of uncoated WC tools in turning of Alloy 718 and Waspaloy. Wear 2012, 282, 12–21. [Google Scholar] [CrossRef]
- Oja, M.; Ravi Chandran, K.S.; Tryon, R.G. Orientation Imaging Microscopy of fatigue crack formation in Waspaloy: Crystallographic conditions for crack nucleation. Int. J. Fatigue 2010, 32, 551–556. [Google Scholar] [CrossRef]
- Kelekanjeri, V.S.; Gerhardt, R.A. Characterization of microstructural fluctuations in Waspaloy exposed to 760 °C for times up to 2500 h. Electrochim. Acta 2006, 51, 1873–1880. [Google Scholar] [CrossRef]
- Sinha, N.K.; Sinha, S. High-temperature yield strength and its dependence on primary creep and recovery. Mater. Sci. Eng. A 2011, 528, 5366–5378. [Google Scholar] [CrossRef]
- Attallah, M.M.; Preuss, M. 2-Inertia Friction Welding (IFW) for aerospace applications A2. In Welding and Joining of Aerospace Materials; Woodhead Publishing: Cambridge, UK, 2012; pp. 25–74. [Google Scholar]
- Chamanfar, A.; Jahazi, M.; Gholipour, J.; Wanjara, P.; Yue, S. Maximizing the integrity of linear friction welded Waspaloy. Mater. Sci. Eng. A 2012, 555, 117–130. [Google Scholar] [CrossRef]
- Li, H.; Wang, X.; Wei, D.; Hu, J.; Li, Y. A comparative study on modified Zerilli–Armstrong, Arrhenius-type and artificial neural network models to predict high-temperature deformation behavior in T24 steel. Mater. Sci. Eng. A 2012, 536, 216–222. [Google Scholar] [CrossRef]
- Xiao, X.; Liu, G.Q.; Hu, B.F.; Zheng, X.; Wang, L.N.; Chen, S.J.; Ullah, A. A comparative study on Arrhenius-type constitutive equations and artificial neural network model to predict high-temperature deformation behaviour in 12Cr3WV steel. Comput. Mater. Sci. 2012, 62, 227–234. [Google Scholar] [CrossRef]
- Han, Y.; Qiao, G.; Sun, J.; Zou, D. A comparative study on constitutive relationship of as-cast 904L austenitic stainless steel during hot deformation based on Arrhenius-type and artificial neural network models. Comput. Mater. Sci. 2013, 67, 93–103. [Google Scholar] [CrossRef]
- Peng, W.; Zeng, W.; Wang, Q.; Yu, H. Comparative study on constitutive relationship of as-cast Ti60 titanium alloy during hot deformation based on Arrhenius-type and artificial neural network models. Mater. Des. 2013, 51, 95–104. [Google Scholar] [CrossRef]
- Shao, J.C.; Xiao, B.L.; Wang, Q.Z.; Ma, Z.Y.; Liu, Y.; Yang, K. Constitutive flow behavior and hot workability of powder metallurgy processed 20 vol.%SiCP/2024Al composite. Mater. Sci. Eng. A 2010, 527, 7865–7872. [Google Scholar] [CrossRef]
- Quan, G.; Ku, T.; Song, W.; Kang, B. The workability evaluation of wrought AZ80 magnesium alloy in hot compression. Mater. Des. 2011, 32, 2462–2468. [Google Scholar] [CrossRef]
- Park, N.; Yeom, J.; Na, Y. Characterization of deformation stability in hot forging of conventional Ti–6Al–4V using processing maps. J. Mater. Process. Technol. 2002, 130, 540–545. [Google Scholar] [CrossRef]
- Anil Kumar, V.; Gupta, R.K.; Narayana Murty, S.V.S.; Prasad, A.D. Hot workability and microstructure control in Co20Cr15W10Ni cobalt-based superalloy. J. Alloy Compd. 2016, 676, 527–541. [Google Scholar] [CrossRef]
- Zhang, P.; Hu, C.; Ding, C.; Zhu, Q.; Qin, H. Plastic deformation behavior and processing maps of a Ni-based superalloy. Mater. Des. 2015, 65, 575–584. [Google Scholar] [CrossRef]
- Kong, Y.; Chang, P.; Li, Q.; Xie, L.; Zhu, S. Hot deformation characteristics and processing map of nickel-based C276 superalloy. J. Alloy Compd. 2015, 622, 738–744. [Google Scholar] [CrossRef]
- Liu, Y.; Ning, Y.; Nan, Y.; Liang, H.; Li, Y.; Zhao, Z. Characterization of hot deformation behavior and processing map of FGH4096–GH4133B dual alloys. J. Alloy Compd. 2015, 633, 505–515. [Google Scholar] [CrossRef]
- Jiang, H.; Dong, J.; Zhang, M.; Zheng, L.; Yao, Z. Hot deformation characteristics of Alloy 617B nickel-based superalloy: A study using processing map. J. Alloy Compd. 2015, 647, 338–350. [Google Scholar] [CrossRef]
- Zhu, Y.; Zeng, W.; Feng, F.; Sun, Y.; Han, Y.; Zhou, Y. Characterization of hot deformation behavior of as-cast TC21 titanium alloy using processing map. Mater. Sci. Eng. A 2011, 528, 1757–1763. [Google Scholar] [CrossRef]
- Zhang, W.; Liu, Y.; Li, H.Z.; Li, Z.; Wang, H.; Liu, B. Constitutive modeling and processing map for elevated temperature flow behaviors of a powder metallurgy titanium aluminide alloy. J. Mater. Process. Technol. 2009, 209, 5363–5370. [Google Scholar] [CrossRef]
- Luo, J.; Li, M.; Yu, W.; Li, H. Effect of the strain on processing maps of titanium alloys in isothermal compression. Mater. Sci. Eng. A 2009, 504, 90–98. [Google Scholar] [CrossRef]
- Ghasemi, E.; Zarei-Hanzaki, A.; Farabi, E.; Tesa, K.; JGer, A.; Rezaee, M. Flow softening and dynamic recrystallization behavior of BT9 titanium alloy: A study using process map development. J. Alloy Compd. 2017, 695, 1706–1718. [Google Scholar] [CrossRef]
- Chi, J.; Cai, Z.; Li, L. Optimization of spinning process parameters for long thin-walled cylinder of TC11 alloy based on processing map. Int. J. Adv. Manuf. Technol. 2018, 97, 1961–1969. [Google Scholar] [CrossRef]
- Guo, L.; Yang, S.; Yang, H.; Zhang, J. Processing map of as-cast 7075 aluminum alloy for hot working. Chin. J. Aeronaut. 2015, 28, 1774–1783. [Google Scholar] [CrossRef]
- Yang, Y.; Xie, Z.; Zhang, Z.; Li, X.; Wang, Q.; Zhang, Y. Processing maps for hot deformation of the extruded 7075 aluminum alloy bar: Anisotropy of hot workability. Mater. Sci. Eng. A 2014, 615, 183–190. [Google Scholar] [CrossRef]
- Jenab, A.; Karimi Taheri, A. Experimental investigation of the hot deformation behavior of AA7075: Development and comparison of flow localization parameter and dynamic material model processing maps. Int. J. Mech. Sci. 2014, 78, 97–105. [Google Scholar] [CrossRef]
- Zhang, G.; Zhou, Z.; Sun, H.; Zou, L.; Wang, M.; Li, S. Hot deformation behavior and processing map of a 9Cr ferritic/martensitic ODS steel. J. Nucl. Mater. 2014, 455, 139–144. [Google Scholar] [CrossRef]
- Pu, E.; Zheng, W.; Xiang, J.; Song, Z.; Li, J. Hot deformation characteristic and processing map of superaustenitic stainless steel S32654. Mater. Sci. Eng. A 2014, 598, 174–182. [Google Scholar] [CrossRef]
- Sun, H.M.; Li, M.Q.; Liu, Y.G. Development of processing map coupling grain size for the isothermal compression of 300 M steel. Mater. Sci. Eng. A 2014, 595, 77–85. [Google Scholar] [CrossRef]
- Cheng, Y.; Du, H.; Wei, Y.; Hou, L.; Liu, B. Metadynamic recrystallization behavior and workability characteristics of HR3C austenitic heat-resistant stainless steel with processing map. J. Mater. Process. Technol. 2016, 235, 134–142. [Google Scholar] [CrossRef]
- Chamanfar, A.; Jahazi, M.; Gholipour, J.; Wanjara, P.; Yue, S. Evolution of flow stress and microstructure during isothermal compression of Waspaloy. Mater. Sci. Eng. A 2014, 615, 497–510. [Google Scholar] [CrossRef]
- Nayan, N.; Gurao, N.P.; Narayana Murty, S.V.S.; Jha, A.K.; Pant, B.; George, K.M. Microstructure and micro-texture evolution during large strain deformation of Inconel alloy IN718. Mater. Charact. 2015, 110, 236–241. [Google Scholar] [CrossRef]
- McQueen, H.J.; Ryan, N.D. Constitutive analysis in hot working. Mater. Sci. Eng. A 2002, 322, 43–63. [Google Scholar] [CrossRef]
- Guo, S.; Li, D.; Pen, H.; Guo, Q.; Hu, J. Hot deformation and processing maps of Inconel 690 superalloy. J. Nucl. Mater. 2011, 410, 52–58. [Google Scholar] [CrossRef]
- Srinivasan, N.; Prasad, Y.V. Microstructural control in hot working of IN-718 superalloy using processing map. Metall. Mater. Trans. A 1994, 25, 2275–2284. [Google Scholar] [CrossRef]
© 2019 by the authors. Licensee MDPI, Basel, Switzerland. This article is an open access article distributed under the terms and conditions of the Creative Commons Attribution (CC BY) license (http://creativecommons.org/licenses/by/4.0/).