Article

Intrinsic Ferroelectricity in Charge-Ordered Magnetite

1
Jülich Centre for Neutron Science JCNS and Peter Grünberg Institut PGI, JARA-FIT, Forschungszentrum Jülich GmbH, 52425 Jülich, Germany
2
Department of Materials Science and Engineering, Tel Aviv University, Wolfson Building for Mechanical Engineering, Tel Aviv-Yafo 6997801, Israel
3
Department of Physics, University of Siegen, 57072 Siegen, Germany
4
Deutsches Elektronen-Synchrotron (DESY), 22603 Hamburg, Germany
5
II. Physikalisches Institut, Universität zu Köln, 50937 Köln, Germany
*
Author to whom correspondence should be addressed.
Current address: X-ray Science Division, Argonne National Laboratory, 9700 S. Cass Ave, Argonne, IL 60439, USA.
Crystals 2019, 9(11), 546; https://doi.org/10.3390/cryst9110546
Submission received: 30 September 2019 / Revised: 14 October 2019 / Accepted: 19 October 2019 / Published: 23 October 2019
(This article belongs to the Special Issue Electronic Phenomena of Transition Metal Oxides)

Abstract

:
Single crystalline magnetite Fe3O4 was investigated at low temperatures in the charge ordered state by electric measurements and time-resolved diffraction with voltage applied in-situ. Dielectric spectroscopy indicates relaxor ferroelectric characteristics, with polarization switching observably only at sufficiently low temperatures and in a suitably chosen time-window. PUND measurements with a ms time scale indicate a switchable polarization of about 0.6 µC/cm2. Significant switching occurs only above a threshold field of about 3 kV/mm, and it occurs with a time delay of about 20 µs. The time-resolved diffraction experiment yields, for sufficiently high voltage pulses, a systematic variation by about 0.1% of the intensity of the ( 2 , 2 ¯ , 10 ¯ ) Bragg reflection, which is attributed to structural switching of domains of the non-centrosymmetric C c structure to its inversion twins, providing proof of intrinsic ferroelectricity in charge ordered magnetite.

Graphical Abstract

1. Introduction

Magnetite Fe3O4 is a remarkable transition metal oxide. It is the oldest known magnetic material, indeed it gave rise to the terms “magnetic” and “magnetism”. Furthermore, it also provides the classical example of a metal-insulator transition, which was found in 1939 around 120 K by Verwey [1], who attributed it to a charge ordering (CO) of the iron valences on the B sites of the inverted spinel structure of the compound. The low temperature CO structure of magnetite is extremely complex and has occupied generations of scientists, sparking plenty of controversy, including about the existence of CO [2]. It took more than six decades before the CO crystal structure could be refined in the full C c cell [3]. An analysis of the bond lengths indicated that the extra electrons are not fully localized on the nominal Fe2+ sites, but rather partially delocalized to two neighboring Fe3+ sites, forming so-called “trimerons” . Despite the trimerons, the ionic approximation of integer 2+/3+ valence states of the B-site iron is useful. The corresponding CO, also found by density-functional calculations [4], is shown in Figure 1, with the Fe valences shaded dark and bright, respectively. The CO is almost centro-symmetric—exchanging the valences of only four iron pairs (hued red in the figure) would result in a CO described by P 2 / c symmetry. These four pairs make the overall structure polar, with a polarization P∼5.5 µC/cm2 according to density functional theory (DFT) Berry phase calculations [4] or even higher with the experimental structure and point-charge calculations [3].
If the valence distribution could be switched by an applied electric field, magnetite would be ferroelectric at low temperatures. Ferroelectricity arising from CO is an intriguing concept, because it is intuitively simple (any CO breaking inversion symmetry is automatically polar), could give rise to sizeable polarizations, and is amenable to strong electromagnetic coupling (given that the ions involved in the CO also necessarily have magnetic moments) [5,6]. However, the concept suffers from the lack of unambiguous experimental evidence, with the “proof-of-principle” example of LuFe2O4 [7] having been called into question [8,9,10]. Proof of ferroelectricity in magnetite would thus make this material a unique first example of “ferroelectricity from CO”, on top of being the first magnetic material.
First indications that magnetite might indeed be ferroelectric had been obtained over 40 years ago, although the reports were not fully convincing as, for example, the measured P ( E ) loops did not exhibit saturation and could be explained in terms of artifacts [11,12]. Apart from a few follow-up works mainly in the 80s and 90s [13,14,15,16,17], research on ferroelectricity in magnetite did not generate a lot of interest until recently. The experimental case was strengthened 10 years ago by measurements on a magnetite thin film (150 nm) indicating a switchable polarization below 40 K of up to about 12 µC/cm2 [18]. The switchable polarization was determined with the PUND (positive-up-negative-down) method [19,20], in which two voltage pulses are applied in the positive direction, followed by two pulses in the negative direction. In this method, the switching current is unique to the first and third pulse, whereas ohmic (leakage, ∝E) and capacitive ( d E / d t ) current contributions arise at all pulses equally, allowing the latter to be subtracted. However, the switching current could still be affected by space charge and contact effects. To eliminate some of the contact-related effects, an analysis of time-scales should be performed. Such a study, primarily by dielectric spectroscopy, was presented by Schrettle and coworkers [21], which revealed several relaxation phenomena including interface contributions, but also an apparently intrinsic contribution behaving similar as ac-susceptibility in spin-glass systems. Such behavior is expected for “relaxor ferroelectrics” and ascribed to the freezing of polar nano-domains [22,23]. Even in relaxors, polarization switching should still be observable at sufficiently low temperatures and in a suitable window of time scales. In the study, convincing ferroelectric hysteresis loops with indications of saturation were obtained at 5.6 K with a frequency of 0.5 kHz [21]. However, the indicated switchable polarization was lower, about 0.5 µC/cm2. The recent reports, while strongly indicative of polarization switching, still do not proof intrinsic ferroelectricity, which would require demonstrating that the polar structure actually switches to its inversion twin structure with opposite polarization.
Here, we present a study on a high-quality single crystal of magnetite with a Verwey transition of 122 K as indicated by a narrow peak in the specific heat (Figure 2 top). We performed dielectric spectroscopy and PUND measurements, the latter of which indicate a switchable polarization of about 0.6 µC/cm2, comparable to values found in Reference [21]. Furthermore, we performed a time-resolved X-ray diffraction experiment with voltage pulses applied in-situ. Tracking the integrated intensity of a Bragg reflection, we observe for sufficiently high voltage pulses a systematic variation of the intensity, which demonstrates a structural switching by the applied voltage. Our results indicate that magnetite in the CO state is indeed an intrinsic ferroelectric and may thus serve as a proof-of-principle example of ferroelectricity arising from charge ordering.

2. Results and Discussion

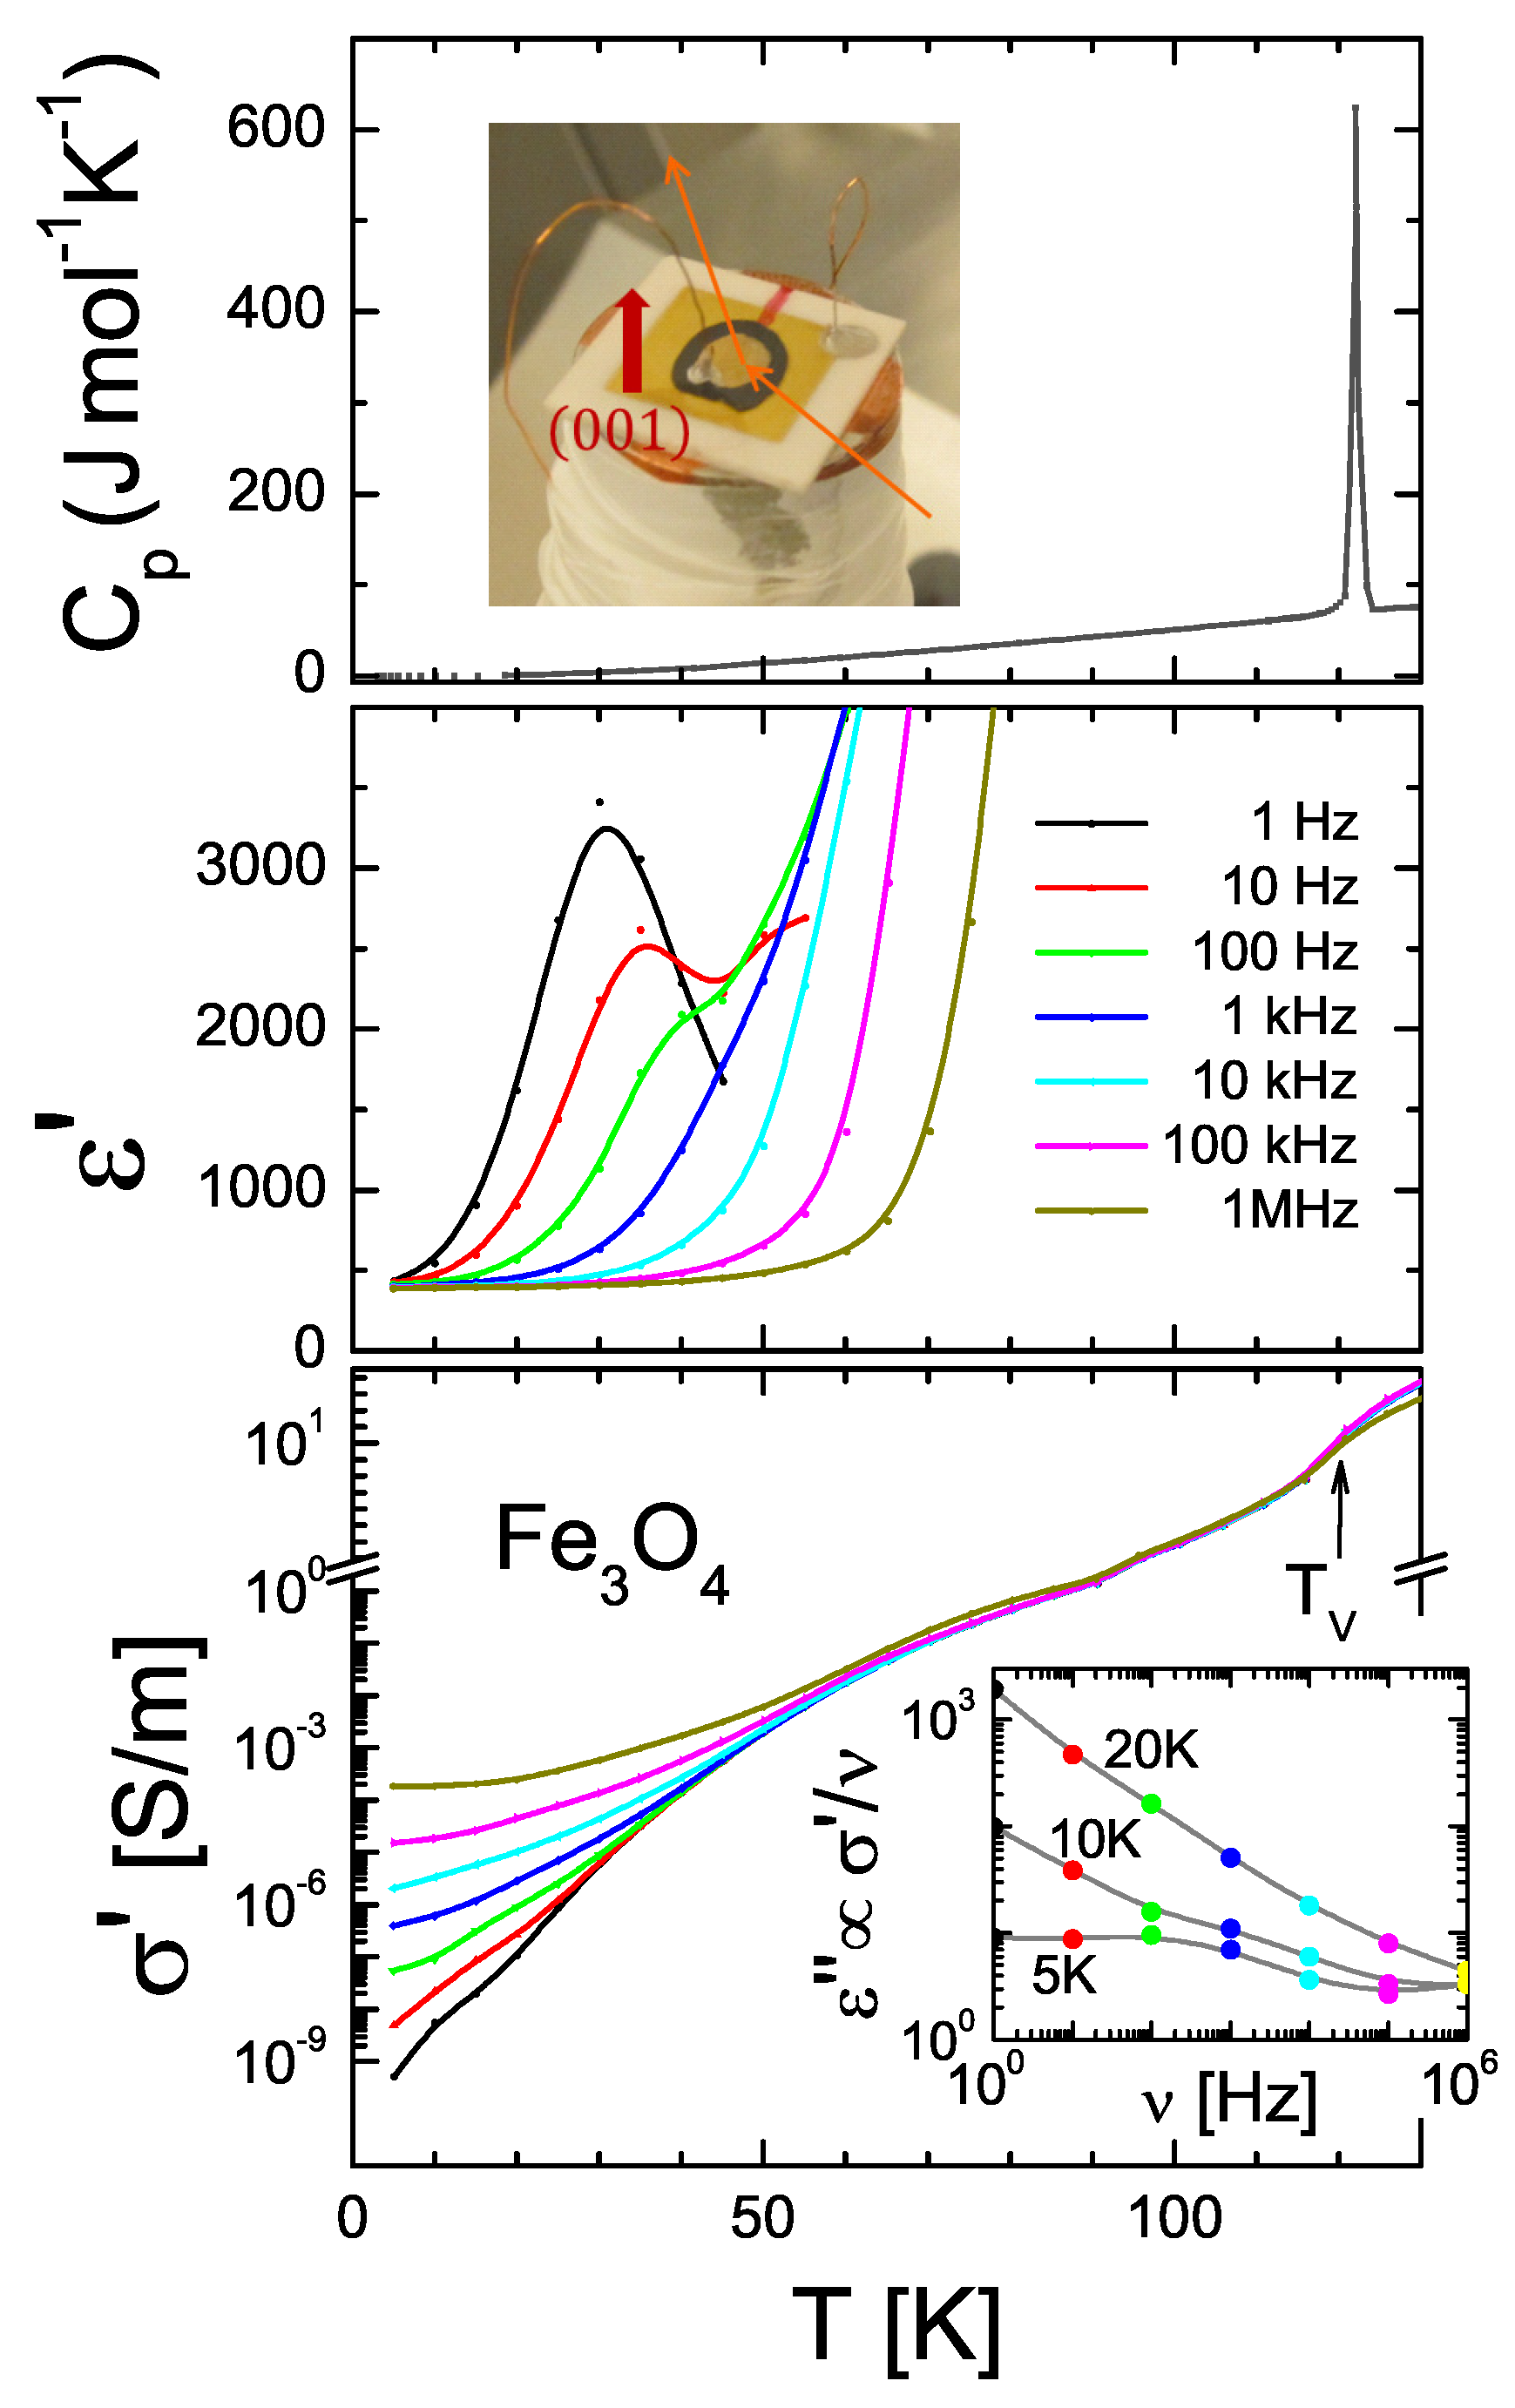
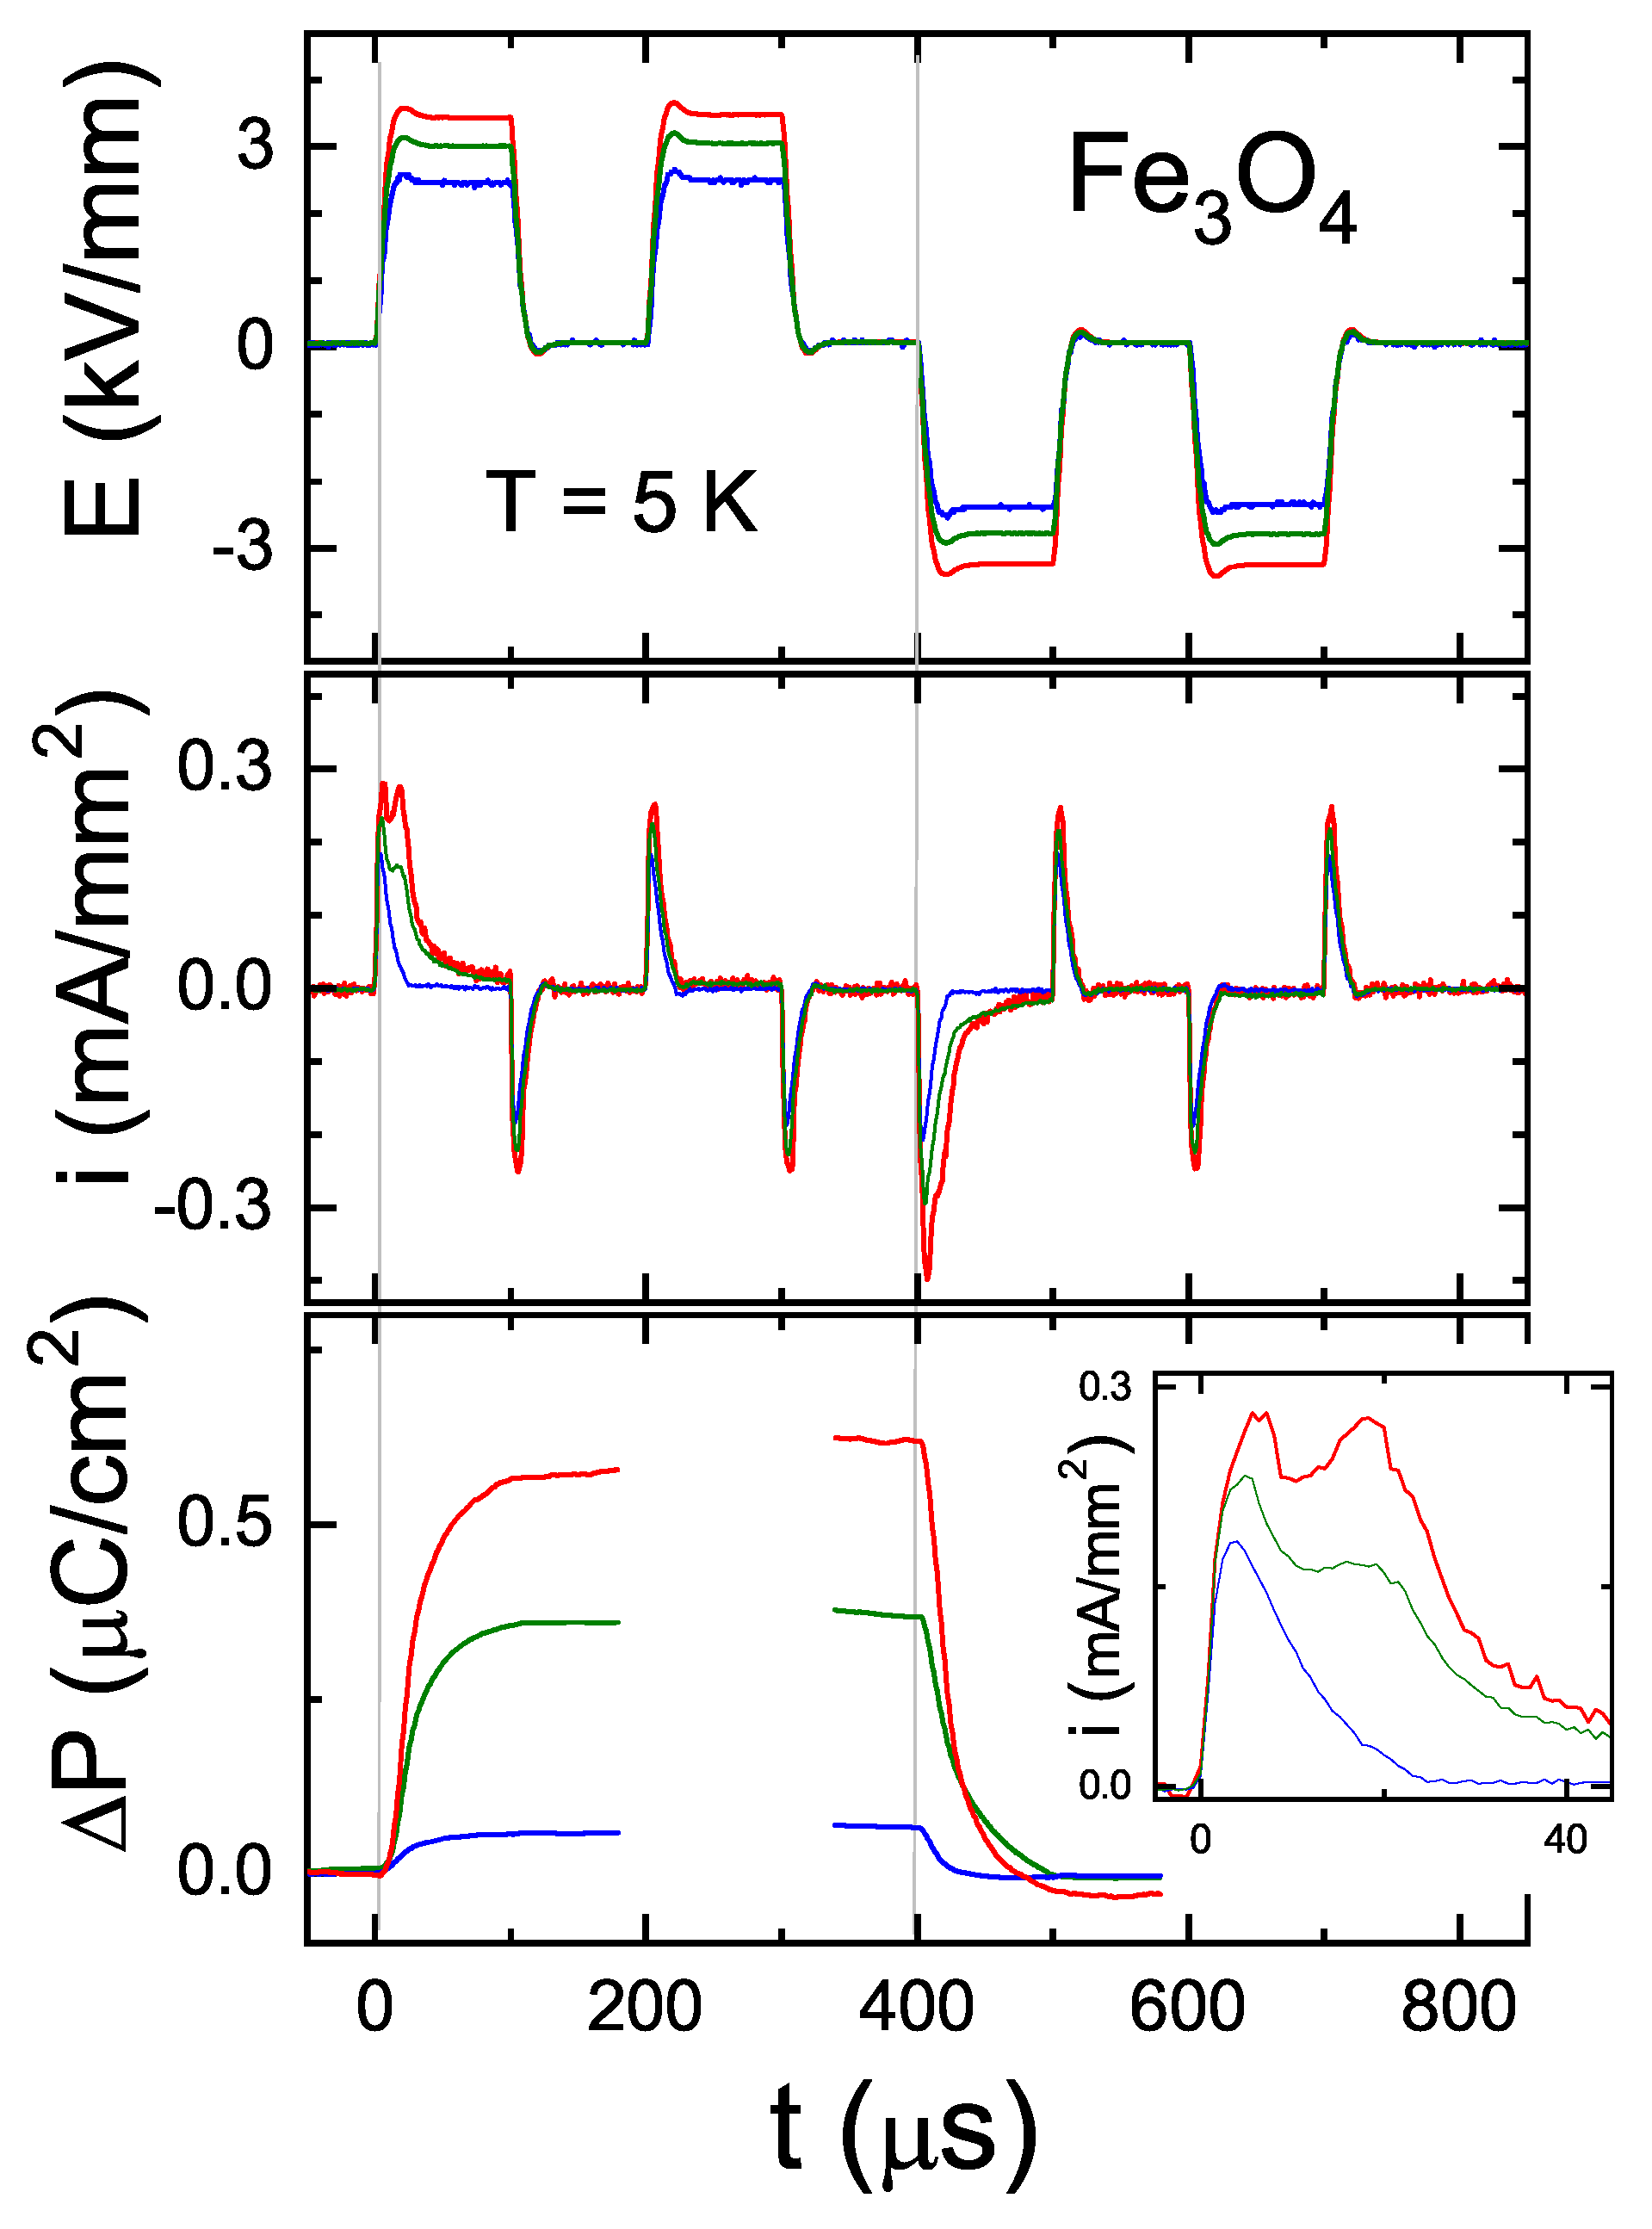
2.1. Macroscopic Characterization

Figure 2 presents the temperature dependence of various quantities, with the narrow peak in the specific heat (top panel) clearly indicating the Verwey transition and the good quality of the sample, particularly concerning the oxygen stoichiometry [24,25]. The middle panel shows the real part of the complex permittivity, ε , measured at various frequencies from 1 Hz to 1 MHz. Overall, these results are rather similar to the dielectric spectroscopy results presented by Schrettle et al. [21]. ε rises very fast to very high values for low frequencies and high temperatures (region above 4000 not shown), which is attributable to Maxwell-Wagner effects [26,27,28,29] and has been similarly observed in many transition metal oxides including, for example, LuFe2O4 [9,30]. The frequency-dependent conductivity σ , related to the imaginary part of the complex permittivity, σ ν ε , is displayed in the bottom panel. In this temperature region above 60 K, where the permittivity is contact dominated, the conductivity σ ( T ) shows no dispersion but is also lowered due to the additional resistive contribution of contacts. Nevertheless, the Verwey transition is visible as a drop in σ (even though less pronounced than in the purely intrinsic σ dc ). For temperatures below 60 K ε ( T ) drops to the nevertheless astonishingly high intrinsic value of about 400 for the higher frequencies. At the same time, the conductivity σ gets frequency dependent for T < 60 K. At low temperatures, σ ( ν ) rises by five orders of magnitude when the frequency is enhanced over 6 decades. This very strong frequency dependence is characteristic of variable-range hopping (VRH), as is also often observed in other oxides [31,32,33]. The frequency dependence is further shown in the inset displaying ε ( ν ) . Whereas at 20 K, the frequency-dependence is close to a straight line in the double-logarithmic plot, denoting ε σ / ν ν s 1 ( 0 < s < 1 ), as expected for VRH , there are clear deviations from this at lower T, particularly at 5 K a peak in the kHz-range seems to be superimposed. These features are related to an emerging second contribution in ε . Below 40 K, a second, non-contact related peak is discernible for not too high frequencies, a peak which becomes larger and shifts to lower temperature as the frequency is lowered. Such behaviour is characteristic of relaxor ferroelectrics [23]. In order to observe signatures of possible polarization switching, the regarded time scale has to be slow enough for the polarization to follow and fast enough to suppress the conductivity related contribution (current leakage) to ε σ / ν . This indicates a window of temperatures (ideally not much above 5 K) and time scales (ideally not much below 1 ms; on the other hand too slow measurements will be strongly affected by current leakage) for further characterization.
Based on the above, we have chosen a temperature of 5 K and a time scale of 1 ms for our PUND [19,20] measurements (Figure 3), a factor of 100 slower than used by Alexe et al. [18]. We applied two positive and two negative pulses of trapezoid shapes with relatively steep flanks, as displayed in the top panel of Figure 3. Shown are the results for three different pulse heights, corresponding to 3.5, 3, and 2.5 kV/mm, displayed in red, green, and blue, respectively. These values are in the range of the coercive field as indicated by the P ( E ) measurements performed at 0.5 kHz by Schrettle et al. [21]. The current-response, shown in the middle panel, is dominated by peaks at the flanks of the pulses and for the second and fourth pulses is very close to simply being proportional to the time-derivative of the electric field. This is thus a capacitive response and has to be expected to be present given that the sample plus electrodes forms a capacitor. Looking closely at the current responses in the middle of the second and fourth pulses, one can see that there is a very small Ohmic contribution (constant current for constant electric field) as well.
Also well visible is that, at least for the higher pulses, there is a significant extra current contribution at the start of the first and the third pulses, that is, where any polarization switching would occur if present (the second and fourth pulses leave the polarization state unchanged). The current response in the starting phase of the first current pulse is magnified in an inset to the bottom panel. The response to the 3.5 kV/mm pulse, remarkably, exhibits two peaks. The first peak at ∼5 µs corresponds to the steepest slope in the rising flank and corresponds to the same capacitive contribution present also at the second pulse. The second, somewhat broader, peak is at around 20 µs and may be attributed to the switching of the polarization, with a time delay corresponding to the time scale of polarization dynamics [34]. In multiferroics with spin-based ferroelectricity this time scale can become relatively slow (ms rather than µs) [35,36]. Hence, the CO based ferroelectricity in magnetite leads to comparatively fast switching dynamics. Therefore, the occurrence of a second time scale is clearly slower than the fast capacitive, and the ohmic response is a clear hint towards switched spontaneous polarization in itself. For the 3 kV/mm pulse, a second peak is still clearly discernible, although greatly diminished in magnitude, while the switching contribution for the 2.5 kV/mm pulse is not readily visible. This is consistent with polarization switching requiring a certain threshold field (the coercive field) to occur, in fact the threshold seems to be sharper than expected for classical relaxor ferroelectrics [23]. The polarization change upon switching is obtained by integrating the switching current (i.e., after subtracting the capacitive and Ohmic contributions that are the same for the second and fourth pulse) and is shown in the bottom panel. The result indicates a switchable polarization of about 0.6 µC/cm2 (the slightly different apparent magnitude at the first and third pulses may be attributed to the relaxation of the polarization on a longer time-scale and different times after the opposite polarization had been established) for the highest applied field of 3.5 kV/mm. This is a value very similar to what was obtained in the polarization loop measurements conducted under similar conditions (same maximum field, 0.5 kHz, 5.6 K) [21]. In addition to the threshold effect and the elimination of capacitive and Ohmic current contributions by the PUND method, we take the switching time delay of about 20 µs as a clear indication that we indeed observe intrinsic polarization switching.

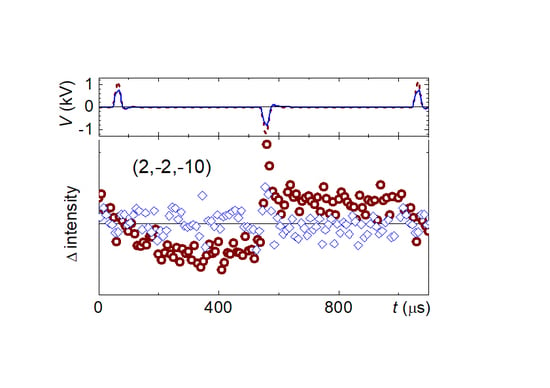
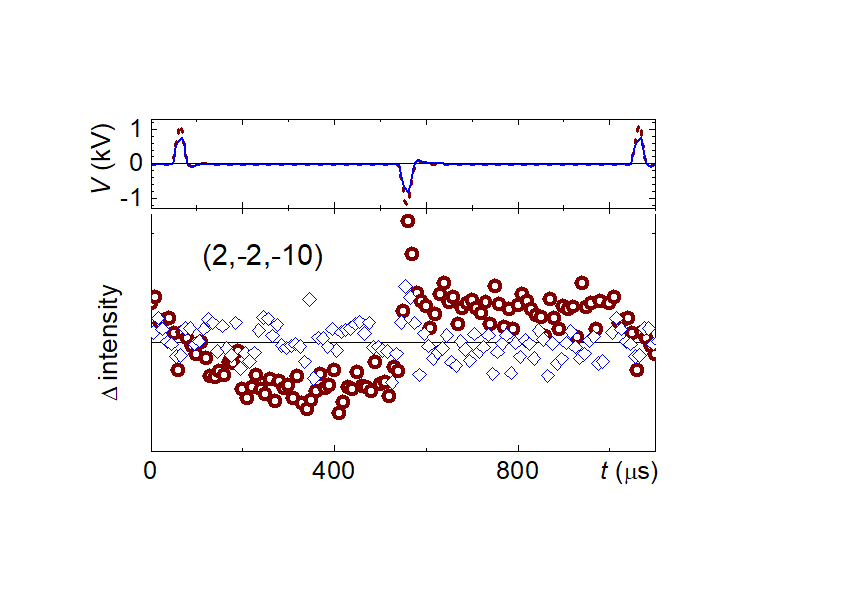
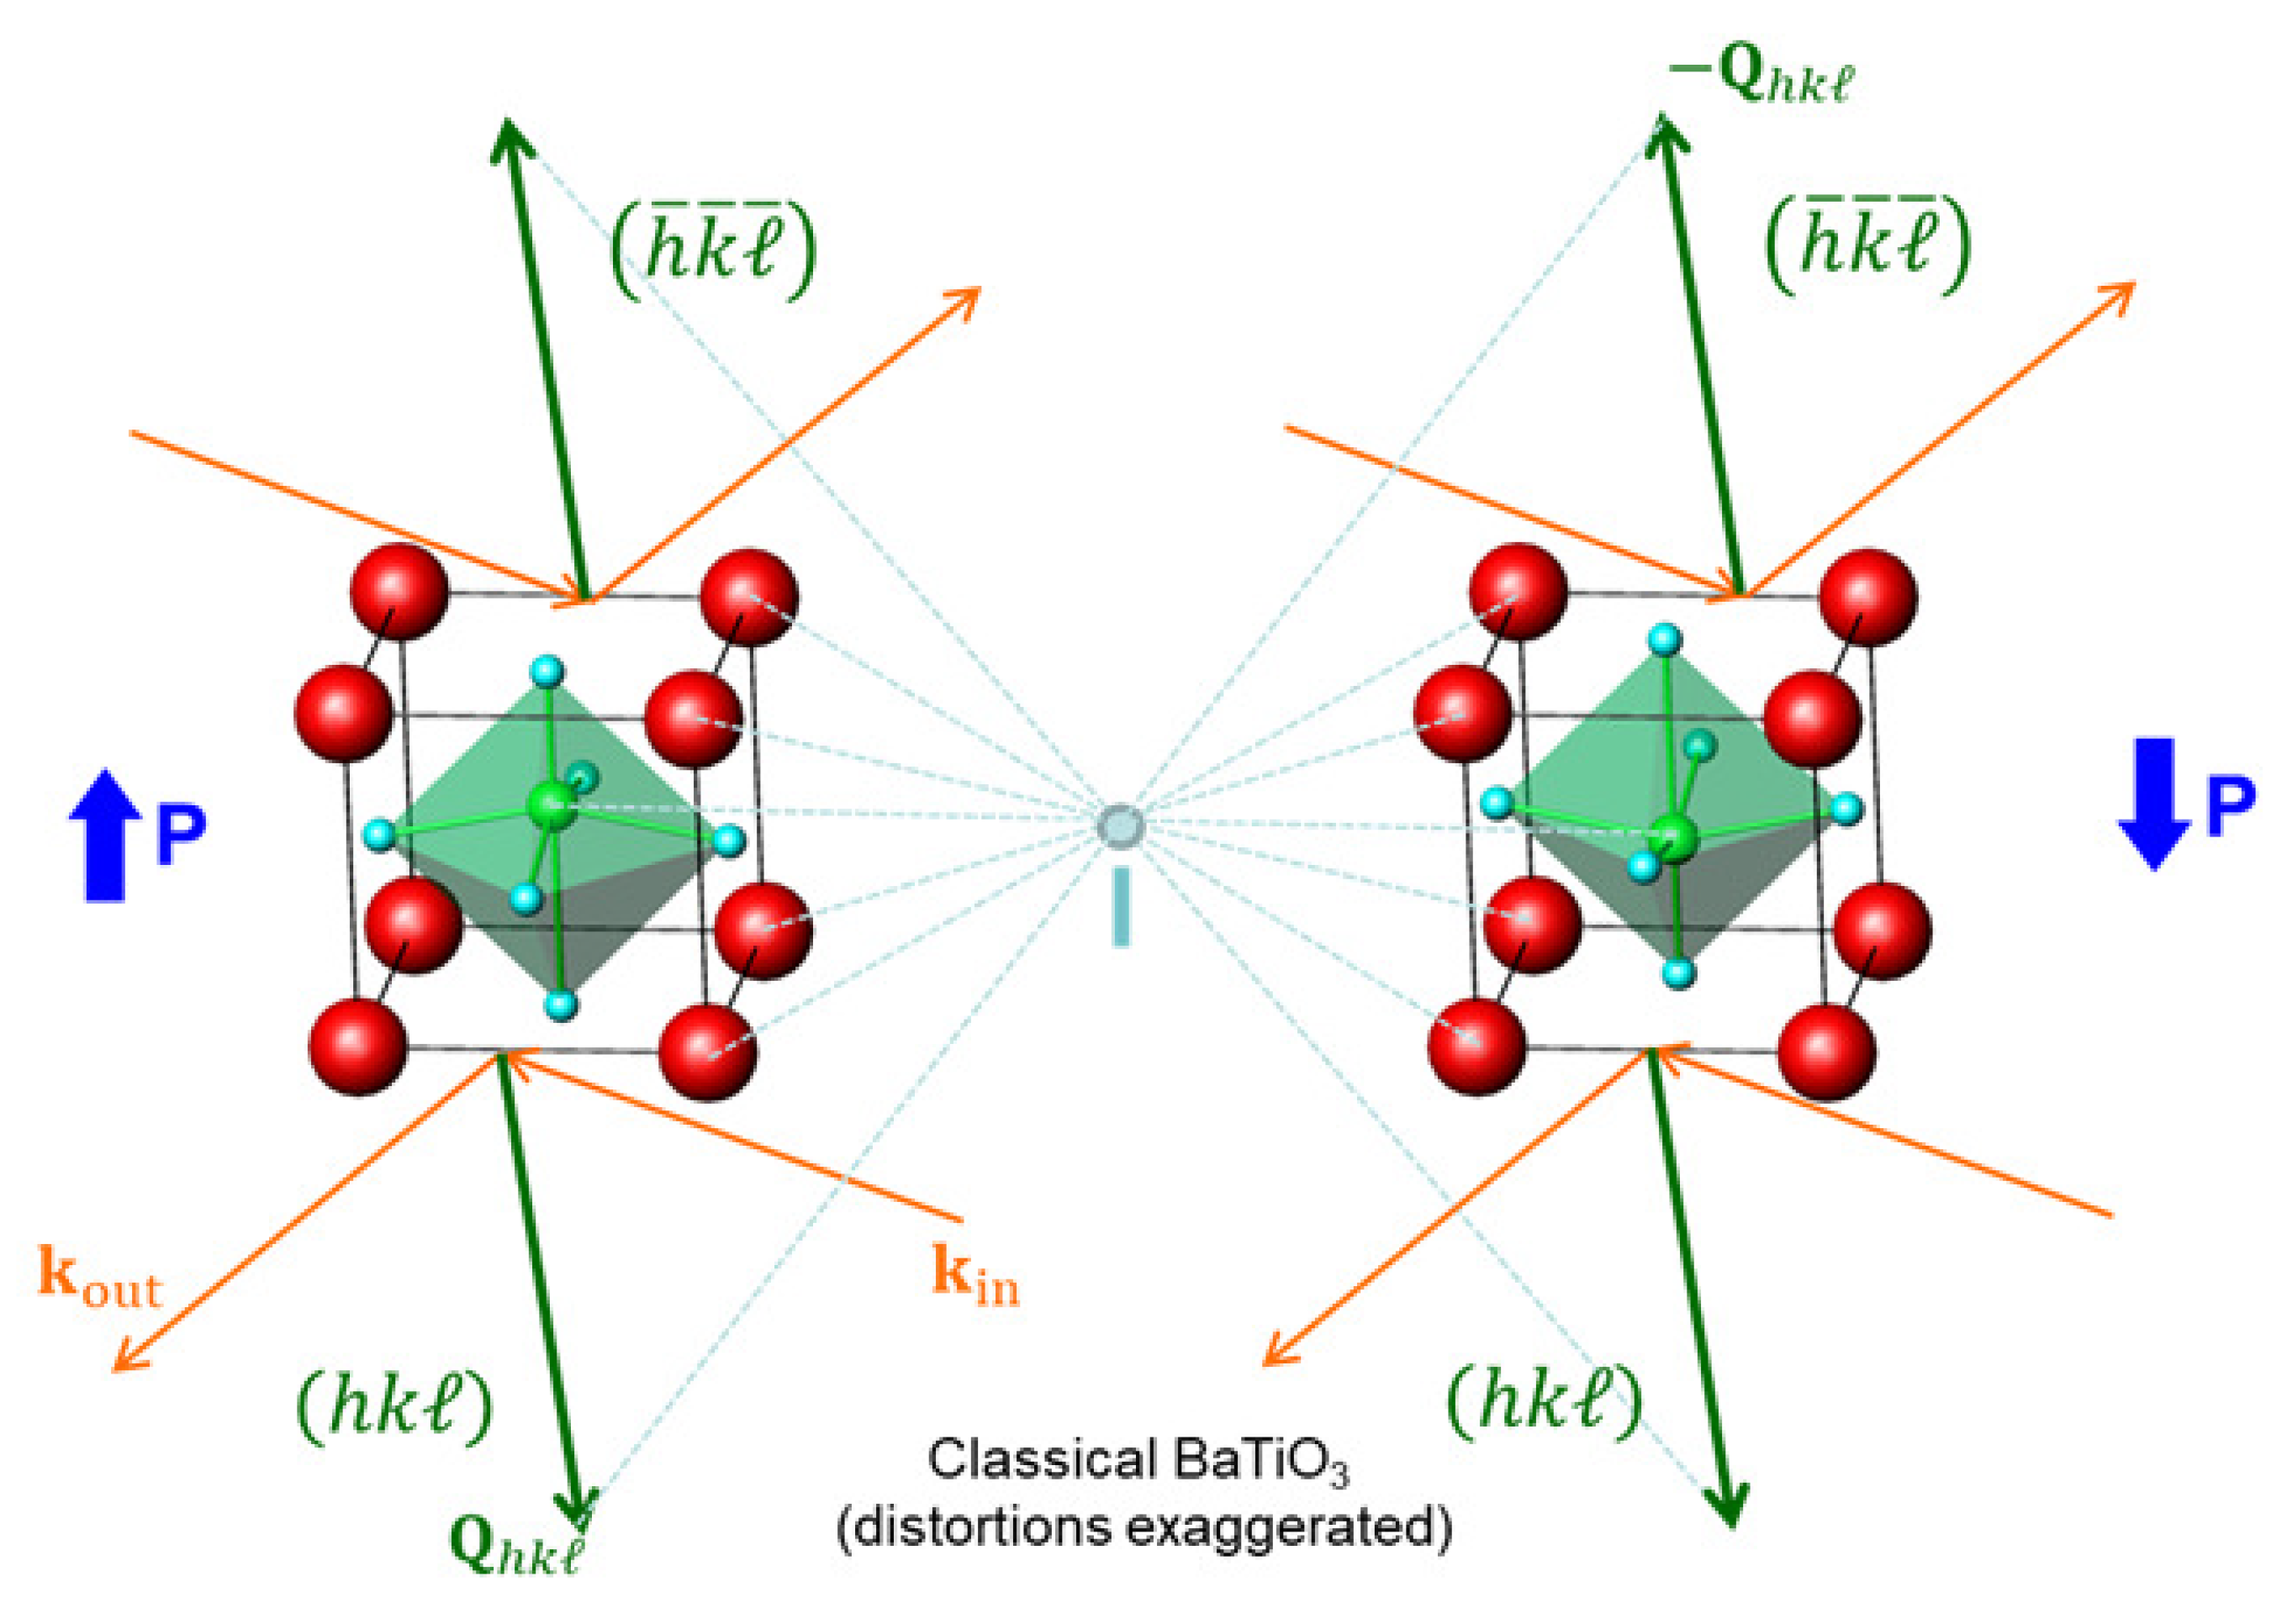
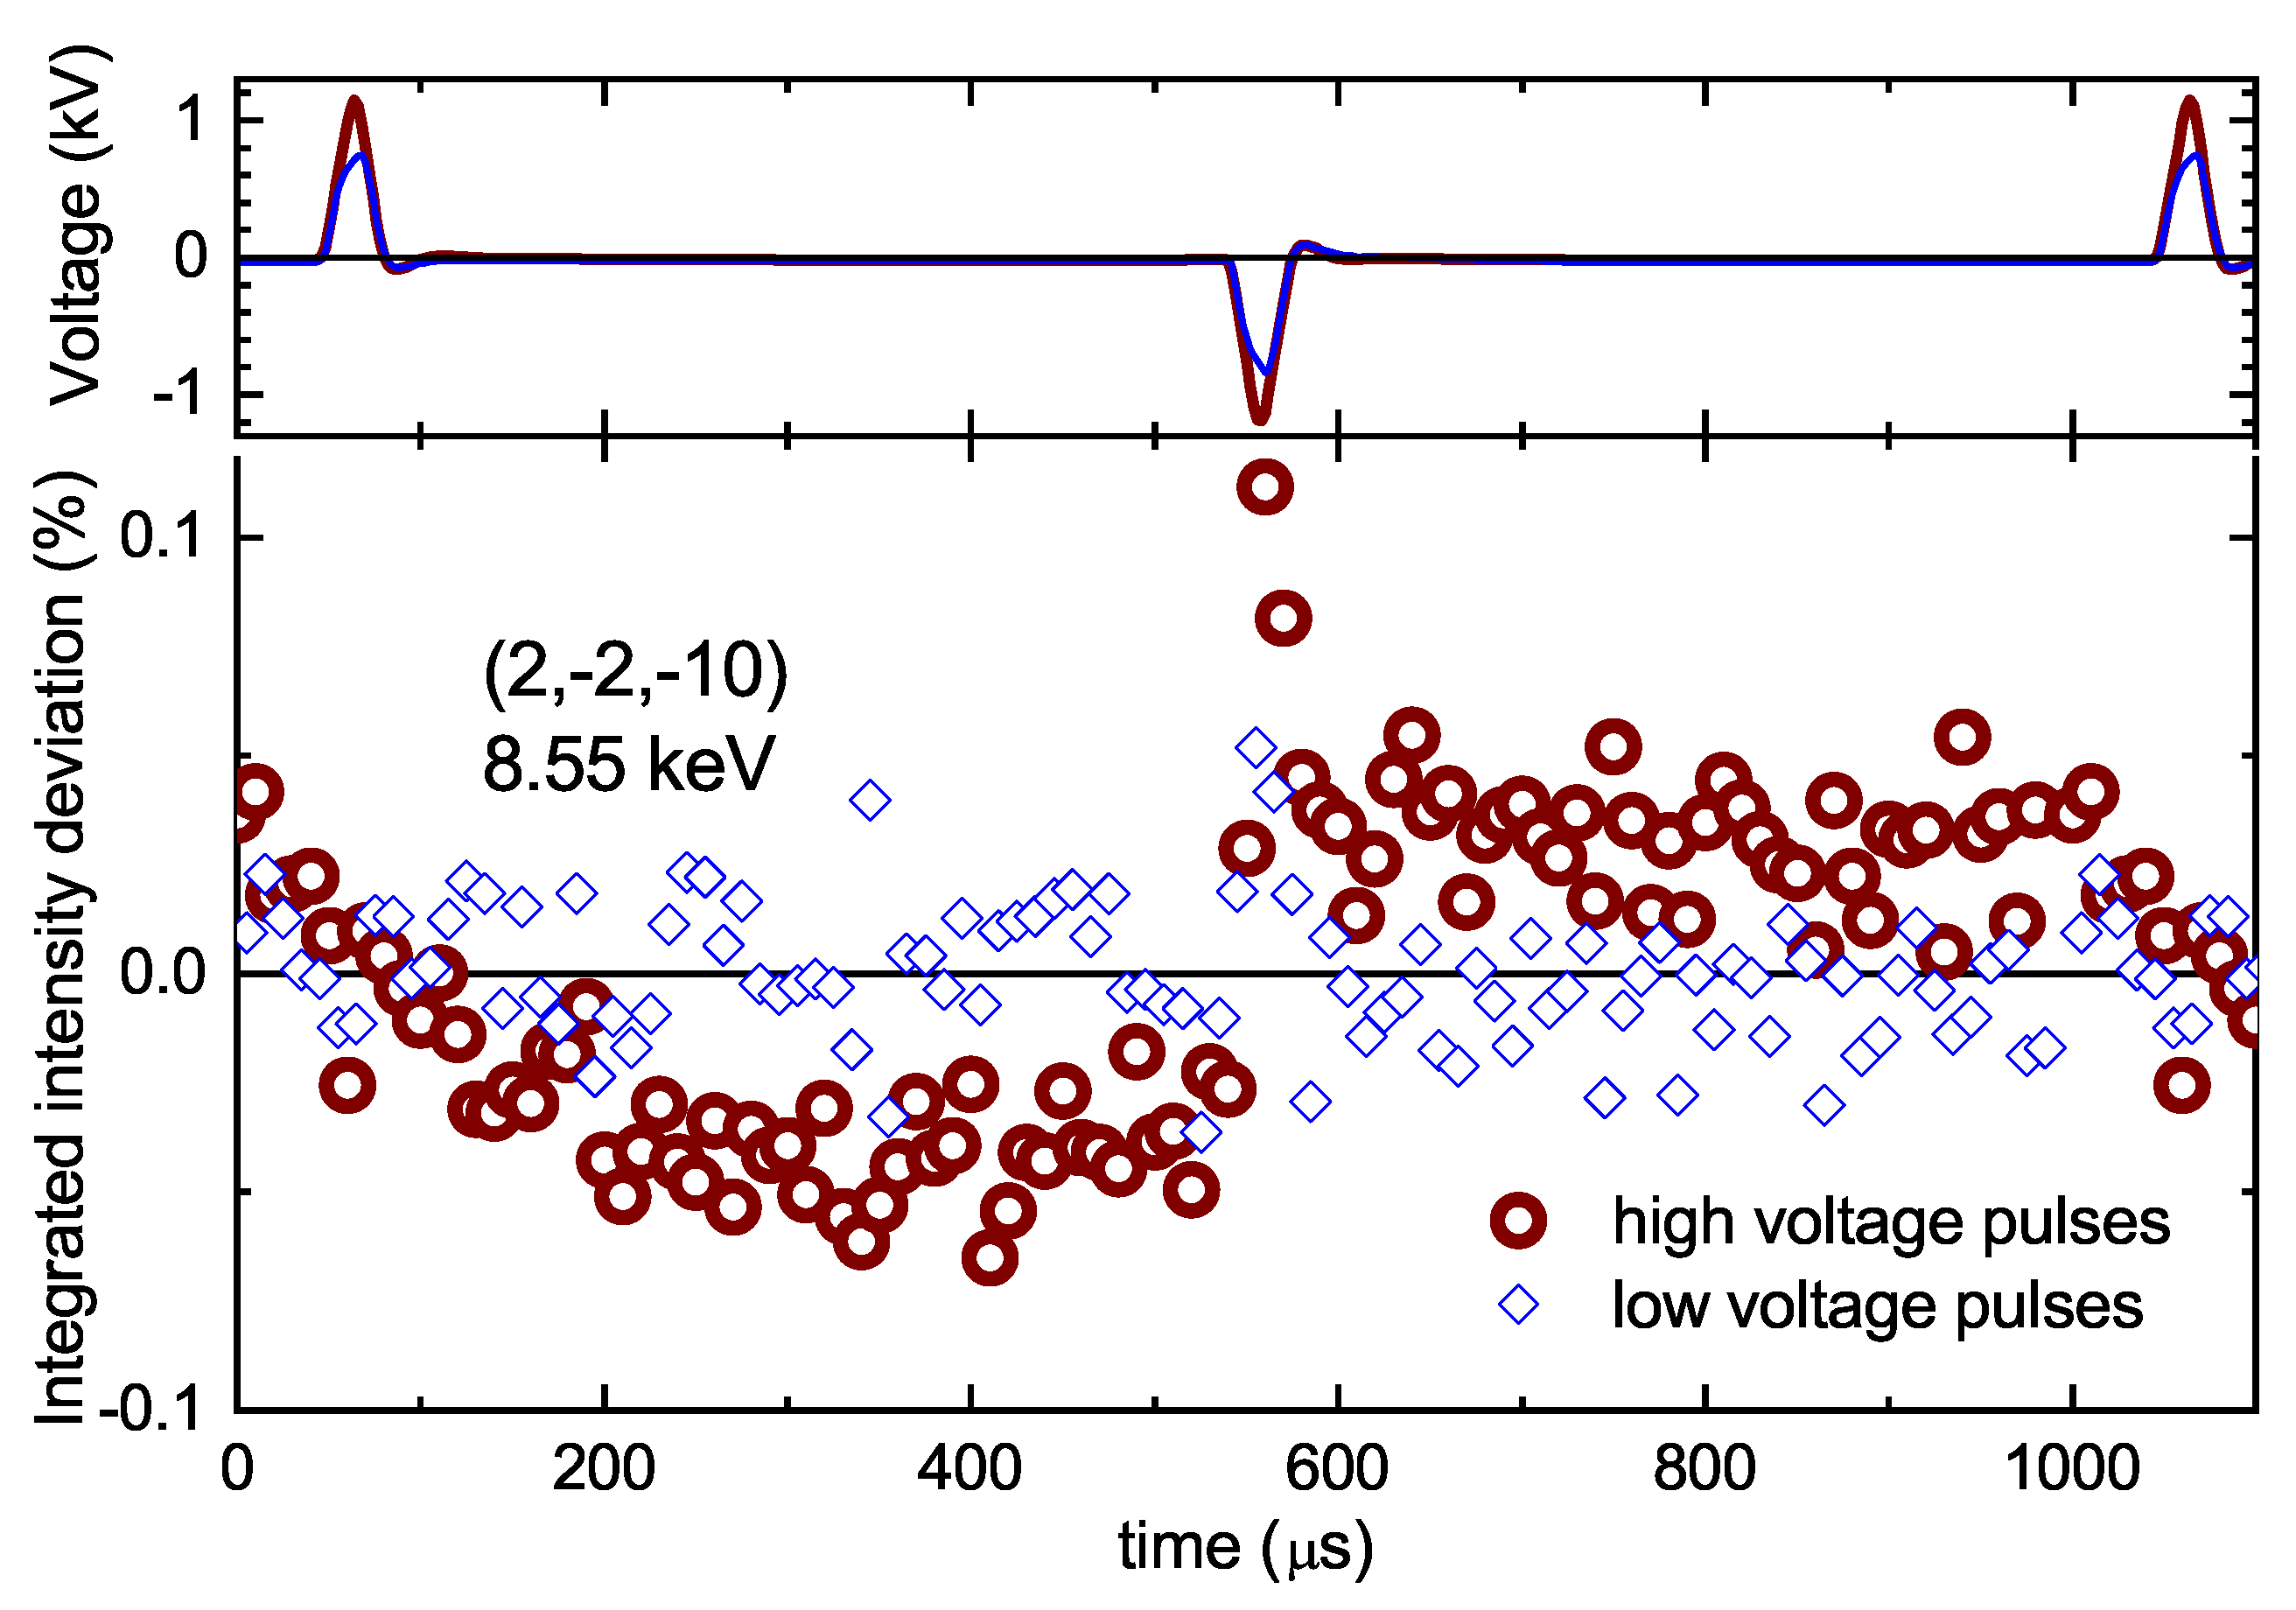
2.2. Time-Resolved X-ray Diffraction with Voltage Pulses Applied In-Situ

However, we still require direct proof of the intrinsic nature of the observed switchable polarization. In an intrinsic ferroelectric, the polarization corresponds to a structural polar distortion, with the state with opposite polarization corresponding to the inversion twin of the structure. For the example of classical ferroelectric BaTiO3 [34], this is sketched in Figure 4, where the polar distortion (off-center displacement of the Ti atom) has been exaggerated. In a diffraction experiment, scattering on some ( h k ) Bragg reflection, going from a non-centrosymmetric structure to its inversion twin has the same effect as inverting the diffraction geometry, that is, incoming and outgoing wavevector and thus also the Q vector, as also indicated in the figure. Thus, switching the polarization of the structure alternatingly forth and back is the same as alternatingly measuring ( h k ) and its Friedel mate ( h k ¯ ). Normally, the Friedel law holds, which states that the intensities of Friedel mates must be equal [37]. However, for non-centrosymmetric structures, the Friedel law holds only in the absence of absorption, that is, when the atomic scattering factors are purely real. Slightly above absorption edges, the atomic scattering factors can acquire a significant imaginary component due to resonant (anomalous) scattering. This breaks the Friedel law and leads to an intensity difference between the Friedel mates, although it will typically be rather small [38]. Thus, with an appropriately chosen photon energy and with application of electric fields in-situ, the switching of the polar structure may be observed as a small change in the intensity of an appropriately chosen Bragg reflection, providing the ultimate direct proof of intrinsic ferroelectricity. This principle has been used successfully by Azimonte et al. [39], who observed an intensity difference of about 5% between the intensities of a reflection on multiferroic DyMn2O5 after applying positive and negative electric fields, respectively. Resonant scattering has also been used to to reconstruct displacement of atoms in BaTiO3-based ferroelectric ceramics during polarization inversion [40]. An intensity difference of about 1% for 111 Bragg reflection was observed for two inversion-related polarization states.
In the case of magnetite, we have several complications, however. First, the CO structure is very complex and the deviation from centro-symmetry of the CO is very subtle [3], corresponding to only four pairs of B-site Fe as indicated in Figure 1. Second, CO in magnetite has 24 domains, with the polar axis pointing in different directions. Polarization switching can be expected only for those domains with the polar axis parallel (or close) to the direction of the applied electric field. Third, and most importantly, given the relaxor characteristics and significant leakage current [21], polarization cannot be expected for static electric fields. Instead, the voltage has to be applied dynamically, within the appropriate time-window, that is, similar to the 1 ms time scale used in the PUND measurements above. The measurements then have to be conducted and time-resolved, with electronic coordination between voltage pulses, detector read-out and diffractometer movements. To this extent, we adapted a setup for time-resolved diffraction, which had been previously used primarily for studying piezoelectric samples, for the synchrotron beamline P09 [41] of PETRAIII [40,42,43,44,45]. We chose a photon energy of 8.55 keV, sufficiently far above the Fe K edge to suppress resonant scattering effects and EXAFS (extended x-ray absorption fine structure) , but close enough to provide for a significant imaginary part of the Fe scattering factor. For this energy, we calculated with JANA2006 [46] the structure factors for many reflections based on the C c model refined by Senn et al. [3], looking for Friedel mates with sufficient absolute as well as relative intensity contrast. Based on these calculations and the geometric restrictions of the experiment, we chose the ( 2 , 2 ¯ , 10 ¯ ) reflection, for which a relative intensity difference of about 2% is expected between Friedel mates assuming that the whole sample switches (see Supplementary Information for details of the calculation).
At first, we mounted the sample with gold contacts on a sapphire plate, which was then fixed on the cold finger of the cryostat, as visible in the photo shown in the top panel of Figure 2. Sapphire insulates the sample electrically from the cryostat while supposedly providing enough thermal conductivity at low T to ensure a good coupling. However, noticing severe heating by the X-ray beam indicated by a large difference between the control thermometer and a thermometer mounted close to the sample, we switched to a direct mount of the sample on the cold finger, fixing this to electrical ground. Still, with the beam on and even more so with applied voltages the sample temperature was increased. To minimize current heating, we applied only small single pulses, as indicated in the top panel of Figure 5, rather than the PUND pulse train employed for the macroscopic measurements (Figure 3 top). During the measurements shown in Figure 5, the thermometer close to the sample displayed between 6 and 7 K, but the real sample temperature was likely higher, perhaps even exceeding 10 K.
During switching, the position of the Bragg reflection may slightly move due to piezoelectricity [40,45]. In order to ensure that at each time the full integrated intensity is obtained, we used a wide open detector and collected a full time-resolved rocking curve. For each rocking angle, the voltage pulses were applied, with the time-resolved detector readings binned into 1000 time channels. The results then provide rocking curves for each time channel. We noticed no position shifts of the rocking curve as a function of time, confirming that we indeed obtained full integrated intensities. The time-dependence of the deviation of the intensity of the reflection from its time-average is shown in the bottom panel of Figure 5 for two different pulse heights. For the lower voltage pulse (blue) no systematic intensity variation is discernible. For the higher voltage pulse (brown), however, a systematic time-dependence, correlated to the times of the voltage pulses, is clearly visible. There are some transient effects close to the times of the pulses themselves, which are asymmetric for the positive and negative pulse (c.f. the anisotropy visible in the switching in Figure 3 and in in-situ diffraction experiments on other compounds [40,44]), and which depend on the movements of the atoms switching mechanism [40]. However, the main effect is that, in between the pulses, the intensity is clearly above average in the interval after the application of the negative pulse and below average in the interval after the application of the positive field pulse. Identifying these two regions with the Friedel mates, we observe an intensity difference of about 0.1%.
This is well below the ideally expected 2%, although part of the discrepancy may simply be due to the fact that many of the CO domains will have their polar axes close to perpendicular to the applied electric field and thus will not be expected to switch. The structural effect being significantly lower than calculated for full switching of the ideal structure corresponds to about one order of magnitude lower observed (Figure 3 bottom and similar in Reference [21]) switchable polarization compared to calculated polarizations. There still remains a factor of about two that the intensity variation is lower yet, assuming an approximately equal population of all domains. Two reasons may primarily be responsible. First, the pulses may be too short to lead to the full polarization reversal, given the relatively slow dynamics with 20 µs time delay observed in the PUND measurements (Figure 3 inset). Second, the higher (and not with complete accuracy known) temperature, as further elaborated in Materials and methods. Apart from the nice-looking polarization loop measured at 5.6 K, Schrettle et al. also show a loop measured at 15 K [21]. The latter shows much less clear signs of saturation, indicating that polarization switching is hampered at temperatures elevated to above about 10 K. In addition to the above, the lower value of the intensity difference may arise from a non-equal domain population, which may even suppress the observed intensity difference to zero in the worst case, as detailed in the Supplementary Information.
Despite the magnitude of the effect being significantly lower than calculated based on a full switching of the ideal structure and even lower than expected when taking into account that the switchable polarization observed by PUND measurements (and earlier in polarization loop measurements [21]) is also an order of magnitude lower than calculated, the results shown in Figure 5 provide compelling evidence of structural switching. The intensity difference in the interval between pulses is not related to transient effects, and is much larger than the noise in the data. The sample does not move during the taking of the time-resolved data, and neither do the reflections in reciprocal space (c.f. Figure S1 in Supplementary Information), and there is therefore no explanation other than a redistribution of the weight of (some of) the 24 domains. This should be by the switching of at least parts of the domains with their polarization axis aligned with the direction of the applied field to their inversion twins, corresponding to moving part of the reflection intensity to the inversion twin. This conclusion is reinforced by the observed threshold effect, with the intensity variation gone (or at least much smaller than the noise) with slightly smaller voltage pulses applied. This effect is shared with PUND (Figure 3) and polarization loop measurements and is generally expected for polarization switching. The apparently higher threshold for the in-situ diffraction experiment (∼5.5 kV/mm) may be attributed to the different pulse shape and the higher temperature.

3. Summary

In summary, a high-quality single crystal of magnetite was investigated at low temperatures by electric measurements and time-resolved diffraction with voltage applied in-situ. In accordance with previous investigations, dielectric spectroscopy indicates relaxor characteristics, with polarization switching observable only at sufficiently low temperatures and in a suitably chosen time-window. PUND measurements suggest that a suitable time scale is a cycle of 1 ms, in which case a switchable polarization of about 0.6 µC/cm2 can be distinguished from non-switching contributions to the current response. Significant switching occurs only above a threshold field of about 3 kV/mm, and it occurs with a time delay of about 20 µs. The time-resolved diffraction experiment qualitatively confirms that at least part of the observed switchable polarization is due to structural switching of domains of the non-centrosymmetric C c structure to its inversion twins, that is, by definition intrinsic ferroelectricity of magnetite. Given that the non-centrosymmetric low-temperature structure is associated with charge ordering, these results provide direct evidence of ferroelectricity arising from charge ordering in magnetite. This makes magnetite the long sought after “proof-of-principle” example of a material exhibiting this mechanism of ferroelectricity, adding to its unique position as the oldest known magnetic material and most prominent example of a compound exhibiting a metal-insulator transition. Quantification of the observed structural switching effects, requiring a resolution of the population of the 24 twin domains of the charge ordered structure, would be highly desirable.

4. Materials and Methods

Single crystals of magnetite Fe3O4+δ were grown by the floating-zone method using an image furnace, with the polycrystalline precursor prepared by standard solid-state synthesis. The critical [24,25] oxygen stoichiometry was fine-tuned by a mixed flow of CO and CO2 gases, with the same setup as previously used for other transition metal oxides [47,48]. Growth conditions were optimized based on specific heat measurements, with flows of CO2 of 96 mL/min and CO of 4–4.5 mL/min crystals with sharp Verwey transitions around 122–123 K were obtained (some variation of transition temperatures even within crystals of the same growth batch was observed, similar to growth results in other systems [49]). For electric characterization and the in-situ diffraction experiment, a selected crystal, checked with a real-time Laue Camera, with specific heat shown in Figure 2 upper panel was cut along the (001) direction and polished down to a thickness of about 160 µm. The sample was prepared as plate capacitor with sputtered gold electrodes of 100 nm thickness and an area of about 4 mm2.
Impedance spectroscopy was carried out in a commercial cryo-magnet (physical properties measurement system PPMS QuantumDesign) using a frequency response analyzer (Novocontrol) in a frequency range of 1 Hz < ν < 1 MHz at a stimulus of about 1 Vrms. The pulse measurements were performed in a homemade setup employing an arbitrary waveform generator, a high voltage amplifier (Trek), and an oscilloscope with a 50 Ω HF (high frequency) reference resistor.
The X-ray diffraction experiment was carried out at the beamline P09 at PETRAIII [41], using a photon energy of 8.55 keV. Rocking curves during alignment of the sample at room temperature indicate a mosaic spread of about 0.1° above the Verwey transition. The sample was first mounted on a sapphire plate, which was then fixed on the cold finger of a standard closed-cycle cryostat with a nominal base temperature of about 4 K, as visible in the photo shown in the top panel of Figure 2. Given sample heating problems, we switched to direct mounting of the sample on the cold finger (set to ground) without the sapphire plate. For the time-resolved diffraction experiments we used the data acquisition technique implemented on the basis of a field-programmed gate array (FPGA) system as described in Reference [42], adapted to the synchrotron beamline P09 at PETRAIII. High-voltage electronics (Matsusada) generate the voltage applied to the sample along with digital pulses synchronized with the change in the HV polarities. The digital signals, current diffractometer angles and the signals from the detector are processed by the FPGA . The crystal is illuminated by the X-ray beam at the same time as the periodic high voltage is applied to the crystal. The detector counts were distributed between 10000 time channels synchronized with the applied voltage. In order to track the response to the voltage of a particular Bragg-reflection, a wide-open detector setting was used and a rocking curve performed with 0.025° steps. For each rocking-angle, time-resolved data were collected. Overall, data collection for one Bragg reflection and one specific pulse form takes about 12 h and we therefore focused on the reachable reflection most sensitive to the polarization state according to structure factor calculations. We used the same time scale as the PUND measurements and tried out several pulse forms, settling on the single narrow pulses shown in Figure 5, in order to minimize Joule heating. The sample temperature during measurements was estimated by a thermometer fixed to the cold finger close to the sample. This consistently showed a few degrees higher than the regulation thermometer, in the best case between 6 and 7 K. As the sample thermometer is close to, but not on, the sample, the true sample temperature was likely higher still; we estimate around 11 K. The elevated temperature is due to a combination of (i) the high-voltage leads attached to the sample, (ii) X-ray beam heating, and (iii) resistive heating during the application of the voltage pulses. The X-ray beam heating directly affects the same region of the sample as is probed. For the experimental conditions the information depth is only about 7 µm, and this region may well have been hotter than the rest of the sample given the low thermal conductivity of magnetite [50].

Supplementary Materials

The following are available online at https://www.mdpi.com/2073-4352/9/11/546/s1, Figure S1: rocking curves, Table S1: domains and calculated intensities, supplementary notes.

Author Contributions

Conceptualization, M.A.; investigation and analysis, S.A., M.Z., S.G., J.S. and M.A. (time-resolved diffraction), C.G., M.P. and J.H. (PUND), S.A. (sample preparation and specific heat); writing—original draft preparation, M.A.; writing—review and editing, M.A., J.H., S.G., J.S. and S.A.; visualization, J.H. and M.A.

Funding

This research was funded by the initiative and networking fund of the Helmholtz Association of German Research Centers grant number VH-NG-510. Work in Cologne was funded by the DFG through CRC1238 (DFG:CRC1238, Project B02). Parts of this research were carried out at the light source PETRAIII at DESY, a member of the Helmholtz Association (HGF).

Acknowledgments

We gratefully acknowledge Jörg Perßon for assistance during crystal growth, Stefan Heidbrink for assistance with the high-voltage electronics and data acquisition system used in the in-situ diffraction experiment, Karen Friese for useful discussions and Paul Attfield for providing the results of Reference [3] in cif-format.

Conflicts of Interest

The authors declare no conflict of interest. The funders had no role in the design of the study; in the collection, analyses, or interpretation of data; in the writing of the manuscript, or in the decision to publish the results.

Abbreviations

The following abbreviations are used in this manuscript:
COcharge order
DFTdensity functional theory
EXAFSextended x-ray absorption fine structure
PUNDpositive-up-negative-down
VRHvariable-range hopping
HVhigh-voltage
FPGAfield-programmed gate array
PPMSphysical properties measurement system
HFhigh frequency

References

  1. Verwey, E.J.W. Electronic Conduction of Magnetite (Fe3O4) and its Transition Point at Low Temperatures. Nature 1939, 144, 327. [Google Scholar] [CrossRef]
  2. Garcia, J.; Subias, G. The Verwey transition—A new perspective. J. Phys. Condens. Matter 2004, 16, R145. [Google Scholar] [CrossRef]
  3. Senn, M.S.; Wright, J.P.; Attfield, J.P. Charge order and three-site distortions in the Verwey structure of magnetite. Nature 2012, 481, 173. [Google Scholar] [CrossRef] [PubMed]
  4. Yamauchi, K.; Tetsuya, T.; Piccozzi, S. Ferroelectricity in multiferroic magnetite Fe3O4 driven by noncentrosymmetric Fe2+/Fe3+ charge-ordering: First-principles study. Phys. Rev. B 2009, 79, 212404. [Google Scholar] [CrossRef]
  5. Van den Brink, J.; Khomskii, D.I. Multiferroicity due to charge ordering. J. Phys.: Condens. Matter 2008, 20, 434217. [Google Scholar] [CrossRef]
  6. Angst, M. Charge Order-Driven Multiferroicity. In Multiferroic Materials—Properties, Techniques, and Applications; Wang, J., Ed.; CRC Press, Taylor & Francis Group: Boca Raton, FL, USA, 2016; Chapter 3; pp. 67–97. [Google Scholar]
  7. Ikeda, N.; Ohsumi, H.; Ohwada, K.; Ishii, K.; Inami, T.; Kakurai, K.; Murakami, Y.; Yoshii, K.; Mori, S.; Horibe, Y.; et al. Ferroelectricity from Iron Valence Ordering in the Charge-Frustrated System LuFe2O4. Nature 2005, 436, 1136. [Google Scholar] [CrossRef]
  8. De Groot, J.; Mueller, T.; Rosenberg, R.A.; Keavney, D.J.; Islam, Z.; Kim, J.W.; Angst, M. Charge Order in LuFe2O4: An Unlikely Route to Ferroelectricity. Phys. Rev. Lett. 2012, 108, 187601. [Google Scholar] [CrossRef]
  9. Niermann, D.; Waschkowski, F.; de Groot, J.; Angst, M.; Hemberger, J. Dielectric Properties of Charge-Ordered LuFe2O4 Revisited: The Apparent Influence of Contacts. Phys. Rev. Lett. 2012, 109, 016405. [Google Scholar] [CrossRef]
  10. Angst, M. Ferroelectricity from iron valence ordering in rare earth ferrites? Phys. Status Solidi RRL—Rapid Res. Lett. 2013, 7, 383–400. [Google Scholar] [CrossRef] [Green Version]
  11. Rado, G.T.; Ferrari, J.M. Electric Field Dependence of the Magnetic Anisotropy Energy in Magnetite (Fe3O4). Phys. Rev. B 1975, 12, 5166. [Google Scholar] [CrossRef]
  12. Kato, K.; Iida, S. Observation of Ferroelectric Hysteresis Loop of Fe3O4 at 4.2 K. J. Phys. Soc. Jpn. 1982, 51, 1335–1336. [Google Scholar] [CrossRef]
  13. Kato, K.; Iida, S.; Yanai, K.; Mizushima, K. Ferrimagnetic ferroelectricity of Fe3O4. J. Magn. Magn. Mater. 1983, 31–34, 783. [Google Scholar] [CrossRef]
  14. Miyamoto, Y.; Chikazumi, S. Crystal Symmetry of Magnetite in Low Temperature Phase Deduced from Magnetoelectric Measurements. J. Phys. Soc. Jpn. 1988, 57, 2040. [Google Scholar] [CrossRef]
  15. Miyamoto, Y.; Kameda, T.; Ishihara, S.; Chikazumi, S. Magnetoelectric polarization for twinned crystal of magnetite below 125 K. Ferroelectrics 1989, 93, 301–308. [Google Scholar] [CrossRef]
  16. Miyamoto, Y.; Shindo, M. Magnetoelectric Measurement of Magnetite (Fe3O4) at Low Temperatures and Direct Evidence for Nonexistence of ac Mirror Plane. J. Phys. Soc. Jpn. 1993, 62, 1423. [Google Scholar] [CrossRef]
  17. Miyamoto, Y.; Ishihara, S.; Hirano, T.; Takada, M.; Suzuki, N. Ferroelectricity of magnetite (Fe3O4) observed by means of magnetoelectric effect. Solid State Commun. 1994, 89, 51–54. [Google Scholar] [CrossRef]
  18. Alexe, M.; Ziese, M.; Hesse, D.; Esquinazi, P.; Yamauchi, K.; Fukushima, T.; Picozzi, S.; Gösele, U. Ferroelectric Switching in Multiferroic Magnetite (Fe3O4) Thin Films. Adv. Mater. 2009, 21, 4452–4455. [Google Scholar] [CrossRef]
  19. Scott, J.F.; Kammerdiner, L.; Parris, M.; Traynor, S.; Ottenbacher, V.; Shawabkeh, A.; Oliver, W.F. Switching kinetics of lead zirconate titanate submicron thin-film memories. J. Appl. Phys. 1988, 64, 787–792. [Google Scholar] [CrossRef]
  20. Fina, I.; Fàbrega, L.; Martí, X.; Sánchez, F.; Fontcuberta, J. Chiral Domains in Cycloidal Multiferroic Thin Films: Switching and Memory Effects. Phys. Rev. Lett. 2011, 107. [Google Scholar] [CrossRef]
  21. Schrettle, F.; Krohns, S.; Lunkenheimer, P.; Brabers, V.A.M.; Loidl, A. Relaxor ferroelectricity and the freezing of short-range polar order in magnetite. Phys. Rev. B 2011, 83, 195109. [Google Scholar] [CrossRef] [Green Version]
  22. Bokov, A.A.; Ye, Z.G. Dielectric dispersion and critical behavior in relaxor ferroelectric Pb(Mg1/3Nb2/3)O3-PbTiO3. Appl. Phys. Lett. 2000, 77, 1888. [Google Scholar] [CrossRef]
  23. Cross, L.E. Relaxor ferroelectrics. Ferroelectrics 1987, 76, 241–267. [Google Scholar] [CrossRef]
  24. Shepherd, J.P.; Koenitzer, J.W.; Aragon, R.; Spallek, J.; Honig, J.M. Heat Capacity and Entropy of Nonstoichiometric Magnetite Fe3(1−δ)O4: The Thermodynamic Nature of the Verwey Transition. Phys. Rev. B 1991, 43, 8461. [Google Scholar] [CrossRef] [PubMed]
  25. Aragón, R.; Gehring, P.M.; Shapiro, S.M. Stoichiometry, percolation, and Verwey ordering in magnetite. Phys. Rev. Lett. 1993, 70, 1635–1638. [Google Scholar] [CrossRef]
  26. Maxwell, J.C. Treatise on Electricity and Magnetism, 3rd ed.; Dover: New York, NY, USA, 1991. [Google Scholar]
  27. Wagner, K.W. Zur Theorie der unvollkommenen Dielektrika. Annalen der Physik 1913, 345, 817. [Google Scholar] [CrossRef]
  28. Lunkenheimer, P.; Bobnar, V.; Pronin, A.V.; Ritus, A.I.; Volkov, A.A.; Loidl, A. Origin of apparent colossal dielectric constants. Phys. Rev. B 2002, 66. [Google Scholar] [CrossRef]
  29. Loidl, A.; Krohns, S.; Hemberger, J.; Lunkenheimer, P. Bananas Go Paraelectric. J. Phys.: Condens. Mat. 2008, 20, 191001. [Google Scholar] [CrossRef]
  30. Ruff, A.; Krohns, S.; Schrettle, F.; Tsurkan, V.; Lunkenheimer, P.; Loidl, A. Absence of polar order in LuFe2O4. Eur. Phys. J. B 2012, 85, 290. [Google Scholar] [CrossRef]
  31. Jonscher, A.K. Universal Relaxation Law; Chelsea Dielectrics Press: New York, NY, USA, 1996. [Google Scholar]
  32. Elliott, S.R. Ac conduction in amorphous chalcogenide and pnictide semiconductors. Adv. Phys. 1987, 36, 135. [Google Scholar]
  33. Shklovskii, B.I.; Efros, A.L. Electronic Properties of Doped Semiconductors; Springer: Berlin, Germany, 1984. [Google Scholar]
  34. Merz, W.J. Domain Formation and Domain Wall Motions in Ferroelectric BaTiO3 Single Crystals. Phys. Rev. 1954, 95, 690–698. [Google Scholar] [CrossRef]
  35. Niermann, D.; Grams, C.; Schalenbach, M.; Becker, P.; Bohatý, L.; Stein, J.; Braden, M.; Hemberger, J. Domain dynamics in the multiferroic phase of MnWO4. Phys. Rev. B 2014, 89, 134412. [Google Scholar] [CrossRef]
  36. Grams, C.; Kopatz, S.; Brüning, D.; Biesenkamp, S.; Becker, P.; Bohatý, L.; Lorenz, T.; Hemberger, J. Evidence for polarized nanoregions from the domain dynamics in multiferroic LiCuVO4. Sci. Rep. 2019, 9, 4391. [Google Scholar] [CrossRef] [PubMed]
  37. Friedel, G. Sur les symétries cristallines que peut révéler la diffraction des rayons X. C. R. Acad. Sci. 1913, 157, 1533. [Google Scholar]
  38. Thiessen, P.A.; Molière, K. Über den Einfluß der Absorption auf den Brechungseffekt der Elektronenstrahlen. I. Teil. Messungen des inneren Potentials an den polaren Tetraederflächen der Zinkblende. Annalen der Physik 1939, 34, 449. [Google Scholar] [CrossRef]
  39. Azimonte, C.; Granado, E.; Terashita, H.; Park, S.; Cheong, S.W. Polar atomic displacements in multiferroics observed via anomalous X-ray diffraction. Phys. Rev. B 2010, 81. [Google Scholar] [CrossRef]
  40. Gorfman, S.; Simons, H.; Iamsasri, T.; Prasertpalichat, S.; Cann, D.P.; Choe, H.; Pietsch, U.; Watier, Y.; Jones, J.L. Simultaneous resonant X-ray diffraction measurement of polarization inversion and lattice strain in polycrystalline ferroelectrics. Sci. Rep. 2016, 6. [Google Scholar] [CrossRef]
  41. Strempfer, J.; Francoual, S.; Reuther, D.; Shukla, D.K.; Skaugen, A.; Schulte-Schrepping, H.; Kracht, T.; Franz, H. Resonant scattering and diffraction beamline P09 at PETRA III. J. Synchrotron Rad. 2013, 20, 541–549. [Google Scholar] [CrossRef]
  42. Gorfman, S.; Schmidt, O.; Ziolkowski, M.; von Kozierowski, M.; Pietsch, U. Time-resolved X-ray diffraction study of the piezoelectric crystal response to a fast change of an applied electric field. J. Appl. Phys. 2010, 108, 064911. [Google Scholar] [CrossRef]
  43. Gorfman, S. Sub-microsecond X-ray crystallography: Techniques, challenges, and applications for materials science. Crystallogr. Rev. 2014, 20, 210–232. [Google Scholar] [CrossRef]
  44. Gorfman, S.; Choe, H.; Shvartsman, V.V.; Ziolkowski, M.; Vogt, M.; Strempfer, J.; Łukasiewicz, T.; Pietsch, U.; Dec, J. Time-Resolved X-Ray Diffraction Reveals the Hidden Mechanism of High Piezoelectric Activity in a Uniaxial Ferroelectric. Phys. Rev. Lett. 2015, 114. [Google Scholar] [CrossRef] [Green Version]
  45. Zhang, N.; Gorfman, S.; Choe, H.; Vergentev, T.; Dyadkin, V.; Yokota, H.; Chernyshov, D.; Wang, B.; Glazer, A.M.; Ren, W.; et al. Probing the intrinsic and extrinsic origins of piezoelectricity in lead zirconate titanate single crystals. J. Appl. Crystallogr. 2018, 51, 1396–1403. [Google Scholar] [CrossRef]
  46. Petricek, V.; Dusek, M.; Palatinus, L. Crystallographic Computing System JANA2006: General features. Z. Kristallogr. 2014, 229, 345–352. [Google Scholar]
  47. Mueller, T.; de Groot, J.; Strempfer, J.; Angst, M. Stoichiometric YFe2O4−δ single crystals grown by the optical floating zone method. J. Cryst. Growth 2015, 428, 40. [Google Scholar] [CrossRef]
  48. Hammouda, S.; Angst, M. Growth of layered Lu2Fe3O7 and Lu3Fe4O10 single crystals exhibiting long-range charge order via the optical floating-zone method. J. Cryst. Growth 2019, 521, 50–54. [Google Scholar] [CrossRef]
  49. de Groot, J.; Marty, K.; Lumsden, M.D.; Christianson, A.D.; Nagler, S.E.; Adiga, S.; Borghols, W.J.H.; Schmalzl, K.; Yamani, Z.; Bland, S.R.; et al. Competing Ferri- and Antiferromagnetic Phases in Geometrically Frustrated LuFe2O4. Phys. Rev. Lett. 2012, 108, 037206. [Google Scholar] [CrossRef]
  50. Mo/lgaard, J.; Smeltzer, W.W. Thermal Conductivity of Magnetite and Hematite. J. Appl. Phys. 1971, 42, 3644–3647. [Google Scholar] [CrossRef]
Figure 1. Sketch of the C c cell of magnetite below the Verwey transition. Shown is the iron charge order on the B sites, with the Fe valences in ionic approximation indicated by dark (Fe2+) and bright (Fe3+) shading (A site Fe and O sites are omitted). Fe sites which have the opposite valence in the centrosymmetric P 2 / c model are hued in red. Tetrahedra with “3:1” configuration are colored cyan, those with “2:2” configuration orange. Replotted after Reference [4].
Crystals 09 00546 g001
Figure 2. Temperature dependence of physical properties of the magnetite crystal. Top: Specific heat, with a narrow (FWHM ∼0.85 K) peak at T V = 122 K. The inset shows a photo of the crystal with gold contacts mounted for the diffraction experiment. Middle: Dielectric permittivity ε over 6 decades of frequencies. Bottom: Conductivity for the same frequencies. The inset shows the imaginary part of the permittivity as a function of frequency at selected temperatures. Lines in the middle and bottom panels are B-splines.
Crystals 09 00546 g002
Figure 3. PUND (positive-up-negative-down) characterization of the sample. Top: Applied voltage pulses as a function of time, with three different maximum voltages. Middle: Current-response to the applied voltage. Change in the polarization obtained by integrating the switching part of the current response. The inset shows a magnification of the current response during switching.
Crystals 09 00546 g003
Figure 4. Sketch of the idea of the in-situ diffraction experiment, illustrated with the simpler structure of classical ferroelectric BaTiO3 (with exaggerated polar displacements). To access the Friedel mate ( h k ¯ ) of a Bragg reflection ( h k ) one could invert both incoming and outgoing wavevectors (e.g., on the left). The same effect is obtained by keeping incoming and outgoing wavevectors and instead inverting the structure of the compound by polarization switching (left to right).
Crystals 09 00546 g004
Figure 5. Time-resolved in-situ diffraction experiment. Top: Applied voltage pulses with higher (blue) and lower (brown) maximum voltage. Bottom: Corresponding normalized deviation from average of the integrated intensity of the ( 2 , 2 ¯ , 10 ¯ ) reflection.
Crystals 09 00546 g005

