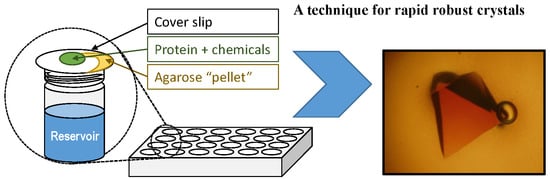
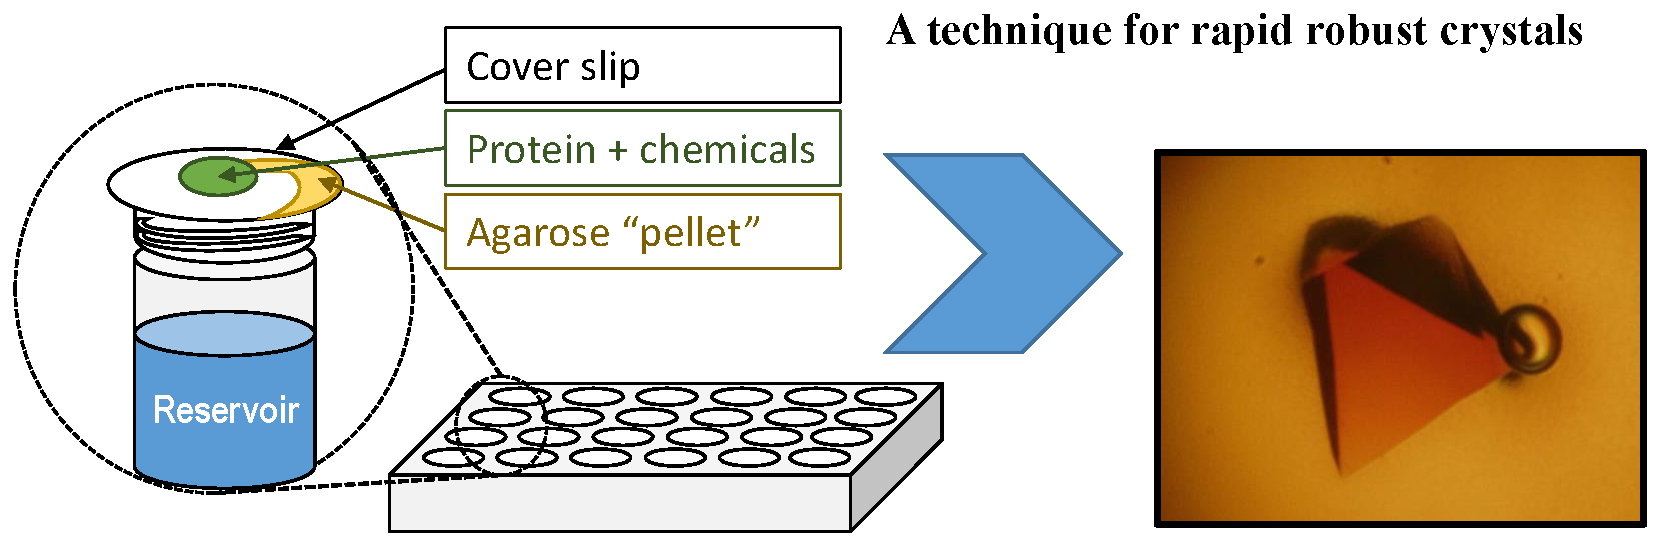
A Simple Technique to Improve Microcrystals Using Gel Exclusion of Nucleation Inducing Elements

 , , , ,
Abstract
1. Introduction
2. Materials and Methods
2.1. Lysozyme
2.2. Proteinase K
2.3. Cubic Insulin
2.4. Ferritin
2.5. Lysozyme Co-Crystallization with Fragment Library
3. Results
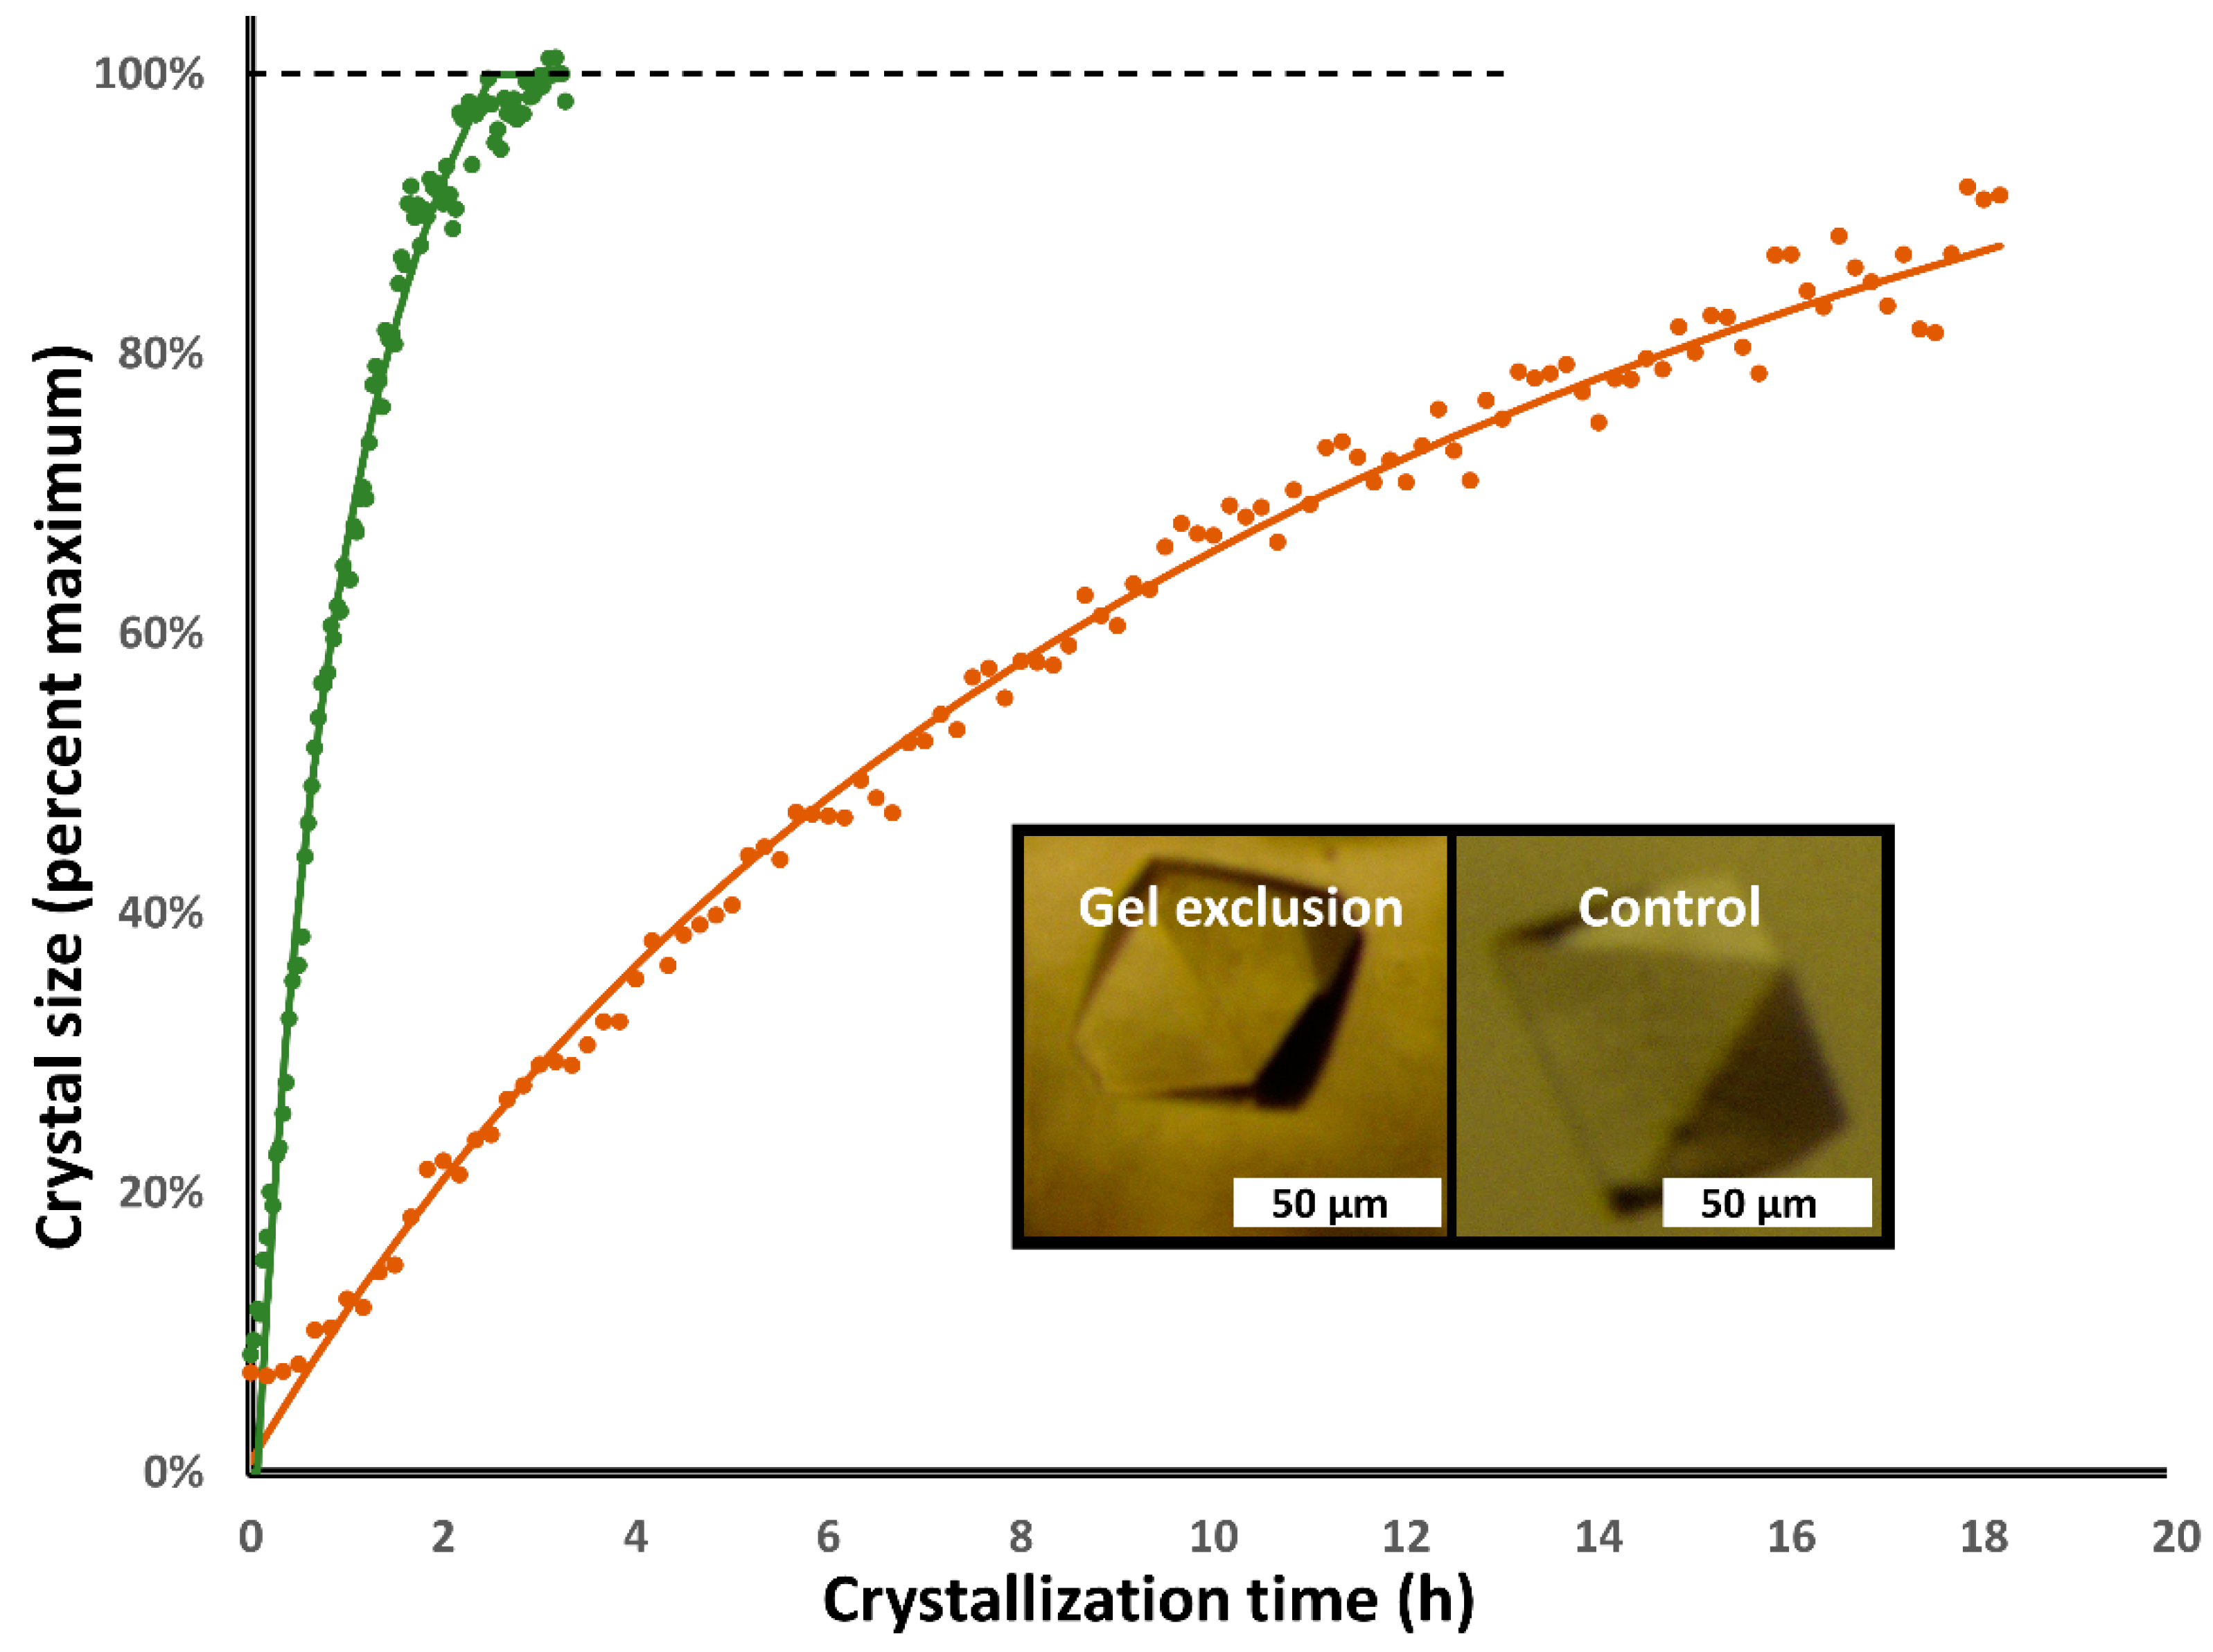
3.1. Lysozyme
3.2. Proteinase K
3.3. Cubic Insulin
3.4. Ferritin
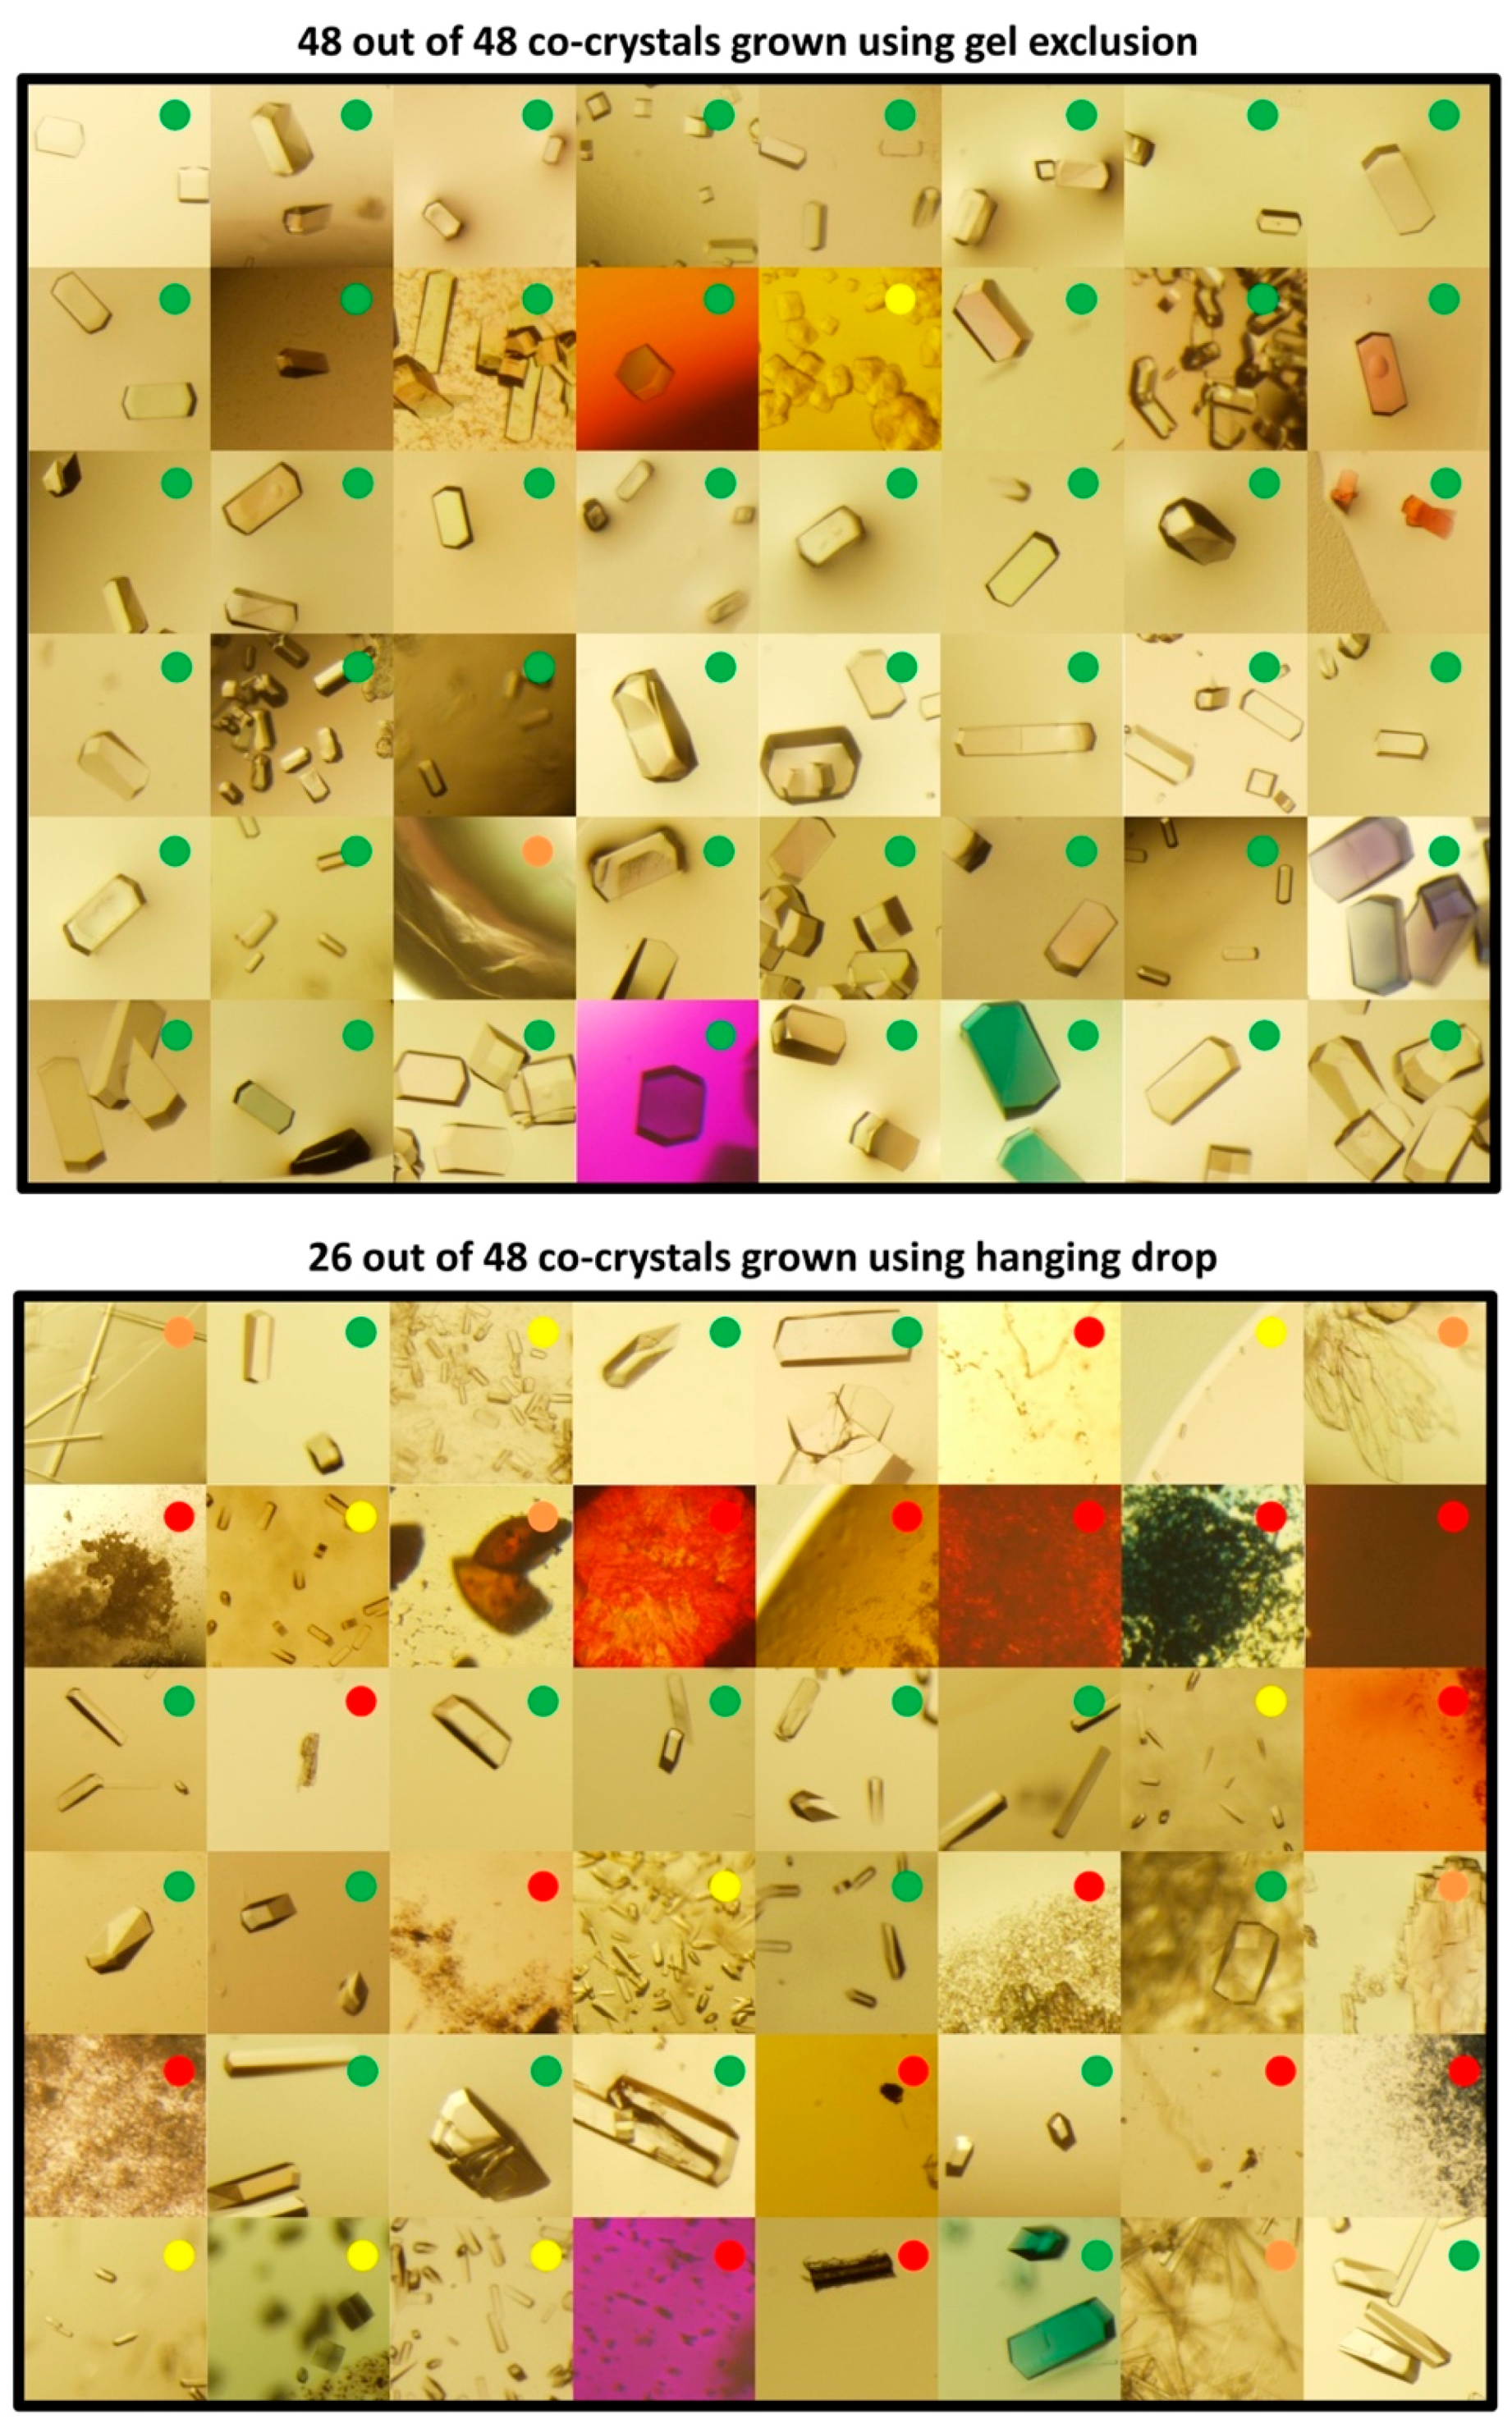
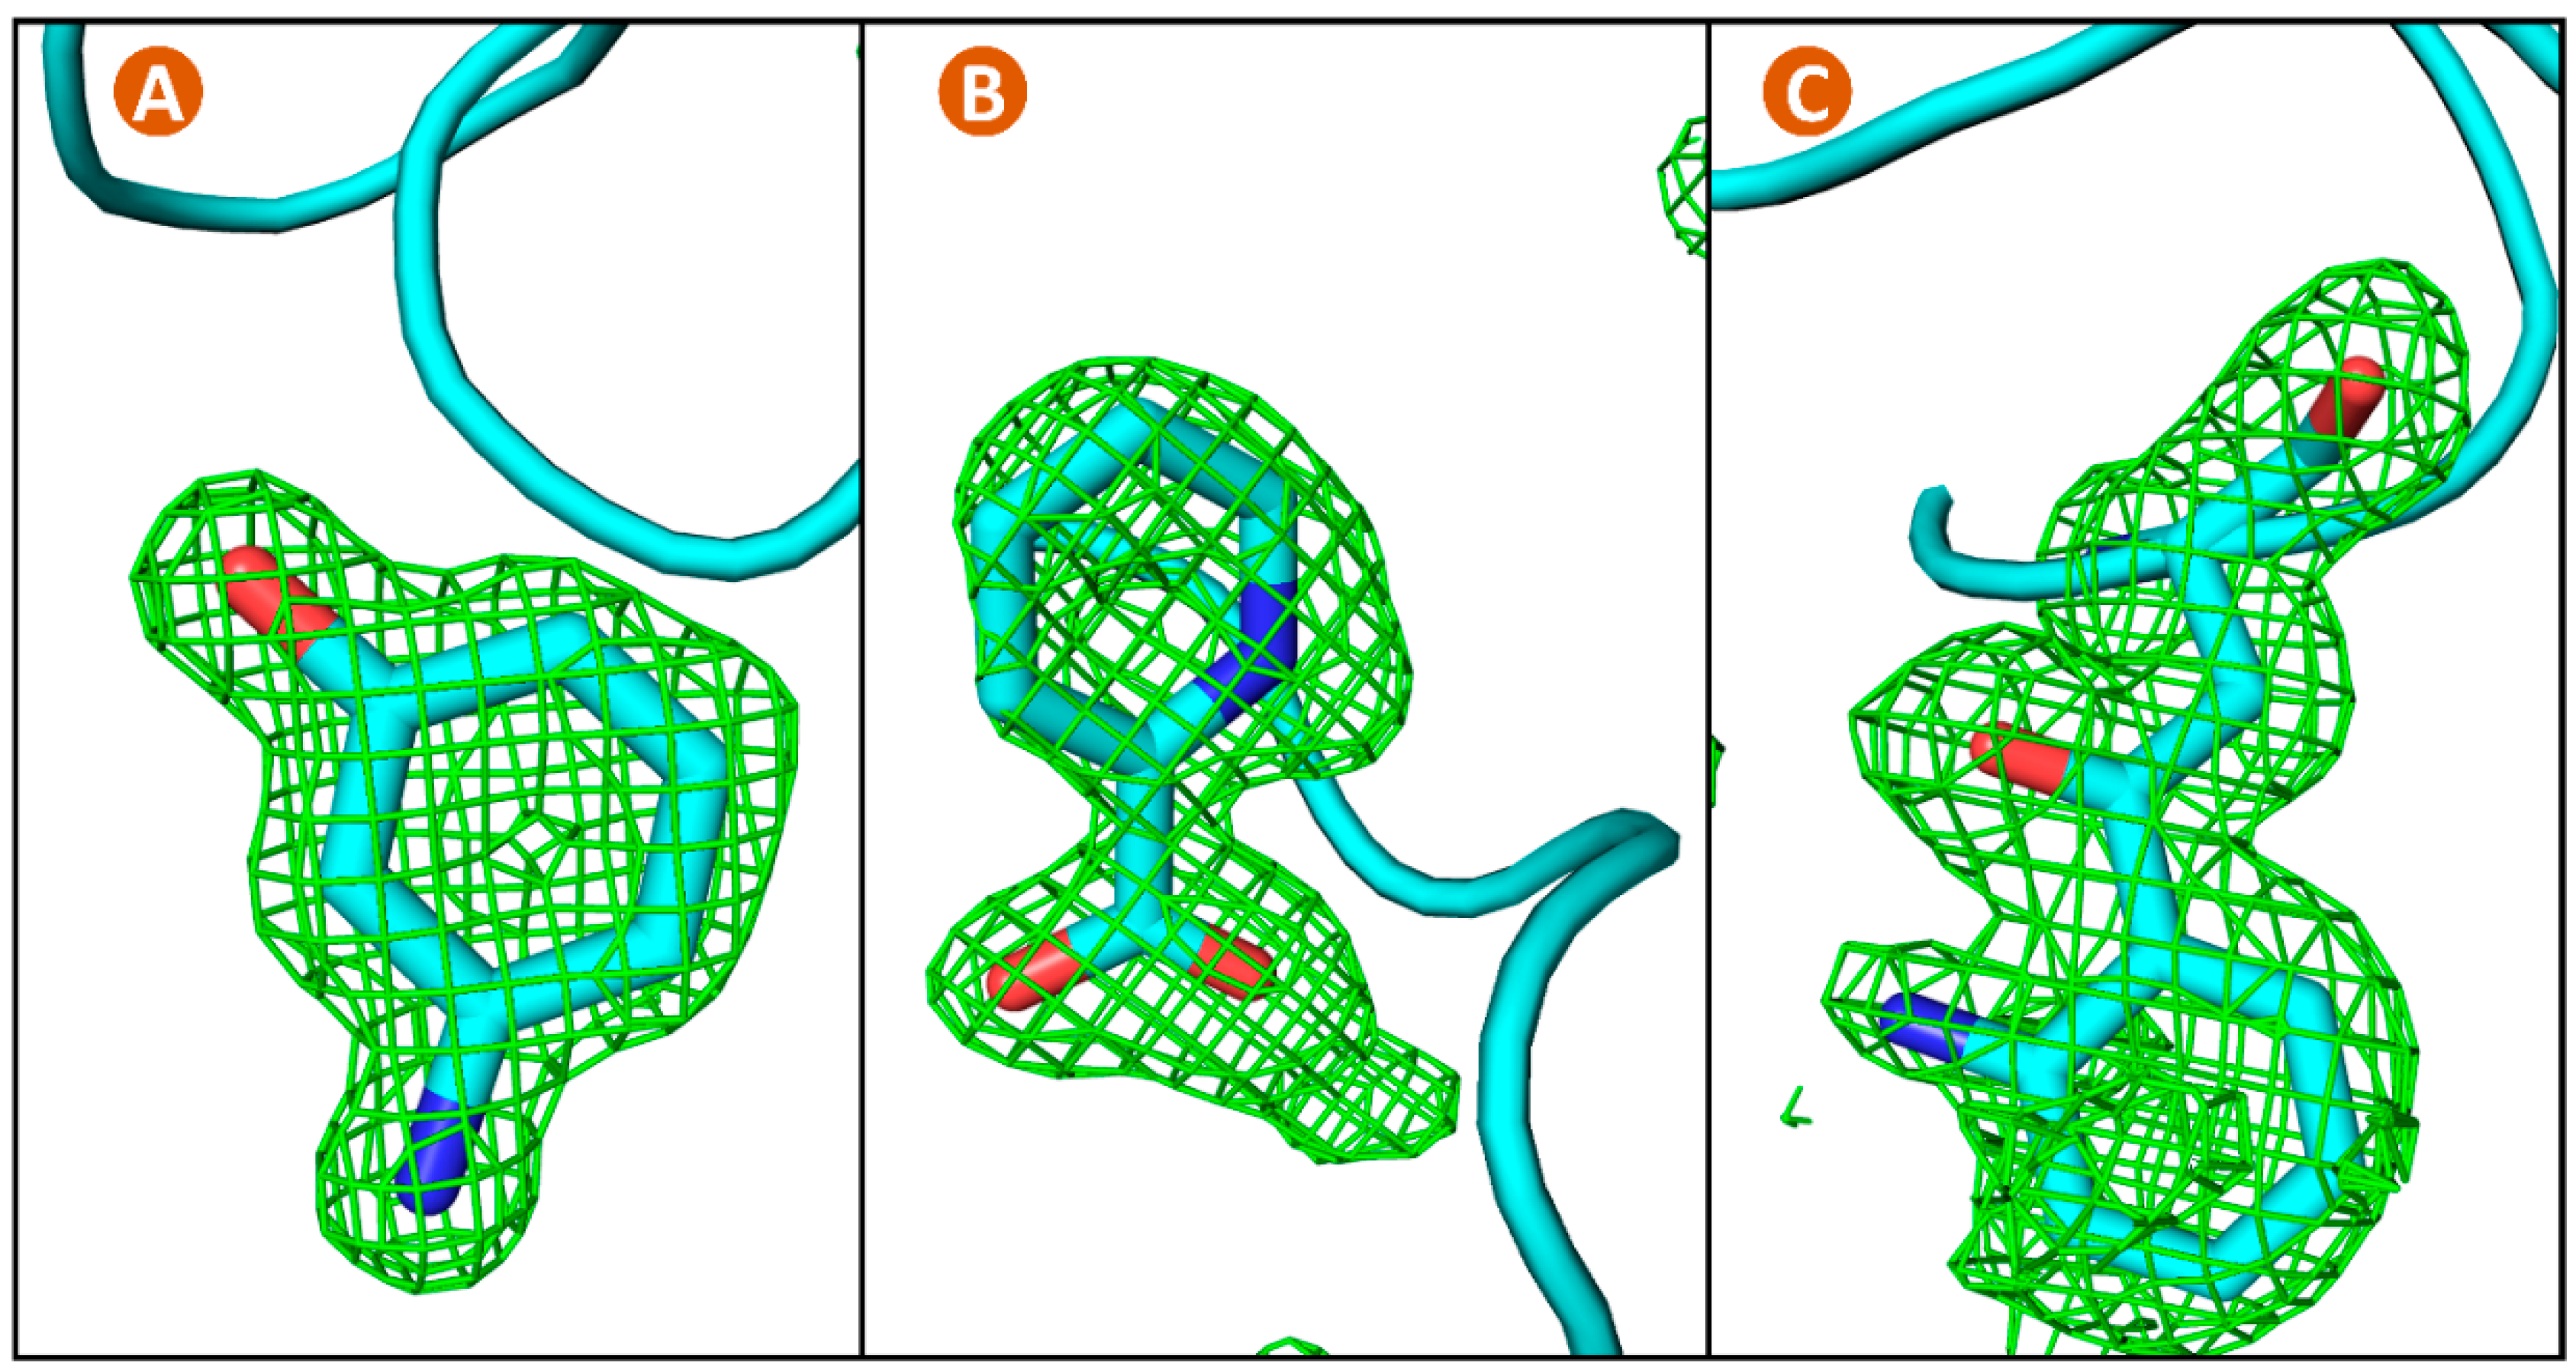
3.5. Lysozyme Co-Crystallization with Fragment Library
4. Discussion
5. Conclusions
Supplementary Materials
Author Contributions
Funding
Acknowledgments
Conflicts of Interest
References
- Lin, Y. What’s happened over the last five years with high-throughput protein crystallization screening? Expert Opin. Drug Discov. 2018, 13, 691–695. [Google Scholar] [CrossRef]
- Chayen, N.E.; Helliwell, J.R.; Snell, E.H. Macromolecular Crystallization and Crystal Perfection; Oxford University Press: Oxford, UK, 2010; Volume 24. [Google Scholar]
- Santesson, S.; Cedergren-Zeppezauer, E.S.; Johansson, T.; Laurell, T.; Nilsson, J.; Nilsson, S. Screening of nucleation conditions using levitated drops for protein crystallization. Anal. Chem. 2003, 75, 1733–1740. [Google Scholar] [CrossRef] [PubMed]
- Ericson, D.L.; Yin, X.; Scalia, A.; Samara, Y.N.; Stearns, R.; Vlahos, H.; Ellson, R.; Sweet, R.M.; Soares, A.S. Acoustic Methods to Monitor Protein Crystallization and to Detect Protein Crystals in Suspensions of Agarose and Lipidic Cubic Phase. J. Lab. Autom. 2016, 21, 107–114. [Google Scholar] [CrossRef] [PubMed]
- Luft, J.R.; DeTitta, G.T. Chaperone salts, polyethylene glycol and rates of equilibration in vapor-diffusion crystallization. Acta Crystallogr. Sect. D 1995, 51, 780–785. [Google Scholar] [CrossRef] [PubMed]
- Stojanoff, V.; Jakoncic, J.; Oren, D.A.; Nagarajan, V.; Navarro Poulsen, J.C.; Adams-Cioaba, M.A.; Bergfors, T.; Sommer, M.O. From screen to structure with a harvestable microfluidic device. Acta Crystallogr. Sect. F 2011, 67, 971–975. [Google Scholar] [CrossRef] [PubMed]
- McPherson, A.; Gavira, J.A. Introduction to protein crystallization. Acta Crystallogr. Sect. F 2014, 70, 2–20. [Google Scholar] [CrossRef] [PubMed]
- Robert, M.C.; Lefaucheux, F. Crystal growth in gels: Principle and applications. J. Cryst. Growth 1988, 90, 358–367. [Google Scholar] [CrossRef]
- Provost, K.; Robert, M.C. Application of gel growth to hanging drop technique. J. Cryst. Growth 1991, 110, 258–264. [Google Scholar] [CrossRef]
- Snell, E.H.; Helliwell, J.R. Macromolecular crystallization in microgravity. Rep. Prog. Phys. 2005, 68, 799. [Google Scholar] [CrossRef]
- McPherson, A. Review Current approaches to macromolecular crystallization. In EJB Reviews 1990; Springer: Berlin/Heidelberg, Germany, 1990; pp. 49–71. [Google Scholar]
- Salemme, F.R. A free interface diffusion technique for the crystallization of proteins for X-ray crystallography. Arch. Biochem. Biophys. 1972, 151, 533–539. [Google Scholar] [CrossRef]
- Gorrec, F.; Löwe, J. Automated Protocols for Macromolecular Crystallization at the MRC Laboratory of Molecular Biology. J. Vis. Exp. 2018. [Google Scholar] [CrossRef] [PubMed]
- Hassell, A.M.; An, G.; Bledsoe, R.K.; Bynum, J.M.; Carter, H.L.; Deng, S.J.; Gampe, R.T.; Grisard, T.E.; Madauss, K.P.; Nolte, R.T.; et al. Crystallization of protein–ligand complexes. Acta Crystallogr. Sect. D Biol. Crystallogr. 2007, 63, 72–79. [Google Scholar] [CrossRef] [PubMed]
- Cole, K.; Roessler, C.G.; Mule, E.A.; Benson-Xu, E.J.; Mullen, J.D.; Le, B.A.; Tieman, A.M.; Birone, C.; Brown, M.; Hernandez, J.; et al. A linear relationship between crystal size and fragment binding time observed crystallographically: Implications for fragment library screening using acoustic droplet ejection. PLoS ONE 2014, 9, e101036. [Google Scholar] [CrossRef] [PubMed]
- Ehrmann, F.R.; Stojko, J.; Metz, A.; Debaene, F.; Barandun, L.J.; Heine, A.; Diederich, F.; Cianférani, S.; Reuter, K.; Klebe, G. Soaking suggests “alternative facts”: Only co-crystallization discloses major ligand-induced interface rearrangements of a homodimeric tRNA-binding protein indicating a novel mode-of-inhibition. PLoS ONE 2017, 12, e0175723. [Google Scholar] [CrossRef] [PubMed]
- Moreno, A.; Quiroz-García, B.; Yokaichiya, F.; Stojanoff, V.; Rudolph, P. Protein crystal growth in gels and stationary magnetic fields. Cryst. Res. Technol. J. Exp. Ind. Crystallogr. 2007, 42, 231–236. [Google Scholar] [CrossRef]
- Thomas, D.H.; Rob, A.; Rice, D.W. A novel dialysis procedure for the crystallization of proteins. Protein Eng. Des. Sel. 1989, 2, 489–491. [Google Scholar] [CrossRef]
- Pippard, M.J. Iron deficiency anemia, anemia of chronic disorders and iron overload. In Blood and Bone Marrow Pathology, 2nd ed.; Elsevier: Amsterdam, The Netherlands, 2011; pp. 173–195. [Google Scholar]
- Honarmand Ebrahimi, K.; Hagedoorn, P.L.; Hagen, W.R. Unity in the biochemistry of the iron-storage proteins ferritin and bacterioferritin. Chem. Rev. 2014, 115, 295–326. [Google Scholar] [CrossRef] [PubMed]
- Arosio, P.; Elia, L.; Poli, M. Ferritin, cellular iron storage and regulation. IUBMB Life 2017, 69, 414–422. [Google Scholar] [CrossRef]
- Weiss, G. Iron and immunity: A double-edged sword. Eur. J. Clin. Investig. 2002, 32, 70–78. [Google Scholar] [CrossRef]
- Arosio, P.; Levi, S. Ferritin, iron homeostasis, and oxidative damage 1, 2. Free Radic. Biol. Med. 2002, 33, 457–463. [Google Scholar] [CrossRef]
- Jutz, G.; van Rijn, P.; Santos Miranda, B.; Böker, A. Ferritin: A versatile building block for bionanotechnology. Chem. Rev. 2015, 115, 1653–1701. [Google Scholar] [CrossRef] [PubMed]
- Zipper, L.E.; Aristide, X.; Bishop, D.P.; Joshi, I.; Kharzeev, J.; Patel, K.B.; Santiago, B.M.; Joshi, K.; Dorsinvil, K.; Sweet, R.M.; et al. A simple technique to reduce evaporation of crystallization droplets by using plate lids with apertures for adding liquids. Acta Crystallogr. Sect. F 2014, 70, 1707–1713. [Google Scholar] [CrossRef] [PubMed]
- Teplitsky, E.; Joshi, K.; Ericson, D.L.; Scalia, A.; Mullen, J.D.; Sweet, R.M.; Soares, A.S. High throughput screening using acoustic droplet ejection to combine protein crystals and chemical libraries on crystallization plates at high density. J. Struct. Biol. 2015, 191, 49–58. [Google Scholar] [CrossRef] [PubMed]
- Gil-Alvaradejo, G.; Ruiz-Arellano, R.R.; Owen, C.; Rodríguez-Romero, A.; Rudino-Pinera, E.; Antwi, M.K.; Stojanoff, V.; Moreno, A. Novel protein crystal growth electrochemical cell for applications in X-ray diffraction and atomic force microscopy. Cryst. Growth Des. 2011, 11, 3917–3922. [Google Scholar] [CrossRef]
- Kabsch, W. Xds. Acta Crystallogr. Sect. D Biol. Crystallogr. 2010, 66, 125–132. [Google Scholar] [CrossRef] [PubMed]
- Winn, M.D.; Ballard, C.C.; Cowtan, K.D.; Dodson, E.J.; Emsley, P.; Evans, P.R.; Keegan, R.M.; Krissinel, E.B.; Leslie, A.G.W.; McCoy, A.; et al. Overview of the CCP4 suite and current developments. Acta Crystallogr. Sect. D 2011, 67, 235–242. [Google Scholar] [CrossRef]
- Winn, M.D.; Murshudov, G.N.; Papiz, M.Z. Macromolecular TLS refinement in REFMAC at moderate resolutions. Methods Enzymol. 2003, 374, 300–321. [Google Scholar]
- Lamzin, V.S.; Wilson, K.S. Automated refinement of protein models. Acta Crystallogr. Sect. D Biol. Crystallogr. 1993, 49, 129–147. [Google Scholar] [CrossRef]
- Granier, T.; Gallois, B.; Dautant, A.; Langlois d’Estaintot, B.; Precigoux, G. Comparison of the Structures of the Cubic and Tetragonal Forms of Horse-Spleen Apoferritin. Acta Crystallogr. Sect. D 1997, 53, 580–587. [Google Scholar] [CrossRef]
- Emsley, P.; Cowtan, K. Coot: Model-building tools for molecular graphics. Acta Crystallogr. Sect. D Biol. Crystallogr. 2004, 60, 2126–2132. [Google Scholar] [CrossRef]
- Yin, X.; Scalia, A.; Leroy, L.; Cuttitta, C.M.; Polizzo, G.M.; Ericson, D.L.; Roessler, C.G.; Campos, O.; Ma, M.Y.; Agarwal, R.; et al. Hitting the target: Fragment screening with acoustic in situ co-crystallization of proteins plus fragment libraries on pin-mounted data-collection micromeshes. Acta Crystallogr. Sect. D 2014, 70, 1177–1189. [Google Scholar] [CrossRef] [PubMed]
- Folzer, E.; Diepold, K.; Bomans, K.; Finkler, C.; Schmidt, R.; Bulau, P.; Huwyler, J.; Mahler, H.C.; Koulov, A.V. Selective Oxidation of Methionine and Tryptophan Residues in a Therapeutic IgG1 Molecule. J. Pharm. Sci. 2015, 104, 2824–2831. [Google Scholar] [CrossRef] [PubMed]
- Soares, A.S.; Caspar, D.L. X-ray diffraction measurement of cosolvent accessible volume in rhombohedral insulin crystals. J. Struct. Biol. 2017, 200, 213–218. [Google Scholar] [CrossRef] [PubMed]
- Bolann, B.J.; Ulvik, R.J. On the limited ability of superoxide to release iron from ferritin. Eur. J. Biochem. 1990, 193, 899–904. [Google Scholar] [CrossRef] [PubMed]
- Smith, J.M.; Helliwell, J.R.; Papiz, M.Z. Absorption of X-radiation by single crystals of proteins containing labile metal components: The determination of the number of iron atoms within the central core of ferritin. Inorg. Chim. Acta 1985, 106, 193–196. [Google Scholar] [CrossRef]


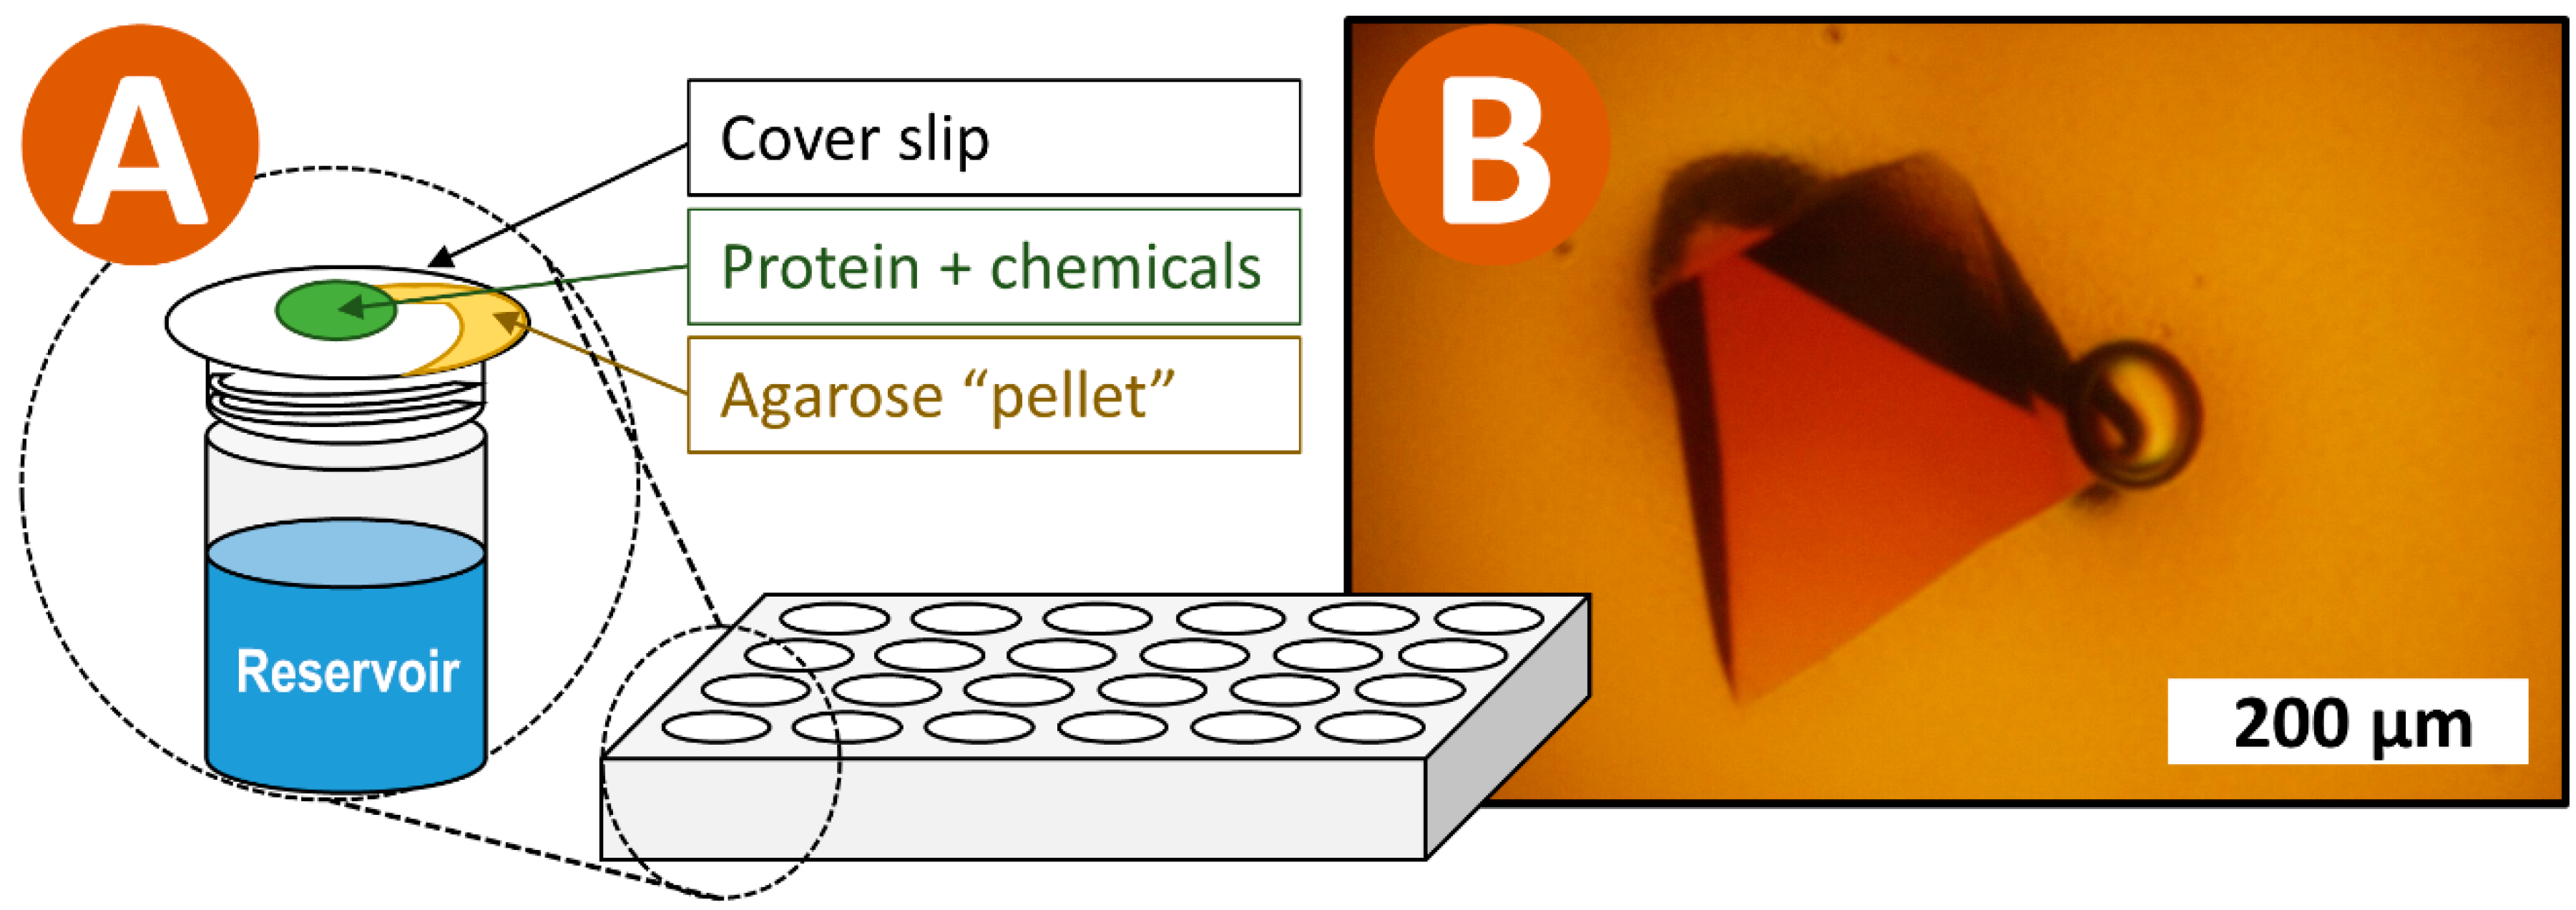
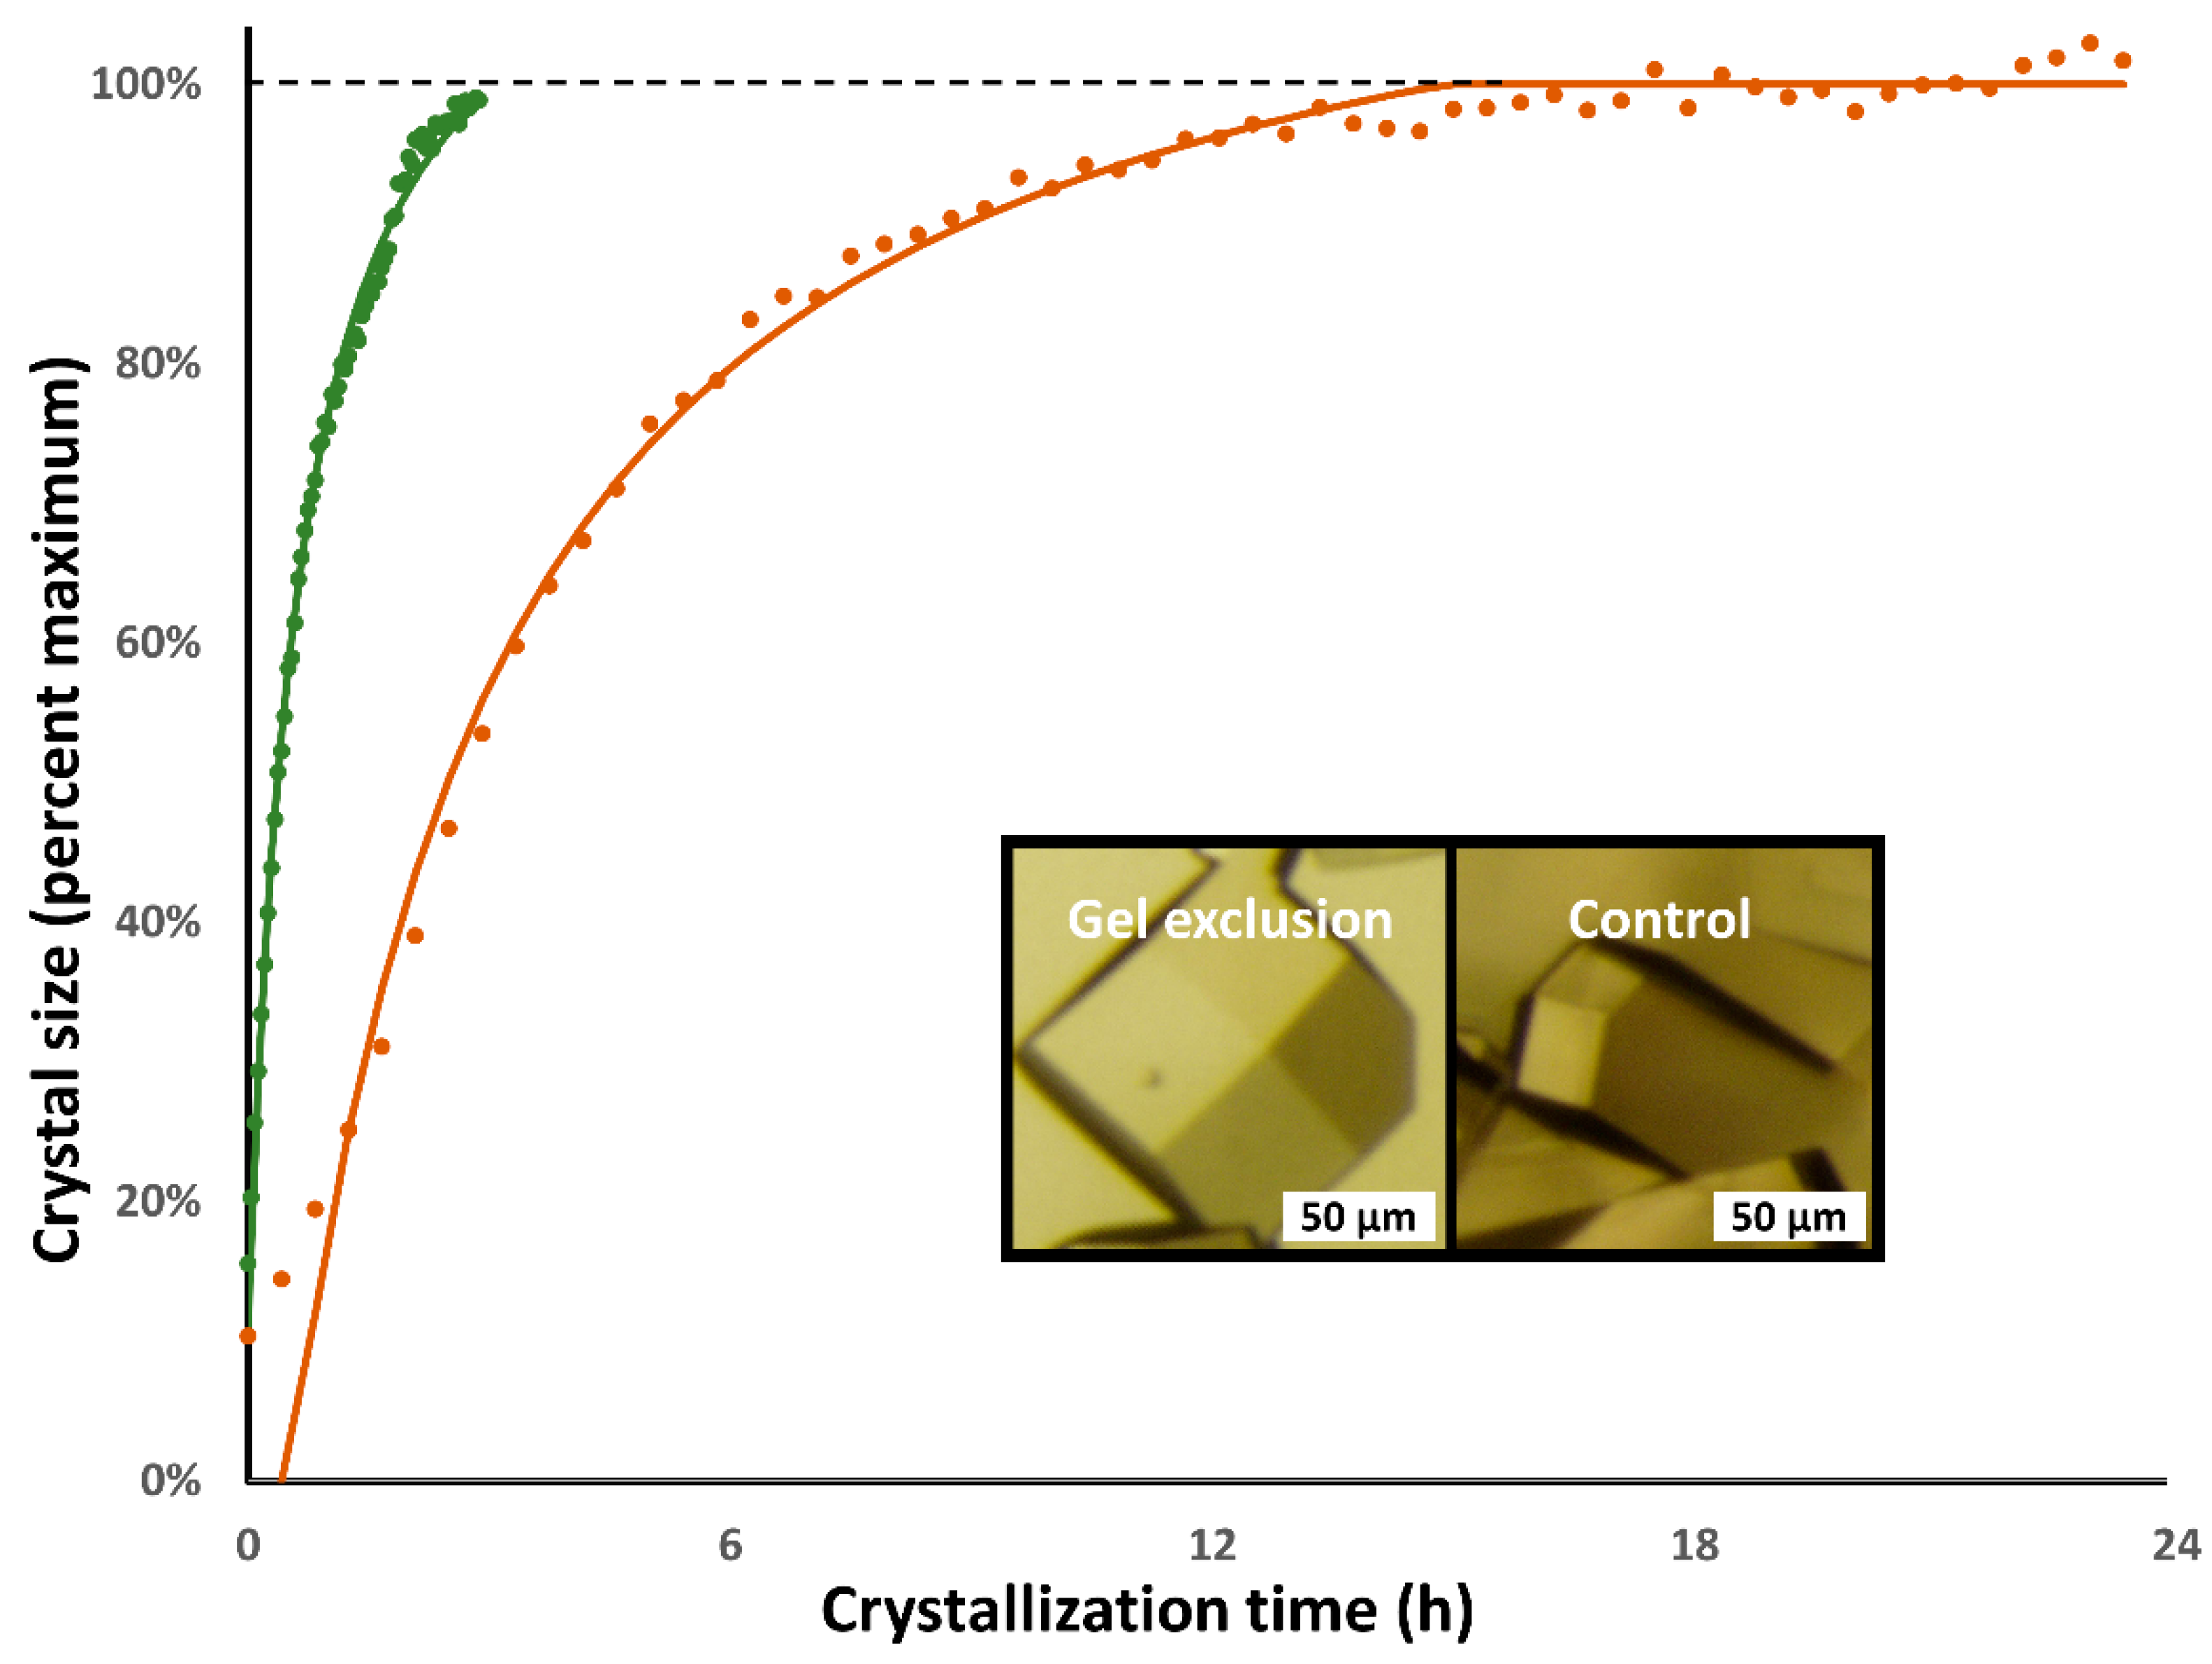
| Lysozyme: | Gel Exclusion | Hanging Drop |
| Time step (s) | 150 | 1500 |
| Tau (h) | 0.57 ± 0.02 | 2.66 ± 0.48 |
| Lmax (µm) | 512 ± 49 | 427 ± 71 |
| Lc (µm) | 605 ± 58 | 505 ± 84 |
| Residual (%) | 2.04% ± 0.36% | 2.55% ± 0.56% |
| Proteinase K: | Gel Exclusion | Hanging Drop |
| Time step (s) | 120 | 600 |
| Tau (h) | 1.01 ± 0.24 | 16.16 ± 2.60 |
| Lmax (µm) | 363 ± 81 | 361 ± 31 |
| Lc (µm) | 430 ± 21 | 534 ± 46 |
| Residual (%) | 5.66% ± 0.82% | 2.80% ± 0.06% |
| Cubic insulin: | Gel Exclusion | Hanging Drop |
| Time step (s) | 150 | 1500 |
| Tau (h) | 3.30 ± 0.00 | 56.33 ± 5.18 |
| Lmax (µm) | 222 ± 16 | 86 ± 10 |
| Lc (µm) | 555 ± 40 | 214 ± 25 |
| Residual (%) | 3.14% ± 0.63% | 4.92% ± 1.97% |
| Protein | Ferritin | Lysozyme | Lysozyme | Lysozyme |
|---|---|---|---|---|
| Fragment | n/a | 3-amino- | Picolinic | Eosin Y/ |
| Phenol | acid | Trp62 | ||
| Resolution (Å) | 1.43 (1.47) | 1.35 (1.39) | 1.23 (1.26) | 1.56 (1.60) |
| Rmerge (%) | 11.6 (407) | 7.0 (74.7) | 6.7 (53.0) | 9.0 (69.4) |
| CC1/2 | 100.0 (49.9) | 99.5 (84.6) | 99.4 (82.4) | 99.5 (77.7) |
| <I/σ(I)> | 31.81 (1.17) | 21.9 (3.2) | 17.4(2.3) | 17.8 (3.1) |
| Multiplicity | 138.2 (48.9) | 12.8 (11.3) | 8.1 (5.5) | 12.8 (11.2) |
| Unique reflections | 47,743 | 27,063 (1906) | 32,856 (1997) | 17,660 (1235) |
| Completeness (%) | 100.0 (100.0) | 99.7 (96.0) | 97.3 (83.1) | 99.7 (96.3) |
| Rwork (%) | 15.71 | 15.75 | 17.62 | 17.44 |
| Rfree (%) | 17.17 | 18.59 | 19.91 | 21.16 |
| R.M.S. bond (Å) | 0.03 | 0.03 | 0.03 | 0.02 |
| rms angles (ᵒ) | 2.65 | 2.53 | 2.51 | 1.83 |
| Mean B (Å2) | 30 | 19 | 19 | 26 |
| Mean ligand B (Å2) | n/a | 17 | 30 | 38 |
| Figure | 4 | 6a | 6b | 6c |
| PDB code | 6MSX | 6MX9 | n/a | n/a |
© 2018 by the authors. Licensee MDPI, Basel, Switzerland. This article is an open access article distributed under the terms and conditions of the Creative Commons Attribution (CC BY) license (http://creativecommons.org/licenses/by/4.0/).
Share and Cite
Blackburn, A.; Partowmah, S.H.; Brennan, H.M.; Mestizo, K.E.; Stivala, C.D.; Petreczky, J.; Perez, A.; Horn, A.; McSweeney, S.; Soares, A.S. A Simple Technique to Improve Microcrystals Using Gel Exclusion of Nucleation Inducing Elements. Crystals 2018, 8, 464. https://doi.org/10.3390/cryst8120464
Blackburn A, Partowmah SH, Brennan HM, Mestizo KE, Stivala CD, Petreczky J, Perez A, Horn A, McSweeney S, Soares AS. A Simple Technique to Improve Microcrystals Using Gel Exclusion of Nucleation Inducing Elements. Crystals. 2018; 8(12):464. https://doi.org/10.3390/cryst8120464
Chicago/Turabian StyleBlackburn, Adafih, Shahla H. Partowmah, Haley M. Brennan, Kimberly E. Mestizo, Cristina D. Stivala, Julia Petreczky, Aleida Perez, Amanda Horn, Sean McSweeney, and Alexei S. Soares. 2018. "A Simple Technique to Improve Microcrystals Using Gel Exclusion of Nucleation Inducing Elements" Crystals 8, no. 12: 464. https://doi.org/10.3390/cryst8120464
APA StyleBlackburn, A., Partowmah, S. H., Brennan, H. M., Mestizo, K. E., Stivala, C. D., Petreczky, J., Perez, A., Horn, A., McSweeney, S., & Soares, A. S. (2018). A Simple Technique to Improve Microcrystals Using Gel Exclusion of Nucleation Inducing Elements. Crystals, 8(12), 464. https://doi.org/10.3390/cryst8120464