Article

Investigation of Cavitation Erosion, Microstructure, and Surface Topography of Hot-Rolled Magnesium-Based AZ 31B Alloys

by
Claudia Ciurel
1,
Ion Mitelea
2,
Ilare Bordeașu
1,
Dragoș Buzdugan
2,
Corneliu Marius Crăciunescu
2 and
Ion-Dragoș Uțu
2,*
1
Department of Mechanical Machines, Equipment and Transports, Politehnica University Timisoara, Bulevardul Mihai Viteazul No.1, 300222 Timisoara, Romania
2
Department of Materials and Fabrication Engineering, Politehnica University Timisoara, Bulevardul Mihai Viteazul No.1, 300222 Timișoara, Romania
*
Author to whom correspondence should be addressed.
Crystals 2026, 16(8), 541; https://doi.org/10.3390/cryst16080541
Submission received: 1 July 2026 / Revised: 14 August 2026 / Accepted: 17 August 2026 / Published: 19 August 2026
(This article belongs to the Special Issue State of the Art of Crystalline Metals and Alloys)

Abstract

Cavitation erosion is a phenomenon that causes the degradation of engineering components operating in fluids under oscillating pressure, and it occurs through the repeated implosion of cavitation bubbles adjacent to the solid surface. This complex phenomenon involves both the hydrodynamic factors of the liquid and the properties of the material being eroded. Cavitation erosion tests were performed using a vibratory apparatus with piezoceramic crystals, in accordance with the ASTM G32-2016 standard. As a reference material, a wrought aluminum-based alloy in the hot-rolled condition, EN AW-6082, was selected. For both alloys, mass losses were measured and erosion rates were calculated. The eroded surfaces were examined by X-ray diffraction (XRD), optical microscopy, scanning electron microscopy (SEM), and energy-dispersive X-ray spectroscopy (EDX). The results indicate that the cavitation erosion resistance of the AZ 31B alloy in the hot-rolled condition is approximately 3.77 times lower than that of the reference material. This behavior is attributed to its lower hardness and heterogeneous microstructure, consisting of an α solid solution matrix with a hexagonal close-packed crystal structure and intermetallic particles of the Mg17Al12 type, which exhibit pronounced brittleness. Cavitation pits are observed mainly within the α-Mg solid solution grains and at the interfaces between the intermetallic phases and the α-Mg matrix.

1. Introduction

Cavitation erosion is a phenomenon that frequently occurs in engineering components operating in aqueous environments under oscillating pressures. It leads to a reduction in their efficiency by causing surface degradation, as well as increased flow instability, noise, and vibrations. These negative effects result in a higher frequency of maintenance operations and increased repair costs [1,2].
Cavitation erosion resistance depends on the mechanical and structural characteristics of the selected material, the properties of the liquid (e.g., temperature, chemical composition, chemical aggressiveness, viscosity), and the intensity of cavitation [3,4,5]. Materials exhibiting a homogeneous and fine-grained microstructure, high fatigue resistance, and superior mechanical properties generally show the highest resistance to cavitation erosion. The most relevant material properties include hardness, tensile strength, yield strength, deformation energy, fracture toughness, and fatigue resistance. Although hardness is often considered a favorable property for improving this surface-related behavior [3,4], the mechanisms involved in the degradation process are complex, and material performance cannot be explained solely based on hardness.
To reduce the negative impact of cavitation erosion on engineering components, numerous surface enhancement methods have been applied in recent decades. The most common approaches involve thermal or thermochemical treatments, which increase hardness while also improving other mechanical properties [4]. Other methods for enhancing surface hardness and mechanical resistance include the deposition of hard coatings, such as WC-Co [5], using techniques such as high-velocity oxy-fuel spraying (HVOF) [6,7], physical vapor deposition (PVD) [8,9], atmospheric plasma spraying (APS) [10], and electric arc spraying (ARC) [11].
Among wrought alloys, those belonging to the Al–Cu, Al–Mg, Al–Si–Mg, and Al–Zn–Mg systems have been extensively studied [12,13,14,15]. Vaidya and Preece [12] investigated the deformation and fracture mechanisms associated with cavitation in age-hardenable aluminum-based alloys. Their results showed that the erosion rate decreases with increasing hardness and mechanical strength, while surface failure remains ductile regardless of alloying degree, which is characteristic of metals with a face-centered cubic (FCC) crystal structure. S.J. Lee et al. [13] analyzed the cavitation erosion resistance and surface degradation of Al–Mg alloys from the 5000 series. Their study details the morphological and compositional changes induced by cavitation and highlights the importance of material selection for components used in marine and riverine industries. The experiments demonstrated that 5083–O alloys exhibit the highest mass losses due to cavitation, while 5083–H116 alloys show the lowest.
B.C.S. Rao et al. [14] studied the cavitation resistance of the aluminum alloy 6061-T6 in three different liquids: viscous mineral oil, distilled water, and industrial supply water. Their experiments focused on determining the mean erosion depth, average erosion rate, and surface roughness changes. Scanning electron microscopy analyses revealed the formation of cavitation pits, grain deformation, and extensive surface erosion. Gianmaria Gottardi et al. [15] demonstrated that a new chromium-containing alloy, AlSi3Cr, exhibits superior cavitation erosion resistance compared to commercial alloys such as A356 and 6061. This behavior is attributed to the intermetallic phases formed both in the as-cast condition and after heat treatment.
Auret et al. [16] investigated the cavitation behavior of wrought aluminum alloys at different temperatures, in comparison with commercially pure copper. They demonstrated that the erosion rate increases with increasing water temperature, reaching a maximum at approximately 65 °C. This behavior is explained by the effect of temperature on the pressure gradient responsible for cavitation.
Magnesium is an alkaline earth metal with a silvery-white color and a melting point of 650 °C. It is the third most abundant metal in the Earth’s crust after aluminum and iron, accounting for approximately 2% of its mass. Its particular interest arises from its very low density, ρ = 1740 kg/m3. Magnesium has a hexagonal close-packed (HCP) crystal structure (a = 3.203 Å; c = 5.2002 Å; c/a = 1.62354), which explains its lower plasticity compared to aluminum [17,18,19,20,21,22].
The thermal conductivity of magnesium [0.3 cal/(cm·s·°C)] is significantly lower than that of aluminum, although their coefficients of linear expansion are nearly identical (26.1 × 10⁻⁶ in the range of 20–100 °C) [17,23,24,25]. Industrial magnesium contains impurities such as Fe, Si, Ni, Al, Mn, and Cu, among which Fe, Ni, Cu, and Si are detrimental as they reduce corrosion resistance. In the as-cast state, magnesium exhibits the following mechanical properties: Rm = 110–120 N/mm2; Rp0.2 = 20–30 N/mm2; A = 6–8%; Z = 9–10%; E = 45,000 N/mm2; HB = 30 daN/mm2. Cold deformation leads to strain hardening, resulting in the following mechanical properties: Rm = 200 N/mm2; Rp0.2 = 90 N/mm2; E = 45,000 N/mm2; HB = 40 daN/mm2; A = 11.5% [17]. Magnesium exhibits relatively good atmospheric corrosion resistance but is unstable in fresh and seawater. It is also a highly flammable metal in air and is used in pyrotechnics and the chemical industry.
In industrial applications, magnesium alloys most commonly contain aluminum (up to 10%), zinc (5–6%), manganese (up to 2.5%), and zirconium (up to 1.5%). Equilibrium phase diagrams of Mg–Al and Mg–Zn systems reveal the formation of α solid solutions and intermetallic phases Mg4Al3 and MgZn, respectively [17]. For alloying element concentrations up to 6–7%, these additions improve mechanical properties [17,21]. Manganese forms an α solid solution with magnesium. As temperature decreases, the solubility of manganese in magnesium decreases, leading to the precipitation of the β phase from the α solid solution [17]. Although manganese does not significantly improve mechanical properties, it enhances corrosion resistance and weldability.
The improved corrosion resistance is attributed to the formation of a protective hydrated Mg–Mn oxide layer and to the removal of iron (Mn forms a dense compound with Fe, which settles at the bottom of the crucible during melting) [17,26].
Wrought magnesium alloys are supplied in the form of bars, hot-rolled profiles, and hot-forged components. Due to their hexagonal crystal structure, they exhibit limited plasticity at low temperatures, with slip occurring primarily along the (0001) crystallographic planes. Upon heating, additional slip systems ((1011) and (1120)) become active, resulting in increased plasticity [17,27,28]. Consequently, plastic deformation processing is carried out at elevated temperatures. The technological plasticity of magnesium alloys increases with decreasing deformation rate.
The objective of the present study is to analyze the cavitation erosion resistance of the AZ31B alloy in the hot-rolled condition. By correlating cumulative mass loss and erosion rate with microstructural changes, this work aims to elucidate the mechanisms responsible for material degradation under extended cavitation conditions. The main sections of the paper are as follows:
  • Morphology of degradation of metallic alloys subjected to cavitation erosion;
  • Investigation of the material microstructure before and after cavitation;
  • Evaluation and interpretation of experimental results;
  • Final conclusions.

2. Experimental Procedure

The investigated material is a wrought magnesium-based alloy of the AZ31B type, whose nominal chemical composition is presented in Table 1. It was determined by optical emission spectrometry using a Thermo ARL QuantoDesk device (Thermo Fisher Scientific, Waltham, MA, USA).
The surface hardness of the specimens was measured using a Vickers hardness tester (Jinan Hensgrand Instrument Co., Ltd., Jinan, China) (HVS-10 A1, China), applying a load of 50 g and a dwell time of 15 s. At least eight repeated measurements were performed for each specimen, and the average hardness value was calculated (Table 1).
The alloy was supplied in the form of hot-rolled bars with a thickness of 25 mm. Specimens with the shape and dimensions shown in Figure 1 were used for cavitation measurements.
Cavitation erosion tests were carried out using ultrasonic vibratory apparatus, in accordance with the ASTM G32-2016 standard [29]. The device is computer-controlled and equipped with software for monitoring and adjusting the operating parameters governing the hydrodynamic cavitation process. The tests were conducted in tap water at a temperature of 22 ± 2 °C. The pH value of the tap water was 7.1, which is considered neutral. Therefore, the measured mass losses can be attributed primarily to cavitation erosion. Pure magnesium is highly reactive in water; however, its alloys exhibit significantly lower reactivity. Preliminary static immersion tests performed on the hot-rolled specimens demonstrated that the mass losses caused by corrosion were negligible.
An indirect (stationary) testing configuration was employed, which involves positioning the specimen separately at a small distance from the horn tip. A conical cavitation cloud is generated between the specimen and the horn tip. The horn tip used had a diameter of 15.8 mm and was positioned 1 mm above the specimen surface to maximize flow aggressiveness. The amplitude and frequency were set to 50 μm and 20 ± 0.02 kHz, respectively.
Prior to cavitation erosion testing, the specimen surfaces were ground using SiC papers and successively polished with monocrystalline diamond suspensions with particle sizes of 9 μm, 3 μm, and 1 μm, followed by final polishing with a colloidal silica suspension with a particle size of 0.02 μm. The polishing operation was carried out using a Buehler Phoenix Beta system (KERN and SOHN GmbH Ziegelei, Balingen, Germany). This final polishing step resulted in surface roughness values below 0.2 μm, which is well below the limit value of 0.8 μm specified in the standard. The cavitation tests were performed under identical conditions on the unetched surfaces of both metallic materials.
The chemical etchant used for the metallographic analysis of the cavitation-tested specimens was a picric acid-based solution (1 g picric acid, 2 mL glacial acetic acid, 2 mL water, and 16 mL ethanol).
The total duration of each test was 165 min, divided into 12 intermediate intervals (one of 5 min, one of 10 min, and ten intervals of 15 min each). After each interruption for measurements, the specimens were rinsed with tap water, distilled water, alcohol, and acetone, dried under a stream of hot air, and weighed. Weighing was performed using a KERN ABT 100-5NM analytical balance, with a precision of five significant decimal places (down to 0.00001 g).
Microstructural investigations were carried out using a Leica DM 2700M optical microscope (Leica Microsystems, Wetzlar, Germany) and a TESCAN Vega 3 LM scanning electron microscope (SEM) (TESCAN Brno, s.r.o., Czech Republic), equipped with a Bruker Quantax 200 energy-dispersive X-ray spectroscopy (EDS) system with a Peltier-cooled XFlash 410M silicon drift detector (Bruker, Billerica, MA, USA).
To identify the nature of the microstructural phases of the alloy before and after cavitation testing, a Philips X-ray diffractometer (PANalytical X’Pert Pro Multi-Purpose Diffractometer, Kassel-Waldau, Germany) was used.
The scanned area was 10 mm × 10 mm, located in the central region of the non-cavitated or cavitated zone after 165 min of testing. The radiation used was Cu-Kα (λ = 1.54 Å, 40 kV, 30 mA). The diffraction angle range was 20–80°, with a step size of 0.013°. Phase identification was performed using the JCPDS (Joint Committee on Powder Diffraction Standards) database.

3. Results and Discussion

3.1. Microstructure of the Alloy Prior to Cavitation Exposure

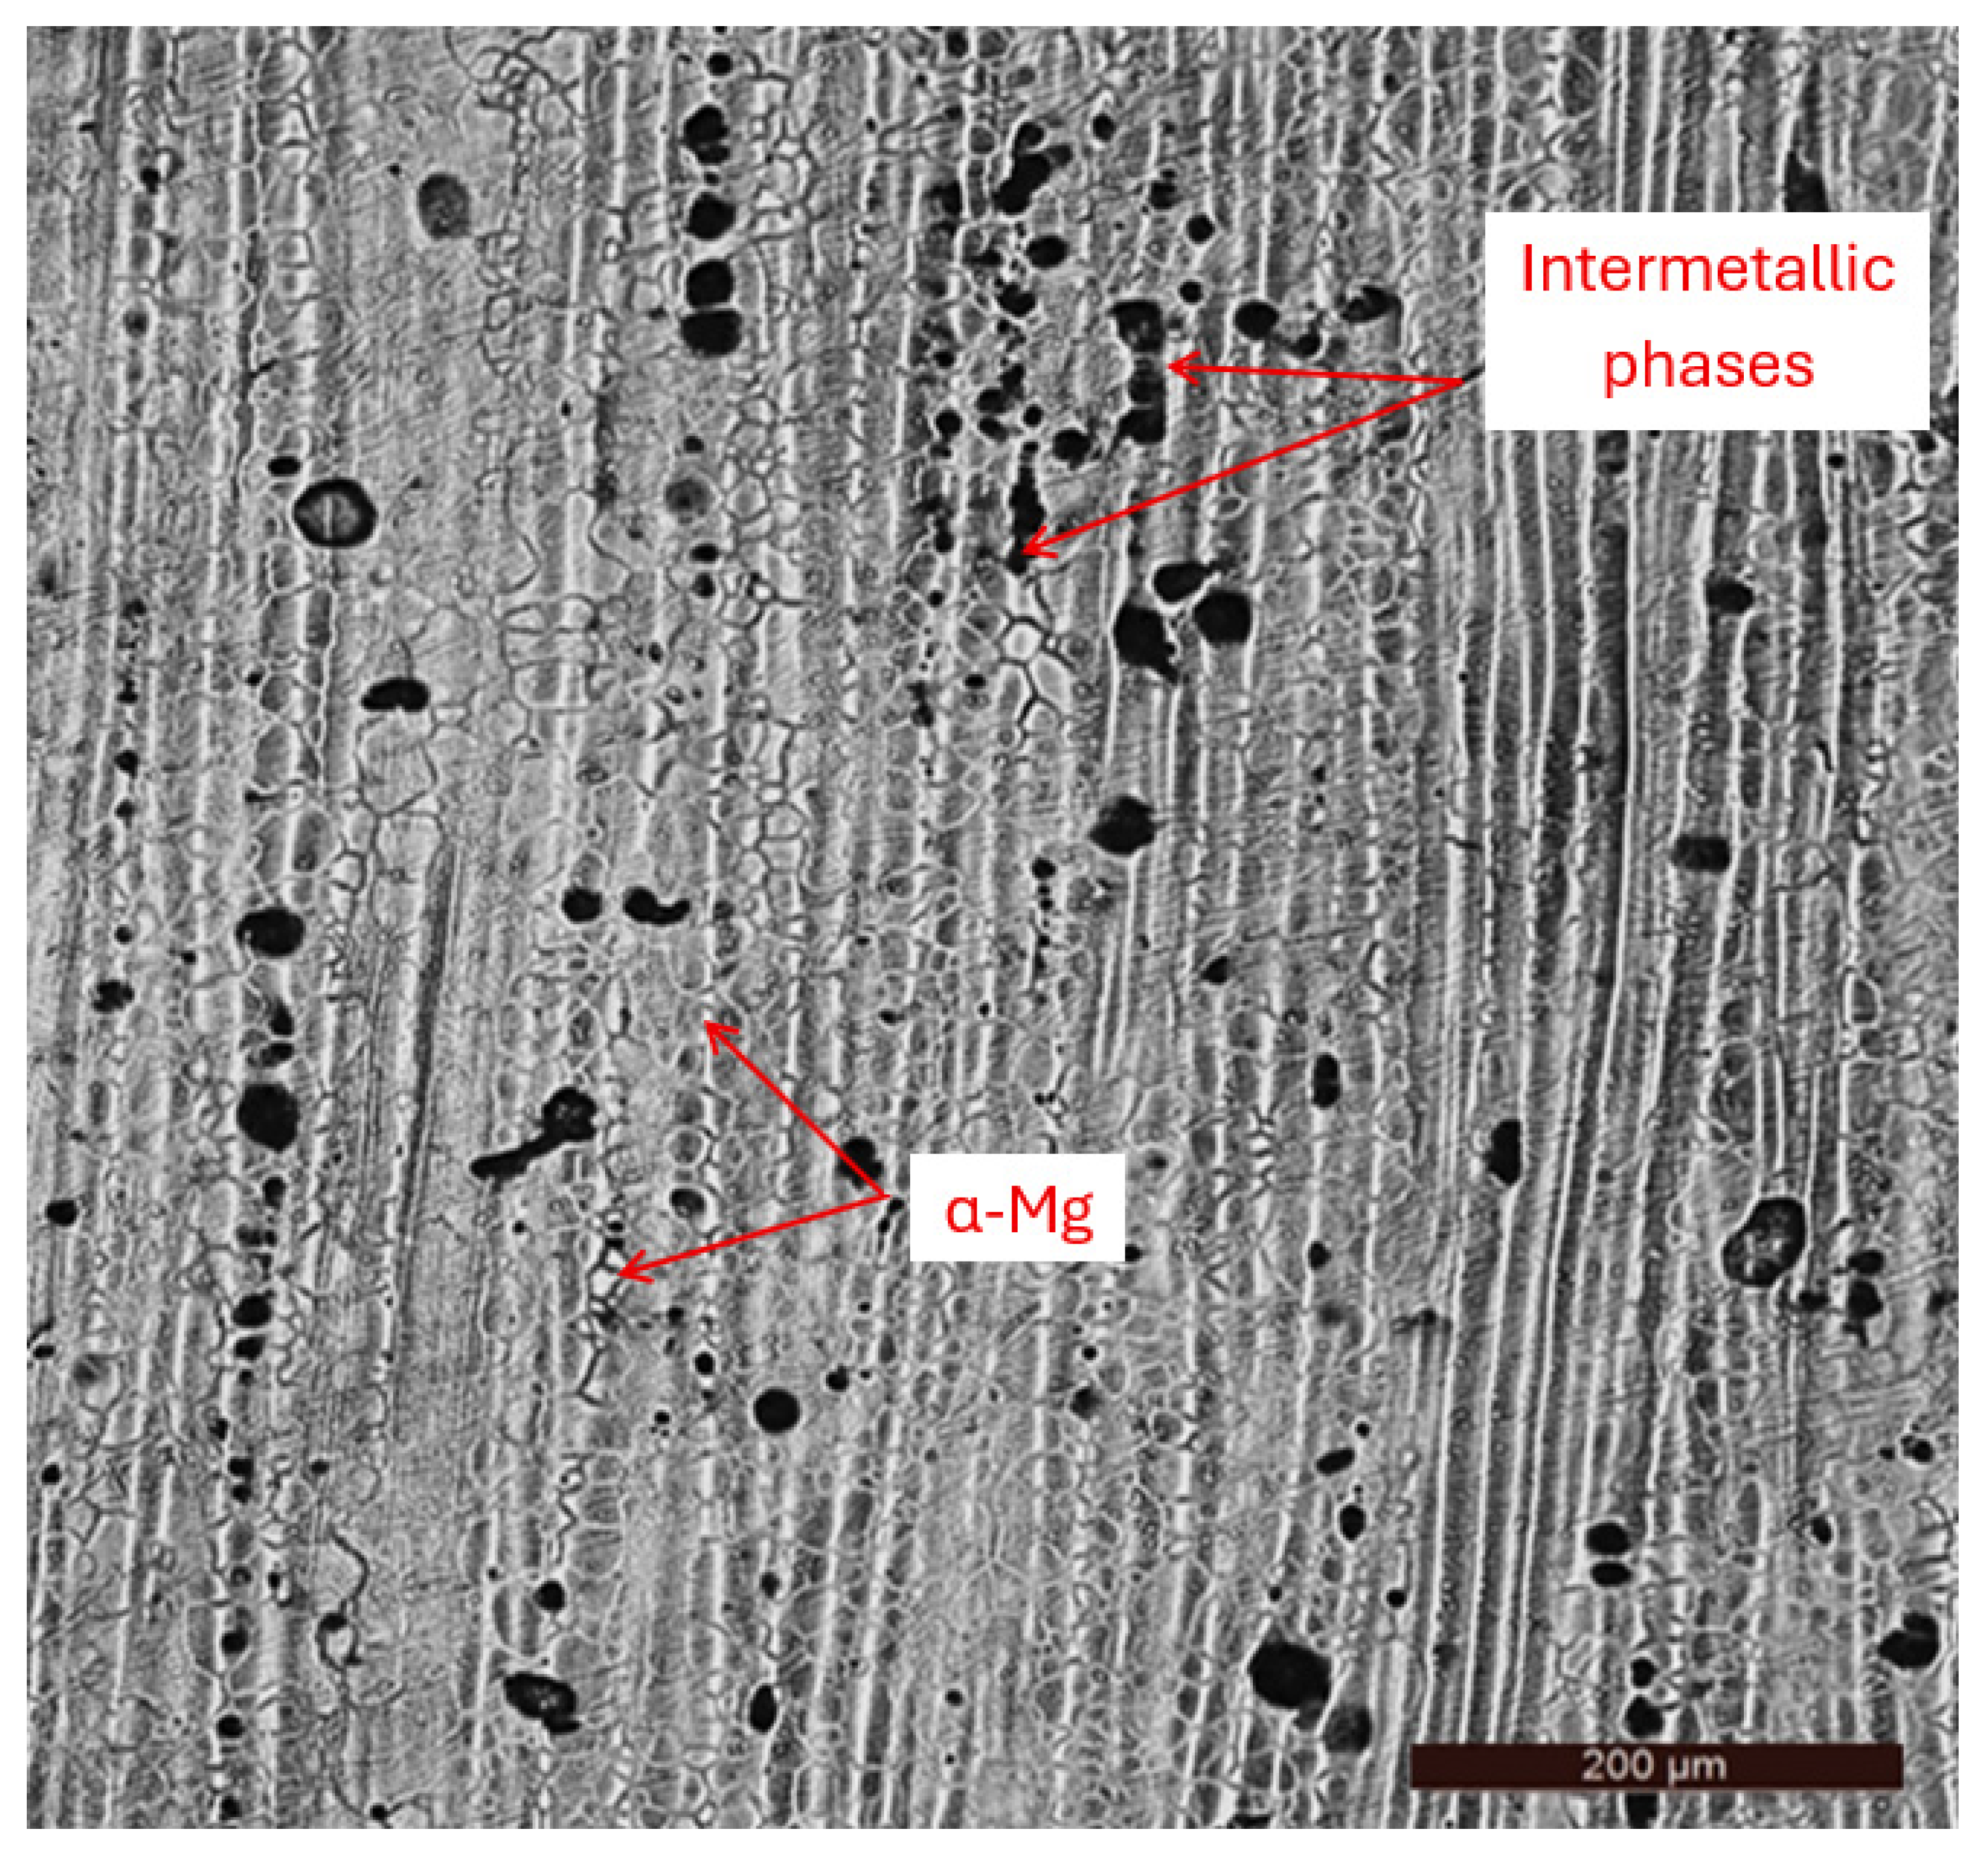
Figure 2 presents the metallographic morphology of the hot-rolled AZ31B alloy prior to cavitation erosion. It can be observed that the microstructure consists of α solid solution grains based on magnesium, with intermetallic phases specific to the Mg–Al–Zn–Mn system located both at the grain boundaries and within the grains. These observations are consistent with results reported in other studies [19,20].

3.2. Cavitation Erosion Curves

The experimental values used in the analysis of the cavitation erosion behavior and structural resistance were determined based on mass loss, using the following relationships:
-
Cumulative mass loss caused by erosion:
M i = Σ i = 1 n Δ m i ,     [ mg ]
-
Cavitation resistance:
R c a v . = ρ · π · d p 2 · Δ t i 4 · Δ m i     [ min / µ m ]
where
i = the number of the intermediate interval;
n = the total number of intermediate intervals (n = 12);
Δmi = mass loss during the i-th intermediate interval (in mg);
Δti = duration of the i-th intermediate interval (in min);
dp = diameter of the surface exposed to cavitation (15.8 mm);
ρ = density of the alloy (1730 g/dm3).
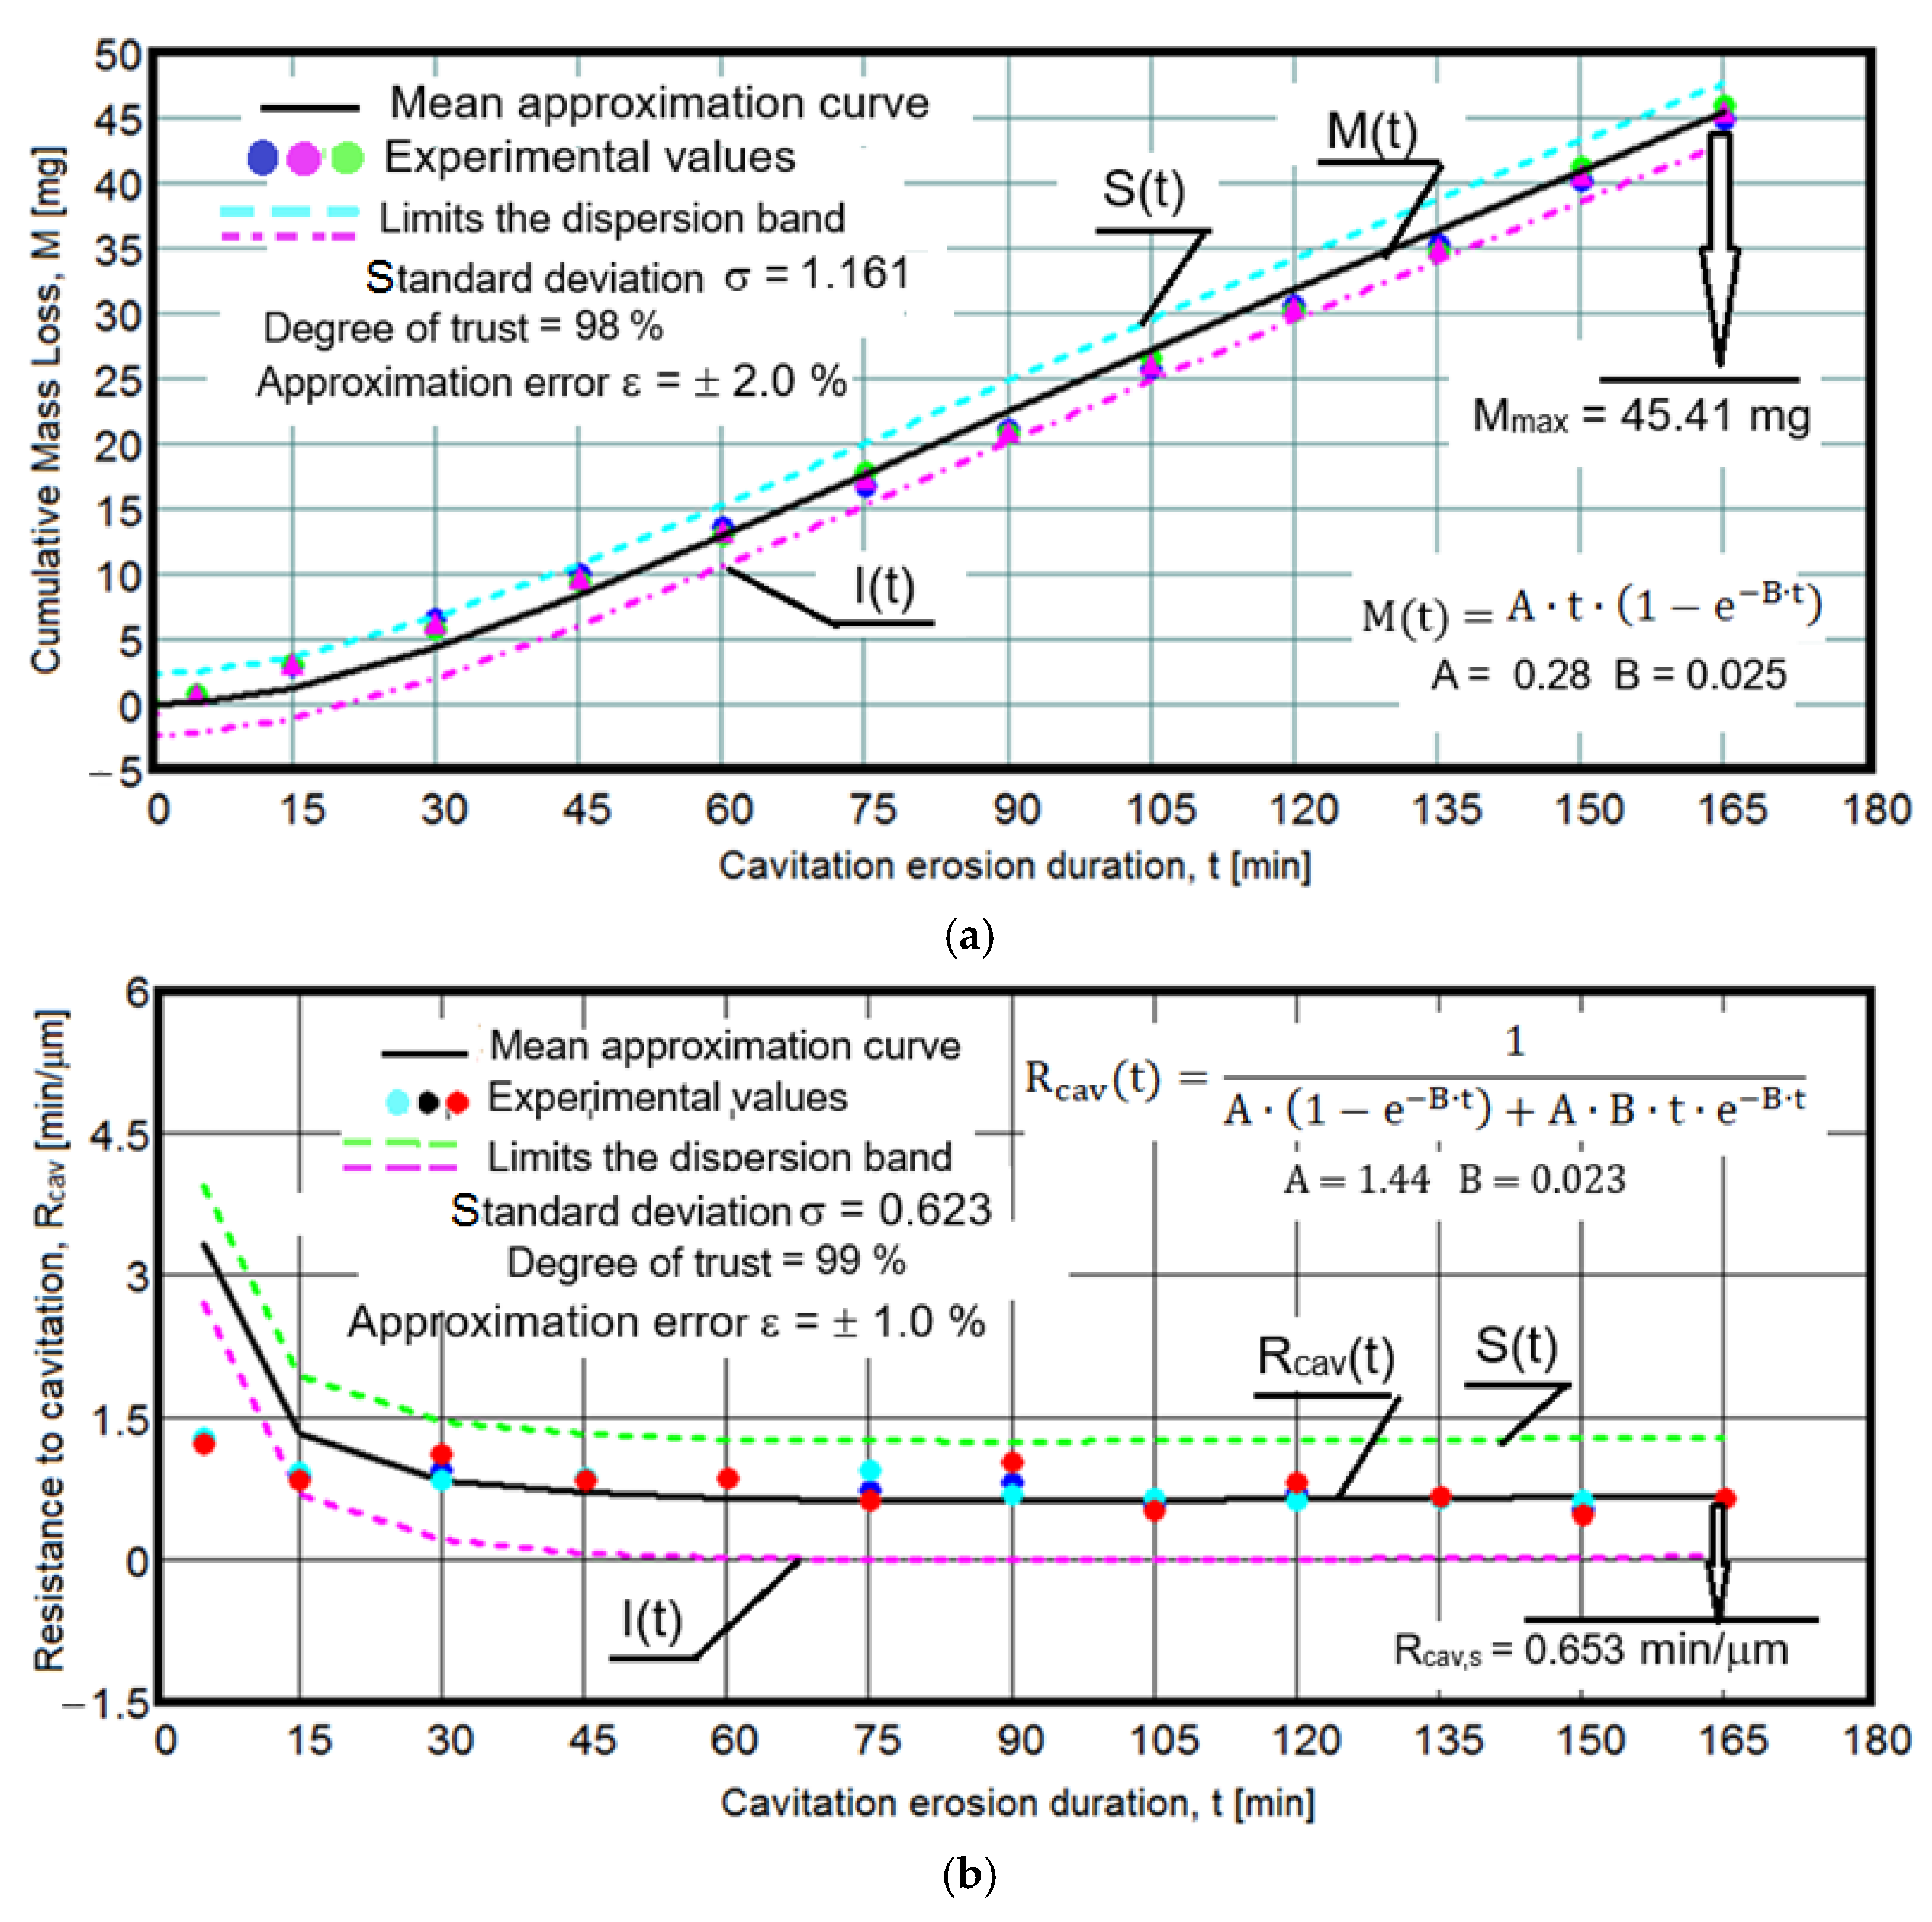
The behavior of the alloy structure under cyclic loading induced by vibratory cavitation is illustrated in Figure 3 through the experimental values of mass loss (Mi) and cavitation erosion resistance (Rcav,i), as well as through their corresponding averaged curves, M(t) and Rcav(t).
To ensure the accuracy of the experiment, in accordance with laboratory practice, the diagrams also include the values of the statistical parameters: the standardized mean deviation (σ), the confidence level, and the approximation error (ε) associated with fitting the experimental data using the averaging curves. These parameters were calculated using Mathcad 14, based on the following relationships:
The standard mean deviation was determined using the following relationship:
σ = i = 1 n ( M i , R c a v , i ) ( M ( t ) i , R c a v , i ( t ) i 2 n 1 1 2         [ mg ,   min / µ m ]
-
The confidence level (DT) is defined by the band within which the experimental values are dispersed, bounded by the curves S(t) and I(t). The calculation of these curves, as well as of the confidence level, is performed based on the approximation error ε, using the following relationships:
S(t) = [M(t), Rcav(t)] + ε⋅σ;    I(t) = [M(t), Rcav(t)] − ε⋅σ   [mg, min/µm]
DT = 100-|ε|  [%]
The relationships used for constructing the averaging curves M(t) and Rcav(t) are also included in the diagrams. The forms of these relationships were established by Bordeasu and co-workers [30,31] and are derived based on the conditions of best fit, ensuring a high confidence level and a minimal approximation error.
Furthermore, for the evaluation of cavitation resistance, the two diagrams display the values of Mmax, representing the cumulative mass loss at the end of the cavitation exposure period (165 min), as defined by the M(t) curve, and the final cavitation resistance, Rcav,s, towards which the Rcav(t) curve converges.
The first parameter is recommended by the ASTM G32-2016 standard, while the second is introduced based on laboratory practice, as it represents the inverse of the erosion rate, which is the parameter recommended by the ASTM G32-2016 standard.
The use of the parameter Rcav, defined as the inverse of the average penetration rate of erosion, in our opinion, provides a more accurate representation of the evolution of surface behavior and hardening under cavitation conditions over time than the erosion rate itself, which is derived from mass losses associated with intermediate exposure intervals, as recommended by ASTM G32-2016.
From the perspective of alloy behavior under vibratory cavitation loading, the dispersion of the experimental values and the evolution of the averaging curves in the two diagrams indicate a high degree of macrostructural homogeneity and uniform mechanical properties throughout the bulk, as well as uniform surface hardness in the cavitated region. This homogeneity is suggested by the very small, sometimes identical, differences between experimental values, regardless of the duration of cavitation exposure considered.
However, the evolution of the M(t) curve, showing a significant increase after 15 min, along with the sharp decrease in cavitation resistance Rcav(t), suggests that the structural resistance to the pressure forces generated by the interaction of the surface with shock waves and cavitation microjets is relatively low.
The variation in the Rcav(t) curve, with a slight increase toward the stabilization value Rcav,s = 0.653 min/μm after reaching a minimum at approximately 60–70 min, reflects the combined effect of mechanical surface hardening and the damping effect produced by air/water trapped in the cavities formed under cavitation conditions, which attenuates the pressure forces [18,30,31,32,33,34,35,36,37].
The accuracy of the experimental procedure is demonstrated by the high confidence levels (98% and 99%) associated with the dispersion ranges of the experimental values, as well as by the low approximation errors ε (±2.0% and ±1.0%) between the experimental data and the averaging curves.
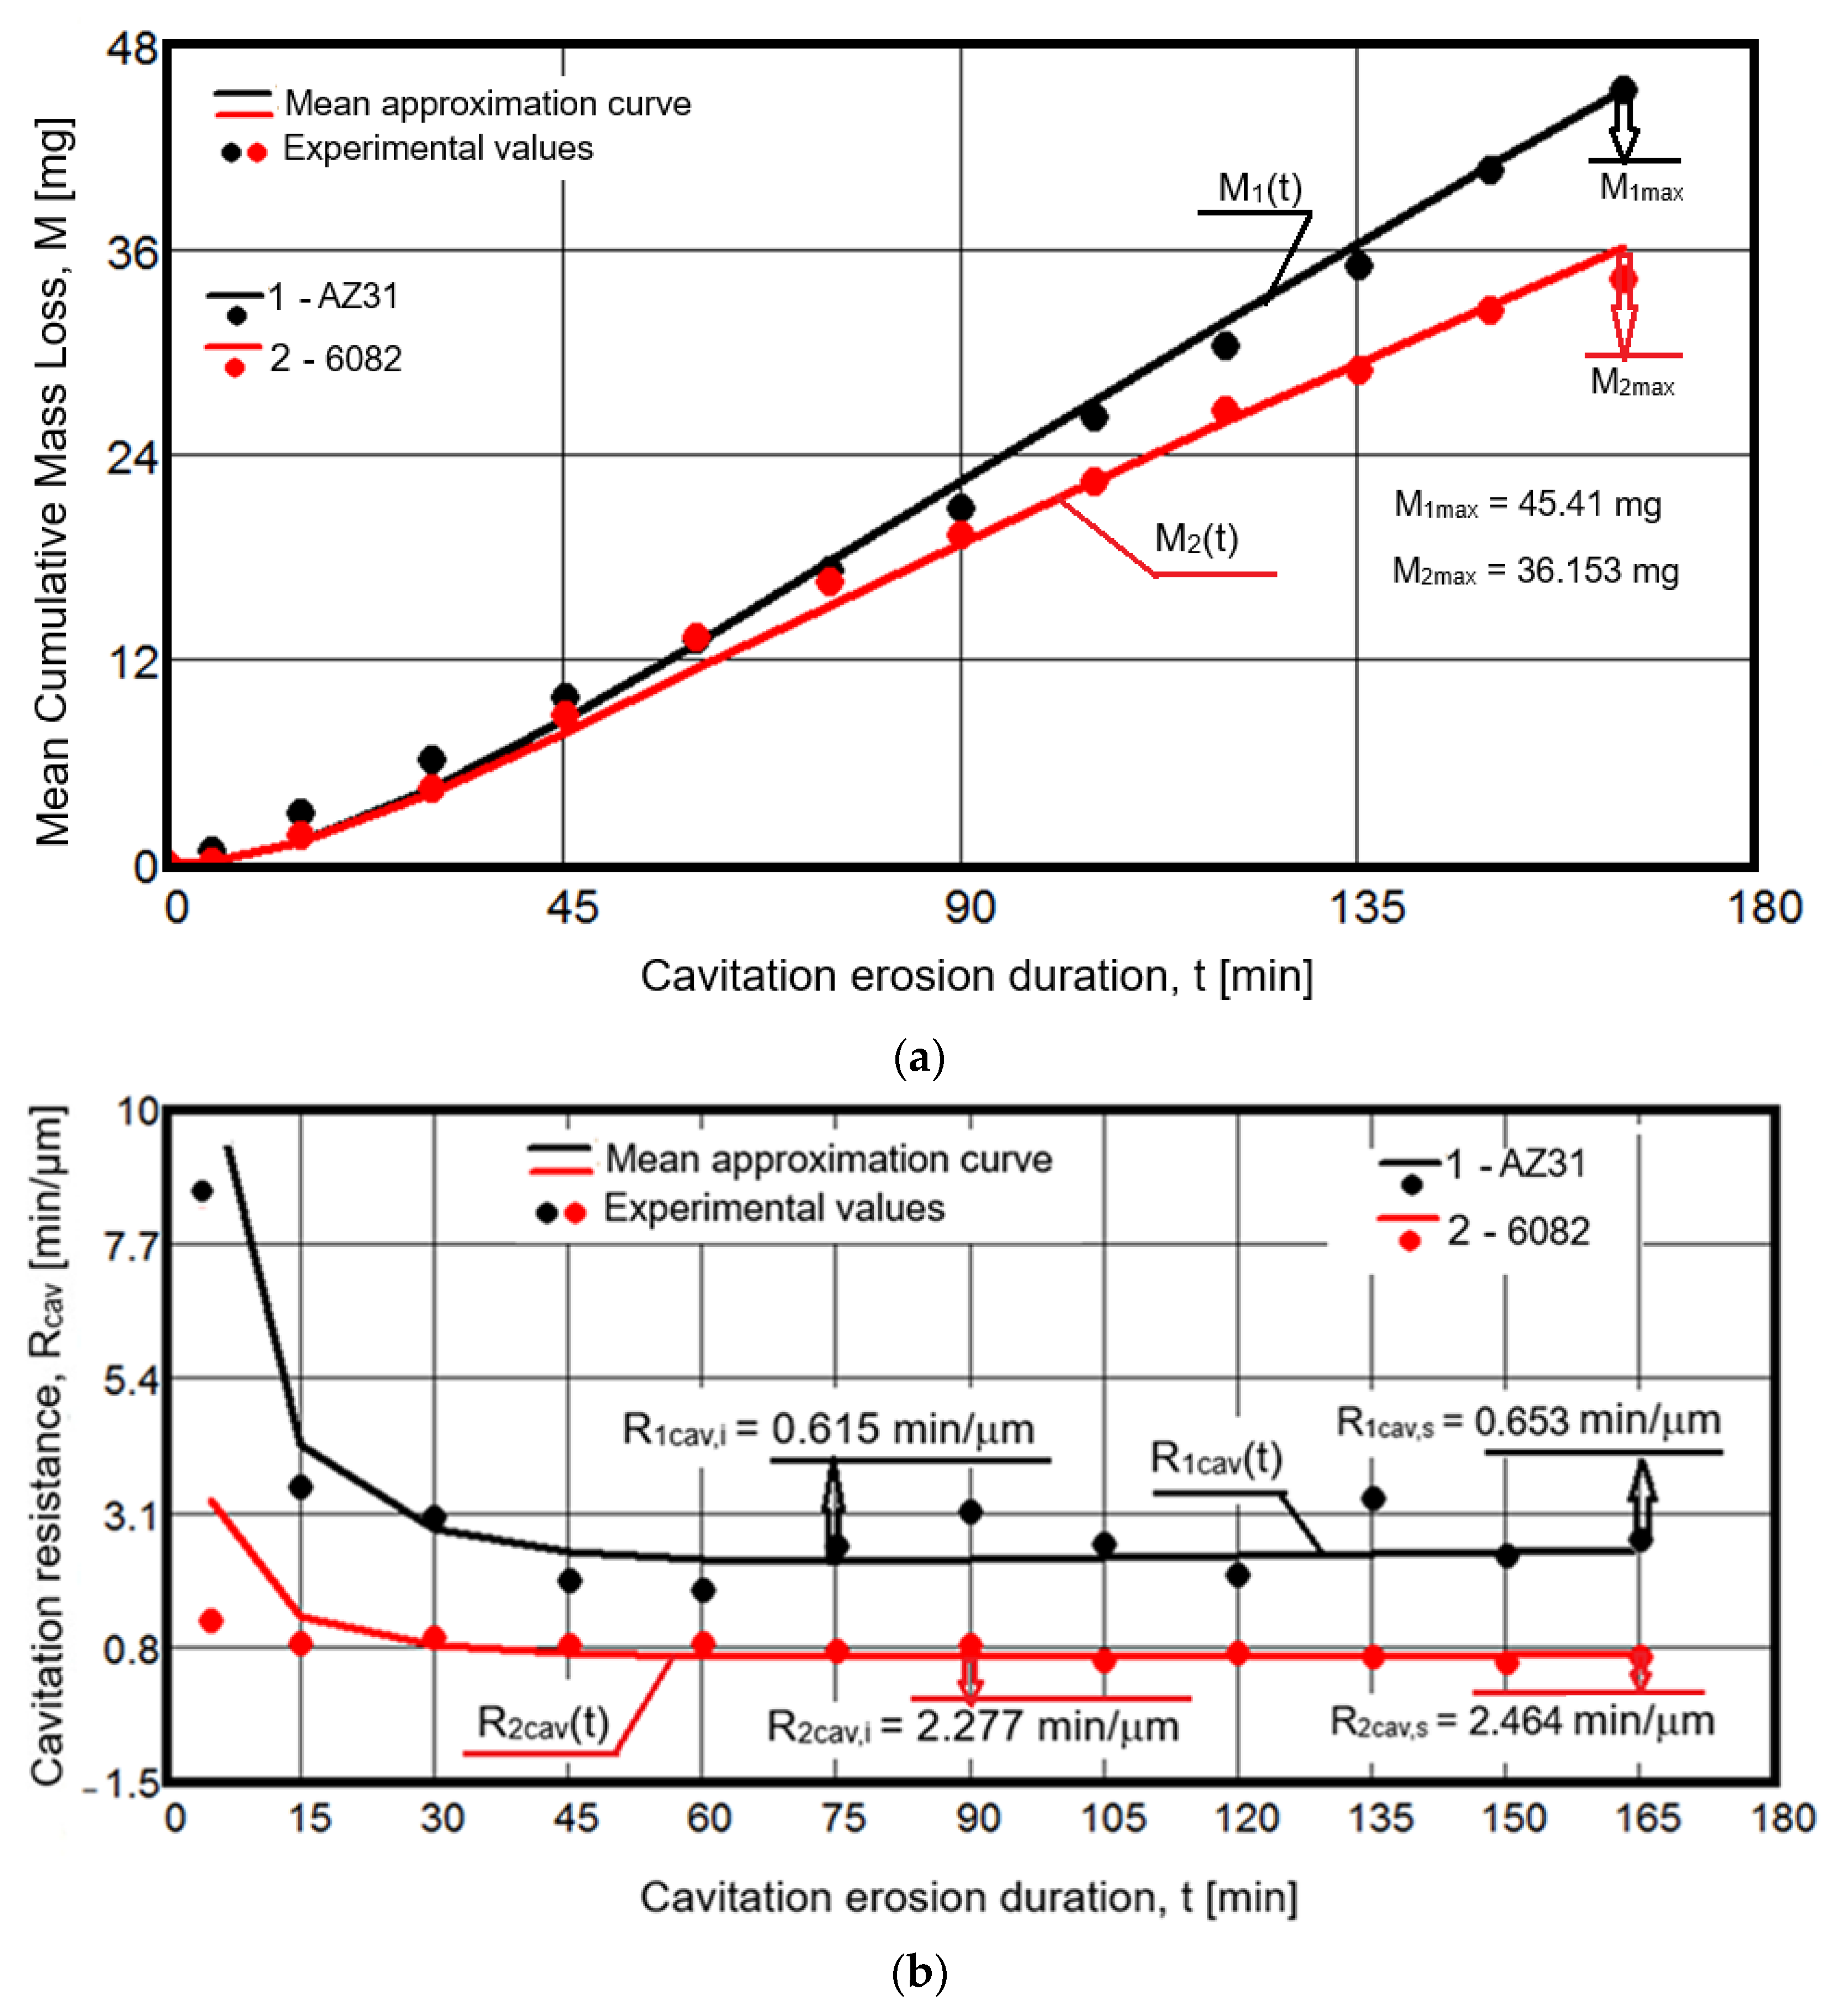
Figure 4 presents the diagrams used to evaluate the cavitation erosion resistance of the AZ31B alloy, using for comparison the curves and parameters corresponding to the aluminum-based alloy EN AW-6082, whose hardness was 111 ± 5 HV0.05. It should be noted that, in these diagrams, the experimental values represent the arithmetic averages obtained from the three specimens at the end of each intermediate interval.
The slightly lower cavitation resistance of the investigated AZ31B alloy is evident both from the slopes of the M(t) curves and from the differences in the ordinate values within the linear regions of the Rcav(t) curves over the interval (45(60)–165 min).
If the values of Mmax and Rcav,s are taken as reference, it can be observed that the investigated alloy exhibits a lower resistance by approximately 26% according to Mmax and by about 3.77 times according to Rcav,s.
The discrepancy between these two evaluations is attributed to the strain-hardening increment, reflected by the increase ΔRcav = ((Rcav,s − Rcav,i) 100/Rcav,i), which is 8.2% for the 6082 alloy compared to 6.1% for AZ31B (as shown in Figure 4b), as well as to differences in chemical composition.

3.3. Macrography of Cavitated Surfaces

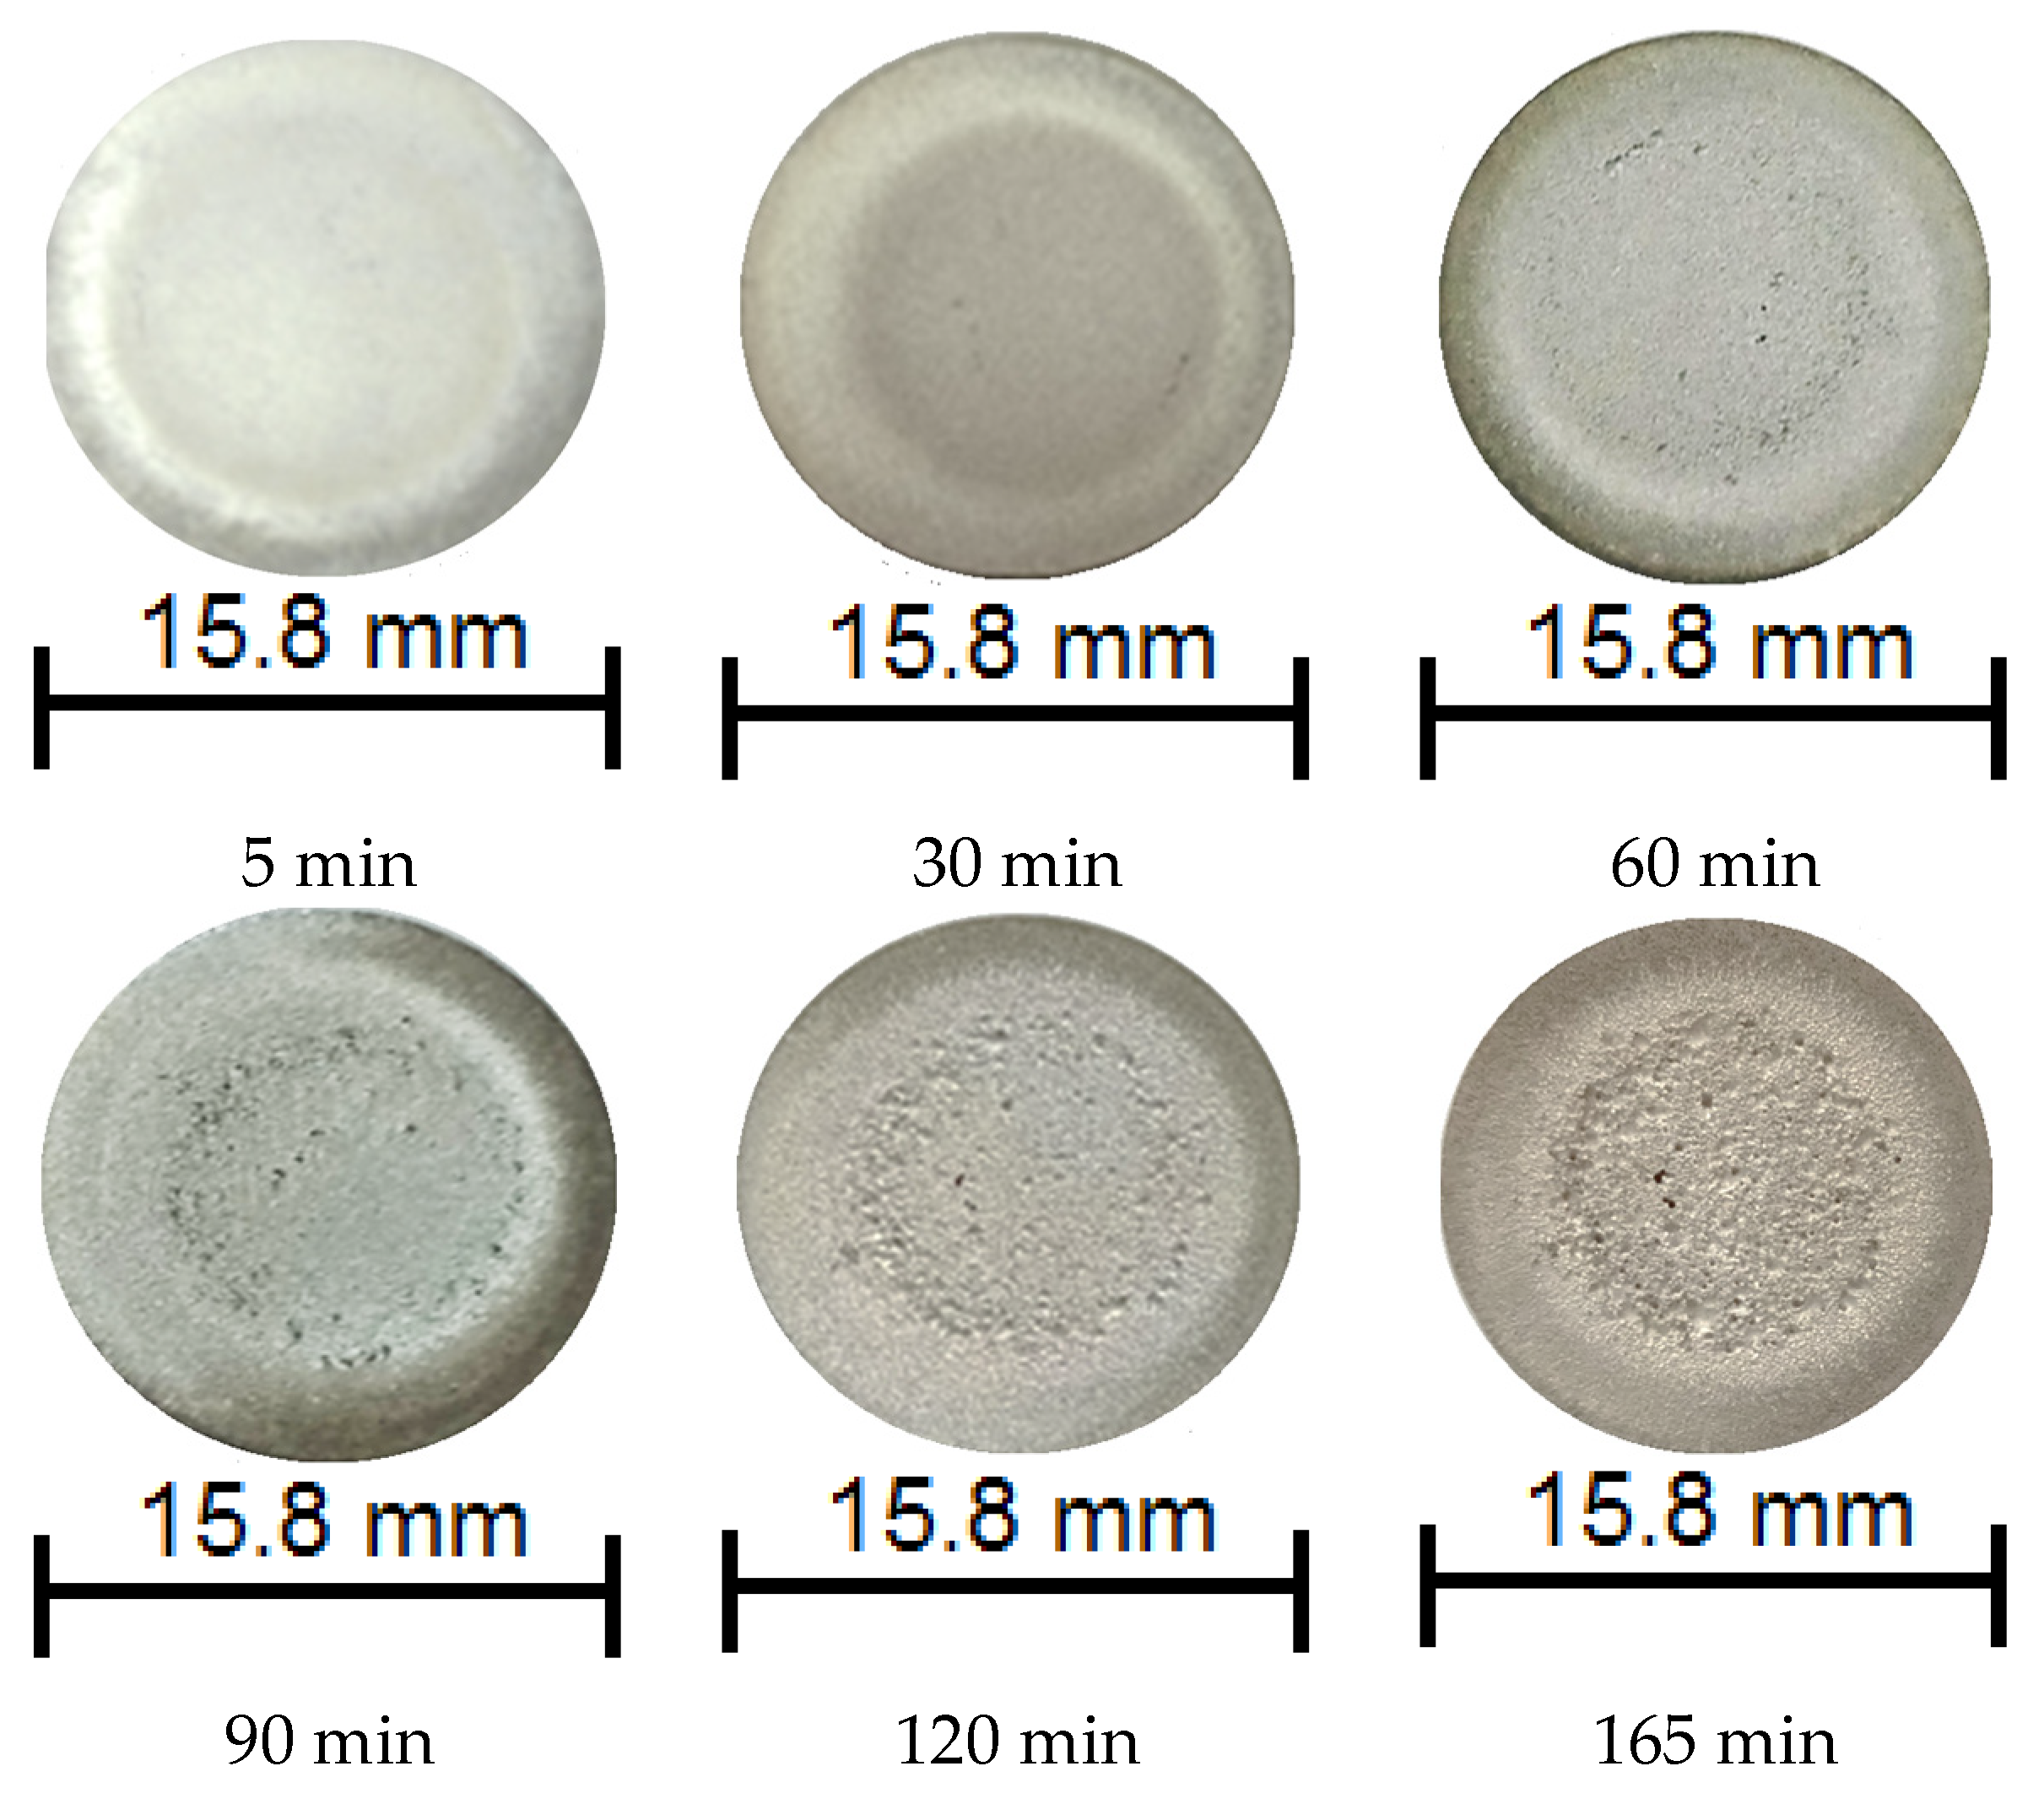
These observations demonstrate that after the first 30 min, the evolution of cavity geometry is consistent with the variation in cumulative mass loss and cavitation resistance, confirming the low resistance of the material to pressures generated by the impact of shock waves and cavitation microjets (Figure 5). According to the results of Bordeasu et al. [36], obtained on 39 aluminum alloys, such cavities—characterized by dimensions indicative of low cavitation resistance—are typical of materials with high plasticity (with impact toughness KCU above 9 J/cm2 and elongation A5 above 12%).
Since the investigated alloy, AZ31B, exhibits an impact toughness KCU above 15 J/cm2 and an elongation A5 above 20%, it can be inferred that these mechanical properties represent one of the contributing factors to this behavior.
The small differences between the cavities observed at 90 min, 120 min, and 165 min confirm the findings reported in [1,3,4], according to which, simultaneously with crack propagation and material removal, mechanical hardening of the affected surface layer also occurs.
Considering that the formation of the attached cavitation bubble cloud on the surface and the bubble collapse both occur through a vibration-driven mechanism, it is assumed that, once cavities are formed, the intensity of the impact pressure forces is attenuated by the air and water trapped within these cavities during the compression phase of the sonotrode.
Therefore, this attenuation effect is one of the factors responsible for maintaining the very small differences in mass loss values, which in turn contribute to the nearly linear trend of the M(t) curve.

3.4. Microstructure and Surface Topography of Cavitated Surfaces

In general, intermetallic phases embedded within a metallic matrix contribute to the improvement of mechanical properties. However, they exhibit a different influence on cavitation erosion resistance. The pressure generated by the collapse of cavitation bubbles acts impulsively over a very small surface area; therefore, the critical impact pressure exerted on the material—representing the minimum impact load—should remain below its fracture strength.
The effect of intermetallic phases depends on their quantity, size, and dispersion within the microstructure. The presence of fine and uniformly distributed phases is beneficial for enhancing cavitation resistance. Similarly, a homogeneous solid solution structure with fine grains contributes to improved cavitation resistance.
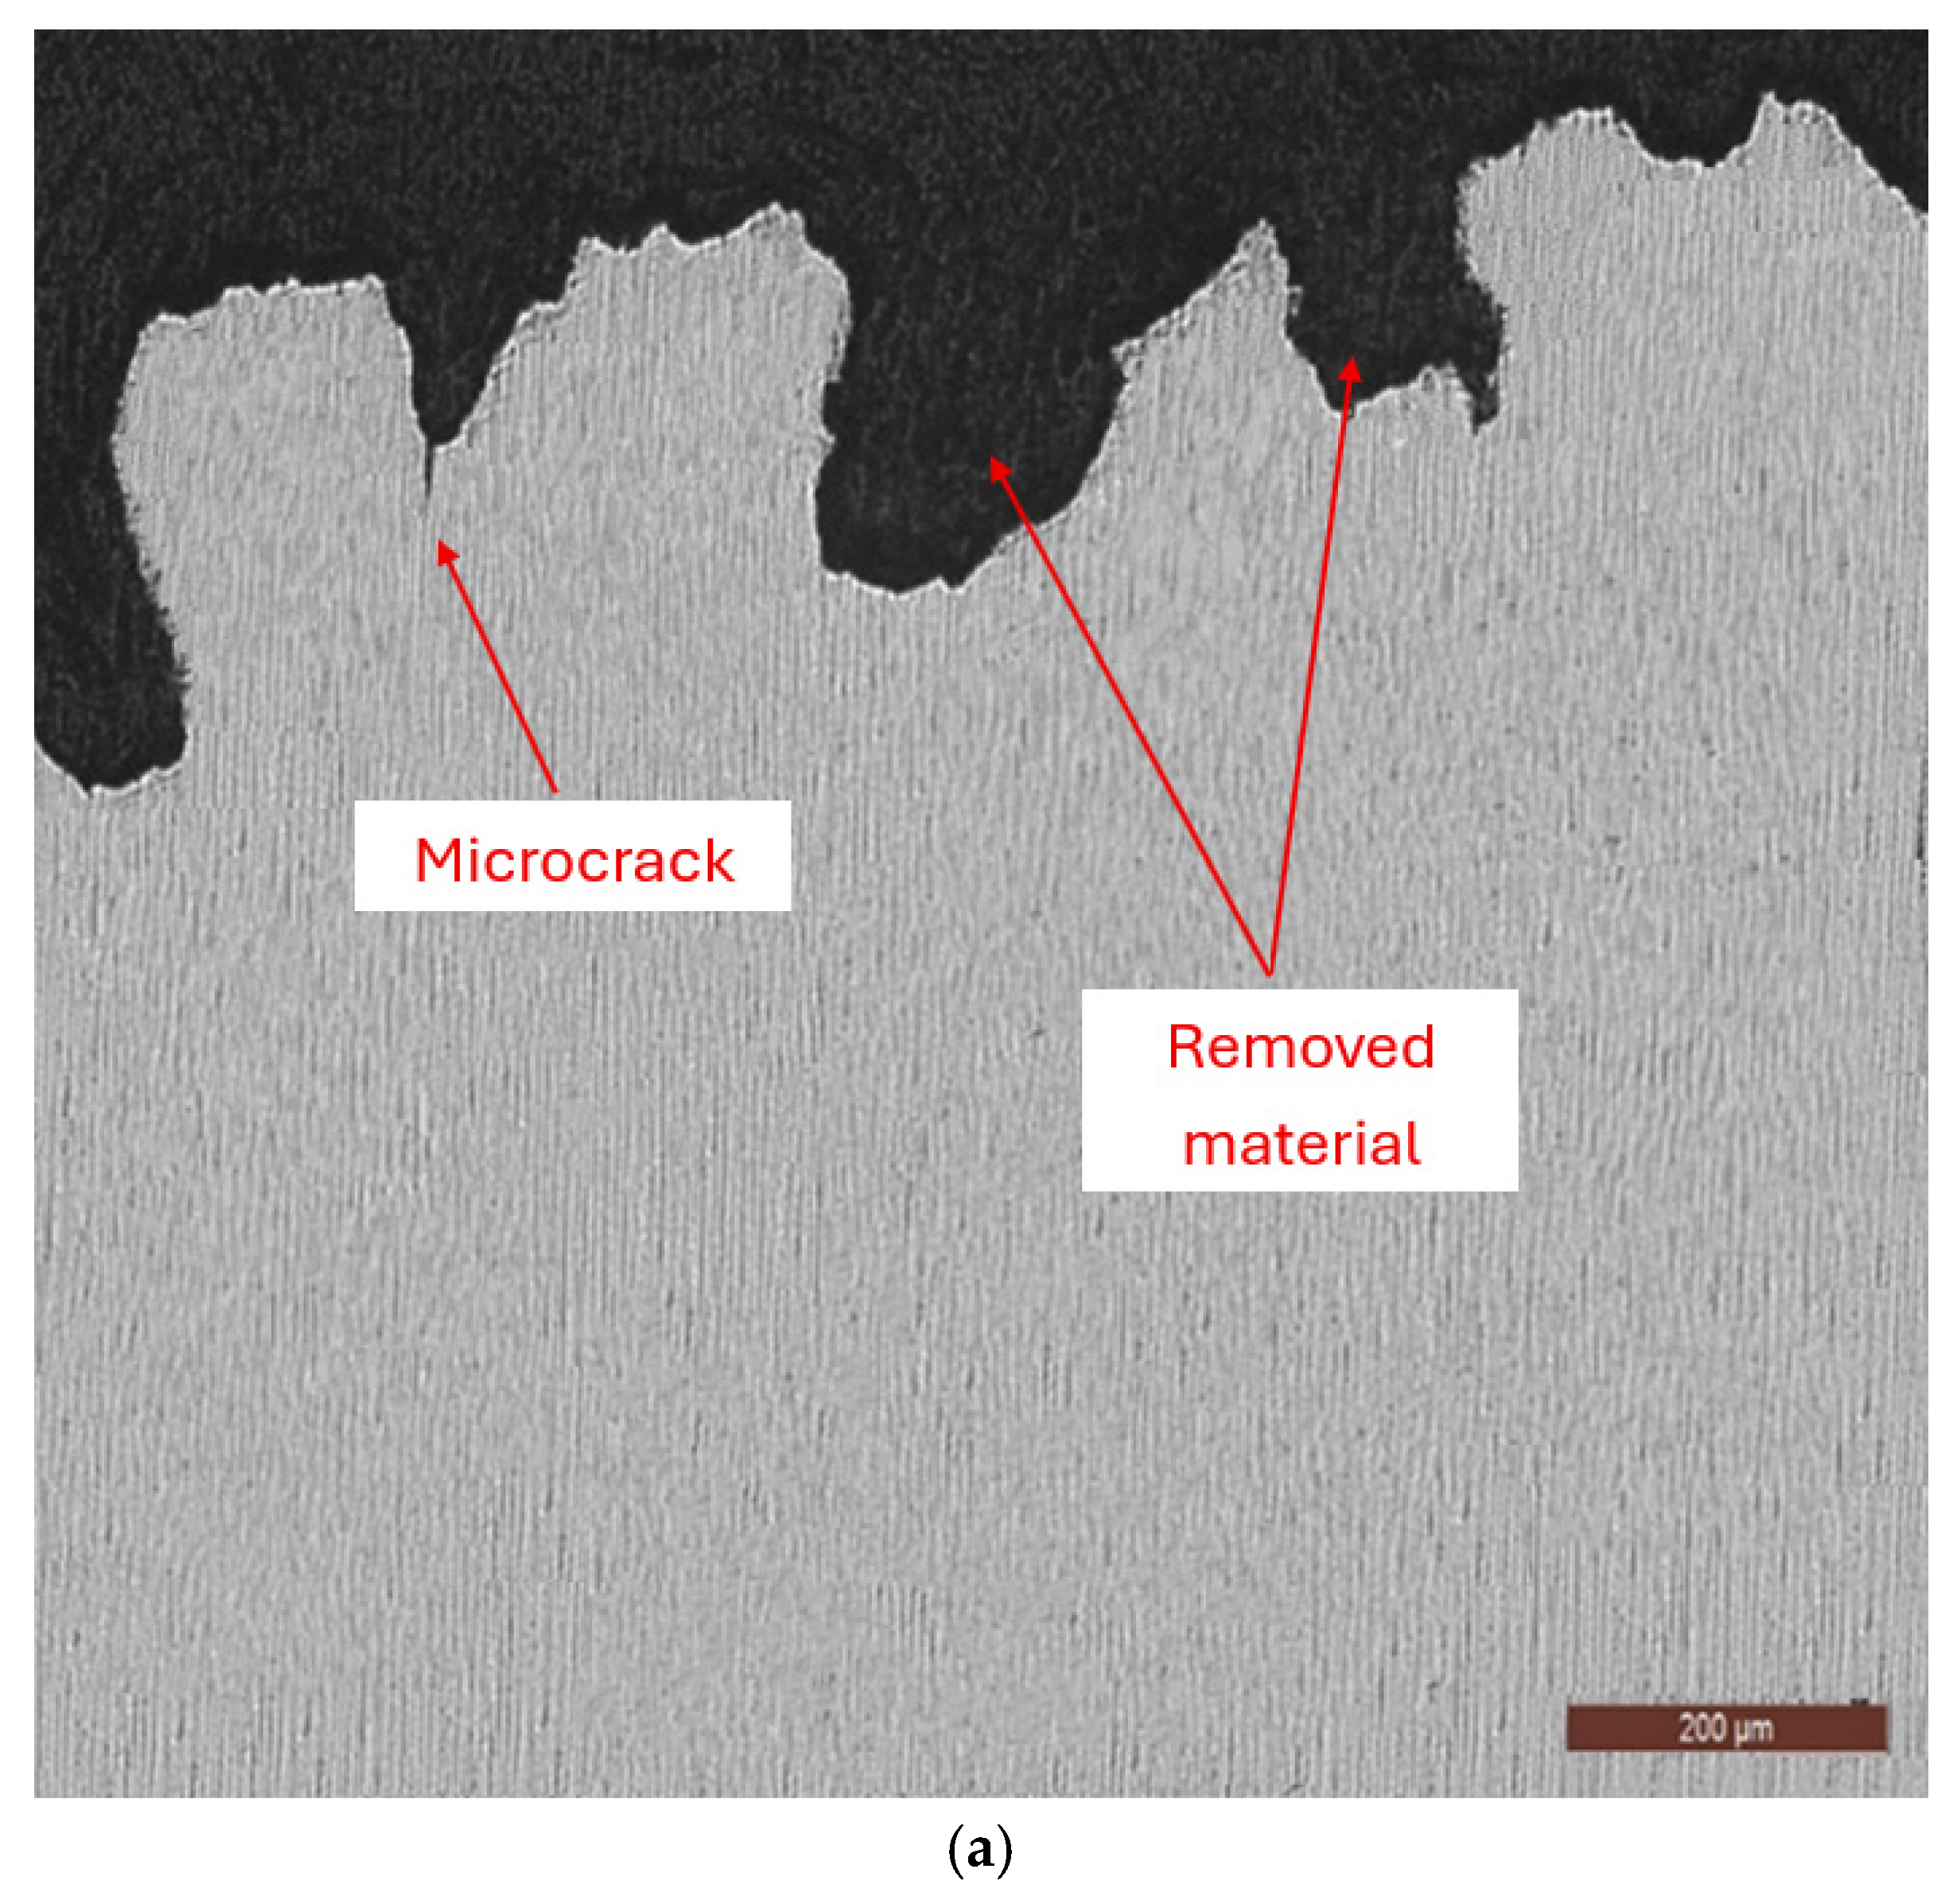
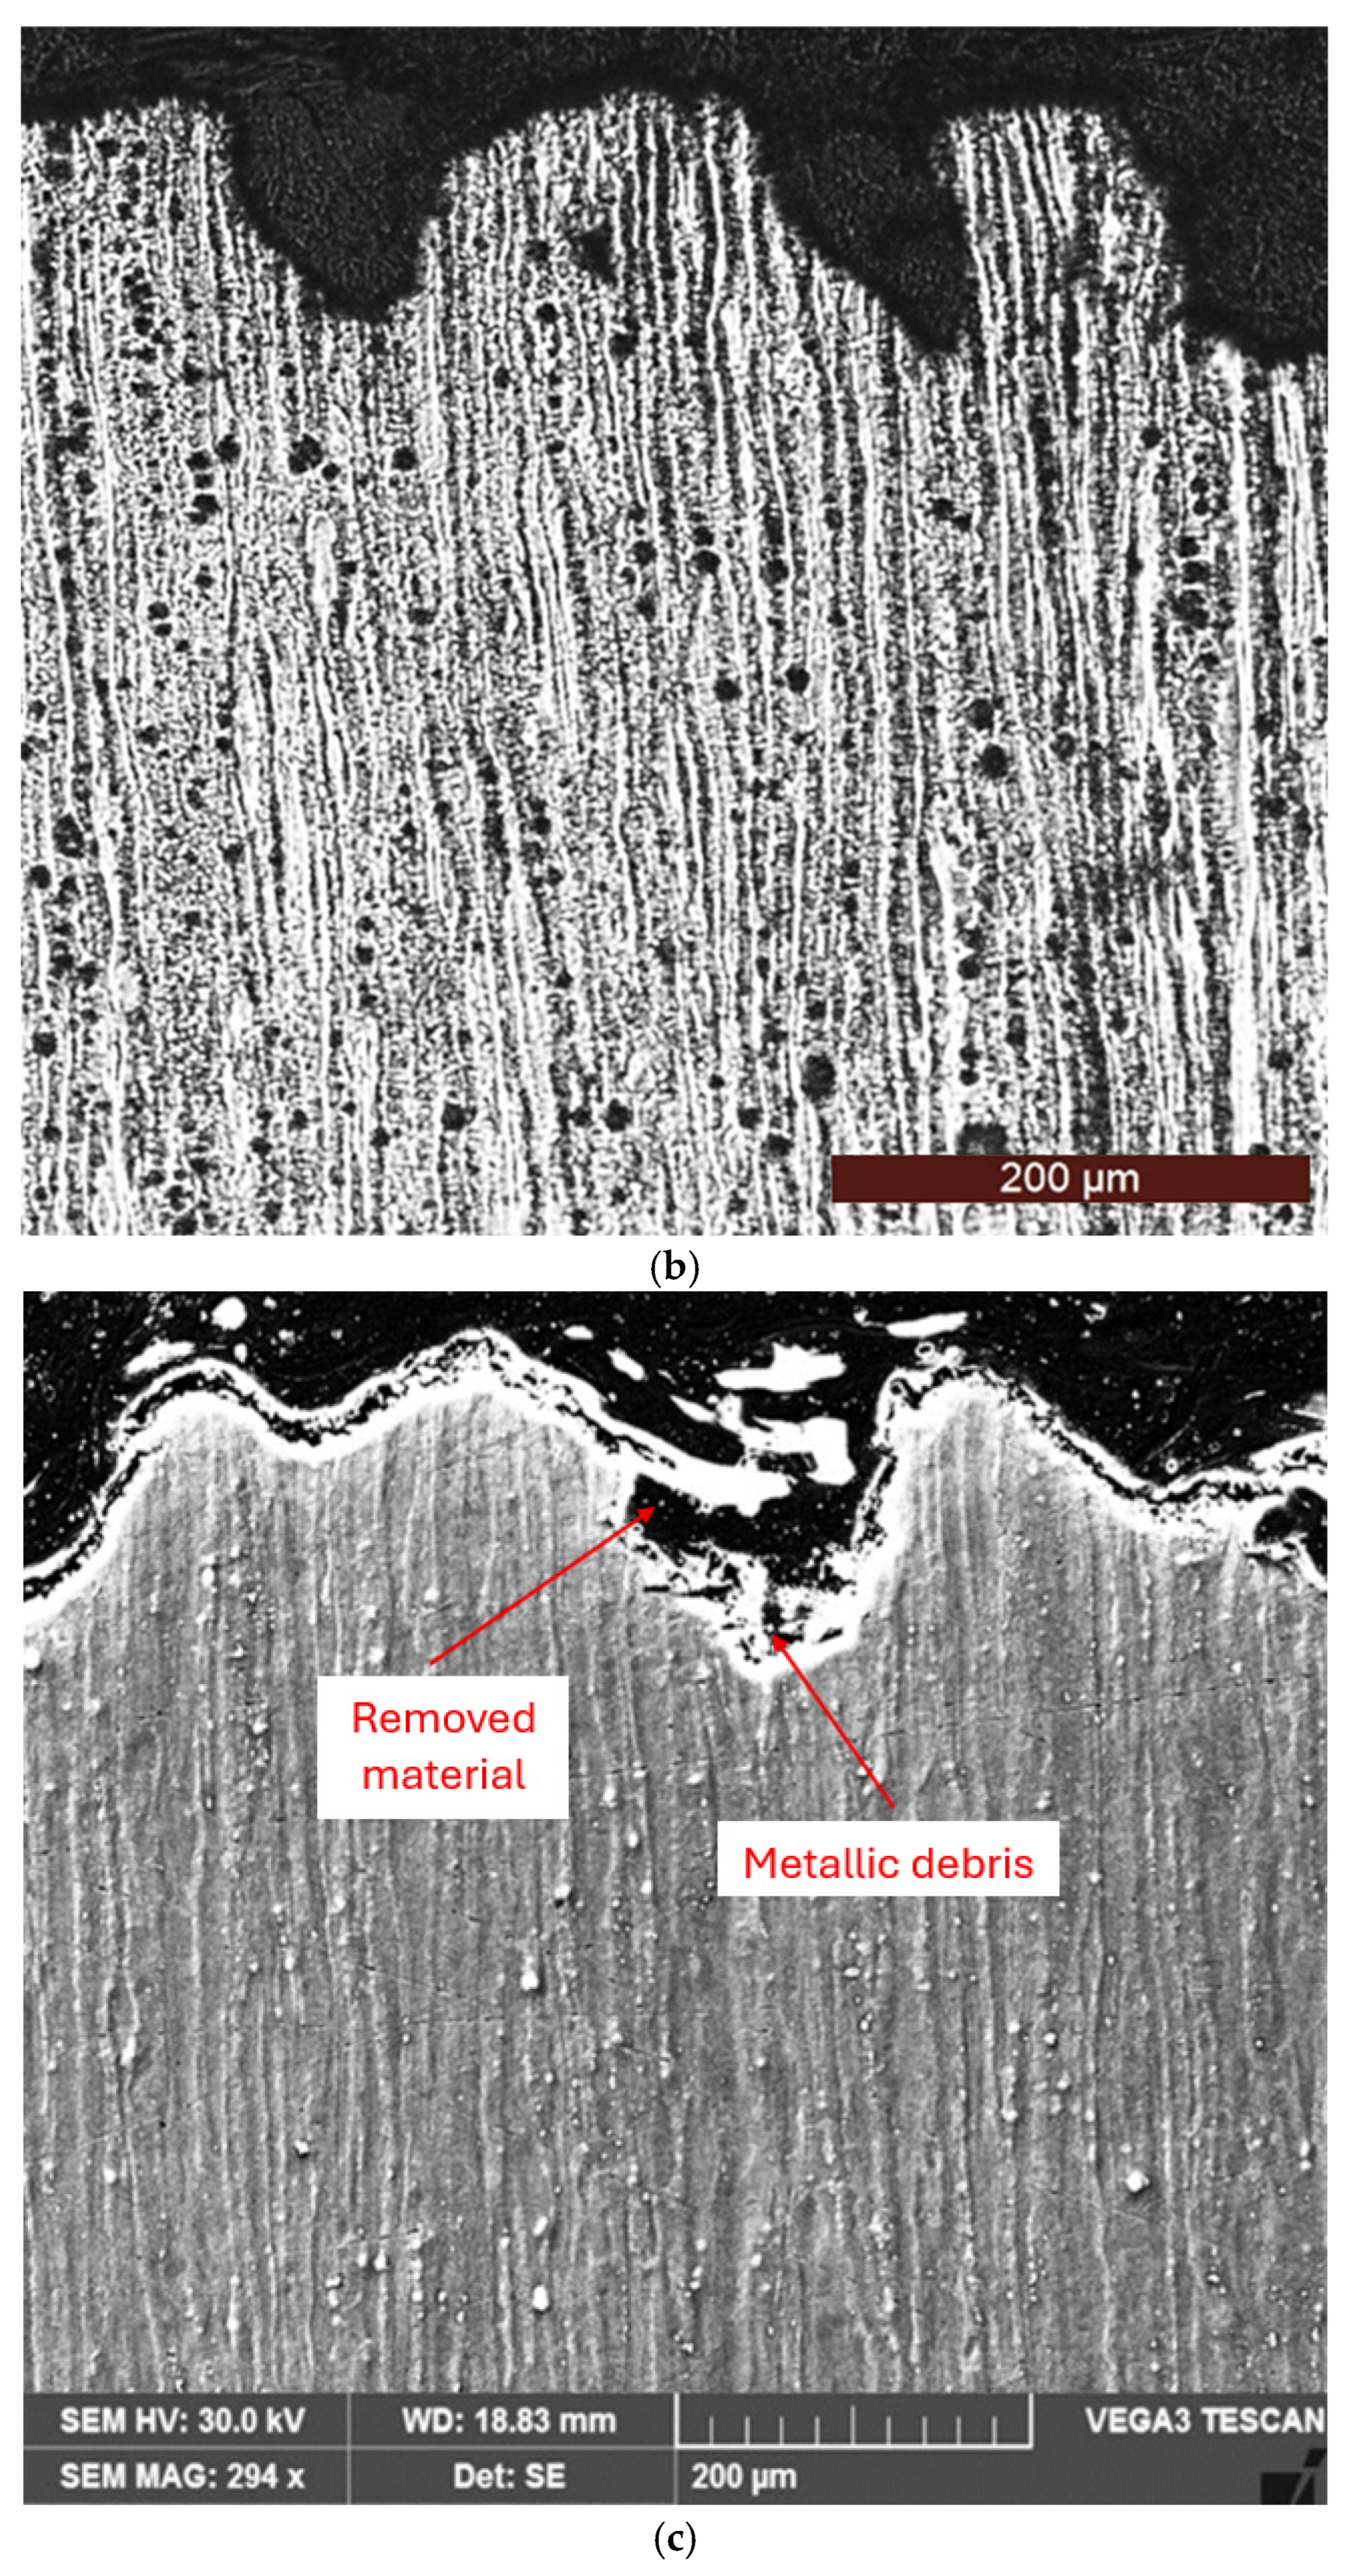
The micrographs presented in Figure 6 confirm that the morphology of the cavitation-eroded surface is consistent with the temporal evolution of the erosion rate shown in Figure 3 and Figure 4. After the completion of cavitation tests, pronounced surface degradation can be observed, characterized by the removal of a significant amount of material and the formation of large craters in certain regions (Figure 6a,b).
As a result of the repeated impact of high-velocity, high-pressure microjets generated during bubble collapse, the alloy surface undergoes plastic deformation, cracking, and stress concentration at grain boundaries and at the interfaces between intermetallic phases and the matrix. Consequently, cavitation erosion damage initiates preferentially at grain boundaries and at the interfaces between the α-Mg solid solution and intermetallic phases.
With increasing cavitation exposure time, cracks initiate and propagate along grain boundaries, leading to severe surface degradation and the formation of debris (Figure 6c). As cracks propagate and coalesce, a substantial amount of material is removed from the eroded surface. Previous studies have shown that intermetallic phases are preferentially removed due to the initiation of deformation and cracking at the particle–matrix interface [32].
Tzanakis et al. [33] quantified the characteristic parameters of the cavitation implosion process and reported that most hydrodynamic impacts ranged between 0.4 and 1 GPa, while the corresponding microjet velocities varied between 200 and 700 m/s.
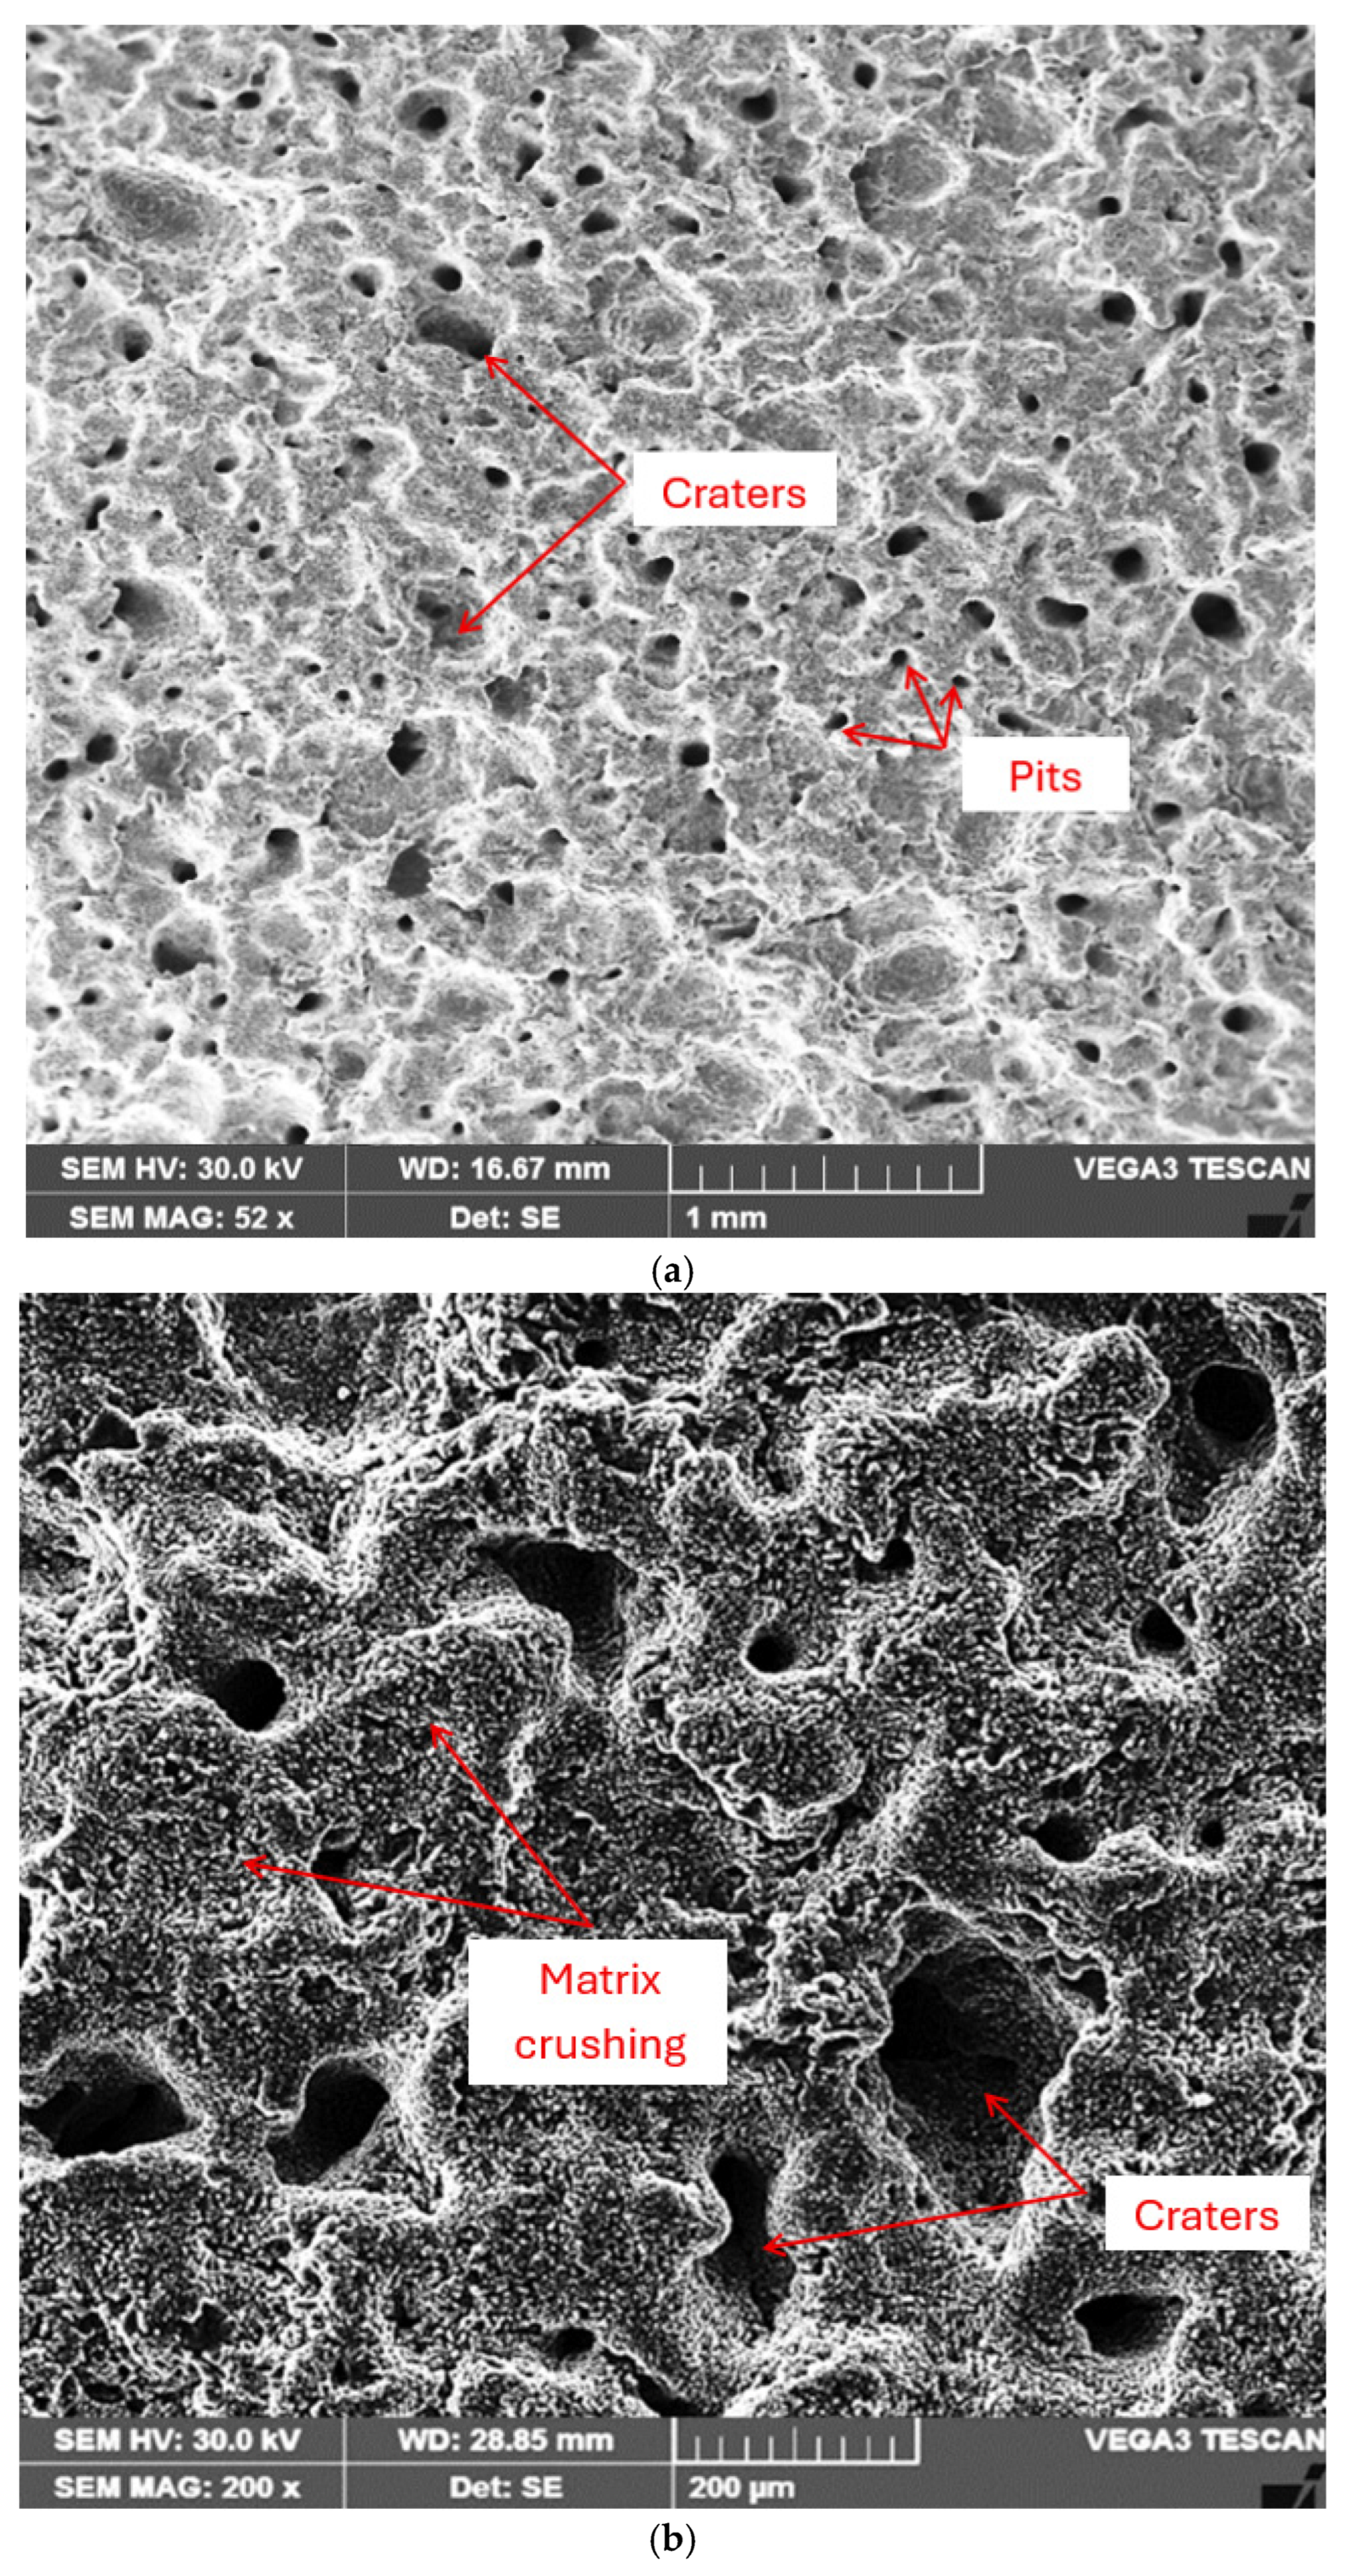
Typical surface topographies of the specimens subjected to cavitation for 165 min (Figure 7a) reveal the formation of craters with depths that may exceed 40 μm, resulting from the partial or complete removal of α-Mg solid solution grains together with intermetallic phase particles, which exhibit pronounced brittleness.
The localized cyclic impact of the fluid on the alloy surface leads to an increase in the density of pits of varying sizes and to fragmentation of the crystalline grains (Figure 7b).
These findings are fully consistent with those reported in other studies on cavitation erosion of non-ferrous alloys whose base metal exhibits a hexagonal close-packed crystal structure [18,34].

3.5. Energy-Dispersive X-Ray Spectroscopy (EDX) Analysis

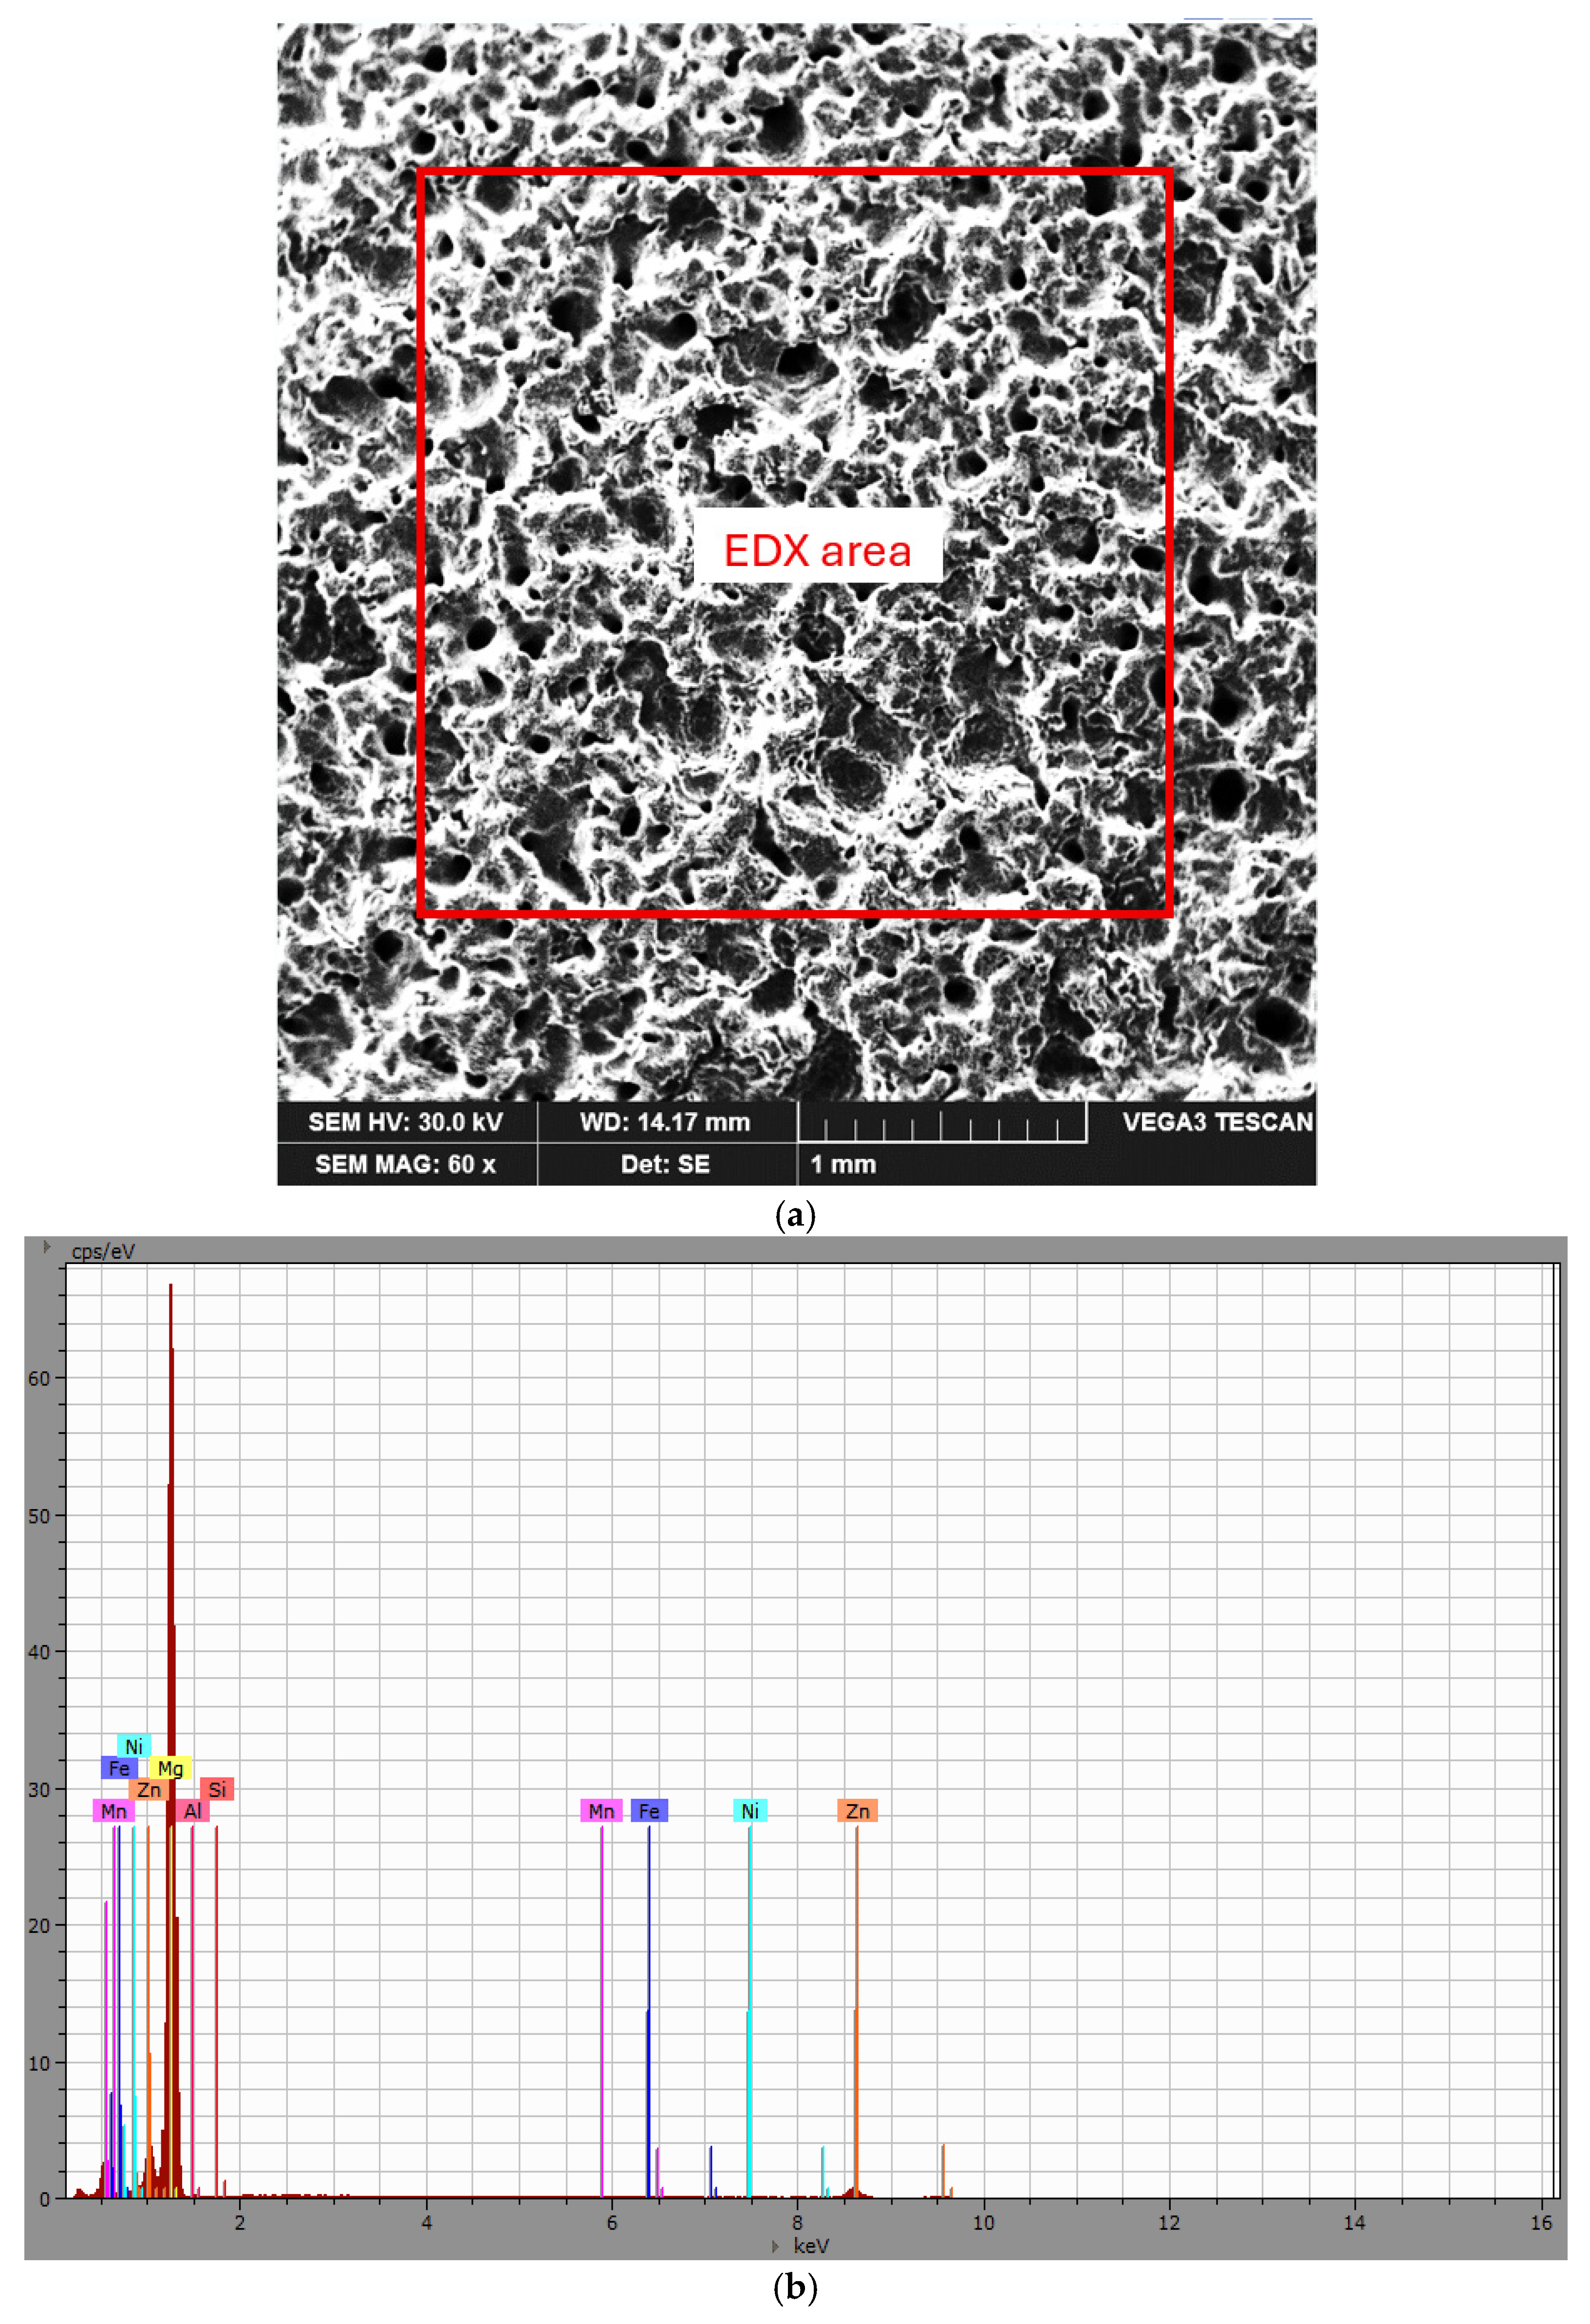
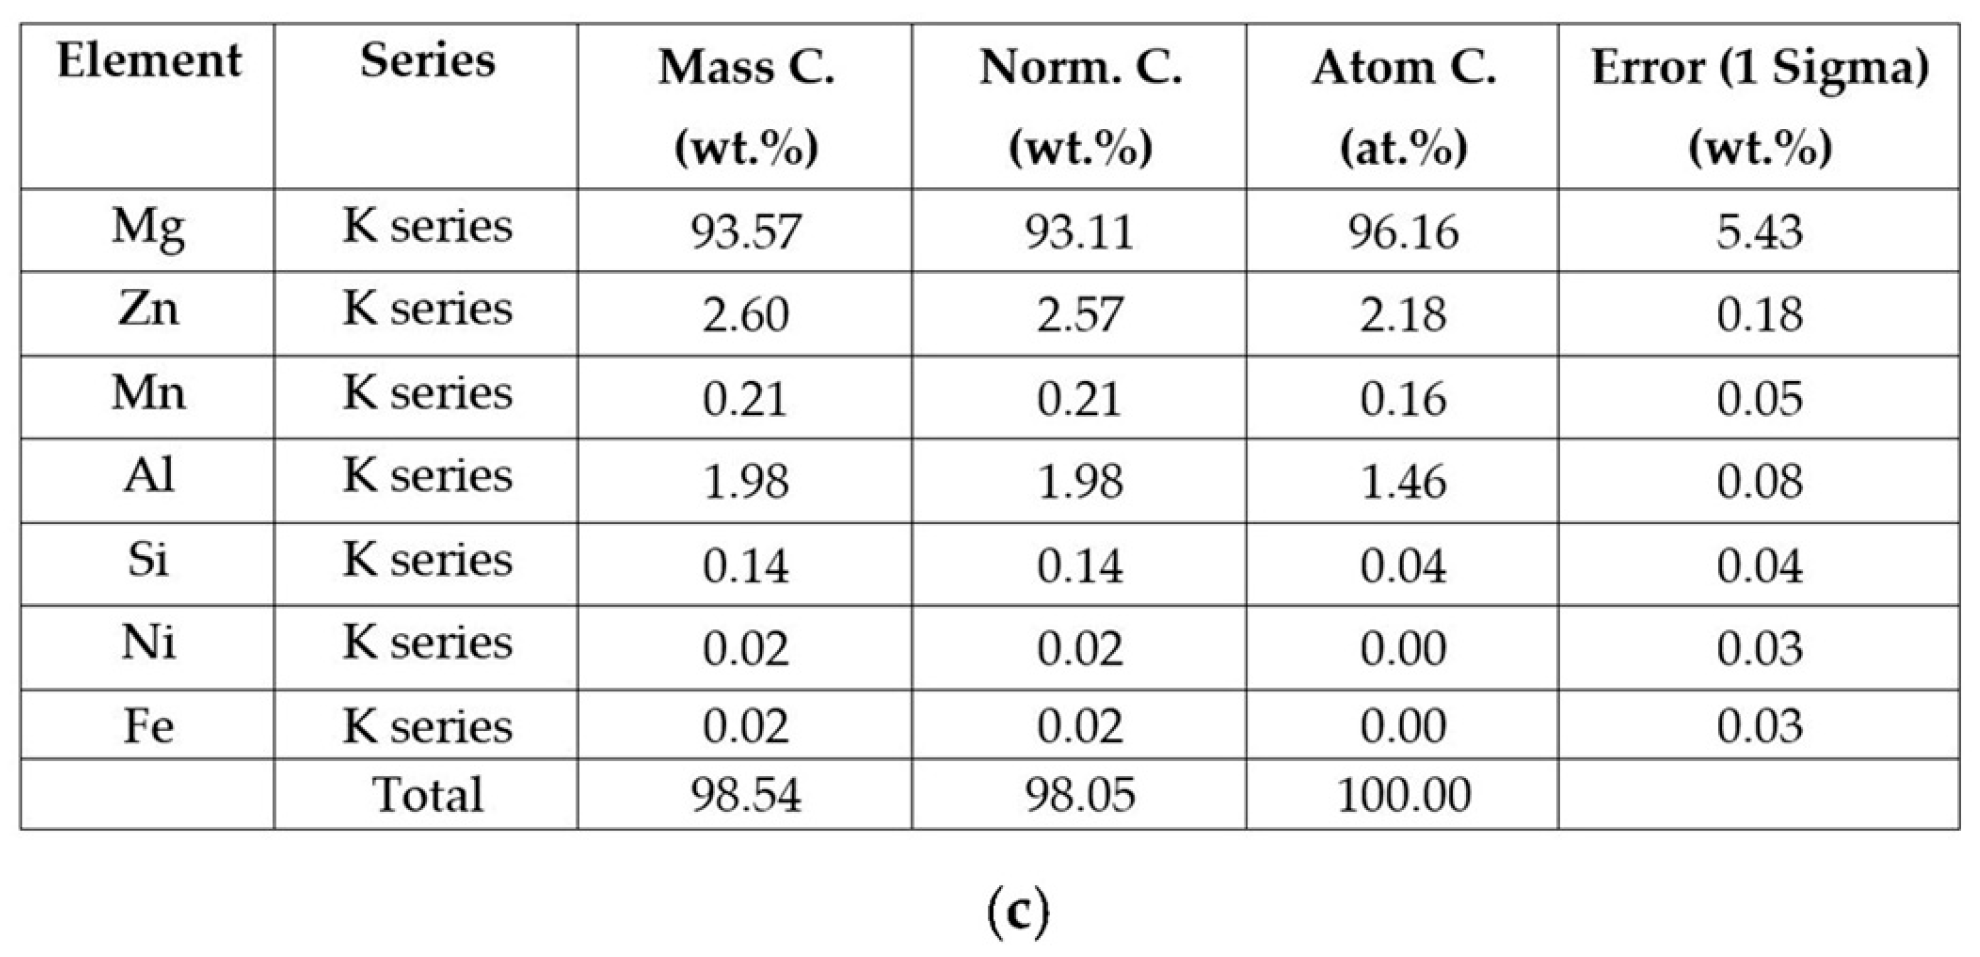
Figure 8 shows the SEM micrograph of a region on the surface cavitated for 165 min (a), the corresponding energy-dispersive X-ray (EDX) spectrum (b), and the chemical composition of the alloy (c).
Although the chemical elements detected on the eroded surface remain the same as those present before the cavitation test, material removal leads to the detachment of phases rich in Mg and Al, resulting in a slight reduction in the concentration of these elements.

3.6. X-Ray Diffraction (XRD) Analysis

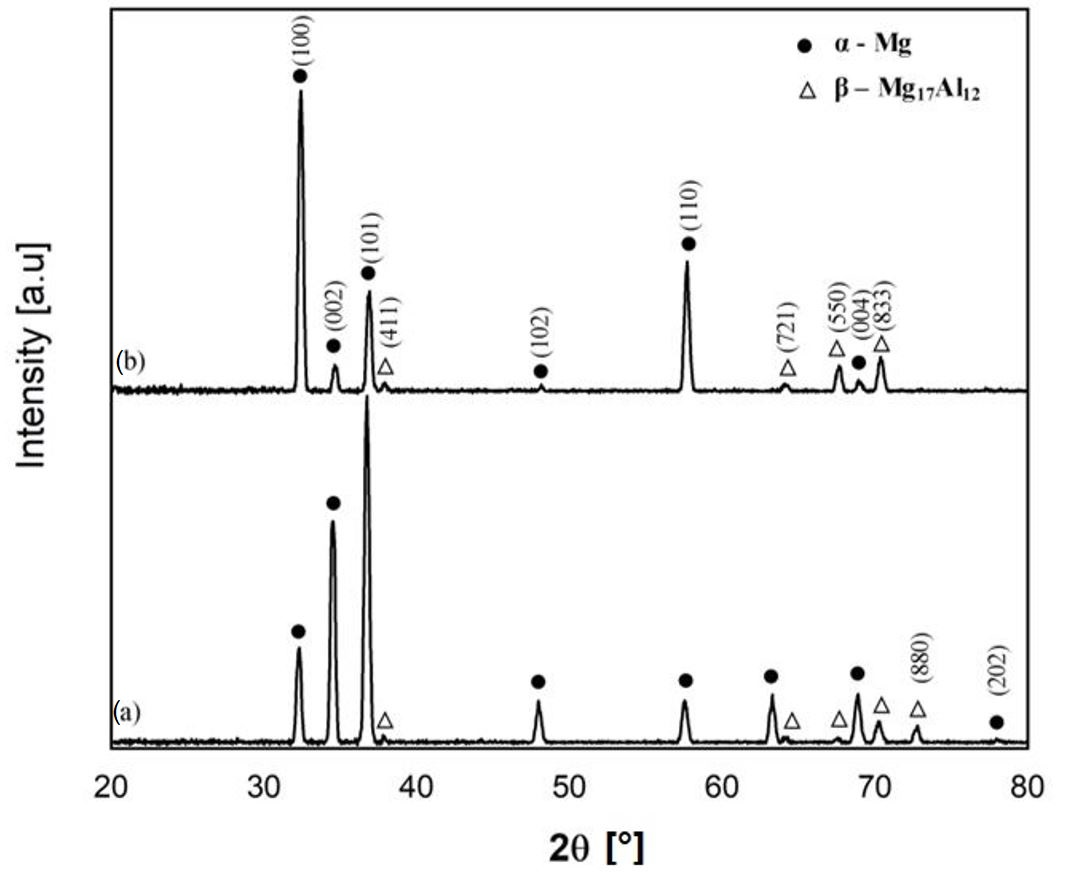
The X-ray diffraction analysis reveals the presence of two main crystalline phases (Figure 9). The diffraction patterns are dominated by reflections corresponding to the α-Mg phase (ICDD PDF No. 35-0821) with a hexagonal close-packed (hcp) crystal structure, which represents the matrix of the alloy. In addition to α-Mg, characteristic diffraction peaks associated with the intermetallic β-Mg17Al12 phase (ICDD PDF No. 73-1148), exhibiting a body-centered cubic structure, are detected.
A comparison of the X-ray diffraction patterns recorded before and after cavitation treatment reveals that the phase constitution of the Mg–Al alloy remains unchanged, with α-Mg as the matrix phase and β-Mg17Al12 as the secondary intermetallic phase. However, significant differences in peak shape and relative intensity are observed after cavitation. In particular, the diffraction peaks corresponding to the α-Mg phase become noticeably broader, indicating an increase in lattice distortions, microstrain, and grain refinement induced by the cavitation process. At the same time, the characteristic reflections of the β-Mg17Al12 phase exhibit a marked reduction in intensity, suggesting fragmentation and partial dissolution or redistribution of the intermetallic precipitates within the magnesium matrix. No additional crystalline phases were detected after cavitation, demonstrating that the damaging process primarily affects the microstructural state rather than inducing phase transformations.

4. Conclusions

Due to their excellent specific mechanical strength (Rm/ρ), magnesium-based alloys are used in the aerospace industry, transportation sector, and medical field.
The cavitation erosion resistance of the AZ31B alloy in the hot-rolled condition is relatively low, being approximately 3.77 times lower than that of the 6082 alloy. Consequently, it can only be used for components operating in cavitation flows with low to moderate hydrodynamic intensity.
The pressure generated by the collapse of cavitation bubbles leads to the formation of localized plastic deformations on the surface of the investigated alloy, as well as cracking phenomena and stress concentrations at grain boundaries and at the interfaces between intermetallic phases and the matrix.
The propagation and coalescence of cracks result in severe degradation of the cavitation-eroded surface, with removal of a significant amount of material, the formation of large craters in certain areas, and the presence of debris.
Typical cavitated surface topographies reveal degradation characteristic of metallic alloys whose base component exhibits a hexagonal close-packed crystal structure.

Author Contributions

Conceptualization, I.M., I.B. and I.-D.U.; methodology, C.C., I.M., I.B., D.B., C.M.C. and I.-D.U.; investigation, C.C., I.M., I.B., D.B., C.M.C. and I.-D.U.; writing—original draft preparation, I.M., I.B. and I.-D.U.; writing—review and editing, C.C., I.M., I.B., D.B. and I.-D.U.; visualization, C.C., I.M., I.B., D.B., C.M.C. and I.-D.U.; supervision, I.M., I.B. and I.-D.U. All authors have read and agreed to the published version of the manuscript.

Funding

This research received no external funding.

Data Availability Statement

The original contributions presented in this study are included in the article. Further inquiries can be directed to the corresponding author.

Conflicts of Interest

The authors declare no conflicts of interest.

References

  1. Kopyscianski, M.; Kalemba-Rec, I.; Węglowski, M.S.; Krella, A.; Kwiecien, M. Effect of friction stir processing on the microstructure and cavitation erosion behavior of AlSi9Mg aluminum alloy. J. Mater. Res. Technol. 2026, 42, 650–662. [Google Scholar] [CrossRef] [Scilit]
  2. Zagar, S.; Soyama, H.; Markoli, B.; Nagli, I.; Sturm, R. Enhancing the surface strength of magnesium alloy AZ80 through cavitation peening. Mater. Des. 2025, 255, 114229. [Google Scholar] [CrossRef] [Scilit]
  3. Ghiban, B.; Bordeasu, I.; Mitelea, I.; Vasile, E.; Popovici, R.A.; Popoviciu, M.O.; Badarau, R. Influence of Homogenization Heat Treatments on the Mechanical, Structural, Biodegradation, and Cavitation Behavior of Some Alloys in the ZnMg(Fe) System. Crystals 2025, 15, 458. [Google Scholar] [CrossRef] [Scilit]
  4. Krella, A.K. Degradation and protection of materials from cavitation erosion: A review. Materials 2023, 16, 2058. [Google Scholar] [CrossRef] [Scilit] [PubMed]
  5. Peng, K.; Kang, C.; Li, G.; Matsuda, K.; Soyama, H. Effect of heat treatment on the cavitation erosion resistance of stainless steel. Mater. Corros. 2017, 69, 536–544. [Google Scholar] [CrossRef] [Scilit]
  6. Lamana, M.S.; Pukasiewicz, A.G.M.; Sampath, S. Influence of cobalt content and HVOF deposition process on the cavitation erosion resistance of WC-Co coatings. Wear 2017, 398–399, 209–219. [Google Scholar] [CrossRef] [Scilit]
  7. Lavigne, S.; Pougoum, F.; Savoie, S.; Martinu, L.; Klemberg-Sapiecha, J.E.; Schulz, R. Cavitation erosion behaviour of HVOF CaviTec coatings. Wear 2017, 386–387, 90–98. [Google Scholar] [CrossRef] [Scilit]
  8. Momeni, S.; Tillmann, W.; Pohl, M. Composite cavitation resistant PVD coatings based on NiTi thin films. Mater. Des. 2016, 110, 830–838. [Google Scholar] [CrossRef] [Scilit]
  9. Krella, A.; Marchewicz, A. Effect of the reversal of the layer thickness ratio in the CrN/CrCN multilayer coating on cavitation-induced degradation. Tribol. Int. 2022, 168, 107432. [Google Scholar] [CrossRef] [Scilit]
  10. Stella, J.; Schüller, E.; Heßing, C.; Hamed, O.A.; Pohl, M.; Stover, D. Cavitation erosion of plasma-sprayed NiTi coating. Wear 2006, 260, 1020–1027. [Google Scholar] [CrossRef] [Scilit]
  11. Wang, Y.; Liu, J.; Kang, N.; Darut, G.; Poirier, T.; Stella, J.; Liao, H.; Planche, M.P. Cavitation erosion of plasma-sprayed CoMoCrSi coatings. Tribol. Int. 2016, 102, 429–435. [Google Scholar] [CrossRef] [Scilit]
  12. Vaidya, S.; Preece, C.M. Cavitation erosion of age-hardenable aluminum alloys. Metall. Trans. A 1978, 9, 299–307. [Google Scholar] [CrossRef] [Scilit]
  13. Lee, S.J.; Kim, K.H.; Kim, S.J. Surface analysis of Al-Mg alloy series for ship after cavitation test. Surf. Interface Anal. 2011, 44, 1389–1392. [Google Scholar] [CrossRef] [Scilit]
  14. Rao, B.C.S.; Buckley, D.H. Erosion of aluminum 6061-T6 under cavitation attack in mineral oil and water. Wear 1985, 105, 171–182. [Google Scholar] [CrossRef] [Scilit]
  15. Gottardi, G.; Tocci, M.; Montesano, L.; Pola, A. Cavitation erosion behaviour of an innovative aluminium alloy for Hybrid Aluminium Forging. Wear 2018, 394–395, 1–10. [Google Scholar] [CrossRef] [Scilit]
  16. Auret, J.G.; Damm, O.F.R.A.; Wright, G.J.; Robinson, F.P.A. Cavitation erosion of copper and aluminium in water at elevated temperature. Tribol. Int. 1993, 26, 421–429. [Google Scholar] [CrossRef] [Scilit]
  17. Mitelea, I. Stiinta Materialelor II; Editura Politehnica: Timisoara, Romania, 2010; pp. 213–216. [Google Scholar]
  18. Dybowski, B.; Szala, M.; Kiełbus, A.; Hejwowski, T. The mechanisms of cavitation erosion of the Elektron21 magnesium alloy. Solid State Phenom. 2015, 229, 99–104. [Google Scholar] [CrossRef] [Scilit]
  19. Rzychoń, T.; Chmiela, B.; Mościcki, A.; Dybowski, B.; Jendrysko, S. The influence of heat treatment on the microstructure and hardness of Mg-5Si-7Sn-5Mn alloy. Solid State Phenom. 2015, 229, 83–88. [Google Scholar] [CrossRef] [Scilit]
  20. Zhang, J.; Miao, J.; Balasubramani, N.; Cho, D.H.; Avey, T.; Chang, C.-Y.; Luo, A.A. Magnesium research and applications: Past, present and future. J. Magnes. Alloys 2023, 11, 3867–3895. [Google Scholar] [CrossRef] [Scilit]
  21. Ding, Y.F.; Wen, C.E.; Hodgson, P.; Li, Y.C. Effects of alloying elements on the corrosion behavior and biocompatibility of biodegradable magnesium alloys: A review. J. Mater. Chem. B 2014, 2, 1912–1933. [Google Scholar] [CrossRef] [Scilit] [PubMed]
  22. Yang, Y.; Xiong, X.; Chen, J.; Peng, X.; Chen, D.; Pan, F. Research advances of magnesium and magnesium alloys worldwide in 2022. J. Magnes. Alloys 2023, 11, 2611–2654. [Google Scholar] [CrossRef] [Scilit]
  23. Liao, H.; Zeng, M.; Chen, H. Impression creep behavior of magnesium alloy ZK60. Mater. Test. 2018, 60, 68–72. [Google Scholar] [CrossRef] [Scilit]
  24. Ijiri, M.; Shimonishi, D.; Tani, S.; Okada, N.; Yamamoto, M.; Nakagawa, D.; Tanaka, K.; Yoshimura, T. Improvement of corrosion resistance of magnesium alloy by high-temperature high-pressure cavitation treatment. Int. J. Light. Mater. Manuf. 2019, 2, 255–260. [Google Scholar] [CrossRef] [Scilit]
  25. Klein, M.; Wittke, P.; Hoppe, R.; Letzig, D.; Walther, F. Corrosion fatigue assessment of extruded magnesium alloys AZ31 and ME20. Mater. Test. 2018, 60, 15–21. [Google Scholar] [CrossRef] [Scilit]
  26. Ye, L.; Zhu, X.; He, Y.; Song, T.; Hu, W. Surface strengthening and grain refinement of AZ31B magnesium alloy by ultrasonic cavitation modification. Chin. J. Aeronaut. 2021, 34, 508–517. [Google Scholar] [CrossRef] [Scilit]
  27. Li, N.; Zheng, Y.F. Novel magnesium alloys developed for biomedical application: A review. J. Mater. Sci. Technol. 2013, 29, 489–502. [Google Scholar] [CrossRef] [Scilit]
  28. Cai, S.H.; Lei, T.; Li, N.F.; Feng, F.F. Effects of Zn on microstructure, mechanical properties and corrosion behavior of Mg-Zn alloys. Mater. Sci. Eng. C 2012, 32, 2570–2577. [Google Scholar] [CrossRef] [Scilit]
  29. ASTM G32-16; Standard Test Method for Cavitation Erosion Using Vibratory Apparatus. ASTM International: West Conshohocken, PA, USA, 2016.
  30. Bordeasu, I. Monografia Laboratorului de Cercetare a Eroziunii prin Cavitatie al Universitatii Politehnica Timisoara (1960–2020); Editura Politehnica: Timisoara, Romania, 2020. [Google Scholar]
  31. Bordeasu, I.; Patrascoiu, C.; Badarau, R.; Sucitu, L.; Popoviciu, M.O.; Balasoiu, V. New contributions to cavitation erosion curves modeling. FME Trans. 2006, 34, 39–43. [Google Scholar]
  32. Feller, H.G.; Kharrazi, Y. Cavitation erosion of metals and alloys. Wear 1984, 93, 249–260. [Google Scholar] [CrossRef] [Scilit]
  33. Tzanakis, I.; Eskin, D.G.; Georgoulas, A.; Fytanidis, D.K. Incubation pit analysis and calculation of the hydrodynamic impact pressure from the implosion of an acoustic cavitation bubble. Ultrason. Sonochem. 2014, 21, 866–878. [Google Scholar] [CrossRef] [Scilit] [PubMed]
  34. Satish Kumar, T.; Shalini, S.; Čep, R.; Kalita, K. Synergetic effect of TiC particles on cavitation erosion resistance of AZ31-TiC surface composites. Heliyon 2025, 11, e42602. [Google Scholar] [CrossRef] [Scilit] [PubMed]
  35. Luca, A.-N. Research on the Cavitation Erosion Resistance of Some Aluminum-Based Alloys Subjected to Artificial Aging Heat Treatment. Ph.D. Thesis, Politehnica University Timișoara, Timișoara, Romania, 2024. (In Romanian) [Google Scholar]
  36. Bordeasu, I.; Bordeasu, D.; Ghiban, B.; Stroita, D.-C.; Pirvulescu, L.-D.; Kiss, I. The Effect of the Mechanical Properties of Aluminum Alloys on Their Resistance to Cavitation Erosion. Appl. Sci. 2026, 16, 5344. [Google Scholar] [CrossRef] [Scilit]
  37. Lokesh Kumar, R.; Yashwanth Kumar, B.G.; Vaira Vignesh, R.; Kaasi Viswanath, J.; Muralimanokar, M.; Memon, S.; Govindaraju, M. Microstructure, Tribology, and Corrosion Characteristics of Hot-Rolled AZ31 Magnesium Alloy. In Advances in Processing of Lightweight Metal Alloys and Composites; Springer: Singapore, 2023; pp. 245–260. [Google Scholar]
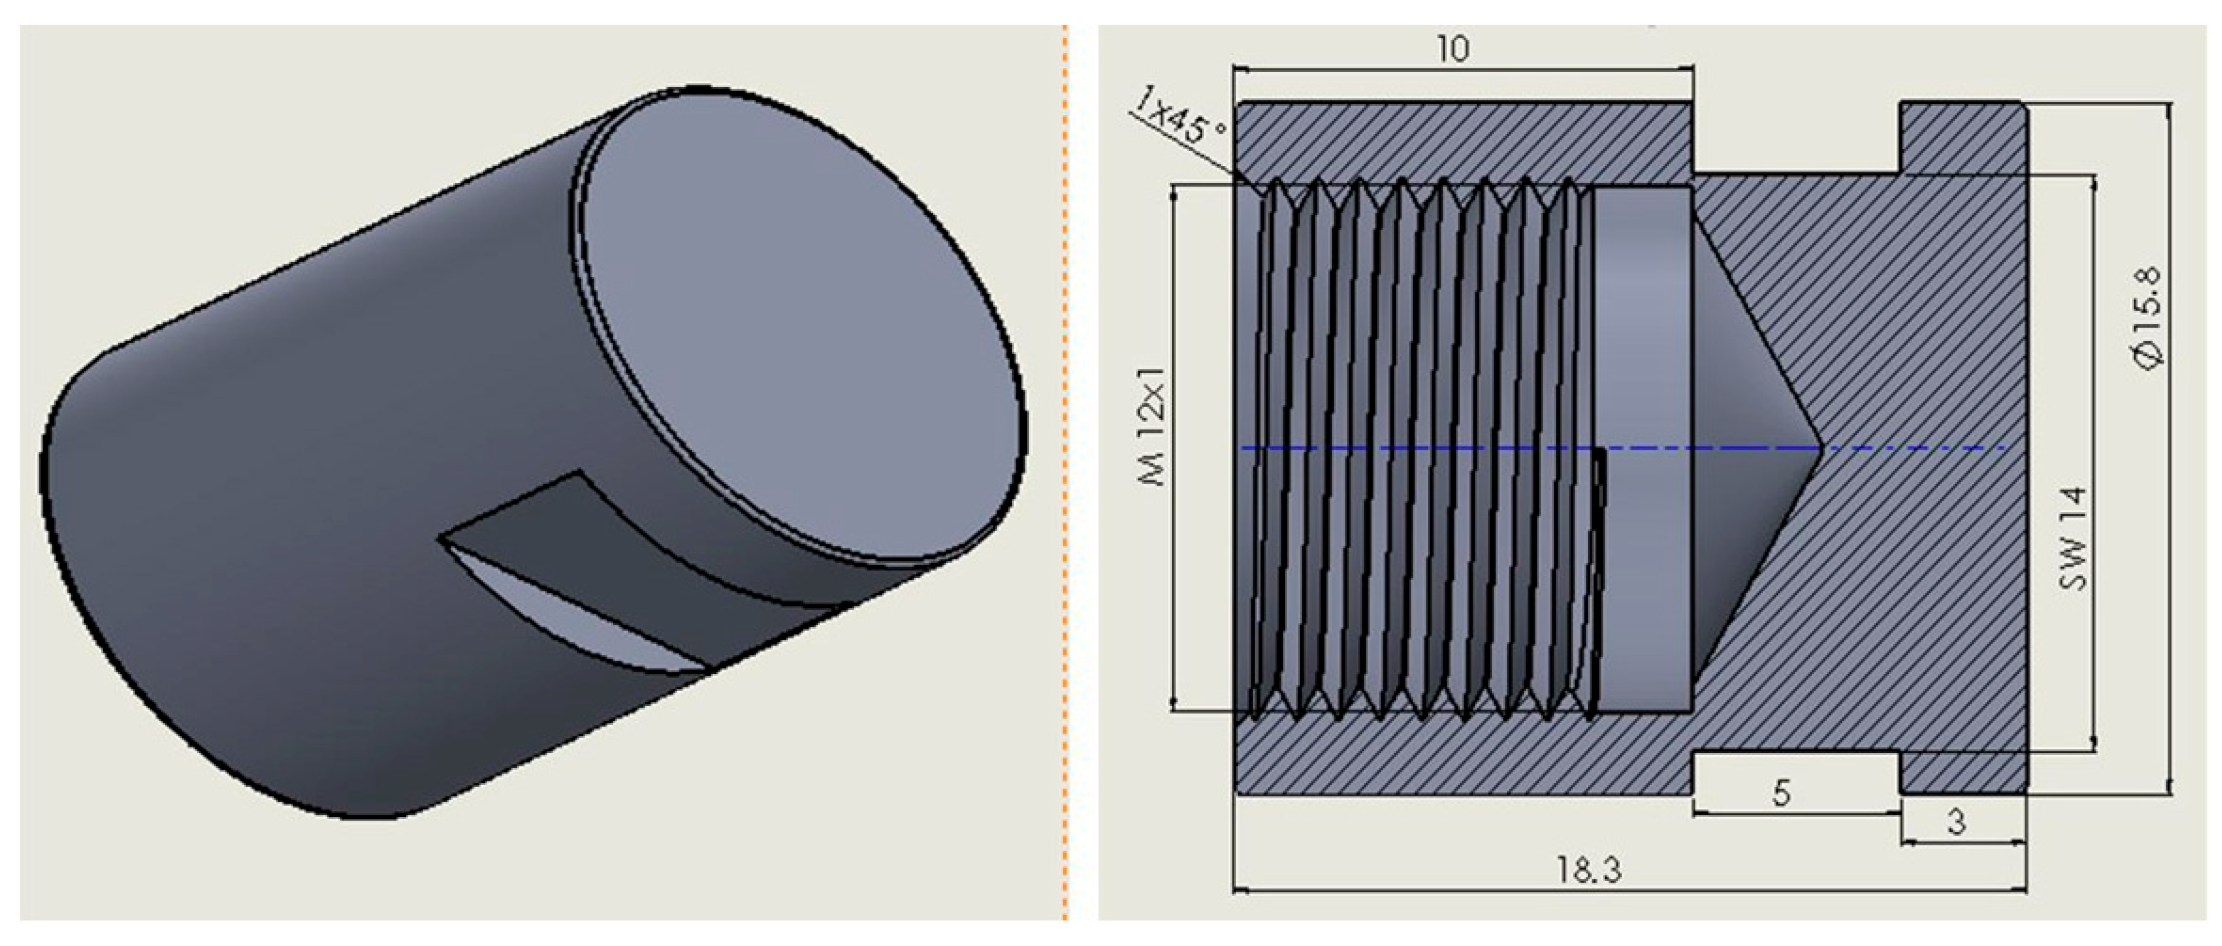
Figure 1. Geometry of the specimens used for cavitation testing.
Crystals 16 00541 g001
Figure 2. OM, ×200: metallographic morphology of the AZ31B alloy after chemical etching and before cavitation erosion.
Crystals 16 00541 g002
Figure 3. Diagrams of cavitation erosion behavior and resistance of the AZ31B alloy. (a) Variation in cumulative mass loss with cavitation time; (b) variation in the resistance to cavitation with cavitation time.
Crystals 16 00541 g003
Figure 4. Diagrams comparing the cavitation curves specific to the AZ31B and 6082 alloys. (a) Variation in cumulative mass loss with cavitation time; (b) variation in the resistance to cavitation with cavitation time.
Crystals 16 00541 g004
Figure 5. Degradation of the surface with increasing cavitation exposure time.
Crystals 16 00541 g005
Figure 6. Micrographs of cross-sections through the surfaces of specimens subjected to cavitation for 165 min: (a) OM, ×200, unetched; (b) OM, ×200, chemically etched; (c) SEM, ×290.
Crystals 16 00541 g006aCrystals 16 00541 g006b
Figure 7. SEM surface morphologies of specimens subjected to cavitation for 165 min: (a) SEM ×52; (b) SEM ×200.
Crystals 16 00541 g007
Figure 8. SEM micrograph (a), EDX spectrum (b), and chemical composition of the surface cavitated for 165 min (c).
Crystals 16 00541 g008aCrystals 16 00541 g008b
Figure 9. XRD patterns before (a) and after (b) cavitation tests.
Crystals 16 00541 g009
Table 1. Nominal chemical composition of the studied alloy.
AlloyChemical Element, % wt.HV0.05
AZ 31BAlZnMnSiFeCuNiMg51 ± 4
2.930.860.400.020.0010.0040.001Rest
Disclaimer/Publisher’s Note: The statements, opinions and data contained in all publications are solely those of the individual author(s) and contributor(s) and not of MDPI and/or the editor(s). MDPI and/or the editor(s) disclaim responsibility for any injury to people or property resulting from any ideas, methods, instructions or products referred to in the content.