Article

Entropy-Driven Isosymmetric Phase Transition in L-Serine Under Pressure: A Periodic DFT Study

by
Anna Maria Mazurek
1,
Monika Franczak-Rogowska
2 and
Łukasz Szeleszczuk
1,*
1
Department of Organic and Physical Chemistry, Medical University of Warsaw, 1 Banacha Str., 02-097 Warsaw, Poland
2
Department of Drug Chemistry, Pharmaceutical and Biomedical Analysis, Medical University of Warsaw, 1 Banacha Str., 02-097 Warsaw, Poland
*
Author to whom correspondence should be addressed.
Crystals 2026, 16(4), 266; https://doi.org/10.3390/cryst16040266
Submission received: 30 March 2026 / Revised: 11 April 2026 / Accepted: 13 April 2026 / Published: 16 April 2026

Abstract

Understanding pressure-induced isosymmetric phase transitions in molecular crystals requires consideration of both structural and thermodynamic factors, particularly in hydrogen-bonded systems. In this work, periodic density functional theory (DFT) calculations were employed to investigate the pressure-dependent behavior of L-serine and to elucidate the origin of its experimentally observed phase transition between Phase I and Phase IV. Geometry optimizations performed at ambient pressure and 8.8 GPa reproduce the compression of the crystal lattice and the pressure-driven stabilization of Phase IV. However, no spontaneous reorientation of the hydroxyl groups is observed, indicating that the transition is not accessible within a purely static framework. To further explore the stability of the system, a series of modified crystal structures with different hydroxyl group orientations was generated and analyzed, revealing a complex energy landscape at ambient conditions that becomes significantly simplified under compression. Phonon calculations within the quasi-harmonic approximation demonstrate that the experimentally observed Phase I structure is not stabilized by enthalpy but by vibrational entropy, whose contribution increases with temperature. These results show that the phase transition in L-serine is governed by an interplay between lattice energy, hydrogen-bond rearrangement, and vibrational effects, and highlight that an accurate description of polymorphic stability in such systems requires inclusion of both static and dynamic contributions.

1. Introduction

Pressure is a powerful thermodynamic variable that can significantly alter the structural, energetic, and dynamical properties of molecular crystals. While temperature primarily increases molecular motion and entropy, pressure directly modifies intermolecular distances and orientations, often leading to reorganization of hydrogen-bond networks, conformational changes, and the formation of new polymorphic forms. Consequently, high-pressure studies have become an essential tool for probing complex energy landscapes and accessing phases inaccessible under ambient conditions [1,2,3].
Pressure-induced phase transitions in molecular crystals are commonly classified according to symmetry changes and transformation pathways. Most involve changes in space-group symmetry or unit-cell multiplicity; however, isosymmetric phase transitions (IPTs) represent a rare and conceptually intriguing class of transformations. In IPTs, the space group, Wyckoff positions, and number of molecules in the unit cell remain unchanged, while discontinuities in lattice parameters, elastic properties, vibrational spectra, or molecular arrangements indicate a phase transition [4,5]. Such transitions challenge classical Landau-type descriptions and require detailed structural and thermodynamic analysis.
IPTs have been reported in a limited number of molecular solids, including glycylglycine [6], L-histidine [7], chlorothiazide [8], biurea [9], and sulfamic acid [10]. In these systems, transitions are driven by subtle cooperative rearrangements of hydrogen-bond networks and electrostatic interactions rather than by symmetry breaking. As a result, IPTs are particularly relevant in hydrogen-bonded crystals, where multiple weak interactions stabilize competing polymorphic forms.
Amino acids constitute an important class of hydrogen-bonded molecular solids and are widely used as model systems for investigating intermolecular interactions, structural flexibility, and phase behavior under varying thermodynamic conditions. In addition to their biological relevance, many amino-acid crystals exhibit functional properties such as nonlinear optical response [11], piezoelectricity [12], and ferroelectric behavior [13], further motivating studies of their structural stability and polymorphism [14].
L-serine (HOCH2–CH(NH3+)–COO) is a prototypical example of such a system. In the solid state, it exists as a zwitterion, forming an extensive three-dimensional hydrogen-bond network involving ammonium, carboxylate, and hydroxyl groups. This network creates a dense yet adaptable crystal structure that is highly sensitive to external pressure, making L-serine a model system for studying pressure-induced polymorphism and kinetic effects.
Under ambient conditions, L-serine crystallizes in the orthorhombic space group P212121, with one molecule in the asymmetric unit (Z′ = 1) and four molecules in the unit cell (Z = 4) [15,16]. Several crystal structures have been reported in the Cambridge Structural Database, with Phase I characterized by lattice parameters a = 5.6193(14) Å, b = 8.519(3) Å, and c = 9.264(3) Å [17,18,19,20]. The structure consists of head-to-tail chains formed by strong N–H···O interactions, interconnected by O–H···O hydrogen bonds, resulting in a cooperative three-dimensional network.
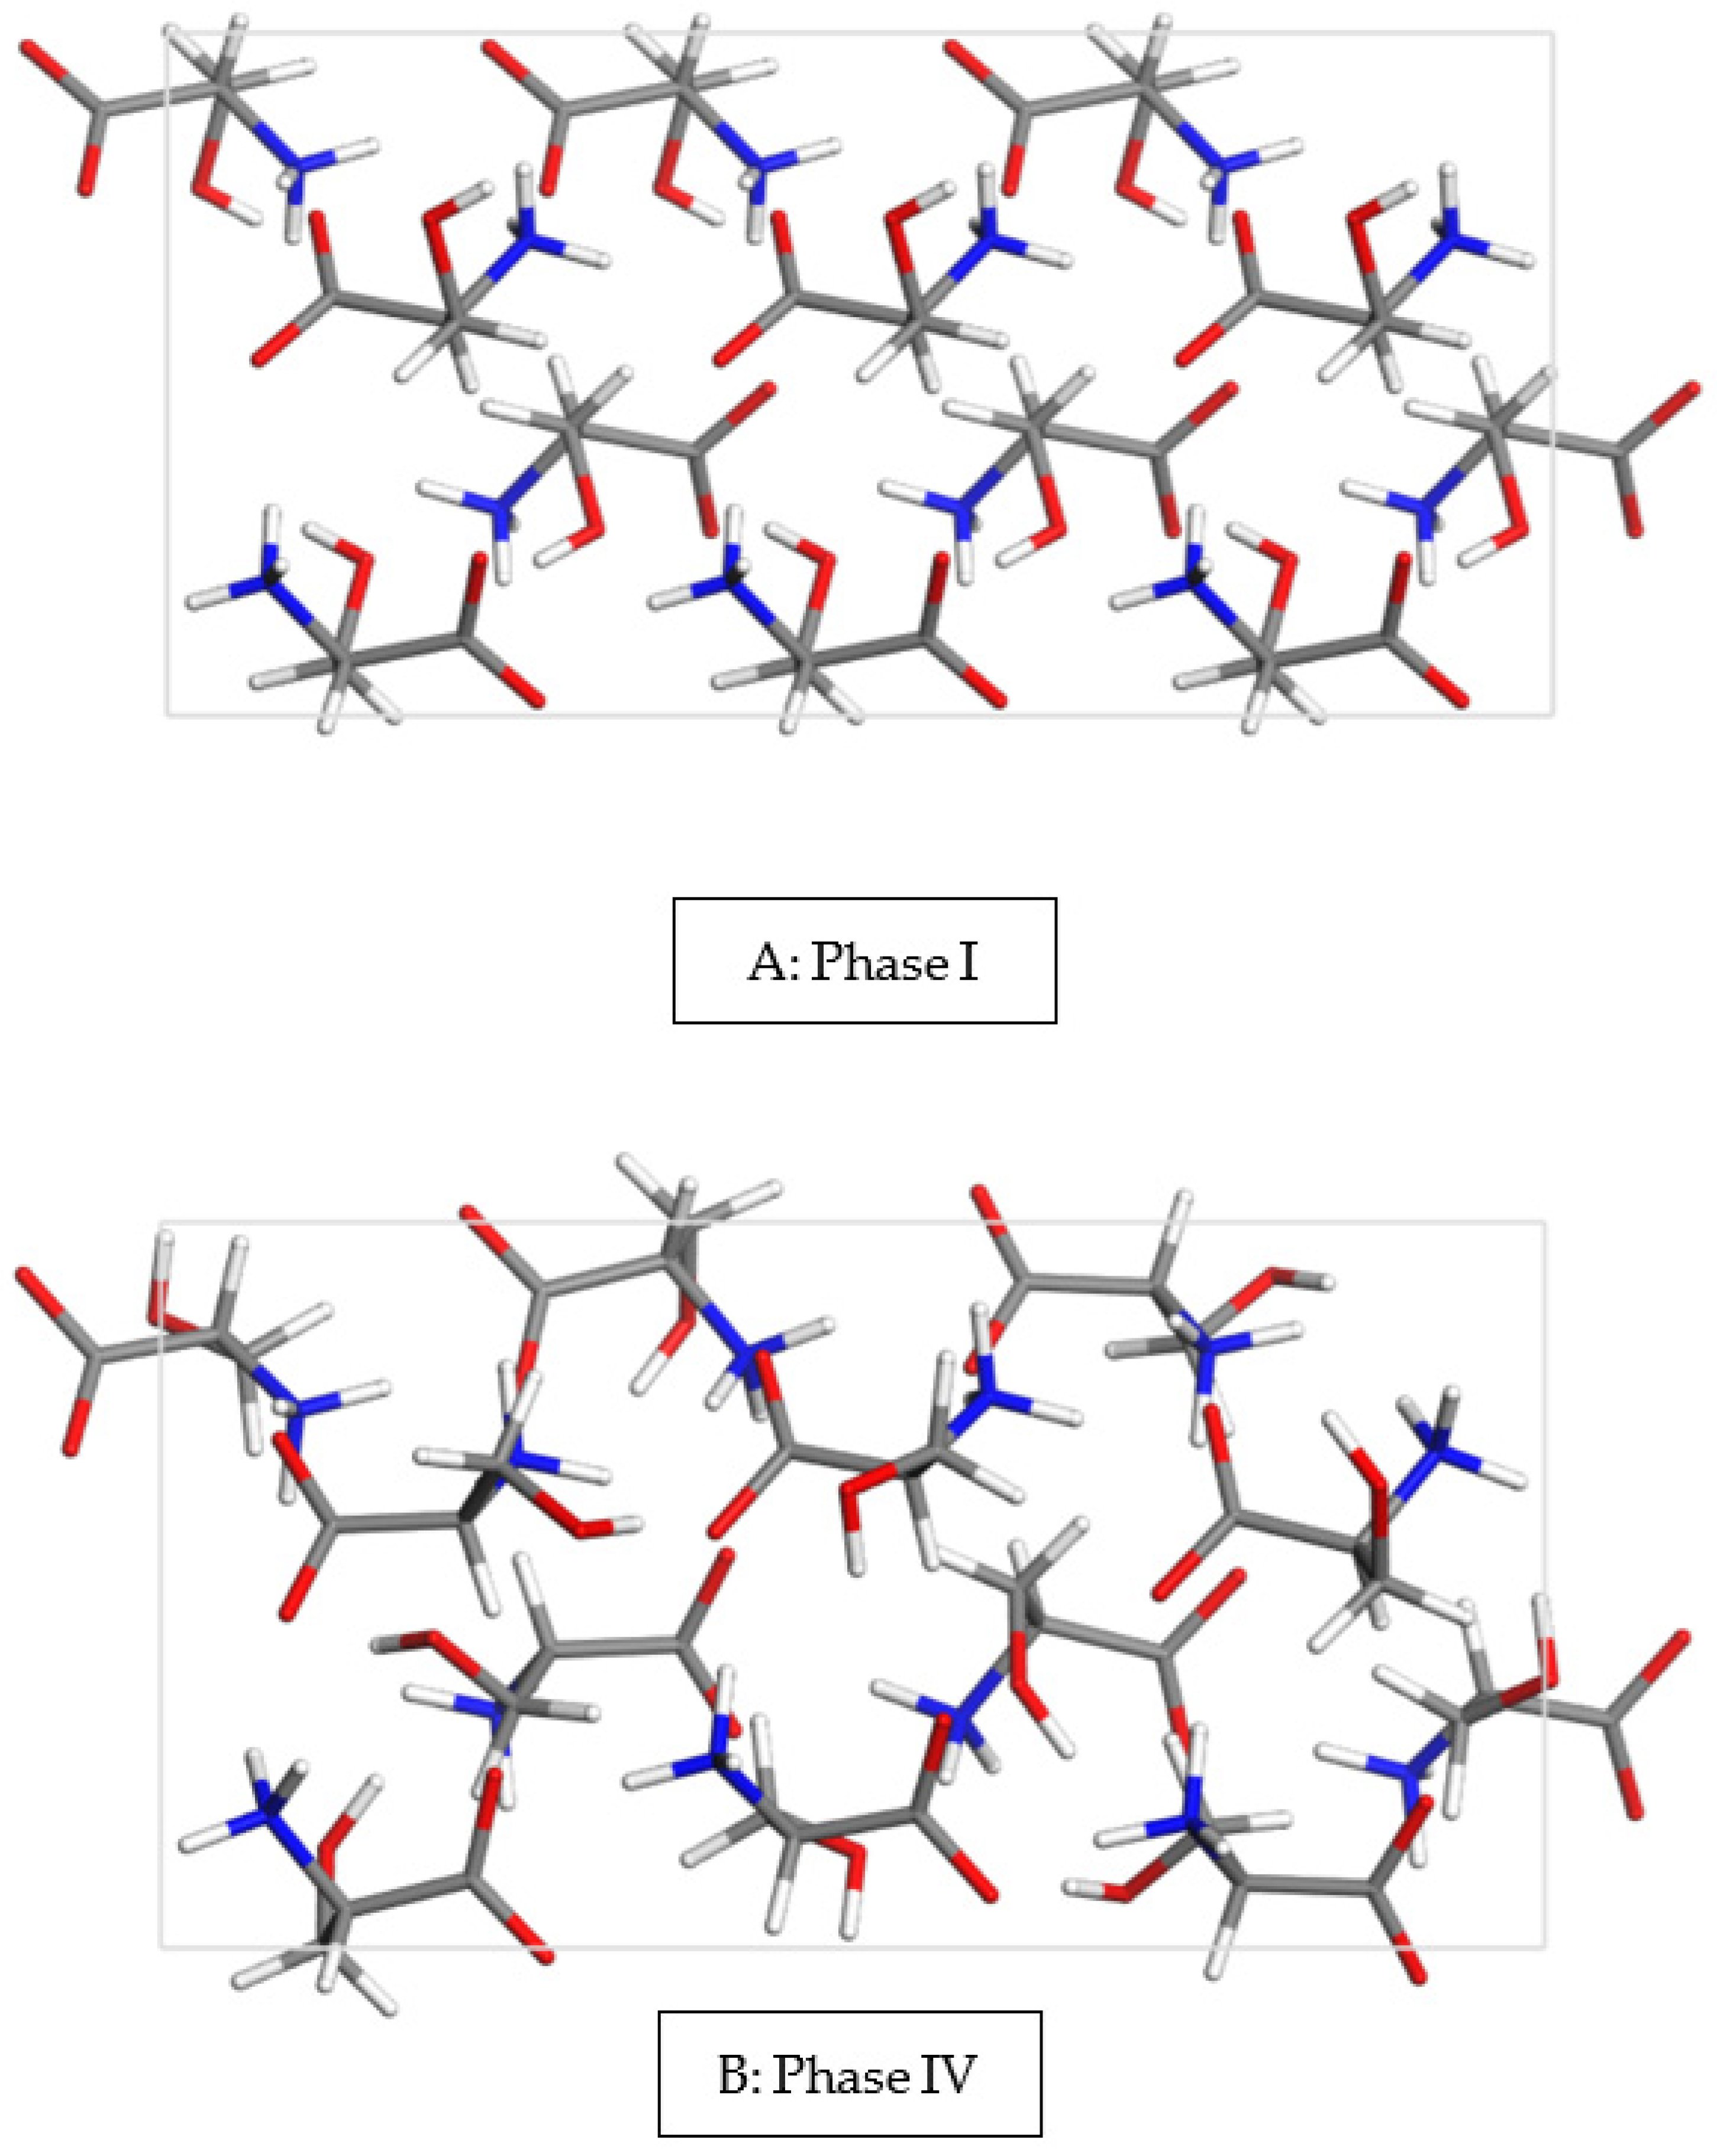
Upon compression, L-serine undergoes a series of pressure-induced phase transitions. Early studies identified high-pressure polymorphs (phases II and III) at approximately 5 and 8 GPa [21,22], both preserving the original space-group symmetry and thus fulfilling the criteria for IPTs. Subsequent synchrotron studies revealed an additional polymorph, Phase IV (Figure 1), which emerges at around 5 GPa under specific compression conditions and remains stable up to at least 9.5 GPa [16]. These transitions are associated with changes in the orientation of the hydroxyl group and cooperative rearrangements of the hydrogen-bond network.
A detailed computational investigation of pressure-induced phase transitions in L-serine polymorphs was previously reported by Rychkov et al. [23], who employed periodic DFT calculations with dispersion corrections and external stress to analyze structural transformations under pressure. In that work, the phase transitions were interpreted primarily in terms of enthalpy changes and volume reduction, with the decrease in unit-cell volume identified as a key macroscopic driving force. At the microscopic level, the mechanism was attributed to overstrain of selected hydrogen bonds, leading to cooperative, martensitic-like transformations.
However, despite the detailed structural and energetic analysis, vibrational contributions to thermodynamic stability were not explicitly considered. As a result, the role of entropy in stabilizing competing polymorphs remained unresolved.
Detailed diffraction studies have shown that the I→II transition involves abrupt changes in lattice parameters and hydrogen-bond rearrangements without symmetry reduction [21,22], while the II→III transition leads to further densification [21]. Importantly, Phase IV does not evolve from Phase II but originates directly from Phase I under slow compression, whereas rapid compression favors the I→II pathway [16].
These observations highlight the crucial role of kinetic effects in the pressure-induced behavior of L-serine. The sequence and reversibility of phase transitions strongly depend on compression rate and stress conditions, indicating that metastable phases may be trapped under non-equilibrium conditions, while slower compression allows access to alternative pathways [16]. The interpretation of experimental data is complicated by the presence of kinetic control and energy barriers associated with phase transitions, as well as by the limited ability to directly access thermodynamic properties under high-pressure conditions.
Density functional theory (DFT) calculations provide a powerful framework for modeling molecular crystals. In polymorphic systems, structural differences arise from variations in intermolecular interactions, including hydrogen bonding, electrostatics, and dispersion forces [24,25,26]. Methods based on isolated molecules are therefore insufficient, and accurate description of polymorphism requires explicit treatment of periodic crystal structures [27,28].
Periodic DFT calculations under periodic boundary conditions are now a standard approach for modeling molecular solids, enabling accurate representation of collective intermolecular interactions. The use of plane-wave basis sets and pseudopotentials ensures computational efficiency and systematic convergence, which are essential for studying pressure-dependent structural changes [27,28,29,30].
In this work, we extend previous computational studies by explicitly incorporating vibrational contributions to thermodynamic stability through phonon calculations within the quasi-harmonic approximation. This approach allows us to move beyond purely enthalpy-driven interpretations and to evaluate the full Gibbs free energy landscape of L-serine polymorphs under pressure. In particular, we demonstrate that the experimentally observed stability of Phase I under ambient conditions is governed by vibrational entropy, highlighting the importance of dynamic effects in pressure-induced isosymmetric phase transitions.

2. Materials and Methods

Density functional theory (DFT) calculations, including enthalpy minimization, phonon dispersion, and density of states analysis, were performed using the CASTEP code [31] implemented in Materials Studio 2020. All calculations employed the plane-wave pseudopotential formalism. On-the-fly-generated (OTFG) norm-conserving pseudopotentials (H_2017R2ncp.otfg for H, N_2017R2ncp.otfg for N, O_2019ncp.otfg for O, and C_2017R2ncp.otfg for C) were used, generated within the Koelling–Harmon scalar relativistic scheme. External pressure was applied within the periodic DFT framework during geometry optimization by including a stress tensor corresponding to the target pressure, allowing simultaneous relaxation of atomic positions and unit cell parameters under pressure conditions.

2.1. DFT Functionals and Dispersion Correction Methods

The DFT functionals and dispersion corrections utilized in this study are presented in Table 1. Different functional–dispersion combinations were considered in order to assess their relative performance in describing the structural and energetic properties of the system.

2.2. Geometry Optimization

Geometry optimizations were performed using the limited-memory Broyden–Fletcher–Goldfarb–Shanno (LBFGS) algorithm with the finite-basis set correction (“smart”) scheme. The plane-wave kinetic energy cutoff (Ecut) was optimized and set to 1020 eV. Brillouin zone sampling was carried out using Monkhorst–Pack k-point grids, with a spacing below 0.07 Å−1.
Experimental crystal structures of L-serine (CSD refcodes LSERIN20 and LSERIN50 were used as initial models. Two optimization schemes were applied: (i) “full + cell”, in which both atomic positions and lattice parameters were relaxed, and (ii) “atoms”, where only atomic positions were optimized while lattice parameters were fixed at experimental values. All the calculations were done without the space group symmetry constraints.
The convergence criteria were set to 5 × 10⁻⁶ eV/atom for total energy, 1 × 10⁻² eV/Å for forces, 2 × 10⁻² GPa for stress, and 5 × 10⁻⁴ Å for atomic displacements. For cell optimization, the fixed-basis set quality approach was employed, with an SCF convergence threshold of 5 × 10⁻⁷ eV/atom.

2.3. Thermodynamic Parameters

Phonon frequencies were calculated using density functional perturbation theory (DFPT) via diagonalization of the dynamical matrix. DFPT provides phonon properties by evaluating the response of the electronic structure to perturbations, without the need for explicit atomic displacements. Phonon calculations and thermodynamic properties were obtained using the density functional perturbation theory (DFPT) implementation available in CASTEP, without the use of external software.
The q-point sampling for dynamical matrix calculations was defined by a Monkhorst–Pack grid with a spacing of 0.05 Å−1. The convergence threshold for force constants was set to 1 × 10⁻⁵ eV/Å2. Phonon dispersion relations, phonon density of states (phonon DOS), and electronic density of states (DOS) were computed based on the optimized structures. For phonon dispersion calculations, the spacing between q-points along the reciprocal-space path was set to 0.015 Å−1. DOS calculations were performed using a 3 × 3 × 3 Monkhorst–Pack k-point grid, corresponding to a q-point spacing of 0.04 Å−1.
Thermodynamic properties were derived within the quasi-harmonic approximation, including zero-point energy (Ezp), entropy (S), Gibbs free energy (G), and enthalpy (H) as functions of temperature, using Equations (1)–(4) reported by Baroni et al. [45]. In these expressions, ω denotes phonon frequency, F(ω) the phonon density of states, Etot the total electronic energy at 0 K, k the Boltzmann constant, and ħ the reduced Planck constant.
E z p = 1 2 F ( ω ) ħ ω d ω
S T = k ħ ω k T exp ħ ω k T 1 F ω d ω F ω ln 1 exp ħ ω k T d ω
G T = E t o t + E z p + k T F ω ln 1 exp ħ ω k T d ω + p V
H = G + T S

3. Results

3.1. Geometry Optimization of L-serine at 1 Atm and 8.8 GPa

Geometry optimizations of L-serine Phases I and IV were performed at both ambient pressure (1 atm) and 8.8 GPa, including full relaxation of atomic positions and unit cell parameters. The pressure of 8.8 GPa was selected to correspond to the experimentally relevant high-pressure range in which L-serine polymorphs are observed and to enable direct comparison with available structural data.
To enable direct structural comparison between the two polymorphs, the experimental unit cell of Phase I (Z′ = 1) was expanded threefold along the a axis to match the supercell representation of Phase IV (Z′ = 3), resulting in comparable lattice dimensions and molecular arrangements. This type of computational approach, involving optimization of crystal structures at different pressures (including conditions beyond their experimental stability range), has been previously applied in studies of L-serine polymorphs under pressure, where it was used to rationalize phase transition mechanisms and relative stability of different forms [23].
Optimizations at 1 atm served two purposes: (i) benchmarking the performance of different DFT functionals (Table 1) through comparison with experimental unit cell parameters, and (ii) selecting the most reliable method for subsequent calculations, including phonon analysis. As expected, the choice of functional significantly affects the calculated structural parameters.
The results (Table 2) show considerable variation depending on the computational approach. For example, the lattice parameter a ranges from 16.372 Å (RPBE-TS) to 17.569 Å (RPBE without dispersion), corresponding to deviations of nearly 1 Å from the experimental value. Similar trends are observed for the remaining lattice parameters and unit cell volumes. Dispersion corrections systematically improve agreement with experiment, whereas methods without dispersion tend to overestimate intermolecular distances and unit cell volumes. Among the tested approaches, the meta-GGA functional RSCAN provides the best agreement with experimental data. A comparison between experimental Phase IV data at 6.64 GPa and structures optimized at 1 atm is provided in Table 3.
Geometry optimizations were subsequently performed under high-pressure conditions (8.8 GPa) for both polymorphs (Table 4 and Table 5). The calculated structures reproduce the experimentally observed lattice compression, with all unit cell parameters decreasing relative to ambient conditions. The compression is anisotropic, reflecting the directional character of the hydrogen-bond network, with the most pronounced contraction observed along the c axis.
Importantly, no spontaneous reorientation of the hydroxyl groups was observed during geometry optimization. Phase I optimized at 8.8 GPa retained its original hydroxyl orientation, with no transition toward the configuration characteristic of Phase IV. Likewise, Phase IV structures preserved their initial hydroxyl arrangement. This indicates that the hydroxymethyl rotation associated with the phase transition is not accessible within a purely static DFT framework and suggests the presence of an energy barrier separating the two configurations.
Such behavior is consistent with experimental observations, which attribute the phase transition to cooperative rearrangements of hydroxymethyl groups and the hydrogen-bond network. These collective processes likely involve overcoming an energy barrier and cannot be captured by standard geometry optimization alone. Therefore, while static DFT calculations correctly reproduce the pressure-dependent stability of the polymorphs, additional approaches, such as phonon-based thermodynamic analysis, are required to fully describe the mechanism of the isosymmetric phase transition.
Further insight into the relative stability of the two polymorphs was obtained from the calculated energy differences between Phase I and Phase IV (Table 6 and Table 7). At ambient pressure, all computational approaches yield negative values of ΔE (Phase I—Phase IV), confirming that Phase I is energetically more stable than Phase IV. This is consistent with experimental observations, where Phase I is the only stable polymorph under ambient conditions.
Under elevated pressure, however, this relationship changes markedly. As shown in Table 7, many dispersion-corrected methods predict positive ΔE values at 8.8 GPa, indicating that Phase IV becomes energetically favored under compression. In several cases, ΔE approaches zero, suggesting that the two polymorphs become nearly isoenergetic in the high-pressure regime. Such small energy differences are characteristic of molecular crystal polymorphs, where competing structures often differ in stability by only a few kJ/mol, making their relative stability highly sensitive to external conditions such as pressure and temperature.
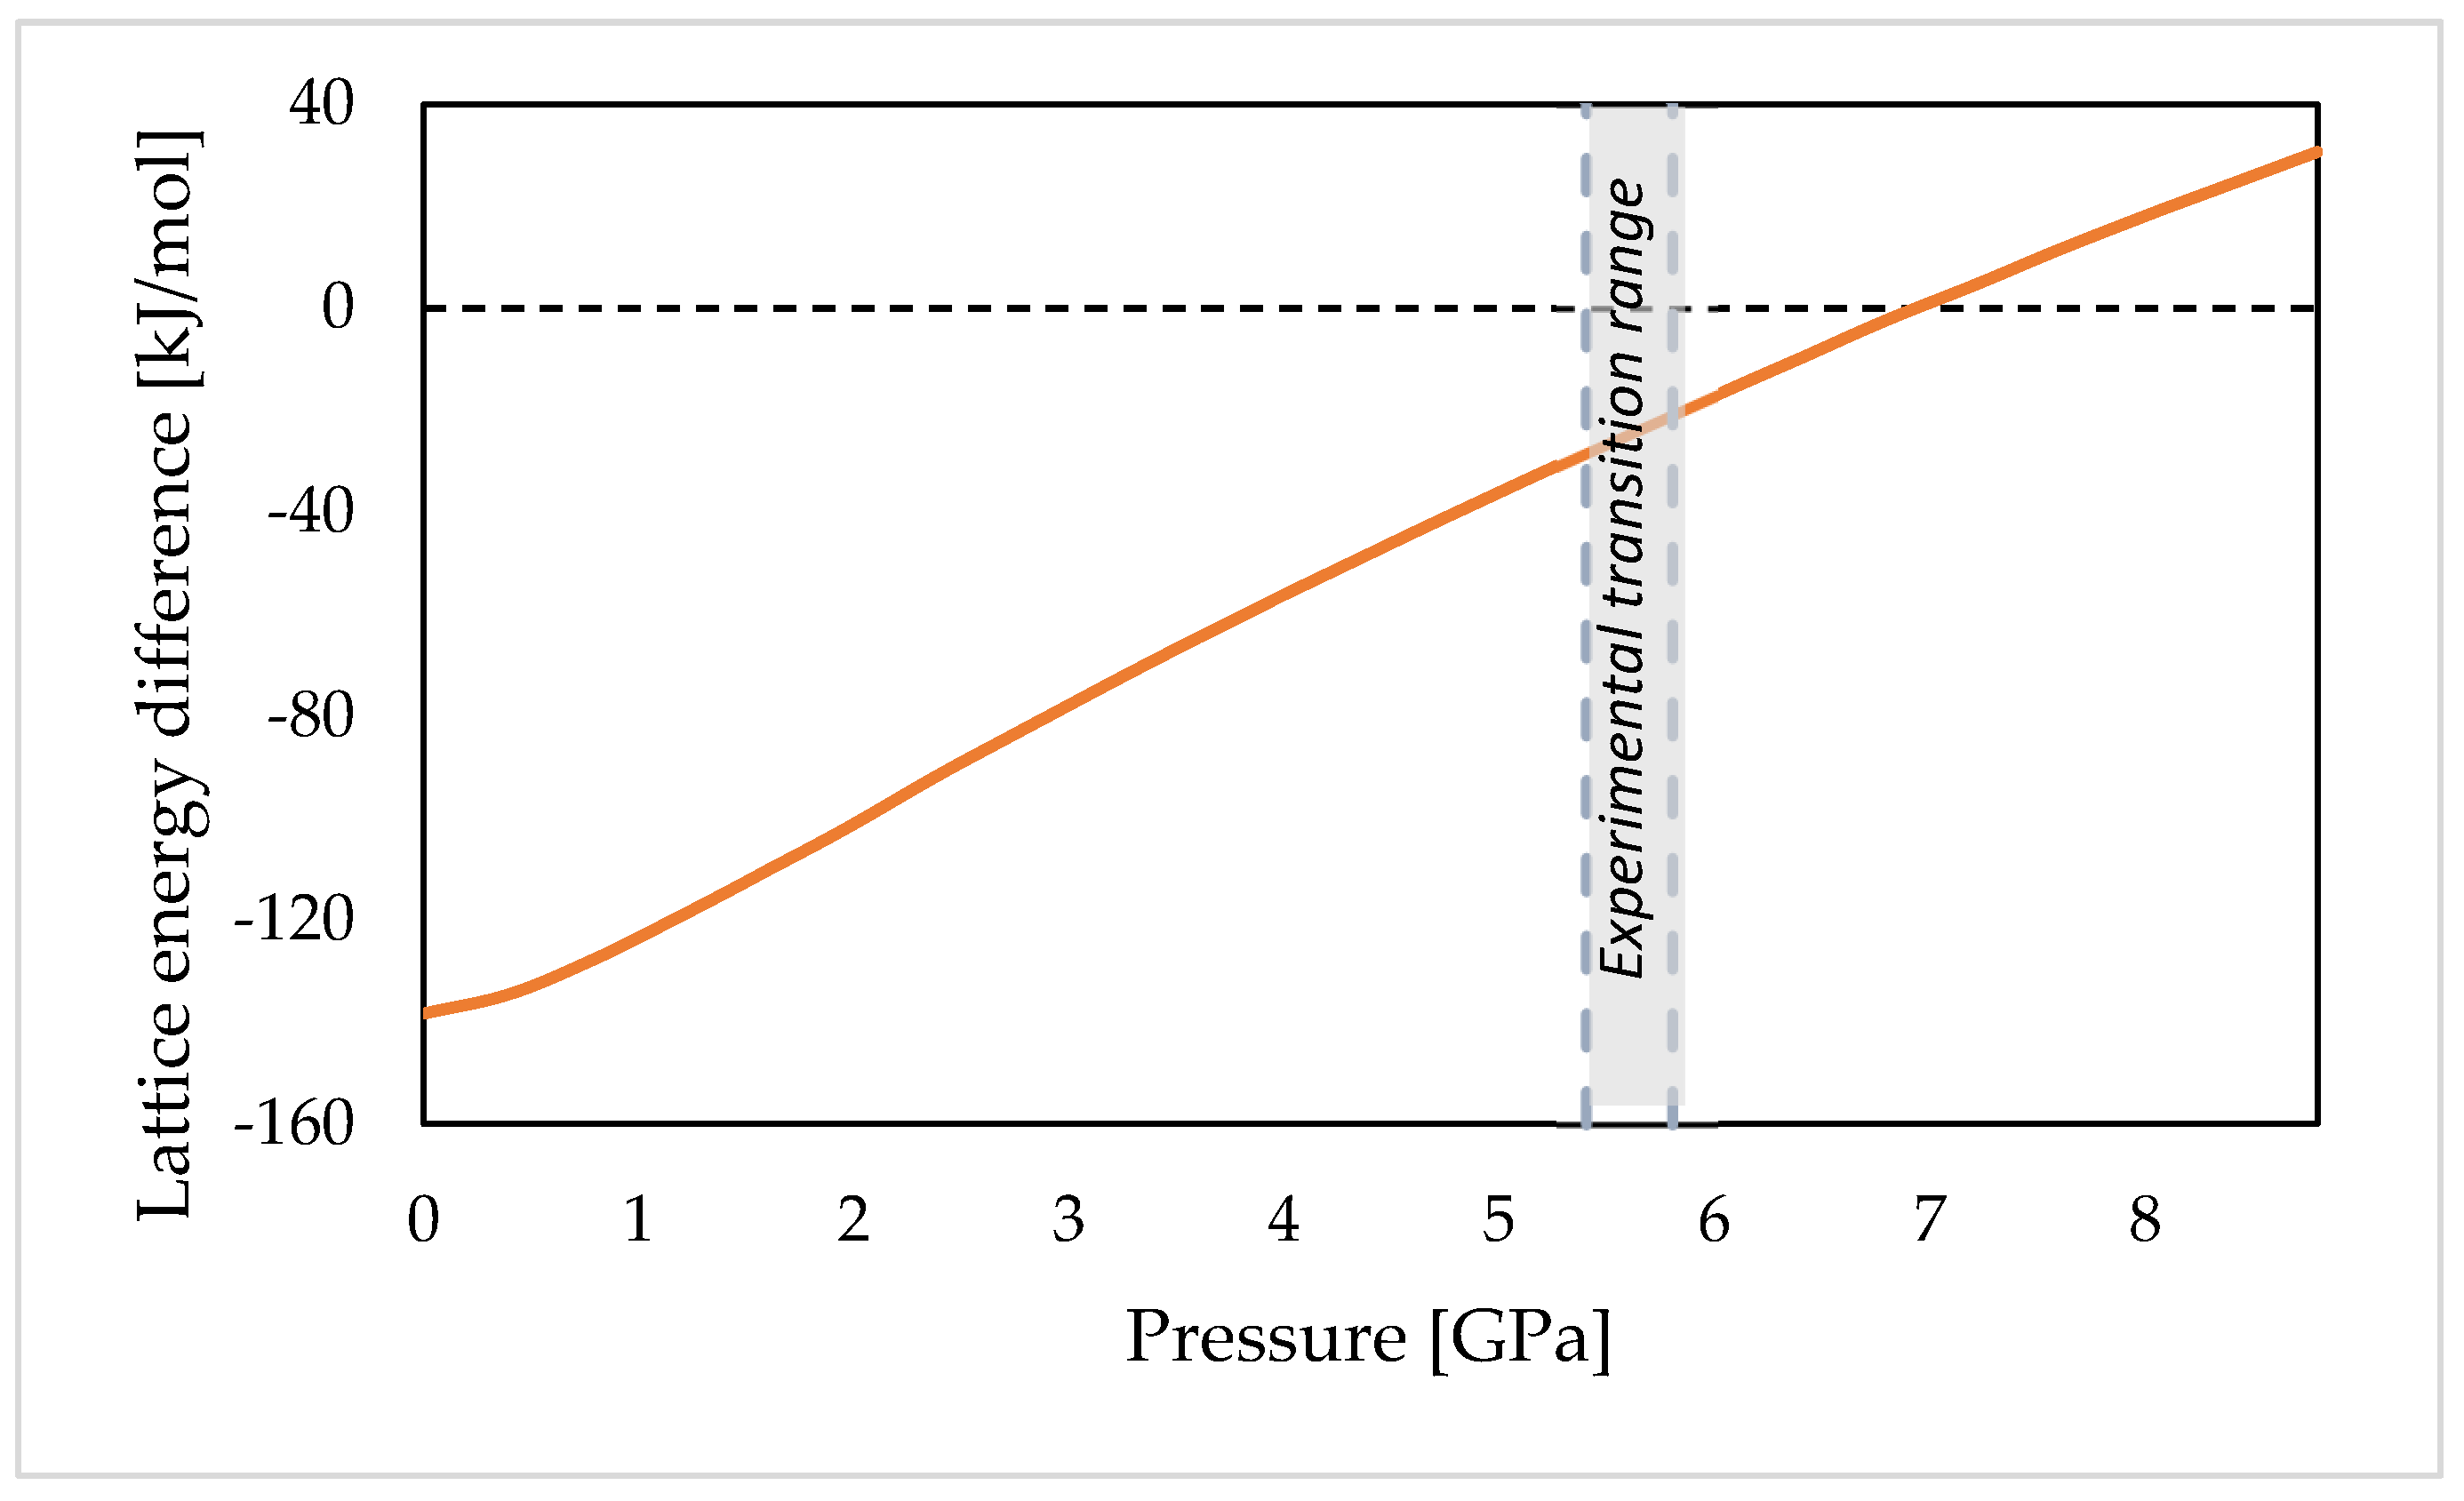
The lattice energy differences between Phase I and Phase IV of L-serine, calculated as a function of pressure using the PBE-TS functional (Figure 2, Table S1), reveal a clear pressure-dependent trend in their relative stability. At low pressures, ΔE values are strongly negative, indicating that Phase I is thermodynamically favored. With increasing pressure, the magnitude of ΔE decreases, reflecting a gradual reduction in the energetic preference for Phase I.
This trend suggests that intermolecular interactions stabilizing Phase IV become progressively more favorable under compression, likely due to pressure-induced rearrangement of the hydrogen-bond network and improved molecular packing efficiency.
A key feature of this behavior is the sign inversion of ΔE between 6.8 and 7.2 GPa, marking the point at which Phase IV becomes energetically more stable than Phase I. This pressure range is in reasonable agreement with experimental observations, which place the onset of Phase IV under slow compression at approximately 5.4–5.8 GPa [16], although the transition is shifted to slightly higher pressures in the calculations.
Such a crossing of lattice energies is commonly interpreted as computational evidence of a pressure-induced phase transition, corresponding to the inversion of thermodynamic stability between the two polymorphs. The gradual nature of the ΔE variation indicates that the transformation is driven by continuous changes in intermolecular interactions rather than an abrupt structural rearrangement. The difference between the calculated and experimental transition pressure (approximately 1 GPa) is within the typical accuracy of periodic DFT methods for molecular crystals [46,47,48]. This discrepancy may arise from the approximate nature of exchange–correlation functionals, limitations in dispersion corrections, and the neglect of anharmonic effects. In addition, experimental conditions such as non-hydrostatic stress and kinetic barriers may influence the observed transition pressure.
The next stage of this study involved the optimization of modified L-serine crystal structures derived from the experimentally determined Phases I and IV. The initial cell parameters were retained, while the orientation of the hydroxyl groups within the –CH2OH side chains of selected molecules in the lattice was systematically varied. Multiple configurations were generated by altering hydroxyl group orientations while preserving the overall crystal packing and lattice topology. These configurations were subsequently subjected to full geometry optimization. This approach was designed to reproduce the experimentally observed structural differences between the polymorphs and to assess whether the pressure-induced IPT could be captured computationally through cooperative reorientation of the hydroxyl groups.
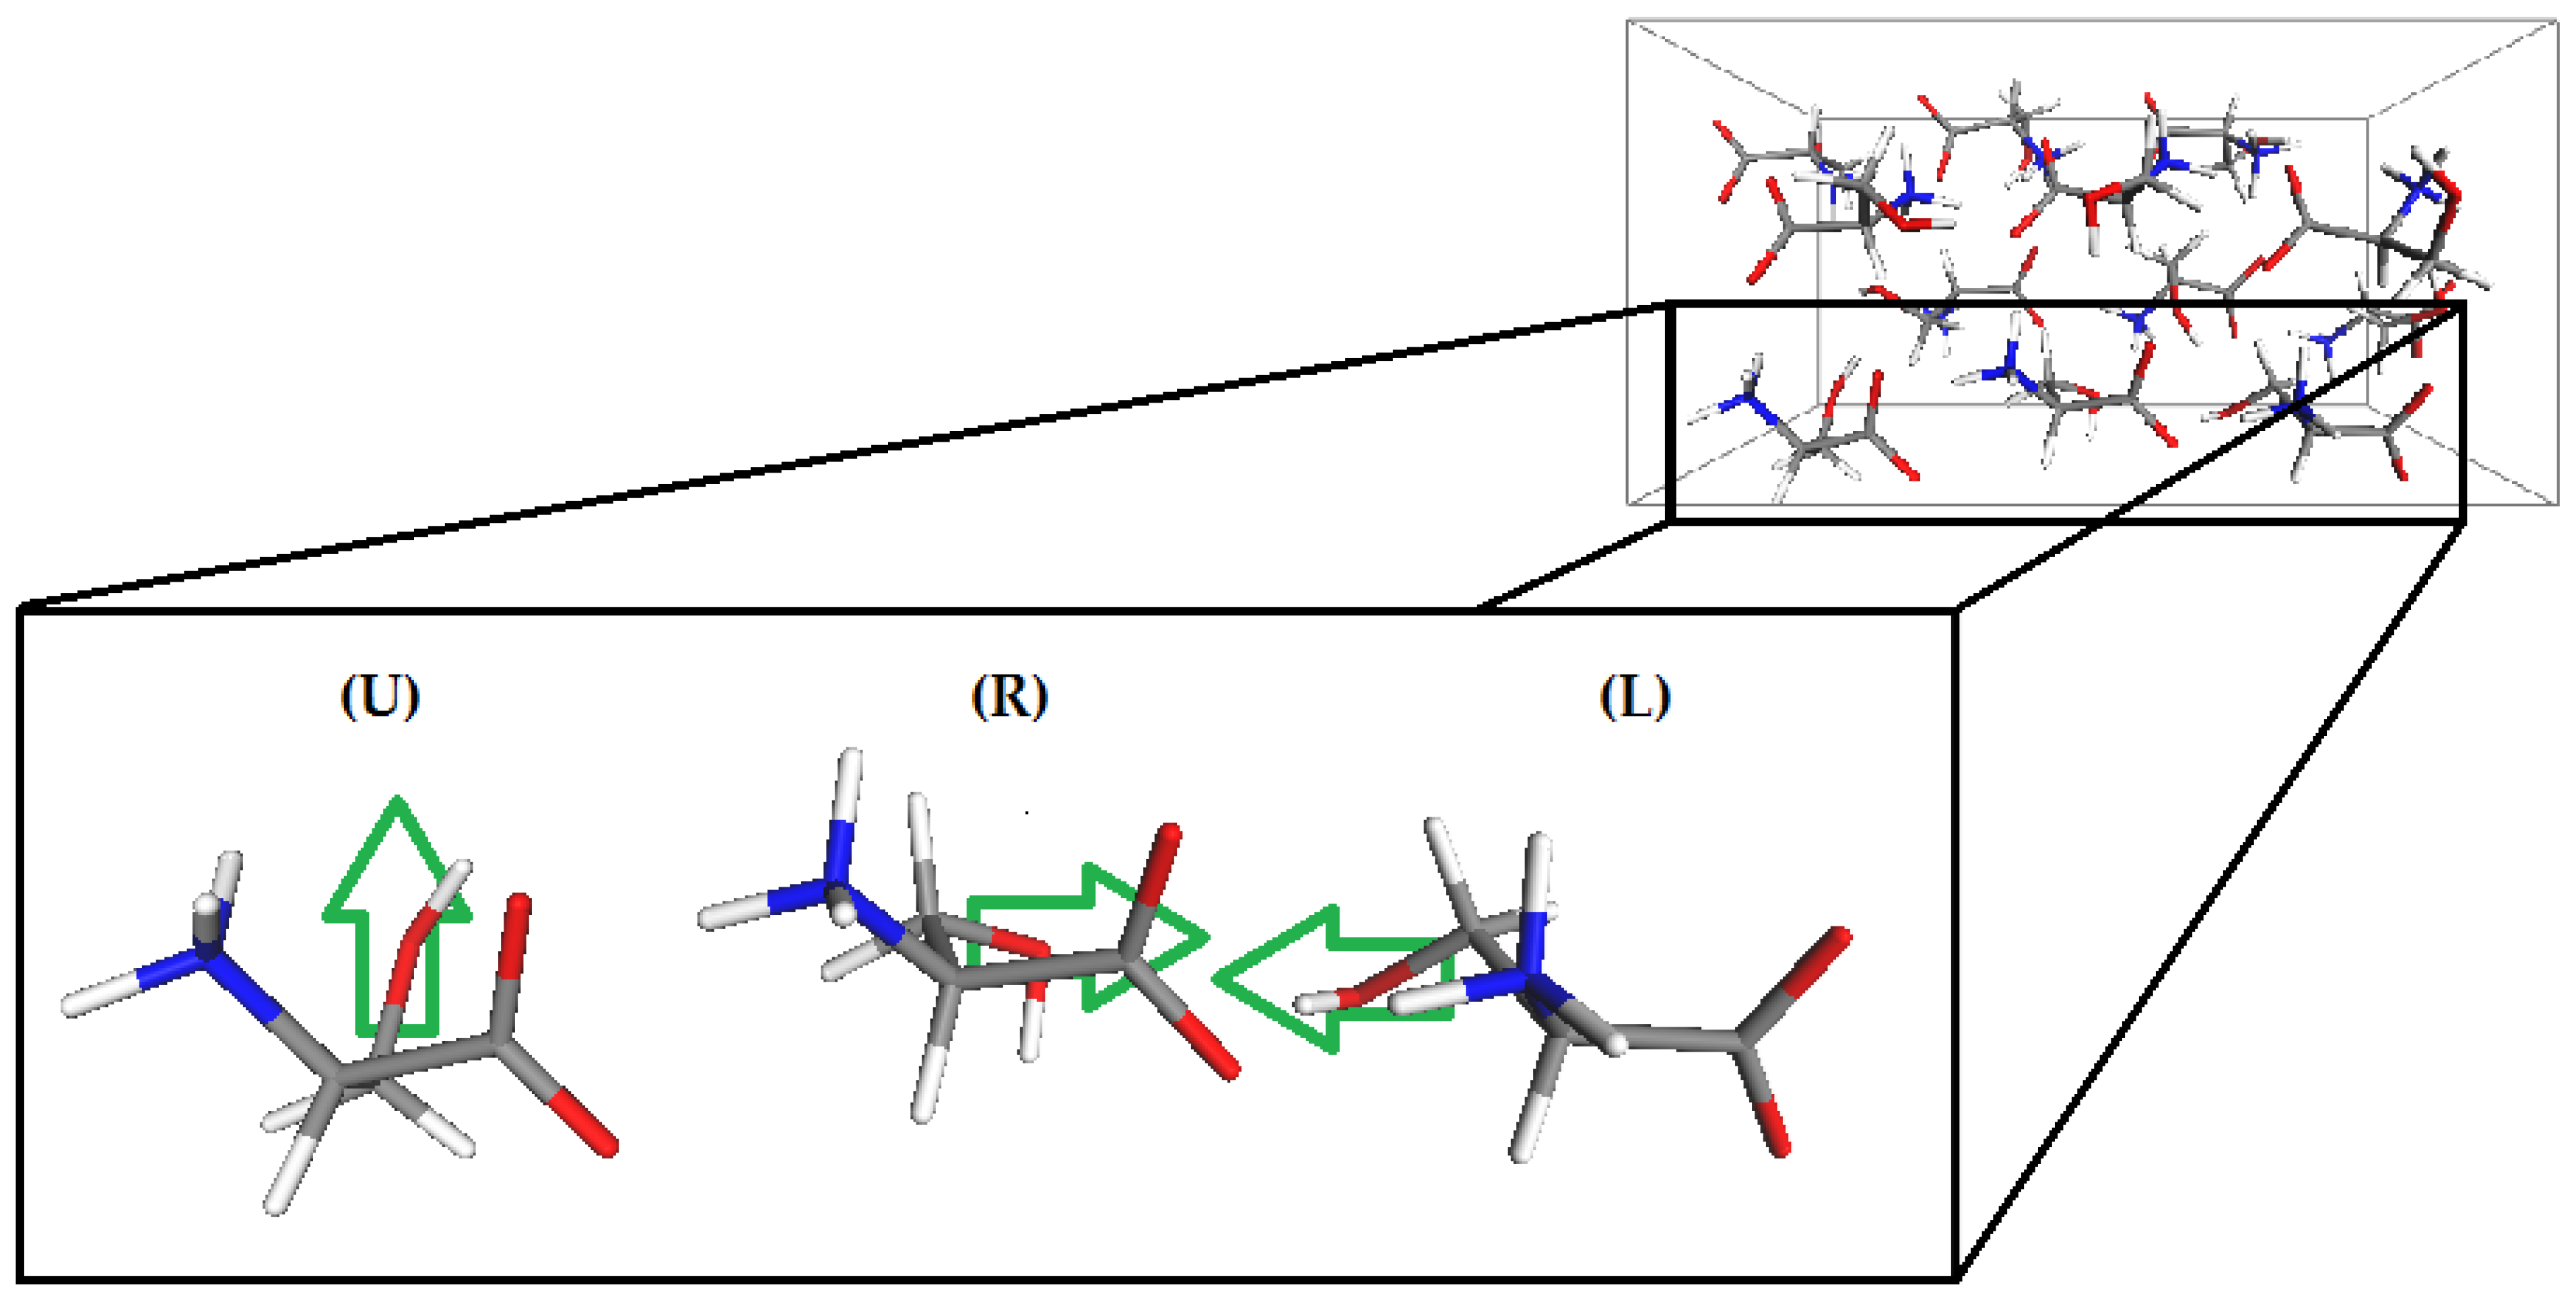
The generated configurations were defined by the orientation of the hydroxyl group in each molecule within the crystal lattice. Orientations were described with respect to the crystallographic axes, taking the a axis as horizontal and the b axis as vertical when viewed along the c direction. The configurations were constructed based on three reference molecules within the structural motif, whose hydroxyl groups could adopt three possible orientations: up, left, or right. These were denoted as U, L, and R, respectively (Figure 3). For Phase IV (Z′ = 3), this leads to a total of 33 = 27 possible configurations, corresponding to all combinations of hydroxyl group orientations in the three symmetry-independent molecules. Each configuration was labeled using a three-letter code reflecting the orientations of the hydroxyl groups in the reference molecules, hereafter referred to as the configuration label.
To examine the relative stability of the generated configurations, lattice energy differences were evaluated at both ambient pressure (1 atm) and elevated pressure (8.8 GPa), as summarized in Table 8 and Table 9. At 1 atm, all energies were referenced to the experimentally observed Phase I configuration (UUU), whereas at 8.8 GPa the values were calculated relative to the Phase IV configuration (URL). The complete set of optimized structural parameters and total energies is provided in Tables S1 and S2.
At ambient conditions, the experimentally observed Phase I configuration (UUU) does not correspond to the lowest-energy structure. Several alternative configurations, most notably LLL and UUL, exhibit significantly lower lattice energies, with LLL representing the global minimum among the analyzed structures. This indicates that, within a static DFT framework, multiple configurations are energetically more favorable than the experimentally observed one. The magnitude of the energy differences, reaching several tens of kJ/mol, highlights the presence of a complex energy landscape with numerous local minima associated with distinct hydrogen-bonding motifs.
A markedly different behavior is observed under compression at 8.8 GPa. In this case, the configuration corresponding to Phase IV (URL) becomes the most stable structure. Only a limited number of configurations, such as UUL and URU, remain close in energy, while the majority are significantly destabilized.
These results demonstrate that increasing pressure not only alters the relative energetic ordering of the configurations but also effectively reduces the number of energetically accessible minima. While multiple configurations are competitive at ambient conditions, compression favors a narrower subset of structures. In particular, the stabilization of the URL configuration, accompanied by the destabilization of alternative arrangements, is consistent with the experimentally observed pressure-induced transition toward Phase IV.
Overall, the results demonstrate that periodic DFT calculations provide a consistent description of both the structural compression and the relative energetic stability of L-serine polymorphs under pressure. Although the isosymmetric phase transition is not directly reproduced within static geometry optimization, the calculated energy trends clearly support the experimentally observed pressure-induced stabilization of Phase IV. These findings provide important insight into the thermodynamic driving forces governing the transition and highlight the limitations of static approaches in capturing cooperative structural transformations.

3.2. Thermodynamic Parameters Calculations

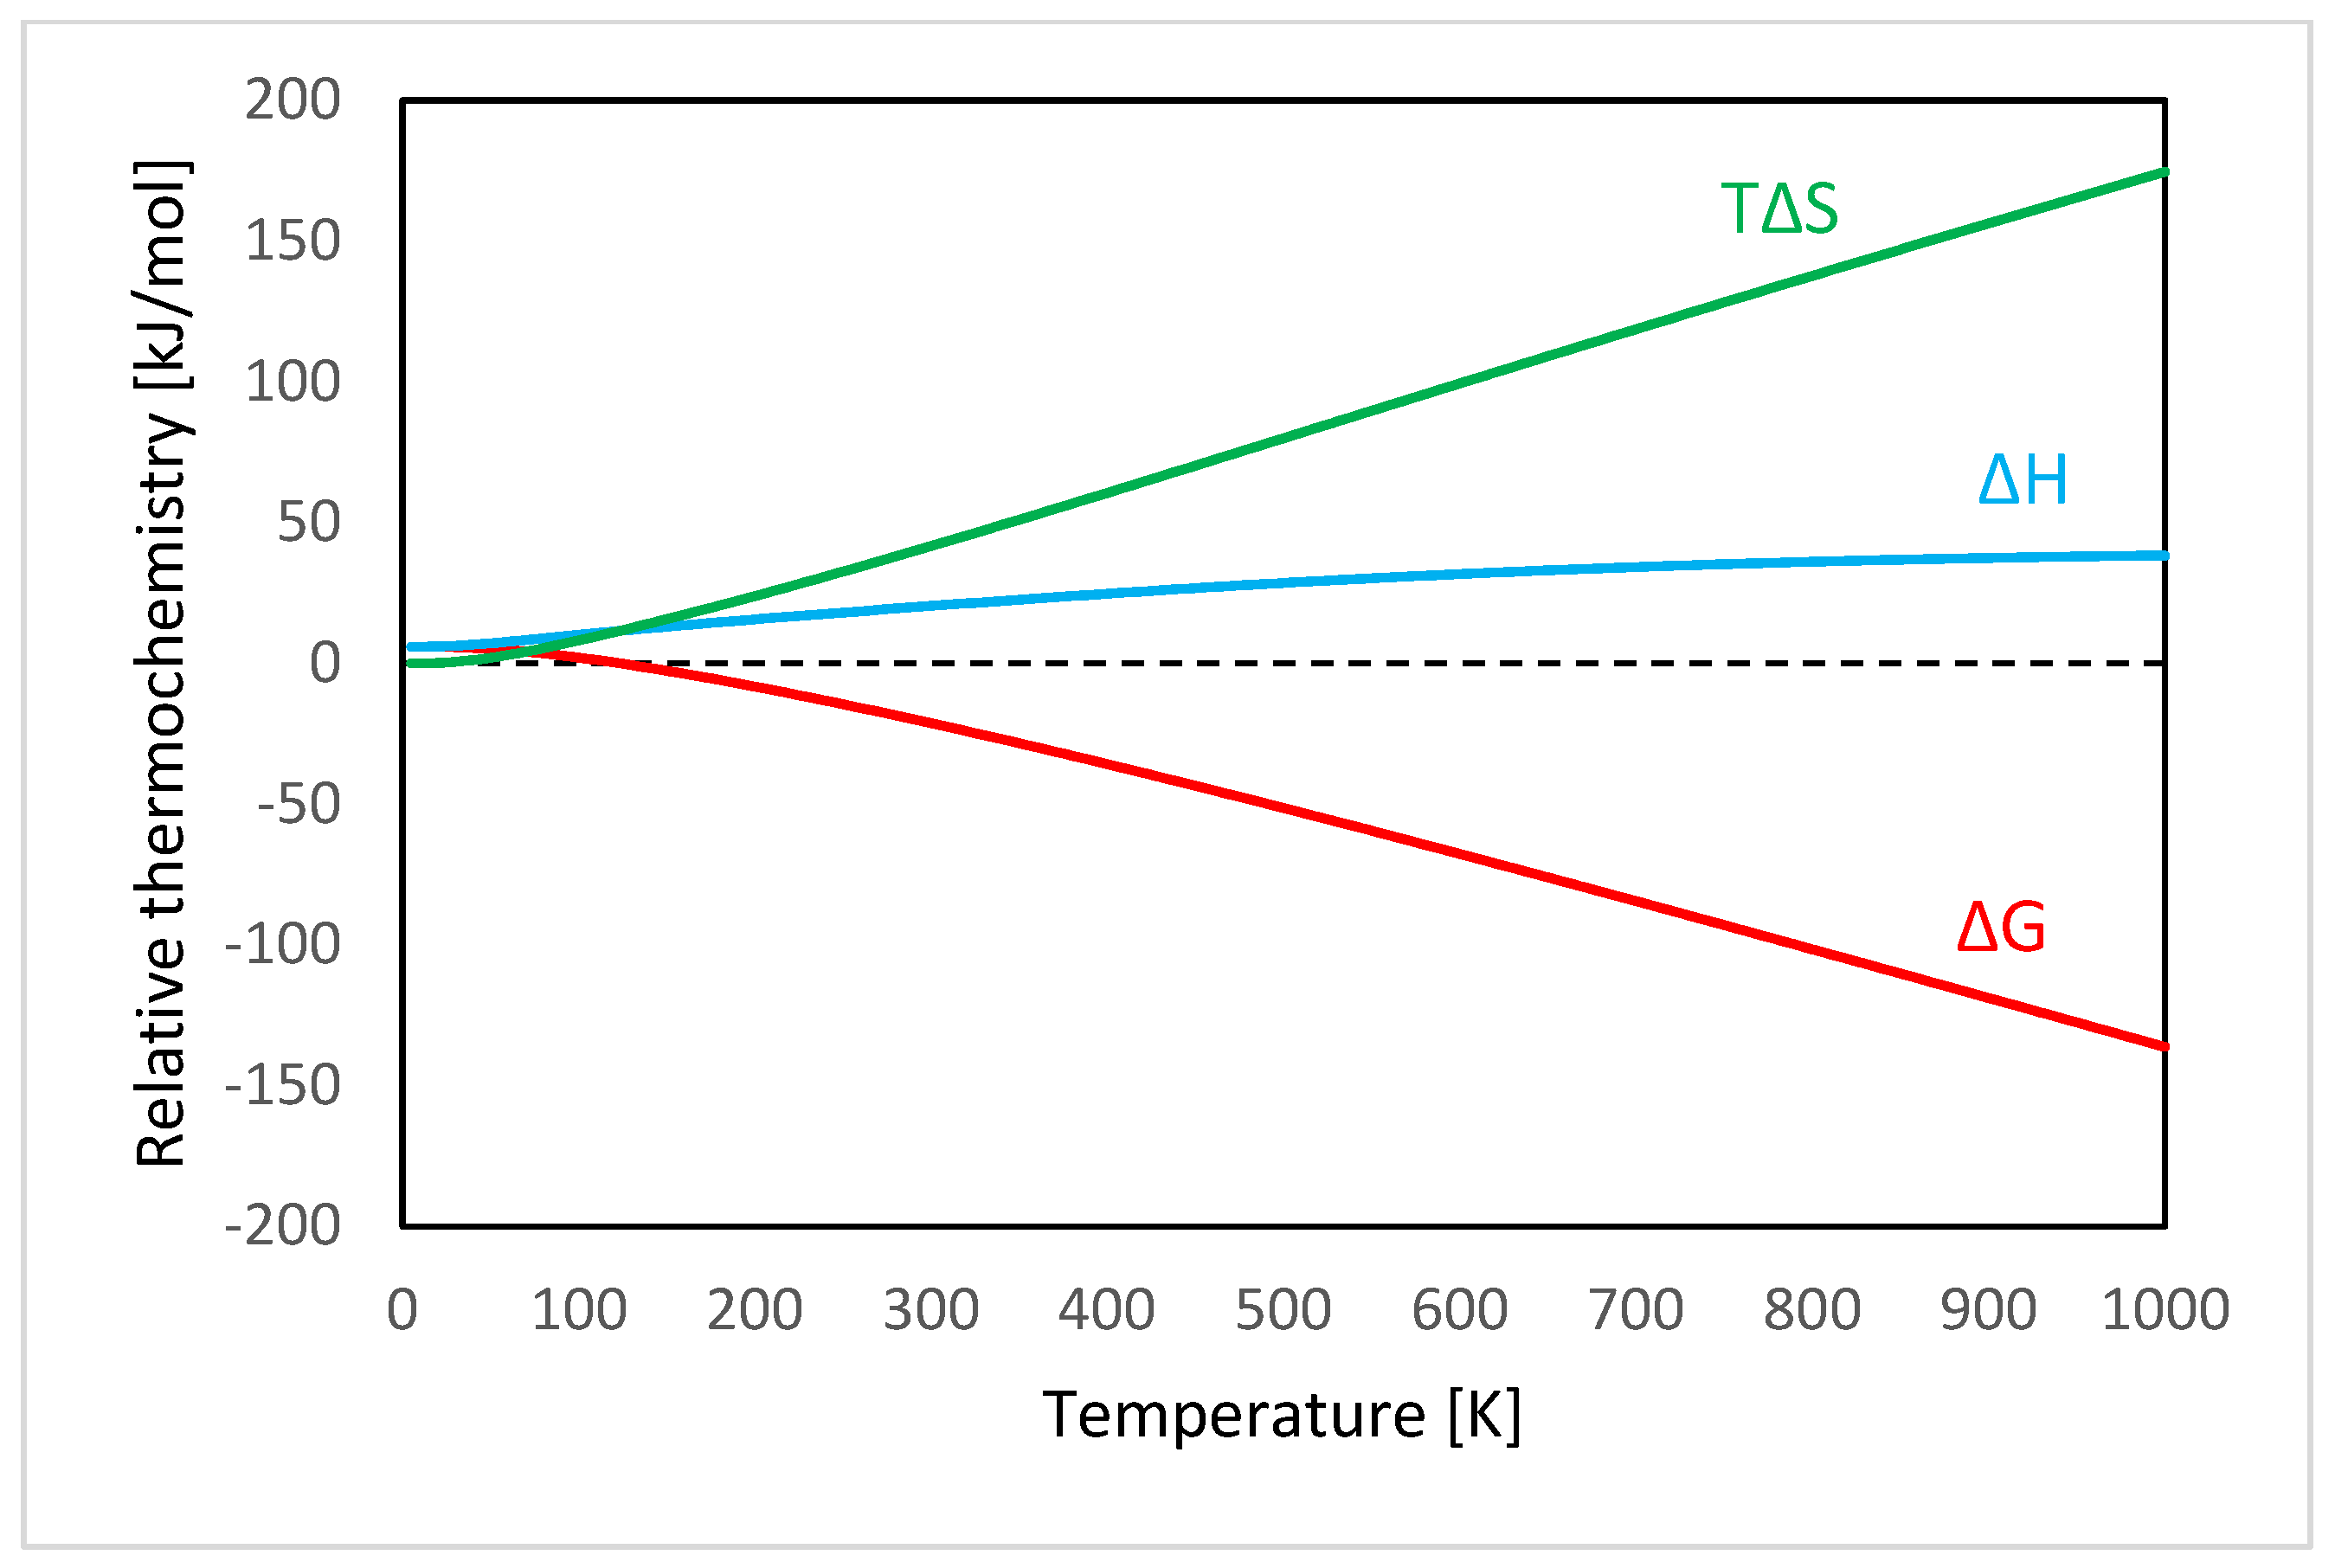
Despite the significant computational cost of phonon dispersion and phonon density of states calculations, they provide essential insight into the thermodynamic stability of polymorphic forms under pressure. The differences between thermodynamic quantities for Phase I and Phase IV (Δ, Phase I–Phase IV), including Gibbs free energy (ΔG), enthalpy (ΔH), and the entropic contribution (TΔS), calculated using the PBE-TS functional at 8.8 GPa as a function of temperature, are shown in Figure 4.
The calculated ΔG values reveal a temperature-dependent stability crossover between the two phases. Below approximately 125 K, ΔG remains positive, indicating that Phase IV is thermodynamically more stable in the low-temperature regime. Above this temperature, ΔG becomes negative, demonstrating that Phase I is stabilized at higher temperatures. The magnitude of the free energy differences is small, on the order of a few kJ/mol, which is typical for molecular crystal polymorphs and highlights the delicate balance between competing structures. This behavior indicates that even subtle entropic contributions can determine the relative stability of the phases.
The configurations selected for phonon calculations were chosen based on the results of the initial geometry optimizations of structures derived from experimentally determined Phases I and IV. The adopted notation reflects both the orientation of hydroxyl groups within the crystal lattice and the phase of origin. The three-letter code denotes the orientation of the hydroxyl group in each of the three reference molecules, as described above, while the suffix (I or IV) indicates whether the configuration was derived from Phase I or Phase IV. The experimentally observed structure is denoted as exp-I and corresponds to the UUU configuration.
Notably, the exp-I structure does not correspond to the lowest-energy configuration at 1 atm. Several alternative arrangements are energetically more favorable within the static DFT framework. This discrepancy between experimental stability and lattice energy indicates that static energetic considerations alone are insufficient to describe the relative stability of the system.
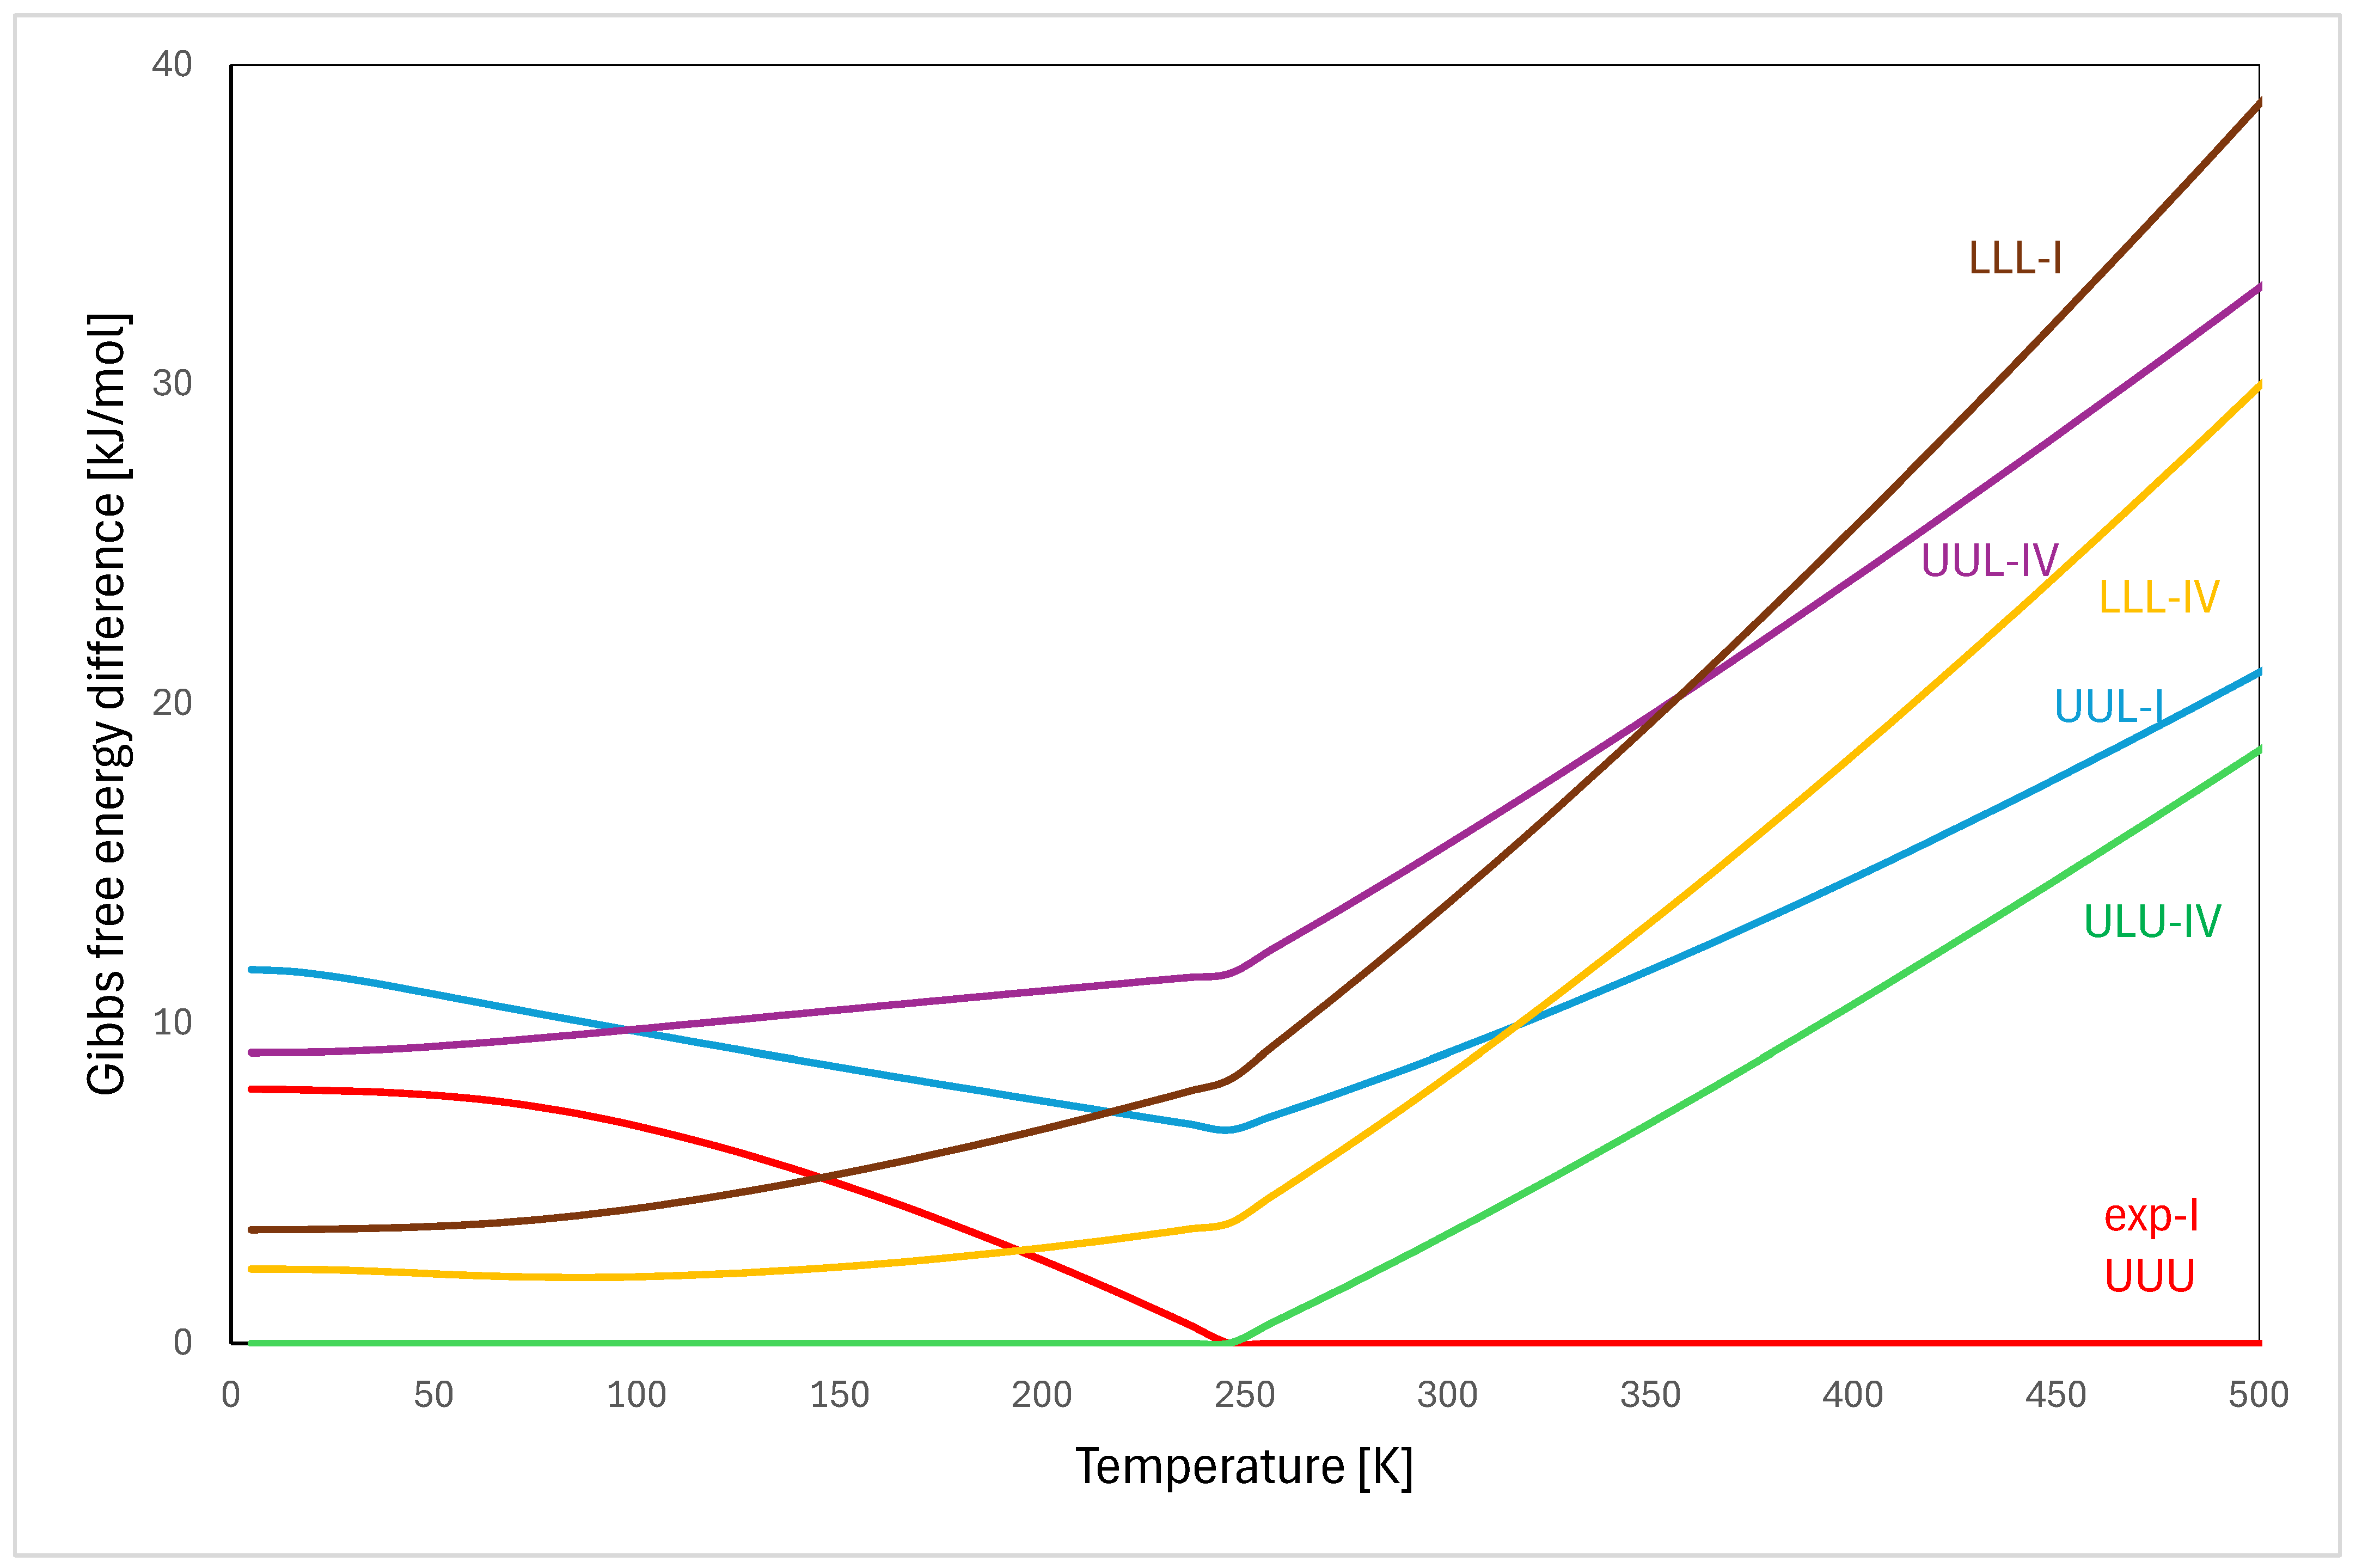
To address this, phonon calculations were performed for selected low-energy configurations identified at the optimization stage. This approach enables explicit evaluation of vibrational contributions to phase stability. Based on the computed phonon properties, Gibbs free energy differences (ΔG) between the configurations were evaluated as a function of temperature (Figure 5). For each temperature, the lowest ΔG value was taken as a reference (Min = 0), allowing direct comparison of relative thermodynamic stability.
At low temperatures, the configuration labeled GLG-IV is consistently the most stable, exhibiting the lowest ΔG values over a broad temperature range. Other configurations are significantly higher in energy, indicating that, within the harmonic approximation, GLG-IV provides the most favorable balance between lattice energy and vibrational contributions.
With increasing temperature, a gradual decrease in ΔG for exp-I relative to the reference configuration is observed, reflecting the growing importance of vibrational entropy. This trend becomes particularly pronounced above approximately 200 K.
A crossover in thermodynamic stability occurs at around 245 K, above which exp-I becomes the most stable configuration. This behavior is consistent with experimental observations, where Phase I is stable under ambient conditions.
This result clearly indicates that the stability of exp-I at elevated temperatures is not governed by enthalpy alone but is significantly influenced by vibrational entropy. The phase behavior can therefore be described as entropy-driven, with lattice dynamics favoring the experimentally observed structure at higher temperatures.
In contrast, most alternative configurations (excluding GLG-IV) show a monotonic increase in ΔG with temperature, leading to their progressive destabilization. As a result, they are unlikely to represent thermodynamically competitive phases under experimentally relevant conditions.
Overall, these findings demonstrate that the observed phase behavior cannot be explained by static lattice energies alone. Instead, it arises from a cooperative thermodynamic response in which subtle differences in hydrogen-bonding patterns and lattice dynamics are amplified by temperature-dependent vibrational contributions. This supports a mechanism in which the IPT in L-serine is governed by a delicate balance between intermolecular interactions and collective phonon modes, with vibrational entropy playing a decisive role in stabilizing the experimentally observed phase.
A comparison of thermodynamic contributions at 298 K (Table 10) provides further insight into the origin of phase stability. Decomposition of the Gibbs free energy into enthalpic and entropic components shows that the stabilization of exp-I does not arise from enthalpy. In fact, exp-I does not exhibit the most favorable enthalpy (H), as several alternative configurations possess lower H values. Instead, its stability is primarily driven by a larger vibrational entropy contribution (TΔS), which compensates for the less favorable enthalpy. The relatively small differences in thermodynamic quantities indicate that multiple configurations are energetically similar and may compete within a narrow thermodynamic window. This confirms that the stability of Phase I under ambient conditions arises from a delicate balance between enthalpic and entropic contributions. In particular, vibrational entropy stabilizes Phase I at elevated temperatures, consistent with the entropy-driven nature of the isosymmetric phase transition in L-serine.

4. Conclusions

The results of this study demonstrate that periodic DFT calculations provide a consistent and reliable description of the pressure-dependent structural and energetic behavior of L-serine, successfully reproducing the experimentally observed stabilization of Phase IV under elevated pressure. The calculated lattice energy trends reveal a gradual inversion of stability between Phase I and Phase IV, in agreement with experimental observations of the pressure-induced isosymmetric phase transition. At the same time, the absence of spontaneous hydroxyl group reorientation during geometry optimization indicates that the transition cannot be captured within a purely static framework, pointing to the presence of an energy barrier and the cooperative nature of the structural rearrangement.
Analysis of alternative hydroxyl group configurations reveals a complex energy landscape at ambient conditions, characterized by multiple local minima associated with distinct hydrogen-bonding motifs. Under compression, this landscape becomes significantly simplified, with a reduced number of energetically accessible configurations and clear stabilization of the arrangement corresponding to Phase IV. This behavior reflects the increasing importance of molecular packing efficiency and hydrogen-bond reorganization under pressure.
Inclusion of vibrational contributions through phonon calculations resolves the apparent discrepancy between experimental observations and static lattice energy results. The experimentally observed Phase I structure, although not corresponding to the lowest lattice energy, is stabilized at ambient conditions primarily by vibrational entropy. This demonstrates that the phase behavior of L-serine cannot be explained solely in terms of enthalpy, but instead arises from a delicate balance between energetic and entropic contributions.
In addition, the present study highlights the importance of carefully selecting functional–dispersion combinations when modeling molecular crystals under pressure, as different approaches may lead to significant variations in predicted structural and energetic properties. Importantly, the results demonstrate that lattice energy alone is insufficient to describe polymorphic stability, and that inclusion of vibrational contributions to Gibbs free energy is essential for capturing experimentally observed phase behavior. More generally, incorporation of temperature-dependent thermodynamic effects under pressure provides a more complete and physically meaningful description of high-pressure phase transitions, offering deeper insight into their mechanisms and stability relationships.
Overall, the pressure-induced isosymmetric phase transition in L-serine is governed by a cooperative interplay between hydrogen-bond rearrangements, lattice compression, and vibrational dynamics. These findings highlight the necessity of combining static DFT calculations with phonon-based thermodynamic analysis to achieve a comprehensive understanding of polymorphic stability in molecular crystals, particularly in systems where entropy plays a decisive role. Such entropy-driven effects have been reported in a range of molecular crystal systems, including amino acids such as glycine and pharmaceutical compounds such as paracetamol, where small energy differences between polymorphs are significantly influenced by vibrational contributions.

Supplementary Materials

The following supporting information can be downloaded at https://www.mdpi.com/article/10.3390/cryst16040266/s1, Table S1: Energy differences between Phase I and Phase IV of L-serine optimized using PBE TS functional under different pressures; Table S2: Geometrically optimized, using PBE TS functional, unit cell dimensions of generated configurations derived from L-serine Phase I and IV at 1 atm; Table S3: Geometrically optimized, using PBE TS functional, unit cell dimensions of generated configurations derived from L-serine Phase I and IV at 8.8 GPa.

Author Contributions

Conceptualisation, Ł.S., M.F.-R. and A.M.M.; methodology, Ł.S.; software, Ł.S.; validation, Ł.S.; formal analysis, Ł.S. and A.M.M.; investigation, Ł.S. and A.M.M.; resources, Ł.S.; data curation, Ł.S. and A.M.M.; writing—original draft preparation, Ł.S. and A.M.M.; writing—review and editing, Ł.S., M.F.-R. and A.M.M.; visualization, Ł.S. and A.M.M.; supervision, Ł.S. and M.F.-R.; project administration, Ł.S.; funding acquisition, Ł.S. All authors have read and agreed to the published version of the manuscript.

Funding

This research received no external funding.

Data Availability Statement

The raw data supporting the conclusions of this article will be made available by the authors on request.

Acknowledgments

During the preparation of this manuscript, the authors used QuillBot (https://quillbot.com/ accessed on 10 April 2026) for language editing and paraphrasing purposes. The authors have reviewed and edited the output and take full responsibility for the content of this publication.

Conflicts of Interest

The authors declare no conflicts of interest.

References

  1. Boldyreva, E.V. High-Pressure Diffraction Studies of Molecular Organic Solids. A Personal View. Acta Crystallogr. A Found. Crystallogr. 2008, 64, 218–231. [Google Scholar] [CrossRef] [PubMed]
  2. Hemley, R.J. Effects of High Pressure on Molecules. Annu. Rev. Phys. Chem. 2000, 51, 763–800. [Google Scholar] [CrossRef] [PubMed]
  3. Katrusiak, A. High-Pressure Crystallography. Acta Crystallogr. A Found. Crystallogr. 2008, 64, 135–148. [Google Scholar] [CrossRef]
  4. Carpenter, M.A.; Salje, E.K.H. Elastic Anomalies in Minerals Due to Structural Phase Transitions. EJM 1998, 10, 693–812. [Google Scholar] [CrossRef]
  5. Christy, A.G. Isosymmetric Structural Phase Transitions: Phenomenology and Examples. Acta Crystallogr. B Struct. Sci. 1995, 51, 753–757. [Google Scholar] [CrossRef]
  6. Clarke, S.M.; Steele, B.A.; Kroonblawd, M.P.; Zhang, D.; Kuo, I.-F.W.; Stavrou, E. An Isosymmetric High-Pressure Phase Transition in α-Glycylglycine: A Combined Experimental and Theoretical Study. J. Phys. Chem. B 2020, 124, 1–10. [Google Scholar] [CrossRef]
  7. Novelli, G.; Maynard-Casely, H.E.; McIntyre, G.J.; Warren, M.R.; Parsons, S. Effect of High Pressure on the Crystal Structures of Polymorphs of L-Histidine. Cryst. Growth Des. 2020, 20, 7788–7804. [Google Scholar] [CrossRef]
  8. Oswald, I.D.H.; Lennie, A.R.; Pulham, C.R.; Shankland, K. High-Pressure Structural Studies of the Pharmaceutical, Chlorothiazide. CrystEngComm 2010, 12, 2533. [Google Scholar] [CrossRef]
  9. Bull, C.L.; Funnell, N.P.; Ridley, C.J.; Pulham, C.R.; Coster, P.L.; Tellam, J.P.; Marshall, W.G. Pressure-Induced Isosymmetric Phase Transition in Biurea. CrystEngComm 2019, 21, 5872–5881. [Google Scholar] [CrossRef]
  10. Li, Q.; Li, S.; Wang, K.; Li, X.; Liu, J.; Liu, B.; Zou, G.; Zou, B. Pressure-Induced Isosymmetric Phase Transition in Sulfamic Acid: A Combined Raman and x-Ray Diffraction Study. J. Chem. Phys. 2013, 138, 214505. [Google Scholar] [CrossRef]
  11. Nourai, N.E.H.; Sebih, F.; Hadji, D.; Allal, F.Z.; Dib, S.; Kambouche, N.; Rolland, V.; Bellahouel-Benzine, S. Nonlinear Optical and Antimicrobial Activity of N-Acyl Glycine Derivatives. J. Mol. Liq. 2024, 398, 124260. [Google Scholar] [CrossRef]
  12. Wang, Y.; Liu, S.; Li, L.; Li, H.; Yin, Y.; Rencus-Lazar, S.; Guerin, S.; Ouyang, W.; Thompson, D.; Yang, R.; et al. Manipulating the Piezoelectric Response of Amino Acid-Based Assemblies by Supramolecular Engineering. J. Am. Chem. Soc. 2023, 145, 15533–15541. [Google Scholar] [CrossRef]
  13. Pensini, E.; Meszaros, P.; Kashlan, N.; Marangoni, A.G.; Laredo, T.; Gregori, S.; Mirzaee Ghazani, S.; van der Zalm, J.; Chen, A. Ferroelectric Hydrogels from Amino Acids and Oleic Acid. iScience 2024, 27, 110601. [Google Scholar] [CrossRef]
  14. Pasternak, M. Articaine—The queen of infiltrative anaesthesia? A peculiar amino-amide local anaesthetic and its use in the dental practice from a pharmacological perspective. Prospect. Pharm. Sci. 2025, 24, 31–38. [Google Scholar] [CrossRef]
  15. Boldyreva, E.V.; Sowa, H.; Seryotkin, Y.; Drebushchak, T.N.; Ahsbahs, H.; Chernyshev, V.; Dmitriev, V. Pressure-Induced Phase Transitions in Crystalline l-Serine Studied by Single-Crystal and High-Resolution Powder X-Ray Diffraction. Chem. Phys. Lett. 2006, 429, 474–478. [Google Scholar] [CrossRef]
  16. Fisch, M.; Lanza, A.; Boldyreva, E.; Macchi, P.; Casati, N. Kinetic Control of High-Pressure Solid-State Phase Transitions: A Case Study on l-Serine. J. Phys. Chem. C 2015, 119, 18611–18617. [Google Scholar] [CrossRef]
  17. Boldyreva, E.V.; Kolesnik, E.N.; Drebushchak, T.N.; Ahsbahs, H.; Beukes, J.A.; Weber, H.-P. A Comparative Study of the Anisotropy of Lattice Strain Induced in the Crystals of L-Serine by Cooling down to 100 K or by Increasing Pressure up to 4.4 GPa. Z. Krist.-Cryst. Mater. 2005, 220, 58–65. [Google Scholar] [CrossRef]
  18. Zakharov, B.A.; Kolesov, B.A.; Boldyreva, E.V. Effect of pressure on crystalline L- and DL-serine: Revisited by a combined single-crystal X-ray diffraction at a laboratory source and polarized Raman spectroscopy study. Acta Crystallogr. Sect. B Struct. Sci. 2012, 68, 275–286. [Google Scholar] [CrossRef]
  19. Szeleszczuk, Ł.; Pisklak, D.M.; Zielińska-Pisklak, M. Can we predict the structure and stability of molecular crystals under increased pressure? First-principles study of glycine phase transitions. J. Comput. Chem. 2018, 39, 1300–1306. [Google Scholar] [CrossRef]
  20. Drebushchak, T.N.; Sowa, H.; Seryotkin, Y.V.; Boldyreva, E.V.; Ahsbahs, H. L-Serine III at 8.0 GPa. Acta Crystallogr. Sect. E Struct. Rep. 2006, 62, o4052. [Google Scholar] [CrossRef]
  21. Moggach, S.A.; Marshall, W.G.; Parsons, S. High-Pressure Neutron Diffraction Study of L-Serine-I and L-Serine-II, and the Structure of L-Serine-III at 8.1 GPa. Acta Crystallogr. B Struct. Sci. 2006, 62, 815–825. [Google Scholar] [CrossRef]
  22. Moggach, S.A.; Allan, D.R.; Morrison, C.A.; Parsons, S.; Sawyer, L. Effect of Pressure on the Crystal Structure of L-Serine-I and the Crystal Structure of L-Serine-II at 5.4 GPa. Acta Crystallogr. B Struct. Sci. 2005, 61, 58–68. [Google Scholar] [CrossRef]
  23. Rychkov, D.A.; Stare, J.; Boldyreva, E.V. Pressure-Driven Phase Transition Mechanisms Revealed by Quantum Chemistry: L-Serine Polymorphs. Phys. Chem. Chem. Phys. 2017, 19, 6671–6676. [Google Scholar] [CrossRef]
  24. Reilly, A.M.; Tkatchenko, A. Role of Dispersion Interactions in the Polymorphism and Entropic Stabilization of the Aspirin Crystal. Phys. Rev. Lett. 2014, 113, 055701. [Google Scholar] [CrossRef]
  25. Qiu, L.; Li, X.-Y.; Miao, B.-W.; Yu, H.; Liu, W.; Sun, Y.; Tang, R.-L. Overcoming the Bandgap–Birefringence Trade-Off: Proton-Transfer Engineering of High-Performance Ultraviolet-Transparent Organic Crystal. Angew. Chem. Int. Ed. 2026, 138, e24424. [Google Scholar] [CrossRef]
  26. Yang, D.-X.; Tang, R.-L.; Lv, Y.-L.; Miao, B.-W.; Liu, W.; Guo, S.-P. A Novel Metal-Free Crystal Demonstrating Superior Birefringence Attributed to the Synergistic Interaction of Dual π-Conjugated Units. Sci. China Mater. 2025, 68, 3600–3606. [Google Scholar] [CrossRef]
  27. Neumann, M.A.; Perrin, M.-A. Energy Ranking of Molecular Crystals Using Density Functional Theory Calculations and an Empirical van Der Waals Correction. J. Phys. Chem. B 2005, 109, 15531–15541. [Google Scholar] [CrossRef] [PubMed]
  28. Fedorov, A.Y.; Rychkov, D.A. Comparison of different computational approaches for unveiling the high-pressure behavior of organic crystals at a molecular level. Case study of tolazamide polymorphs. J. Struct. Chem. 2020, 61, 1356–1366. [Google Scholar] [CrossRef]
  29. Rychkov, D.A. A Short Review of Current Computational Concepts for High-Pressure Phase Transition Studies in Molecular Crystals. Crystals 2020, 10, 81. [Google Scholar] [CrossRef]
  30. Dubok, A.S.; Rychkov, D.A. What Is More Important When Calculating the Thermodynamic Properties of Organic Crystals, Density Functional, Supercell, or Energy Second-Order Derivative Method Choice? Crystals 2025, 15, 274. [Google Scholar] [CrossRef]
  31. Clark, S.J.; Segall, M.D.; Pickard, C.J.; Hasnip, P.J.; Probert, M.I.J.; Refson, K.; Payne, M.C. First Principles Methods Using CASTEP. Z. Krist.-Cryst. Mater. 2005, 220, 567–570. [Google Scholar] [CrossRef]
  32. Perdew, J.P.; Burke, K.; Ernzerhof, M. Generalized Gradient Approximation Made Simple. Phys. Rev. Lett. 1996, 77, 3865–3868. [Google Scholar] [CrossRef]
  33. Tkatchenko, A.; Scheffler, M. Accurate Molecular Van Der Waals Interactions from Ground-State Electron Density and Free-Atom Reference Data. Phys. Rev. Lett. 2009, 102, 073005. [Google Scholar] [CrossRef]
  34. Grimme, S. Semiempirical GGA-type Density Functional Constructed with a Long-range Dispersion Correction. J. Comput. Chem. 2006, 27, 1787–1799. [Google Scholar] [CrossRef]
  35. Ambrosetti, A.; Reilly, A.M.; DiStasio, R.A.; Tkatchenko, A. Long-Range Correlation Energy Calculated from Coupled Atomic Response Functions. J. Chem. Phys. 2014, 140, 18A508. [Google Scholar] [CrossRef]
  36. Hammer, B.; Hansen, L.B.; Nørskov, J.K. Improved Adsorption Energetics within Density-Functional Theory Using Revised Perdew-Burke-Ernzerhof Functionals. Phys. Rev. B 1999, 59, 7413–7421. [Google Scholar] [CrossRef]
  37. Perdew, J.P.; Wang, Y. Accurate and simple analytic representation of the electron-gas correlation energy. Phys. Rev. B 1992, 45, 13244–13249. [Google Scholar] [CrossRef]
  38. Perdew, J.P.; Chevary, J.A.; Vosko, S.H.; Jackson, K.A.; Pederson, M.R.; Singh, D.J.; Fiolhais, C. Atoms, Molecules, Solids, and Surfaces: Applications of the Generalized Gradient Approximation for Exchange and Correlation. Phys. Rev. B 1992, 46, 6671–6687. [Google Scholar] [CrossRef] [PubMed]
  39. Ortmann, F.; Bechstedt, F.; Schmidt, W.G. Semiempirical van der Waals correction to the density functional description of solids and molecular structures. Phys. Rev. B 2006, 73, 205101. [Google Scholar] [CrossRef]
  40. Wu, Z.; Cohen, R.E. More Accurate Generalized Gradient Approximation for Solids. Phys. Rev. B 2006, 73, 235116. [Google Scholar] [CrossRef]
  41. Perdew, J.P.; Ruzsinszky, A.; Csonka, G.I.; Vydrov, O.A.; Scuseria, G.E.; Constantin, L.A.; Zhou, X.; Burke, K. Restoring the Density-Gradient Expansion for Exchange in Solids and Surfaces. Phys. Rev. Lett. 2008, 100, 136406. [Google Scholar] [CrossRef] [PubMed]
  42. Becke, A.D. Density-Functional Exchange-Energy Approximation with Correct Asymptotic Behavior. Phys. Rev. A 1988, 38, 3098–3100. [Google Scholar] [CrossRef] [PubMed]
  43. Lee, C.; Yang, W.; Parr, R.G. Development of the Colle-Salvetti Correlation-Energy Formula into a Functional of the Electron Density. Phys. Rev. B 1988, 37, 785–789. [Google Scholar] [CrossRef] [PubMed]
  44. Bartók, A.P.; Yates, J.R. Regularized SCAN Functional. J. Chem. Phys. 2019, 150, 161101. [Google Scholar] [CrossRef]
  45. Baroni, S.; De Gironcoli, S.; Dal Corso, A.; Giannozzi, P. Phonons and Related Crystal Properties from Density-Functional Perturbation Theory. Rev. Mod. Phys. 2001, 73, 515–562. [Google Scholar] [CrossRef]
  46. Guo, Y.Q.; Zhang, S.H.; Beyerlein, I.J.; Legut, D.; Shang, S.L.; Liu, Z.K.; Zhang, R.F. Synergetic Effects of Solute and Strain in Biocompatible Zn-Based and Mg-Based Alloys. Acta Mater. 2019, 181, 423–438. [Google Scholar] [CrossRef]
  47. Zhang, W.; Tang, G.; Sahoo, M.P.K.; Liang, Y.; Zhang, Y. Unified Picture for the Pressure-Controlled Band Gap in Inorganic Halide Perovskites: Role of Strain–Phonon and Phonon–Phonon Couplings. Phys. Rev. B 2022, 105, 075150. [Google Scholar] [CrossRef]
  48. Smirnova, V.Y.; Iurchenkova, A.A.; Rychkov, D.A. Computational Investigation of the Stability of Di-p-Tolyl Disulfide “Hidden” and “Conventional” Polymorphs at High Pressures. Crystals 2022, 12, 1157. [Google Scholar] [CrossRef]
Figure 1. Unit cells of L-serine (A) phase I and (B) phase IV. Gray: carbon, blue: nitrogen, red: oxygen, white: hydrogen.
Crystals 16 00266 g001
Figure 2. Pressure dependence of the lattice energy difference between Phase I and Phase IV of L-serine calculated using the PBE-TS functional. The zero reference corresponds to the equal lattice energy of Phase I and IV. The gray shaded region (5.4–5.8 GPa) indicates the experimentally observed pressure range of the onset of Phase IV under slow compression conditions, as reported by Fisch et al. [16].
Crystals 16 00266 g002
Figure 3. The asymmetric unit of L-serine phase IV with defined hydroxyl group orientation URL: Up (U), Right (R), Left (L).
Crystals 16 00266 g003
Figure 4. Differences (Phase I–Phase IV) between the thermodynamic parameters of the Gibbs free energy (∆G), enthalpy (∆H), and temperature times entropy (T∆S) of the structures modeled using PBE TS functional at 8.8 GPa, with respect to the temperature. The zero reference corresponds to the equal values of thermodynamic properties of Phase I and IV.
Crystals 16 00266 g004
Figure 5. Differences (Phase I–Min) between the thermodynamic parameter of the Gibbs free energy (∆G) of the structures modeled using PBE TS functional at 1 atm, with respect to the temperature. The zero reference corresponds to the lattice free energy of the most thermodynamically stable phase.
Crystals 16 00266 g005
Table 1. DFT-based computational methods used in this study.
No.ApproximationFunctionalDispersion
Correction
References
1GGAPBETS[32,33]
2GGAPBEGD2[32,34]
3GGAPBEMBD*[32,35]
4GGAPBENot used[32]
5GGARPBETS[33,36]
6GGARPBENot used[36]
7GGAPW91TS[33,37,38]
8GGAPW91OBS[37,38,39]
9GGAPW91Not used[37,38]
10GGAWCNot used[40]
11GGAPBESOLTS[33,41]
12GGAPBESOLNot used[41]
13GGABLYPTS[33,42,43]
14GGABLYPGD2[34,42,43]
15GGABLYPNot used[42,43]
16meta-GGARSCANNot used[44]
Table 2. Comparison of experimentally determined and geometrically optimized unit cell dimensions of L-serine Phase I at 1 atm.
CCDC Ref. Code/DFT FunctionalDispersion
Correction
a [Å]b [Å]c [Å]V [Å3]
CSD_LSERIN20 16.858 18.519(3)9.264(3)1358.9
PBETS16.9068.4899.4691303.2
PBEGD216.9698.4339.1061340.6
PBEMBD*16.9378.4979.3161470.2
PBENot used17.0878.7389.8471295.5
RPBETS16.3728.8148.9781859.2
RPBENot used17.56910.51010.0691365.0
PW91TS16.9188.4799.5151364.9
PW91OBS16.9188.4819.5131469.5
PW91Not used17.0768.7179.8721365.5
WCNot used16.8088.4599.6051286.7
PBESOLTS16.6628.3649.2331343.0
PBESOLNot used16.7848.4399.4811244.1
BLYPTS16.5088.7408.6231292.8
BLYPGD217.1418.5078.8661591.5
BLYPNot used17.3729.07510.0951327.1
RSCANNot used16.8258.5199.2591358.9
1 The value was multiplied by three to enable direct comparison with the L-serine phase IV crystal lattice.
Table 3. Comparison of experimentally determined at 6.64 GPa and geometrically optimized at 1 atm unit cell dimensions of L-serine Phase IV.
CCDC Ref. Code/DFT FunctionalDispersion
Correction
a [Å]b [Å]c [Å]V [Å3]
CSD_LSERIN50 16.09873(5)8.42773(2)8.04459(7)1091.5
PBETS16.3069.1109.1971366.1
PBEGD216.5348.7518.8501280.5
PBEMBD*16.2979.0909.1231351.5
PBENot used16.5939.39010.0801570.4
RPBETS16.3318.6628.7741241.0
RPBENot used16.7729.65510.7661743.3
PW91TS16.2799.1649.2911386.0
PW91OBS16.2819.1619.2911385.8
PW91Not used16.5779.38410.1191574.1
WCNot used16.3919.2189.9301500.2
PBESOLTS16.1318.9959.0211308.8
PBESOLNot used16.1239.2639.5851431.4
BLYPTS16.4078.6148.4591195.4
BLYPGD216.6728.7248.7421271.5
BLYPNot used16.7779.51610.5511684.4
RSCANNot used16.3178.8989.1101322.7
Table 4. Comparison of experimentally determined and geometrically optimized unit cell dimensions of L-serine Phase I at 8.8 GPa.
CCDC Ref. Code/DFT FunctionalDispersion
Correction
a [Å]b [Å]c [Å]V [Å3]
L-Ser I 16.05096 18.15948.336691091.8
PBETS16.2778.0618.3661097.7
PBEGD216.2898.0328.2281076.6
PBEMBD*16.2328.0788.2731084.7
PBENot used16.3278.1948.4221126.7
RPBETS16.0577.7557.828974.6
RPBENot used16.5298.3038.6181182.8
PW91TS16.2428.0828.3501096.1
PW91OBS16.2418.0848.3501096.2
PW91Not used16.3088.1918.4061123.0
WCNot used16.1158.0858.2681077.2
PBESOLTS15.4438.4208.1281057.0
PBESOLNot used16.1058.0888.2701077.2
BLYPTS16.4387.7037.9241003.3
BLYPGD216.4088.0408.2371086.6
BLYPNot used16.5028.2898.5161164.9
RSCANNot used16.1628.0848.2671080.2
1 The value was multiplied by three to enable direct comparison with the L-serine phase IV crystal lattice.
Table 5. Comparison of experimentally determined and geometrically optimized unit cell dimensions of L-serine Phase IV at 8.8 GPa.
CCDC Ref. Code/DFT FunctionalDispersion
Correction
a [Å]b [Å]c [Å]V [Å3]
L-Ser IV 16.013968.343787.930061091.8
PBETS15.9438.2968.0841069.3
PBEGD215.9728.2327.9761048.6
PBEMBD*15.9418.2578.0201055.7
PBENot used16.0448.3718.1561095.4
RPBETS15.6478.1067.646969.8
RPBENot used16.2168.5218.3511153.9
PW91TS15.9418.2908.0741067.1
PW91OBS15.9438.2898.0741067.0
PW91Not used16.0338.3598.1401091.0
WCNot used15.8648.2397.9841043.5
PBESOLTS15.8108.1827.9201024.5
PBESOLNot used15.8678.2407.9861044.1
BLYPTS15.7398.1697.673986.5
BLYPGD216.0758.2607.9761059.0
BLYPNot used16.2048.4758.2541133.5
RSCANNot used15.8938.2398.0051048.1
Table 6. Energy differences between Phase I and Phase IV of L-serine optimized at 1 atm.
DFT FunctionalDispersion
Correction
∆E Phase I—Phase IV
[kJ/mol]
PBETS−138.36
PBEGD2−149.09
PBEMBD*−153.93
PBENot used−51.56
RPBETS−107.59
RPBENot used−48.20
PW91TS−128.46
PW91OBS−128.41
PW91Not used−42.26
WCNot used−40.90
PBESOLTS−110.38
PBESOLNot used−82.98
BLYPTS−83.12
BLYPGD2−148.56
BLYPNot used−25.62
RSCANNot used−183.55
Table 7. Energy differences between Phase I and Phase IV of L-serine optimized at 8.8 GPa.
DFT FunctionalDispersion
Correction
∆E Phase I—Phase IV [kJ/mol]
PBETS30.61
PBEGD20.37
PBEMBD*6.43
PBENot used−31.79
RPBETS63.40
RPBENot used−72.58
PW91TS22.93
PW91OBS23.00
PW91Not used−26.77
WCNot used18.17
PBESOLTS34.20
PBESOLNot used22.47
BLYPTS145.16
BLYPGD2−0.48
BLYPNot used−52.71
RSCANNot used−23.36
Table 8. Energy differences between Phase I (UUU) and configurations derived from Phase I and IV of L-serine optimized using PBE TS functional at 1 atm. Negative values are bolded.
Label∆E Configuration Derived from Phase I—Phase I (UUU) [kJ/mol]∆E Configuration Derived from Phase IV—Phase I (UUU) [kJ/mol]
UUU0.0081.76
UUR79.6847.12
UUL−15.41−22.98
URU19.06171.99
URR151.72106.47
URL3.15138.38
ULU36.50−29.20
ULR115.55127.26
ULL11.6640.47
RUU63.5295.70
RUR181.37117.03
RUL126.52135.68
RRU146.38147.09
RRR89.41205.08
RRL84.83197.88
RLU68.3627.42
RLR71.3083.95
RLL46.6372.22
LUU57.997.15
LUR73.7545.06
LUL101.0533.73
LRU119.63174.17
LRR77.64116.96
LRL87.9191.52
LLU40.3819.50
LLR40.5381.07
LLL−47.67−48.33
Table 9. Energy differences between Phase IV (URL) and configurations derived from Phase I and IV of L-serine optimized using PBE TS functional at 8.8 GPa.
Label∆E Configuration Derived from Phase I—Phase IV (URL) [kJ/mol]∆E Configuration Derived from Phase IV—Phase IV (URL) [kJ/mol]
UUU42.97130.69
UUR102.81117.65
UUL1.2428.61
URU5.6692.86
URR135.1871.32
URL0.0012.14
ULU156.3342.25
ULR217.53218.73
ULL91.9769.47
RUU77.04191.69
RUR126.76201.43
RUL174.96108.89
RRU94.57126.20
RRR52.3988.01
RRL69.0872.90
RLU179.66136.13
RLR149.19226.55
RLL74.2974.16
LUU54.9092.82
LUR113.9696.00
LUL127.73128.93
LRU156.40127.72
LRR134.90102.62
LRL11.9311.86
LLU157.74198.32
LLR108.96100.81
LLL86.1358.89
Table 10. Energy of experimentally obtained Phase I (UUU) and configurations derived from Phase I and IV of L-serine optimized using PBE TS functional at 298 K. Values [kJ/mol] are presented in reference to exp-I.
LabelHTSG
exp-I (UUU)0.000.000.00
UUL-I−5.37−14.288.91
UUL-IV−7.78−23.1015.32
LLL-I−18.47−31.8413.37
LLL-IV−18.78−26.818.03
ULU-IV−16.51−19.703.19
Disclaimer/Publisher’s Note: The statements, opinions and data contained in all publications are solely those of the individual author(s) and contributor(s) and not of MDPI and/or the editor(s). MDPI and/or the editor(s) disclaim responsibility for any injury to people or property resulting from any ideas, methods, instructions or products referred to in the content.