Review

X-Ray Characterization of Semiconductor Materials and Advanced Packaging: A Perspective on Multidimensional Structural Analysis


1
State Key Laboratory of Spintronics, Hangzhou International Innovation Institute, Beihang University, Hangzhou 311115, China
2
MIIT Key Laboratory of Spintronics, Fert Beijing Institute, School of Integrated Circuit Science and Engineering, Beihang University, Beijing 100191, China
3
Qingdao Research Institute, Beihang University, Qingdao 266100, China
4
High Energy Photon Source, Institute of High Energy Physics, Chinese Academy of Sciences, Beijing 100049, China
5
University of Chinese Academy of Sciences, Beijing 100049, China
6
Truth Instruments (Hangzhou) Co., Ltd., Hangzhou 311115, China
*
Authors to whom correspondence should be addressed.
Crystals 2026, 16(4), 265; https://doi.org/10.3390/cryst16040265
Submission received: 20 March 2026 / Revised: 6 April 2026 / Accepted: 8 April 2026 / Published: 14 April 2026
(This article belongs to the Section Inorganic Crystalline Materials)

Abstract

X-ray techniques provide powerful, non-destructive tools for structural characterization in semiconductor manufacturing and advanced packaging. Their strong penetration capability and sensitivity to multiple contrast mechanisms enable the investigation of lattice structure, strain, defects, interfaces, and elemental distribution across a wide range of length scales. As semiconductor devices evolve toward three-dimensional architectures and heterogeneous integration, there is an increasing demand for characterization approaches capable of probing complex, buried, and multi-scale structures in a consistent manner. In this review, we present a systematic overview of X-ray characterization techniques for advanced semiconductor systems, including diffraction-based methods, small-angle scattering, computed tomography, X-ray fluorescence, and spectroscopic approaches. These techniques are discussed in terms of the type of structural, morphological, and compositional information they provide, their applicable length scales, and their strengths and limitations in addressing key challenges such as thin films, high-aspect-ratio structures, buried interfaces, and full wafers. Particular attention is given to the complementary nature of different X-ray modalities and their roles in addressing practical metrology problems. The limitations associated with resolution, model dependence, and data interpretation are also outlined. Finally, emerging opportunities in laboratory X-ray sources, synchrotron-based methods, and integrated characterization strategies are briefly discussed. This review aims to provide a unified perspective for understanding and integrating X-ray techniques, offering insights into their roles in addressing the growing complexity of next-generation semiconductor devices.

1. Introduction

Structural characterization plays a central role in understanding and engineering modern material and device systems. Among the available approaches, X-ray-based techniques provide a uniquely powerful platform due to their strong penetration capability and sensitivity to multiple contrast mechanisms within a unified physical framework. These advantages are becoming increasingly important as semiconductor technologies undergo rapid structural evolution driven by both “More Moore” and “More-than-Moore” paradigms. On the one hand, as device dimensions approach the atomic scale [1], high-aspect-ratio (HAR) structures such as three-dimensional FinFETs, nanosheets, and Gate-all-around (GAA) architectures [2,3], have increased substantially. At the same time, advanced packaging and heterogeneous integration are introducing see-through architectures that integrate multiple chips and materials within three-dimensional configurations. This has led to emerging interconnect structures like through-silicon vias (TSVs), micro-bumps, and hybrid bonding, enabling ultra-short-distance, ultra-high-bandwidth connections between chips [4,5].
As a result, key structural challenges in modern semiconductor systems can be broadly categorized into several recurring types, including thin films and multilayers, high-aspect-ratio nanostructures, buried or see-through architectures, and wafer-scale variations. These challenges span multiple length scales, information dimensions, and collectively determine device performance and reliability. For example, thin-film properties—such as thickness, density, and interface roughness—govern dielectric behavior; geometrical parameters in high-aspect-ratio devices influence electrostatic control and variability; buried interface quality affects interconnect reliability in three-dimensional integration; and wafer-scale non-uniformities impact yield and large-scale device performance.
In response to these challenges, semiconductor metrology is undergoing a paradigm shift: transitioning from two-dimensional geometric measurements to three-dimensional and multi-physics coupled analysis. At the same time, rapid advances in high-brightness synchrotron radiation sources [6], laboratory microfocus X-ray sources, and high-performance detectors have significantly expanded the capabilities and accessibility of X-ray metrology. From this perspective, modern X-ray methods are evolving from isolated characterization tools into a multidimensional crystallographic framework.
Despite the rapid development of these methods, existing reviews are often organized around individual techniques, making it difficult to obtain a unified understanding of how different X-ray approaches relate to specific semiconductor characterization challenges. In practical scenarios, multiple techniques are often required to fully resolve complex structures, particularly in systems involving multi-scale features and heterogeneous integration. In particular, as shown in Table 1, the same practical challenge often requires multiple information dimensions. Accordingly, this review aims to provide a structured perspective on X-ray characterization techniques by organizing them according to the types of information they provide across different dimensions. The relationships and potential complementarity between these techniques are discussed where appropriate.

2. X-Ray Scattering and Diffraction Techniques for Microstructural Characterization

In modern semiconductor devices, many of the most important structural variables are not directly visible as geometric objects, but manifest as changes in lattice spacing, crystal tilt, strain partitioning, and periodic electron-density modulation. These quantities govern channel mobility, epitaxial stability, stress engineering, and process-induced relaxation, yet they are often buried inside multilayer stacks and cannot be quantitatively obtained by surface-sensitive inspection or direct cross-sectional imaging alone. Physically, because these problems originate from periodic atomic order, they are most naturally encoded in reciprocal space through the positions, widths, asymmetries, and intensity distributions of diffraction or scattering signals. For this reason, X-ray diffraction, scattering, and reflectivity are indispensable when the scientific question is how the lattice is distorted, how periodic nanostructures are formed, or how buried crystalline order evolves in semiconductor structures.

2.1. X-Ray Diffraction (XRD) for Crystal Orientation and Strain Metrology

Precise control of crystal orientation and lattice strain is fundamental to semiconductor manufacturing, as these parameters govern epitaxial growth behavior, strain engineering, and device performance. X-ray diffraction (XRD) provides a direct and quantitative approach for measuring lattice parameters, crystal orientation, and strain states in semiconductor structures. From an information perspective, XRD provides both statistically averaged structural data and spatially resolved insights. As device architecture evolves toward three-dimensional configurations and localized strain engineering, XRD has progressively expanded from conventional two-dimensional statistical characterization to quasi-three-dimensional approaches with limited depth sensitivity, and, more recently, to truly three-dimensional diffraction-based structural characterization.
Traditional XRD employs a spot size ranging from millimeters to hundreds of micrometers to illuminate the sample. The detector scans through angular space to acquire diffraction signals, with the resulting measurements essentially representing the statistical average response of the crystal structure within the spot’s coverage area. Consequently, statistical XRD does not provide spatial distribution information but instead yields macroscopic quantities such as average lattice parameters, orientation dispersion, and defect fluctuations. Two core types of information can be extracted from these diffraction peaks. First, the position of each peak directly corresponds to the interplanar spacing of a specific crystal plane. Precise measurement of minute shifts in peak positions enables calculation of elastic strain in the lattice under applied force. For example, in SiGe strain channels, epitaxial layer-matching structures, and metal interconnect layers, measurements of symmetric and asymmetric reflections can, respectively, extract the in-plane and out-of-plane strain components, enabling evaluation of epitaxial quality and residual stress states [7,8,9,10]. For example, the systematic shift of the SiGe diffraction peak with decreasing fin width provides direct evidence of strain relaxation at the nanoscale, demonstrating the sensitivity of XRD to process-induced dimensional effects. Second, when grain size decreases, or micro-strain arises from dislocations in the lattice, the width of diffraction peaks increases accordingly. The half-width of the rocking curve, obtained by slowly oscillating the sample at a fixed diffraction angle, directly quantifies the degree of deviation from the ideal texture: the more dispersed the orientation, the broader the curve. In metal interconnect layers, grain orientation directly impacts electromigration lifetime. For instance, in Al interconnect films, the (111) preferred orientation reduces the number of grain-boundary diffusion pathways, thereby enhancing reliability. Precise measurement of swing curve width enables quantitative comparison of how different underlayers influence texture, significantly delivering an order-of-magnitude improvement in electromigration lifetime [11]. In copper interconnects, XRD polar pattern analysis reveals correlations between fiber texture and plating additives/annealing processes, providing a basis for optimizing fill quality and suppressing void formation [12,13,14]. This demonstrates that statistically oriented information measured by XRD can be directly converted into engineering reliability metrics.
In integrated circuits manufacturing, XRD has primarily evolved along three experimental systems: monochromatic microbeam diffraction, white-light Laue diffraction, and X-ray diffraction imaging (XRDI). Despite differing experimental geometries and data formats, these techniques have evolved methodologically from two-dimensional localized scanning to quasi-three-dimensional depth analysis, providing critical support for semiconductor process optimization and reliability assessment.
Monochromatic scanning diffraction employs a focused monochromatic X-ray beam to scan the sample point by point, achieving high spatial resolution and extensive detection coverage across different scales, such as structural imaging of wafers [15], warpage analysis of packaged chips [16], and characterization of localized strain in advanced node devices such as FinFETs [17]. Building upon this, Shida et al. developed a quasi-3D tomographic mapping method by exploiting the continuous depth variation of Ge content in SiGe buffer layers and its correlation with the Bragg angle (2θ). Because the Ge composition varies monotonically with depth, the corresponding change in lattice spacing leads to a depth-dependent shift in 2θ, allowing the 2θ dimension in the 3D reciprocal space to be used as a proxy for depth. This enables quasi-3D reconstruction of the distribution of mismatch dislocations in a non-destructive manner [18]. When the focus shifts to polycrystalline metal interconnects, white-light Laue diffraction is typically employed, enabling each grain to generate multiple sets of diffraction spots under fixed-geometry conditions. It is currently widely used to address stress concentration issues caused by thermal expansion mismatch in TSV copper fillings within 3D packaging, as well as to identify regions of localized elastic strain and plastic deformation [19,20,21]. Similarly, combined with differential probe technology, it achieves the first non-destructive quantitative measurement of the full stress tensor at varying depths within TSVs [19]. X-ray diffraction imaging techniques capture two-dimensional projections of lattice distortions using wide beams, followed by B-spline surface fitting [22,23] and energy-resolved slicing [24] to yield three-dimensional distributions of silicon lattice bending surfaces in packaged chips and minute lattice tilts (±0.03°).
Building upon the aforementioned quasi-3D techniques, a new generation of methods capable of directly acquiring three-dimensional volumetric information has emerged in recent years. These technologies no longer rely solely on integration or tomographic mapping in the depth direction. Instead, they achieve three-dimensional reconstruction of strain fields within individual grains or entire polycrystalline networks through coherent diffraction or tomographic geometries. Bragg coherent diffraction imaging (BCDI) directly reconstructs the three-dimensional strain and displacement fields within individual grains or nanostructures by inverting three-dimensional coherent diffraction patterns collected around one or more Bragg diffraction peaks. This technique has been successfully applied to map nanoscale strain distributions in silicon-on-insulator (SOI) nanostructures [25]. The introduction of scanning redundancy concepts has led to the development of Bragg ptychography, which significantly enhances the resolution and scanning range of BCDI technology. This advancement enables the detection of nanoscale strain and defect distributions in electronic devices and chips within wafer-level packaging [26,27,28]. Besides the above technologies, diffraction contrast tomography (DCT) [29] and three-dimensional X-ray diffraction (3DXRD) [30,31] aim to resolve the three-dimensional orientation and strain networks of hundreds to thousands of grains in polycrystalline materials. With breakthroughs in laboratory light-source technology [32], these techniques will gradually demonstrate significant engineering potential for reliability studies of semiconductor interconnect metals and power-device metallization layers.
Overall, diffraction-based X-ray methods reconstruct the various crystallographic quantities. Table 2 compares several representative approaches in terms of their most relevant semiconductor applications, strengths, and limitations.

2.2. Small-Angle X-Ray Scattering (SAXS) for Critical Dimension Metrology

The transition toward increasingly complex three-dimensional device architectures has made accurate characterization of nanoscale feature sizes and periodic structures more challenging. Critical dimension metrology must now capture structural information from densely packed features with high statistical reliability. Small-angle X-ray scattering (SAXS) probes the spatial correlations of nanoscale structures [32] by analyzing the angular distribution of X-rays scattered at small angles. Because geometric parameters such as feature size, pitch, and edge roughness directly modulate the scattering intensity and reciprocal-space distribution, SAXS enables the quantitative extraction of critical dimensions (CDs), line-edge roughness, and average cross-sectional profiles in periodic semiconductor nanostructures [33,34,35]. The fundamental principle involves irradiating the sample with a collimated, monochromatic X-ray beam and recording coherent scattering signals at small scattering angles, which originate from nanoscale inhomogeneities in electron density.
The quantitative relationship between intensity I q and scattering vector q , derived from scattering theory, form the core of SAXS analysis:
I q F q 2 = Δ ρ 2 V 2 P q S q
where Δ ρ is the difference in electron density between the scatterer and the matrix, V is the scatterer volume, P q is the shape factor reflecting the geometric characteristics of a single particle, and S q is the structure factor describing the spatial arrangement and interactions between particles.
In advanced semiconductor devices, photolithographic patterns such as line grids and through-hole arrays are considered highly periodic grating structures. CD-SAXS essentially measures the Fourier distribution P q of the structure’s electron density. The positions of diffraction peaks determine the structural periodicity, while the intensity distribution across different orders encodes information about the cross-sectional morphology within a single period. For high-aspect-ratio structures such as 3D NAND channel holes, the scattering amplitude can be interpreted as the coherent superposition of Fourier components from different depth directions. Structural variations along the sidewalls, therefore, modulate the intensity distribution of higher diffraction orders. For example, sidewall curvature alters the intensity envelope of diffraction peaks, while bottom tilts introduce peak asymmetry and broadening. In high-aspect-ratio structures, the scattering amplitude approximately scales with the structure height, while the scattered intensity scales with the square of the height, providing a significant signal advantage for CD-SAXS in high-aspect-ratio semiconductor architectures.
Based on this scattering framework, structural information is distributed across different regions of reciprocal space. In practical CD-SAXS analysis, different q ranges encode structural features at distinct length scales, enabling hierarchical reconstruction of semiconductor nanostructures: the low-q region primarily encodes overall periodicity and macroscopic geometric perturbations, making it particularly critical for inline CD control during back-end-of-line (BEOL) processes [36,37]. The middle-q region contains detailed information on sidewall curvature and profile evolution and plays a central role in enabling model-based reconstruction of three-dimensional structural profiles, such as “two-bow” or multi-curvature structures. By jointly fitting multi-order scattering intensity distributions, stable reconstruction of sidewall profiles along the depth direction is achieved. CD-SAXS measurements performed on semiconductor wafers show excellent agreement with cross-sectional TEM observations, confirming that the mid-q region of the scattering spectrum contains sufficient information to constrain three-dimensional profile reconstruction [38]. The high q region is sensitive to nanoscale interfacial structures and thin layers. As demonstrated by Rigaku team, a ~2 nm thick sidewall metal coating produces detectable scattering contributions due to its strong electron density gradient, enabling quantitative analysis of deeply buried thin films. These capabilities demonstrate that CD-SAXS provides a unified metrology framework capable of simultaneously resolving macroscopic structural geometry and nanoscale interfacial features in advanced semiconductor architectures [39].
However, this effective utilization of the medium-to-high q region imposes more stringent requirements on experimental conditions. Early high-precision SAXS studies relied almost entirely on synchrotron radiation sources [40]. For transmission CD-SAXS, which requires penetration through 750 μm silicon wafers, X-ray energies exceeding 15 keV are necessary to minimize absorption losses. Over the past two decades, laboratory source technologies such as micro-focused rotating anodes and liquid metal jets have significantly enhanced brightness, enabling high-energy laboratory systems to gradually support CD-SAXS. However, in online metrology scenarios for logic devices, achieving sub-minute measurement throughput with a spot size under 100 μm while maintaining a divergence angle below the diffraction-peak spacing of 1 mrad poses a challenge that requires at least a two-order-of-magnitude increase in source brightness [41]. In contrast, memory devices have become the first commercial field for CD-SAXS online applications due to their strong scattering signals from high-aspect-ratio structures. Multiple equipment suppliers have launched compact transmission SAXS systems suitable for cleanrooms, such as the Bruker Sirius-XCD, which can complete single-point measurements within minutes [42]. Moreover, the true expansion of CD-SAXS capabilities stems not only from improvements in light-source and detector performance but also from continuous optimization of the inverse-problem-solving framework [35,43]. Traditional iterative approximation methods struggle to meet the high-throughput demands of production lines, but the application of deep learning is gradually changing this landscape. Through convolutional neural networks [44], ResNet [45], and other architectures, analysis time can be compressed from hours to seconds.
Although transmission CD-SAXS is well suited for deep structures, its strong penetration limits sensitivity to surface features such as interface roughness, line edge roughness, and shallow buried structures. This limitation arises from the measurement geometry itself, as transmission scattering primarily captures structural information integrated along the beam path. To enhance sensitivity to surface and near-surface morphology, the scattering geometry can instead be configured in grazing-incidence mode (GI-SAXS), where the incident angle approaches the total internal reflection critical angle. Under these conditions, the scattering pattern forms truncation rods along the vertical direction, which encode information about vertical topographical and surface morphology.
For HAR structures, the key metrology question is not simply whether the feature can be imaged, but whether its buried profile can be reconstructed with adequate depth sensitivity and statistical process relevance. Table 3 compares CD-SAXS with several representative alternatives from this perspective.
Compared with CD-SAXS, GI-SAXS does not require X-ray penetration through thick substrates, enabling high-precision measurements under lower-energy laboratory light sources. However, this geometry also introduces additional modeling complexity, particularly when multiple scattering and significant interface roughness are present. Despite these challenges, GI-SAXS has become an effective tool for quantitative characterization of nanoscale surface structures in advanced semiconductor processes [46,47,48]. For example, Freychet et al. employed a conventional Cu-Kα laboratory source to measure etched silicon line gratings under grazing-incidence geometry. By rotating the sample to acquire angle-resolved datasets and applying inverse reconstruction using the CMA-ES algorithm, they obtained angle-resolved datasets and successfully reconstructed the depth profile of the line structures. Results demonstrated high agreement between the GI-SAXS-extracted profile and 3D-AFM measurements. The reconstructed profiles showed strong agreement with independent measurements obtained from 3D-AFM [48]. In addition, the development of high-brightness liquid-metal jet X-ray sources has further facilitated the implementation of laboratory-scale GI-SAXS measurements, enabling broader adoption of this technique for semiconductor nanostructure characterizations [49].
Different metrology techniques address distinct aspects of HAR structures, including deterministic geometrical parameters (e.g., CD and profile) and stochastic features (e.g., LER/LWR). These measurement tasks are implicitly reflected in the strengths and limitations of each technique. Table 3 compares SAXS-based techniques with several representative alternatives from this perspective.
The unique value of SAXS, therefore, lies not only in its non-destructive character, but in its sensitivity to the full buried profile of periodic HAR structures, where both direct cross-sectional methods face important trade-offs.

2.3. X-Ray Reflectivity (XRR) for Thin-Film Thickness, Density, and Interface Characterization

Thin films form the fundamental building blocks of modern semiconductor devices, including gate stacks, dielectric layers, barrier layers, and multilayer interconnect structures. Precise characterization of thin-film thickness, density, and interface quality is therefore essential for ensuring device performance and process reliability, making X-ray reflectivity (XRR) an important metrology technique for thin-film analysis. XRR is a non-destructive characterization technique based on total internal reflection and multi-layer interference effects of X-rays at smooth interfaces, widely used for precise analysis of thin films and multilayer structures [50,51,52]. From a scattering theory perspective, XRR represents a special case where the parallel component of the scattering vector is zero. Under these conditions, scattering is determined solely by variations in electron density along the surface normal direction. Although both XRR and GI-SAXS employ similar low-incidence-angle geometries, they differ in the dimensionality of the information they capture. XRR records only specular reflection signals and exhibits high sensitivity to one-dimensional layered structures perpendicular to the surface. It is primarily used for precise measurements of average film thickness, electron density, and interfacial roughness. In contrast, GI-SAXS records two-dimensional scattering distributions that simultaneously incorporate in-plane and normal-related information. It is more suitable for analyzing lateral correlation lengths, periodic structures, and statistical roughness topography. Thus, the two techniques form a complementary relationship in thin-film structure characterization.
The physical basis of XRR can be equivalently established on the complex refractive index of materials to X-rays:
n = 1 δ i β
where δ and β are material-dependent parameters related to the electron density and absorption coefficient, respectively. The reflectivity profile—measured as a function of the normal momentum transfer q z —contains rich structural information about layered thin films. By analyzing the variation in reflection intensity with q z , several key structural parameters of multilayer thin films can be extracted by fitting the measured reflectivity curve, most notably the film density, thickness, and interface roughness. Film density derived from XRR is frequently used to evaluate film compactness, porosity, and the impact of deposition processes on material quality for both low-k dielectric and high-k gate dielectric films [50,53,54,55]. In a multilayer thin-film structure, interference between reflected waves at adjacent interfaces in multilayer structures generates Kiessig fringes on the reflectance curve. Their period Δ q z   approximates the film thickness as follows:
d 2 π Δ q z
This relationship enables XRR to be widely used in atomic layer deposition (ALD) processes to precisely determine the growth per cycle and verify process linearity and repeatability [56,57]. In addition, interface or surface roughness induces overall attenuation of reflected signals in high q z regions, an effect commonly described using Debye–Waller-like factors. Such roughness characterization is particularly important for advanced semiconductor heterostructures. For instance, in advanced logic devices, XRR provides critical insights into the interface roughness of SiGe/Si superlattices within complementary field-effect transistors (CFETs) [54].
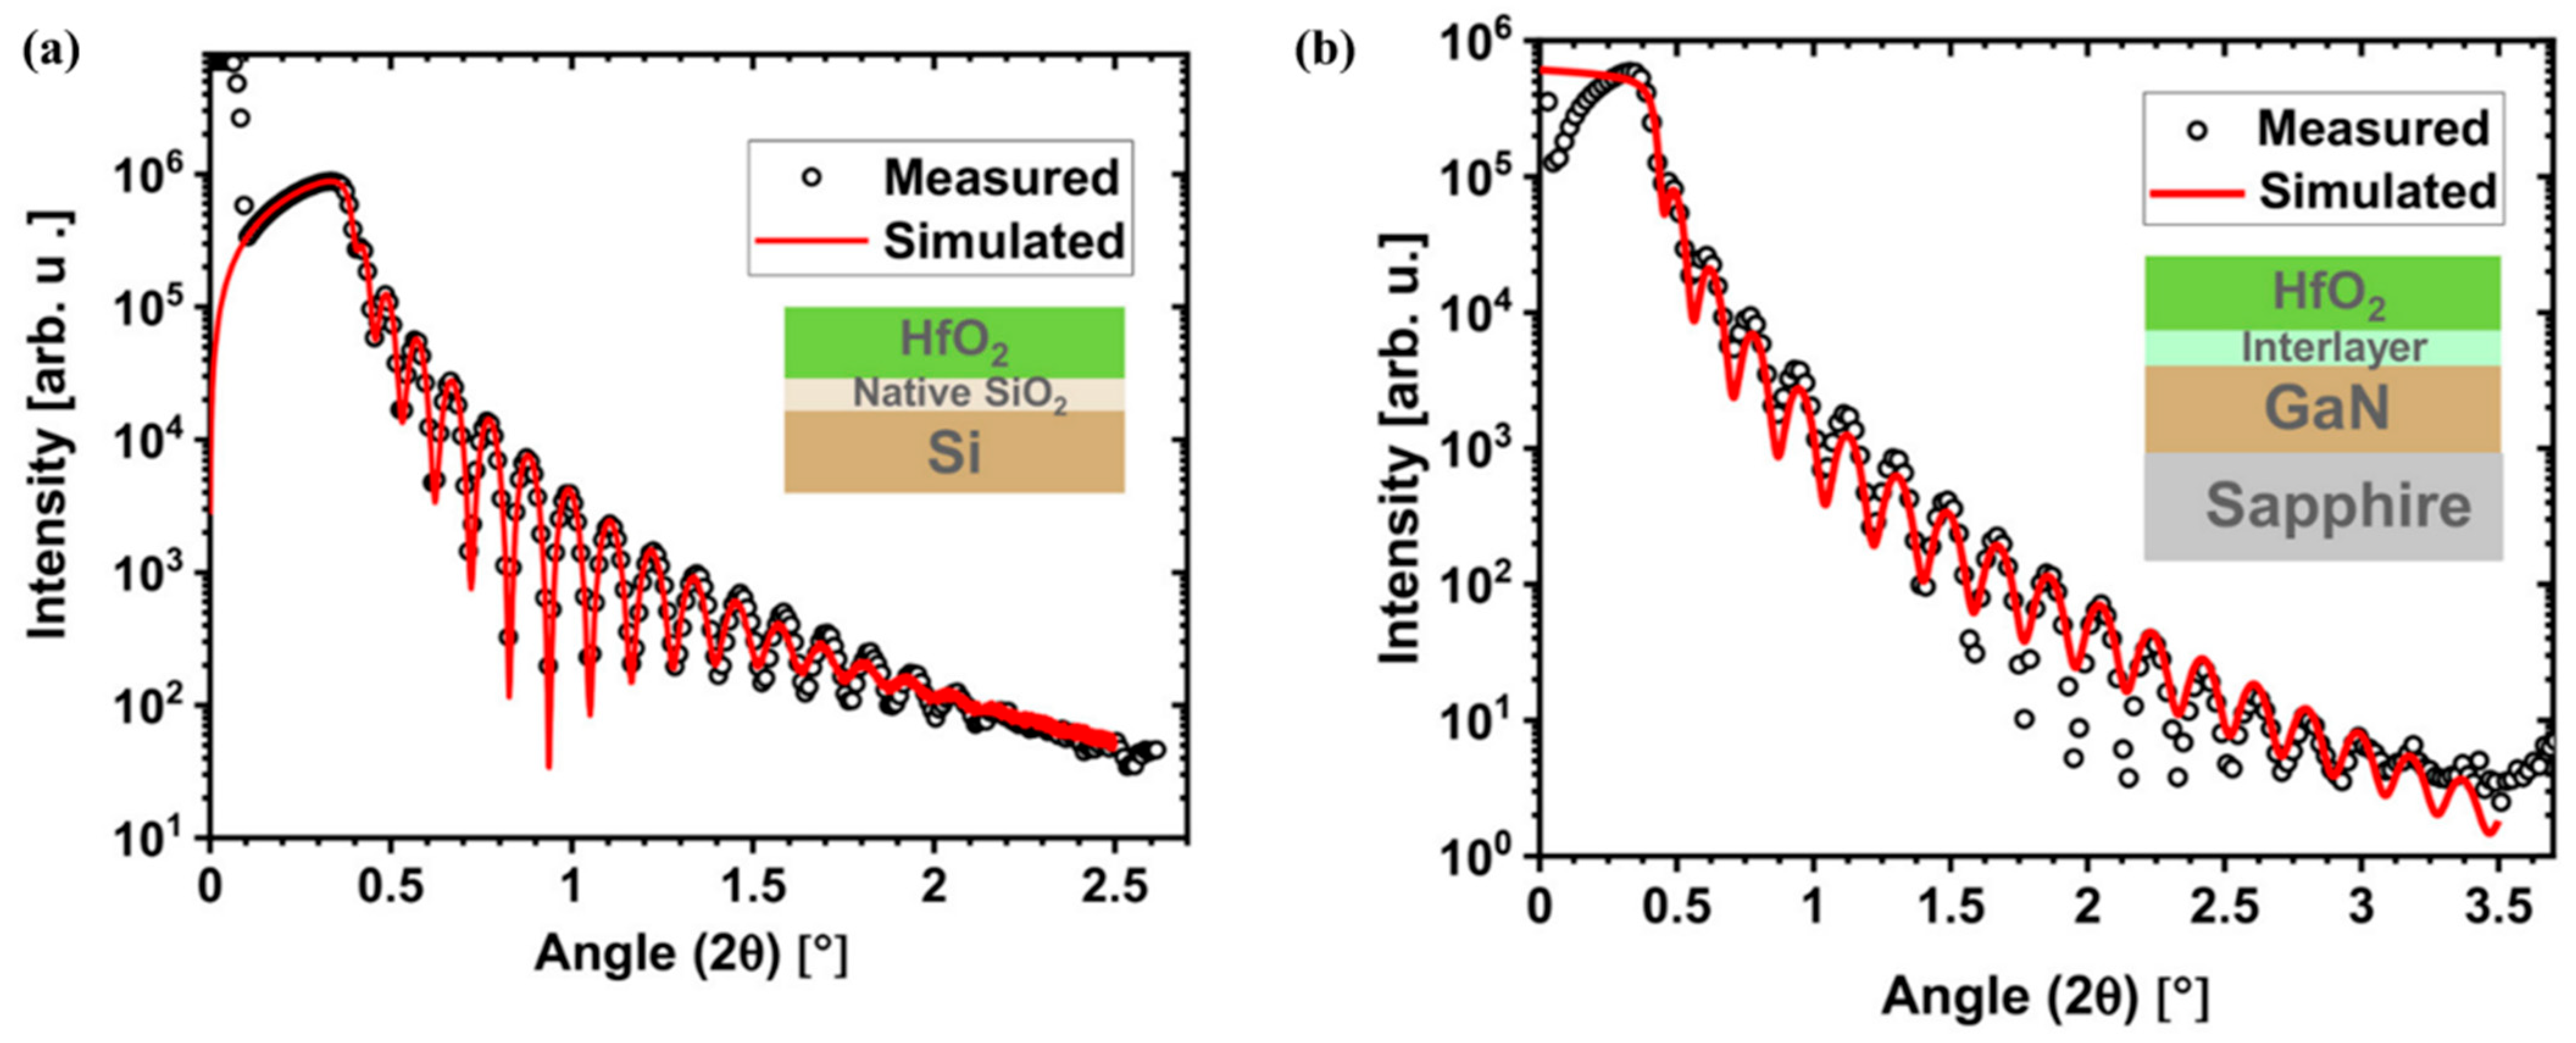
XRR plays an important role in evaluating the quality of gate dielectrics in advanced semiconductor devices. For example, in the structural characterization of PEALD HfO2 gate dielectrics for GaN-based power devices [58], fitting results (see Figure 1) revealed clear Kiessig oscillations and quantified an electron density of 9.1 g/cm3, approaching the bulk limit. At the same time, the HfO2/GaN interface roughness was determined to be approximately 0.5 nm. These structural parameters provide direct physical evidence explaining the high dielectric constant and high breakdown field strength of the device.
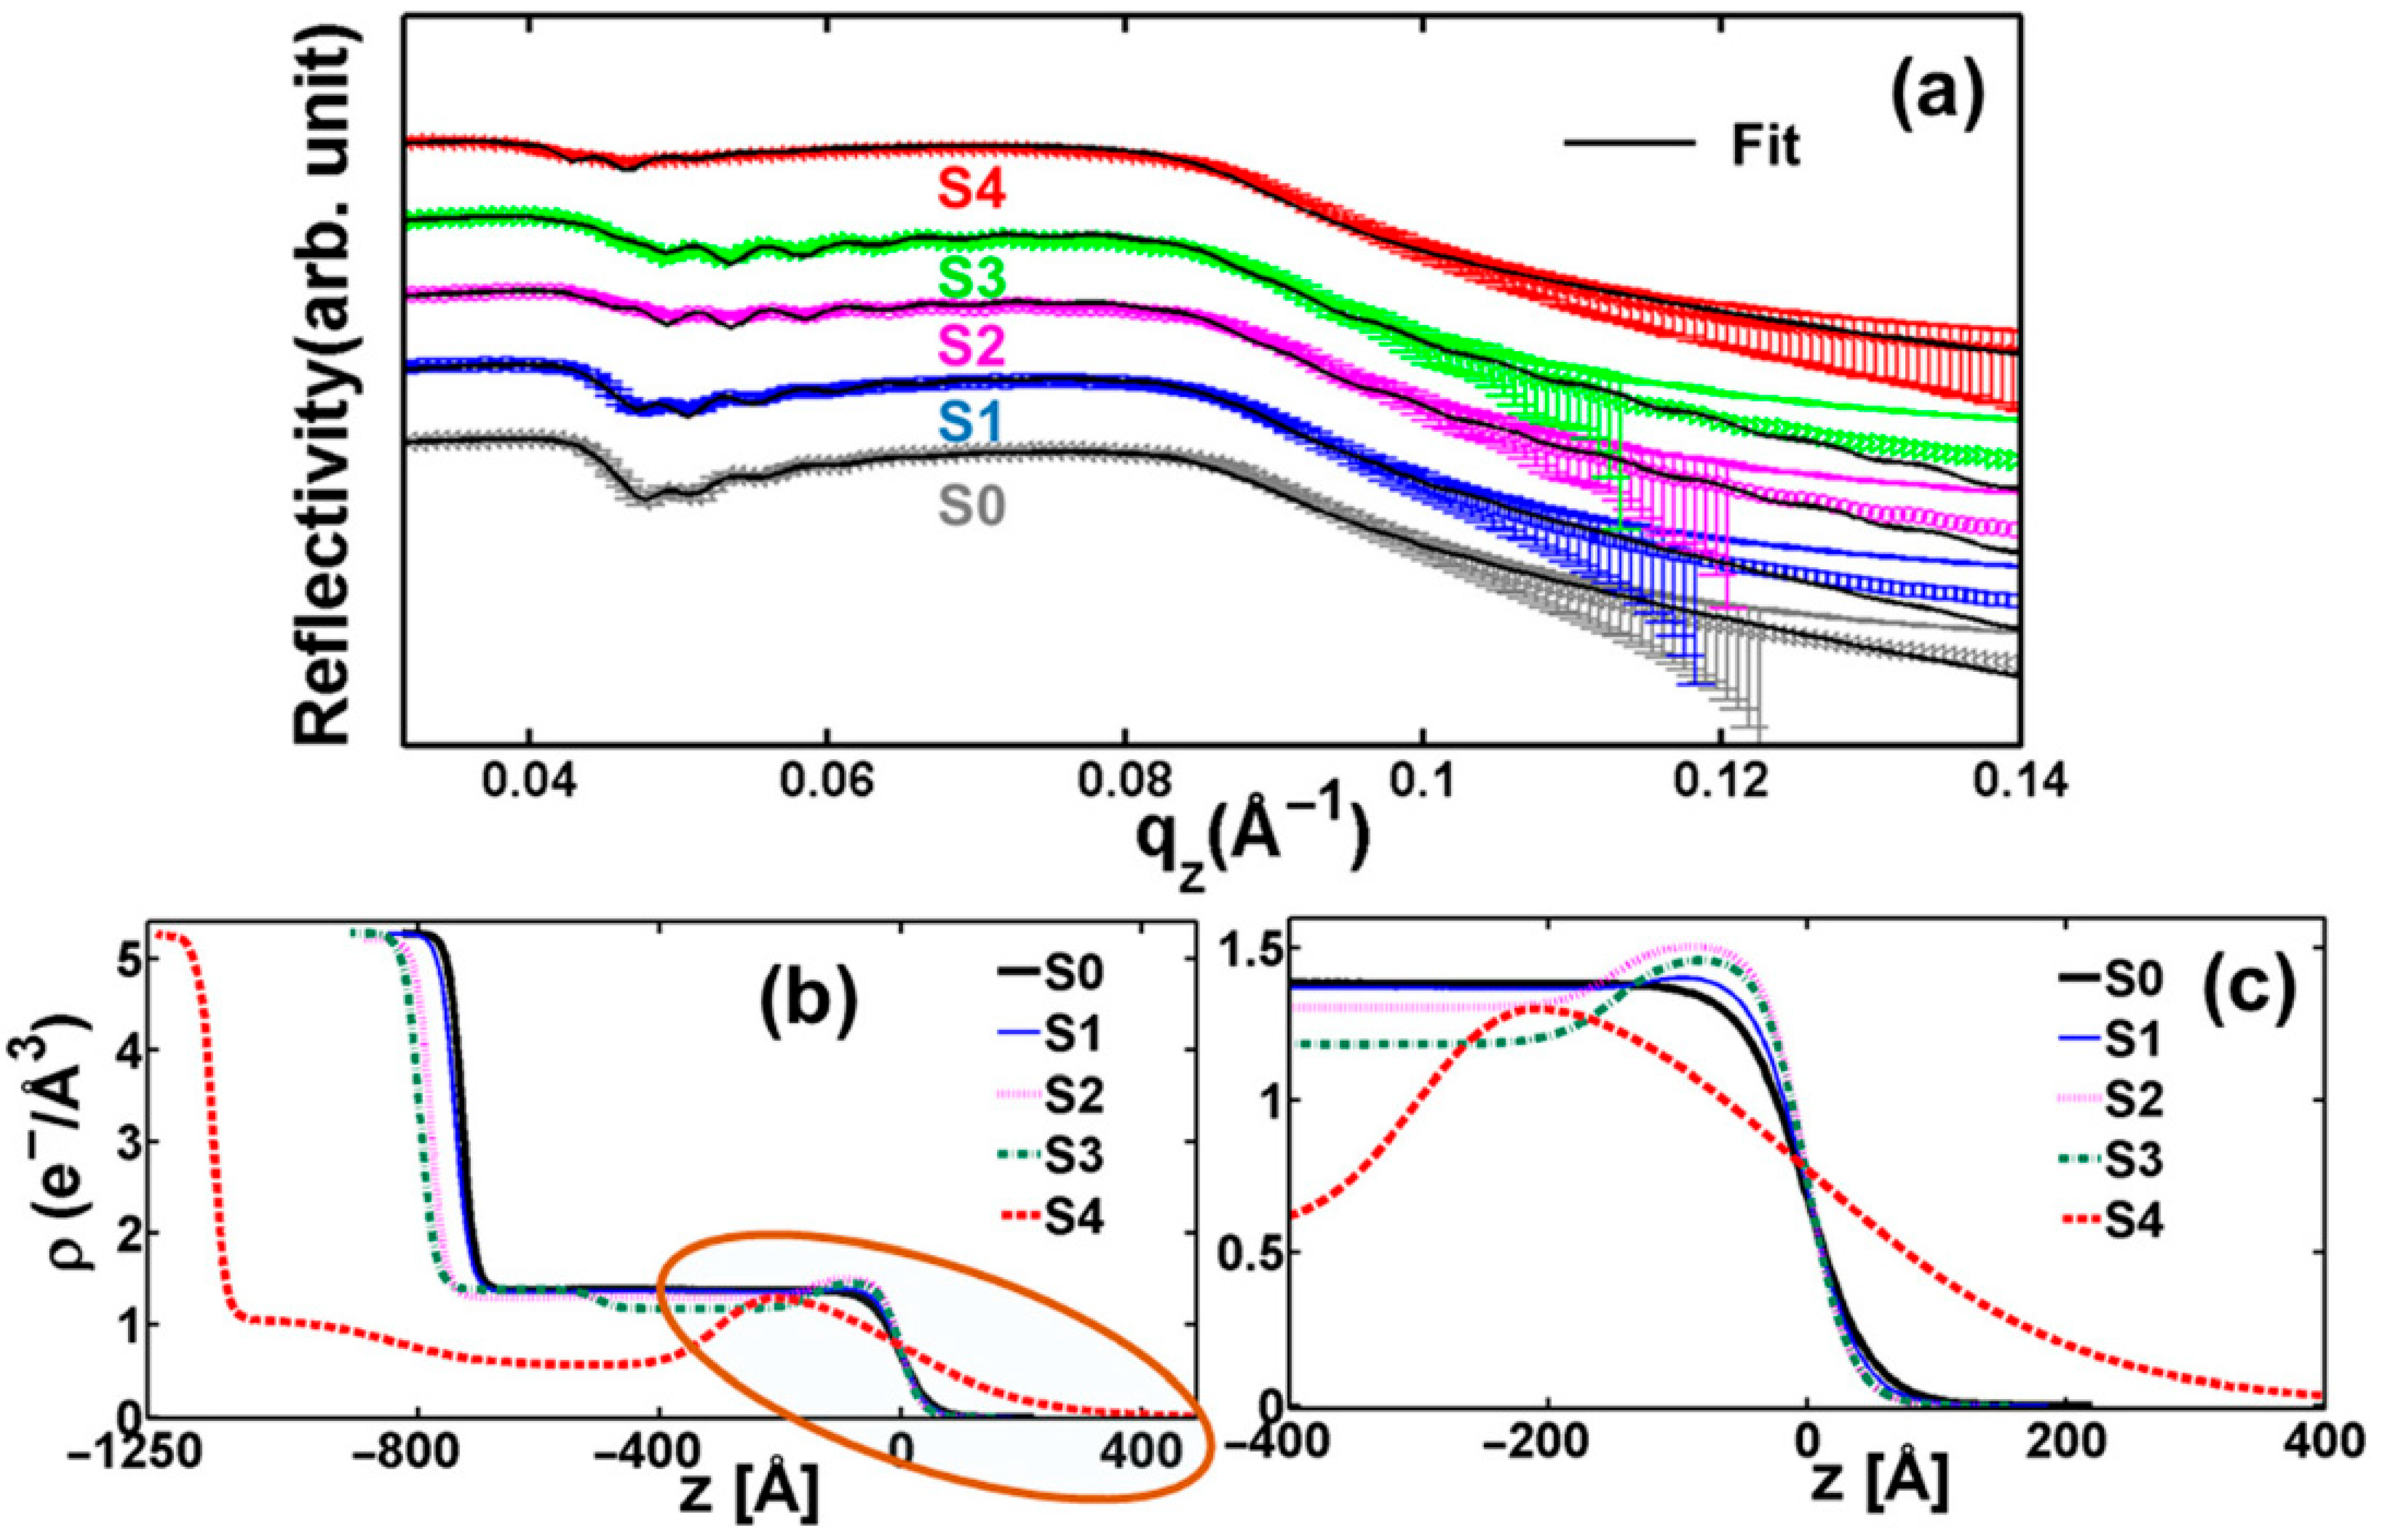
XRR has also been applied to investigate structure–property correlations in resistive random-access memory devices [59]. As shown in Figure 2, XRR curves of TiO2−X/Pt heterostructures exhibit systematic shifts in the critical angle with increasing irradiation dose, indicating variations in the average electron density of the film. By reconstructing the electron density profiles ρ(z), a surface-enriched titanium layer and a subsurface region of reduced electron density were identified. This electron density gradient directly correlates with oxygen ion migration, providing a structural basis for conductive filament formation.
As device structures become increasingly complex, traditional XRR fitting methods based on manual model adjustments have revealed issues of computational time consumption and non-unique solutions. In recent years, the integration of machine learning with physical scattering models has emerged as an effective strategy to overcome these limitations. On the one hand, such approaches can directly map XRR data to electrical parameters, enabling end-to-end device performance prediction and process defect detection [60]. On the other hand, reliable structural parameters can be consistently obtained even under conditions of significantly reduced sampling or radiation dose [61,62,63]. These developments enable XRR to evolve from an offline analysis technique into an in-line metrology tool capable of real-time process monitoring.

3. X-Ray Tomography for See-Through Structures and Defects

However, semiconductor failure and structural evolution are not determined by lattice metrics alone. In advanced packaging, three-dimensional interconnects, and heterogeneous integration, practical problems often arise from voids, cracks, delamination, sidewall deformation, or local geometric non-uniformity. These defects are fundamentally real-space objects: what matters is their position, connectivity, morphology, and three-dimensional distribution inside the device. Although reciprocal-space methods are highly sensitive to structural perturbation, they often do not uniquely specify the actual geometry of buried defects or internal architectures. This is why real-space X-ray imaging and tomography become necessary: they provide direct non-destructive reconstruction of internal morphology when the scientific question concerns where a defect is, how it propagates, and how three-dimensional device geometry evolves.

3.1. X-Ray Microscopy for 3D Packaging Defect Inspection

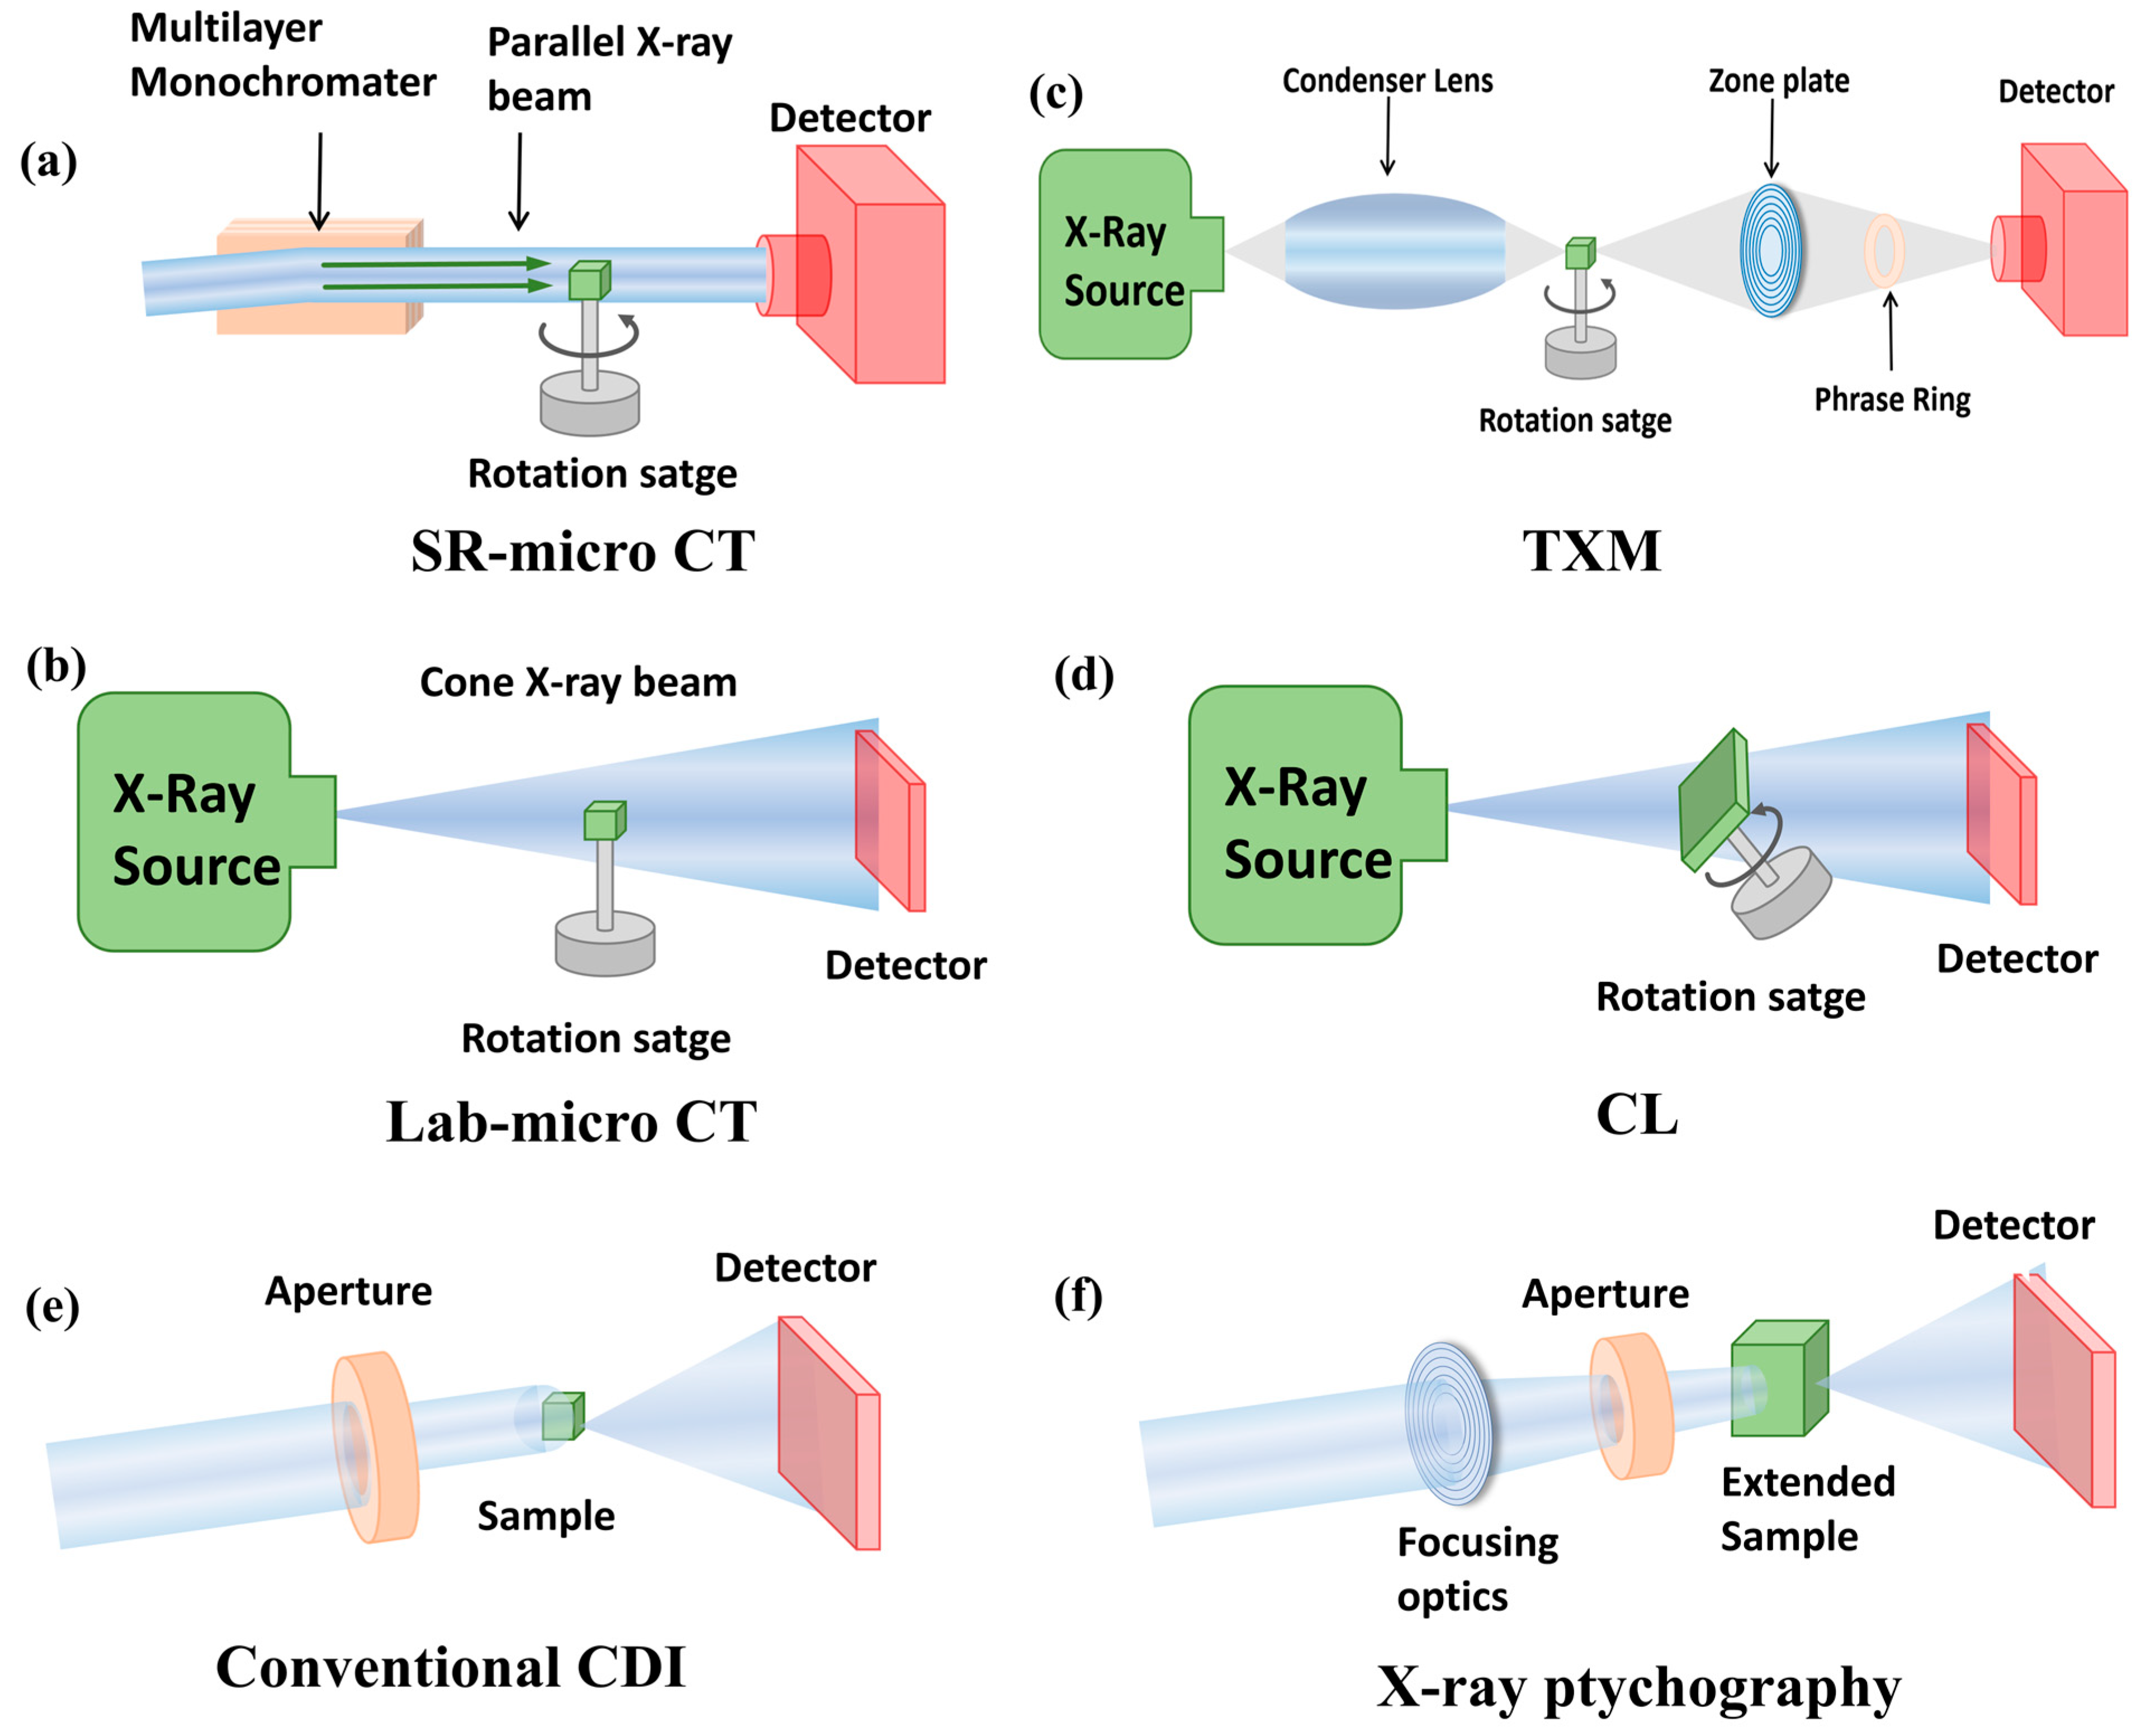
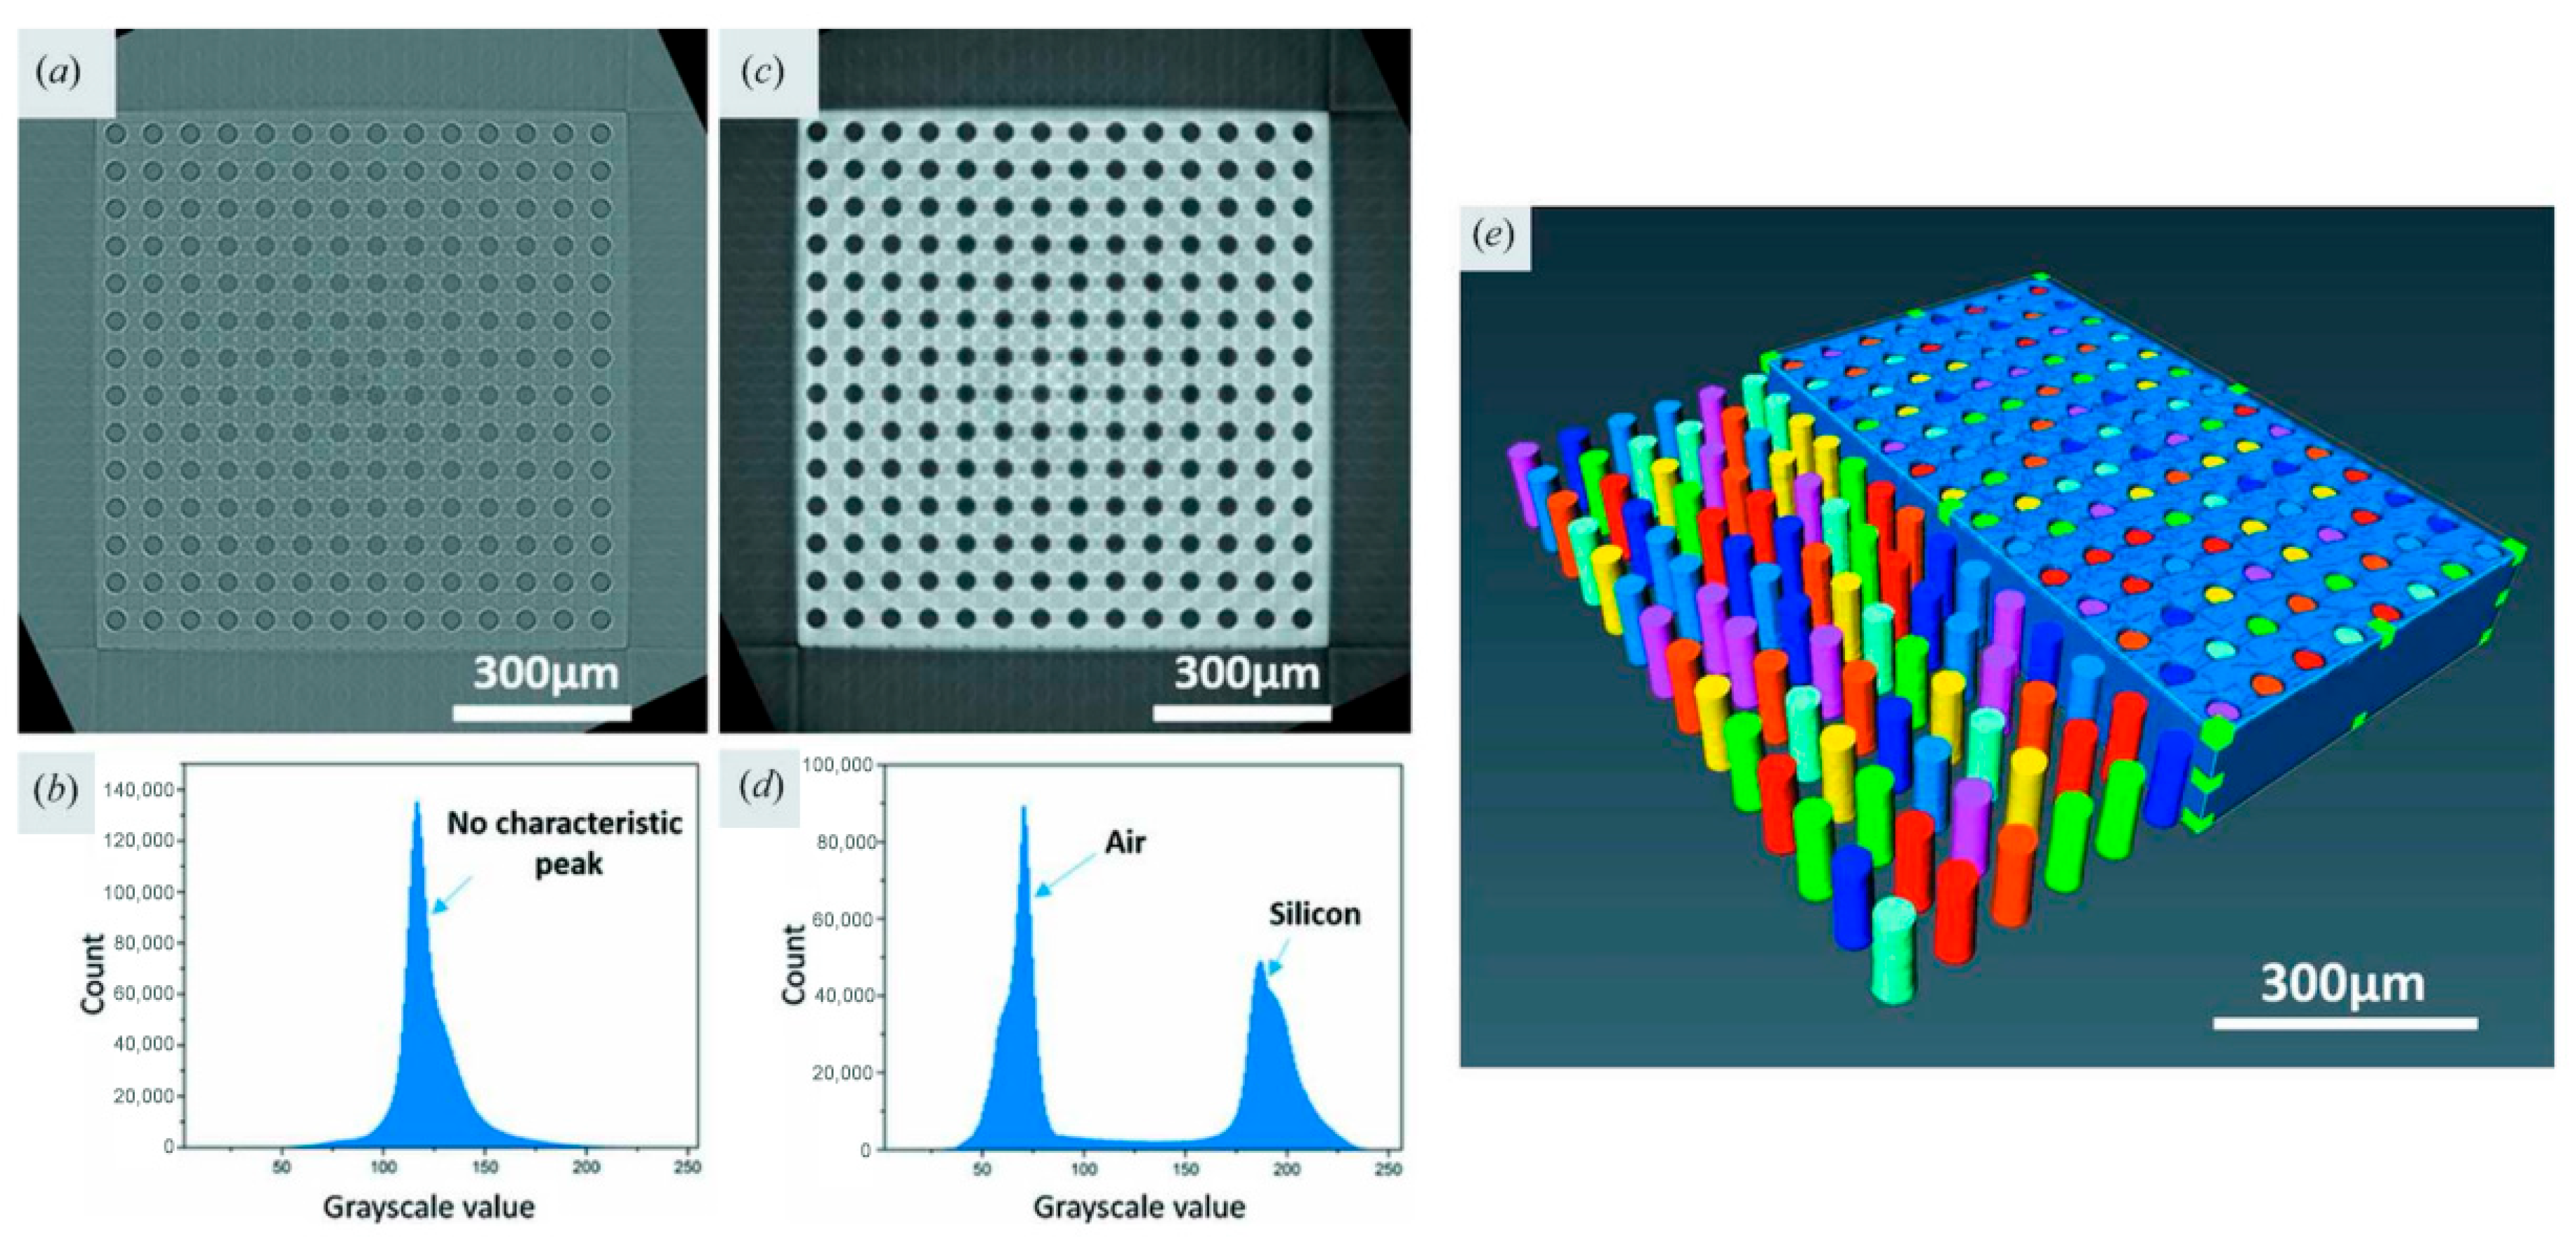
High-resolution X-ray microscopy offers unique capabilities for non-destructive characterization of semiconductor devices across a broad range of length scales from micrometers to nanometers [64,65]. Due to its robustness and compatibility with relatively large sample volumes, conventional X-ray computed tomography (XCT) and micro-XCT are widely used for defect detection and failure localization. As shown in Figure 3a,b, in XCT, a parallel or cone-shaped X-ray beam is transmitted through the sample while it is rotated over a full angular range, and a series of absorption-based projection images are collected. A three-dimensional volume is then reconstructed using back-projection algorithms from these projections. However, their spatial resolution is typically limited to ~0.5 μm when relying solely on geometric magnification.
To overcome this limitation, full-field transmission X-ray microscopy (TXM) has been developed. In TXM, a focused X-ray beam is used together with X-ray optics, such as zone plates, to achieve higher resolution projection images of the sample. In addition to absorption contrast, phase contrast can be achieved either through propagation-based methods or by introducing a phase ring, enabling enhanced visualization of weakly absorbing structures (see Figure 3c). In synchrotron-based TXM systems, the combination of high-brightness X-rays, high-resolution focusing optics, and efficient CMOS area detectors [66] enables sub-10-nanometer spatial resolution in the soft X-ray region [67,68] and tens-of-nanometer spatial resolution in the hard X-ray region [69,70]. For laboratory instruments, advanced nano-focus X-ray sources currently achieve a spatial resolution of approximately 150 nm [71]. Nevertheless, rotating anode sources remain the dominant laboratory solution because of their stability, reliability, and mature system integration, typically enabling around 50 nm resolution imaging in commercial systems.
Concurrently, liquid metal jet (LMJ) sources [72,73,74] have been introduced into commercial XRM platforms in recent years, offering significantly higher brightness and broader spectral flexibility. Although LMJ sources have also been employed to explore laboratory ptychography [75], the spatial resolution currently achieved remains below that of state-of-the-art TXM systems and far from the performance of synchrotron ptychography. Consequently, rotating-anode-based X-ray microscopes still dominate the advanced packaging inspection in laboratory environments. Focusing optics represent another core component of TXM systems. Common optical elements include Kirkpatrick–Baez (KB) mirrors, Fresnel zone plates (FZPs), composite refractive lenses (CRLs), and multilayer film lenses [73], each presenting distinct trade-offs between numerical aperture, efficiency, and robustness. Among these, Fresnel zone plates are most widely adopted in commercial laboratory TXM systems due to their relative simplicity of alignment and operational stability. With continued progress in nanofabrication, zone plates with outermost ring widths below 30 nanometers and high aspect ratios can be fabricated, pushing the spatial resolution of hard X-ray microscopy close to practical limits [76,77].
Traditional XCT primarily relies on absorption contrast. However, at higher photon energies, the attenuation contrast between materials decreases, which significantly reduces image quality. This effect is particularly pronounced in advanced semiconductor packaging, where copper interconnects are embedded within low-dielectric-constant materials, and phase effects often dominate imaging in the hard X-ray regime. Consequently, modern TXM systems predominantly employ phase-contrast imaging modes. Among various phase-contrast methods, Zernike phase-contrast microscopy has become one of the most widely adopted techniques in laboratory TXM. By introducing a phase ring at the rear focal plane of the objective waveplate, phase shifts introduced by the sample are converted into intensity changes, significantly enhancing the visibility of weakly absorbed features. In addition to Zernike imaging, laboratory X-ray microscopes are also exploring other full-field phase-contrast techniques, such as grating-based Talbot–Lau interferometric imaging, which has proven particularly effective for detecting interfaces, voids, delamination, and cracks in low-k materials [78].
Beyond phase contrast approaches, computed laminography (CL) has become an important technique for inspecting planar semiconductor samples. Unlike conventional CT, which requires a full 360° rotation, laminography tilts the rotation axis relative to the incident beam (see Figure 3d), thereby reducing the effective X-ray path length through large planar samples. CL therefore provides a practical solution for non-destructive, large-area inspection of panel-level or tape-level packaging structures [79,80]. Under synchrotron radiation, laminography can achieve spatial resolutions of tens of nanometers, approaching that of CT [81]. Comparative studies by AMD demonstrate that CL enables full-board imaging of large printed circuit boards (PCBs) and system-in-package (SiP) components [82,83] without destructive sample preparation. Although achievable spatial resolution typically falls short of that of conventional 3D X-ray microscopy (XRM), it remains sufficient to detect critical defects in advanced packaging workflows.
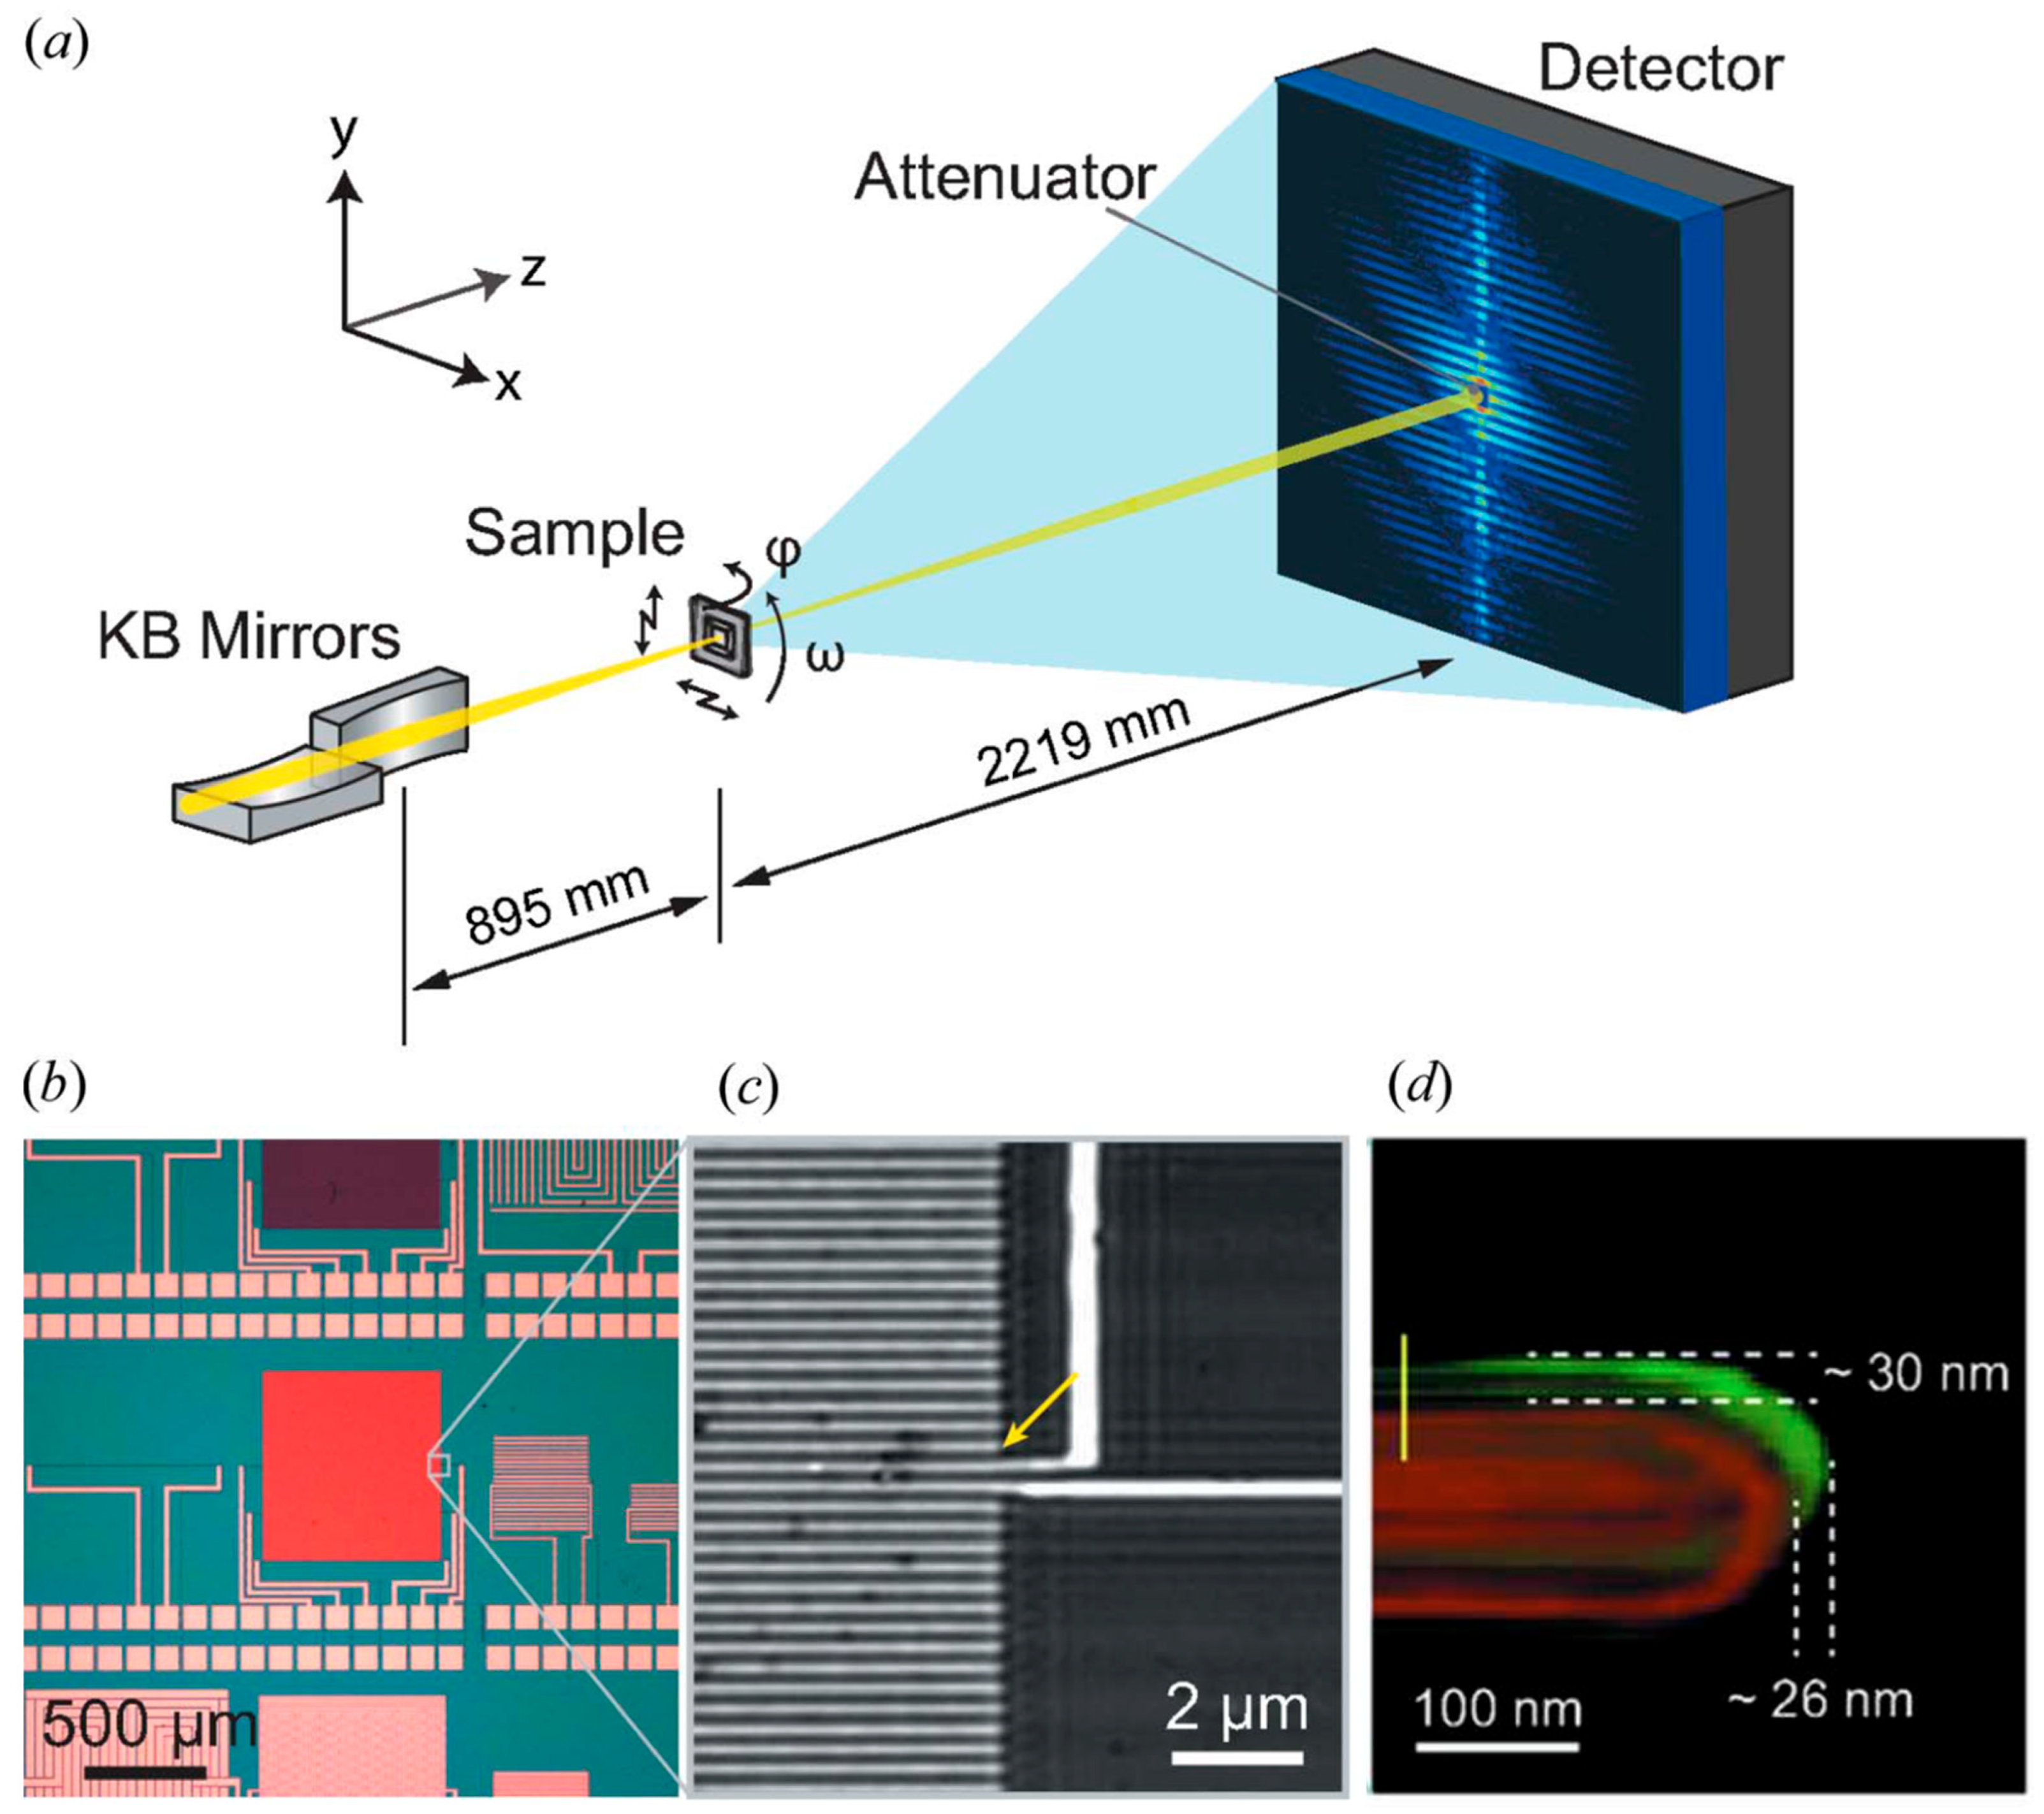
As interconnect density continues to increase, non-destructive inspection of critical structures such as redistribution layers (RDLs) [84], micro-bumps, and through-silicon vias (TSVs) now requires sub-micron to nanometer-scale resolution. 3D X-ray microscopy has successfully resolved line widths and spacings in fan-out RDL structures [85,86], with current demonstrations achieving line-width resolution down to 2 μm [87], enabling the detection of minute open-circuit defects in advanced packaging. Micro-bumps and copper pillars are key interconnect elements in 2.5D/3D integration, wafer-level fan-out packaging, and high-bandwidth memory (HBM). As interconnect pitch continues to shrink and current density increases, their structural integrity and reliability have become critical limiting factors for device performance and lifetime. Owing to their small size and buried nature, non-destructive 3D inspection of micro-bumps is essential for both process development and failure analysis. From a detection perspective, typical characterization targets include internal voids, interface delamination, cracks, and geometric non-uniformity. High-resolution X-ray CT and X-ray microscopy have been widely applied to visualize these features in three dimensions without requiring sample sectioning. Representative studies demonstrate that laboratory-scale 3D X-ray imaging can resolve voids and discontinuities within solder micro-bumps and Cu pillars at submicron spatial resolution, providing direct insights into defect morphology and spatial distribution within bump arrays [88,89,90]. Simultaneously, among the various failure mechanisms, electromigration-induced void formation is a particularly critical reliability issue for fine-pitch solder micro-bump interconnects. Three-dimensional X-ray imaging has enabled non-destructive observation of the correlation between void morphology and electromigration-driven degradation [91,92]. Meanwhile, through-silicon vias (TSVs)—another core interconnect technology for 3D integration and advanced packaging—require high-precision, non-destructive inspection to detect defects such as voids, delamination, open-via failures, and stress-induced degradation. Due to their buried nature and high aspect ratio, accurate non-destructive TSV inspection has become a critical requirement for yield control and long-term reliability [5]. High-resolution 3D X-ray microscopy and CT have been widely adopted for non-destructive observation of TSV internal structures, enabling the identification of voiding-related defects inaccessible to optical or surface-sensitive techniques. Representative studies demonstrate that X-ray microscopy reliably detects and localizes voids and through-hole-related defects within TSVs, establishing X-ray CT as a practical tool for TSV defect detection in failure analysis environments [93,94,95]. Notably, for subtle morphological features such as TSV sidewall profiles, bottom curvature, and silicon-dielectric interfaces, absorption contrast often proves insufficient. As shown in Figure 4, phase-contrast X-ray microtomography significantly enhances sensitivity to these features, enabling precise 3D reconstruction of TSV etch profiles and quantitative statistical analysis of via geometry [96]. These results highlight the advantages of phase-contrast imaging in resolving subtle interface and morphological changes that are difficult to capture with absorption contrast alone.
Despite significant advances in XCT and XRM technologies, existing commercial XRM systems still cannot simultaneously achieve sub-100-nanometer spatial resolution, high-energy-photon penetration above 15 keV, and meet high-throughput imaging requirements. Regarding resolution alone, current hard X-ray nano-CT imaging, which can approach 20 nanometers, primarily relies on third- and fourth-generation synchrotron radiation sources and has yet to become widespread on laboratory platforms. As packaging technology continues to evolve toward smaller dimensions and higher material homogeneity, the industry increasingly demands imaging methods with enhanced phase sensitivity or novel imaging mechanisms. Against this backdrop, coherent diffraction imaging using synchrotron radiation has emerged as a critical frontier in research. This approach theoretically enables quantitative phase reconstruction at the nanoscale and even the atomic scale, addressing the aforementioned challenges in extreme detection.

3.2. Ptychographic X-Ray Computed Tomography (PXCT) for High-Resolution Three-Dimensional Morphological Reconstruction

In coherent diffraction imaging (CDI), the sample is illuminated by a coherent X-ray beam, and mainly far-field diffraction patterns are recorded without using an imaging lens. These patterns correlate to the sample’s Fourier transform but lack phase information. Theoretically, the missing phase can be reconstructed using phase retrieval algorithms, but this typically requires prior knowledge of the sample. For complex, realistic samples, such prior information is often difficult to obtain or insufficient. Ptychography effectively overcomes this limitation by scanning the sample and collecting a series of diffraction patterns from overlapping regions. Figure 3e,f illustrates the differences in the setup between the two methods. This data acquisition method significantly constrains the inverse problem required for reconstruction, thereby substantially reducing dependence on prior information. It only necessitates known scan positions and assumes beam stability during scanning. Simultaneously, the ample overlap of the data enables decoupling the illumination-probe function from the sample’s complex amplitude distribution, achieving ultra-high-resolution quantitative phase imaging without requiring high-precision optical components.
Ptychographic X-ray computed tomography (PXCT) represents the first major breakthrough enabling true nanoscale 3D imaging of semiconductor devices. By combining coherent diffraction imaging with tomographic reconstruction, PXCT circumvents the resolution limitations of X-ray optics, achieving resolution primarily determined by the maximum recorded scattering angle. In 2017, Holler et al. reported a landmark demonstration achieving 14.6 nm isotropic 3D resolution in an Intel processor using PXCT [97]. This work employed a focused ion beam (FIB) to prepare cylindrical samples approximately 10 μm in diameter, enabling full-angle rotation during data acquisition. The reconstructed structures clearly resolved copper interconnects, transistor gate structures, and dielectric layers, establishing PXCT as a viable tool for nanoscale semiconductor imaging. Despite its unprecedented resolution, PXCT inherently requires cylindrical specimens to achieve full tomographic rotation. This sample preparation step introduces a degree of destructiveness, limiting PXCT’s applicability for routine failure analysis or pinpointing specific defects within large intact chips. These constraints spurred the development of alternative geometries compatible with planar semiconductor samples. To address challenges posed by flat sample geometries and limited angular acquisition, Ptychographic X-ray Laminography Imaging (PyXL) was introduced as a non-destructive alternative to PXCT. In PyXL, the rotation axis is tilted relative to the incident beam, reducing the wedge artifacts that occur when imaging extended planar samples. Holler et al. demonstrated PyXL’s feasibility in semiconductor inspection in 2019 by imaging a 16 nm FinFET chip with a spatial resolution of 18.9 nm. Crucially, this approach enables direct imaging of entire chips without columnar sample preparation. Beyond geometric innovation, this work introduces the concept of macro-to-nano zoom—first utilizing millimeter-scale wide-field-of-view positioning to locate regions of interest, followed by high-resolution in situ scanning of selected areas. This layered workflow significantly enhances the practicality of in situ imaging for failure analysis and reverse engineering tasks [98,99]. Thus, PyXL represents a critical step toward true non-destructive chip inspection, bridging the gap between laboratory demonstrations and application-driven semiconductor analysis.
Although PXCT and PyXL have demonstrated the feasibility of nanoscale 3D imaging, experimental stability remains a major bottleneck, particularly during extended acquisition times required for advanced nodes. Mechanical vibrations, thermal drift, and beam instability severely limit the resolution of conventional tomographic scanning. To overcome these challenges, Aidukas et al. introduced burst ptychography in 2024 [68]. This technique employs rapid sequences of short-exposure diffraction measurements to effectively “freeze” sample motion, followed by computational correction of residual drift. Combined with tomographic backpropagation reconstruction, burst ptychography achieved 4 nm half-width resolution on a commercial 7 nm node logic chip. Individual silicon wafers and metal gate structures are clearly resolved in three dimensions, marking the first demonstration of X-ray imaging technology capable of addressing cutting-edge semiconductor process nodes. Furthermore, this technique enables a 170-fold increase in acquisition rate, from several thousand to 14,000 voxels per second. This achievement represents a qualitative leap in X-ray semiconductor metrology, positioning ptychography as a competitive non-destructive alternative for high-resolution and full-field reconstruction tasks—particularly where 3D information and maximum sample preservation are required.
Beyond the aforementioned technology, to overcome thin-sample limitations, enhance 3D resolution and quantitative imaging capabilities, and maintain manageable computational demands, Shimomura et al. introduced precession X-ray ptychography—a method inspired by precession diffraction. By systematically tilting the incident beam and acquiring multi-angle ptychographic diffraction data, this approach significantly increases angular diversity within datasets. Combined with multilayer reconstruction algorithms, it enables numerical separation of signals from different depth layers. As shown in Figure 5, researchers successfully resolved two circuit layers with a vertical spacing of only 1.4 μm, achieving a spatial resolution of approximately 10 nanometers [100].
Despite its exceptionally high spatial resolution, ptychographic imaging remains limited in widespread commercial chip inspection applications due to its lengthy data acquisition times, high radiation exposure, and substantial computational resource demands. In recent years, rapid advances in algorithms and deep learning methods have enabled significant improvements in the efficiency and robustness of ptychographic imaging. These approaches aim to accelerate data acquisition, reduce radiation exposure, and minimize radiation damage to samples. Current research primarily focuses on reducing the number of projection angles required for reconstruction. Kang et al. proposed the Attentional Ptychographic Task (APT), a physics-based machine learning framework incorporating axial self-attention mechanisms [101]. By leveraging correlations along the rotation axis, APT achieves high-quality 3D reconstructions using only about one-twelfth of the projection angles required by conventional methods, significantly shortening data acquisition time. Beyond angle sparsification, learning-based approaches have also been applied to reconstructions with extremely limited angles. In the same group’s work, Kang et al. demonstrated that transformer-based networks can reconstruct 3D IC structures from single-angle or sparse-angle predictions by leveraging inherent strong structural priors in integrated circuits, such as hierarchical Manhattan geometry [102]. Furthermore, the application of self-supervised learning and pre-training strategies enables networks to optimize ptychographic reconstruction without extensive labeled data, further enhancing algorithmic robustness [103,104,105,106]. These significant algorithmic advancements are propelling ptychographic imaging toward becoming a practical tool for reconstructing high-resolution structures in advanced packaging. While maintaining ultra-high spatial resolution, the technique has achieved notable improvements in imaging speed, dose efficiency, and system robustness.
When the primary objective is three-dimensional reconstruction of buried structures, the most useful comparison is by imaging capability rather than by device application. Table 4, therefore, sorts X-ray imaging approaches discussed in this review.
This comparison shows that no single 3D X-ray imaging mode simultaneously maximizes resolution, penetration, robustness, and throughput, which explains why different scenarios call for different mainstream technologies.

4. X-Ray Spectroscopy for Compositional and Chemical Analysis

Even direct structural reconstruction is often insufficient to explain why a semiconductor interface degrades, why a defect forms, or why device performance shifts during processing and operation. In many cases, the decisive factors are chemical rather than purely geometric: trace metal contamination, dopant redistribution, interdiffusion, oxidation, bonding-state evolution, and interface dipoles can all alter stress, defect formation, carrier transport, and interfacial stability. These are not fully determined by lattice distortion or morphology alone. What is physically required is access to elemental distribution and chemical-state information, especially at buried or ultrathin interfaces. X-ray fluorescence and photoelectron spectroscopy, therefore, become essential when the scientific question is not only what structure is present, but what chemical origin produced that structure, and how composition and bonding constrain its behavior.

4.1. X-Ray Fluorescence (XRF) for Elemental Composition and Contamination Control

XRF analysis is based on the photoelectric effect and the subsequent relaxation process of inner-shell electrons in atoms. When the photon energy exceeds the binding energy of an inner-shell electron, the electron is ejected, leaving a core-level vacancy. This vacancy is subsequently filled by an outer-shell electron, accompanied by the emission of a characteristic X-ray photon with an energy determined by the difference between the two electronic levels. By measuring the energy and intensity of these characteristic photons with detectors such as proportional counters or silicon drift detectors (SDD), both qualitative and quantitative elemental analysis can be achieved. More importantly for semiconductor characterization, XRF can be configured so that the measured fluorescence signal encodes not only elemental presence, but also lateral distribution, surface concentration, or even depth-dependent composition. Hence, XRF is not merely an elemental assay tool, but a route to reconstructing elemental distributions in semiconductor structures.
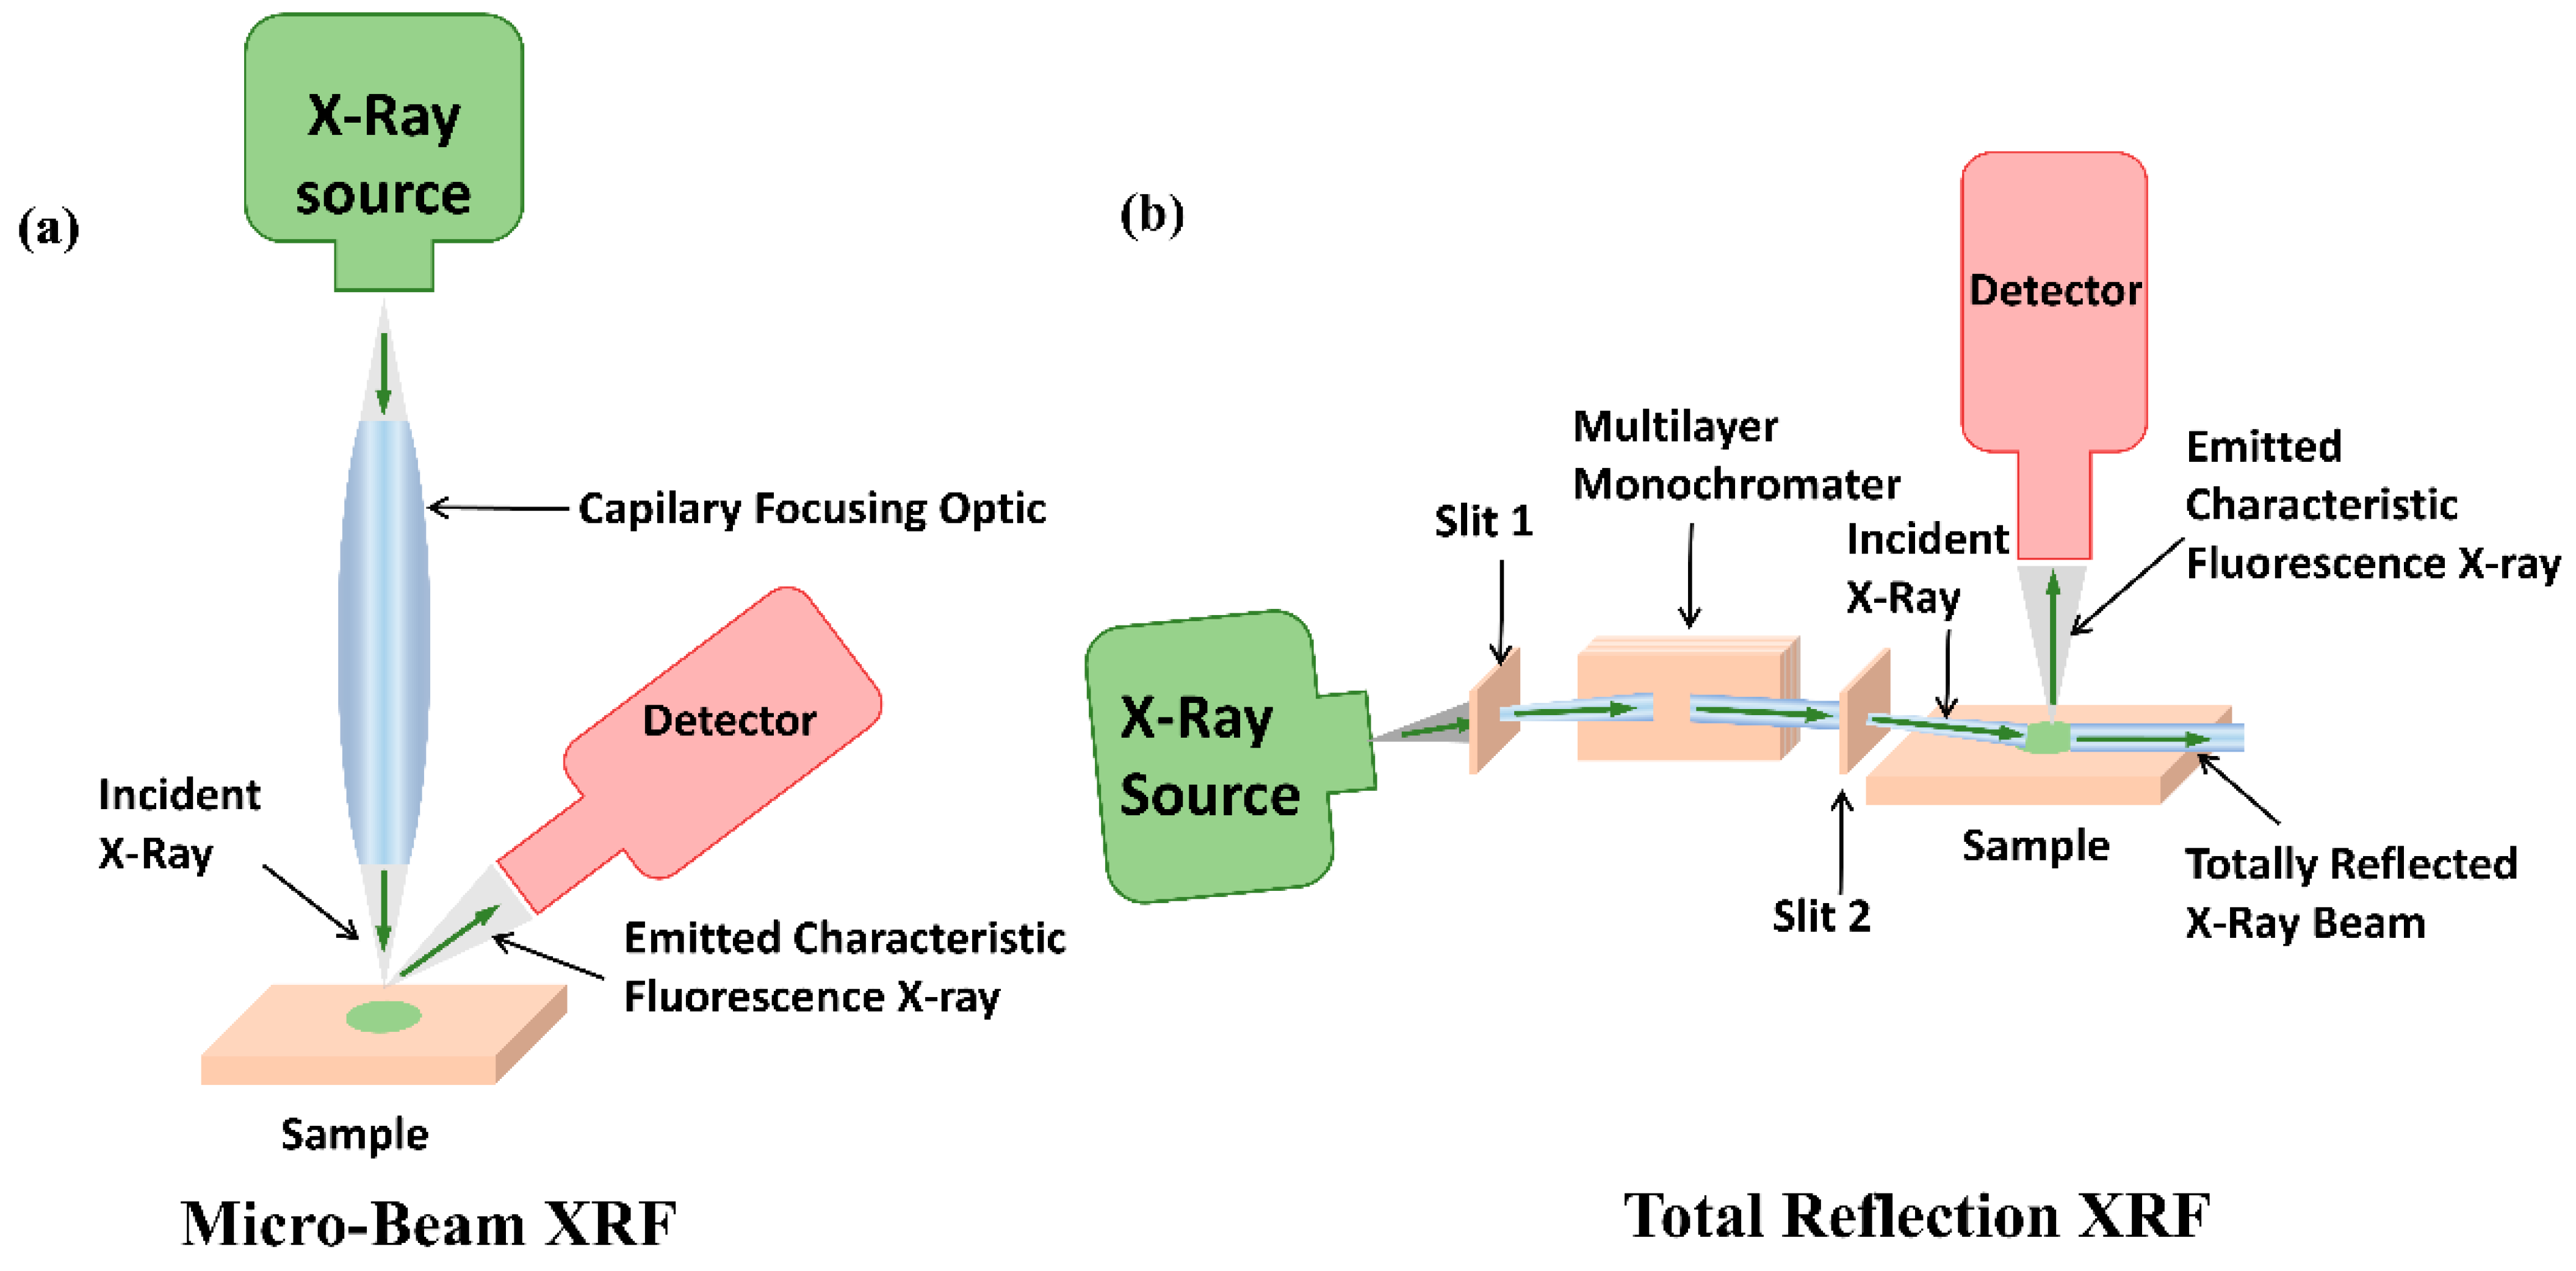
Current advances in XRF technology primarily focus on improving detection sensitivity and expanding spatial analysis capability. Regarding sensitivity, synchrotron-based microbeam XRF (μ-XRF) has pushed detection limits to the level of hundreds of atoms (see Figure 6a). For instance, a benchmark study by Masteghin et al. demonstrated that XRF microscopy using high-brightness synchrotron nano-beams can detect a few thousand Ga atoms within a one-second acquisition time, with the detection limit further reduced to several hundred atoms through longer integration [107]. These developments highlight XRF’s capability for nanoscale elemental analysis. In parallel with improvements in sensitivity, advances in imaging modes have expanded the accessible field of view. Full-field XRF imaging technology has emerged as a powerful approach for rapid mapping of elemental distribution across centimeter-scale regions while maintaining micrometer-level spatial resolution [108,109,110]. Together, these developments significantly broaden the applicability of XRF, from a point-analysis method into a multiscale imaging approach for chemical heterogeneity.
For semiconductor surface and thin-film analysis, grazing-incidence geometries such as TXRF and GIXRF provide additional advantages by enhancing surface sensitivity and suppressing substrate background. In industrial applications, these techniques have become the primary methods for balancing high spatial resolution, field-of-view coverage, and measurement repeatability. Both approaches employ grazing-incidence optical paths that not only reduce substrate scattering but also generate a controllable X-ray standing-wave field (XSW) in thin films or multilayer systems, thereby further improving depth sensitivity.
Total reflection X-ray fluorescence (TXRF) operates under the condition of total external reflection when the incident angle is below the critical angle of the substrate (see Figure 6b). Under this geometry, penetration of the excitation beam into the substrate is significantly suppressed, markedly reducing background noise and enhancing sensitivity to surface and near-surface elements. Consequently, TXRF has become the standard technique for monitoring metal surface contamination on silicon wafers. To meet the requirements of industrial in-line monitoring, compact and low-power TXRF spectrometers have been developed, facilitating integration into manufacturing environments and enabling rapid and cost-effective contamination monitoring [111,112]. At the same time, TXRF also illustrates a key principle of chemically sensitive reconstruction: the measurement geometry defines the information depth. Because TXRF is highly surface-selective, it is highly effective for reconstructing near-surface contamination profiles, but its applicability becomes limited when surface roughness increases. Yim et al. systematically investigated the influence of surface roughness on TXRF signals and found that when the surface root-mean-square roughness exceeds approximately 3 nm, the scattering background increases markedly, fluorescence peaks broaden, and detection limits deteriorate, thereby constraining the reliability of TXRF in realistic advanced-manufacturing conditions [113]. Thus, TXRF is best understood as a highly sensitive but geometrically constrained route for reconstructing elemental distributions at or very near the surface.
A more structurally informative XRF mode is grazing-incidence X-ray fluorescence (GIXRF), especially when combined with X-ray reflectivity (XRR). By precisely controlling the incident angle near the critical angle, GIXRF enables X-rays to generate a standing-wave field within the sample. Because elemental fluorescence is modulated by this field, the angular dependence of the fluorescence signal encodes the vertical distribution of elements. In other words, GIXRF transforms fluorescence intensity into a depth-sensitive signal and thereby enables reconstruction of elemental concentration profiles in thin films and multilayers. Rotella et al. demonstrated this principle through combined GIXRF–XRR analysis, showing that elemental depth profiles can be reconstructed with nanometer-scale resolution when XRR provides constraints on thickness, density, and interfacial roughness [114]. This coupling is important because GIXRF alone is not simply a direct measurement of depth, but an inversion problem whose stability depends on an accurate structural model. Subsequently, the reference-free analysis method [115] further reinforces the point that chemically sensitive X-ray characterization becomes substantially more powerful when tied to accurate structural constraints.
Taken together, XRF-based methods contribute to semiconductor characterization through three complementary reconstruction routes: μ-XRF and full-field XRF reconstruct lateral elemental heterogeneity across different spatial scales; TXRF reconstructs surface and near-surface contamination states with exceptional sensitivity; and GIXRF, especially when combined with XRR, reconstructs depth-dependent composition in thin films and buried interfaces. Therefore, it can be seen that, in modern semiconductor characterization systems, XRF should not be regarded as merely a chemical assay technique, but as an elemental-distribution reconstruction tool that provides the compositional dimension needed to interpret structural evolution, interface quality, and process-induced heterogeneity in complex semiconductor systems. At the same time, the capabilities of XRF are defined by its underlying physical mechanism. XRF provides robust and quantitative information on total elemental composition over relatively large information depths, typically ranging from micrometers to millimeters, which makes it particularly suitable for bulk-sensitive analysis and process monitoring. Its experimental implementation is comparatively straightforward, enabling high-throughput and in-line applications. However, because XRF detects characteristic fluorescence energies that are only weakly affected by chemical environment, it cannot resolve different oxidation states or bonding configurations of the same element. In addition, the relatively large penetration depth makes XRF less suitable for ultrathin surface-specific analysis.

4.2. X-Ray Photoelectron Spectroscopy (XPS) for Chemical Bonding and Surface Analysis

X-ray Photoelectron Spectroscopy (XPS) is based on the photoelectric effect. By measuring the kinetic energy of photoelectrons emitted when materials are excited by X-rays of known energies, XPS enables qualitative and quantitative analysis of the elemental composition, chemical states, and electronic structures at material surfaces. Its typical penetration depth ranges from 1 to 10 nanometers, making it highly sensitive to surface and interfacial phenomena. As semiconductor technology advances toward nanoscale dimensions, heterogeneous integration, and complex three-dimensional structures, XPS has evolved from a traditional surface chemical analysis tool into a versatile characterization platform capable of resolving band alignment, buried interface chemistry, and depth-dependent elemental distributions. In addition, because core-level shifts and valence-band features respond sensitively to local potential, band bending, and interfacial dipoles, XPS can also reconstruct aspects of buried electronic structure that are inaccessible to purely structural or morphological measurements.
Synchrotron radiation has played a pivotal role in expanding XPS capabilities through its tunable photon energy, high brightness, and polarization control. Particularly crucial for semiconductor applications are beamlines integrated into in situ sample environments, enabling immediate measurement of chemical states and band alignment following thin-film growth or process steps [116,117,118]. Such in situ measurements effectively eliminate artifacts caused by surface contamination and are essential for reliable interface analysis in oxide, nitride, and wide-bandgap semiconductor systems. For example, the Micro-SX-ARPES beamline at SPring-8 employs a Kirkpatrick–Baez (KB) lens to focus soft X-rays into micrometer-sized spots. This approach overcomes sample size limitations and enables the investigation of the three-dimensional band structure of minute single crystals, particularly dispersion along the vertical direction [118,119]. In parallel with synchrotron developments, laboratory XPS instruments have achieved notable progress, particularly in excitation energy capabilities. The adoption of monochromatized Cr Kα sources and liquid-metal-jet Ga Kα sources has enabled hard X-ray photoelectron spectroscopy (HAXPES) measurements under laboratory conditions [120,121]. Compared to traditional Al Kα excitation, HAXPES achieves an information depth of 20–30 nm, enabling non-destructive chemical state analysis of buried interfaces. The integration of soft and hard X-ray excitation sources in a dual-source configuration further facilitates complementary characterization across different information depths.
One important reconstruction task enabled by XPS is interface electronic-structure analysis. In heterojunctions and metal–semiconductor contacts, device behavior is strongly governed by valence-band offsets, conduction-band offsets, and interfacial charge redistribution. XPS provides a direct and quantitative route for determining such parameters through core-level-to-valence-band analysis, typically using the Kraut method. Band bending induced by interfacial charge transfer causes systematic shifts and broadening of core levels, transforming the spectral lines themselves into probes of localized potential distributions. In situ XPS is particularly crucial as it avoids interference from surface contamination on energy level positions, thereby revealing the true interfacial charge rearrangement and dipole formation [122]. This method has been widely applied to two-dimensional material heterostructures and mixed-dimensional semiconductor systems, distinguishing between Type I and Type II band alignments [123]. It can even resolve approximately 0.2 eV energy level shifts induced by interfacial dipoles, directly reflecting charge transfer across interfaces and the resulting band bending [124].
While band alignment analysis focuses on electronic structure at interfaces, characterizing buried interfaces and the vertical chemical distribution in multilayer films, three-dimensional structures require greater depth-resolved techniques. The detection depth of conventional XPS is typically limited to a few nanometers near the surface. To overcome this limitation, several depth-resolved techniques have been developed. First, Hard X-ray Photoelectron Spectroscopy (HAXPES) employs X-rays with higher photon energies, extending the detection depth to tens of nanometers. This enables HAXPES to non-destructively probe deeply buried interfaces covered by top layers, such as high-k dielectric layers beneath metal gates or device structures beneath encapsulation layers. Budri et al. demonstrate the powerful utility of laboratory-scale HAXPES technology. In analyzing a contact-resistance failure, researchers used high-energy X-rays to penetrate thick metal electrode layers and directly perform chemical-state analysis of the deeply buried Ti/Al contact interface. The HAXPES spectrum clearly revealed an anomalous fluorine residue at the interface. This residue, originating from a prior process step, formed a high-resistance layer at the interface, ultimately causing device failure. This case highlights HAXPES’s irreplaceable value in precisely locating chemical-composition defects within complex integrated-circuit stacks and in resolving practical manufacturing challenges [125].
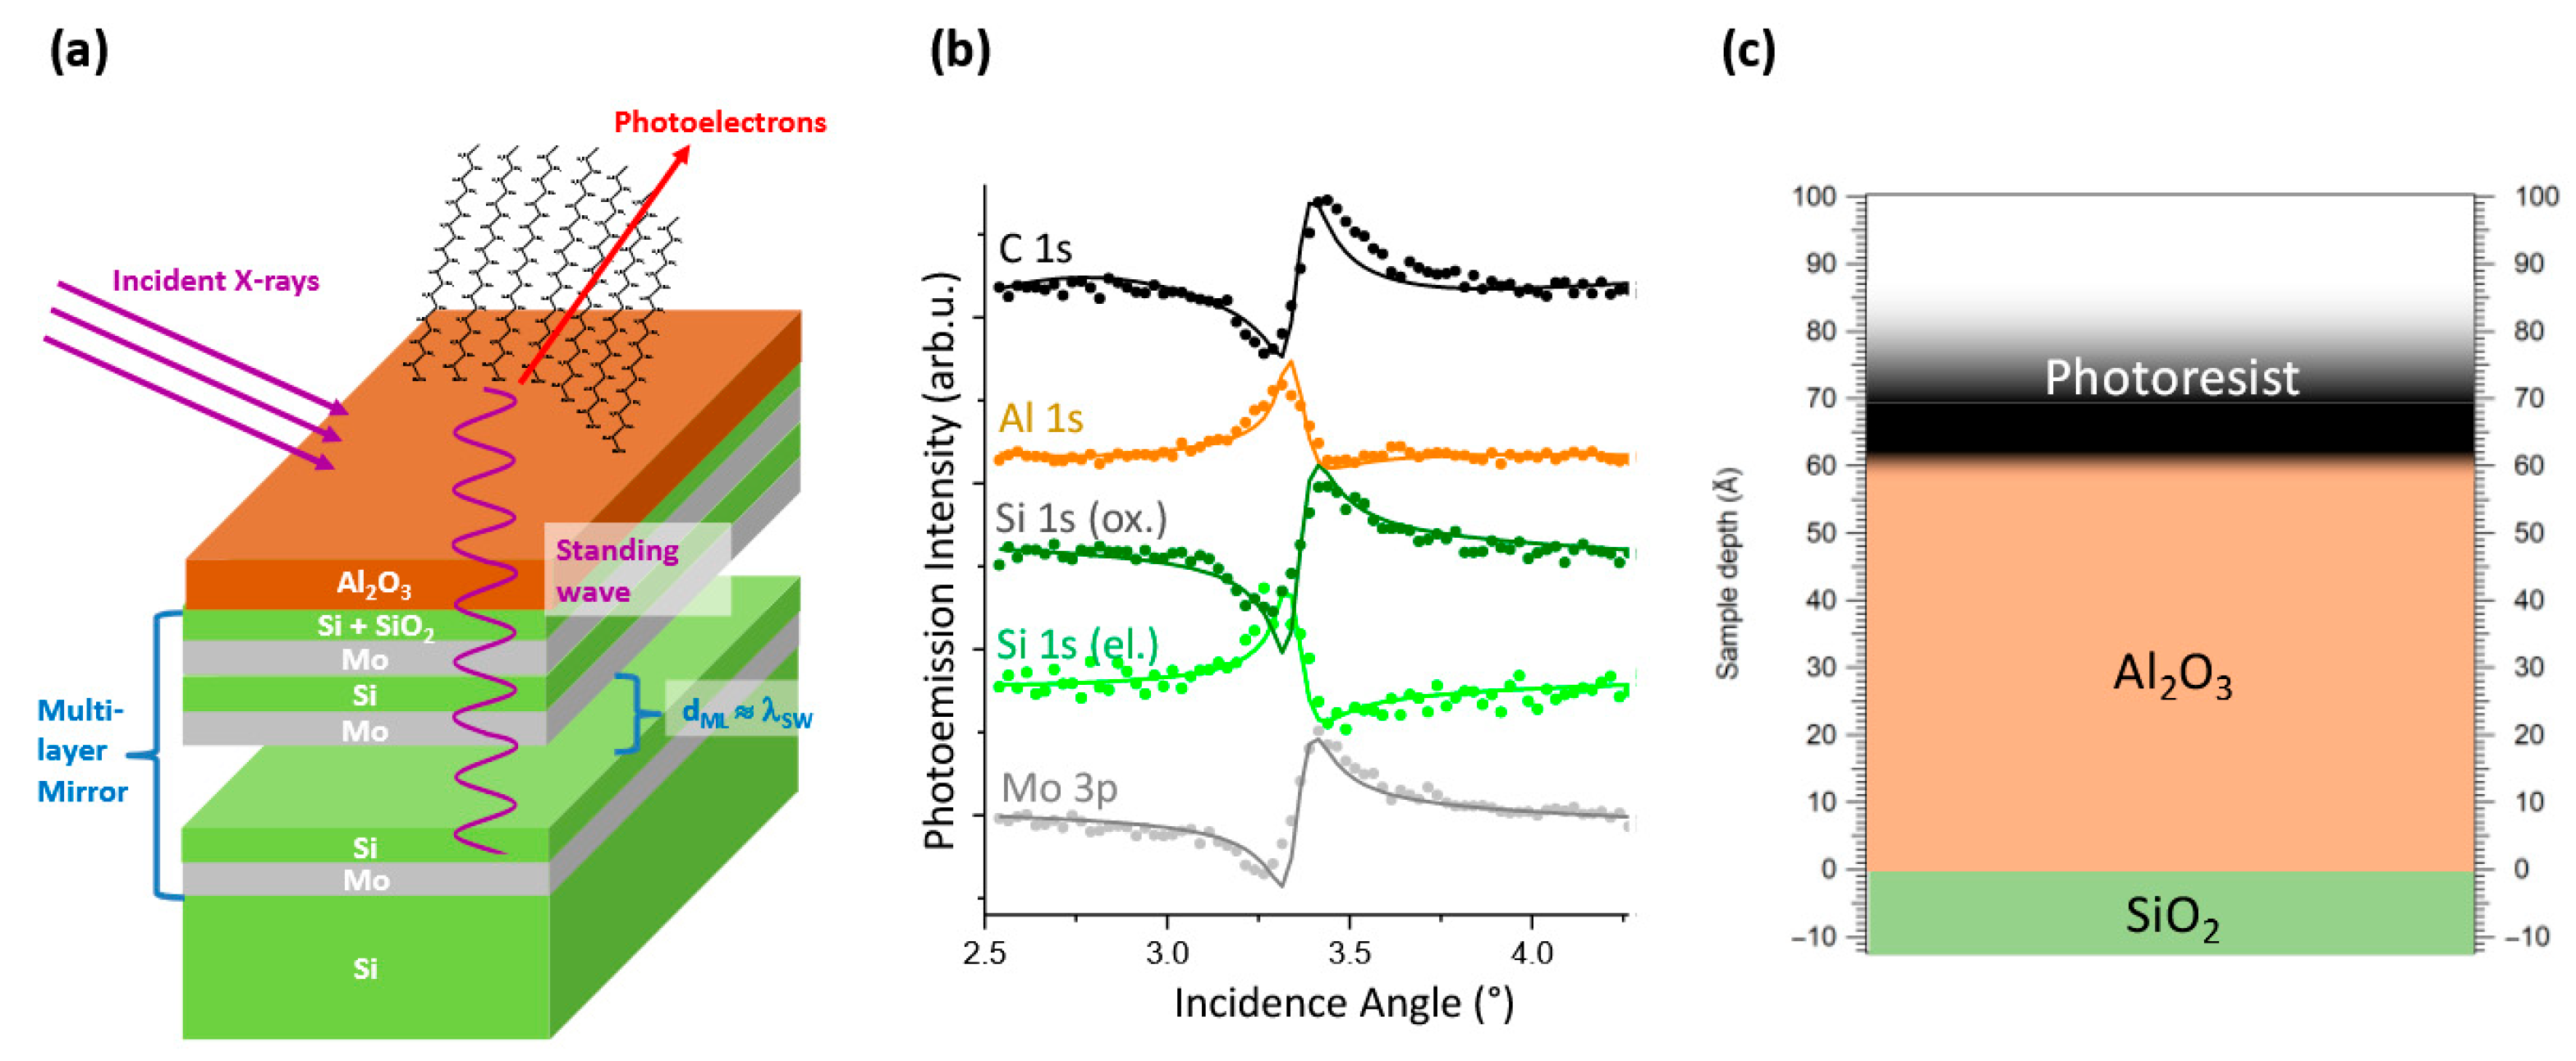
Another significant technological direction is standing-wave X-ray photoelectron spectroscopy (SW-XPS). By precisely adjusting the wavelength or the angle of incidence of X-rays, the positions of standing-wave antinodes and nodes along the sample depth can be controlled. This enables selective enhancement of photoelectron signals from specific atomic layers, achieving depth-selective analysis at the single-atom-layer level. In extreme ultraviolet (EUV) lithography—a cutting-edge semiconductor manufacturing process—the vertical distribution of photoresist components critically determines performance. Conti et al. employed SW-XPS to perform sub-nanometer depth profiling of EUV photoresist films. By generating standing waves via Bragg reflection and combining angle-scanning, they achieved high-precision quantitative characterization of film-interface roughness, molecular orientation, and interlayer diffusion. By tuning the X-ray standing-wave field, they revealed an interface roughness of only 0.2 nm between the SAM film and the aluminum oxide substrate (see Figure 7). This study experimentally demonstrated, for the first time, the chemical heterogeneity present at the bottom of photoresist films, providing unprecedented insights into their development mechanisms and optimizing performance [126,127].
In summary, XPS is a chemically and electronically meaningful interface state analysis technique. Conventional XPS resolves surface bonding environments and band alignment, HAXPES extends this reconstruction capability to buried stacks, and SW-XPS adds depth selectivity at the sub-nanometer scale. However, XPS-based techniques are intrinsically constrained by trade-offs among information depth, resolution, and experimental efficiency. Conventional XPS provides excellent surface sensitivity at the expense of penetration depth. HAXPES partially alleviates this limitation but is accompanied by reduced signal intensity and higher experimental cost. SW-XPS achieves depth resolution yet requires highly controlled sample preparation and involves substantially increased complexity in data interpretation.
As semiconductor thin films have become increasingly complex, XRF and XPS techniques have evolved from providing simple cross-validation of surface or ultrathin layer elemental content [128] to forming a highly complementary relationship [7,129,130]. XRF delivers bulk or overall elemental distribution, while XPS provides surface-sensitive chemical-state and electronic-structure information. Moreover, XRR provides vertical structural information, including thickness and interface roughness, whereas GISAXS gives lateral structural insights at the nanoscale. Looking back at film metrology mentioned above, thin film and multilayer challenges rarely depend on a single observable. Table 5, therefore, compares how complementary X-ray methods address thickness, roughness, elemental depth distribution, and interface chemistry in stacked semiconductor films.

5. Conclusions and Perspective

In this review, a systematic overview of X-ray characterization techniques for advanced semiconductor structures has been presented, covering diffraction-based methods, small-angle scattering, computed tomography, and spectroscopic approaches. These techniques provide complementary insights into structural, morphological, and compositional properties across multiple length scales, making them essential tools for addressing the increasing complexity of modern semiconductor devices and advanced packaging systems.
The comparison of different methods highlights that no single technique is sufficient to fully resolve the diverse structural challenges encountered in practice, such as high-aspect-ratio features, buried interfaces, and wafer architectures. Instead, effective characterization often relies on combining multiple X-ray modalities, each contributing distinct information and constraints. In this context, understanding the capabilities and limitations of each technique is critical for selecting appropriate measurement strategies and for interpreting experimental results in a consistent manner.
It is also important to recognize that many X-ray characterization techniques rely on model-based interpretation, where structural information is inferred from measured signals rather than directly observed. From this perspective, different X-ray methods can be viewed as probing the material system through different physical encoding mechanisms, including reciprocal-space scattering, real-space projection, and element-specific emission or excitation processes. The extraction of meaningful structural parameters, therefore, depends not only on data quality but also on the underlying assumptions, reconstruction models, and the stability of the associated inverse problems.
At present, however, no single X-ray technique can simultaneously satisfy the demands for nanoscale resolution, large penetration depth, high throughput, chemical sensitivity, and industrial compatibility. Synchrotron-based methods continue to define the frontier of high-resolution and multidimensional characterization, while laboratory systems remain more attractive for routine process monitoring and wider technological adoption. This gap defines the central challenge for the next stage of X-ray metrology development.
Looking forward, future improvements will focus on better light sources, robust algorithms, and the integration of multiple characterization techniques into unified systems.
First, while current high-brightness synchrotron radiation sources provide vital support for integrated circuit metrology, their operational costs and accessibility constraints limit widespread industrial adoption. Future developments in laboratory microfocus sources, advanced optical systems, and high-dynamic-range detectors will further enhance spatial resolution and data acquisition efficiency in laboratory setups. This will drive X-ray technology toward high stability, repeatability, and online acquisition capabilities, bridging the gap between research facilities and industrial applications.
To better contextualize the role of X-ray source development across different techniques, Table 6 summarizes the typical radiation source characteristics, including radiation requirements (monochromatic, polychromatic, or coherent), energy ranges, and beam properties, together with their implications for radiation damage.
Most diffraction- and spectroscopy-based techniques (e.g., XRD, XRR, SAXS, and XPS) rely on monochromatic radiation, whereas imaging approaches such as CT can operate with polychromatic sources. In contrast, CDI and ptychography primarily depend on beam coherence. While both laboratory and synchrotron sources are used, the higher photon flux and smaller beam sizes at synchrotron facilities generally increase the risk of radiation damage. These differences lead to technique-specific source requirements. For example, SAXS and HAXPES require both sufficient photon energy for penetration and strict monochromaticity, placing high demands on photon flux. As a result, they still rely heavily on synchrotron radiation. In contrast, CDI and ptychography require highly coherent and intense beams, making laboratory-scale implementation even more challenging. Overall, laboratory sources are emerging as a key direction for development. Promising laboratory light sources currently include liquid metal jet sources and inverse Compton scattering sources. Liquid metal jet sources provide high brightness and flexible energy selection for high-resolution scattering and diffraction measurements, although their spatial coherence remains lower than that of synchrotron radiation. Inverse Compton scattering sources offer the potential for compact and high-brightness hard X-ray generation, although their technical maturity and system stability are still under active development [131,132]. Advancements in these sources will enable imaging techniques centered on ptychography—such as Bragg ptychography and ptychographic X-ray computed tomography—to achieve both high resolution and large field-of-view. Such developments represent an important pathway toward nanoscale three-dimensional characterization of semiconductor devices.
Secondly, the structural reconstruction of scattering and diffraction data typically relies on complex model fitting and iterative computations, demanding high algorithmic efficiency and stability. Specific applications of deep learning have been discussed in the respective X-ray technique sections. Overall, four key directions are emerging for AI-assisted X-ray analysis: physics-constrained deep learning frameworks enable rapid and robust reconstruction under sparse data conditions; data fusion strategies integrate results from hybrid metrology to enhance prediction accuracy [133]; adaptive scanning strategies driven by real-time feedback to improve data acquisition efficiency; and automated defect recognition for high-throughput wafer inspection. Furthermore, AI-assisted data analysis and defect identification tools can rapidly flag anomalous regions in high-throughput wafer inspection. Crucially, future applications may extend to adjusting process parameters and comprehending complex structures. Through these approaches, AI not only accelerates and improves the reliability of structural reconstruction but also reduces reliance on ultra-high-coherence light sources or on prolonged exposure times, thereby enabling faster and more robust semiconductor inspection workflows.
Finally, individual X-ray techniques are typically sensitive to specific structural parameters but cannot simultaneously capture geometric, compositional, and strain information. As semiconductor devices enter the sub-10-nanometer scale, structural features exhibit multiscale, multi-material, and multi-physics coupling characteristics. Therefore, hybrid metrology will become an essential pathway for future structural characterization. Methodologically, future trends extend beyond the combined application of different X-ray techniques to include cross-integration with electron microscopy, optical scattering metrology, electrical characterization, and other approaches. By synthesizing the most reliable information from diverse physical mechanisms to achieve data complementarity and cross-validation, the confidence and stability of measurement results can be significantly enhanced. Currently, established combined modes for thin-film and multilayer structure analysis include XRR with GIXRF [134,135,136] and XRF with XPS [114,137], enabling simultaneous acquisition of thickness, density, composition, and crystal-structure information. Other combinations include CD-SAXS and SEM [138], OCD, XRF [139], and more. At the system level, future equipment development may increasingly adopt multiplexed architecture designs. Through optical path design and energy switching, rapid switching or simultaneous acquisition of XRD, XRF, CT, and scattering techniques can be achieved. Current explorations include integrated XRF-CT beamline designs [140] and desktop CT systems incorporating XRF modules [141,142].
In summary, with continued advances in laboratory X-ray sources, AI-driven data analysis, and hybrid characterization strategies, X-ray techniques are poised to play an increasingly central role in the study and development of next-generation semiconductor devices and other complex material systems. These developments will support high-resolution, multi-dimensional structural analysis that is both practical and non-destructive, enabling improved design, process optimization, and quality control in advanced technologies.

Author Contributions

Y.J.: Conceptualization, Data Curation, Writing—original draft; Z.Z. and Z.A.: Data Curation; Writing—review and editing; X.P.: Data Curation; Visualization; X.S. and R.W.: Resources; J.L. and C.C.: Visualization; Z.C.: Project administration; Resources; Y.X. and J.W.: Supervision; Resources; X.Z.: Supervision; Writing—review and editing; Funding acquisition; Y.P.: Project administration; Writing—review and editing; Funding acquisition. All authors have read and agreed to the published version of the manuscript.

Funding

This research received financial support from Research Start-up Funds of Hangzhou International Innovation Institute of Beihang University [Grant No. 2024KQ058], [Grant No. 2025BKZ026], and [Grant No. 2025BKZ058]. This work was also supported by the National Natural Science Foundation of China (Grants No. 12404118) and China Postdoctoral Science Foundation (Grants No. 2024M754047).

Data Availability Statement

The original contributions presented in this study are included in the article. Further inquiries can be directed to the corresponding authors.

Conflicts of Interest

Zhiqiang Cao and Xueying Zhang were employed by the Truth Instruments (Hangzhou) Co., Ltd. The remaining authors declare that the research was conducted in the absence of any commercial or financial relationships that could be construed as a potential conflict of interest.

References

  1. Wu, F.; Tian, H.; Shen, Y.; Hou, Z.; Ren, J.; Gou, G.; Sun, Y.; Yang, Y.; Ren, T.-L. Vertical MoS2 Transistors with Sub-1-Nm Gate Lengths. Nature 2022, 603, 259–264. [Google Scholar] [CrossRef] [Scilit] [PubMed]
  2. Breton, M.A.; Schmidt, D.; Greene, A.; Frougier, J.; Felix, N. Review of Nanosheet Metrology Opportunities for Technology Readiness. J. Micro/Nanopatterning Mater. Metrol. 2022, 21, 021206. [Google Scholar] [CrossRef] [Scilit]
  3. Karimi, K.; Fardoost, A.; Javanmard, M. Comprehensive Review of FinFET Technology: History, Structure, Challenges, Innovations, and Emerging Sensing Applications. Micromachines 2024, 15, 1187. [Google Scholar] [CrossRef] [Scilit]
  4. Praful, P.; Bailey, C. Warpage in Wafer-Level Packaging: A Review of Causes, Modelling, and Mitigation Strategies. Front. Electron. 2025, 5, 1515860. [Google Scholar] [CrossRef] [Scilit]
  5. Lu, K.; Lin, P.; Chun, H.; Kim, B.; Nomura, M.; Park, J.; Lee, C. A Review of Through-Silicon Via Inspection and Metrology Technology for Advanced Semiconductor Packaging. J. Manuf. Sci. Eng. 2025, 147, 121005. [Google Scholar] [CrossRef] [Scilit]
  6. Raimondi, P.; Benabderrahmane, C.; Berkvens, P.; Biasci, J.C.; Borowiec, P.; Bouteille, J.-F.; Brochard, T.; Brookes, N.B.; Carmignani, N.; Carver, L.R.; et al. The Extremely Brilliant Source Storage Ring of the European Synchrotron Radiation Facility. Commun. Phys. 2023, 6, 82. [Google Scholar] [CrossRef] [Scilit]
  7. Muthinti, G.R.; Loubet, N.; Chao, R.; De La Peña, A.A.; Li, J.; Guillorn, M.A.; Yamashita, T.; Kanakasabapathy, S.; Gaudiello, J.; Cepler, A.J.; et al. Proceedings of the Materials Characterization for Process Integration of Multi-Channel Gate All around (GAA) Devices, San Jose, CA, USA, 31 March 2017; Sanchez, M.I., Ukraintsev, V.A., Eds.; SPIE: Bellingham, WA, USA, 2017; p. 101451U. [Google Scholar]
  8. Schulze, A.; Loo, R.; Ryan, P.; Wormington, M.; Favia, P.; Witters, L.; Collaert, N.; Bender, H.; Vandervorst, W.; Caymax, M. Observation and Understanding of Anisotropic Strain Relaxation in Selectively Grown SiGe Fin Structures. Nanotechnology 2017, 28, 145703. [Google Scholar] [CrossRef] [Scilit]
  9. Schmidt, D.; Durfee, C.; Li, J.; Loubet, N.; Cepler, A.; Neeman, L.; Meir, N.; Ofek, J.; Oren, Y.; Fishman, D. In-Line Raman Spectroscopy for Gate-All-around Nanosheet Device Manufacturing. J. Micro/Nanopatterning Mater. Metrol. 2022, 21, 021203. [Google Scholar] [CrossRef] [Scilit]
  10. Yao, Y.-J.; Yang, C.-R.; Tseng, T.-Y.; Chang, H.-J.; Lin, T.-J.; Luo, G.-L.; Hou, F.-J.; Wu, Y.-C.; Chang-Liao, K.-S. High-Performance P- and N-Type SiGe/Si Strained Super-Lattice FinFET and CMOS Inverter: Comparison of Si and SiGe FinFET. Nanomaterials 2023, 13, 1310. [Google Scholar] [CrossRef] [Scilit]
  11. Liu, H.; Zeng, F.; Tang, G.; Wang, G.; Song, C.; Pan, F. Significant Enhancement in Electromigration Resistance and Texture of Aluminum Films Using an Ultrathin Titanium Underlayer. Acta Mater. 2013, 61, 4619–4624. [Google Scholar] [CrossRef] [Scilit]
  12. Sun, J.-Y.; Lee, H.-R.; Hwan Oh, K. Columnar Grown Copper Films on Polyimides Strained beyond 100%. Sci. Rep. 2015, 5, 13791. [Google Scholar] [CrossRef] [Scilit]
  13. Feng, X.; Yu, N.; Hang, T.; Zhang, Y.; Li, M. Experimental and Theoretical Study on Self-Annealing Behavior of Copper Film Electroplated with 2-Mercaptopyridine and 2-Aminobenzothiazole as Additives. J. Electrochem. Soc. 2016, 163, D57–D62. [Google Scholar] [CrossRef] [Scilit]
  14. Zhang, M.; Gao, L.-Y.; Wang, Y.-X.; Dong, W.; Zhao, N.; Liu, Z.-Q.; Sun, R. Thermal Stability of Electroplated Cu Films with Different Microstructure by Annealing Treatment. In Proceedings of the 2022 23rd International Conference on Electronic Packaging Technology (ICEPT), Dalian, China, 10 August 2022; IEEE: New York, NY, USA, 2022; pp. 1–5. [Google Scholar]
  15. Zoellner, M.H.; Richard, M.-I.; Chahine, G.A.; Zaumseil, P.; Reich, C.; Capellini, G.; Montalenti, F.; Marzegalli, A.; Xie, Y.-H.; Schülli, T.U.; et al. Imaging Structure and Composition Homogeneity of 300 Mm SiGe Virtual Substrates for Advanced CMOS Applications by Scanning X-Ray Diffraction Microscopy. ACS Appl. Mater. Interfaces 2015, 7, 9031–9037. [Google Scholar] [CrossRef] [Scilit]
  16. Wong, C.S.; Bennett, N.S.; Manessis, D.; Danilewsky, A.; McNally, P.J. Non-Destructive Laboratory-Based X-Ray Diffraction Mapping of Warpage in Si Die Embedded in IC Packages. Microelectron. Eng. 2014, 117, 48–56. [Google Scholar] [CrossRef] [Scilit]
  17. Mochizuki, S.; Murray, C.E.; Madan, A.; Pinto, T.; Wang, Y.-Y.; Li, J.; Weng, W.; Jagannathan, H.; Imai, Y.; Kimura, S.; et al. Quantification of Local Strain Distributions in Nanoscale Strained SiGe FinFET Structures. J. Appl. Phys. 2017, 122, 135705. [Google Scholar] [CrossRef] [Scilit]
  18. Shida, K.; Takeuchi, S.; Tohei, T.; Imai, Y.; Kimura, S.; Schulze, A.; Caymax, M.; Sakai, A. Depth-Resolved Analysis of Lattice Distortions in High-Ge-Content SiGe/Compositionally Graded SiGe Films Using Nanobeam X-Ray Diffraction. Semicond. Sci. Technol. 2018, 33, 124005. [Google Scholar] [CrossRef] [Scilit]
  19. Okoro, C.; Levine, L.E.; Xu, R.; Hummler, K.; Obeng, Y.S. Nondestructive Measurement of the Residual Stresses in Copper Through-Silicon Vias Using Synchrotron-Based Microbeam X-Ray Diffraction. IEEE Trans. Electron. Devices 2014, 61, 2473–2479. [Google Scholar] [CrossRef] [Scilit]
  20. Jiang, T.; Wu, C.; Tamura, N.; Kunz, M.; Kim, B.G.; Son, H.-Y.; Suh, M.-S.; Im, J.; Huang, R.; Ho, P.S. Study of Stresses and Plasticity in Through-Silicon Via Structures for 3D Interconnects by X-Ray Micro-Beam Diffraction. IEEE Trans. Device Mater. Reliab. 2014, 14, 698–703. [Google Scholar] [CrossRef] [Scilit]
  21. Song, M.; Mundboth, K.R.; Szpunar, J.A.; Chen, L.; Feng, R. Characterization of Local Strain/Stress in Copper through-Silicon via Structures Using Synchrotron X-Ray Microdiffraction, Electron Backscattered Diffraction and Nonlinear Thermomechanical Model. J. Micromech. Microeng. 2015, 25, 085002. [Google Scholar] [CrossRef] [Scilit]
  22. McNally, P.J. B-Spline X-Ray Diffraction Imaging Techniques for Die Warpage and Stress Monitoring inside Fully Encapsulated Packaged Chips. In Proceedings of the 2015 16th International Conference on Thermal, Mechanical and Multi-Physics Simulation and Experiments in Microelectronics and Microsystems, Budapest, Hungary, 19–22 April 2015; IEEE: New York, NY, USA, 2015; pp. 1–3. [Google Scholar]
  23. Cowley, A.; Ivankovic, A.; Wong, C.S.; Bennett, N.S.; Danilewsky, A.N.; Gonzalez, M.; Cherman, V.; Vandevelde, B.; De Wolf, I.; McNally, P.J. B-Spline X-Ray Diffraction Imaging—Rapid Non-Destructive Measurement of Die Warpage in Ball Grid Array Packages. Microelectron. Reliab. 2016, 59, 108–116. [Google Scholar] [CrossRef] [Scilit]
  24. Kim, J.; Seo, O.; Song, C.; Hiroi, S.; Chen, Y.; Irokawa, Y.; Nabatame, T.; Koide, Y.; Sakata, O. Mapping of a Lattice-Plane Tilting in a Ga N Wafer Using Energy-Resolved X-Ray Diffraction Topography. Phys. Rev. Appl. 2019, 11, 024072. [Google Scholar] [CrossRef] [Scilit]
  25. Xiong, G.; Moutanabbir, O.; Reiche, M.; Harder, R.; Robinson, I. Coherent X-Ray Diffraction Imaging and Characterization of Strain in Silicon-on-Insulator Nanostructures. Adv. Mater. 2014, 26, 7747–7763. [Google Scholar] [CrossRef] [Scilit]
  26. Hruszkewycz, S.O.; Allain, M.; Holt, M.V.; Murray, C.E.; Holt, J.R.; Fuoss, P.H.; Chamard, V. High-Resolution Three-Dimensional Structural Microscopy by Single-Angle Bragg Ptychography. Nat. Mater. 2017, 16, 244–251. [Google Scholar] [CrossRef] [Scilit]
  27. Deng, J.; Hong, Y.P.; Chen, S.; Nashed, Y.S.G.; Peterka, T.; Levi, A.J.F.; Damoulakis, J.; Saha, S.; Eiles, T.; Jacobsen, C. Nanoscale X-Ray Imaging of Circuit Features without Wafer Etching. Phys. Rev. B 2017, 95, 104111. [Google Scholar] [CrossRef] [Scilit]
  28. Li, P.; Phillips, N.W.; Leake, S.; Allain, M.; Hofmann, F.; Chamard, V. Revealing Nano-Scale Lattice Distortions in Implanted Material with 3D Bragg Ptychography. Nat. Commun. 2021, 12, 7059. [Google Scholar] [CrossRef] [Scilit]
  29. Bachmann, F.; Bale, H.; Gueninchault, N.; Holzner, C.; Lauridsen, E.M. 3D Grain Reconstruction from Laboratory Diffraction Contrast Tomography. J. Appl. Crystallogr. 2019, 52, 643–651. [Google Scholar] [CrossRef] [Scilit] [PubMed]
  30. Bieler, T.R.; Wang, L.; Beaudoin, A.J.; Kenesei, P.; Lienert, U. In Situ Characterization of Twin Nucleation in Pure Ti Using 3D-XRD. Met. Mater. Trans. A 2014, 45, 109–122. [Google Scholar] [CrossRef] [Scilit]
  31. Heller, L.; Karafítov́, I.; Petrich, L.; Pawlas, Z.; Shayanfard, P.; Beneš, V.; Schmidt, V.; Šittner, P. Numerical Microstructure Model of NiTi Wire Reconstructed from 3D-XRD Data. Model. Simul. Mater. Sci. Eng. 2020, 28, 055007. [Google Scholar] [CrossRef] [Scilit]
  32. Radamson, H.H.; Miao, Y.; Zhou, Z.; Wu, Z.; Kong, Z.; Gao, J.; Yang, H.; Ren, Y.; Zhang, Y.; Shi, J.; et al. CMOS Scaling for the 5 Nm Node and Beyond: Device, Process and Technology. Nanomaterials 2024, 14, 837. [Google Scholar] [CrossRef] [Scilit] [PubMed]
  33. Jones, R.L.; Hu, T.; Lin, E.K.; Wu, W.-L.; Kolb, R.; Casa, D.M.; Bolton, P.J.; Barclay, G.G. Small Angle X-Ray Scattering for Sub-100 Nm Pattern Characterization. Appl. Phys. Lett. 2003, 83, 4059–4061. [Google Scholar] [CrossRef] [Scilit]
  34. Sasaki, K.; Hashimoto, T.; Kuo, Y.; Tsukada, H.; Tanizaki, H. Measurability Analysis of the HAR Structure in 3D Memory by T-SAXS Simulation. In Proceedings of the Metrology, Inspection, and Process Control for Semiconductor Manufacturing XXXV, Online Only, USA, 22 February 2021; Adan, O., Robinson, J.C., Eds.; SPIE: Bellingham, WA, USA, 2021; p. 25. [Google Scholar]
  35. Tsuji, Y.; Kim, D.; Yoo, G.; Hwang, B.; Kim, K.; Lee, D.; Sasai, Y.; Yi, S.; Jeong, J.; Ihm, D.; et al. Small Angle X-Ray Scattering (SAXS) and Q-Space Weighting Filter for ×3 CD-Extraction Accuracy Improvement. AIP Adv. 2021, 11, 065129. [Google Scholar] [CrossRef] [Scilit]
  36. Lin, Y.-Y.; Lee, T.-J.; Su, H.-F.; Liu, Y.-H.; Cheng, C.-Y.; Liman, C.; Chen, B.; Tan, Z.; Wu, M.-T.; Huang, M.-H.; et al. Global Tilt Measurement on Irregular PIL Supporting Patterns in 3D NAND Memory. In Proceedings of the Metrology, Inspection, and Process Control XXXVIII, San Jose, CA, USA, 10 April 2024; Sendelbach, M.J., Schuch, N.G., Eds.; SPIE: Bellingham, WA, USA, 2024; p. 106. [Google Scholar]
  37. Lin, Y.-Y.; Lee, T.-J.; Su, H.-F.; Liu, Y.-H.; Cheng, C.-Y.; Liman, C.; Chen, B.; Tan, Z.; Chiu, Y.-C.; Huang, C.-K.; et al. Global Tilt Extraction for BEOL Contact Landing Displacement Control. In Proceedings of the Metrology, Inspection, and Process Control XXXVIII, San Jose, CA, USA, 10 April 2024; Sendelbach, M.J., Schuch, N.G., Eds.; SPIE: Bellingham, WA, USA, 2024; p. 109. [Google Scholar]
  38. Fan, M.; Ranjit, R.; Thurber, A.; Engelhard, D. High Resolution Profiles of 3D NAND Pillars Using X-Ray Scattering Metrology. In Proceedings of the Metrology, Inspection, and Process Control for Semiconductor Manufacturing XXXV, Online Only, USA, 22 February 2021; Adan, O., Robinson, J.C., Eds.; SPIE: Bellingham, WA, USA, 2021; p. 23. [Google Scholar]
  39. Suenaga, R.; Ito, Y.; Goto, T.; Omote, K. Non-Destructive Sub-Nanometer Evaluation of Sidewall Coverage in Deep Holes by Small-Angle x-Ray Scattering. In Proceedings of the Metrology, Inspection, and Process Control XXXIX, San Jose, CA, USA, 24 April 2025; Sendelbach, M.J., Schuch, N.G., Eds.; SPIE: Bellingham, WA, USA, 2025; p. 100. [Google Scholar]
  40. Wu, W.; Joseph Kline, R.; Jones, R.L.; Lee, H.-J.; Lin, E.K.; Sunday, D.F.; Wang, C.; Hu, T.; Soles, C.L. Review of the Key Milestones in the Development of Critical Dimension Small Angle X-Ray Scattering at National Institute of Standards and Technology. J. Micro/Nanopatterning Mater. Metrol. 2023, 22, 031206. [Google Scholar] [CrossRef] [Scilit]
  41. Institute of Electrical and Electronics Engineers. IEEE International Roadmap for Devices and Systems, “Metrology”; Institute of Electrical and Electronics Engineers: New York, NY, USA, 2024. [Google Scholar]
  42. Wormington, M.; Ginsburg, A.; Reichental, I.; Dikopoltsev, A.; Krokhmal, A.; Vinshtein, Y.; Ryan, P.; Korlahalli, R.; Wong, F.; Rabello, S.; et al. X-Ray Critical Dimension Metrology Solution for High Aspect Ratio Semiconductor Structures. In Proceedings of the Metrology, Inspection, and Process Control for Semiconductor Manufacturing XXXV, Online Only, USA, 22 February 2021; Adan, O., Robinson, J.C., Eds.; SPIE: Bellingham, WA, USA, 2021; p. 27. [Google Scholar]
  43. Dhungana, N.; Bryan, M.; Gergaud, P.; Quéméré, P.; Freychet, G. An Open-Source CD-SAXS Library Framework for Parallelized Calculations to Facilitate the Modeling and Uncertainty Calculations of Complex Material Stacks. In Proceedings of the Metrology, Inspection, and Process Control XXXIX, San Jose, CA, USA, 24 April 2025; Sendelbach, M.J., Schuch, N.G., Eds.; SPIE: Bellingham, WA, USA, 2025; p. 31. [Google Scholar]
  44. Baranovskiy, A.; Grinberg, I.; Greene, M.G.; Amasay, Y.; Wormington, M. Deep Learning for the Analysis of X-Ray Scattering Data from High-Aspect Ratio Structures. In Proceedings of the Metrology, Inspection, and Process Control XXXVII, San Jose, CA, USA, 27 April 2023; Robinson, J.C., Sendelbach, M.J., Eds.; SPIE: Bellingham, WA, USA, 2023; p. 123. [Google Scholar]
  45. Ekmekci, C.; Cetin, M. Uncertainty Quantification for Deep Unrolling-Based Computational Imaging. IEEE Trans. Comput. Imaging 2022, 8, 1195–1209. [Google Scholar] [CrossRef] [Scilit]
  46. Mahadevapuram, N.; Strzalka, J.; Stein, G.E. Grazing-incidence Transmission Small Angle X-ray Scattering from Thin Films of Block Copolymers. J. Polym. Sci. B Polym. Phys. 2013, 51, 602–610. [Google Scholar] [CrossRef] [Scilit]
  47. Hori, Y.; Gonda, S. Error Investigation for SI Traceable Pitch Calibration of One-Dimensional Grating by Grazing-Incidence Small-Angle X-Ray Scattering. Measurement 2024, 225, 114036. [Google Scholar] [CrossRef] [Scilit]
  48. Freychet, G.; Rademaker, G.; Blancquaert, Y.; Gergaud, P. Reconstruction of the In-Depth Profile of Line Gratings with Critical Dimension Grazing Incidence Small Angle x-Ray Scattering on Laboratory Equipment. J. Micro/Nanopatterning Mater. Metrol. 2023, 22, 031210. [Google Scholar] [CrossRef] [Scilit]
  49. Hallstedt, J.; Espes, E.; Lundström, U.; Hallstedt, B.; Hemberg, O.; Otendal, M.; Tuohimaa, T.; Takman, P. METALJET Source for in Situ SAXS Studies in the Home Laboratory. Acta Crystallogr. A Found. Adv. 2017, 73, C687. [Google Scholar] [CrossRef] [Scilit]
  50. Zaumseil, P. X-Ray Reflectivity Characterisation of Thin-Film and Multilayer Structures. In Materials for Information Technology; Zschech, E., Whelan, C., Mikolajick, T., Eds.; Engineering Materials and Processes; Springer: London, UK, 2005; pp. 497–505. [Google Scholar]
  51. Seth, A.; Kaushik, D.; Ghosh, S.K. X-Ray Scatterings to Probe the Structure and Assembly of Biomimetic Membranes. Eur. Phys. J. Spec. Top. 2024, 233, 2941–2963. [Google Scholar] [CrossRef] [Scilit]
  52. Pan, J. Synchrotron X-Ray Techniques for In Situ or Microscopic Study of Passive Films on Industrial Alloys: A Mini Review. Corros. Mater. Degrad. 2025, 6, 56. [Google Scholar] [CrossRef] [Scilit]
  53. Mezger, M.; Jérôme, B.; Kortright, J.B.; Valvidares, M.; Gullikson, E.M.; Giglia, A.; Mahne, N.; Nannarone, S. Molecular Orientation in Soft Matter Thin Films Studied by Resonant Soft X-Ray Reflectivity. Phys. Rev. B 2011, 83, 155406. [Google Scholar] [CrossRef] [Scilit]
  54. Bogdanowicz, J.; Mingardi, A.; Brissonneau, V.; Loo, R.; Shimura, Y.; Akula, A.; Gowda, P.P.; Zhou, D.; Horiguchi, N.; Biesemans, S.; et al. Inline X-Ray Metrology for Complementary Field-Effect Transistors (CFET). In Proceedings of the Metrology, Inspection, and Process Control XXXIX, San Jose, CA, USA, 24 April 2025; Sendelbach, M.J., Schuch, N.G., Eds.; SPIE: Bellingham, WA, USA, 2025; p. 48. [Google Scholar]
  55. Pang, X.; Yu, P.; Shang, C.; Chen, B.; Yin, Y.; Chen, X.; Zhang, J.; Wong, T.; Li, Z.; Hong, F.; et al. Thin Film Metrology Techniques: X-Ray Diffraction and x-Ray Reflectivity. In Proceedings of the Ninth International Workshop on Advanced Patterning Solutions (IWAPS 2025), Shenzhen, China, 3 December 2025; Ye, T., Wei, Y., Eds.; SPIE: Bellingham, WA, USA, 2025; p. 36. [Google Scholar]
  56. Li, X.; Tang, H.; Zhao, J.; Li, F. Research Progress of Beyond Extreme Ultraviolet Multilayers at 6.X nm. Chin. J. Laser 2024, 51, 0701010. [Google Scholar] [CrossRef] [Scilit]
  57. Perros, A.P.; Sippola, P.; Arduca, E.; Johansson, L.-S.; Lipsanen, H. Low Temperature and High Quality Atomic Layer Deposition HfO2 Coatings. In Proceedings of the 2017 IMAPS Nordic Conference on Microelectronics Packaging (NordPac), Gothenburg, Sweden, 18–20 June 2017; IEEE: New York, NY, USA, 2017; pp. 182–185. [Google Scholar]
  58. Paul, P.; Brusaterra, E.; Ostermay, I.; Bahat Treidel, E.; Brunner, F.; Mogilatenko, A.; Udas, K.; Boschker, J.; Hilt, O.; Krüger, O. Plasma Enhanced Atomic Layer Deposition of HfO2—A Potential Gate Dielectric for GaN-Based Devices. J. Vac. Sci. Technol. A 2025, 43, 042406. [Google Scholar] [CrossRef] [Scilit]
  59. Barman, A.; Saini, C.P.; Sarkar, P.K.; Roy, A.; Satpati, B.; Kanjilal, D.; Ghosh, S.K.; Dhar, S.; Kanjilal, A. Probing Electron Density across Ar+ Irradiation-Induced Self-Organized TiO2−x Nanochannels for Memory Application. Appl. Phys. Lett. 2016, 108, 244104. [Google Scholar] [CrossRef] [Scilit]
  60. Gaudiello, J.; Emans, S.; Shifrin, M.; Etzioni, Y.; Urenski, R.; Lee, W.T.; Breton, M.; Chao, R.; Muthinti, G.R.; De La Pena, A.A.; et al. Electrical Test Prediction Using Hybrid Metrology and Machine Learning. In Proceedings of the Metrology, Inspection, and Process Control for Microlithography XXXI, San Jose, CA, USA, 12 April 2017; Sanchez, M.I., Ukraintsev, V.A., Eds.; SPIE: Bellingham, WA, USA, 2017; p. 3. [Google Scholar]
  61. Liao, S.; Mo, Z.; Zeng, M.; Wu, J.; Gu, Y.; Li, G.; Quan, G.; Lv, Y.; Liu, L.; Yang, C.; et al. Fast and Low-Dose Medical Imaging Generation Empowered by Hybrid Deep-Learning and Iterative Reconstruction. Cell Rep. Med. 2023, 4, 101119. [Google Scholar] [CrossRef] [Scilit]
  62. Pithan, L.; Starostin, V.; Mareček, D.; Petersdorf, L.; Völter, C.; Munteanu, V.; Jankowski, M.; Konovalov, O.; Gerlach, A.; Hinderhofer, A.; et al. Closing the Loop: Autonomous Experiments Enabled by Machine-Learning-Based Online Data Analysis in Synchrotron Beamline Environments. J. Synchrotron Radiat. 2023, 30, 1064–1075. [Google Scholar] [CrossRef] [Scilit] [PubMed]
  63. Schumi-Mareček, D.; Bertram, F.; Mikulík, P.; Varshney, D.; Novák, J.; Kowarik, S. Millisecond X-Ray Reflectometry and Neural Network Analysis: Unveiling Fast Processes in Spin Coating. J. Appl. Crystallogr. 2024, 57, 314–323. [Google Scholar] [CrossRef] [Scilit] [PubMed]
  64. Carlton, H.D.; Elmer, J.W.; Li, Y.; Pacheco, M.; Goyal, D.; Parkinson, D.Y.; MacDowell, A.A. Using Synchrotron Radiation Microtomography to Investigate Multi-Scale Three-Dimensional Microelectronic Packages. J. Vis. Exp. 2016, e53683. [Google Scholar] [CrossRef] [Scilit]
  65. Gluch, J.; Löffler, M.; Meyendorf, N.; Oppermann, M.; Röllig, M.; Sättler, P.; Wolter, K.J.; Zschech, E. Multi-Scale Radiographic Applications in Microelectronic Industry. AIP Conf. Proc. 2016, 1706, 020026. [Google Scholar] [CrossRef] [Scilit]
  66. Scott, C.C.; Farrier, M.; Li, Y.; Laxer, S.; Ravi, P.; Kenesei, P.; Wojcik, M.J.; Miceli, A.; Karim, K.S. High-Energy Micrometre-Scale Pixel Direct Conversion X-Ray Detector. J. Synchrotron Radiat. 2021, 28, 1081–1089. [Google Scholar] [CrossRef] [Scilit]
  67. Rösner, B.; Finizio, S.; Koch, F.; Döring, F.; Guzenko, V.A.; Langer, M.; Kirk, E.; Watts, B.; Meyer, M.; Loroña Ornelas, J.; et al. Soft X-Ray Microscopy with 7 Nm Resolution. Optica 2020, 7, 1602. [Google Scholar] [CrossRef] [Scilit]
  68. Aidukas, T.; Phillips, N.W.; Diaz, A.; Poghosyan, E.; Müller, E.; Levi, A.F.J.; Aeppli, G.; Guizar-Sicairos, M.; Holler, M. High-Performance 4-Nm-Resolution X-Ray Tomography Using Burst Ptychography. Nature 2024, 632, 81–88. [Google Scholar] [CrossRef] [Scilit]
  69. Cesar Da Silva, J.; Pacureanu, A.; Yang, Y.; Bohic, S.; Morawe, C.; Barrett, R.; Cloetens, P. Efficient Concentration of High-Energy X-Rays for Diffraction-Limited Imaging Resolution. Optica 2017, 4, 492. [Google Scholar] [CrossRef] [Scilit]
  70. Yan, H.; Bouet, N.; Zhou, J.; Huang, X.; Nazaretski, E.; Xu, W.; Cocco, A.P.; Chiu, W.K.S.; Brinkman, K.S.; Chu, Y.S. Multimodal Hard X-Ray Imaging with Resolution Approaching 10 Nm for Studies in Material Science. Nano Futures 2018, 2, 011001. [Google Scholar] [CrossRef] [Scilit]
  71. Dreier, T.; Nilsson, D.; Hållstedt, J.; Hu, S. Improved Resolution in Advanced Packaging Metrology Through Advanced Nano-Focus X-Ray Sources. In Proceedings of the 2024 25th International Conference on Electronic Packaging Technology (ICEPT), Tianjin, China, 7–9 August 2024; pp. 1–3. [Google Scholar]
  72. Bryant, K.; Eng, B. New X-Ray Tubes for Wafer Level Inspection. In Proceedings of the 2020 International Wafer Level Packaging Conference (IWLPC), San Jose, CA, USA, 13–30 October 2020; pp. 1–6. [Google Scholar]
  73. Lechowski, B.; Kutukova, K.; Grenzer, J.; Panchenko, I.; Krueger, P.; Clausner, A.; Zschech, E. Laboratory X-Ray Microscopy of 3D Nanostructures in the Hard X-Ray Regime Enabled by a Combination of Multilayer X-Ray Optics. Nanomaterials 2024, 14, 233. [Google Scholar] [CrossRef] [Scilit] [PubMed]
  74. Kutukova, K.; Lechowski, B.; Grenzer, J.; Krueger, P.; Clausner, A.; Zschech, E. Laboratory High-Contrast X-Ray Microscopy of Copper Nanostructures Enabled by a Liquid-Metal-Jet X-Ray Source. Nanomaterials 2024, 14, 448. [Google Scholar] [CrossRef] [Scilit] [PubMed]
  75. Batey, D.J.; Van Assche, F.; Vanheule, S.; Boone, M.N.; Parnell, A.J.; Mykhaylyk, O.O.; Rau, C.; Cipiccia, S. X-Ray Ptychography with a Laboratory Source. Phys. Rev. Lett. 2021, 126, 193902. [Google Scholar] [CrossRef] [Scilit]
  76. Chen, Y. Recent Progress in Nanofabrication of High Resolution X-Ray Zone Plate Lenses by Electron Beam Lithography. Acta Opt. Sin. 2022, 42, 1134005. [Google Scholar] [CrossRef] [Scilit]
  77. Li, Y.; Lu, W.; Wang, S.; Yuan, Q.; Kong, X.; Han, L.; Xia, Y. Fabrication of Multilayer Fresnel Zone Plate for Hard X-Ray Microscopy by Atomic Layer Deposition and Focused Ion Beam Milling. Vacuum 2023, 209, 111776. [Google Scholar] [CrossRef] [Scilit]
  78. Lau, S.H.; Gul, S.; Zan, G.; Vine, D.; Lewis, S.; Yun, W. Defect Characterization of Advanced Packages Using Novel Phase and Dark Field X-Ray Imaging. EDFA Tech. Artic. 2020, 22, 18–25. [Google Scholar] [CrossRef] [Scilit]
  79. Gelb, J.; Gul, S.; Zheng, C.; Singh, V.; Adibhatla, A.; Lau, S.; Lewis, S.; Yun, W. Dual-Mode 3D X-Ray Imaging for Failure Analysis of Complex Semiconductor Packages. In Proceedings of the International Symposium for Testing and Failure Analysis, Pasadena, CA, USA, 16 November 2025; ASM International: Novelty, OH, USA, 2025; Volume 85212, pp. 335–342. [Google Scholar]
  80. Lau, S.H.; Gelb, J.; Gul, S.; Rowland, D.; Qin, T.; Zheng, C.; Singh, V.; Lewis, S.; Yun, W. Next-Gen Failure Analysis: 3D X-Ray Imaging at 350 Nm Meets Laminography. In Proceedings of the 2025 IEEE 32nd International Symposium on the Physical and Failure Analysis of Integrated Circuits (IPFA), Bayan Lepas, Malaysia, 5–8 August 2025; IEEE: New York, NY, USA, 2025; pp. 1–6. [Google Scholar]
  81. Nikitin, V.; Mittone, A.; Clark, S.J.; Fezzaa, K.; Wojcik, M.; Deriy, A.; Bean, S.; De Carlo, F. Nano-Laminography with a Transmission X-Ray Microscope. J. Synchrotron Radiat. 2025, 32, 1452–1462. [Google Scholar] [CrossRef] [Scilit]
  82. Khan, M.S.M.; Xi, C.; Haque, M.S.U.; Tehranipoor, M.M.; Asadizanjani, N. Exploring Advanced Packaging Technologies for Reverse Engineering a System-in-Package (SiP). IEEE Trans. Compon. Packag. Manuf. Technol. 2023, 13, 1360–1370. [Google Scholar] [CrossRef] [Scilit]
  83. Wen Lee, X.; Zulkifli, S.; Zee, B. Enabling Advanced Packaging Defect Inspection Using X-Ray Computed Laminography Imaging Technique. In Proceedings of the 2025 IEEE 32nd International Symposium on the Physical and Failure Analysis of Integrated Circuits (IPFA), Bayan Lepas, Malaysia, 5 August 2025; IEEE: New York, NY, USA, 2025; pp. 1–5. [Google Scholar]
  84. Chery, E.; Duval, F.F.C.; Stucchi, M.; Slabbekoorn, J.; Croes, K.; Beyne, E. Reliability Study of Polymers Used in Sub-4-Μm Pitch RDL Applications. IEEE Trans. Compon. Packag. Manuf. Technol. 2021, 11, 1073–1080. [Google Scholar] [CrossRef] [Scilit]
  85. Shafkat, M.; Khan, M.; Xi, C.; Varshney, N.; Khan, A.A.; Dalir, H.; Asadizanjani, N. Assessing Compatibility of Advanced IC Packages to X-Ray Based Physical Inspection. EDFA Tech. Artic. 2024, 26, 14–24. [Google Scholar] [CrossRef] [Scilit]
  86. Lin, Y.-S.; Liu, C.-H.; Wang, C.-C.; Hung, C.-P.; Kuo, C.-L.; Hung, C.-W. Novel Fault Isolation Methodology Applied on Nanoscale Defect in Fine Line RDL for Advanced Fan-Out Package. In Proceedings of the 2025 IEEE 75th Electronic Components and Technology Conference (ECTC), Dallas, TX, USA, 27 May 2025; IEEE: New York, NY, USA, 2025; pp. 1943–1947. [Google Scholar]
  87. Liu, C.-H.; Chang, Y.-J.; Hsiao, Y.-H.; Lin, Y.-S. 3D X-Ray Microscope Applied on Fine-Line Inspection of Fan-Out Packages. In Proceedings of the 2022 International Conference on Electronics Packaging (ICEP), Sapporo, Japan, 11 May 2022; IEEE: New York, NY, USA, 2022; pp. 199–200. [Google Scholar]
  88. Huang, C.-J.; Hsiao, Y.-H.; Lin, Y.-S.; Liu, C.-H. A Special Holding System for Large Package in 3D X-Ray Inspection. In Proceedings of the 2024 International Conference on Electronics Packaging (ICEP), Toyama, Japan, 17 April 2024; IEEE: New York, NY, USA, 2024; pp. 231–232. [Google Scholar]
  89. Li, S.; Frame, J.; Madriaga-Berry, E.; Hulog, J.; Zhang, M.; Terada, M.; Gu, A.; Taraci, D. Detecting Wafer-Level Cu Pillar Defects Using Advanced 3D X-Ray Microscopy (XRM) with Submicron Resolution. J. Fail. Anal. Prev. 2024, 24, 2232–2239. [Google Scholar] [CrossRef] [Scilit]
  90. Dreier, T.; Nilsson, D.; Hållstedt, J. Fast and High-Resolution X-Ray Nano Tomography for Failure Analysis in Advanced Packaging. Microelectron. Reliab. 2025, 168, 115694. [Google Scholar] [CrossRef] [Scilit]
  91. Lin, T.-W.; Shie, K.-C.; Chen, C.; Tu, K.-N. Study of Electromigration of Solder Microbumps by 3D X-Ray Microscopy. In Proceedings of the 2020 15th International Microsystems, Packaging, Assembly and Circuits Technology Conference (IMPACT), Taipei, Taiwan, 21 October 2020; IEEE: New York, NY, USA, 2020; pp. 76–78. [Google Scholar]
  92. Shie, K.-C.; Lin, T.-W.; Tu, K.N.; Chen, C. Non-Destructive Observation of Void Formation Due to Electromigration in Solder Microbump by 3D Xray. In Proceedings of the 2021 IEEE 71st Electronic Components and Technology Conference (ECTC), San Diego, CA, USA, 1–4 July 2021; IEEE: New York, NY, USA, 2021; pp. 925–930. [Google Scholar]
  93. Chen, Y.; Lai, P.; Huang, H.-Z.; Zhang, P.; Lin, X. Open Localization in 3D Package with TSV Daisy Chain Using Magnetic Field Imaging and High-Resolution Three-Dimensional X-Ray Microscopy. Appl. Sci. 2021, 11, 8148. [Google Scholar] [CrossRef] [Scilit]
  94. Wolz, B.C.; Jaremenko, C.; Vollnhals, F.; Kling, L.; Wrege, J.; Christiansen, S. X-ray Microscopy and Automatic Detection of Defects in through Silicon Vias in Three-dimensional Integrated Circuits. Eng. Rep. 2022, 4, e12520. [Google Scholar] [CrossRef] [Scilit]
  95. Wang, X.; Van Nhat Anh, T. High Aspect Ratio >10 TSV Design and Integration Challenges and Solutions for the Multi Memory Stacking. In Proceedings of the 2024 IEEE 26th Electronics Packaging Technology Conference (EPTC), Singapore, 3 December 2024; IEEE: New York, NY, USA, 2024; pp. 135–138. [Google Scholar]
  96. Li, K.; Deng, B.; Zhang, H.; Yu, F.; Xue, Y.; Xie, C.; Ye, T.; Xiao, T. Comprehensive Characterization of TSV Etching Performance with Phase-Contrast X-Ray Microtomography. J. Synchrotron Radiat. 2020, 27, 1023–1032. [Google Scholar] [CrossRef] [Scilit]
  97. Holler, M.; Guizar-Sicairos, M.; Tsai, E.H.R.; Dinapoli, R.; Müller, E.; Bunk, O.; Raabe, J.; Aeppli, G. High-Resolution Non-Destructive Three-Dimensional Imaging of Integrated Circuits. Nature 2017, 543, 402–406. [Google Scholar] [CrossRef] [Scilit]
  98. Holler, M.; Odstrcil, M.; Guizar-Sicairos, M.; Lebugle, M.; Müller, E.; Finizio, S.; Tinti, G.; David, C.; Zusman, J.; Unglaub, W.; et al. Three-Dimensional Imaging of Integrated Circuits with Macro- to Nanoscale Zoom. Nat. Electron. 2019, 2, 464–470. [Google Scholar] [CrossRef] [Scilit]
  99. Holler, M.; Guizar-Sicairos, M.; Raabe, J. State-of-the-Art High-Resolution 3D X-Ray Microscopy for Imaging of Integrated Circuits. EDFA Tech. Artic. 2021, 23, 13–19. [Google Scholar] [CrossRef] [Scilit]
  100. Shimomura, K.; Hirose, M.; Takahashi, Y. Multislice Imaging of Integrated Circuits by Precession X-Ray Ptychography. Acta Crystallogr. A Found. Adv. 2018, 74, 66–70. [Google Scholar] [CrossRef] [Scilit] [PubMed]
  101. Kang, I.; Wu, Z.; Jiang, Y.; Yao, Y.; Deng, J.; Klug, J.; Vogt, S.; Barbastathis, G. Attentional Ptycho-Tomography (APT) for Three-Dimensional Nanoscale X-Ray Imaging with Minimal Data Acquisition and Computation Time. Light. Sci. Appl. 2023, 12, 31. [Google Scholar] [CrossRef] [Scilit]
  102. Kang, I.; Yao, Y.; Deng, J.; Klug, J.; Vogt, S.; Honig, S.; Barbastathis, G. Three-Dimensional Reconstruction of Integrated Circuits by Single-Angle X-Ray Ptychography with Machine Learning. In Proceedings of the OSA Imaging and Applied Optics Congress 2021 (3D, COSI, DH, ISA, pcAOP); Optica Publishing Group: Washington, DC, USA, 2021; p. CTu6A.4. [Google Scholar]
  103. Guan, Z.; Tsai, E.; Huang, X.; Yager, K.; Qin, H. PtychoNet: Fast and High Quality Phase Retrieval for Ptychography. In Proceedings of the 30th British Machine Vision Conference (BMVC 2019), Cardiff, UK, 9–12 September 2019. [Google Scholar]
  104. Kang, I.; Jiang, Y.; Holler, M.; Guizar-Sicairos, M.; Levi, A.F.J.; Klug, J.; Vogt, S.; Barbastathis, G. Accelerated Deep Self-Supervised Ptycho-Laminography for Three-Dimensional Nanoscale Imaging of Integrated Circuits. Optica 2023, 10, 1000. [Google Scholar] [CrossRef] [Scilit]
  105. Pan, X.; Wang, S.; Zhou, Z.; Zhou, L.; Liu, P.; Li, C.; Wang, W.; Zhang, C.; Dong, Y.; Zhang, Y. An Efficient Ptychography Reconstruction Strategy through Fine-Tuning of Large Pre-Trained Deep Learning Model. iScience 2023, 26, 108420. [Google Scholar] [CrossRef] [Scilit]
  106. Nakahata, R.; Zaman, S.; Zhang, M.; Lu, F.; Chiu, K. PtychoFormer: A Transformer-Based Model for Ptychographic Phase Retrieval. arXiv 2024, arXiv:2410.17377. [Google Scholar]
  107. Masteghin, M.G.; Gervais, T.; Clowes, S.K.; Cox, D.C.; Zelyk, V.; Pattammattel, A.; Chu, Y.S.; Kolev, N.; Stock, T.J.Z.; Curson, N.J.; et al. Benchmarking of X-Ray Fluorescence Microscopy with Ion Beam Implanted Samples Showing Detection Sensitivity of Hundreds of Atoms. Small Methods 2024, 8, 2301610. [Google Scholar] [CrossRef] [Scilit] [PubMed]
  108. An, S.; Krapohl, D.; Norlin, B.; Thungström, G. Full-Field X-Ray Fluorescence Imaging with a Straight Polycapillary X-Ray Collimator. J. Instrum. 2020, 15, P12033. [Google Scholar] [CrossRef] [Scilit]
  109. Sun, S.; Chen, Z.; Liu, Y.; Ouyang, X.; Li, X. Characterization of a Large-Area Full-Field X-Ray Fluorescence Imaging System Based on a Commercial Full-Frame CMOS Camera. J. Instrum. 2021, 16, P10031. [Google Scholar] [CrossRef] [Scilit]
  110. Soltau, J.; Meyer, P.; Hartmann, R.; Strüder, L.; Soltau, H.; Salditt, T. Full-Field x-Ray Fluorescence Imaging Using a Fresnel Zone Plate Coded Aperture. Optica 2023, 10, 127. [Google Scholar] [CrossRef] [Scilit]
  111. Wang, X.; Liao, S.; Chen, L.; Li, J.; Chen, L.; Hei, D. A Compact, Low-Power Total Reflection X-Ray Fluorescence (TXRF) Spectrometer Designed for Surface Metal Contamination Analysis of Silicon Wafers. Spectrochim. Acta Part B At. Spectrosc. 2026, 235, 107388. [Google Scholar] [CrossRef] [Scilit]
  112. Staeck, S.; Kayser, Y.; Baumann, J.; Jonas, A.; Mantouvalou, I.; Hartmann, R.; Kanngießer, B.; Stiel, H. Towards Soft X-Ray Fluorescence Measurements in the Laboratory Using a Laser-Produced Plasma Source and a Complementary Metal-Oxide Semiconductor Detector. J. Instrum. 2021, 16, P03033. [Google Scholar] [CrossRef] [Scilit]
  113. Yim, V.; Mukhtarov, A.; Drogue, N.; Autillo, D.; Lardin, T.; Zussy, M.; Dechamp, J.; Truffier-Boutry, D. TXRF Capability of Metallic Contamination Analysis on Rough Silicon Wafers. J. Mater. Res. 2024, 39, 2522–2530. [Google Scholar] [CrossRef] [Scilit]
  114. Rotella, H.; Caby, B.; Ménesguen, Y.; Mazel, Y.; Valla, A.; Ingerle, D.; Detlefs, B.; Lépy, M.-C.; Novikova, A.; Rodriguez, G.; et al. Elemental Depth Profiling in Transparent Conducting Oxide Thin Film by X-Ray Reflectivity and Grazing Incidence X-Ray Fluorescence Combined Analysis. Spectrochim. Acta Part B At. Spectrosc. 2017, 135, 22–28. [Google Scholar] [CrossRef] [Scilit]
  115. Melhem, S. Reference-Free Combined Analysis GIXRF-XRR for the Characterization of Thin Film Materials and Uncertainties Calculation. Ph.D. Thesis, Université Paris-Saclay, Orsay, France, 2023. [Google Scholar]
  116. Horiba, K.; Kamakura, N.; Yamamoto, K.; Kobayashi, K.; Shin, S. A High-Resolution Angle-Resolved Photoemission Spectrometer Combined with Laser Molecular-Beam Epitaxy at SPring-8 BL17SU. J. Electron. Spectrosc. Relat. Phenom. 2005, 144–147, 1027–1030. [Google Scholar] [CrossRef] [Scilit]
  117. Szczepanik-Ciba, M.; Sobol, T.; Szade, J. PHELIX—A New Soft X-Ray Spectroscopy Beamline at SOLARIS Synchrotron. Nucl. Instrum. Methods Phys. Res. Sect. B Beam Interact. Mater. At. 2021, 492, 49–55. [Google Scholar] [CrossRef] [Scilit]
  118. Muro, T.; Senba, Y.; Ohashi, H.; Ohkochi, T.; Matsushita, T.; Kinoshita, T.; Shin, S. Soft X-Ray ARPES for Three-Dimensional Crystals in the Micrometre Region. J. Synchrotron Radiat. 2021, 28, 1631–1638. [Google Scholar] [CrossRef] [Scilit] [PubMed]
  119. Yamagami, K.; Yokoyama, Y.; Sumiya, Y.; Shouno, H.; Nakamura, T.; Mizumaki, M. Development of Ultra-High Efficiency Soft X-Ray Angle-Resolved Photoemission Spectroscopy Equipped with Deep Prior-Based Denoising Method. arXiv 2025, arXiv:2511.22909. [Google Scholar]
  120. Spencer, B.F.; Church, S.A.; Thompson, P.; Cant, D.J.H.; Maniyarasu, S.; Theodosiou, A.; Jones, A.N.; Kappers, M.J.; Binks, D.J.; Oliver, R.A.; et al. Characterization of Buried Interfaces Using Ga Kα Hard X-Ray Photoelectron Spectroscopy (HAXPES). Faraday Discuss. 2022, 236, 311–337. [Google Scholar] [CrossRef] [Scilit]
  121. Artyushkova, K.; Mann, J.; Zaccarine, S. Analysis of Thin Films and Buried Interfaces by Soft and Hard X-Ray Photoemission. Microsc. Microanal. 2023, 29, 768. [Google Scholar] [CrossRef] [Scilit]
  122. Thapa, S.; Paudel, R.; Blanchet, M.D.; Gemperline, P.T.; Comes, R.B. Probing Surfaces and Interfaces in Complex Oxide Films via in Situ X-Ray Photoelectron Spectroscopy. J. Mater. Res. 2021, 36, 26–51. [Google Scholar] [CrossRef]
  123. Huang, H.; Zhao, G.; Xing, S.; Mao, B.; Lv, X.; Liu, G.; Li, X.; Yang, W.; Yang, J. Investigation of Band Alignment at Two-Dimensional ReS2/XSe2 (X=W, Mo) Heterojunctions Using x-Ray/Ultraviolet Photoelectron Spectroscopy. Phys. Lett. A 2022, 445, 128241. [Google Scholar] [CrossRef] [Scilit]
  124. Henck, H.; Ben Aziza, Z.; Zill, O.; Pierucci, D.; Naylor, C.H.; Silly, M.G.; Gogneau, N.; Oehler, F.; Collin, S.; Brault, J.; et al. Interface Dipole and Band Bending in the Hybrid p − n Heterojunction MoS2/GaN (0001). Phys. Rev. B 2017, 96, 115312. [Google Scholar] [CrossRef] [Scilit]
  125. Budri, T.; Klatt, J.; Chung, J.; Clubb, A.; Mann, J.; Artyushkova, K. Semiconductor Film Stack Interface Investigation via DSIMS & TOFSIMS Depth Profiling and HAXPES: Yield Enhancement/Learning. In Proceedings of the 2023 34th Annual SEMI Advanced Semiconductor Manufacturing Conference (ASMC), Saratoga Springs, NY, USA, 1 May 2023; IEEE: New York, NY, USA, 2023; pp. 1–3. [Google Scholar]
  126. Conti, G.; Perin Martins, H.; Cordova, I.A.; Ma, J.; Wojtecki, R.J.; Naulleau, P.P.; Nemsak, S. Sub-Nm Depth Characterization of EUV Nanoscale Photoresist Films by Standing-Wave Photoemission Spectroscopy. In Proceedings of the Extreme Ultraviolet Lithography 2020, Online Only, USA, 10 November 2020; Ronse, K.G., Gargini, P.A., Naulleau, P.P., Itani, T., Eds.; SPIE: Bellingham, WA, USA, 2020; p. 15. [Google Scholar]
  127. Conti, G.; Martins, H.P.; Cordova, I.A.; Ma, J.; Wojtecki, R.J.; Naulleau, P.; Nemšák, S. Chemical and Structural Characterization of EUV Photoresists as a Function of Depth by Standing-Wave x-Ray Photoelectron Spectroscopy. J. Micro/Nanopatterning Mater. Metrol. 2021, 20, 034603. [Google Scholar] [CrossRef] [Scilit]
  128. Martin-Concepción, A.I.; Yubero, F.; Espinos, J.P.; Garcia-Lopez, J.; Tougaard, S. Determination of Amount of Substance for Nanometre-thin Deposits: Consistency between XPS, RBS and XRF Quantification. Surf. Interface Anal. 2003, 35, 984–990. [Google Scholar] [CrossRef] [Scilit]
  129. L’Herron, B.; Chao, R.; Kim, K.; Lee, W.T.; Motoyama, K.; Deprospo, B.; Standaert, T.; Gaudiello, J.; Goldberg, C. Hybridization of XRF/XPS and Scatterometry for Cu CMP Process Control. In Proceeding of the Metrology, Inspection, and Process Control for Microlithography XXIX, San Jose, CA, USA, 19 March 2015; Cain, J.P., Sanchez, M.I., Eds.; SPIE: Bellingham, WA, USA, 2015; p. 94241M. [Google Scholar]
  130. Hossain, M.; Subramanian, G.; Triyoso, D.; Wahl, J.; Mcardle, T.; Vaid, A.; Bello, A.F.; Lee, W.T.; Klare, M.; Kwan, M.; et al. XPS-XRF Hybrid Metrology Enabling FDSOI Process. In Proceeding of the Metrology, Inspection, and Process Control for Microlithography XXX, San Jose, CA, USA, 24 March 2016; Sanchez, M.I., Ukraintsev, V.A., Eds.; SPIE: Bellingham, WA, USA, 2016; p. 97780N. [Google Scholar]
  131. Kowalczyk, J.M.D.; Madey, J.M.J. Use of Etendue and Energy Spread to Assess Inverse-Compton X-Ray Sources for Applications. In Proceedings of the High-Brightness Sources and Light-Driven Interactions; OSA: Long Beach, CA, USA, 2016; p. EM1A.1. [Google Scholar]
  132. Turenhout, M.; Mutsaers, P.; Luiten, J. ICS-SAXS: Hard X-Ray Metrology Accelerated by an Inverse Compton Scattering Source. In Proceedings of the International Symposium on Compact Synchrotron X-Ray Sources, Munchen, Germany, 24–26 June 2024. [Google Scholar]
  133. Digraci, P.; Besacier, M.; Gergaud, P.; Rademaker, G.; Rêche, J. Multi-Branch Neural Network for Hybrid Metrology Improvement. In Proceedings of the Metrology, Inspection, and Process Control XXXVI, San Jose, CA, USA, 26 May 2022; Robinson, J.C., Sendelbach, M.J., Eds.; SPIE: Bellingham, WA, USA, 2022; p. 46. [Google Scholar]
  134. Hönicke, P.; Detlefs, B.; Müller, M.; Darlatt, E.; Nolot, E.; Grampeix, H.; Beckhoff, B. Reference-Free, Depth-Dependent Characterization of Nanolayers and Gradient Systems with Advanced Grazing Incidence X-Ray Fluorescence Analysis: Characterization of Nanolayers and Gradient Systems. Phys. Status Solidi A 2015, 212, 523–528. [Google Scholar] [CrossRef] [Scilit]
  135. Nolot, E.; Pessoa, W.; Torrengo, S.; Mazel, Y.; Bernard, M.; Gergaud, P.; Ménesguen, Y.; Lépy, M.C.; Eichert, D. Grazing-Incidence X-Ray Fluorescence Analysis of Thin Chalcogenide Materials Deposited on Bragg Mirrors. Spectrochim. Acta Part B At. Spectrosc. 2020, 168, 105864. [Google Scholar] [CrossRef] [Scilit]
  136. Tiwari, A.; Fallica, R.; Ackermann, M.D.; Makhotkin, I.A. The Interface Study of Photoresist/Underlayer Using Hybrid X-Ray Reflectivity and X-Ray Standing Wave Approach. In Proceedings of the Metrology, Inspection, and Process Control XXXVIII, San Jose, CA, USA, 10 April 2024; Sendelbach, M.J., Schuch, N.G., Eds.; SPIE: Bellingham, WA, USA, 2024; p. 4. [Google Scholar]
  137. Fauquier, L.; Pelissier, B.; Jalabert, D.; Pierre, F.; Hartmann, J.M.; Rozé, F.; Doloy, D.; Le Cunff, D.; Beitia, C.; Baron, T. Benefits of XPS Nanocharacterization for Process Development and Industrial Control of Thin SiGe Channel Layers in Advanced CMOS Technologies. Mater. Sci. Semicond. Process. 2017, 70, 105–110. [Google Scholar] [CrossRef] [Scilit]
  138. Jang, Y.; Choi, D.; Song, J.K.; Lee, S.; Seong, T.; Lee, H.; Seo, S.; Song, C.; Lan, T.; Zhang, J.; et al. Study of Critical Dimension Small-Angle X-Ray Scattering within-Spot Uniformity with Mass Critical Dimension Scanning Electron Microscope and 3D Tomography. J. Micro/Nanopatterning Mater. Metrol. 2025, 24, 034004. [Google Scholar] [CrossRef] [Scilit]
  139. Pasikatan, E.; Antonelli, G.A.; Keller, N.; Kal, S.; Rednor, M.; Tapily, K.; Hetzer, D.; Schaefer, M.; Kuhn, M.; Murakami, S.; et al. Superlattice Effects and Limitations of Non-Destructive Measurement of Advanced Si/Si1−xGex Superlattice Structures Using Mueller Matrix Scatterometry and High-Resolution X-Ray Diffraction. J. Micro/Nanopatterning Mater. Metrol. 2024, 23, 044004. [Google Scholar] [CrossRef] [Scilit]
  140. Deng, B.; Yang, Q.; Xie, H.-L.; Du, G.-H.; Xiao, T.-Q. First X-Ray Fluorescence CT Experimental Results at the SSRF X-Ray Imaging Beamline. Chin. Phys. C 2011, 35, 402–404. [Google Scholar] [CrossRef] [Scilit]
  141. Laforce, B.; Masschaele, B.; Boone, M.N.; Schaubroeck, D.; Dierick, M.; Vekemans, B.; Walgraeve, C.; Janssen, C.; Cnudde, V.; Van Hoorebeke, L.; et al. Integrated Three-Dimensional Microanalysis Combining X-Ray Microtomography and X-Ray Fluorescence Methodologies. Anal. Chem. 2017, 89, 10617–10624. [Google Scholar] [CrossRef] [Scilit] [PubMed]
  142. Mandot, S.; Zannoni, E.M.; Cai, L.; Nie, X.; Rivière, P.J.L.; Wilson, M.D.; Meng, L.J. A High-Sensitivity Benchtop X-Ray Fluorescence Emission Tomography (XFET) System With a Full-Ring of X-Ray Imaging-Spectrometers and a Compound-Eye Collimation Aperture. IEEE Trans. Med. Imaging 2024, 43, 1782–1791. [Google Scholar] [CrossRef] [Scilit] [PubMed]
Figure 1. XRR analysis of ~25 nm PEALD HfO2 films. Measured and simulated XRR angular scans on (a) Si and (b) GaN [58]. Adapted from Paul, P.; Brusaterra, E., J. Vac. Sci. Technol. A (2025), under the Creative Commons Attribution (CC BY) license.
Crystals 16 00265 g001
Figure 2. XRR investigation of irradiation-induced structural changes in TiO2−X/Pt heterostructures. (a) Reflectivity curves shift systematically with increasing Ar+ fluence, indicating variations in average electron density. (b) Reconstructed electron density profiles reveal a surface-enriched Ti layer and a subsurface region of reduced density, attributed to oxygen vacancy formation. (c) Magnified view of the near-surface region (circled (saffron colored) area in (b)). The results establish a direct link between oxygen deficiency and conductive filament formation in resistive switching devices [59]. Reprinted with permission from Barman and Saini, Appl. Phys. Lett. 108, 244101 (2016). Copyright 2016 AIP Publishing LLC.
Crystals 16 00265 g002
Figure 3. Several typical configurations of X-ray imaging. (a) SR-micro CT. (b) Lab-micro CT. (c) TXM. (d) CL. (e) CDI. (f) ptychography. The green arrow indicates parallel X-ray beam.
Crystals 16 00265 g003
Figure 4. CT reconstruction with and without phase retrieval. (a) A slice reconstructed directly from the unprocessed projections. (b) A histogram of (a). (c) A slice reconstructed from projections with phase retrieval. (d) A histogram of (c). (e) Three-dimensional visualization of TSV etching. Different colors are used to distinguish vias from one another [96]. Reproduced from Li et al. J. Synchrotron Rad. 27, 1023–1032 (2020), with permission of the International Union of Crystallography.
Crystals 16 00265 g004
Figure 5. Precession X-ray ptychography for depth-resolved imaging of stacked circuits. (a) Schematic of precession X-ray ptychography experiment. The sample was composed of two circuits, which were stacked with a gap of ~1.4 mm. The incident X-ray angle was controlled by adjusting a two-axis rotational stage, where φ and ω are the horizontal and vertical tilt angles, respectively (The arrows indicate the translation (zigzag arrow) and tilt (curve arrow) scanning of the sample). (bc) Top views of the sample and (c) the X-ray-irradiated position is indicated by the yellow arrow. (d) Reconstructed phase images of the two-layered (red and green) circuit by precession 3PIE [100]. Adapted from Shimomura et al. Acta Cryst. A74, 66–70 (2018) with permission of the International Union of Crystallography.
Crystals 16 00265 g005
Figure 6. Two typical configurations of XRF. (a) μ-XRF. (b) TXRF. The green arrow indicates the direction of the beam.
Crystals 16 00265 g006
Figure 7. Standing-wave XPS (SW-XPS) for sub-nm depth profiling of EUV photoresist stacks. (a) Experimental setup: a standing wave is generated by Bragg reflection from a multilayer mirror; varying the incident angle shifts the wave antinodes vertically through the sample. (b) Experimental and simulated rocking curves for an e-beam exposed self-assembled monolayer (SAM). (c) Concentration depth profiles reveal an interface roughness of only 0.2 nm between the SAM and Al2O3 substrate, and quantify interdiffusion lengths, demonstrating SW-XPS’s unique capability for non-destructive chemical depth profiling at the atomic scale [126]. Reproduced from Conti et al. [126], Proc. SPIE 11517, 115170B (2020), with permission from SPIE and the authors.
Crystals 16 00265 g007
Table 1. Representative X-ray techniques for key challenges in semiconductor manufacturing and advanced packaging.
ChallengesTechniquesFilmHigh-Aspect-RatioSee-Through/Backside-Relevant InspectionWafer/Die
Information
Structural CharacterizationXRD-based, SAXS-based,
XRR
XRD for multilayer strain and crystalline quality; GISAXS for periodic morphology of nanostructured films;
XRR for thickness/roughness
SAXS for profile, tilt, sidewall reconstruction, and LWR/LER metrology;μ-XRD for buried strain fields and buried crystalline distortionμ-XRD and XRDI for strain, warpage-related stress, and die-level crystallographic non-uniformity
Morphology
Characterization
CT/CL, TXM, PXCTLimited roleCT/CL trench, hole, edge, and via geometry;
PXCT for nanoscale 3D reconstruction
CT/TXM/PXCT for buried cavities, residues, voids, TSVs, hybrid-bond defects, post-thinning defects, and backside metal inspectionCT/CL mainly for post-bonding internal defects rather than primary geometry metrology
Compositional CharacterizationXRF-based, XPS-basedGIXRF for elemental depth profiles;
HAXPES/SW-XPS for interface chemistry and band alignment
GIXRF or TXRF for buried coatings or composition-sensitive casesHAXPES for buried interfaces and residues;
XRF-based approaches for buried elemental heterogeneity
TXRF for wafer contamination;
full-field XRF for large-area elemental non-uniformity
Table 2. Comparison of X-ray diffraction techniques for strain and defect characterization.
TechniquesMain AdvantagesMain LimitationsTypical Applications
Statistics XRDHigh accuracy, reliable quantificationNo spatial distribution informationMainly Film
Monochromatic Microbeam Scanning XRDHigh spatial resolution, capable of mappingTime-consuming scanning, limited depth informationFilm, wafers, and see-through structures
White Beam Laue DiffractionMultiple diffraction spots in single exposure, suitable for polycrystalsComplex data analysisHAR and see-through structures
XRDILarge area, fast imagingLimited quantification capabilityWafers and device-scale
BCDI and Bragg PtychographyNanoscale resolution, direct reconstruction of displacement fieldsRequires coherent source, demanding sample requirementsBuried nanostructures
3DXRD/DCTStrong statistical capability for polycrystalsLower resolution compared to coherent methodsPolycrystalline metal layers
Table 3. Comparison of methods for HAR profile metrology.
TechniqueAdvantagesLimitations
CD-SAXS (Transmission)Highly sensitive to HAR structuresRequires high throughout
GI-SAXSSensitive to surface/interface & LER/LWRLimited depth sensitivity; complex modeling
SEMFast top-view CD & edge imagingMainly surface sensitivity
TEM (cross-section)Direct real-space structureDestructive, limited statistics
AFM/3D-AFMHigh-resolution surface topography & roughnessLimited depth sensitivity; slow
X-ray CT3D density distributionResolution insufficient for nanoscale CD
Table 4. Capability comparison of representative see-through X-ray imaging methods.
MetricCTCLTXMPXCT/PyXLMultislice Ptychography
Typical resolutionμm to sub-μmμm to sub-μm~30–50 nm~10 nm~10 nm
sample compatibilityhighmainly for planar samplesmoderatemoderate, more demandingmoderate, favorable for layered planar samples
Contrast mechanismmainly absorptionabsorptionabsorption/phasephase retrievalphase reconstruction with depth separation
Dose burdenlowmoderatemoderatehighhigh
maturityhighesthighmoderate to highresearch-stageresearch-stage
Best-suited roleroutine buried-defect inspectionflat-chip/package 3D inspectionhigher-resolution local 3D imagingultimate nanoscale non-destructive 3D reconstructionnanoscale layer separation
Table 5. Comparison of X-ray methods for film and near-surface distribution characterization.
TechniqueApplicationStrengthLimitation
XRRThickness, density, interface roughnessSub-nm roughnessModel-dependent; limited lateral information
GI-SAXSSurface morphology, lateral roughness, nanostructure shapeIn-plane morphology and nanoscale correlationLess direct for absolute thickness
μ-XRFElemental analysisQuantitative; lateral compositional mapping over large areas, μm-mm depthDepth sensitivity indirect
GIXRFElemental depth distributionElement-specific depth sensitivityRequires modeling and usually structural constraints
XPSSurface chemistry, bonding state, band alignmentDirect sensitivity to chemical-state and electronic structureOnly a few nm information depth
HAXPES/SW-XPSBuried interface chemistry or depth-selective analysisExtends XPS to buried or sub-nm depth resolutionMore specialized and experimentally demanding
Table 6. X-ray source characteristics and radiation for different techniques.
TechniqueSource TypeRadiation RequirementEnergy/Tube VoltageBeam SizeRadiation Damage Consideration
XRDLaboratory & SynchrotronMonochromatic~8 keV (mainly Cu Kα1)mm-µm (lab); sub-µm (sync)Generally low, Higher for scanning and white light measurements
SAXSLaboratory (LMJ & rotating anode) & SynchrotronMonochromatic8–17 keV (Cu/Mo/W Kα1)µmHigher flux and energy typically required
XRRLaboratory & SynchrotronMonochromatic~8 keV (mainly Cu Kα1)µmGrazing-incidence geometry more radiation-tolerant
XRFMainly LaboratoryTypically, polychromatic or filtered~50 kV (tube voltage)mmGenerally low
XPSLaboratory (LMJ) & SynchrotronMonochromatic~1.49 keV(mainly Al Kα1)
higher for HAXPES (Cr Kα1, Ga Kα1, SR)
mm-µmSurface damage possible
CT/TXMMainly LaboratoryPolychromaticup to ~130–160 kV (tube voltage)µm-nmGenerally low, higher in high-resolution scans
PXCTSynchrotron (coherent beam)Monochromatic (coherence more critical)5~10 keV (typically 6)nmHigh dose due to focused beam and long scanning acquisition
Disclaimer/Publisher’s Note: The statements, opinions and data contained in all publications are solely those of the individual author(s) and contributor(s) and not of MDPI and/or the editor(s). MDPI and/or the editor(s) disclaim responsibility for any injury to people or property resulting from any ideas, methods, instructions or products referred to in the content.