1. Introduction
Crystallization is a critical separation and purification step widely employed in the pharmaceutical, fine chemical, and food industries [
1]. In these applications, precise control of crystal size is essential, as it directly influences the efficiency of downstream operations such as filtration, washing, and drying, as well as critical quality attributes including bioavailability and flowability [
2,
3]. Seeded batch cooling crystallization is commonly used to enhance process consistency [
4], as the introduction of seed crystals provides a controlled starting point compared to the stochastic nature of primary nucleation [
5]. However, despite controlled initialization, batch crystallization processes remain prone to batch-to-batch variability [
6]. The complex, nonlinear dynamics of crystallization [
7], combined with operational uncertainties and thermal lag between reactor and jacket temperatures often lead to deviations in the final crystal size distribution [
8].
The shift toward a Quality by Design (QbD) framework in pharmaceutical and fine chemical manufacturing has moved process development away from identifying isolated optimal points and toward defining a reliable, well-characterized design space [
9,
10]. Design of Experiments (DoE) has been the conventional tool for this purpose, offering systematic, statistically rigorous exploration of process variables and their interactions [
11]. However, DoE is fundamentally endpoint-oriented, and this limitation becomes particularly consequential in batch crystallization, where cooling trajectory plays a decisive role: small deviations in cooling rate during early stages can disproportionately influence nucleation kinetics and, consequently, the final crystal size distribution. While time-dependent factors can in principle be incorporated through trajectory parameterization [
12], the resulting increase in dimensionality substantially raises the experimental cost [
13], making comprehensive design space exploration impractical.
Population Balance Models (PBMs) provide a mechanistic alternative, offering detailed phenomenological descriptions of nucleation, growth [
14], and agglomeration phenomena [
15]. However, their practical application requires estimation of system-specific kinetic parameters that are often difficult to obtain with sufficient accuracy [
16]. Beyond parameter estimation, PBMs are commonly applied within deterministic optimization frameworks. The computational cost of solving the governing differential equations makes large-scale stochastic analyses, such as Monte Carlo robustness evaluation computationally expensive during optimization [
17]. As a result, PBM-based strategies frequently converge toward mathematically optimal but operationally fragile solutions, exhibiting limited tolerance to the process variability in industrial systems, including thermal lag [
18].
To overcome the limitations of complex kinetic modeling, data-driven approaches have emerged as effective alternatives for crystallization process modeling [
19,
20]. Recurrent Neural Network (RNN) architectures have been used within model predictive control frameworks to optimize yield and crystal size in batch crystallization, demonstrating the value of dynamic surrogate models for process optimization [
21]. Nevertheless, standard recurrent architectures can struggle with long-range temporal dependencies inherent in multi-stage cooling trajectories. Long Short-Term Memory (LSTM) networks address this limitation directly [
22]. Through their internal gating mechanisms, LSTMs selectively retain and discard information across time steps [
23], enabling accurate mapping between dynamic cooling trajectories and crystallization outcomes without the significant computational burden [
24].
This study builds on an LSTM-based digital twin developed in prior work, which accurately predicted image-derived crystal size distribution metrics (D
10, D
50, D
90) and particle counts using engineered features describing process dynamics alongside temperature profiles and seed loadings [
22] and extends the predictive framework toward robust process optimization. The millisecond-scale inference time of the LSTM surrogate is a critical enabler of the approach proposed here, as it makes repeated ensemble-based stochastic evaluation within an evolutionary optimization loop computationally feasible.
Gradient-based optimization methods have been widely applied in process control [
25]. However, they tend to converge on local optima within the highly nonlinear, non-convex objective functions characteristic of batch crystallization [
26]. Metaheuristic algorithms, including Genetic Algorithms (GAs) and Particle Swarm Optimization (PSO), are therefore commonly employed due to their ability to perform global searches without requiring gradient information [
27,
28]. These approaches handle naturally the mixed discrete-continuous decision variables typical of crystallization procedures, such as seed loadings and multi-stage cooling profiles [
29]. Nevertheless, conventional metaheuristics evaluate candidate solutions under a single, static simulation [
30], producing optima that are mathematically favorable but sensitive to perturbations. Such solutions may perform well in silico yet fail to maintain target specifications under the variability encountered in real operations [
31].
Recent work has begun to address this robustness gap. Torraca et al. [
32] proposed a deep reinforcement learning framework for crystallization control that embeds progressive uncertainty scaling directly into the training procedure, demonstrating improved robustness against parametric uncertainty and measurement noise. Similarly, robust optimization approaches combining Monte Carlo uncertainty propagation with PSO have been applied to batch crystallization to account for seed loading variability, minimizing the variance of CSD outcomes across stochastic ensembles [
33]. While these contributions represent meaningful advances, reinforcement learning approaches require extensive iterative interaction with a process simulator during training, which limits practicality. PSO-based approaches combined with PBMs inherit the computational limitations of kinetic model evaluation. Furthermore, neither approach has been validated experimentally across multiple target crystal size specifications. A framework that combines the predictive speed of a data-driven surrogate with rigorous stochastic robustness enforcement during evolutionary optimization, and that is validated experimentally across a range of target specifications, remains an open need in the field.
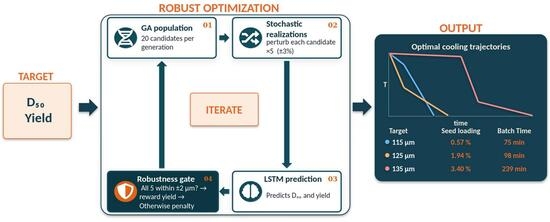
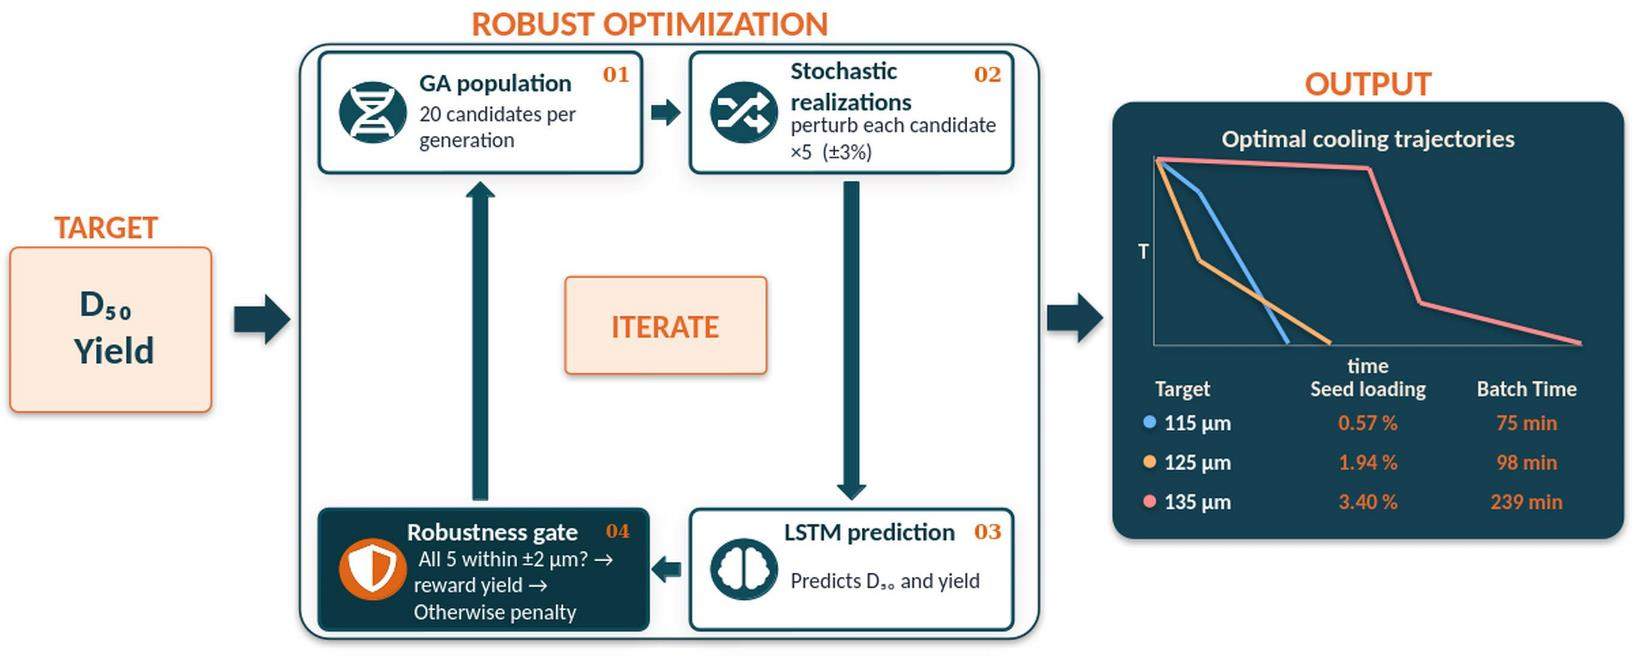
To address this gap, this study proposes a Robustness-Aware Genetic Algorithm (RAGA) framework that explicitly incorporates process uncertainty into the optimization procedure. Each crystallization procedure is evaluated under five independent stochastic realizations, with process parameters perturbed randomly within defined uncertainty bounds. Robustness is enforced as a strict criterion. A candidate crystallization procedure is promoted in the evolutionary search only if all five perturbed evaluations produce a predicted D
50 within ±2 µm of the target value. Candidates failing this criterion are penalized in the fitness function regardless of their nominal performance. This conservative gate biases selection toward trajectories with stable behavior across perturbations, in line with the specification of Critical Quality Attributes (CQAs), where deviations outside specified limits are considered unacceptable. A hierarchical fitness function is employed to strictly enforce the target D
50 as the primary constraint; candidates are considered feasible only when the size specification is met. Once feasibility is established, the algorithm maximizes process yield as a secondary objective [
34], directly reflecting the industrial priority of meeting quality specifications before maximizing yield.
The RAGA framework is applied to the seeded cooling crystallization of creatine monohydrate across three target D50 values of 115, 125, and 135 µm to evaluate its performance. Following identification of optimal crystallization procedures for each target, robustness is independently verified through Monte Carlo simulation using 100 runs. Random perturbations within ±10% are applied to total batch time, transition temperatures, and time fractions, with success defined as D50 remaining within ±5 µm of the target. This tolerance reflects realistic batch acceptance criteria. Optimized crystallization procedures are subsequently validated experimentally at laboratory scale for each target size. Experimental validation confirmed that two of three optimized procedures achieved D50 within the ±5 µm acceptance criterion. Together, these elements form an integrated framework connecting dynamic process modeling, conservative robustness-aware evolutionary optimization, and experimental validation. Broader generality across different crystallization systems and operating scales remains to be established empirically and is identified as a direction for future work.
While the primary aim of this work is robust process optimization, the framework also produced a notable secondary outcome. Operating entirely on data-driven predictions without embedded crystallization theory, the RAGA converged on strategies that align with well-established crystallization principles. These included low seed loading combined with fast cooling for smaller crystals, and high seed loading with extended low supersaturation holds for larger ones. The model achieved this even though supersaturation was never provided as an input feature. This consistency between the optimizer’s strategies and known supersaturation-management principles suggests that the LSTM surrogate captured the relevant input-output dynamics of the system from the available training data. A definitive interpretation, however, would require additional studies across different crystallization systems.
2. Materials and Methods
2.1. Experimental System and Materials
Creatine monohydrate (Polleo Sport, Zagreb, Croatia) and deionized water were selected as the model system for this study. Creatine monohydrate exhibits temperature-dependent solubility in aqueous solution, making it a suitable and reproducible model compound for investigating cooling crystallization dynamics [
35]. From a practical standpoint, creatine monohydrate is an industrially relevant active ingredient widely used in sports nutrition formulations, providing direct motivation for the development of reliable crystallization control strategies for this compound. Creatine monohydrate crystallizes from aqueous solution in a monoclinic prism morphology, with each creatine molecule incorporating a water molecule into the crystalline lattice to form the characteristic monohydrate structure [
36].
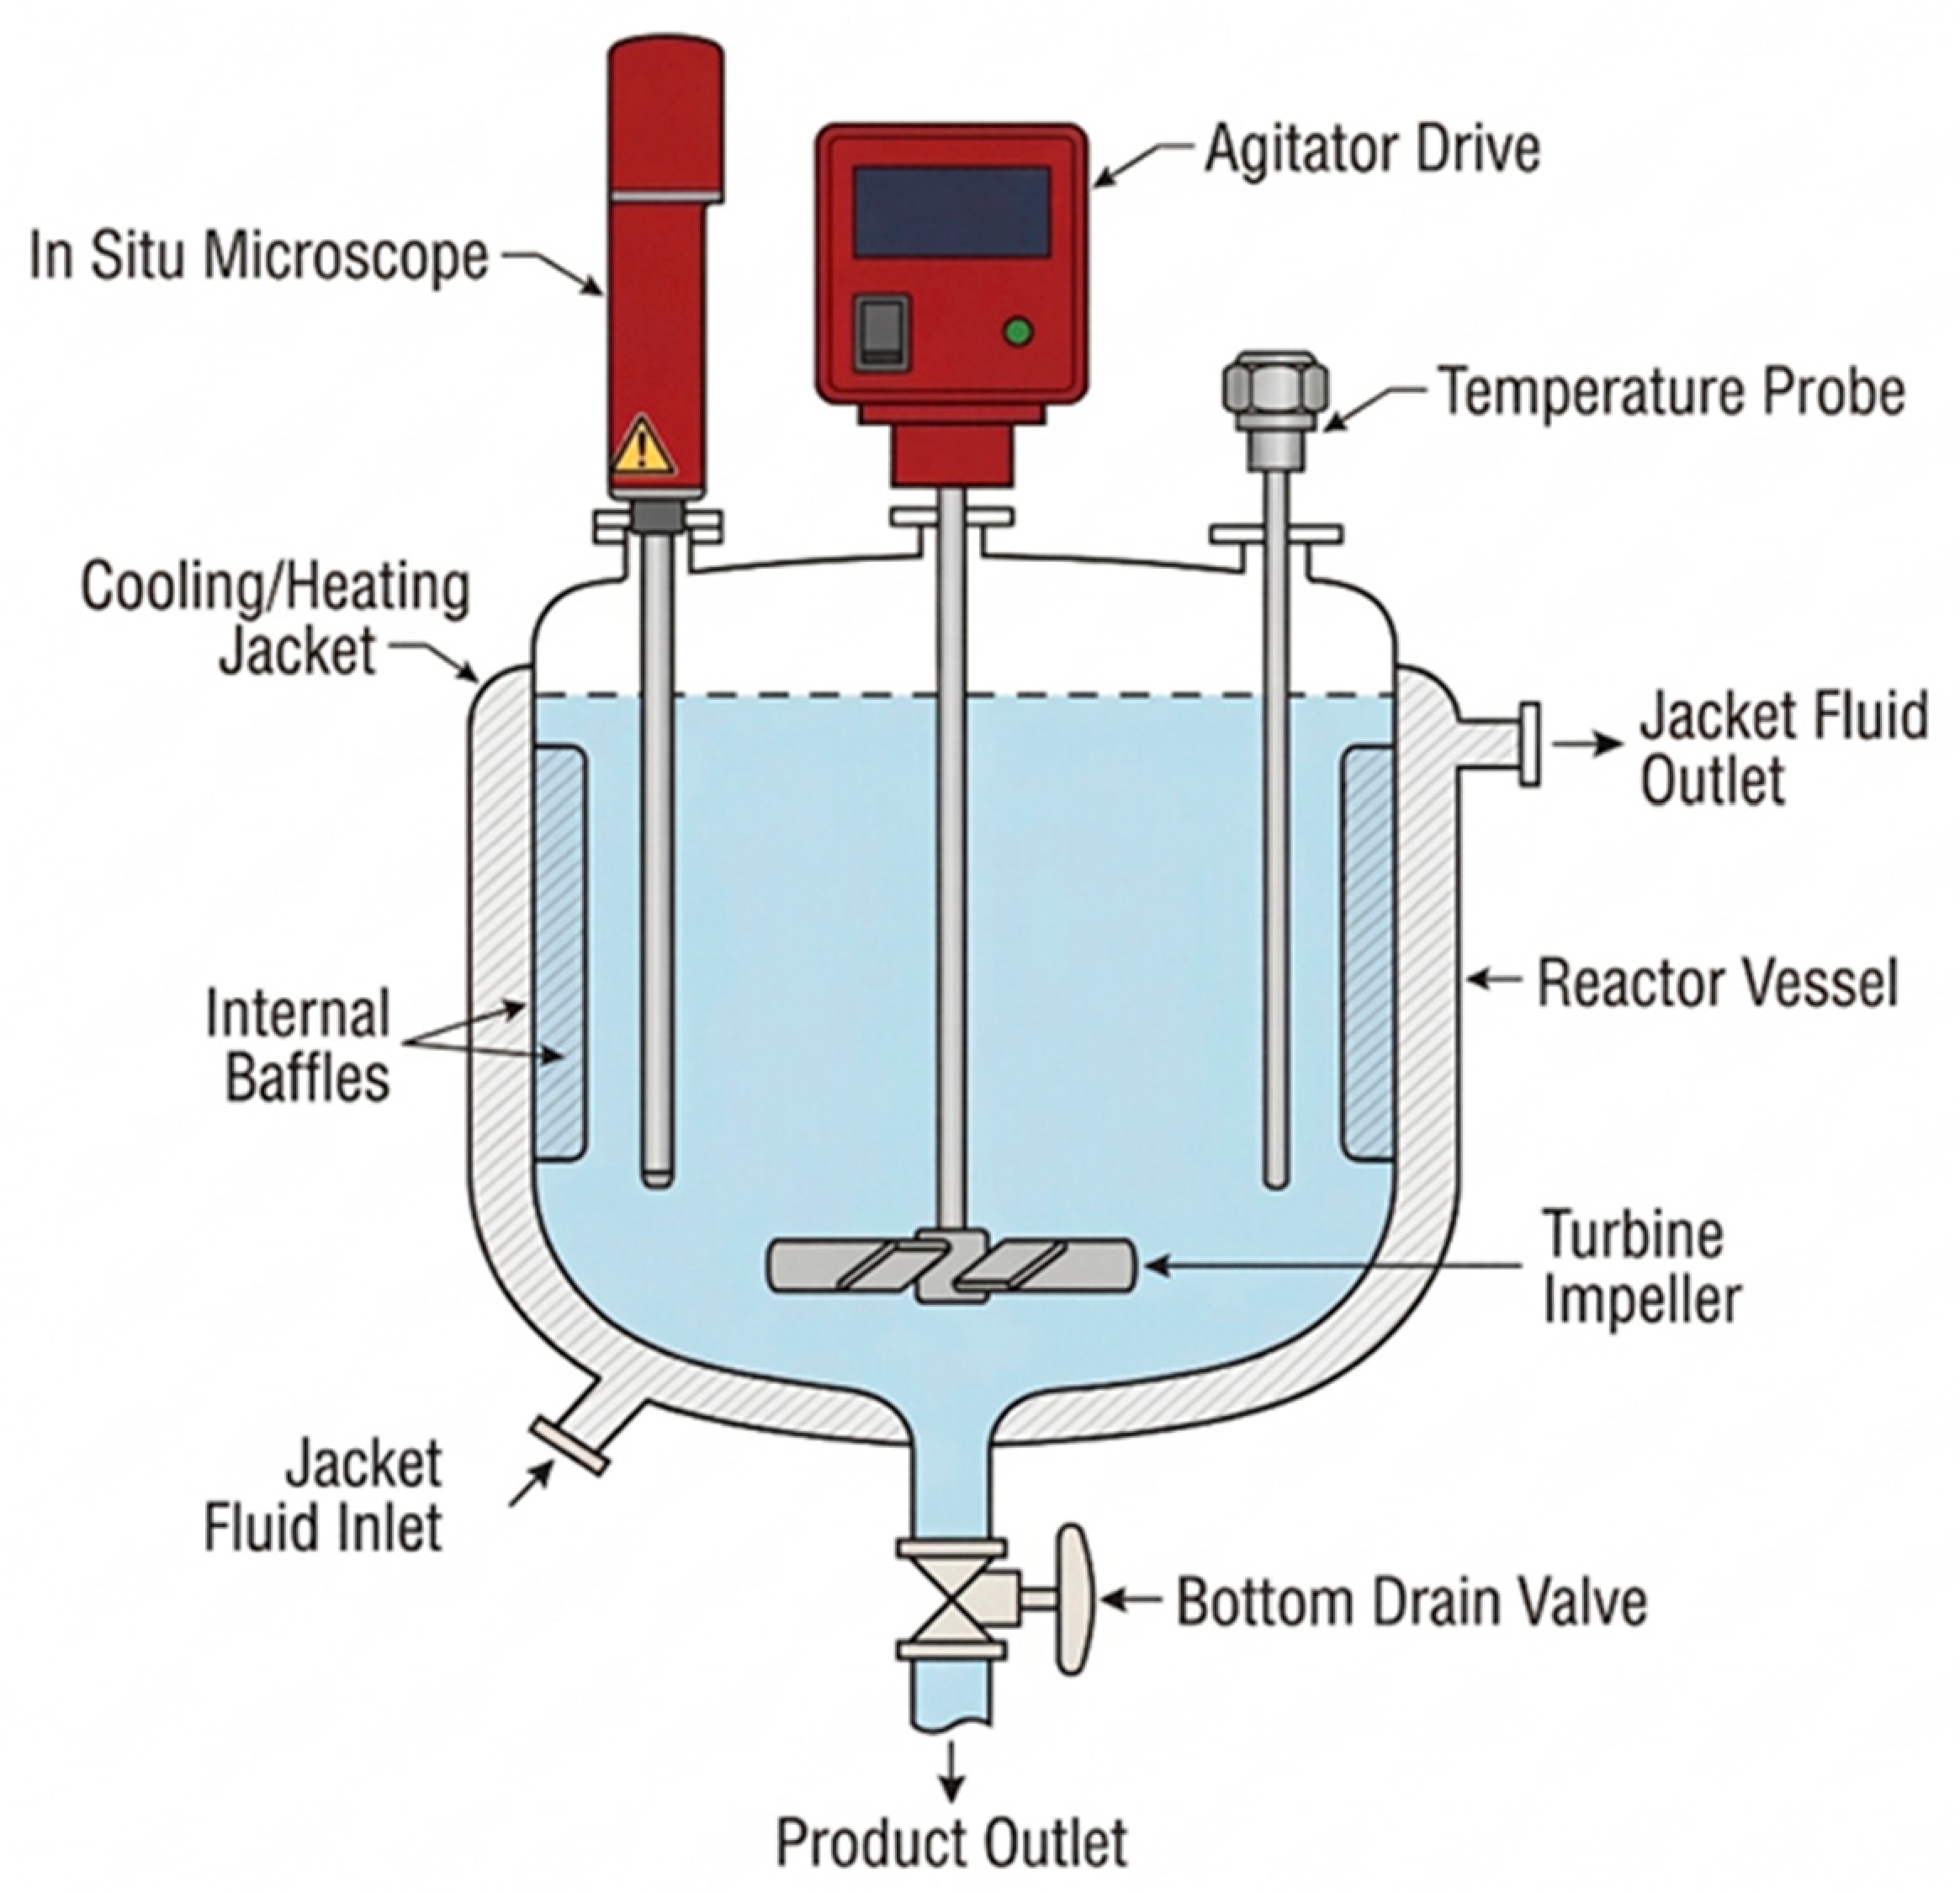
All crystallization experiments were carried out in a jacketed 500 mL glass crystallizer (HWS Labortechnik, Mainz, Germany) (
Figure 1) equipped with four flat baffles and a Rushton turbine agitator (3D printed). The baffled geometry combined with the Rushton turbine ensured uniform particle suspension and homogeneous distribution of crystals throughout the crystallizer volume, which is critical for representative in situ measurements. Agitation was maintained at a constant rate of 300 rpm using a precision stirrer (Heidolph Hei-TORQUE 100, Schwabach, Germany). Temperature control was achieved using a thermostat (Julabo Maggio MS-1000F, Seelbach, Germany), with temperature measurements recorded continuously via a PTFE-encapsulated Pt-100 sensor (BOLA, Grünsfeld, Germany).
Real-time monitoring of the crystallization process was performed using an in situ microscope (Blaze Metrics LCC Blaze 900 Micro, Bothell, WA, USA), immersed directly in the crystallizer, enabling continuous non-invasive measurement of the crystal population without process interruption or sampling-induced disturbances [
37,
38]. The instrument recorded image-derived chord length distribution (ID-CLD) metrics at 5-s intervals throughout each batch. The monitored metrics included D
50 and particle count, providing high-resolution data on crystal size evolution and crystallization dynamics throughout the batch. These measurements served as the primary output variables for digital twin training, model validation, and experimental assessment of the optimized crystallization trajectories.
2.2. LSTM-Based Digital Twin
The LSTM-based digital twin employed in this study was developed and validated as part of our previous work [
22], to which the reader is referred for full details of the training methodology, dataset, and hyperparameter optimization. Briefly, the model was implemented in Python 3.11 using the PyTorch 2.0 framework [
39]. It was trained on experimental batch crystallization data to predict image-derived crystal size distribution metrics (D
10, D
50, D
90) and particle count from cooling profile and seed loading conditions, without requiring real-time supersaturation measurements or explicit kinetic knowledge. The employed architecture comprised 96 hidden units, 2 stacked LSTM layers, and a 60-step input lag window, with all input and output variables normalized to [0, 1] using a MinMax scaler. The LSTM architecture was selected for its ability to capture the long-range temporal dependencies inherent in multi-stage batch cooling profiles, where cumulative thermal history determines the final crystal size distribution.
The model was trained on 11 experimental runs that captured the key process dynamics across the investigated range of seed loadings and cooling profiles. Each run was selected to maximize information content with respect to the relationship between cooling trajectory, seed loading, and final crystal size distribution. The framework was developed to operate on simple, routinely available process data (temperature profiles, seed loading, and image-derived crystal size measurements) without requiring real-time solute concentration measurement. This design choice broadens applicability to systems for which in-situ concentration measurement is unavailable or impractical.
The predictive performance of the model was independently evaluated on four test experiments with seed loadings and cooling profiles not included in the training dataset. Across the test set, the model achieved a median absolute error for D50 ranging from 1.42 to 8.31 µm depending on the complexity of the cooling conditions.
The trained surrogate performs predictions at millisecond-scale inference times, making it computationally practical to evaluate thousands of crystallization procedures within the optimization loop. This speed is a critical enabler of the RAGA framework, as it allows repeated stochastic ensemble evaluation of each candidate solution without the significant computational burden.
2.3. Robustness-Aware Genetic Algorithm (RAGA)
The optimization framework integrates the LSTM digital twin within a Robustness-Aware Genetic Algorithm to identify seed loading and cooling trajectories resistant to process noise and operational variability. The RAGA framework is built around two key elements: a hierarchical objective structure and an embedded stochastic robustness gate. The primary objective is the target median crystal size D50, while the secondary objective is process yield approximated by particle count. This priority structure reflects standard industrial practice, where crystal size is a critical quality attribute that must be met unconditionally, while yield is an operational parameter that drives process economics. The embedded stochastic robustness gate ensures that only crystallization procedures capable of consistently delivering the target crystal size under realistic process variability are promoted during the evolutionary search.
The implementation utilizes PyGAD 3.3.1 [
40] for the evolutionary search, NumPy 2.0.2 [
41] and Pandas 2.2.2 [
42] for stochastic data handling.
2.3.1. Crystallization Procedure Parameterization
The seed loading and cooling trajectory were parameterized using six continuous decision variables: total batch time, seed loading, two intermediate transition temperatures, and two fractional time points defining when temperature transitions occur within the batch. The cooling profile was constructed by linear interpolation between the seeding temperature of 50 °C, two intermediate temperatures, and the final temperature of 10 °C, at time points determined by the fractional transition variables. The search space bounds for each decision variable are summarized in
Table 1. This parameterization reflects the practical structure of industrial seeded cooling crystallization procedures while keeping the optimization problem computationally manageable.
2.3.2. Fitness Function and Robustness Gate
The GA employed a hierarchical fitness function where the primary objective is meeting the target D50, and the secondary objective is maximizing process yield quantified by particle count. Candidates failing the D50 constraint received a continuously scaled fitness penalty and were excluded from yield evaluation entirely. Among feasible candidates, yield was rewarded proportionally based on particle count.
The fitness function takes a strict two-tier hierarchical form. A candidate solution was classified as infeasible if the maximum predicted D
50 deviation across the five stochastic perturbations exceeded the ±2 µm acceptance threshold. The fitness assigned to such candidates was:
This continuous inverse-scaling form preserves a non-zero fitness gradient across the entire infeasible region, with the strongest resolution near the feasibility boundary. It provides a sharp gradient that pulls candidates toward the feasible region as they approach the gate, while severe deviations are penalized to near-zero fitness, ensuring they are unambiguously dominated by candidates closer to feasibility. A fixed flat penalty would instead produce a uniform fitness plateau on which the GA has no selection signal, forcing the search to rely solely on random mutation to escape and substantially slowing convergence.
Candidates passing the robustness gate were classified as feasible, and their fitness was driven by the secondary objective of process yield, approximated by the predicted particle count:
The constant offset of 10 enforces the strict two-tier hierarchy. By definition, an infeasible candidate has a worst-case deviation greater than 2 µm, so its maximum attainable fitness is bounded above by 1/(1 + 100 × 2) ≈ 5 × 10⁻³, more than three orders of magnitude below the minimum fitness of any feasible candidate. No infeasible candidate can therefore outrank a feasible one regardless of its yield estimate, and the algorithm strictly prioritizes specification compliance over yield, in line with the industrial priority structure stated in the Introduction. Within the feasible tier, the linear scaling of particle count over 106 keeps fitness on the same order of magnitude as the base offset, so that yield differences between feasible candidates remain a meaningful selection signal without overwhelming the hierarchy.
Robustness was enforced by subjecting each candidate crystallization procedure to five independent stochastic realizations prior to fitness assignment. In each realization, random perturbations were applied to total batch time, transition temperatures, and time fractions, sampled uniformly within ±3% of the nominal values, reflecting typical operational variability in industrial crystallization. Seed loading was deliberately excluded from perturbation, as it is a precisely weighed and controlled input parameter and therefore does not represent a meaningful source of operational variability. A candidate was promoted in the evolutionary search only if all five perturbed evaluations produced a predicted D50 within ±2 µm of the target. This strict criterion ensures that only consistently robust procedures are selected, rather than solutions that perform well only under idealized conditions.
The choice of five in-loop realizations and the ±2 µm gate reflects a deliberate balance between computational cost, statistical screening power, and prediction noise of the LSTM surrogate. Five realizations keep the optimization tractable on standard hardware while requiring consistency across independent stochastic variations. The ±2 µm value is set to roughly 40% of the ±5 µm acceptance criterion used for batch release, providing a safety margin so that candidates passing the internal gate also pass the wider external acceptance window with high probability. It is also of the same order as the LSTM median absolute D
50 error reported on the held-out test set (1.4–8.3 µm), ensuring the gate is not tighter than the prediction noise of the surrogate. The rigorous statistical assessment of robustness is provided by the independent 100-run Monte Carlo verification described in
Section 2.4.
The strict all-pass criterion is a conservative design choice that, by construction, eliminates higher-yield but more fragile candidates. This is consistent with the industrial priority structure: in pharmaceutical manufacturing, deviations from Critical Quality Attributes outside specification are unacceptable, while yield is an economic optimization that becomes meaningful only among feasible candidates. The economic argument itself reinforces this choice. When a Critical Quality Attribute falls even slightly outside specification, the material typically cannot be released and must be reprocessed, which consumes additional batch time, solvent and energy, and incurs further yield losses during recrystallization. The nominal yield advantage of a fragile high-yield procedure is therefore frequently erased once the expected cost of reprocessing is taken into account.
The GA was configured with a population size of 20, running for 40 generations with 10 parents mating per generation and a mutation rate of 20% of genes per solution.
2.4. Monte Carlo Robustness Verification
Following identification of the optimal cooling trajectory for each crystal size target, an independent post-optimization robustness verification was performed through Monte Carlo simulation. One hundred stochastic realizations were generated by applying random perturbations drawn from uniform distributions within ±10% of the nominal values of total batch time, transition temperatures, and time fractions. The ±10% range was selected to envelop the dominant sources of operational variability in laboratory and pilot-scale batch crystallization, including variability in the duration of cooling segments arising from thermal lag. The value is deliberately wider than what would be expected under tight industrial process control to ensure that robustness is demonstrated under elevated rather than nominal variability. Consistent with the optimization stage, seed loading was held fixed at the RAGA-prescribed value during Monte Carlo sampling, as it represents a precisely controlled input parameter. For each realization, the LSTM digital twin predicted the resulting D50, yielding a distribution of predicted outcomes under realistic operational variability. A trajectory was classified as robustly validated if the predicted D50 remained within ±5 µm of the target value. The tolerance window was deliberately wider than the ±2 µm optimization gate, reflecting realistic batch acceptance criteria in pharmaceutical manufacturing rather than the conservative threshold applied during evolutionary search. The robustness score was calculated as the percentage of these 100 trials that successfully fell within the ±5 µm target window.
2.5. Crystallization Procedure and Experimental Validation
Aqueous creatine monohydrate solutions were prepared at a concentration of 50 g/L. The solution was heated to 70 °C under constant agitation at 300 rpm until complete dissolution. Dissolution was confirmed by the absence of particles and a stable baseline particle count recorded by the in situ microscope, ensuring no residual seed crystals or undissolved solids prior to crystallization. The clear solution was subsequently cooled to the seeding temperature of 50 ± 0.2 °C, at which point commercially micronized creatine monohydrate seeds were added. The use of micronized seeds ensured a high specific surface area and consistent nucleation initiation, reducing batch-to-batch variability associated with seed size distribution. Seed loading in the present work was treated as a decision variable within the RAGA optimization framework. The optimal seed loading for each target crystal size was therefore determined by the RAGA alongside the cooling trajectory, reflecting the coupled influence of seeding and cooling profile on the final crystal size distribution. The RAGA-prescribed seed loading was precisely weighed using a laboratory balance and added at 50 ± 0.2 °C for each respective target size experiment. Following seed addition, the batch was cooled according to the RAGA-optimized multi-stage cooling trajectory to a final temperature of 10 ± 1 °C. Process yield was determined by particle count using the in situ microscope, tracking the evolution of total particle number throughout the batch as an approximation for crystallization progress and yield. Since D50 is strictly enforced as the primary optimization constraint, all feasible candidate solutions exhibit similar crystal size distributions. Under this condition, particle count serves as a valid approximation of process yield, as higher particle counts at a fixed target size directly correspond to greater total crystalline mass recovered. This approximation holds while crystal size distribution width and morphology remain comparable across candidates. In systems where significant agglomeration or habit modification occurs, direct gravimetric yield measurement would be required.
The RAGA framework was applied to three distinct target D50 targets of 115, 125, and 135 µm. For each target size, the optimized cooling trajectory and seed loading identified by the RAGA were implemented experimentally in the laboratory-scale crystallizer under the conditions described above. The achieved D50 was determined from in situ microscope measurements recorded during the final stage of each batch, providing direct comparison between the computationally optimized target and the physically achieved crystal size.
3. Results and Discussion
3.1. Optimized Crystallization Procedures
The RAGA was applied independently for each of the three target crystal sizes of 115, 125, and 135 µm, yielding three distinct optimized crystallization procedures. The optimized crystallization procedure variables for each target size are summarized in
Table 2, and the corresponding predicted outputs are presented in
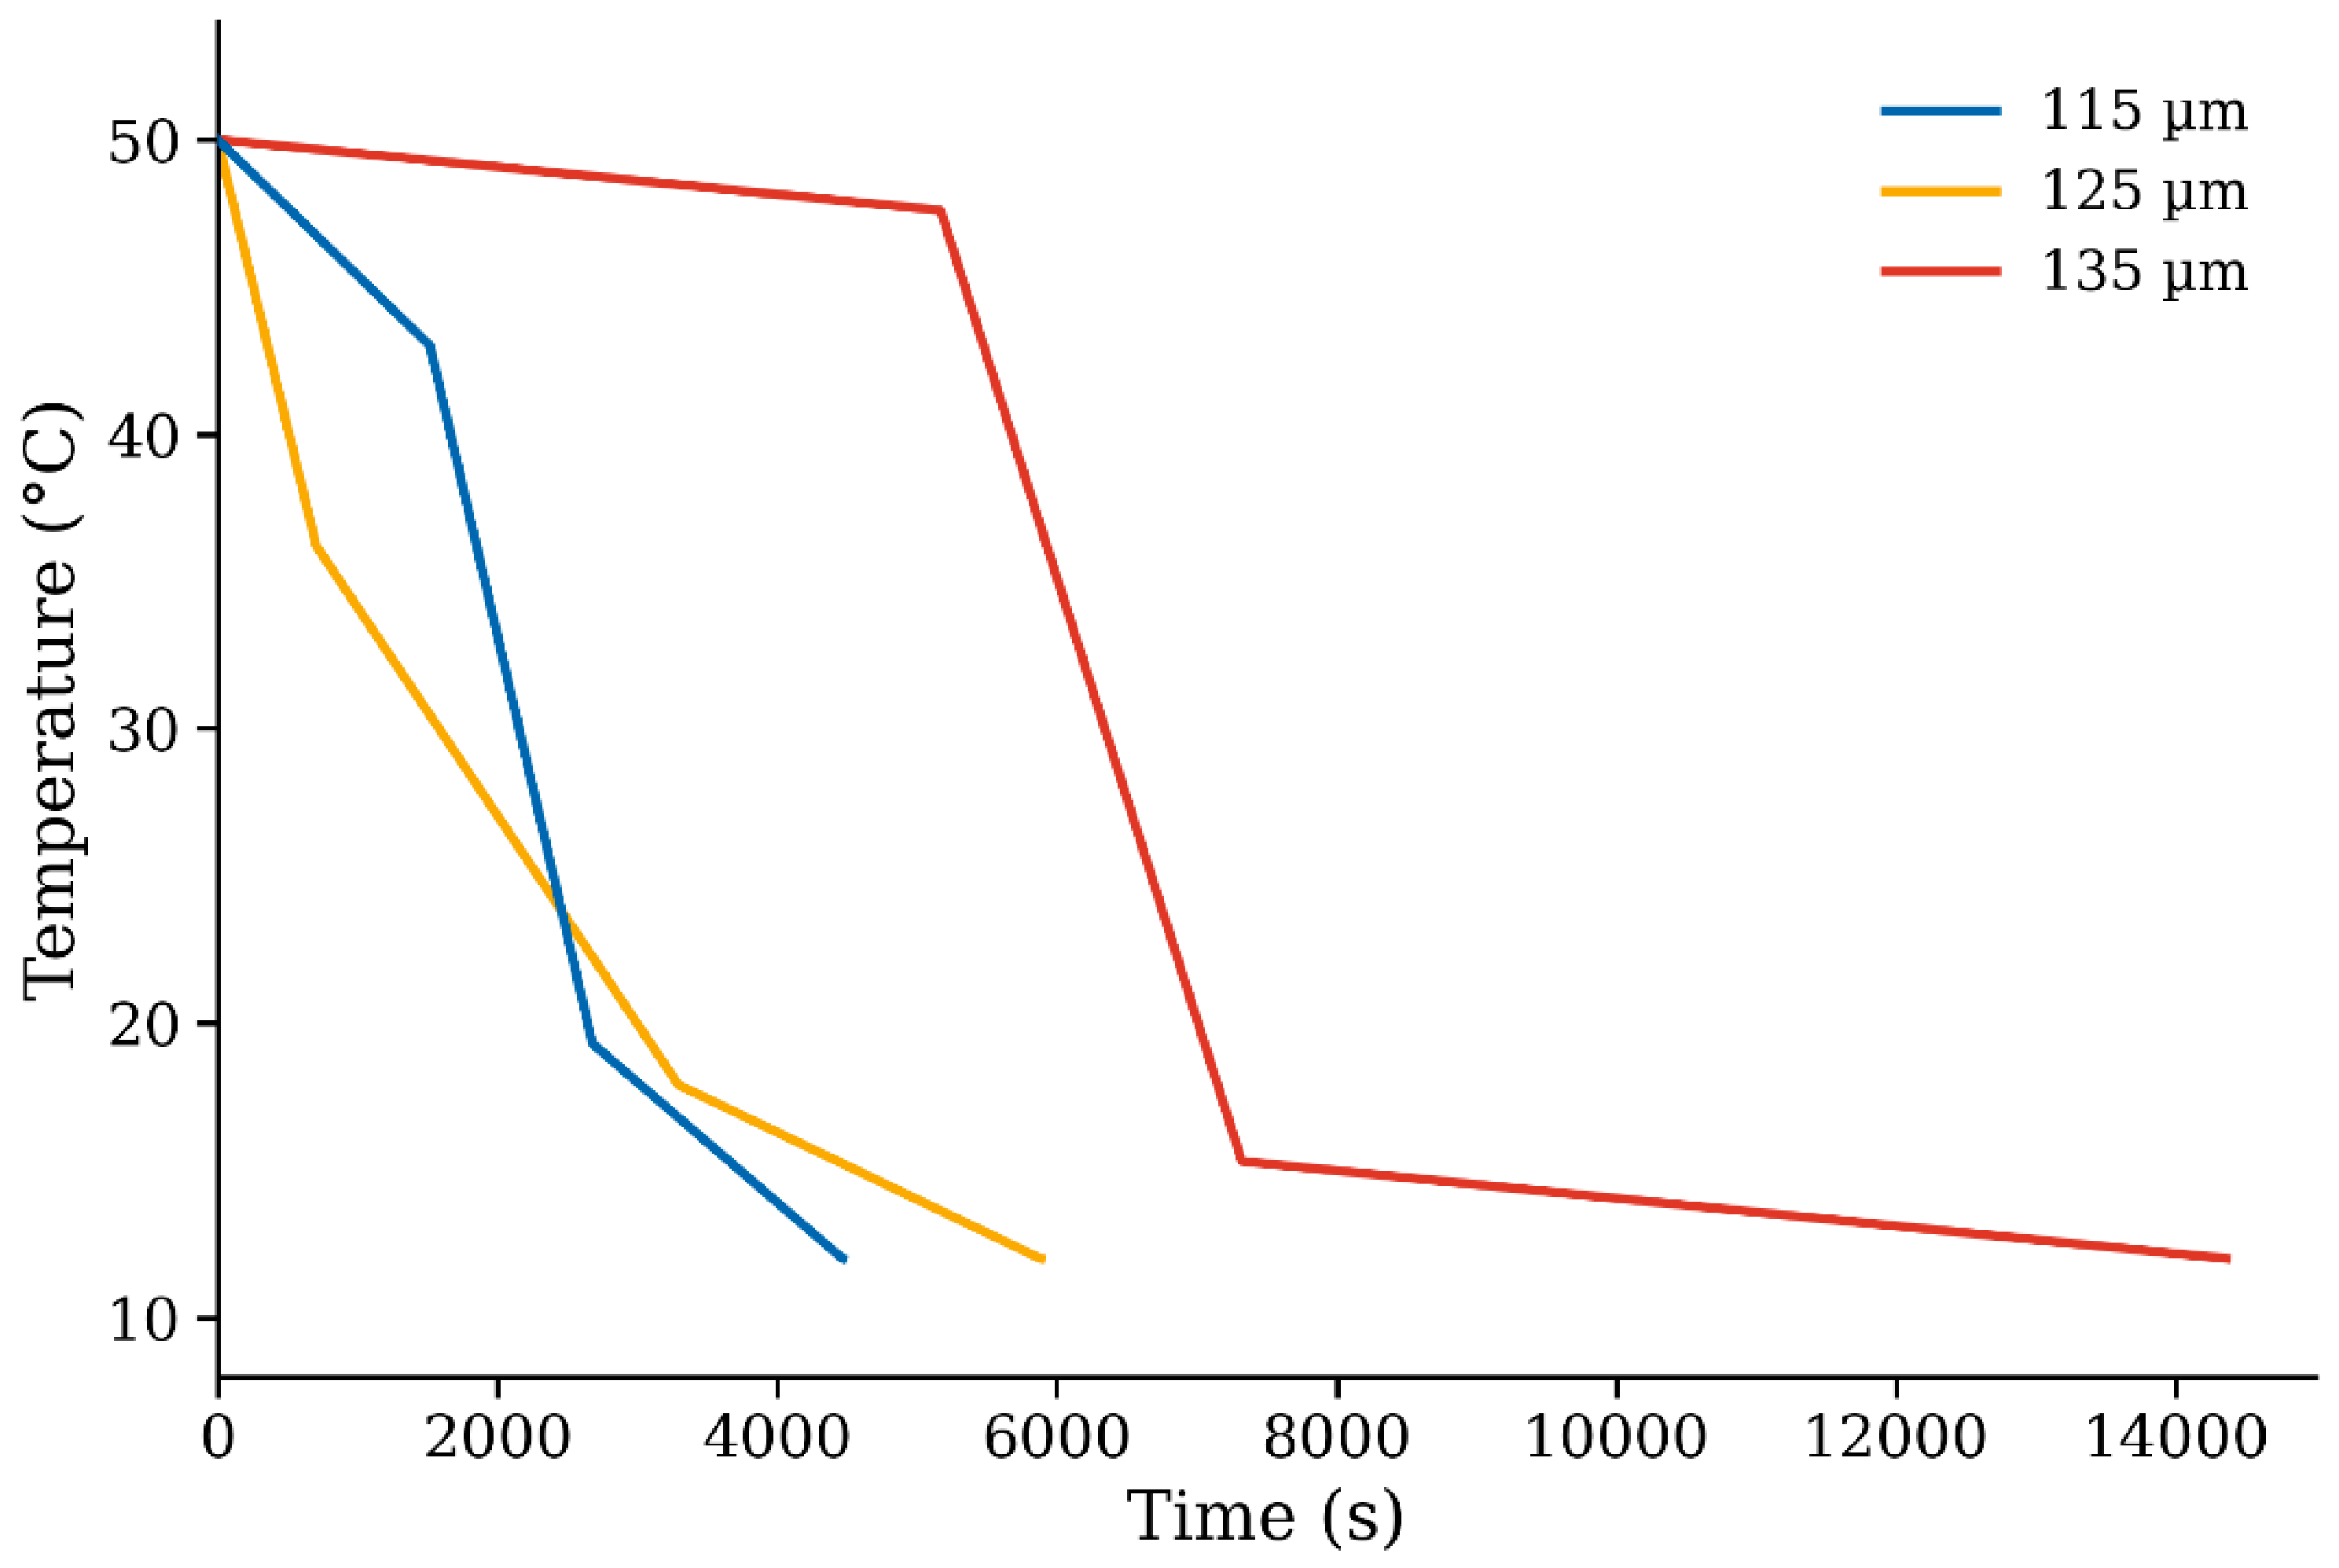
Table 3. The optimized cooling trajectories for all three target sizes are shown in
Figure 2.
As shown in
Table 2, the RAGA successfully identified procedures that met the primary D
50 constraint with high precision. The deviations between the target and predicted values were minimal: −0.9 µm for the 115 µm target, +1.6 µm for the 125 µm target, and +1.9 µm for the 135 µm target. These results confirm that the hierarchical fitness function effectively prioritized the crystal size specification, ensuring all optimized solutions resided within the defined ±2 µm required for promotion in the evolutionary search.
A significant trend is observed in the relationship between target size, total batch time, and seed loading. As the target D50 shifts from 115 µm to 135 µm: Total Batch Time increases nearly four-fold, from 4467 s to 14,358 s. Seed Loading increases from 0.57% to 3.40%. This suggests that to achieve larger crystal sizes while maintaining robustness, the optimizer favors a crystallization at low supersaturation strategy. By increasing the seed loading at larger targets, the system provides a greater total surface area for deposition, which, coupled with significantly extended batch times, allows for controlled growth and higher yields while suppressing the secondary nucleation that typically occurs at high supersaturation. The RAGA prescription of increasing seed loading and total batch time with increasing target crystal size directly reflects this mechanism and confirms that the optimization converged on a physically meaningful operating strategy.
As shown in
Figure 2, the three optimized cooling trajectories exhibit distinctly different temporal profiles, each reflecting a specific supersaturation management strategy. The 115 µm trajectory (blue) follows a roughly linear cooling trajectory, with a moderate initial hold near 43 °C during the first third of the batch, followed by a steep descent to 10 °C. Combined with the lowest seed loading (0.57%), the limited available crystal surface area results in limited consumption of supersaturation through growth, allowing secondary nucleation to contribute meaningfully to the final population. The interplay between nucleation and growth over a short batch time produces a large number of smaller crystals, consistent with the lowest target D
50 and the lowest predicted particle count among the three procedures.
The 125 µm trajectory (orange) displays a convex cooling profile, characterized by a rapid initial temperature drop from 50 °C to 36 °C within the first 681 s, followed by a more gradual cooling through the remainder of the batch. The steep early cooling rapidly increases supersaturation above the metastable zone width, promoting a burst of secondary nucleation that establishes the crystal population early in the process. As the cooling rate subsequently decreases, supersaturation is progressively consumed by growth on the now-established crystal surfaces. The intermediate seed loading (1.94%) provides sufficient surface area to moderate the nucleation burst and prevent excessive fines generation, while still allowing new crystal formation. This balance between early nucleation-dominated and late growth-dominated regimes results in an intermediate crystal size and a notably higher particle count compared to the 115 µm case.
In contrast, the 135 µm trajectory (red) exhibits a distinctive shape. The temperature remains near 48 °C for approximately the first 4680 s, then drops steeply to approximately 15 °C, followed by a prolonged, gentle approach to 10 °C over the remaining time. The extended high-temperature plateau maintains the system within a low-supersaturation regime close to the solubility curve, effectively suppressing secondary nucleation. Combined with the highest seed loading (3.40%), the dominant crystallization mechanism during the plateau phase is surface integration on existing seed crystals, where solute molecules deposit onto available growth sites without generating new nuclei. The subsequent controlled descent gradually increases supersaturation, but the large total crystal surface area established by the high seed loading ensures that the generated supersaturation is consumed through growth rather than nucleation. This growth-dominated mechanism over an extended batch time produces the largest median crystal size while simultaneously achieving the highest particle count and yield. The optimizer therefore converged on a physically coherent strategy: maximizing crystal mass deposition through surface-area-driven growth at sustained low supersaturation.
Across all three targets, the optimizer identified distinct combinations of seed loading, batch duration, and cooling trajectory parameters that each reflect a different balance between nucleation and crystal growth, despite the LSTM having no explicit representation of supersaturation or crystallization kinetics.
3.2. Monte Carlo Robustness Verification
To evaluate the sensitivity of each optimized procedure to parametric uncertainty, 100-run Monte Carlo simulations were conducted independently for each of the three target crystal sizes. In every run, the five process decision variables (total batch time, transition temperature T1 (°C), transition temperature T2, time fraction f1, and time fraction f2) were independently perturbed by sampling multiplicative factors from a uniform distribution on [0.90, 1.10]. Seed loading was excluded from perturbation and held at its nominal value to reflect the precision of gravimetric preparation in laboratory practice. A run was deemed successful if the LSTM-predicted D50 fell within a ±5 µm acceptance window centred on the target size. This tolerance is consistent with typical pharmaceutical batch release specifications for particle size.
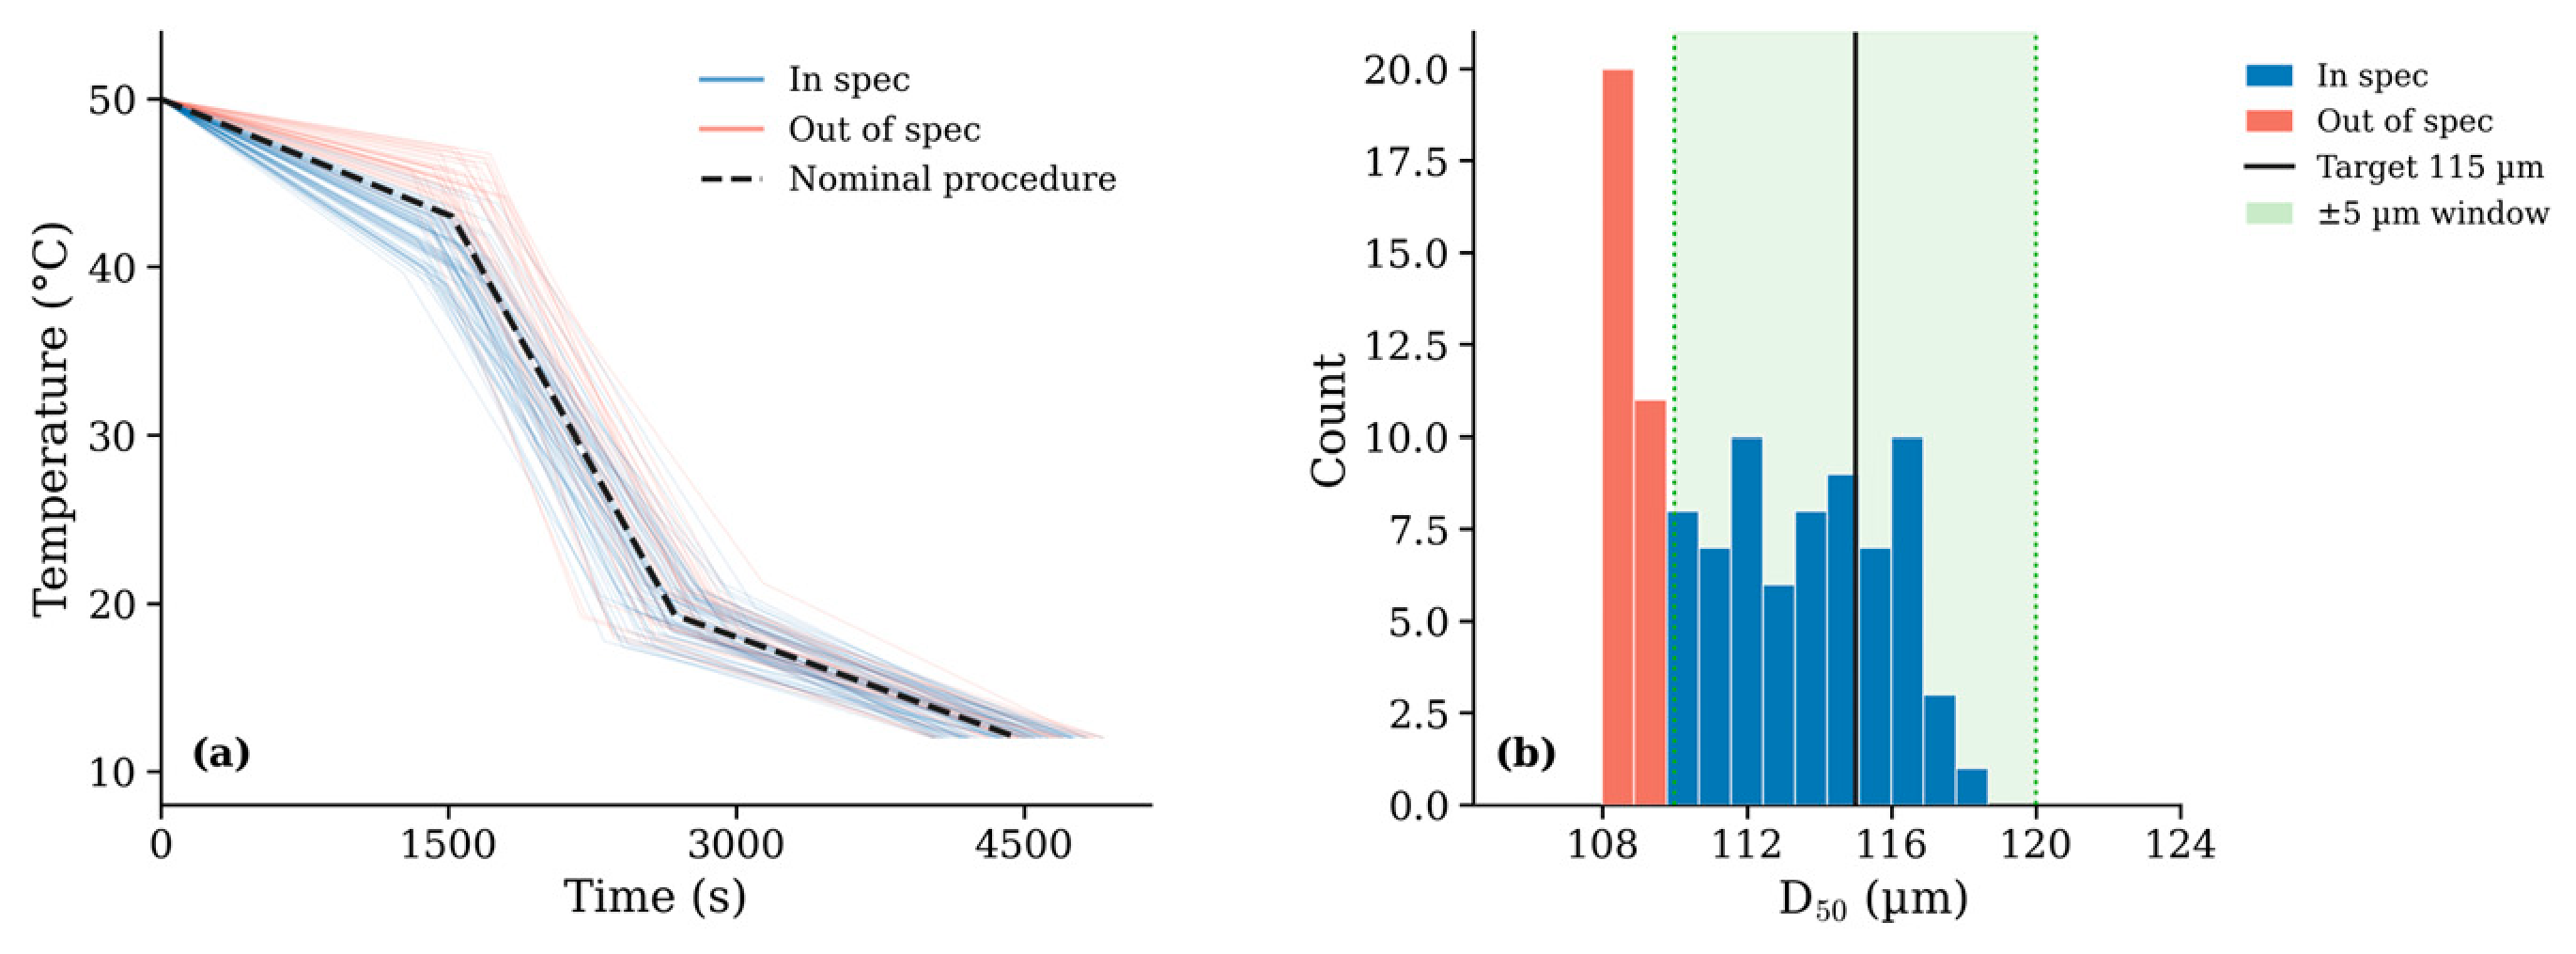
The 115 µm procedure returned a robustness score of 66%, the lowest of the three targets. The trajectories reveal a distinct subpopulation of out-of-specification cooling profiles (
Figure 3a, red), which have higher first transition temperature relative to the nominal procedure. This upward perturbation of the first transition temperature steepens the second-stage cooling rate. The D
50 histogram (
Figure 3b) shows that failures are concentrated in a narrow band between 108 and 110 µm, just below the lower acceptance limit, indicating that the failure mode is marginal. This behavior is consistent with the low seed loading prescribed for this procedure (0.57%). At such limited seed surface area, an accelerated second-stage cooling ramp generates supersaturation faster than the available seed population can consume. The resulting secondary nucleation produces a fine particle fraction that depresses the median crystal size below specification.
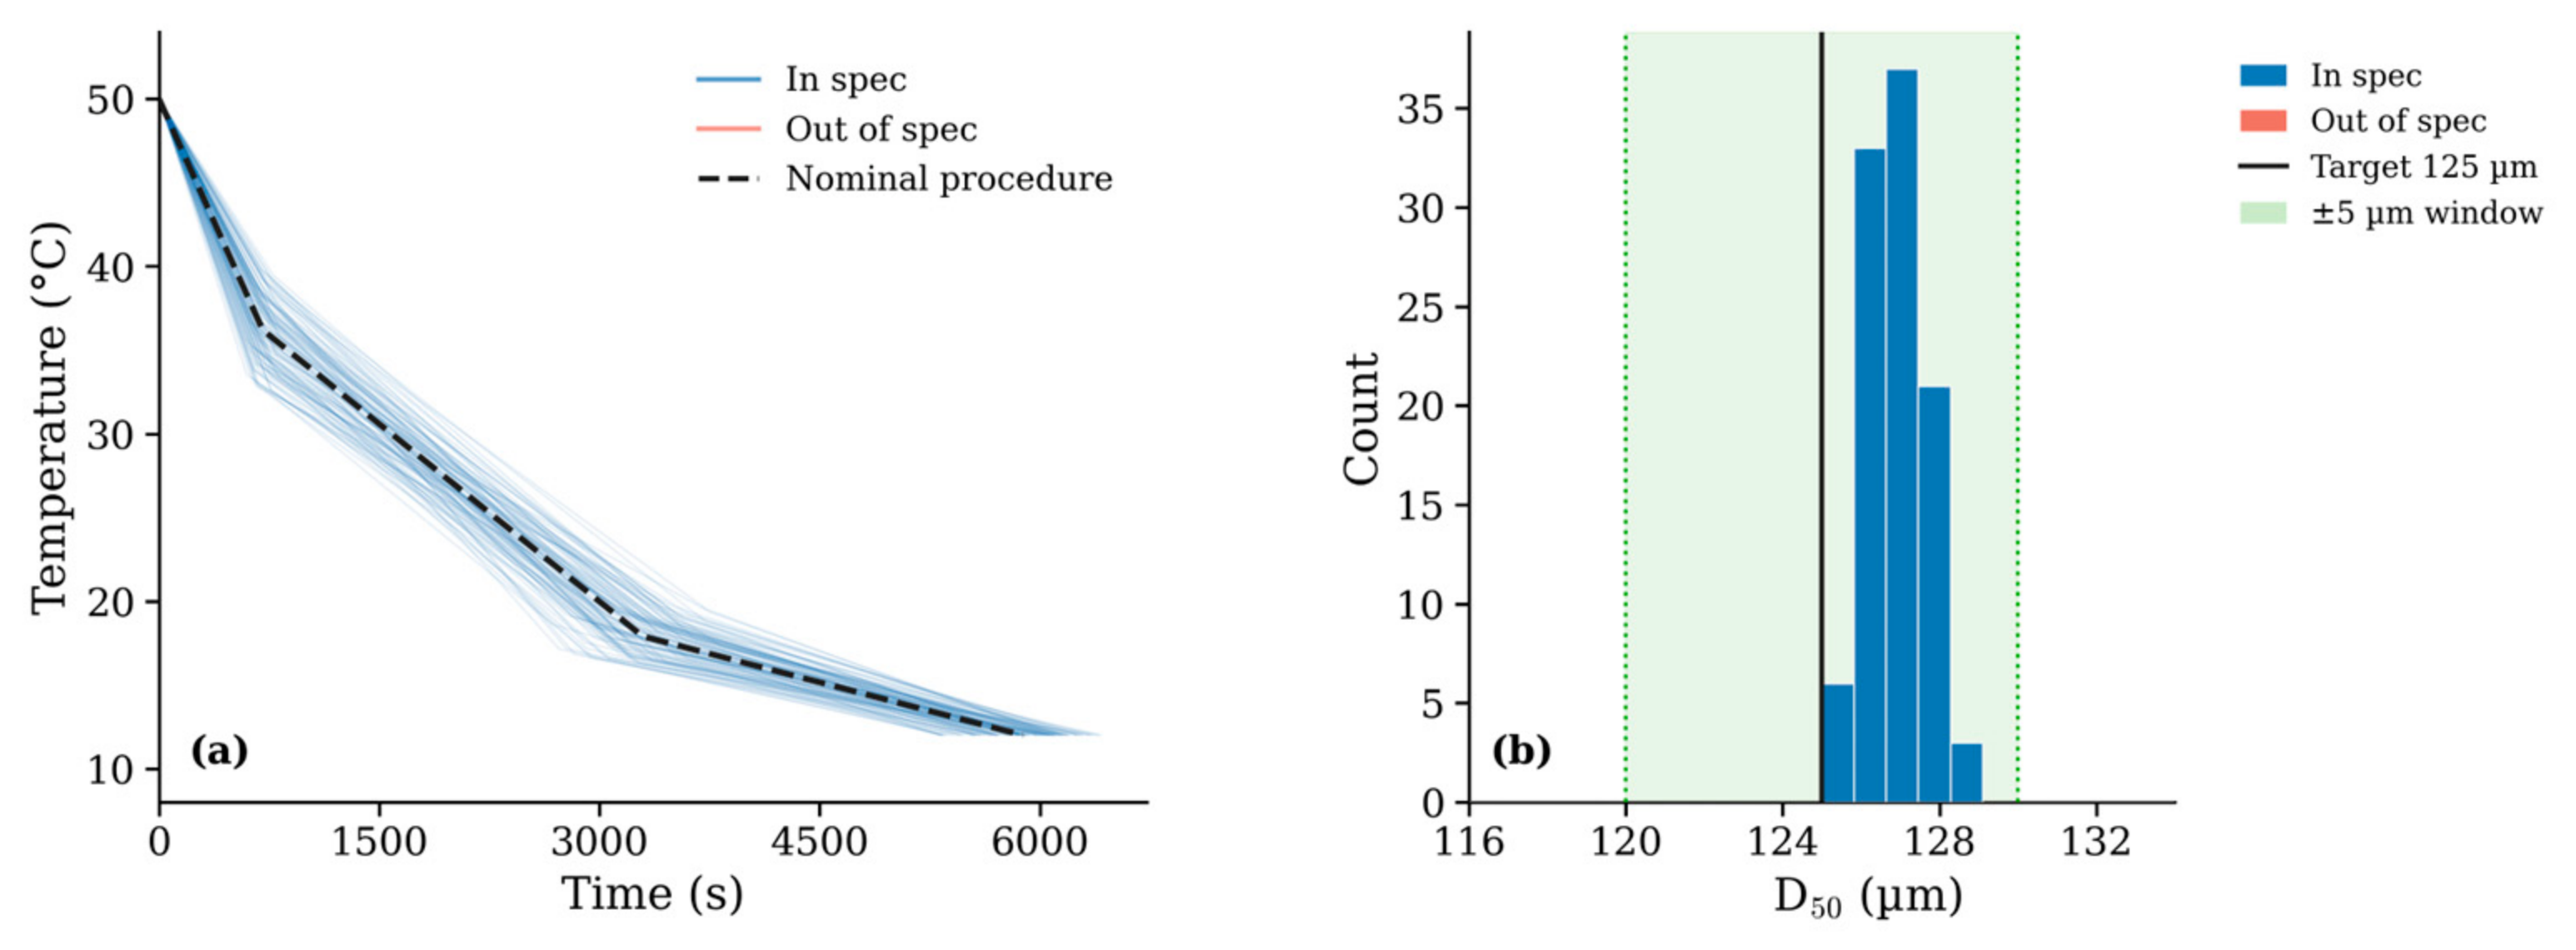
For the 125 µm target, the optimized procedure achieved a robustness of 100%, with every Monte Carlo run producing a compliant D
50. The corresponding D
50 distribution in
Figure 4b spans between 125–129 µm, well contained within the acceptance window, and exhibits no outlying observations. This result indicates that the 125 µm procedure, with its moderate seed loading (1.94%) and batch duration (5882 s), operates well within a safe region of the process space and can tolerate the ±10% perturbations without approaching the specification limits.
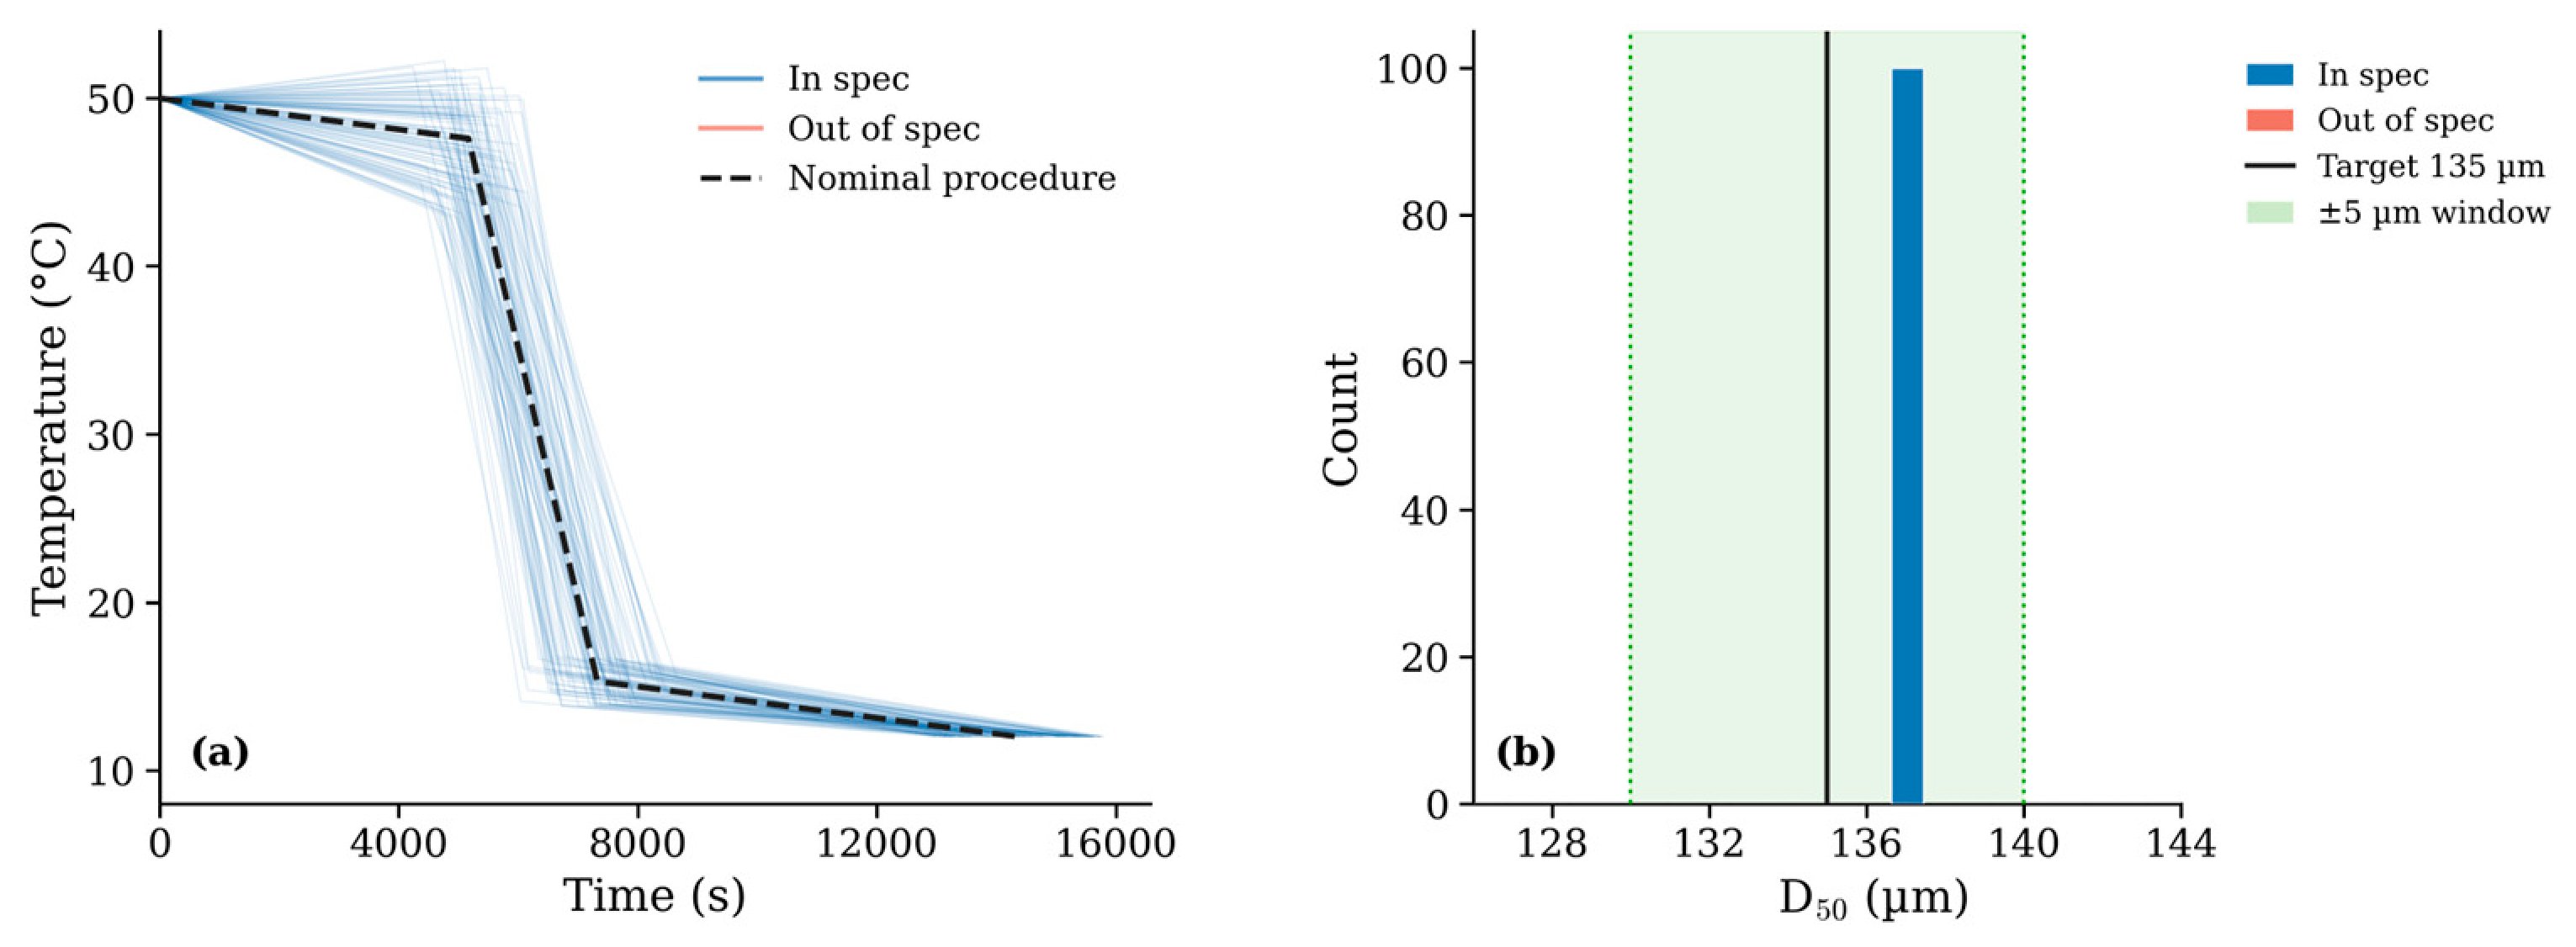
The 135 µm procedure also achieved 100% robustness. The considerably longer batch duration (14,358 s), combined with the highest seed loading among the three procedures (3.40 wt%), maintains lower supersaturation throughout the process compared to the 115 and 125 µm cases. Under these conditions, growth on existing seed crystals dominates over nucleation, producing larger crystals with a D
50 tightly grouped around 137 µm across all 100 runs (
Figure 5). The low supersaturation throughout the batch makes the final crystal size inherently less sensitive to perturbations in the cooling profile, which explains the perfect robustness score.
Taken together, the Monte Carlo results confirm that the RAGA consistently identified crystallization procedures with strong resistance to realistic levels of parametric uncertainty. The 125 and 135 µm targets both achieved perfect robustness under ±10% perturbation, while the 115 µm target returned a score of 66%, a result that is quantitatively consistent with the tighter operating window imposed by low seed loading. For practical implementation at the 115 µm target, these results suggest that tighter control of the first transition temperature is crucial.
The two procedures with higher seed loading (for 125 and 135 µm) showed strong robustness because the large initial seed surface area buffers the process against perturbations in the cooling trajectory. For the 115 µm procedure, the limited seed surface means that the same deviations have a much larger impact on supersaturation accumulation, making the process sensitive to secondary nucleation.
3.3. Experimental Validation
The three optimized crystallization procedures were implemented experimentally in the laboratory-scale crystallizer under the conditions described in
Section 2.5. The RAGA-prescribed cooling trajectories were programmed as jacket temperature setpoints, and the resulting internal reactor temperatures were recorded continuously by the temperature Pt-100 sensor. The experimentally achieved D
50 values for each target size are summarized in
Table 4 and the corresponding cooling trajectories are compared with the optimized profiles.
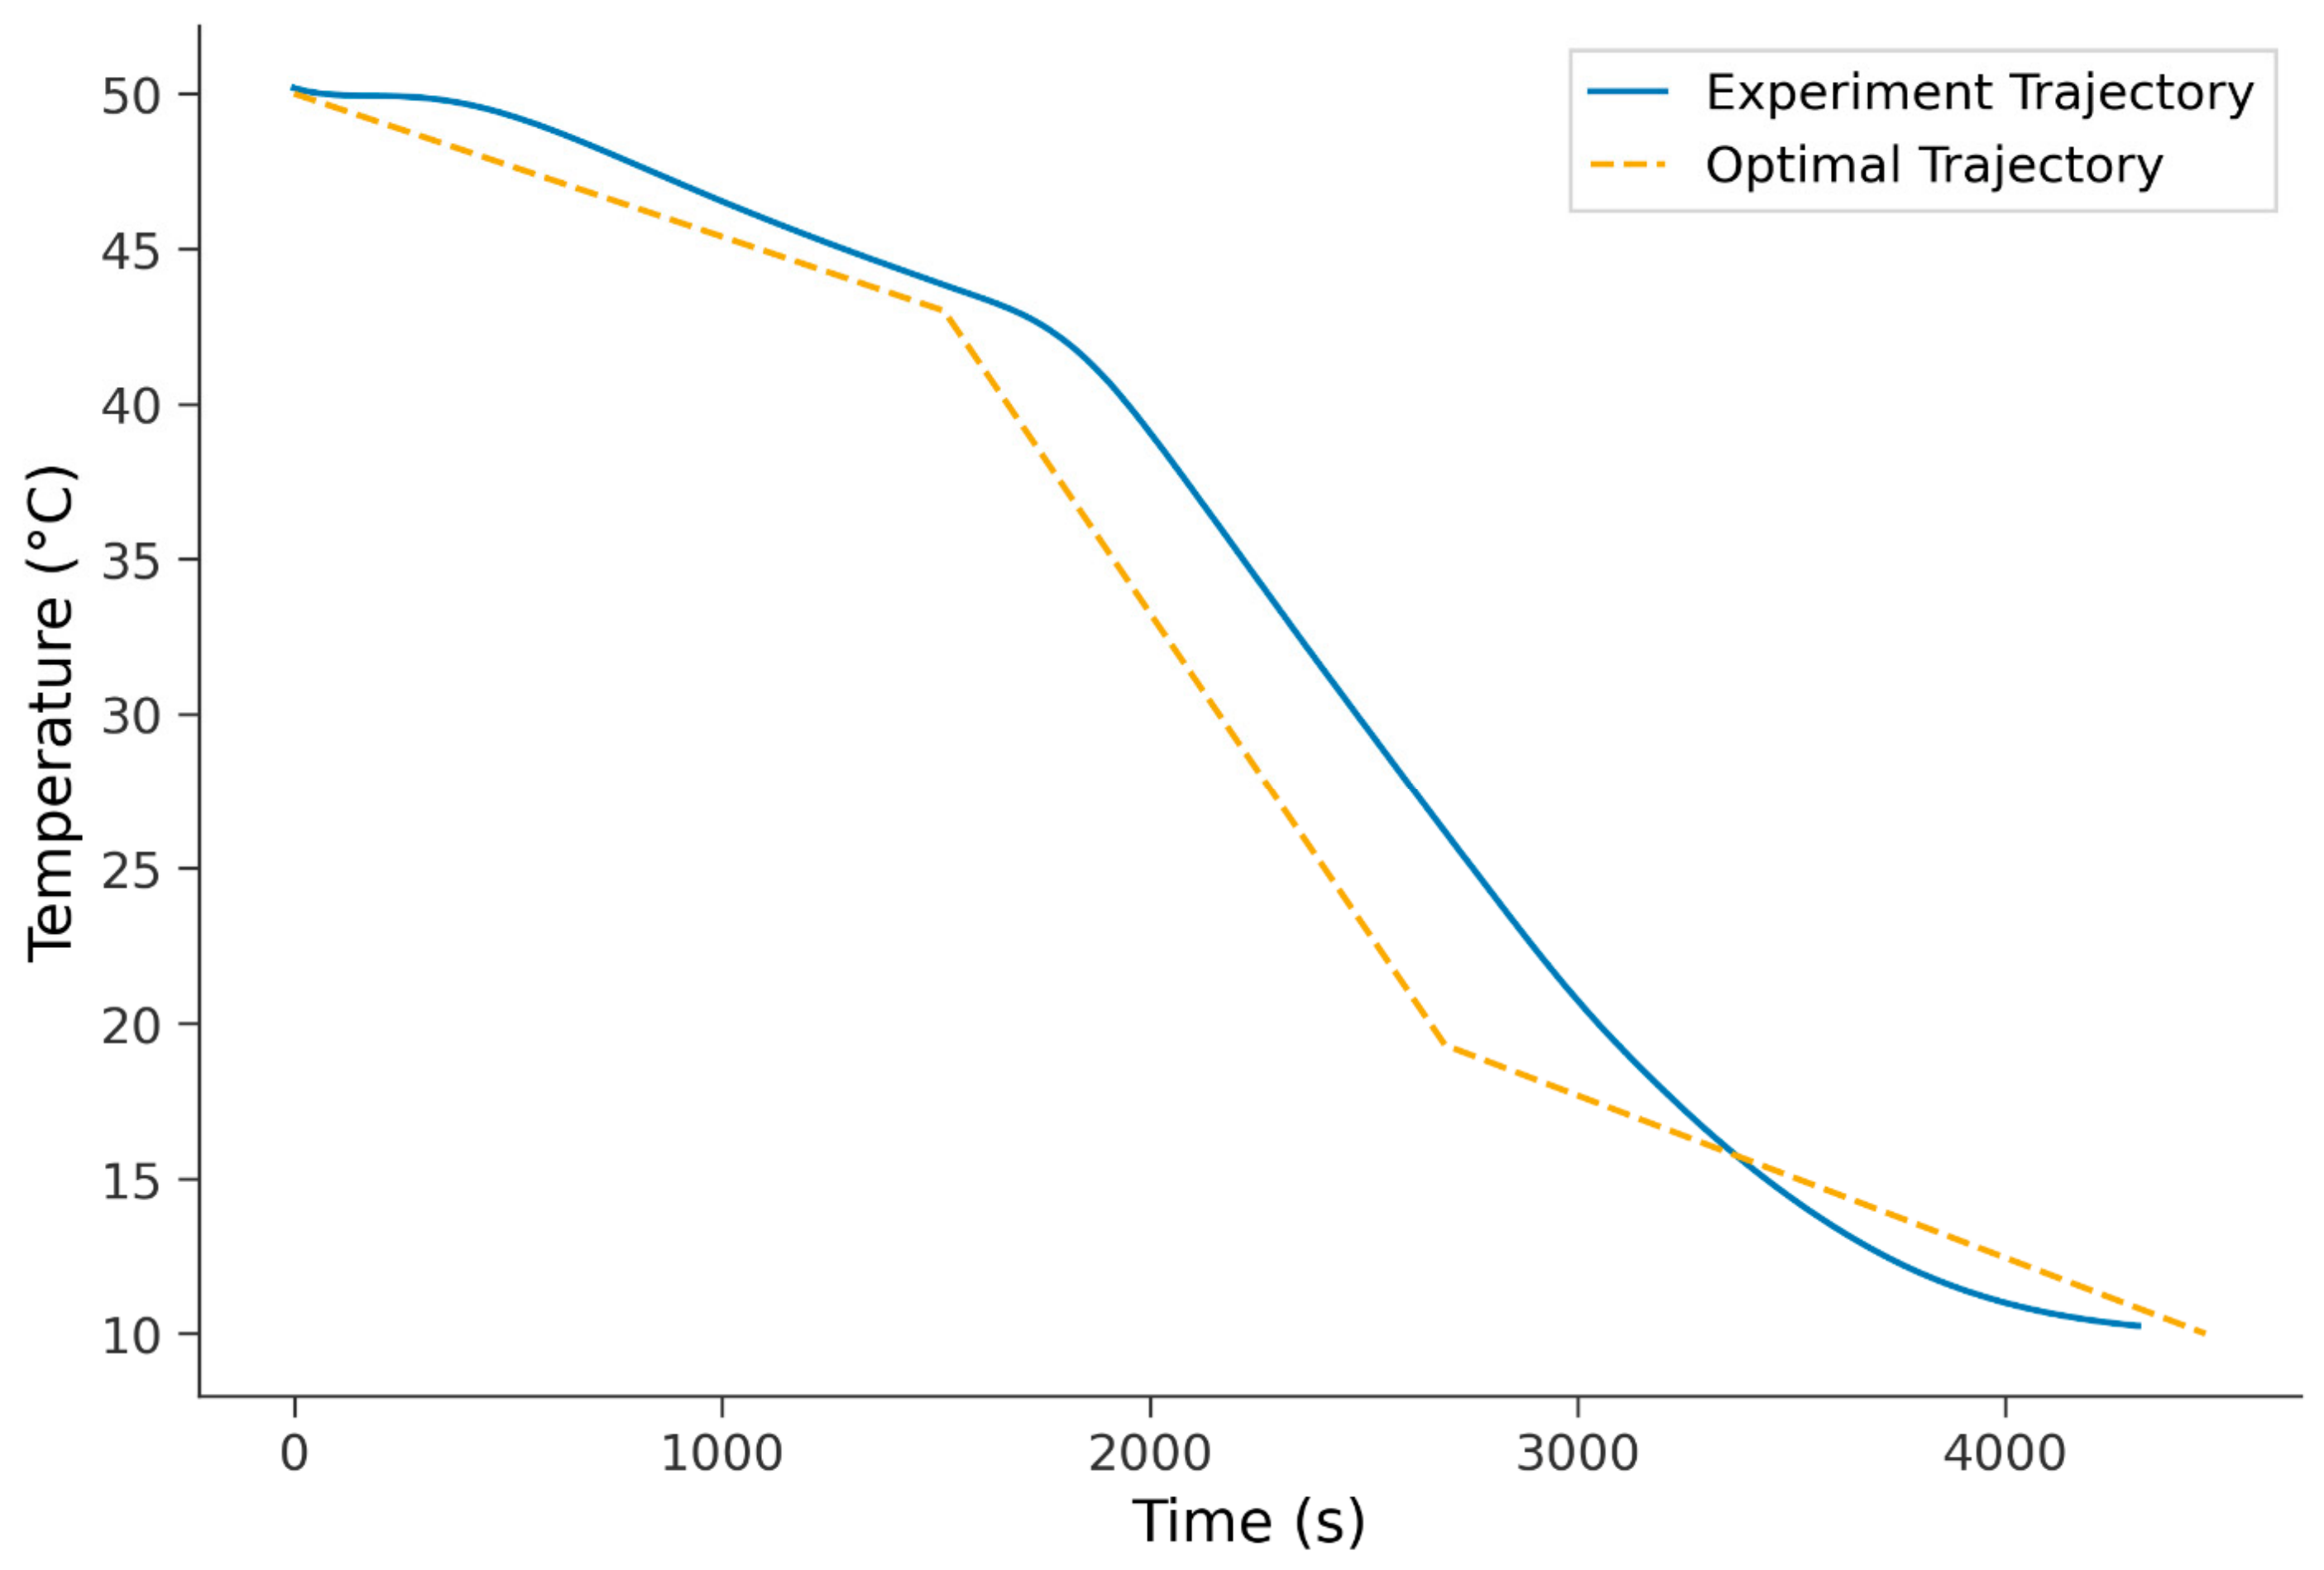
For the 115 µm target, the experimental D
50 of 112 µm fell within 3 µm of the target and well within the ±5 µm acceptance window. The experimental trajectory (
Figure 6) follows the general shape of the optimal profile but exhibits a characteristic delay during the steep second cooling stage, where the reactor temperature trails behind the prescribed ramp.
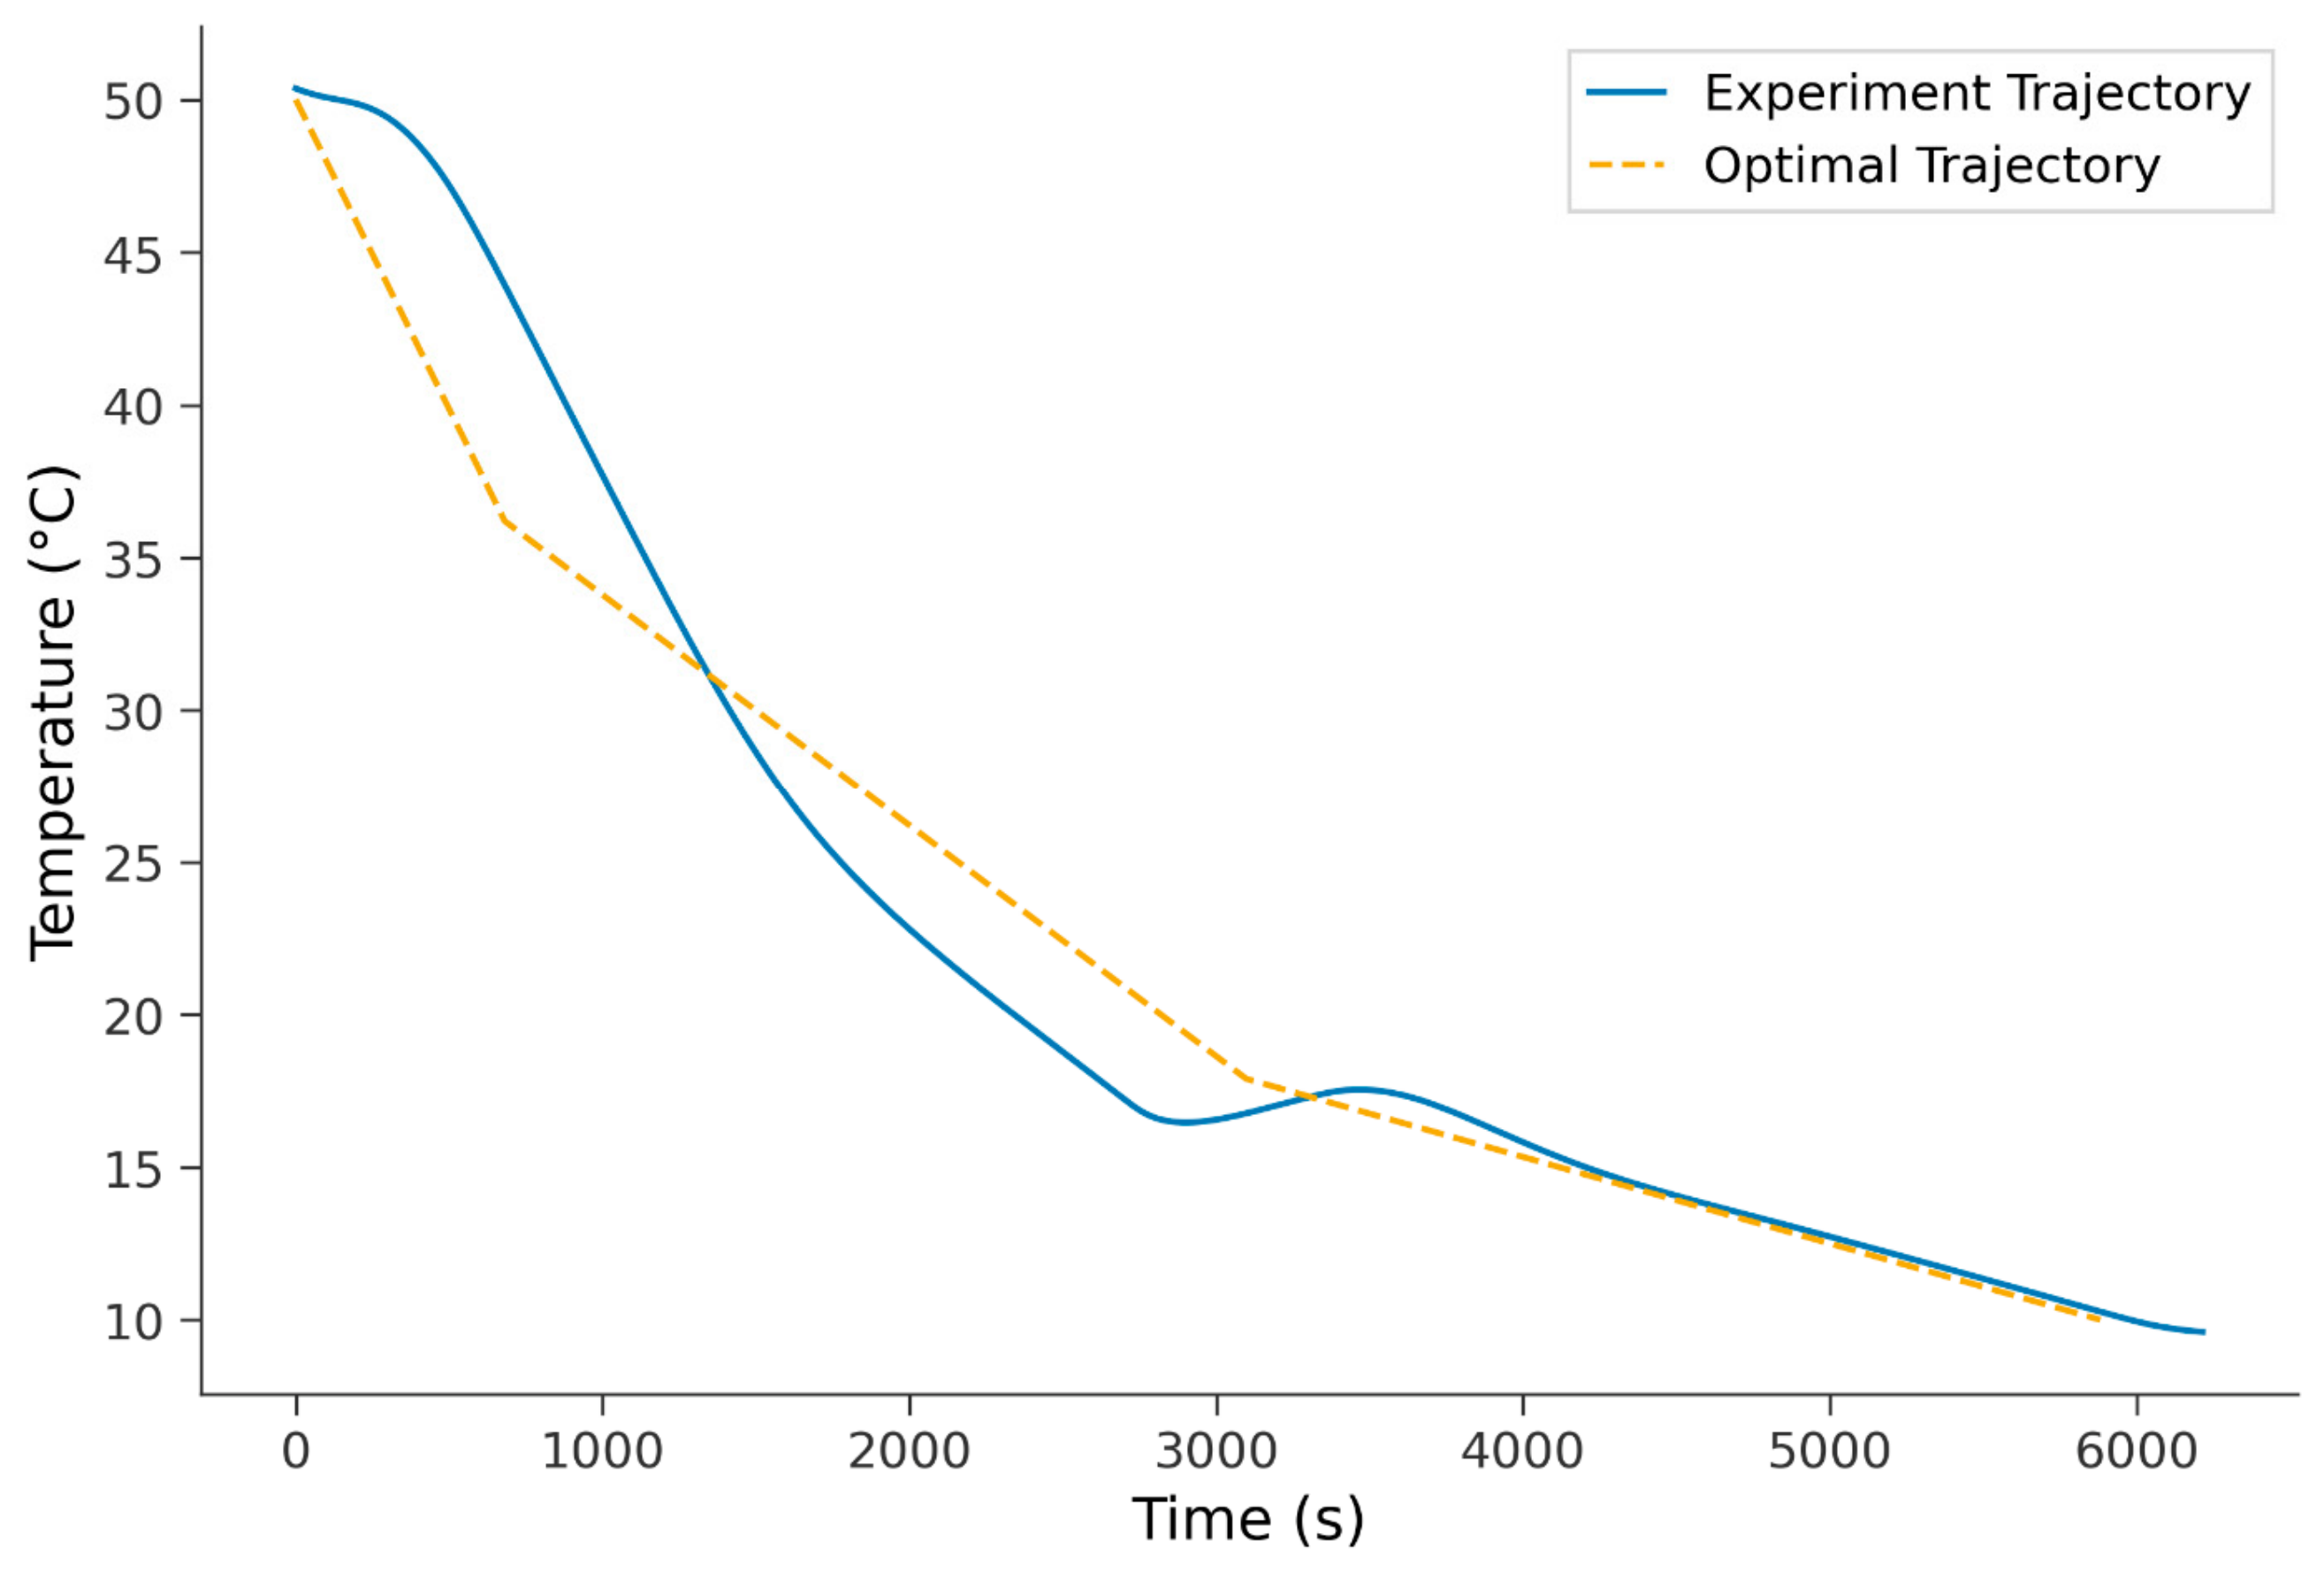
For the 125 µm target, the experimental D
50 of 120.3 µm represents a deviation of −4.7 µm from the target, at the boundary of the acceptance window. The cooling trajectory (
Figure 7) shows a similar thermal lag pattern: the steep initial setpoint change from 50 °C to 36.2 °C within the first 681 s is attenuated by the thermal mass of the reactor, producing a smoother and slower initial temperature drop. The experimental trajectory falls below the optimal profile in the mid-batch region before the two converge during the final cooling stage. The slower initial supersaturation generation resulting from this attenuated cooling may explain the lower-than-predicted D
50, as a delayed onset of secondary nucleation would shift the crystal population toward fewer, slightly smaller crystals.
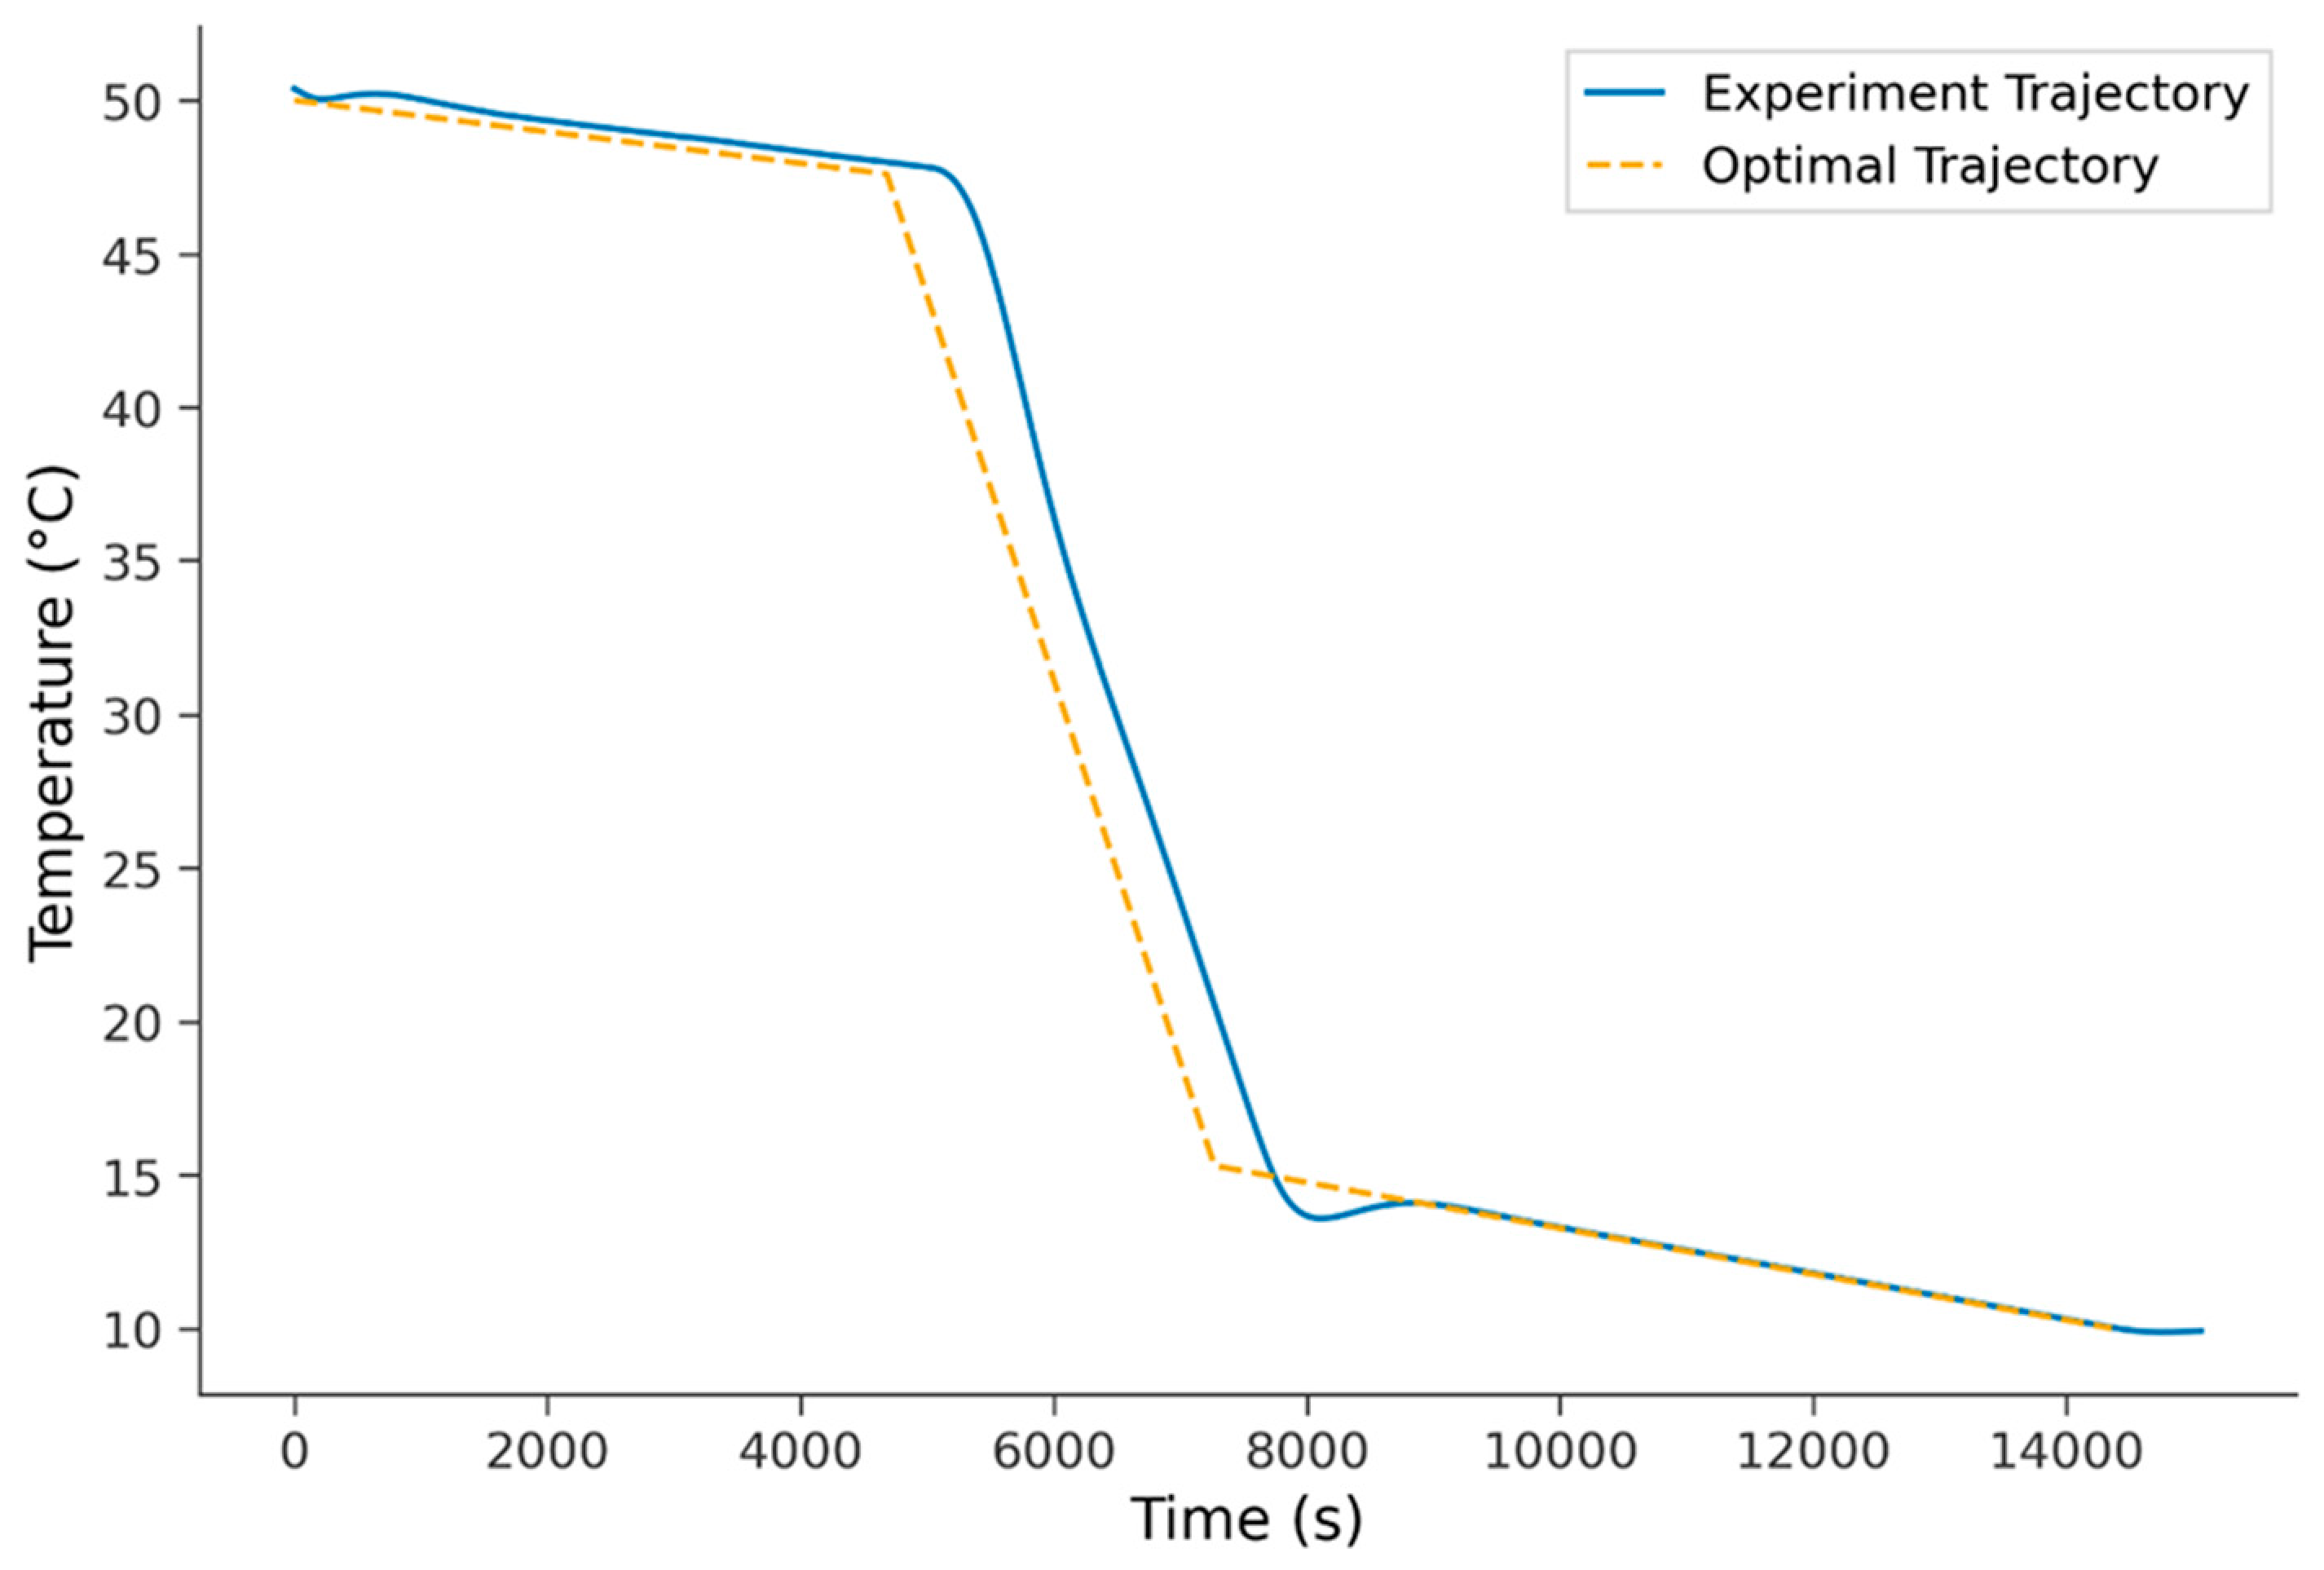
For the 135 µm target, the experimental D
50 of 144.5 µm exceeded the target by 9.5 µm, falling outside the ±5 µm acceptance window. The cooling trajectory (
Figure 8) reveals that the reactor temperature remained near 50 °C for approximately 1000 s longer than the optimal profile before the steep cooling ramp began. This extended high-temperature plateau, caused by the thermal inertia of the jacketed system during the long hold phase, maintained the system at low supersaturation for a prolonged period, allowing additional growth on existing seed crystals before supersaturation increased. Combined with the highest seed loading among the three procedures (3.40 wt%), this extended growth phase produced crystals that exceeded the target size.
Across the three target sizes, two of the three experimental D50 values fell within the ±5 µm acceptance criterion. The deviation observed for the 135 µm target is the result of two compounding factors: the prediction uncertainty of the LSTM digital twin and the deviation of the experimental cooling trajectory from the optimized profile due to thermal lag. When this prediction uncertainty is combined with the thermal lag of the crystallizer the cumulative effect can push the experimental outcome beyond the acceptance window. This compounding is most pronounced for the 135 µm procedure, where the long high-temperature hold amplifies the difference between the setpoint and the actual reactor temperature, extending the low-supersaturation growth phase and producing crystals larger than predicted.
3.4. Framework Applicability
From a practical standpoint, the framework offers a cost-effective pathway for crystallization procedure development. Conventional approaches to identifying robust operating conditions for a new target crystal size require extensive experimental campaigns, with each cooling profile and seed loading combination tested. The proposed framework reduces this to a computational search followed by a single confirmatory experiment. In the present study, three distinct target specifications were addressed using the same trained digital twin, with each optimization completed in minutes on standard hardware. The experimental effort was limited to one validation run per target, compared to the dozens of exploratory runs that would typically be required to arrive at comparable procedures through sequential experimentation. In pharmaceutical development, where timelines are compressed and laboratory capacity is limited, the ability to screen thousands of candidate procedures computationally and test only the most promising represents a meaningful reduction in both development time and material consumption.
The predictive accuracy of data-driven surrogate models is inherently linked to the diversity and coverage of the training dataset. Future work will focus on enriching the experimental dataset with additional runs targeting underrepresented regions of the operating space, which is expected to improve prediction accuracy and support optimization across a wider range of target crystal sizes and crystallization systems. Rather than uniform expansion of the training set, an active learning strategy can be adopted, in which new experimental runs are placed in regions of the input space where the surrogate is least confident. In parallel, calibrated uncertainty estimates from methods such as Monte Carlo dropout could replace the current deterministic robustness gate with a probabilistic chance constraint.
To extend the framework to different operating scales, thermal lag between jacket setpoint and crystallizer temperature must be addressed explicitly. This lag is the most significant scale-dependent factor in batch crystallization, becoming more pronounced as vessel size increases, and was a contributor to the deviation observed at the 135 µm experimental target in the present system. We propose to address it by coupling the existing LSTM surrogate with a heat-transfer model of the jacketed reactor [
43]. The heat-transfer model consists of an energy balance on the reactor and the jacket, parameterized by the overall heat-transfer coefficient and the jacket-side dynamics. The resulting hybrid structure would predict both the actual reactor temperature evolution and the jacket setpoint trajectory required to track a desired reactor profile.
Additionally, the hierarchical fitness function can be extended to multi-attribute targets, for example by adding a distribution-width descriptor such as span ((D90 − D10)/D50) as an additional objective. Systematic tuning of the RAGA configuration, including population size, number of generations, mutation rate, and the number of stochastic realizations in the robustness gate, could further improve the quality of optimized procedures.
4. Conclusions
This study presented a Robustness-Aware Genetic Algorithm (RAGA) integrated with an LSTM digital twin for the design of robust seeded cooling crystallization procedures. The framework was applied to creatine monohydrate across three target crystal sizes of 115, 125, and 135 µm.
The RAGA successfully identified physically coherent crystallization procedures for all three targets, with predicted D50 values within ±2 µm of the target specification. The optimizer converged on a consistent strategy of increasing seed loading and batch duration with increasing target crystal size, from 0.57% and 4467 s at 115 µm to 3.40% and 14 358 s at 135 µm, reflecting a progressive shift from nucleation- to growth-dominated crystallization. This trend confirms that the optimization framework, despite operating entirely on data-driven predictions without explicit kinetic knowledge, recovered a physically meaningful operating strategy consistent with established crystallization principles.
Independent Monte Carlo verification confirmed 100% robustness for the 125 and 135 µm procedures under ±10% perturbations, while the 115 µm procedure achieved 66%. Experimental validation confirmed two of three targets within the ±5 µm acceptance window; the deviation at the 135 µm target was attributed to the combined effect of LSTM prediction uncertainty and thermal lag, both of which are addressed as priorities for further development.
It should be noted that the framework was developed and tested on a limited dataset of a single crystallization system at laboratory scale. Further investigation of framework applicability to more complex crystallization systems and across different scales is needed to confirm the benefits of this fast-to-apply framework.
The results demonstrate that embedding robustness directly within the evolutionary optimization loop, rather than verifying it post hoc, produces crystallization procedures that are inherently resistant to parametric uncertainty. The millisecond-scale inference time of the LSTM surrogate was a critical enabler of this approach, making repeated stochastic ensemble evaluation computationally feasible within the optimization loop.