Article

Effect of Crystal-to-Detector Distance Variations on Serial Femtosecond Crystallography Data Collected at PAL-XFEL


1
College of General Education, Kookmin University, Seoul 02707, Republic of Korea
2
Pohang Accelerator Laboratory, Pohang University of Science and Technology, Pohang 37673, Republic of Korea
*
Author to whom correspondence should be addressed.
Crystals 2026, 16(3), 203; https://doi.org/10.3390/cryst16030203
Submission received: 28 February 2026 / Revised: 13 March 2026 / Accepted: 15 March 2026 / Published: 17 March 2026
(This article belongs to the Section Biomolecular Crystals)

Abstract

Serial femtosecond crystallography (SFX) using X-ray free electron lasers (XFELs) enables the determination of room-temperature structures of biological macromolecules without radiation damage. The accuracy of detector geometry parameters, including the crystal-to-detector distance (CTDD), is critical for reliable data processing. In SFX experiments, the CTDD may shift during data collection due to changes in the experimental setup or installation of the sample delivery system. Such CTDD variations can affect the quality of SFX datasets; however, their impact has not been fully elucidated in the context of SFX data processing. In this study, we investigated the influence of CTDD variations on SFX datasets collected at Pohang Accelerator Laboratory X-ray Free Electron Laser (PAL-XFEL) with thermolysin, lysozyme, and glucose isomerase crystals processed by four indexing algorithms. At the optimized CTDD, the distribution of unit cell parameters exhibited a Gaussian pattern; however, it became distorted as the CTDD deviated further from the optimal value. Data analysis indicated that the CTDD tolerance for successful data processing and structure determination was approximately ±3–5 mm from the optimized CTDD. These findings provide insight into indexing behavior in SFX data processing at PAL-XFEL and offer practical guidance for improving data processing efficiency.

1. Introduction

Serial femtosecond crystallography (SFX) using X-ray free electron lasers (XFELs) enables the determination of room-temperature macromolecular structures while minimizing radiation damage [1,2,3,4,5]. SFX experiments using optical lasers enable visualization of time-resolved ultrafast molecular dynamics of photoactive proteins or photochemical reactions [6,7,8,9,10]. SFX with a mix-and-inject system enables the investigation of time-resolved structural changes during enzymatic catalytic reactions or substrate (or inhibitor) binding to target proteins [11,12,13,14,15,16]. Furthermore, SFX data collection of enzymes in the presence of substrates can provide insight into intermediate states using averaged electron density maps obtained during catalytic reactions [17]. Accordingly, SFX structures offer biologically relevant structural and mechanistic information, including molecular flexibility, conformational dynamics, and functional states [4,18,19,20].
During SFX experiments, a large number of microcrystals are delivered into the X-ray interaction region using sample delivery systems, such as injectors, fixed-target scanning stages, or hybrid methods, and each microcrystal is exposed to an XFEL pulse [21,22,23]. The XFEL diffraction images contain partial-reflection information due to the ultrashort XFEL pulse duration [2,24,25]. Accordingly, to generate fully integrated intensities for reliable three-dimensional structure determination, thousands to hundreds of thousands of diffraction patterns are integrated using Monte Carlo integration methods [26,27].
During SFX data processing, the accuracy of detector geometry parameters, including the crystal-to-detector distance (CTDD), detector configuration, and wavelength, is critical for the successful indexing of diffraction patterns and for obtaining reliable structural information [28,29]. Among the various data processing parameters, the CTDD is particularly important because it directly determines the predicted Bragg peak positions, influences unit cell parameter estimation, and affects indexing accuracy, intensity integration, and overall data quality [30,31,32].
Accordingly, accurate CTDD values are essential for achieving high indexing rates and reliable data processing. To utilize accurate CTDD values during data collection, initial estimates of the CTDD and beam center are typically determined from chemical powder (e.g., LaB6 and CeO2) diffraction patterns or model protein crystals before data collection and provided to users as initial geometry parameters [1,33].
However, CTDD deviations can occur during the installation of sample delivery devices, such as injectors or fixed-target sample holders [32]. In addition, CTDD variations may arise from the spatial distribution of crystals within the injection stream or fixed-target holder, the instability of the injection stream, misalignment of the fixed-target holder on translation stages along the X, Y, or Z axes, or even shifts in detector position [31,32]. Therefore, optimizing detector geometry parameters, including CTDD refinement, is essential for accurate data processing.
The effects of CTDD deviations in serial synchrotron crystallography (SSX) data have been analyzed, showing that data can still be successfully processed even with several millimeters of deviation from the optimal CTDD [32]. This information may be useful for SX data processing; however, the acceptable CTDD tolerance range cannot be directly applied to SFX data processing due to multiple differences, including X-ray properties and experimental setups, such as detector configuration. Therefore, it is important to evaluate CTDD tolerance and determine how CTDD deviations influence data quality using SFX data collected under specific beamline configurations and commonly used sample delivery setups.
To better understand the effect of CTDD on SFX data processing, we analyzed SFX datasets of thermolysin (TLN), hen egg white lysozyme (HEWL), and glucose isomerase (GI) collected at the Pohang Accelerator Laboratory X-ray Free Electron Laser (PAL-XFEL) across a range of CTDD values using four different indexing algorithms. Indexing efficiency, unit cell parameter distributions, data processing statistics, and structure refinement metrics were comprehensively compared. These results provide practical guidelines for PAL-XFEL users and contribute to a broader understanding of detector geometry tolerance in serial femtosecond crystallography data processing.

2. Materials and Methods

2.1. Data Preparation

The XFEL datasets for TLN (CXIDB code 86), HEWL (CXIDB code 89), and GI (CXIDB code 90) were obtained from the Coherent X-ray Imaging Data Bank (CXIDB) [34]. All datasets containing diffraction peaks were pre-filtered using Cheetah [35] with the peakfinder8 algorithm.

2.2. Data Processing

All XFEL datasets were processed using CrystFEL (version 0.9.1+886ae521) [36] with the DirAx [37], XDS [30], MOSFLM [38], and XGANDALF [39] indexing algorithms. During indexing, default parameters were used for tolerance, peak finding, and threshold settings. The detector geometry, including the CTDD, beam center, and detector rotation, was refined using geoptimiser [28] and validated using the detector_shift and cell_explore tools implemented in CrystFEL along with the Gaussian distribution of the unit cell parameters. For CTDD tolerance analysis, each dataset was indexed at 1 mm intervals within a ±10 mm range from the optimal CTDD value. All data processing was performed at the global science data hub center (GSDC) at Korea Institute of Science and Technology Information (KISTI, Republic of Korea) [40].

2.3. Structure Determination

Phase problems were solved through molecular replacement (MR) using Phaser-MR implemented in PHENIX (version 1.17.1) [41]. The crystal structures of TLN (PDB code 6LZN) [42], HEWL (6IRJ) [43], and GI (7DFJ) [44] were used as search models for the respective datasets. The MR solutions were further refined using phenix.refine in PHENIX. During structure refinement, water molecules were automatically added using the default parameters. The final refinement resolutions for TLN, HEWL, and GI were 1.80, 1.65, and 1.75 Å, respectively, following the values reported in the original crystal structure studies. All structural figures were generated using PyMOL (version 2.6.0) (http://pymol.org; accessed on 14 February 2026).

3. Results

3.1. Dataset

To investigate the effect of CTDD on SFX data processing collected using the PAL-XFEL, previously reported SFX datasets of TLN, HEWL, and GI were analyzed (Table 1). In SFX experiments, microcrystals are continuously delivered to the X-ray interaction point, and variations in the sample delivery method can lead to fluctuations in the effective CTDD. For the TLN dataset, crystals were delivered using a carrier matrix delivery (CMD) injector with a polyacrylamide (PAM) injection matrix [45]. The width of the PAM stream containing crystals was approximately 105 μm at a flow rate of 800 nL/min. For the HEWL and GI datasets, crystals were delivered using a fixed-target scanning approach [43]. The crystals were mounted on a nylon mesh sample holder, and the inner space of the holder was greater than 600 μm. Because crystals can be distributed throughout the entire width of the injection stream or across the full internal space of the fixed-target holder, the effective CTDD may vary accordingly. Therefore, potential experimental CTDD offsets of up to ~100 μm for injection-based delivery (TLN) and >600 μm for fixed-target delivery (HEWL and GI) may be introduced. In the experimental setup, the CTDDs of the samples exposed to the XFEL beam for TLN, HEWL, and GI were 105, 140, and 140 mm, respectively. However, geometry optimization using CrystFEL refined the CTDD values to approximately 106.5, 137.0, and 136.0 mm, respectively. These deviations may have arisen from experimental errors during the installation of the injector or sample holder.

3.2. Indexing of SFX Dataset Across CTDD Values and Indexing Algorithms

To evaluate the effect of CTDD accuracy on indexing efficiency, indexing was performed using CrystFEL over a range of ±10 mm around the geometry-optimized CTDD at 1 mm intervals. Because indexing efficiency can vary depending on the indexing algorithm, CTDD-dependent indexing was performed using the DirAx, XDS, MOSFLM, and XGANDALF algorithms.
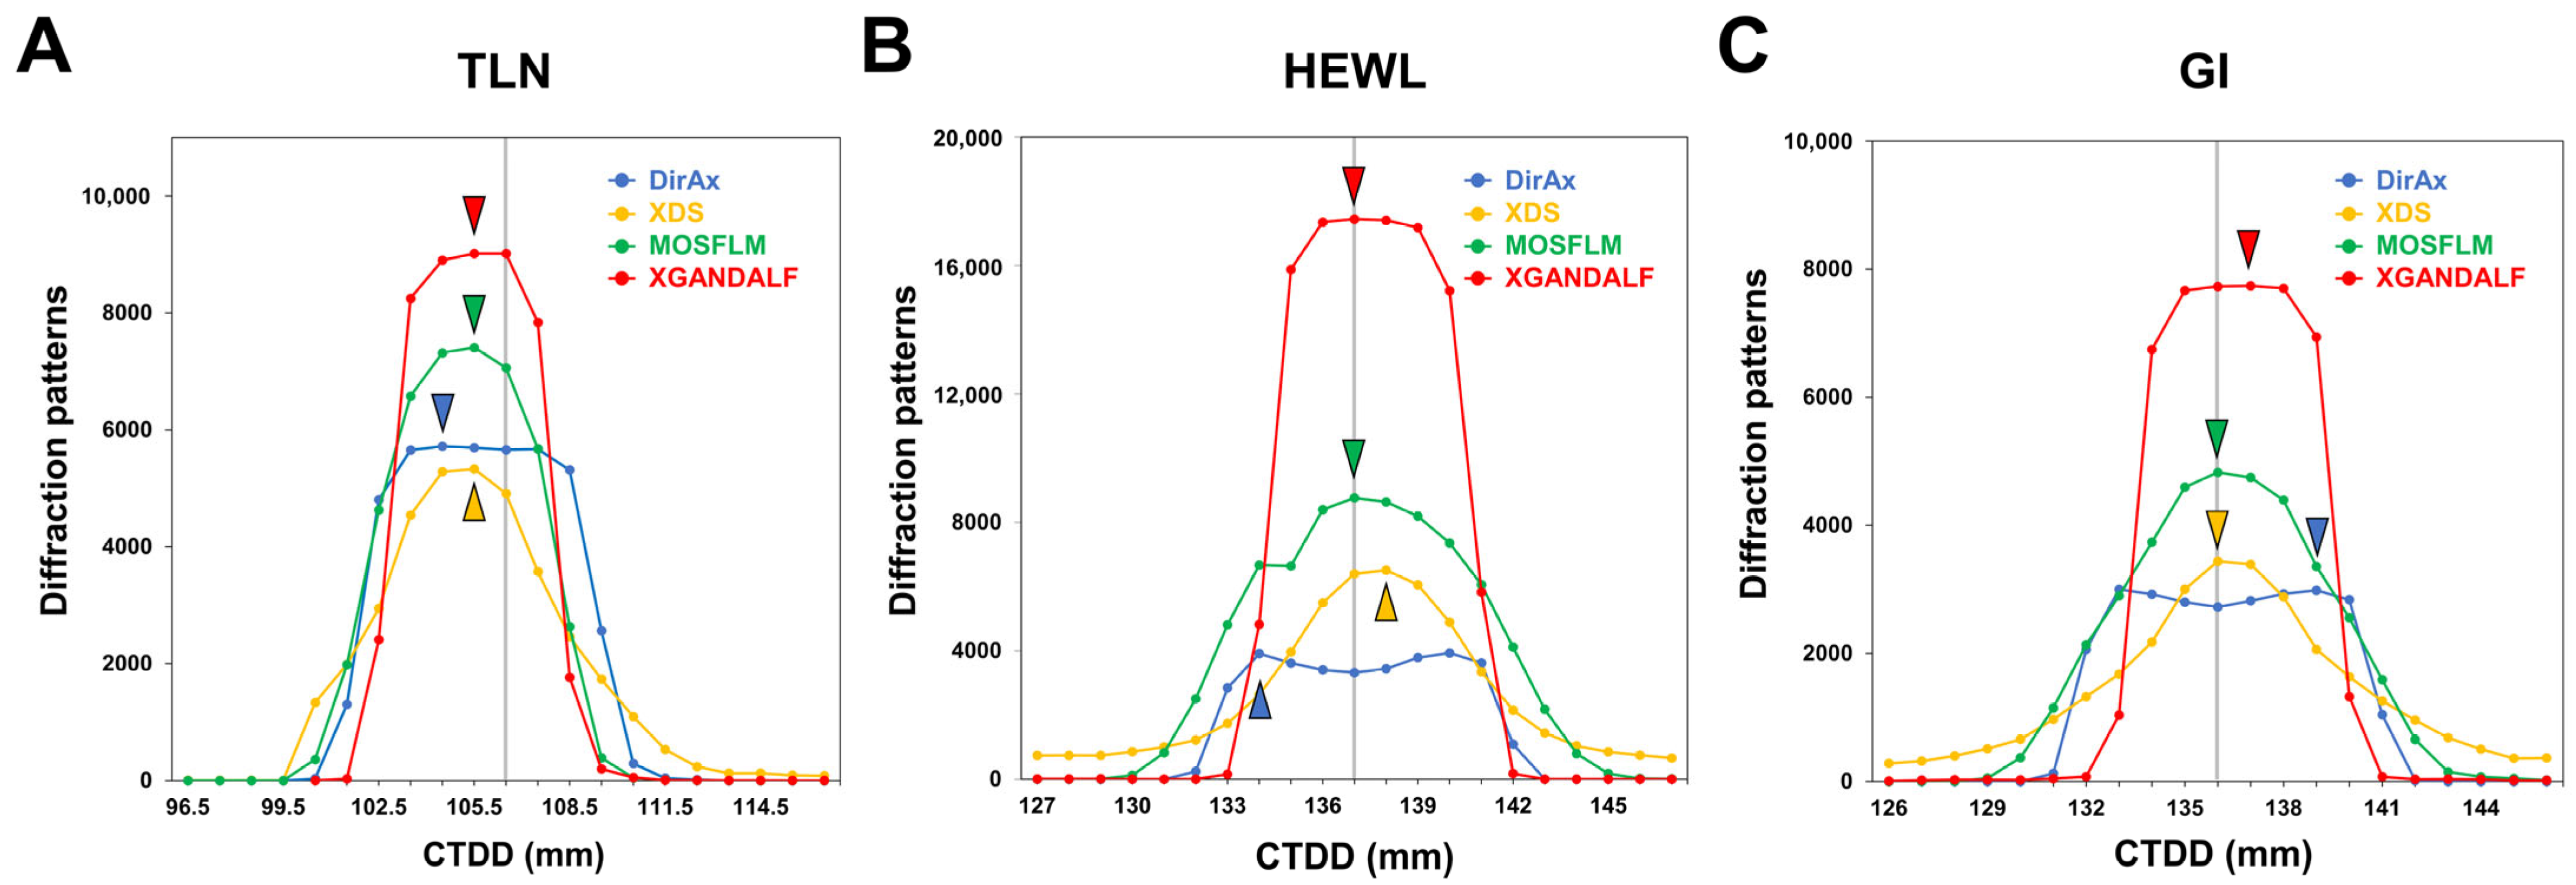
For the TLN dataset, a total of 10,061 hit images were indexed. At the optimized CTDD of 106.5 mm, the numbers of indexed images were 5658, 4911, 7063, and 9016 for DirAx, XDS, MOSFLM, and XGANDALF, respectively. When indexing was performed across various CTDD values, the maximum number of indexed diffraction patterns was 5718 for DirAx (101.06% relative to the optimized CTDD) at 104.5 mm, whereas the maxima for XDS (5331; 108.55%), MOSFLM (7408; 104.88%), and XGANDALF (9017; 100.1%) were observed at 105.5 mm (Figure 1A). These CTDD values, which yielded the maximum indexing efficiency, differed by 1–2 mm from the geometry-optimized CTDD.
For the HEWL dataset, a total of 15,483 hit images were indexed. At the optimized CTDD of 137 mm, the numbers of indexed images were 3322, 6397, 8762, and 17,445 for DirAx, XDS, MOSFLM, and XGANDALF, respectively (Figure 1B). When indexing was performed across various CTDD values, the maximum number of indexed diffraction patterns was 3913 for DirAx (117.79%) at 134 mm, whereas the maximum was 6511 for XDS (101.78%) at 138 mm. These CTDD values yielding maximum indexing efficiency differed by 3 mm for DirAx and 1 mm for XDS from the geometry-optimized CTDD. Meanwhile, the maximum numbers of indexed diffraction patterns, 8762 for MOSFLM and 17,445 for XGANDALF, were observed at a CTDD of 137 mm, corresponding to the optimized CTDD (Figure 1B).
For the GI dataset, a total of 11,932 hit images were indexed. At the optimized CTDD of 136 mm, the numbers of indexed images were 2724, 3439, 4826, and 7730 for DirAx, XDS, MOSFLM, and XGANDALF, respectively. When indexing was performed across various CTDD values, the maximum number of indexed diffraction patterns was 2986 for DirAx (109.61%) at 139 mm, whereas the maximum was 7740 for XGANDALF (100.12%) at 137 mm (Figure 1C). These CTDD values yielding maximum indexing efficiency differed by 3 mm for DirAx and 1 mm for XGANDAFL from the geometry-optimized CTDD. Meanwhile, the maximum numbers of indexed diffraction patterns, 3439 for XDS and 4826 for MOSFLM, were observed at a CTDD of 136 mm, corresponding to the optimized CTDD (Figure 1C).

3.3. Unit Cell Distribution Across CTDD Values

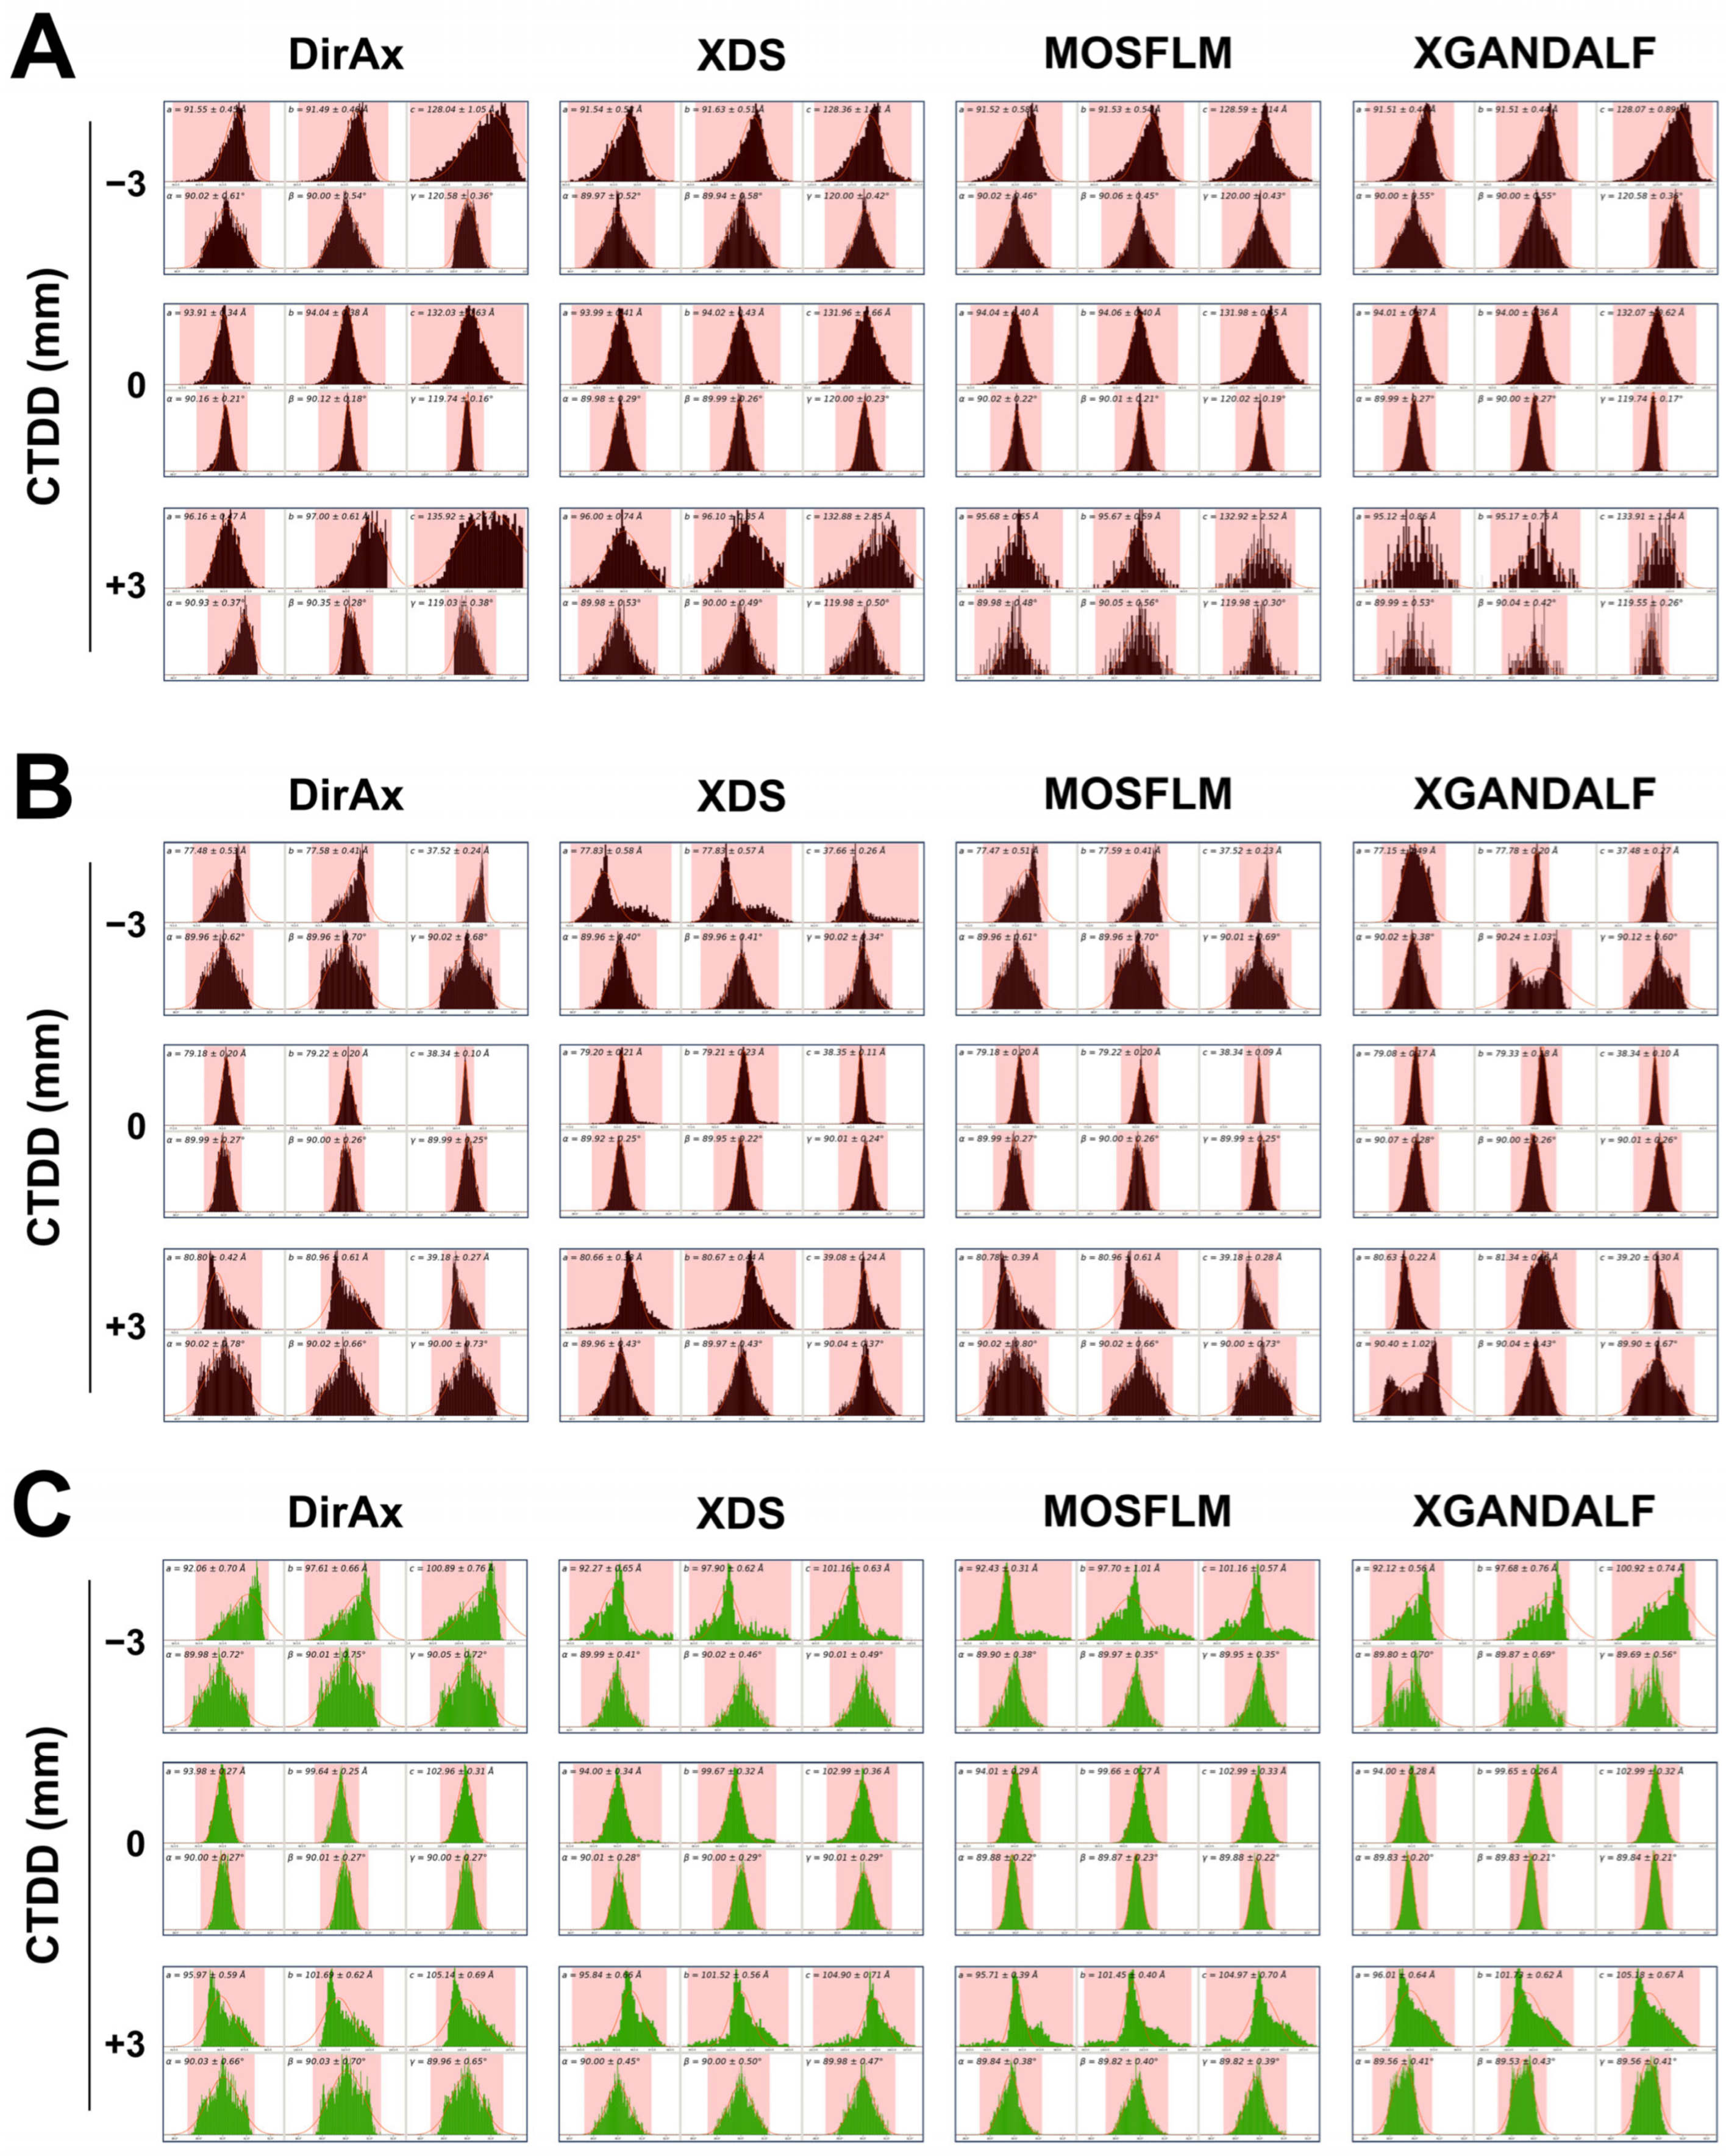
Inaccurate detector geometry, particularly the CTDD, can affect reflection position predictions and result in broadening of the unit cell parameter distribution during the indexing process [27,30]. To understand the pattern of the unit cell distribution of the indexed diffraction on the inaccuracy of CTDD, the unit cell distributions of indexed diffraction patterns of TLN, HEWL, and GI were analyzed. The distributions of all unit cell parameters (a, b, c, α, β, and γ) obtained from TLN, HEWL, and GI datasets processed using four indexing algorithms exhibited a Gaussian pattern at the optimized CTDD (Figure 2). However, when the processing CTDD deviated from the optimized value, the Gaussian distribution of the unit cell parameters became distorted (Figure 2). In addition, the mean unit cell dimensions shifted depending on the CTDD offset.
When the CTDD was smaller than the optimized value, the unit cell dimensions decreased. For example, in MOSFLM indexing, the a-axis dimensions for TLN, HEWL, and GI were 94, 79, and 93 Å, respectively, at the optimized CTDD. At −3 mm from the optimized value, the corresponding a-axis dimensions decreased to 91, 77, and 90 Å, respectively (Figure 2). In contrast, when the CTDD was larger than the optimized value, the unit cell dimensions increased. At +3 mm from the optimized CTDD, the a-axis dimensions of TLN, HEWL, and GI increased to 97, 83, and 96 Å, respectively (Figure 2).
These results are consistent with previous approaches used in serial crystallography (SX) data processing to identify the optimal CTDD. The present analysis indicates that monitoring both the distribution pattern and variance of unit cell parameters provides a practical strategy for estimating or refining the CTDD when its experimental value is uncertain.
Furthermore, the standard deviation of the unit cell parameter distribution increased as the CTDD deviated further from the optimized value. For example, in MOSFLM indexing at the optimized CTDD, the standard deviations of the a-axis for TLN, HEWL, and GI were ±0.4, ±0.3, and ±0.2 Å, respectively. At −3 mm, these values increased to ±0.5, ±0.6, and ±0.8 Å, respectively, whereas at +3 mm they further increased to ±0.6, ±0.7, and ±0.9 Å, respectively (Figure 2).
Although all indexing algorithms exhibited Gaussian distributions at the optimized CTDD for all datasets, the distortion patterns observed under shifted CTDD conditions were not identical among algorithms. For example, in the TLN dataset, most unit cell parameters exhibited a single-peak distribution across all algorithms, even when the CTDD was shifted. However, in the HEWL dataset, when the CTDD was inaccurate, XGANDALF processing produced bimodal distributions for α, β, and γ, rather than a single Gaussian peak. This finding indicates that the distortion pattern of unit cell distributions under inaccurate CTDD conditions may vary depending on both the dataset and the indexing algorithm.
Overall, increasing deviation from the optimized CTDD resulted in systematic shifts in unit cell parameters, distortion of the Gaussian distribution shape, and broadening of the indexed unit cell parameter distribution.

3.4. Data Processing Statistics Across CTDD Values

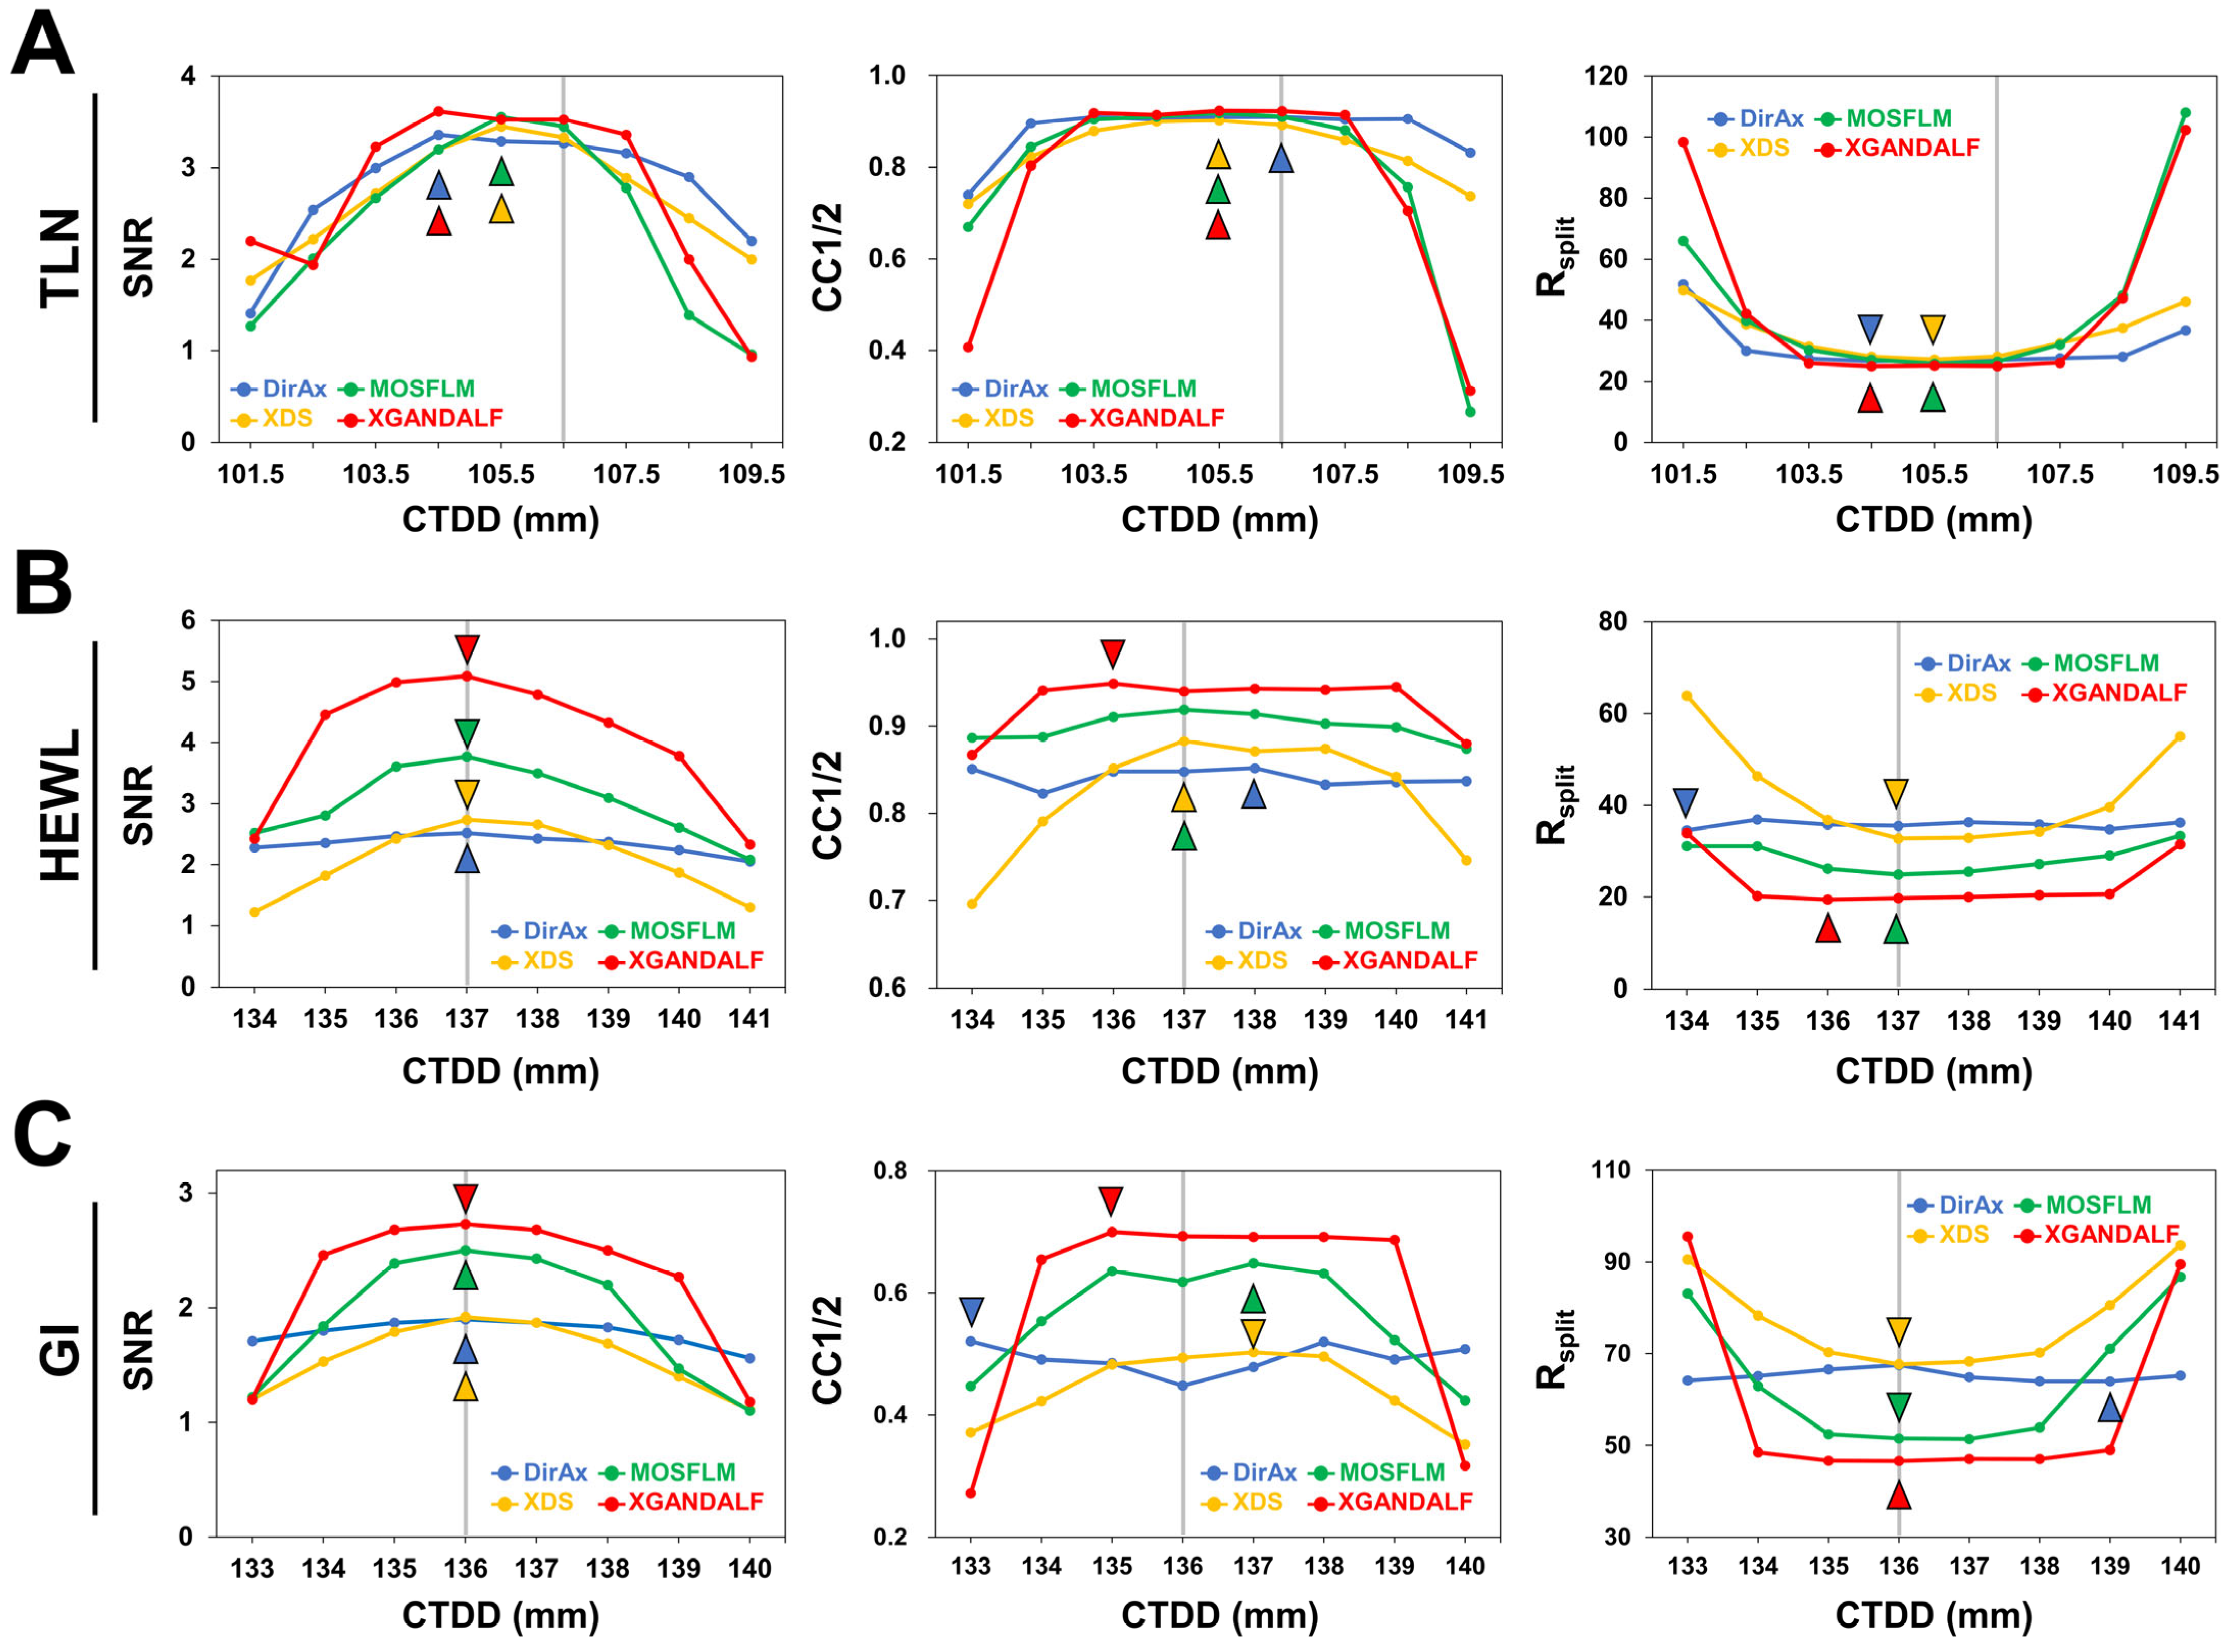
To investigate the effect of CTDD on data processing statistics, SNR, CC1/2, and Rsplit were analyzed from SFX data processing of the TLN, HEWL, and GI datasets. The SNR values of the TLN dataset processed using the four indexing algorithms were comparable. In contrast, for the HEWL and GI datasets, the SNR values obtained using MOSFLM and XGANDALF were higher than those obtained using the other indexing algorithms, which may be associated with differences in the number of integrated diffraction patterns.
The TLN dataset was processed to 1.8 Å resolution. The CTDD corresponding to the highest SNR and CC1/2 values was 104.5 mm for DirAx, whereas for XDS, MOSFLM, and XGANDALF, the highest SNR and CC1/2 values were observed at 105.5 mm (Figure 3A). These CTDD values were 1–2 mm smaller than the optimized CTDD value of 106.5 mm. However, the SNR, CC1/2, and Rsplit values at the optimized CTDD remained relatively stable within the CTDD range of 103.5–107.5 mm (Figure 3A).
The HEWL dataset was processed to 1.65 Å resolution. The highest SNR and CC1/2 values, along with the lowest Rsplit values, for HEWL processed by MOSFLM and XGANDALF were observed at an optimized CTDD of 137 mm (Figure 3B). Meanwhile, the highest SNR and CC1/2 values for DirAx and XDS were obtained at 134 and 138 mm, respectively. Overall, the SNR, CC1/2, and Rsplit values of the HEWL dataset were comparable within the CTDD range of 135–139 mm, including the optimized CTDD (Figure 3B).
The GI dataset was processed to 1.75 Å resolution. The highest SNR and CC1/2 values and the lowest Rsplit values for GI processed by XDS and MOSFLM were observed at an optimized CTDD of 136 mm (Figure 3C). In contrast, DirAx and XGANDALF showed their best statistical values at CTDDs of 139 and 137 mm, respectively (Figure 3C). Nevertheless, the SNR, CC1/2, and Rsplit values of the GI dataset remained similar within the CTDD range of 135–138 mm, encompassing the optimized CTDD.

3.5. Structure Determination Statistics of Datasets Processed at Various CTDD Values

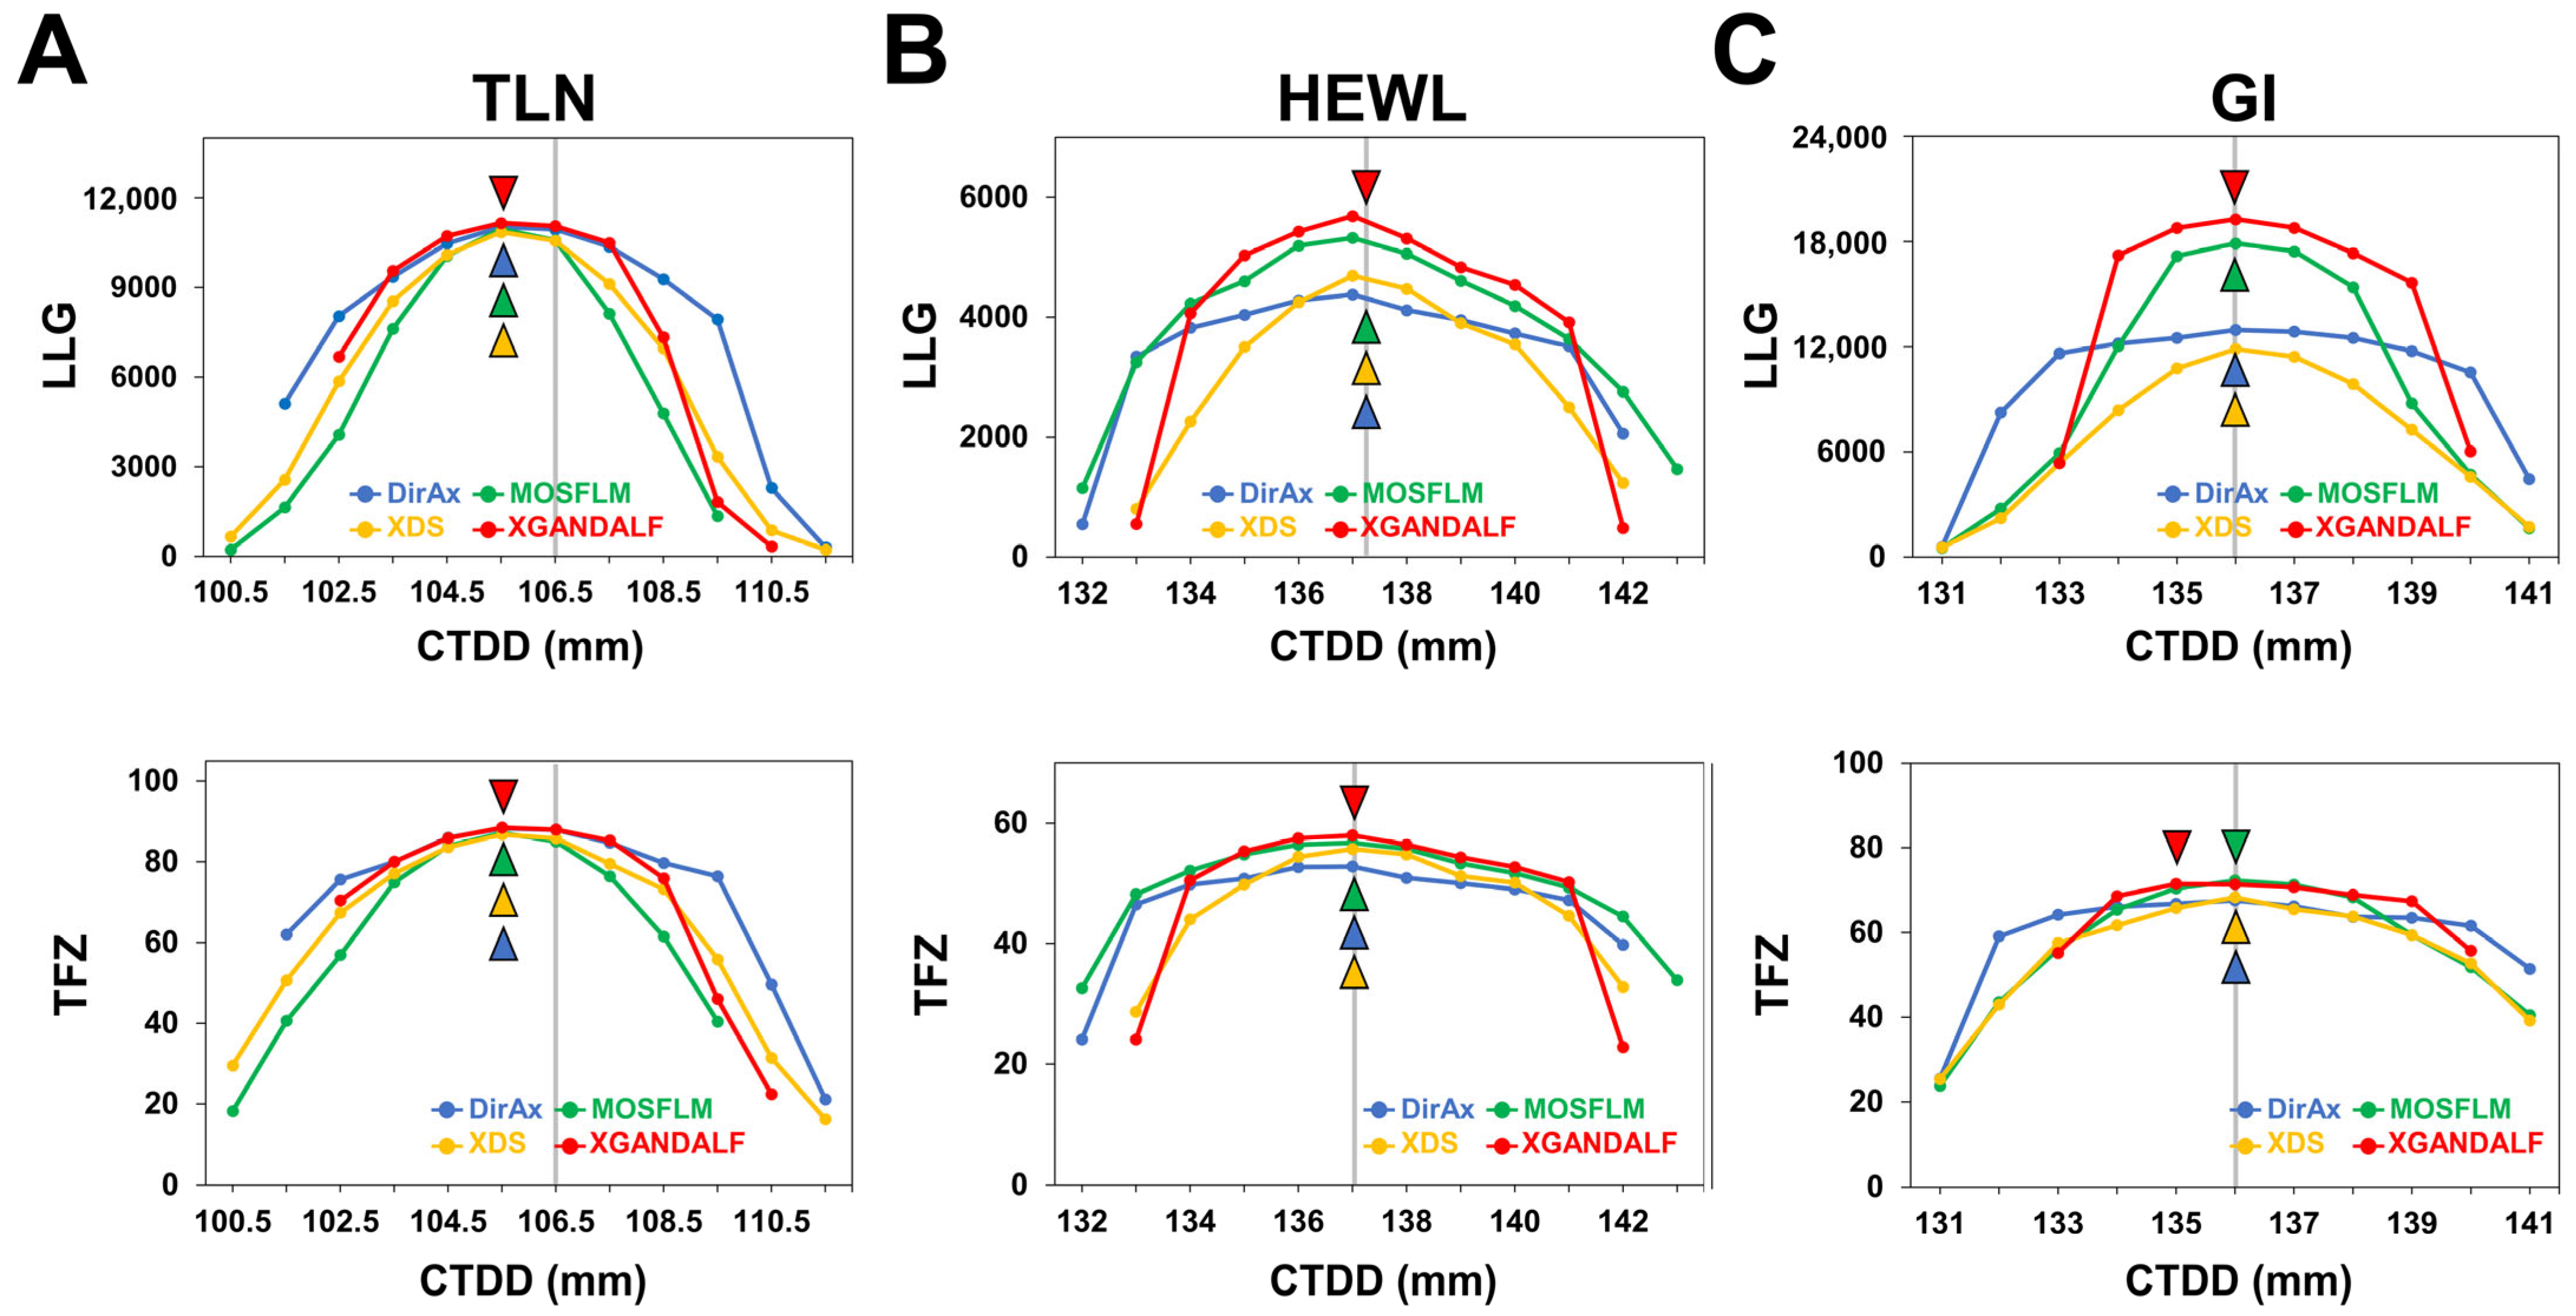
To investigate how CTDD accuracy affects phase determination using molecular replacement (MR), MR calculations were performed for all datasets, and the top log-likelihood gain (LLG) and translation function Z-score (TFZ) values were analyzed.
For the TLN dataset, the highest LLG (>10,860) and TFZ (>86) values were observed at a CTDD of 105.5 mm across all indexing algorithms, which is 1 mm smaller than the optimized CTDD value of 106.5 mm (Figure 4A). DirAx, XDS, and MOSFLM produced correct MR solutions over a CTDD range of 100.5–111.5 mm, whereas XGANDALF yielded correct MR solutions within a slightly narrower range of 101.5–110.5 mm.
For the HEWL dataset, the highest LLG (>4379) and TFZ (>52) values were observed at 137 mm across all indexing algorithms, which is identical to the optimized CTDD value (Figure 4B). The CTDD ranges yielding correct MR solutions were 132–142 mm for DirAx, 133–143 mm for XDS, 132–143 mm for MOSFLM, and 133–142 mm for XGANDALF.
For the GI dataset, the highest LLG (>11,871) and TFZ (>67) values were observed at 136 mm across all indexing algorithms, except for XGANDALF. For XGANDALF, the highest TFZ value (71.5) was obtained at 137 mm, which is 1 mm larger than the optimized CTDD value (Figure 4C). The CTDD ranges producing correct MR solutions were 130–142 mm for DirAx and MOSFLM, 130–145 mm for XDS, and 133–140 mm for XGANDALF.
These results indicate that the highest LLG and TFZ values were generally observed near the optimized CTDD. However, the CTDD tolerance range yielding correct MR solutions varied depending on both the indexing algorithm and the dataset. In general, the CTDD range producing correct MR solutions with XGANDALF was narrower than that obtained using the other indexing algorithms.
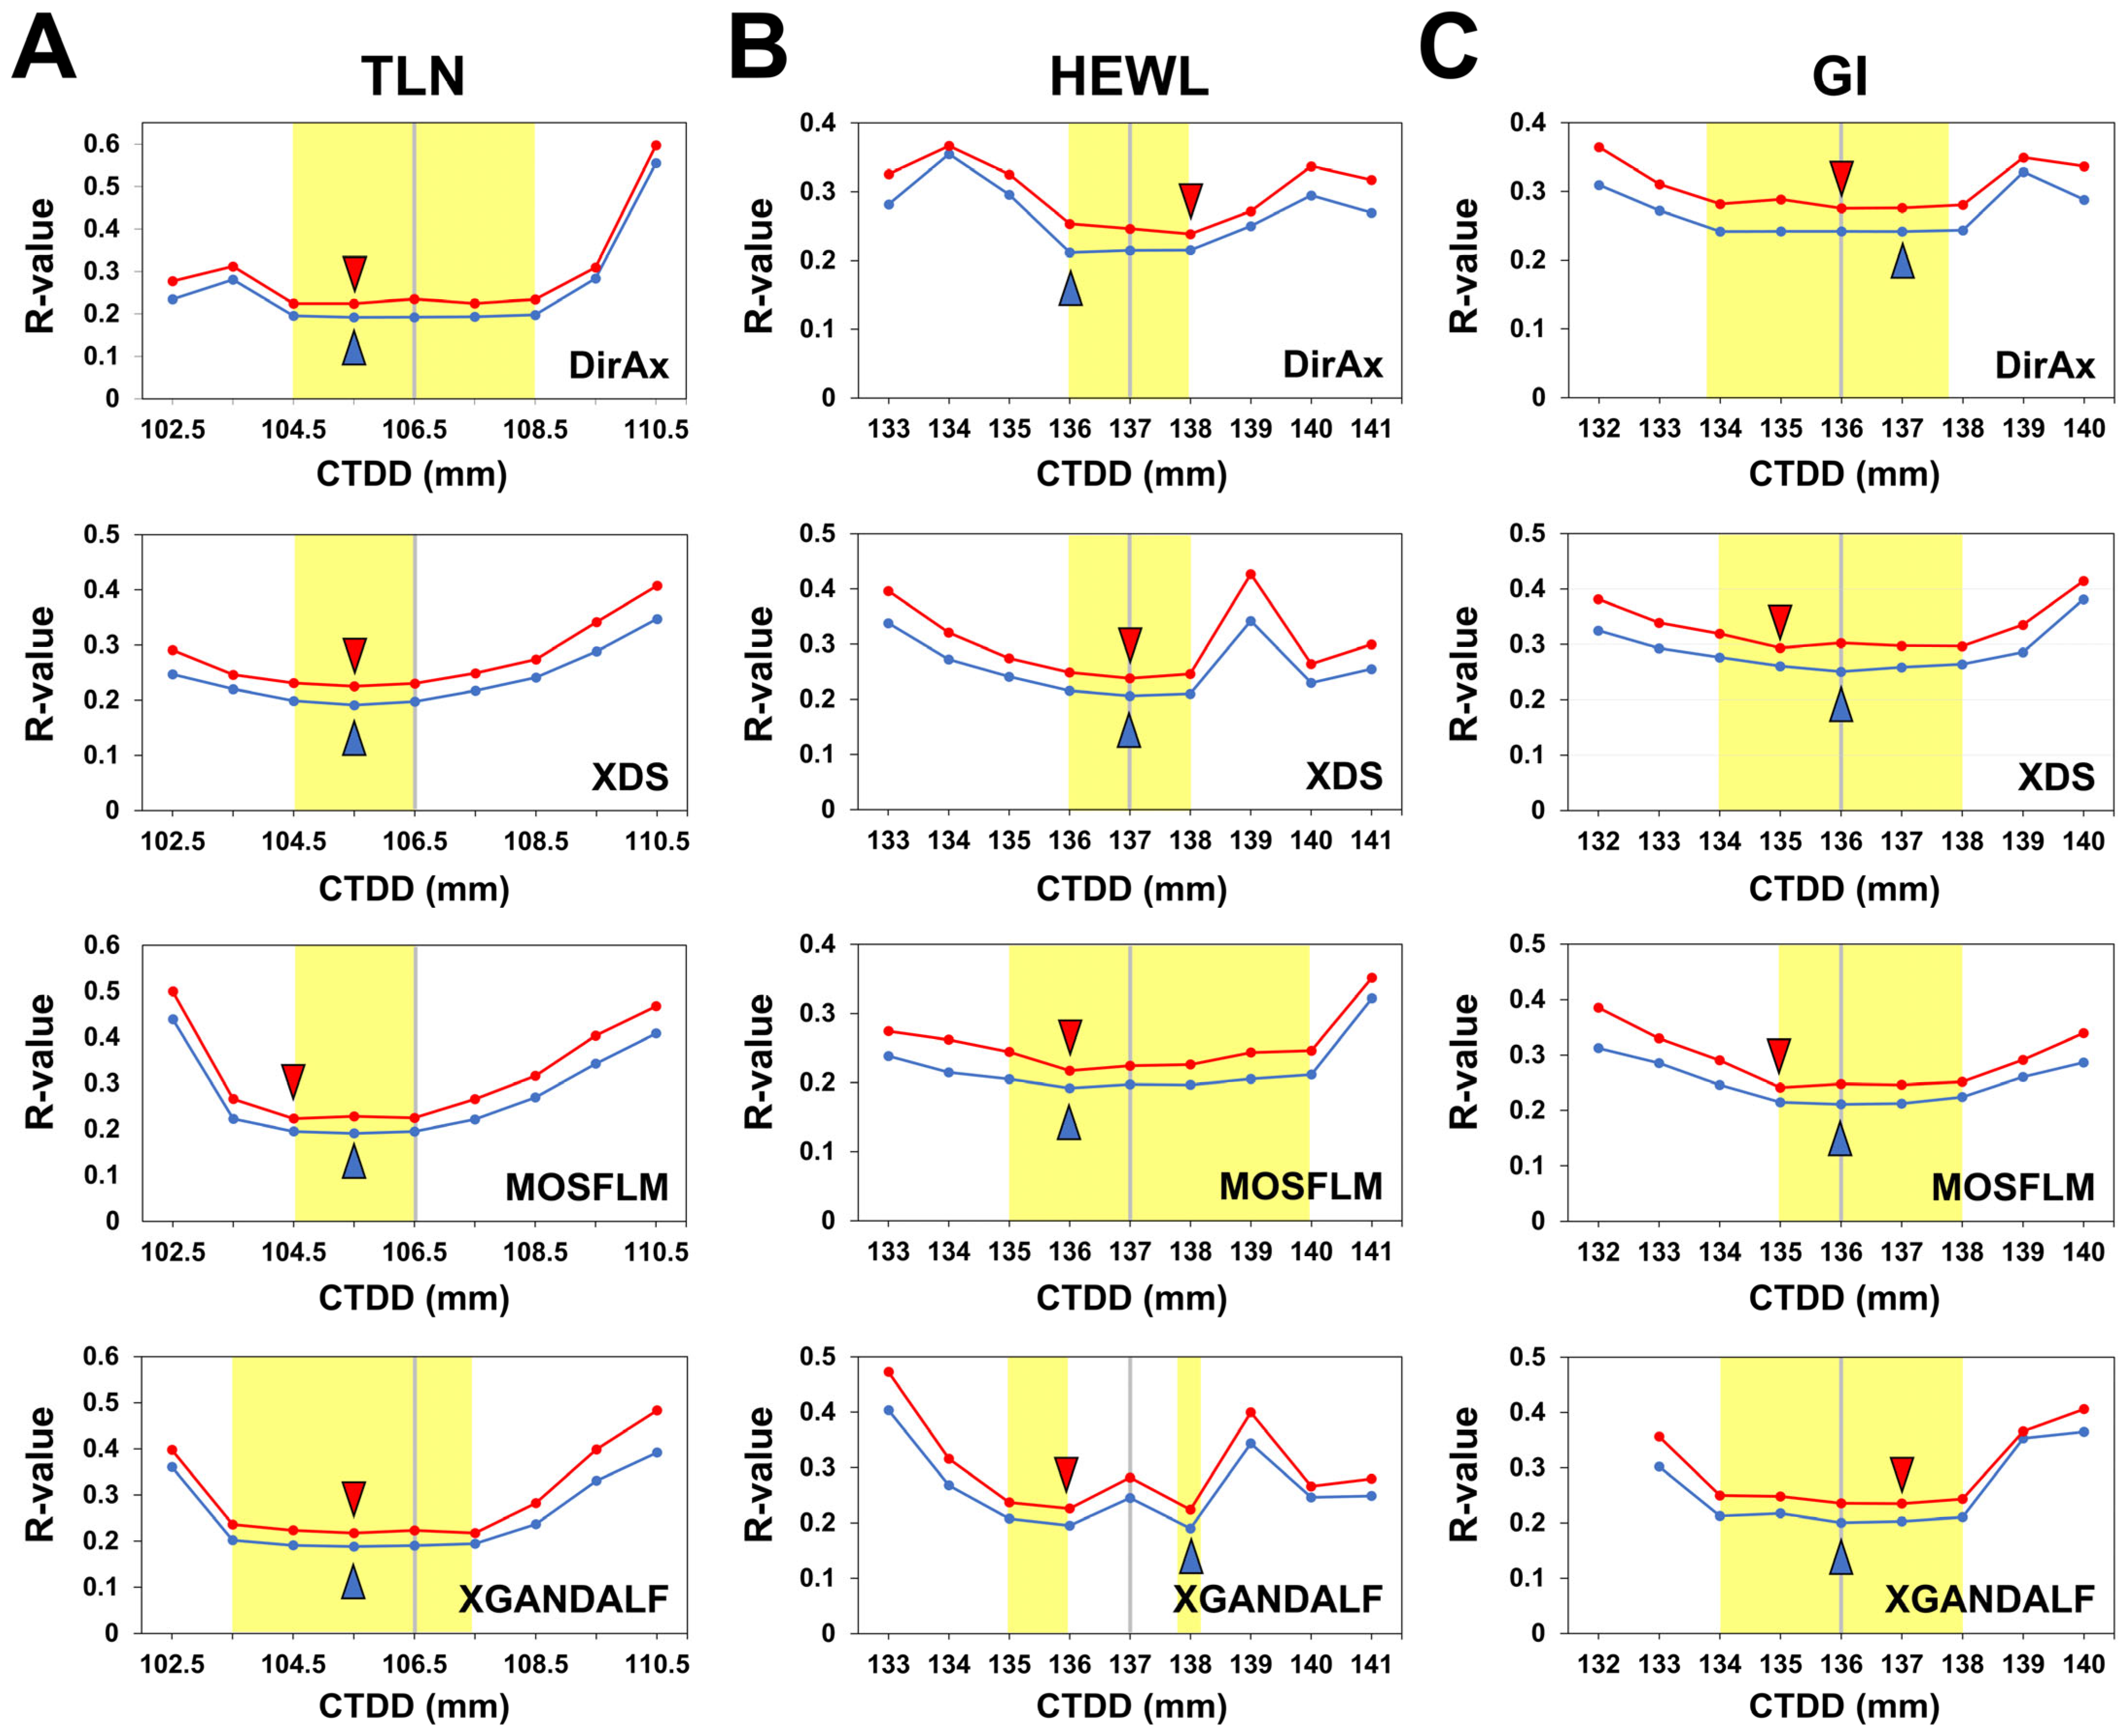
Structure refinement of TLN, HEWL, and GI using MR solutions showed that the lowest Rwork and Rfree values were observed near the optimized CTDD, typically within ±1 mm of the optimized value for all datasets and indexing algorithms. However, the overall trends of the R-value plots differed slightly among datasets and indexing algorithms.
For the TLN dataset, Rwork and Rfree values remained within 90% of the minimum R-values across CTDD ranges of 104.5–108.5 mm for DirAx, 104.5–106.5 mm for XDS and MOSFLM, and 103.5–107.5 mm for XGANDALF (Figure 5A). For the HEWL dataset, Rwork and Rfree values remained within 90% of the minimum R-values across CTDD ranges of 106–108 mm for DirAx and MOSFLM (Figure 5B). In general, as the CTDD deviated further from the optimized value, Rwork and Rfree tended to increase. However, unexpectedly high R-value peaks were observed for HEWL processed by XDS and XGANDALF at a CTDD of 139 mm. In addition, the R-values of XGANDALF at the optimized CTDD of 137 mm were slightly higher than those at 136 and 138 mm (Figure 5B). For the GI dataset, Rwork and Rfree values showed trends similar to those observed for TLN, with the lowest R-values identified within CTDD ranges of 134–138 mm for DirAx, XDS, and XGANDALF, and 135–138 mm for MOSFLM (Figure 5C). As with the other datasets, increasing deviation from the optimized CTDD generally resulted in increased Rwork and Rfree values.

4. Discussion

Data processing parameters, including detector geometry and the CTDD, are critical for the accuracy and efficiency of X-ray diffraction data processing. In SFX, the CTDD parameter may vary during sample delivery or following reinstallation of the sample delivery device or experimental setup, including the detector. Understanding the effect of CTDD shifts and their tolerance range is particularly important for data processing. In this study, to provide insight into SFX data processing, we investigated the effects of varying CTDD values and different indexing algorithms on TLN, HEWL, and GI datasets collected using the PAL-XFEL.
Indexing results for the TLN, HEWL, and GI datasets showed that indexing efficiency differed depending on the indexing algorithm, and the maximum indexing efficiency was not necessarily observed at the optimized CTDD. This finding is consistent with previous reports from SSX data processing [32]. However, the indexable CTDD range differed between the SFX and SSX datasets. For example, in this study, the indexable CTDD ranges (defined as >50% of the maximum indexing efficiency) for HEWL and GI processed by MOSFLM were ±4 mm and ±3 mm, respectively. In contrast, the corresponding indexable ranges for HEWL and GI in previously reported SSX data were approximately ±8 mm [32]. These results indicate that the CTDD tolerance range in the SFX datasets is narrower than that reported for the SSX datasets. In SFX, each diffraction pattern typically records only partial reflections because the ultrashort XFEL pulse samples only a fraction of the full angular width of each Bragg reflection [46]. As a result, accurate partiality modeling and precise spot position prediction are critical for successful indexing. Even small geometric inaccuracies, such as slight deviations in CTDD, can therefore significantly affect indexing performance. SSX experiments using synchrotron X-ray provide structural information comparable to that obtained from SFX experiments [47]. Meanwhile, SSX generally employs millisecond exposure times with synchrotron X-rays, during which slight crystal motion may occur [48,49], allowing a larger portion of the reciprocal lattice point to intersect the Ewald sphere, thereby leading to diffraction spots with relatively lower partiality than those observed in single-shot diffraction patterns from SFX experiments. Consequently, SSX data processing may exhibit greater tolerance to small geometry errors than SFX.
In general, accurate indexing parameters, including the CTDD, are expected to result in higher indexing efficiency. However, our data processing results showed that the highest indexing efficiency was not always observed at the optimized CTDD. In some cases, slightly shifted CTDD values yielded higher indexing rates than the optimized value. Accordingly, indexing efficiency alone should not be considered a definitive indicator for determining the optimal CTDD during data processing.
Analysis of the unit cell parameter distributions for TLN, HEWL, and GI datasets processed using all indexing algorithms, including DirAx, XDS, MOSFLM, and XGANDALF, clearly demonstrated that, at the optimized CTDD, the unit cell parameters exhibited Gaussian distributions with relatively narrow standard deviations. These findings agree with previous reports showing that Gaussian distributions of unit cell parameters are typically observed near the optimal detector distance. Therefore, when the accurate CTDD is not predefined before data processing, the optimal CTDD can be identified through the analysis of the unit cell distribution pattern.
Analysis of the data processing statistics showed that the CTDD values yielding the highest data quality for datasets processed using XDS, MOSFLM, and XGANDALF were generally located within ±1 mm of the optimized CTDD, whereas for DirAx, the CTDD values associated with the highest data quality were relatively farther from the optimized CTDD. The CTDD positions exhibiting higher SNR, CC1/2, and lower Rsplit values for TLN, HEWL, and GI were almost identical to the CTDD positions with a larger number of indexed diffraction patterns. This observation indicates that data processing statistics are influenced by the accuracy of the CTDD parameter and the number of merged diffraction patterns.
Molecular replacement demonstrated that phase determination was still successful even when the processing CTDD deviated by more than ±5 mm from the optimized CTDD value. These results indicate that moderate CTDD deviations do not critically impair phase determination. In addition, initial structure refinement showed that acceptable R-values were observed near the optimized CTDD within a range of ±3–5 mm.
Overall, the SFX data analysis indicated that the CTDD tolerance for data processing and structure determination was approximately ±3–5 mm from the optimized CTDD. Meanwhile, for high-quality final data processing of SFX datasets, accurate refinement of the CTDD and subsequent reprocessing using the optimized detector distance remain essential. Accordingly, although a certain CTDD tolerance can be allowed during preliminary data processing, precise CTDD optimization is still required for final high-quality data processing.
Detector geometry optimization, including CTDD refinement, is typically performed iteratively during data processing. Therefore, optimizing the CTDD during beamtime may not be efficient in terms of real-time data processing and rapid data evaluation. In this study, we showed that when the processing CTDD was within several millimeters of the optimized CTDD value, indexing efficiency, MR solutions, and initial refinement statistics were not critically affected. Therefore, when rapidly evaluating the feasibility of structure determination during beamtime, data processing can be performed using the experimentally determined CTDD and several nearby CTDD values within ±3 mm. By analyzing the unit cell parameter distributions and confirming an approximately Gaussian distribution pattern, preliminary MR solutions can be performed within this CTDD tolerance range.
Meanwhile, to obtain reliable MR solutions through rapid real-time processing, sufficient diffraction patterns satisfying completeness requirements are necessary. The number of diffraction images required for structure determination depends on data quality and space group. Based on previous PAL-XFEL SFX studies, approximately 1000 diffraction patterns were sufficient to obtain MR solutions and interpretable electron density maps for orthorhombic P212121 space group structures such as HviGH11 [50] and myoglobin [51]. In summary, the CTDD parameter can influence indexing efficiency, data processing statistics, and structure refinement results. However, CTDD shifts within ±3–5 mm did not prevent successful structure determination in this study. These findings provide practical insight into SFX data processing strategies for datasets collected at PAL-XFEL.
In this study, we focused on the effect of the CTDD on SFX data collected at PAL-XFEL, which provides a practical guideline for PAL-XFEL users. However, the results of data processing can be influenced not only by CTDD but also by other factors such as the experimental setup, X-ray characteristics, detector specifications, and the type and quality of the sample. Therefore, the tolerance range of the CTDD obtained in this study may not necessarily be applicable to other facilities or experimental configurations. Accordingly, rather than the exact numerical values, the overall trend in data quality observed in this study should be considered.

5. Conclusions

In this study, the effects of CTDD variations on SFX data collected using the PAL-XFEL were systematically investigated. As the CTDD deviated from the optimized value, the distribution of unit cell parameters became progressively distorted. However, within a tolerance of several millimeters from the optimized CTDD, no significant adverse effects were observed in terms of data processing statistics or structure determination outcomes. These findings contribute to a better understanding of the impact of CTDD variations not only in SFX data processing at PAL-XFEL but also in SX data processing more broadly. The results provide practical guidance for improving data processing efficiency and optimizing experimental workflows in future SFX experiments.

Author Contributions

Conceptualization, K.H.N.; validation, K.H.N., S.P. and J.P.; formal analysis, K.H.N.; writing—original draft preparation, K.H.N.; writing—review and editing, S.P. and J.P.; visualization, K.H.N. All authors have read and agreed to the published version of the manuscript.

Funding

This study was supported by PAL-XFEL, with funding provided in part by MSIT and POSTECH (XFEL2025-01), and by Kookmin University. This work was supported by the National Research Foundation of Korea (NRF) grant funded by the Korea government (MSIT) (RS-2026-25496931).

Data Availability Statement

The data that support the findings of this study are available on request from the corresponding author.

Acknowledgments

The authors thank the beamline staff at Pohang Accelerator Laboratory X-ay Free-electron Laser (PAL-XFEL) for their assistance with data collection. The authors thank the Global Science Data hub Center (GSDC) at the Korea Institute of Science and Technology Information (KISTI) for providing computing resources and technical support. The XFEL experiments were carried out at the NCI endstation at PAL-XFEL (Proposal No. 2025-2nd-NCI-I002). During manuscript preparation, the authors used ChatGPT-5.2 and Trinka AI to improve grammar and language clarity.

Conflicts of Interest

The authors declare no conflicts of interest.

Abbreviations

The following abbreviations are used in this manuscript:
PALPohang Accelerator Laboratory
XFELX-ray Free Electron Laser
CTDDCrystal-to-detector distance
TLNThermolysin
HEWLHen egg white lysozyme
GIGlucose isomerase

References

  1. White, T.A.; Barty, A.; Stellato, F.; Holton, J.M.; Kirian, R.A.; Zatsepin, N.A.; Chapman, H.N. Crystallographic Data Processing for Free-Electron Laser Sources. Acta Crystallogr. D Biol. Crystallogr. 2013, 69, 1231–1240. [Google Scholar] [CrossRef]
  2. Schlichting, I. Serial Femtosecond Crystallography: The First Five Years. IUCrJ 2015, 2, 246–255. [Google Scholar] [CrossRef]
  3. Martin-Garcia, J.M.; Conrad, C.E.; Coe, J.; Roy-Chowdhury, S.; Fromme, P. Serial Femtosecond Crystallography: A Revolution in Structural Biology. Arch. Biochem. Biophys. 2016, 602, 32–47. [Google Scholar] [CrossRef]
  4. Barends, T.R.M.; Stauch, B.; Cherezov, V.; Schlichting, I. Serial Femtosecond Crystallography. Nat. Rev. Methods Primers 2022, 2, 59. [Google Scholar] [CrossRef] [PubMed]
  5. Williams, L.J.; Thompson, A.J.; Dijkstal, P.; Appleby, M.; Assmann, G.; Dworkowski, F.S.N.; Hiller, N.; Huang, C.-Y.; Mason, T.; Perrett, S.; et al. Damage before Destruction? X-Ray-Induced Changes in Single-Pulse Serial Femtosecond Crystallography. IUCrJ 2025, 12, 358–371. [Google Scholar] [CrossRef]
  6. Schmidt, M. Time-Resolved Macromolecular Crystallography at Pulsed X-Ray Sources. Int. J. Mol. Sci. 2019, 20, 1401. [Google Scholar] [CrossRef]
  7. Orville, A.M. Recent Results in Time Resolved Serial Femtosecond Crystallography at XFELs. Curr. Opin. Struct. Biol. 2020, 65, 193–208. [Google Scholar] [CrossRef]
  8. Poddar, H.; Heyes, D.J.; Schirò, G.; Weik, M.; Leys, D.; Scrutton, N.S. A Guide to Time-resolved Structural Analysis of Light-activated Proteins. FEBS J. 2022, 289, 576–595. [Google Scholar] [CrossRef]
  9. Westenhoff, S.; Meszaros, P.; Schmidt, M. Protein Motions Visualized by Femtosecond Time-Resolved Crystallography: The Case of Photosensory vs Photosynthetic Proteins. Curr. Opin. Struct. Biol. 2022, 77, 102481. [Google Scholar] [CrossRef] [PubMed]
  10. Smyth, P.; Jaho, S.; Williams, L.J.; Karras, G.; Fitzpatrick, A.; Thompson, A.J.; Battah, S.; Axford, D.; Horrell, S.; Lučić, M.; et al. Time-Resolved Serial Synchrotron and Serial Femtosecond Crystallography of Heme Proteins Using Photocaged Nitric Oxide. IUCrJ 2025, 12, 582–594. [Google Scholar] [CrossRef] [PubMed]
  11. Stagno, J.R.; Liu, Y.; Bhandari, Y.R.; Conrad, C.E.; Panja, S.; Swain, M.; Fan, L.; Nelson, G.; Li, C.; Wendel, D.R.; et al. Structures of Riboswitch RNA Reaction States by Mix-and-Inject XFEL Serial Crystallography. Nature 2017, 541, 242–246. [Google Scholar] [CrossRef]
  12. Kupitz, C.; Olmos, J.L.; Holl, M.; Tremblay, L.; Pande, K.; Pandey, S.; Oberthür, D.; Hunter, M.; Liang, M.; Aquila, A.; et al. Structural Enzymology Using X-Ray Free Electron Lasers. Struct. Dyn. 2017, 4, 044003. [Google Scholar] [CrossRef]
  13. Orville, A.M. Entering an Era of Dynamic Structural Biology. BMC Biol. 2018, 16, 55. [Google Scholar] [CrossRef] [PubMed]
  14. Olmos, J.L.; Pandey, S.; Martin-Garcia, J.M.; Calvey, G.; Katz, A.; Knoska, J.; Kupitz, C.; Hunter, M.S.; Liang, M.; Oberthuer, D.; et al. Enzyme Intermediates Captured “on the Fly” by Mix-and-Inject Serial Crystallography. BMC Biol. 2018, 16, 59. [Google Scholar] [CrossRef]
  15. Park, J.; Nam, K.H. Recent Chemical Mixing Devices for Time-Resolved Serial Femtosecond Crystallography. TrAC Trends Anal. Chem. 2024, 172, 117554. [Google Scholar] [CrossRef]
  16. Henkel, A.; Oberthür, D. A Snapshot Love Story: What Serial Crystallography Has Done and Will Do for Us. Acta Crystallogr. D Struct. Biol. 2024, 80, 563–579. [Google Scholar] [CrossRef] [PubMed]
  17. Kim, J.; Kim, Y.; Park, J.; Nam, K.H.; Cho, Y. Structural Mechanism of Escherichia coli Cyanase. Acta Crystallogr. D Struct. Biol. 2023, 79, 1094–1108. [Google Scholar] [CrossRef] [PubMed]
  18. Boutet, S.; Lomb, L.; Williams, G.J.; Barends, T.R.M.; Aquila, A.; Doak, R.B.; Weierstall, U.; DePonte, D.P.; Steinbrener, J.; Shoeman, R.L.; et al. High-Resolution Protein Structure Determination by Serial Femtosecond Crystallography. Science 2012, 337, 362–364. [Google Scholar] [CrossRef]
  19. Chapman, H.N.; Fromme, P.; Barty, A.; White, T.A.; Kirian, R.A.; Aquila, A.; Hunter, M.S.; Schulz, J.; DePonte, D.P.; Weierstall, U.; et al. Femtosecond X-Ray Protein Nanocrystallography. Nature 2011, 470, 73–77. [Google Scholar] [CrossRef]
  20. Oda, K.; Nomura, T.; Nakane, T.; Yamashita, K.; Inoue, K.; Ito, S.; Vierock, J.; Hirata, K.; Maturana, A.D.; Katayama, K.; et al. Time-Resolved Serial Femtosecond Crystallography Reveals Early Structural Changes in Channelrhodopsin. eLife 2021, 10, e62389. [Google Scholar] [CrossRef] [PubMed]
  21. Grünbein, M.L.; Nass Kovacs, G. Sample Delivery for Serial Crystallography at Free-Electron Lasers and Synchrotrons. Acta Crystallogr. D Struct. Biol. 2019, 75, 178–191. [Google Scholar] [CrossRef]
  22. Zhao, F.; Zhang, B.; Yan, E.; Sun, B.; Wang, Z.; He, J.; Yin, D. A Guide to Sample Delivery Systems for Serial Crystallography. FEBS J. 2019, 286, 4402–4417. [Google Scholar] [CrossRef] [PubMed]
  23. Manna, A.; Doppler, D.; Sripati, M.P.; Sonker, M.; Ros, A. Sample Delivery Methods for Protein X-Ray Crystallography with a Special Focus on Sample Consumption. Nat. Commun. 2025, 16, 9856. [Google Scholar] [CrossRef] [PubMed]
  24. Lyubimov, A.Y.; Uervirojnangkoorn, M.; Zeldin, O.B.; Brewster, A.S.; Murray, T.D.; Sauter, N.K.; Berger, J.M.; Weis, W.I.; Brunger, A.T. IOTA: Integration Optimization, Triage and Analysis Tool for the Processing of XFEL Diffraction Images. J. Appl. Crystallogr. 2016, 49, 1057–1064. [Google Scholar] [CrossRef]
  25. Mizohata, E.; Nakane, T.; Fukuda, Y.; Nango, E.; Iwata, S. Serial Femtosecond Crystallography at the SACLA: Breakthrough to Dynamic Structural Biology. Biophys. Rev. 2018, 10, 209–218. [Google Scholar] [CrossRef] [PubMed]
  26. Sunada, S.; Harayama, T.; Arai, K.; Yoshimura, K.; Davis, P.; Tsuzuki, K.; Uchida, A. Chaos Laser Chips with Delayed Optical Feedback Using a Passive Ring Waveguide. Opt. Express 2011, 19, 5713. [Google Scholar] [CrossRef]
  27. White, T.A.; Kirian, R.A.; Martin, A.V.; Aquila, A.; Nass, K.; Barty, A.; Chapman, H.N. CrystFEL: A Software Suite for Snapshot Serial Crystallography. J. Appl. Crystallogr. 2012, 45, 335–341. [Google Scholar] [CrossRef]
  28. Yefanov, O.; Mariani, V.; Gati, C.; White, T.A.; Chapman, H.N.; Barty, A. Accurate Determination of Segmented X-Ray Detector Geometry. Opt. Express 2015, 23, 28459. [Google Scholar] [CrossRef] [PubMed]
  29. Kroon-Batenburg, L.M.J.; Schreurs, A.M.M.; Ravelli, R.B.G.; Gros, P. Accounting for Partiality in Serial Crystallography Using Ray-Tracing Principles. Acta Crystallogr. D Biol. Crystallogr. 2015, 71, 1799–1811. [Google Scholar] [CrossRef]
  30. Kabsch, W.  XDS. Acta Crystallogr. D Biol. Crystallogr. 2010, 66, 125–132. [Google Scholar] [CrossRef]
  31. Nam, K.H. Effects of Beam Center Position Shifts on Data Processing in Serial Crystallography. Crystals 2025, 15, 185. [Google Scholar] [CrossRef]
  32. Nam, K.H. Effect of Crystal-to-Detector Distance Shift on Data Processing in Serial Crystallography. PLoS ONE 2025, 20, e0327019. [Google Scholar] [CrossRef]
  33. Park, J.; Nam, K.H. Sample Delivery Systems for Serial Femtosecond Crystallography at the PAL-XFEL. Photonics 2023, 10, 557. [Google Scholar] [CrossRef]
  34. Maia, F.R.N.C. The Coherent X-Ray Imaging Data Bank. Nat. Methods 2012, 9, 854–855. [Google Scholar] [CrossRef]
  35. Barty, A.; Kirian, R.A.; Maia, F.R.N.C.; Hantke, M.; Yoon, C.H.; White, T.A.; Chapman, H. Cheetah: Software for High-Throughput Reduction and Analysis of Serial Femtosecond X-Ray Diffraction Data. J. Appl. Crystallogr. 2014, 47, 1118–1131. [Google Scholar] [CrossRef]
  36. White, T.A.; Mariani, V.; Brehm, W.; Yefanov, O.; Barty, A.; Beyerlein, K.R.; Chervinskii, F.; Galli, L.; Gati, C.; Nakane, T.; et al. Recent Developments in CrystFEL. J. Appl. Crystallogr. 2016, 49, 680–689. [Google Scholar] [CrossRef]
  37. Duisenberg, A.J.M. Indexing in Single-Crystal Diffractometry with an Obstinate List of Reflections. J. Appl. Crystallogr. 1992, 25, 92–96. [Google Scholar] [CrossRef]
  38. Powell, H.R. The Rossmann Fourier Autoindexing Algorithm in MOSFLM. Acta Crystallogr. D Biol. Crystallogr. 1999, 55, 1690–1695. [Google Scholar] [CrossRef]
  39. Gevorkov, Y.; Yefanov, O.; Barty, A.; White, T.A.; Mariani, V.; Brehm, W.; Tolstikova, A.; Grigat, R.-R.; Chapman, H.N. XGANDALF—Extended Gradient Descent Algorithm for Lattice Finding. Acta Crystallogr. A Found. Adv. 2019, 75, 694–704. [Google Scholar] [CrossRef]
  40. Nam, K.H.; Na, S.-H. Serial Femtosecond Crystallography Data Processing at the Global Science Data Hub Center at KISTI. Sci. Rep. 2026, 16, 6786. [Google Scholar] [CrossRef] [PubMed]
  41. Liebschner, D.; Afonine, P.V.; Baker, M.L.; Bunkóczi, G.; Chen, V.B.; Croll, T.I.; Hintze, B.; Hung, L.-W.; Jain, S.; McCoy, A.J.; et al. Macromolecular Structure Determination Using X-Rays, Neutrons and Electrons: Recent Developments in Phenix. Acta Crystallogr. D Struct. Biol. 2019, 75, 861–877. [Google Scholar] [CrossRef]
  42. Nam, K.H. Structural Analysis of Metal Chelation of the Metalloproteinase Thermolysin by 1,10-Phenanthroline. J. Inorg. Biochem. 2021, 215, 111319. [Google Scholar] [CrossRef]
  43. Lee, D.; Baek, S.; Park, J.; Lee, K.; Kim, J.; Lee, S.J.; Chung, W.K.; Lee, J.-L.; Cho, Y.; Nam, K.H. Nylon Mesh-Based Sample Holder for Fixed-Target Serial Femtosecond Crystallography. Sci. Rep. 2019, 9, 6971. [Google Scholar] [CrossRef]
  44. Nam, K.H. Room-Temperature Structure of Xylitol-Bound Glucose Isomerase by Serial Crystallography: Xylitol Binding in the M1 Site Induces Release of Metal Bound in the M2 Site. Int. J. Mol. Sci. 2021, 22, 3892. [Google Scholar] [CrossRef] [PubMed]
  45. Park, J.; Park, S.; Kim, J.; Park, G.; Cho, Y.; Nam, K.H. Polyacrylamide Injection Matrix for Serial Femtosecond Crystallography. Sci. Rep. 2019, 9, 2525. [Google Scholar] [CrossRef] [PubMed]
  46. Liu, H.; Spence, J.C.H. The Indexing Ambiguity in Serial Femtosecond Crystallography (SFX) Resolved Using an Expectation Maximization Algorithm. IUCrJ 2014, 1, 393–401. [Google Scholar] [CrossRef]
  47. Mehrabi, P.; Bücker, R.; Bourenkov, G.; Ginn, H.M.; Von Stetten, D.; Müller-Werkmeister, H.M.; Kuo, A.; Morizumi, T.; Eger, B.T.; Ou, W.-L.; et al. Serial Femtosecond and Serial Synchrotron Crystallography Can Yield Data of Equivalent Quality: A Systematic Comparison. Sci. Adv. 2021, 7, eabf1380. [Google Scholar] [CrossRef]
  48. Beilsten-Edmands, J.; Parkhurst, J.M.; Winter, G.; Evans, G. Processing Serial Synchrotron Crystallography Diffraction Data with DIALS. In Methods in Enzymology; Elsevier: Amsterdam, The Netherlands, 2024; Volume 709, pp. 207–244. ISBN 978-0-443-31456-8. [Google Scholar]
  49. Diederichs, K.; Wang, M. Serial Synchrotron X-Ray Crystallography (SSX). Methods in Molecular Biology; In Protein Crystallography; Wlodawer, A., Dauter, Z., Jaskolski, M., Eds.; Springer: New York, NY, USA, 2017; Volume 1607, pp. 239–272. ISBN 978-1-4939-6998-2. [Google Scholar]
  50. Nam, K.H.; Park, S.; Park, J. Preliminary XFEL Data from Spontaneously Grown Endo-1,4-β-Xylanase Crystals from Hypocrea virens. Acta Crystallogr. F Struct. Biol. Commun. 2022, 78, 226–231. [Google Scholar] [CrossRef]
  51. Park, J.; Park, S.; Nam, K.H. Preliminary Serial Femtosecond Crystallography Studies of Myoglobin from Equine Skeletal Muscle. Crystals 2025, 15, 905. [Google Scholar] [CrossRef]
Figure 1. Indexing of the SFX diffraction images of (A) TLN, (B) HEWL, and (C) GI processed using the DirAx (blue), XDS (yellow), MOSFLM (green), and XGANDALF (red) algorithms at various CTDDs. The optimal CTDD is indicated by a gray line. Triangles indicate the maximum number of indexed diffraction patterns by DirAx (blue), XDS (yellow), MOSFLM (green), and XGANDALF (red).
Crystals 16 00203 g001
Figure 2. The distribution of the indexed unit cell parameters (a, b, c, α, β, and γ) for (A) TLN, (B) HEWL, and (C) GI processed using the DirAx, XDS, MOSFLM, and XGANDALF indexing algorithms at the optimized CTDD and at ±3 mm from the optimized value.
Crystals 16 00203 g002
Figure 3. Data processing statistics showing SNR, CC1/2, and Rsplit values for (A) TLN, (B) HEWL, and (C) GI datasets processed using DirAx (blue), XDS (yellow), MOSFLM (green), and XGANDALF (red) indexing algorithms at various CTDD values. The optimal CTDD is indicated by a gray line. Triangles indicate the highest SNR and CC1/2 values and the lowest Rsplit values from data processed with DirAx (blue), XDS (yellow), MOSFLM (green), and XGANDALF (red).
Crystals 16 00203 g003
Figure 4. Analysis of the molecular replacement solution. A plot of the log-likelihood gain (LLG) and translation function Z (TFZ) scores for (A) TLN, (B) HEWL, and (C) GI processed using the DirAx (blue), XDS (yellow), MOSFLM (green), and XGANDALF (red) algorithms at various CTDDs. The optimal CTDD is indicated by a gray line. Triangles indicate the highest LLG and TFZ values from data processed with DirAx (blue), XDS (yellow), MOSFLM (green), and XGANDALF (red).
Crystals 16 00203 g004
Figure 5. Structure refinement statistics of TLN, HEWL and GI at various CTDDs. A plot of the Rwork (blue) and Rfree (red) values for (A) TLN, (B) HEWL, and (C) GI at various CTDDs. The optimal CTDD is indicated by a gray line. The lowest Rwork and Rfree values are indicated by blue and red triangles, respectively. The CTDD ranges in which the Rwork and Rfree values remained within 90% of their minimum values are indicated by the yellow highlight.
Crystals 16 00203 g005
Table 1. A summary of the XFEL data used in this study.
DatasetCXIDB IDDOISample DeliverySample Distribution Width (μm)Wavelength (Å)Reference
Thermolysin (TLN)8610.11577/1502065Injector with polyacrylamide1051.2782[45]
Hen Egg White Lysozyme (HEWL)8910.11577/1511589Nylon mesh-based fixed target scanning>6001.2782[43]
Glucose Isomerase (GI)9010.11577/1511590Nylon mesh-based fixed target scanning>6001.2782[43]
Disclaimer/Publisher’s Note: The statements, opinions and data contained in all publications are solely those of the individual author(s) and contributor(s) and not of MDPI and/or the editor(s). MDPI and/or the editor(s) disclaim responsibility for any injury to people or property resulting from any ideas, methods, instructions or products referred to in the content.