Article

Integrated Chromogenic Analysis of Freshwater Pearls: Revealing the Internal Factors Driving Color Variation

1
School of Gemology, China University of Geosciences Beijing, 29 Xueyuan Road, Beijing 100083, China
2
State Key Laboratory of Geological Processes and Mineral Resources, China University of Geosciences, Beijing 100083, China
3
Frontiers Science Center for Deep-Time Digital Earth, China University of Geosciences Beijing, Beijing 100083, China
4
Key Laboratory of Gold Mineralization Processes and Resource Utilization, Ministry of Natural Resources, Shandong Institute of Geological Sciences, Jinan 250013, China
*
Authors to whom correspondence should be addressed.
Crystals 2025, 15(9), 797; https://doi.org/10.3390/cryst15090797 (registering DOI)
Submission received: 29 July 2025 / Revised: 21 August 2025 / Accepted: 5 September 2025 / Published: 8 September 2025
(This article belongs to the Collection Topic Collection: Mineralogical Crystallography)

Abstract

Pearl color serves as the paramount criterion for quality assessment and commercial valuation in the global pearl industry. Freshwater nucleated pearls, which constitute 95% of global production, exhibit striking chromatic diversity. This study deciphers the chromogenic mechanisms of freshwater nucleated cultured pearls in Hyriopsis cumingii from Zhuji, China, through integrated spectroscopic (UV-vis-NIR and Raman), colorimetric (CIELAB), and trace-element (LA-ICP-MS) analyses. We identify polyene compounds as the primary organic chromophores, with C=C bond counts determining core hue: purple (12 C=C bonds), pink (11 C=C bonds), and white/orange (10 C=C bonds). Color expression is further modulated by nacre microstructure; densely aligned aragonite tablets enhance optical interference in purple pearls, whereas irregular tablet arrangements in pink and orange pearls promote diffuse scattering. Crucially, trace elements (Mn, Fe, Cu, Zn) contribute synergistically via metalloporphyrin formation (e.g., Mn-porphyrin in purple variants) and aragonite lattice substitutions. These findings reveal that pearl coloration arises from the interplay of biological factors (organic matrix), physical structure (nacre architecture), and chemical composition (trace elements), providing insights for quality enhancement and sustainable aquaculture practices.

1. Introduction

Pearls represent an important category of organic gemstones, and consist of approximately 95% inorganic aragonite and 4–5% organic components, with a water content of 0.6–0.8% by weight [1]. The organic matrix primarily comprises conchiolin, supplemented by minor quantities of sugars, porphyrins, and other organic matter. In the modern pearl industry, cultured pearls dominate global production, with China supplying approximately 95% of the world’s output, predominantly freshwater cultured varieties [2]. Pearl quality assessment relies heavily on visual characteristics, primarily size, shape, luster and color. Color, in particular, serves as the principal determinant of both grading and market value [3]. Given the market dominance of freshwater cultured pearls, elucidating their coloration mechanisms is essential for quality improvement, market alignment, and sustainable industry development.
Pearl coloration emerges from the synergistic interaction of three optical phenomena: body color, overtone, and orient [4]. Body color, the inherent basic hue of the pearl, is primarily attributed to internal chemical composition, including organic pigments and the type, content, and chemical state of trace metal ions [5,6,7]. Overtone refers to one or more translucent layers of color (e.g., pink, green and blue) superimposed on the body color (inherent basic hue) and observable on the pearl’s surface. This effect results from optical interactions with the aragonite lamellar structure, such as reflection and interference. Orient manifests as iridescent, rainbow-like reflections on or beneath the surface, produced by refraction, reflection, diffraction, and other interactions with the pearl’s microstructure [8]. Thus, the overall coloration results from the superposition and interaction of body color, overtone, and orient.
The mechanism of pearl color formation involves synergistic endogenous and exogenous factors. The endogenous factors include the following: (1) Organic matter: Subject to dual regulation by pigment molecules (carotenoids, polyenes, porphyrin derivatives) and matrix proteins [8,9,10,11], the organic matrix serves as the core regulatory medium coordinating chemical components (pigments and metal ions) and physical structure (crystal arrangement) to achieve precise pearl color expression. (2) Physical structure: The regular arrangement of aragonite tablets creates photonic band gaps and superimposed grating structures, forming the basis for overtones and orient [12,13,14]. The crystallographic orientation of aggregated aragonite tablets directly determines interference color ranges, consequently affecting pearl color. (3) Metal ions: These form metalloporphyrins with porphyrins, generating various pearl colors [9]. Additionally, metals may substitute for calcium ions within aragonite and calcite crystal lattices. Exogenous factors operate through genetic and environmental pathways. Gene expression influences pearl color phenotypes [15,16], while environmental factors (e.g., temperature, pH and trace elements) induce variations in genetically identical pearls [17].
In this study, we analyzed freshwater nucleated cultured pearls (commercially designated Edison pearls) with typical body color phenotypes (white 1–5, orange 1–2, purple 1–4, pink 1–5) sourced from a single culturing site in Zhuji, Zhejiang Province, within one cultivation cycle. Analytical methods included gemological characterization, UV-vis-NIR spectroscopy, Raman spectroscopy, CIELAB colorimetry, and LA-ICP-MS for trace element contents. This multidisciplinary approach aimed to identify key factors governing color variation in nucleated freshwater cultured pearls.

2. Materials and Methods

2.1. Sample Description

The experimental samples comprised 20 Hyriopsis cumingii mussels (aged 2–3 years) and 20 corresponding Edison cultured pearls collected from an industrial aquaculture base in Zhuji, Zhejiang Province. All pearls were cultivated under standardized conditions: nucleus implantation (6–10 mm diameter shells) with mantle epithelial grafts (5 mm2) in a closed-loop system maintaining constant temperature (28 °C), pH (7.0–7.5), and dissolved oxygen (>5 mg/L). The cultivation cycle was strictly controlled at 18 ± 2 months, with health monitoring ensuring optimal nacre deposition. The pearl samples represented four color phenotypes: purple (n = 8), white (n = 5), pink (n = 5), and orange (n = 2). All exhibited good luster with diameters of 7–12 mm (Figure 1a) and generally smooth surfaces, though minor flaws were visible under unaided inspection.
The Hyriopsis cumingii specimens exhibited large, flat shells with a slightly triangular shape, featuring yellowish-brown to black surfaces and distinct growth lines. The nacres displayed pearly luster appearing in pinkish-purple hues (Figure 1b) or milky white coloration (Figure 1c).

2.2. Methods

2.2.1. Spectroscopy Analysis

The UV–vis spectrum, infrared spectrum and laser Raman spectrum were conducted at the Gemological Experimental Teaching Center, School of Gemology, China University of Geosciences (Beijing). The UV–vis spectra were measured using a UV–3600 UV–vis spectrophotometer (Shimadzu Corporation, Kyoto, Japan) via the reflection method, with a wavelength range of 200–800 nm, a sampling interval of 1 s, a resolution of 1 nm, a signal-to-noise ratio exceeding 1000:1, and an acquisition time of 50 ms. The infrared spectra were tested with a Bruker TensorII Fourier Transform Infrared (FTIR) spectrometer (Bruker, Billerica, Germany). All samples were analyzed with the reflectance method. The experimental test conditions were 220 V voltage, 4−1 resolution, 64 scans, and a scanning range from 500 to 2500 cm−1.
Raman spectra were acquired using a Horiba HR Evolution confocal Raman spectrometer (Kyoto, Japan). Analytical conditions included 532 nm laser wavelength, 100 mW output power, 2 µm spot size, and 1 cm−1 spectral resolution. Each spectrum represented 3 accumulations of 20s scans. Spectral data (200–4000 cm−1) were compared with reference spectra from the RRUFF mineral database.
X-ray diffraction (XRD) analysis was carried out utilizing a BRUKER D8 Advance X-ray diffractometer, operating at a voltage of 40 kV and a current of 40 mA, with Cu Kα radiation λ = 1.5406 Å and Co Kα radiation λ = 1.79026 Å.

2.2.2. Scanning Electron Microscope

Microstructures were tested using a scanning electron microscope (Zeiss Sigma360, Carl ZEISS AG, Oberkochen, Germany) at the ZEISS Microscopy Customer Center in Beijing. All samples were analyzed without carbon coating to preserve native surface characteristics. Two analytical approaches were employed: polished thin section analysis and fresh fracture surface examination. All samples underwent ultrasonic cleaning before analysis. The SEM operated at a 2 kV accelerating voltage and 2–5 nA beam current under high vacuum (0.1 mbar), acquiring both backscattered and secondary electron images.

2.2.3. Chemical Composition Analysis

Trace-element analyses were conducted using laser ablation–inductively coupled plasma mass spectrometry (LA-ICP-MS) (Coherent, Santa Clara, CA, USA) at the Key Laboratory of Gold Mineralization Process and Resource Utilization (Ministry of Natural Resources) and Key Laboratory of Metallic Mineralization Geological Process and Resource Utilization, Shandong Institute of Geological Sciences. The system comprised a Resolution SE 193 nm excimer laser coupled to a Thermo Fisher Element XR ICP-MS. Helium carrier gas and argon makeup gas were mixed through a three-way connector prior to ICP introduction to optimize ablation sensitivity. Laser parameters included 3–5 J/cm2 energy density, 40 μm spot size, and 4 Hz repetition rate in single-spot mode. Each analysis comprised 10–20 s background acquisition followed by 50 s sample ablation. Quantification followed the multiple external standard method (Chen et al., 2011 [18]) using USGS reference glasses (BCR-2G, BHVO-2G) and NIST610 for calibration, with NIST610 monitoring instrumental mass bias.

3. Results

3.1. Absorption Spectra

3.1.1. UV–Vis Spectra

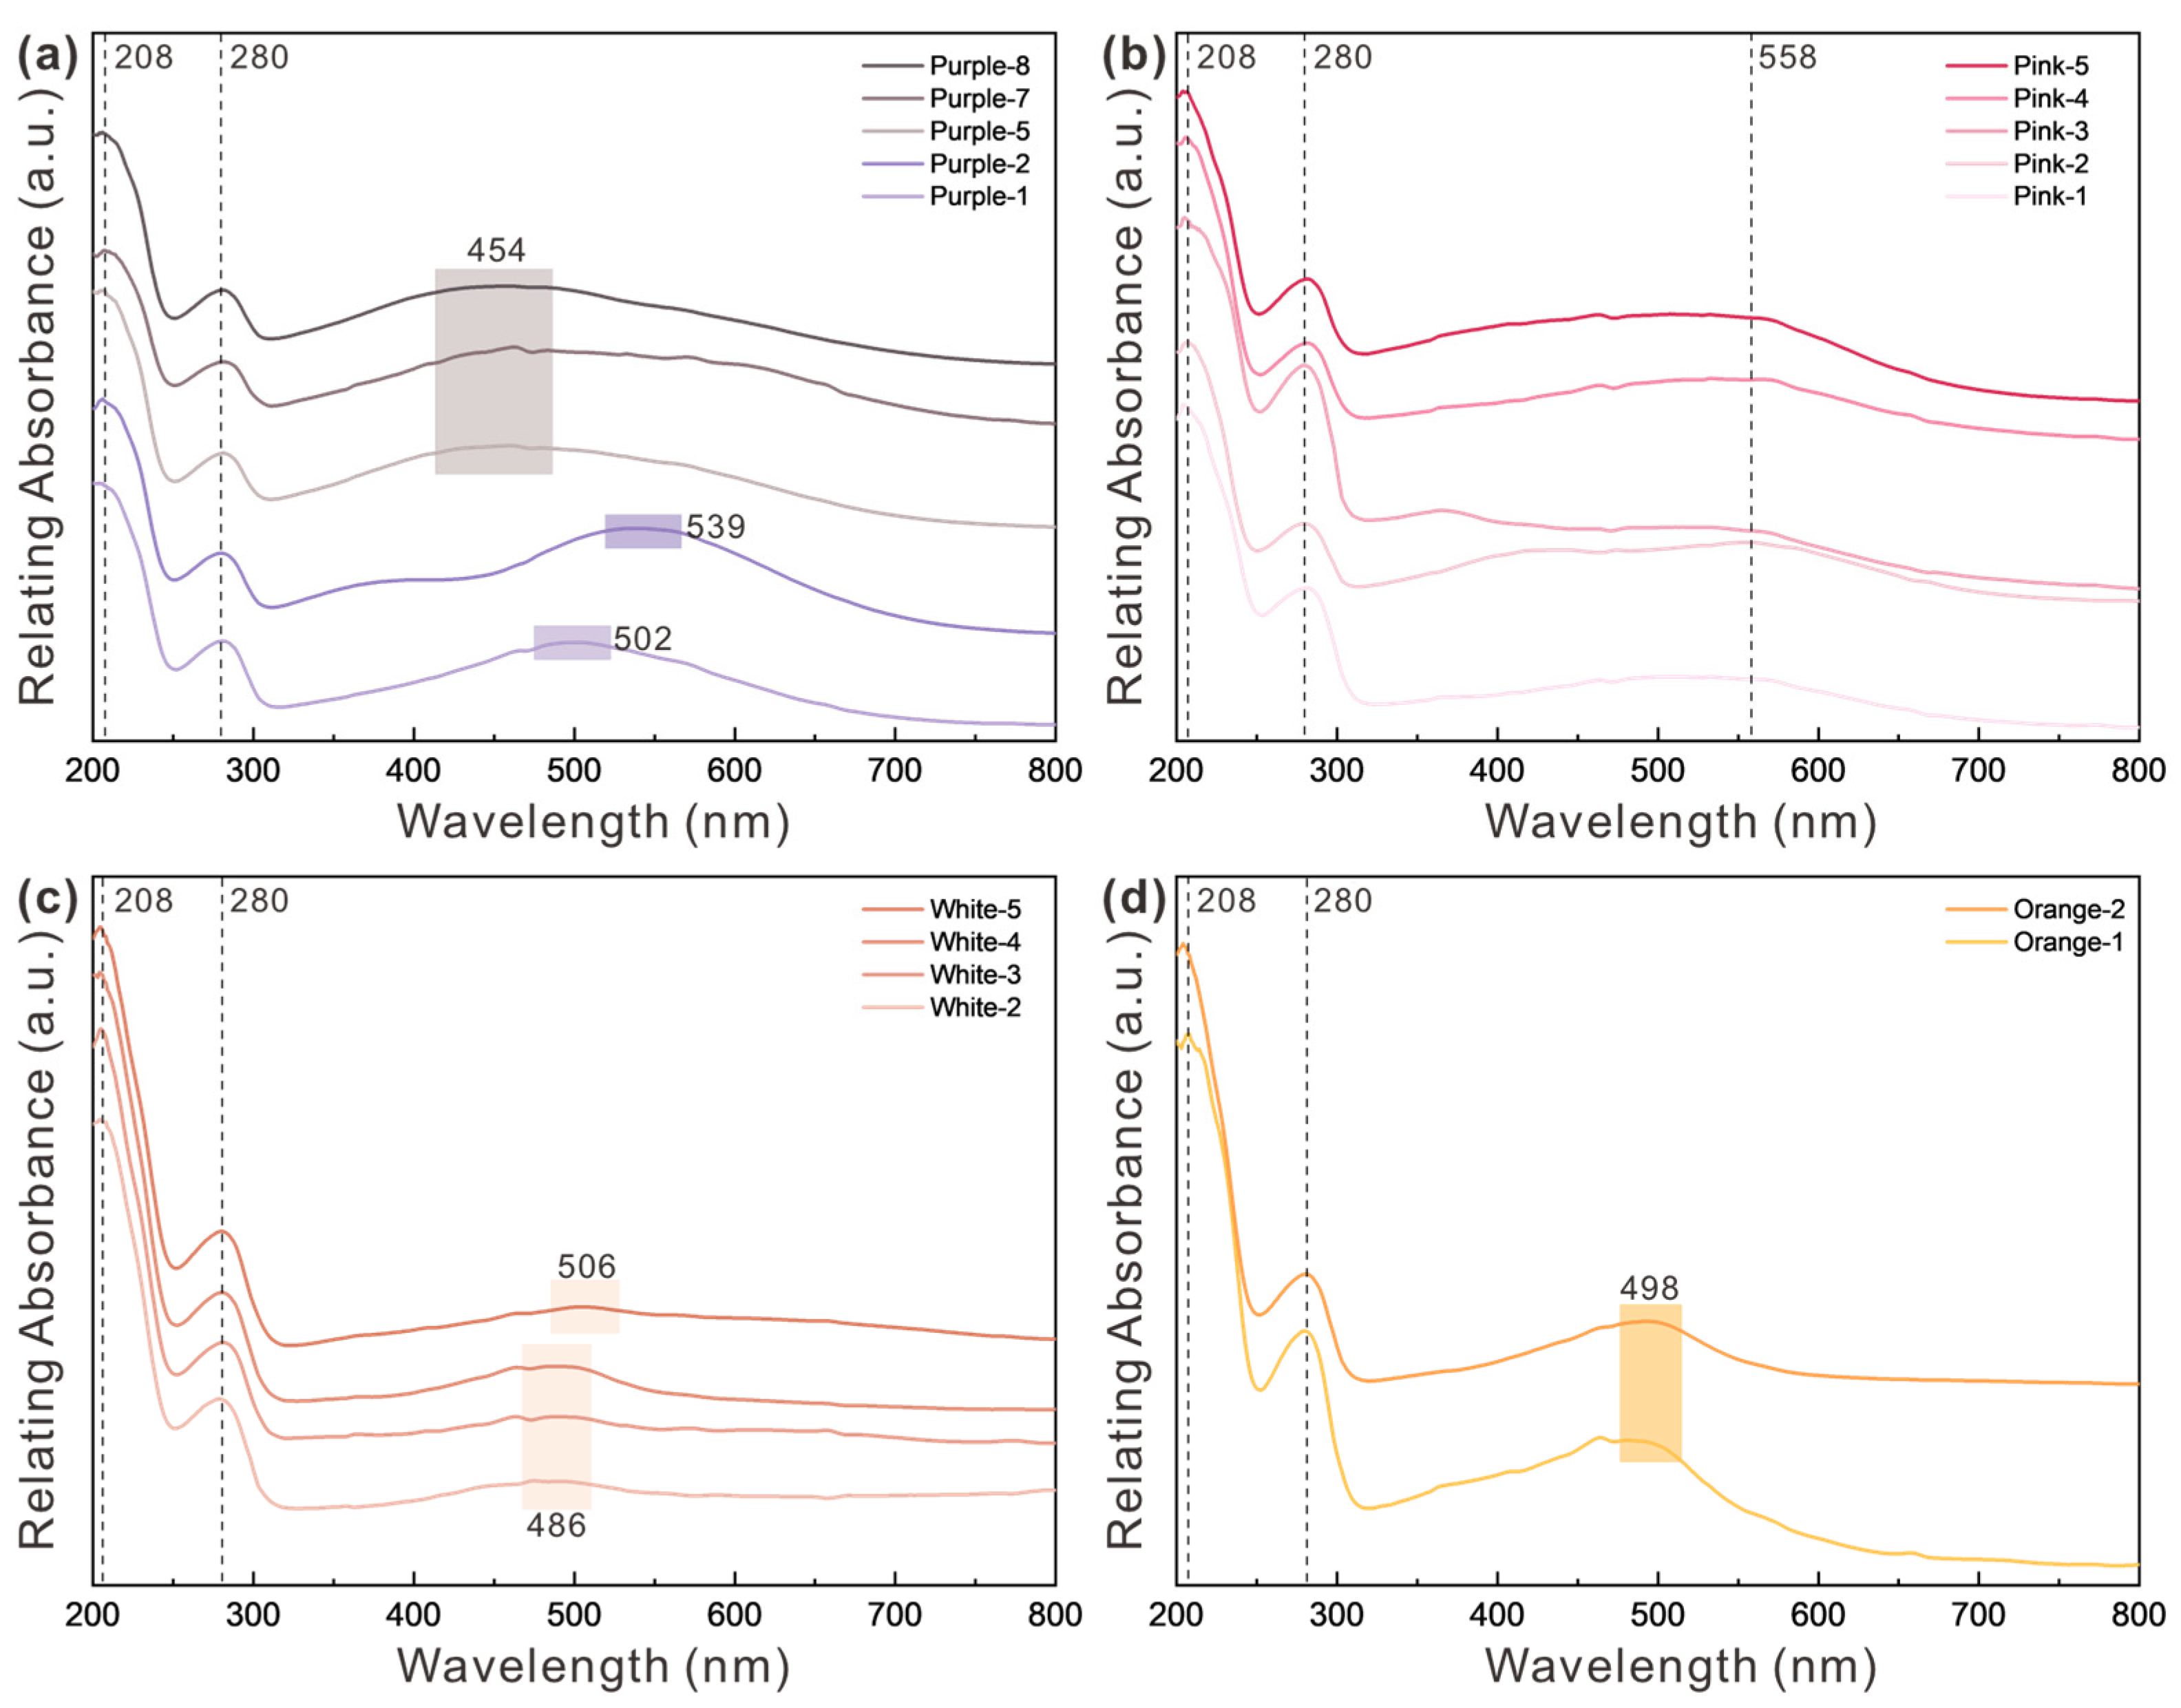
Surface analysis was conducted at multiple points on the nacreous layer of 20 freshwater nucleated cultured pearls, with representative data presented. UV-vis spectroscopy revealed consistent characteristic absorption bands centered near 205 nm and 280 nm across all samples. Additionally, broad absorption features between 450 and 580 nm exhibited color-dependent spectral variations among the pearl samples (Figure 2a–d).
The UV-vis spectroscopy revealed distinct absorption profiles across pearl color series, governing observed hues through selective wavelength absorption. Purple pearls exhibited a broad brand at 454 nm, 502 nm and 539 nm (Figure 2a). This enhances the reflection of complementary red wavelengths (>600 nm) and residual blue-violet light (<450 nm), combining to produce their characteristic violet appearance. Pink pearls absorb predominantly at 558 nm (Figure 2b), significantly reducing reflection between 500 and 580 nm. Consequently, reflected light is dominated by red-orange components (600–700 nm) with minor blue contributions (<480 nm), resulting in pink hues. White pearls display weak absorption at 486 nm (Figure 2c), causing minimal reduction in short-wavelength reflection. The near-uniform reflectance across the entire visible spectrum (400–700 nm) generates balanced white coloration. Orange pearls absorb intensely at 498 nm (Figure 2d), diminishing reflection in the 470–530 nm band. This favors the strong transmission of yellow-orange wavelengths (550–650 nm), yielding a saturated orange appearance as shown in their spectral profile.
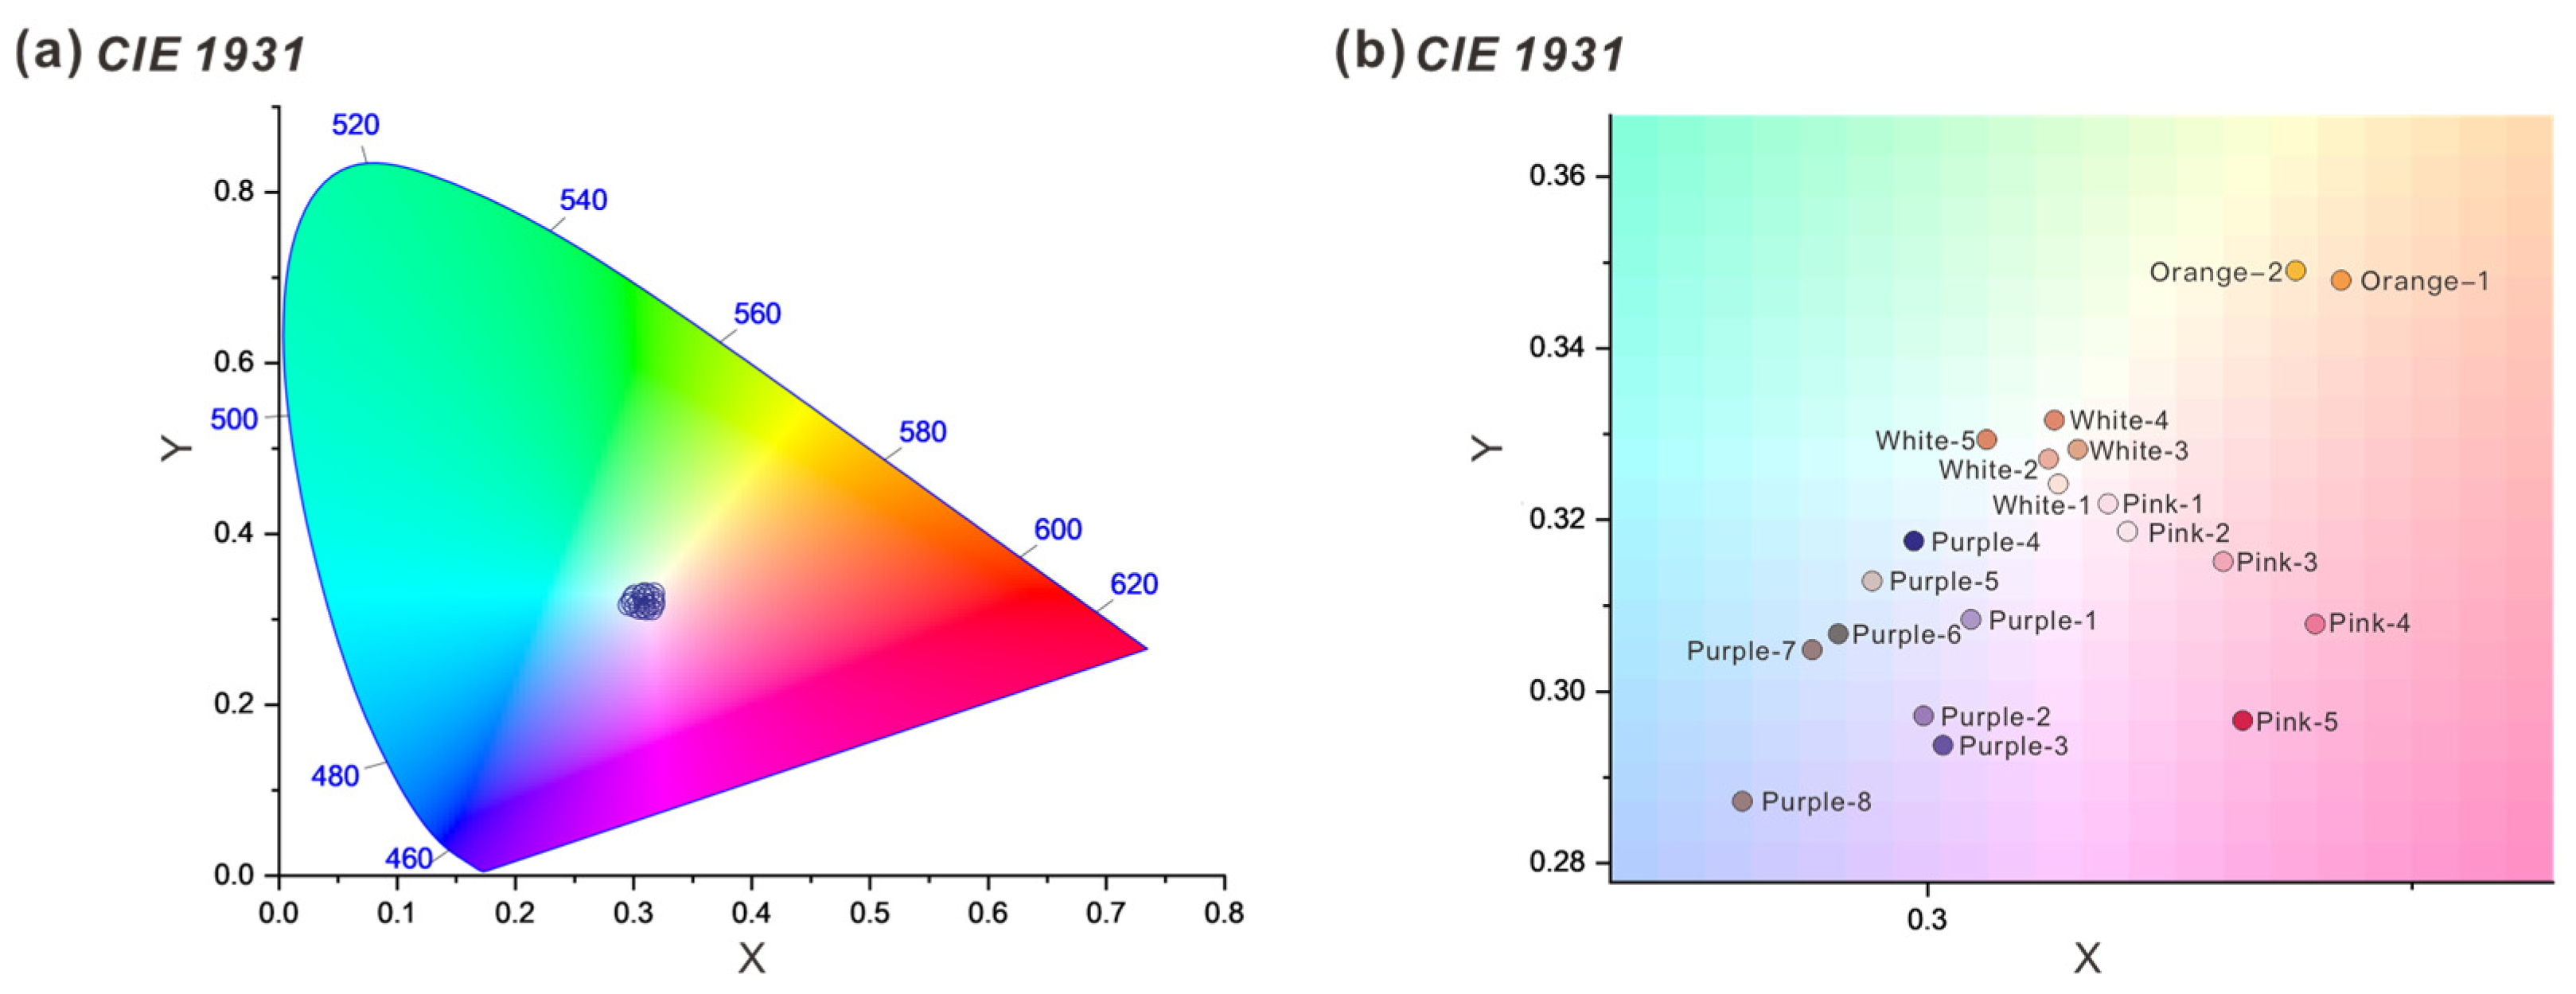
The three-dimensional scatter plot confirmed the superior brightness of white pearls, and chromaticity coordinates derived from UV-vis spectroscopy (Figure 3) corresponded closely with visually observed body colors.

3.1.2. FTIR Spectra

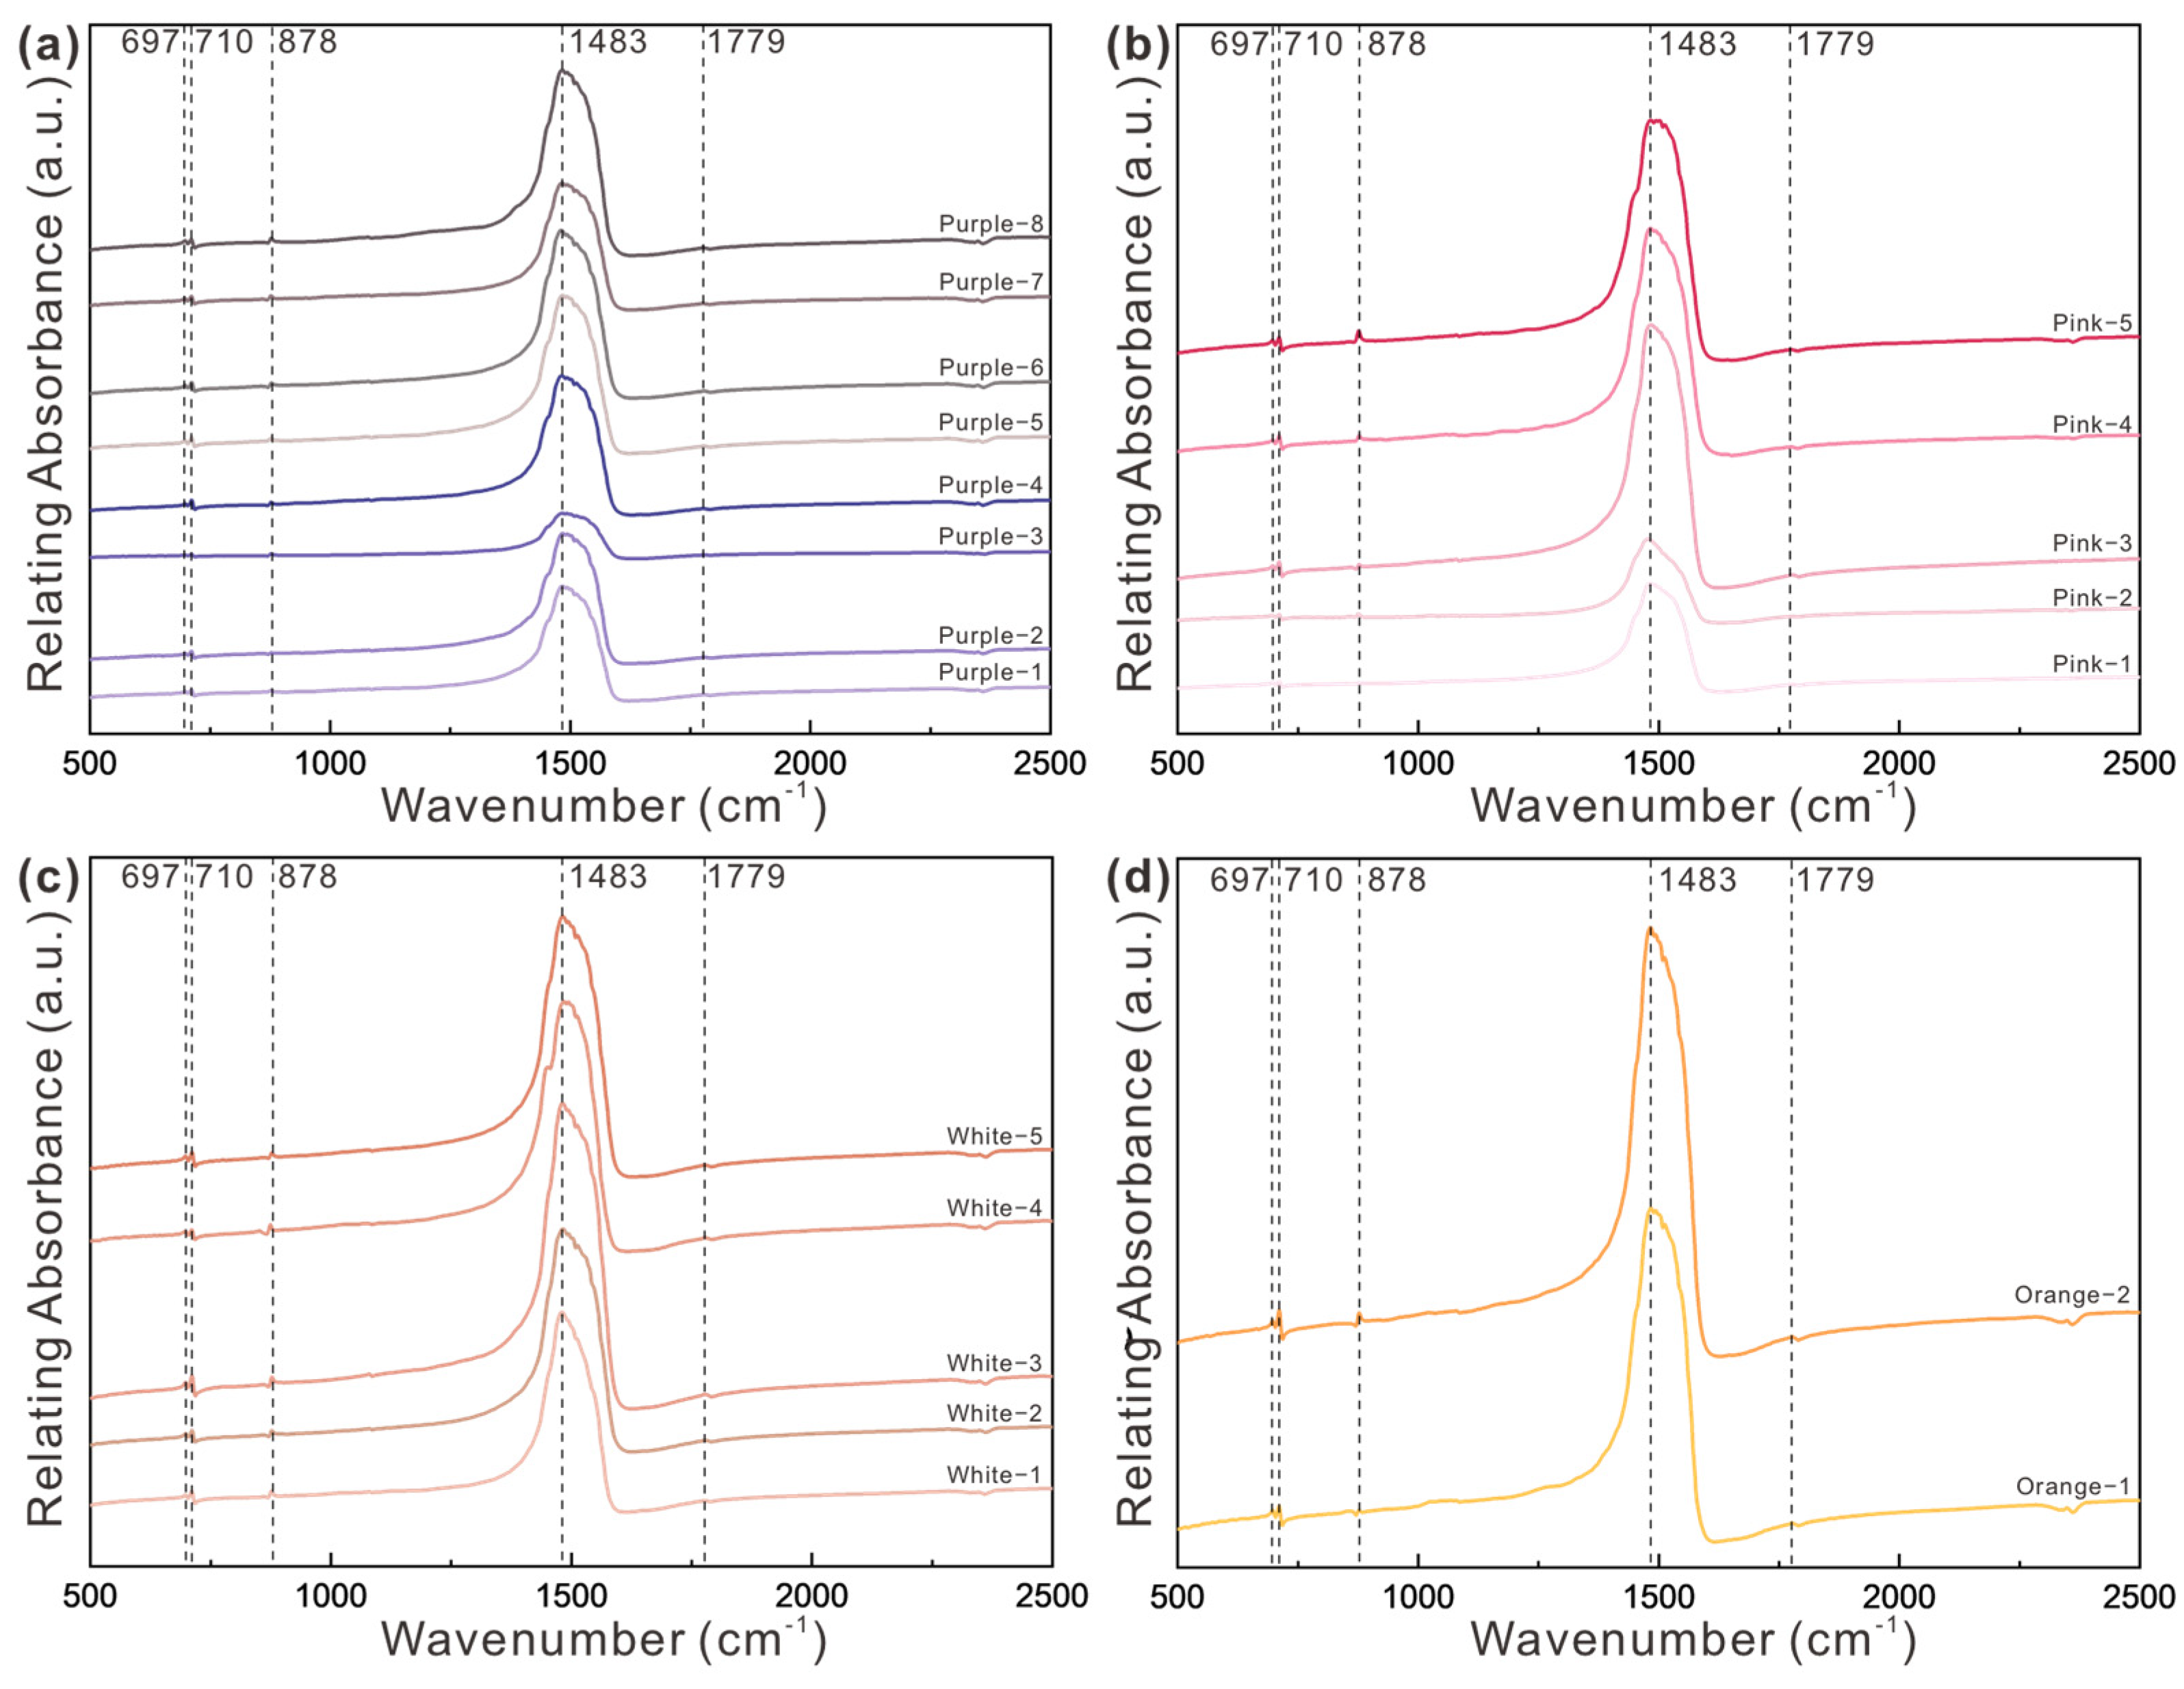
Surface analysis was conducted at multiple points on the nacreous layer of 20 freshwater nucleated cultured pearls. All colored pearls exhibited consistent absorption peaks at 697 cm−1, 710 cm−1, 878 cm−1, 1483 cm−1, 1779 cm−1 and 2353 cm−1 (Figure 4a–d). FTIR spectral peak assignments were made by referencing standard material spectra and prior research [12,20]. The observed peaks at 697 cm−1 and 710 cm−1 correspond to the in-plane bending vibration (υ4) of aragonite’s O-C-O groups, while the 878 cm−1 peak represents the out-of-plane bending vibration (υ2) of aragonite O-C-O. The intense 1483 cm−1 peak is characteristic of the asymmetric stretching vibration in calcite’s [CO3]2− ions, and the weak 1779 cm−1 feature arises from overtone and combination bands (υ1 + υ4) of fundamental vibrations.

3.1.3. Raman Spectra

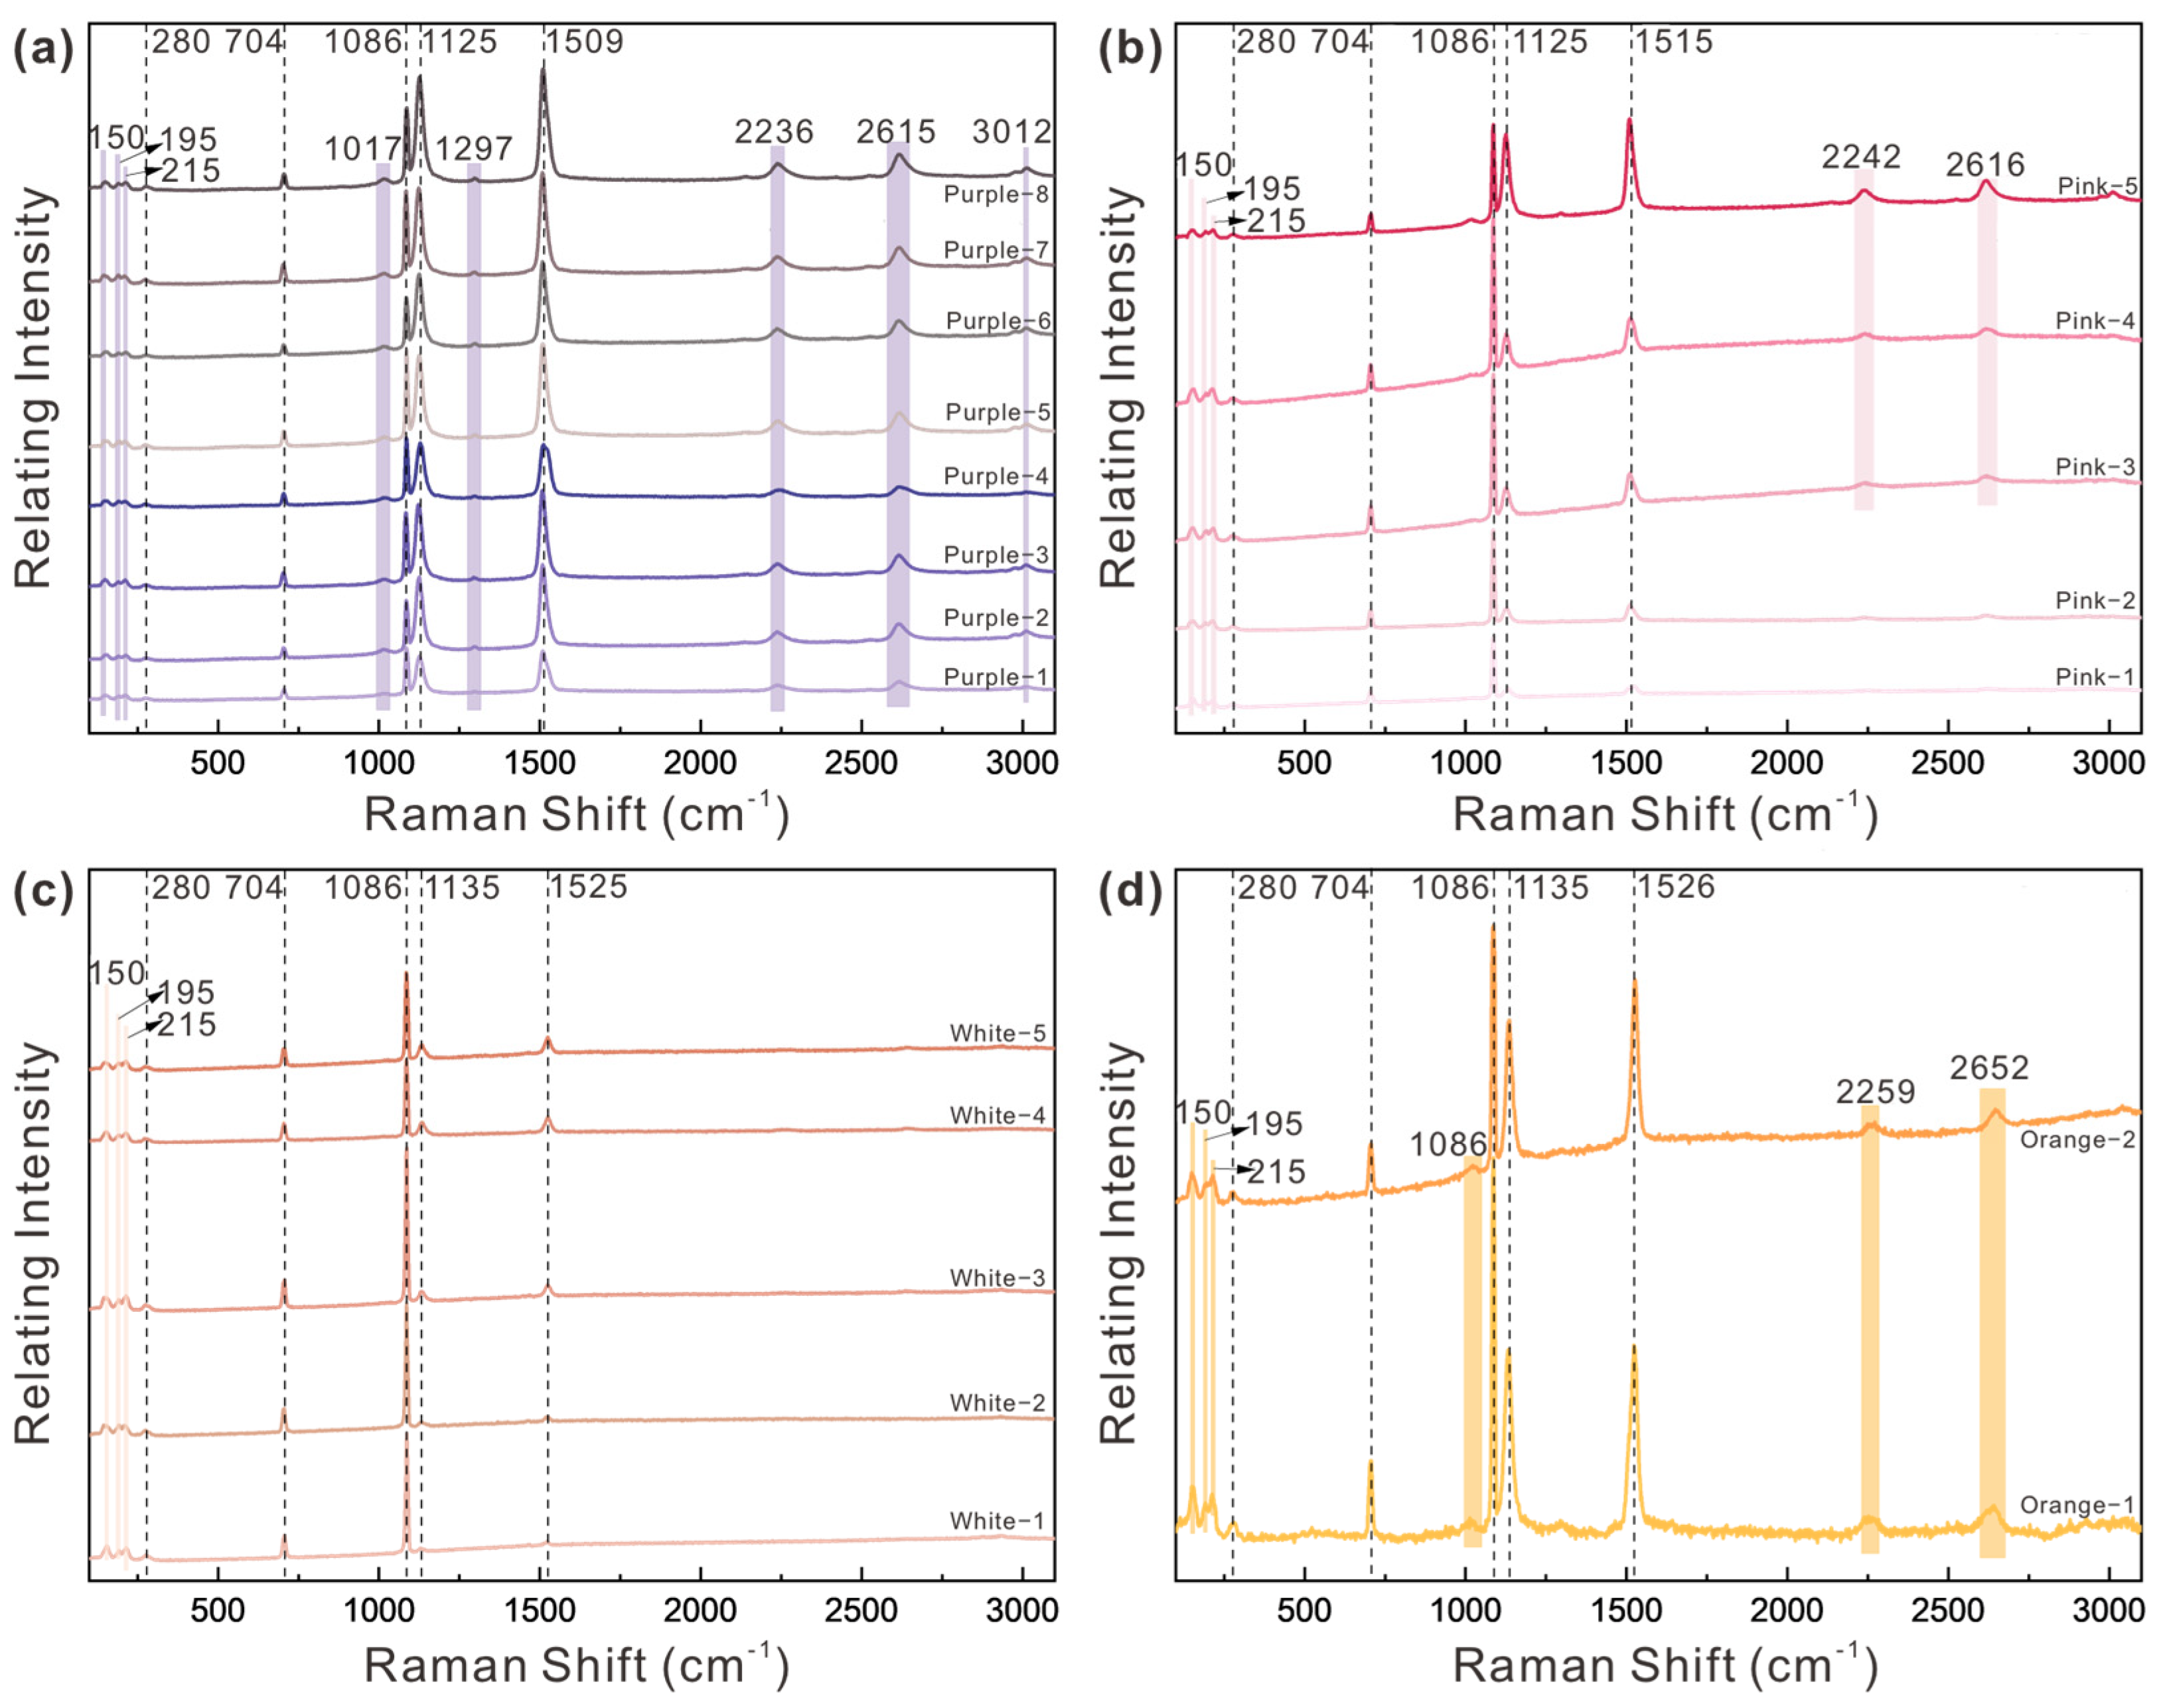
Laser Raman spectroscopy was performed at multiple points on the nacreous layer surface of 20 freshwater nucleated cultured pearls, with representative spectra from each pearl presented. All colored pearls exhibit consistent Raman absorption peaks at 150 cm−1, 195 cm−1, 211 cm−1, 280 cm−1, 704 cm−1, and 1086 cm−1. The peaks at 150 cm−1, 195 cm−1, 211 cm−1, and 280 cm−1 originate from aragonite lattice vibrations [21]. No Raman signatures indicative of other carbonate polymorphs, such as vaterite or calcite, were detected in any of the samples. The characteristic peak at 704 cm−1 corresponds to the in-plane bending vibration of CO32−, while the 1086 cm−1 peak is attributed to the symmetric stretching vibration (ν1) of CO32− [6,21,22].
The white pearls exhibit relatively weak organic absorption peaks at 1135 cm−1 and 1525 cm−1 (Figure 5c). In contrast, colored pearls show stronger and more numerous organic absorption peaks. The Raman spectra of pearls with varying color saturation within the same hue were spectrally analogous, with peak intensities increasing proportionally to color depth. Strong absorption bands from polyene-related compounds appeared in the 1000–1600 cm−1 region. The peaks at 1125 cm−1 and 1135 cm−1 correspond to C-C (ν2) stretching vibrations, while the characteristic peaks at 1509 cm−1, 1515 cm−1 and 1525 cm−1 represent C=C (ν1) stretching vibrations of the polyene backbone. Both ν1 and ν2 peak intensities increased with darker body colors (Figure 5a,b,d), with their specific positions correlating with polyene chain length [6,21]. Purple pearls additionally display an absorption peak near 1297 cm−1, attributed to in-plane C-H bending vibrations.
Laser Raman spectroscopy successfully identified polyene functional groups (C=C and C-C bonds), but it could not detect branched-chain components of polyene compounds. Furthermore, no Raman signatures indicative of carbonate polymorphs other than aragonite were observed.

3.1.4. X-Ray Diffraction Analysis

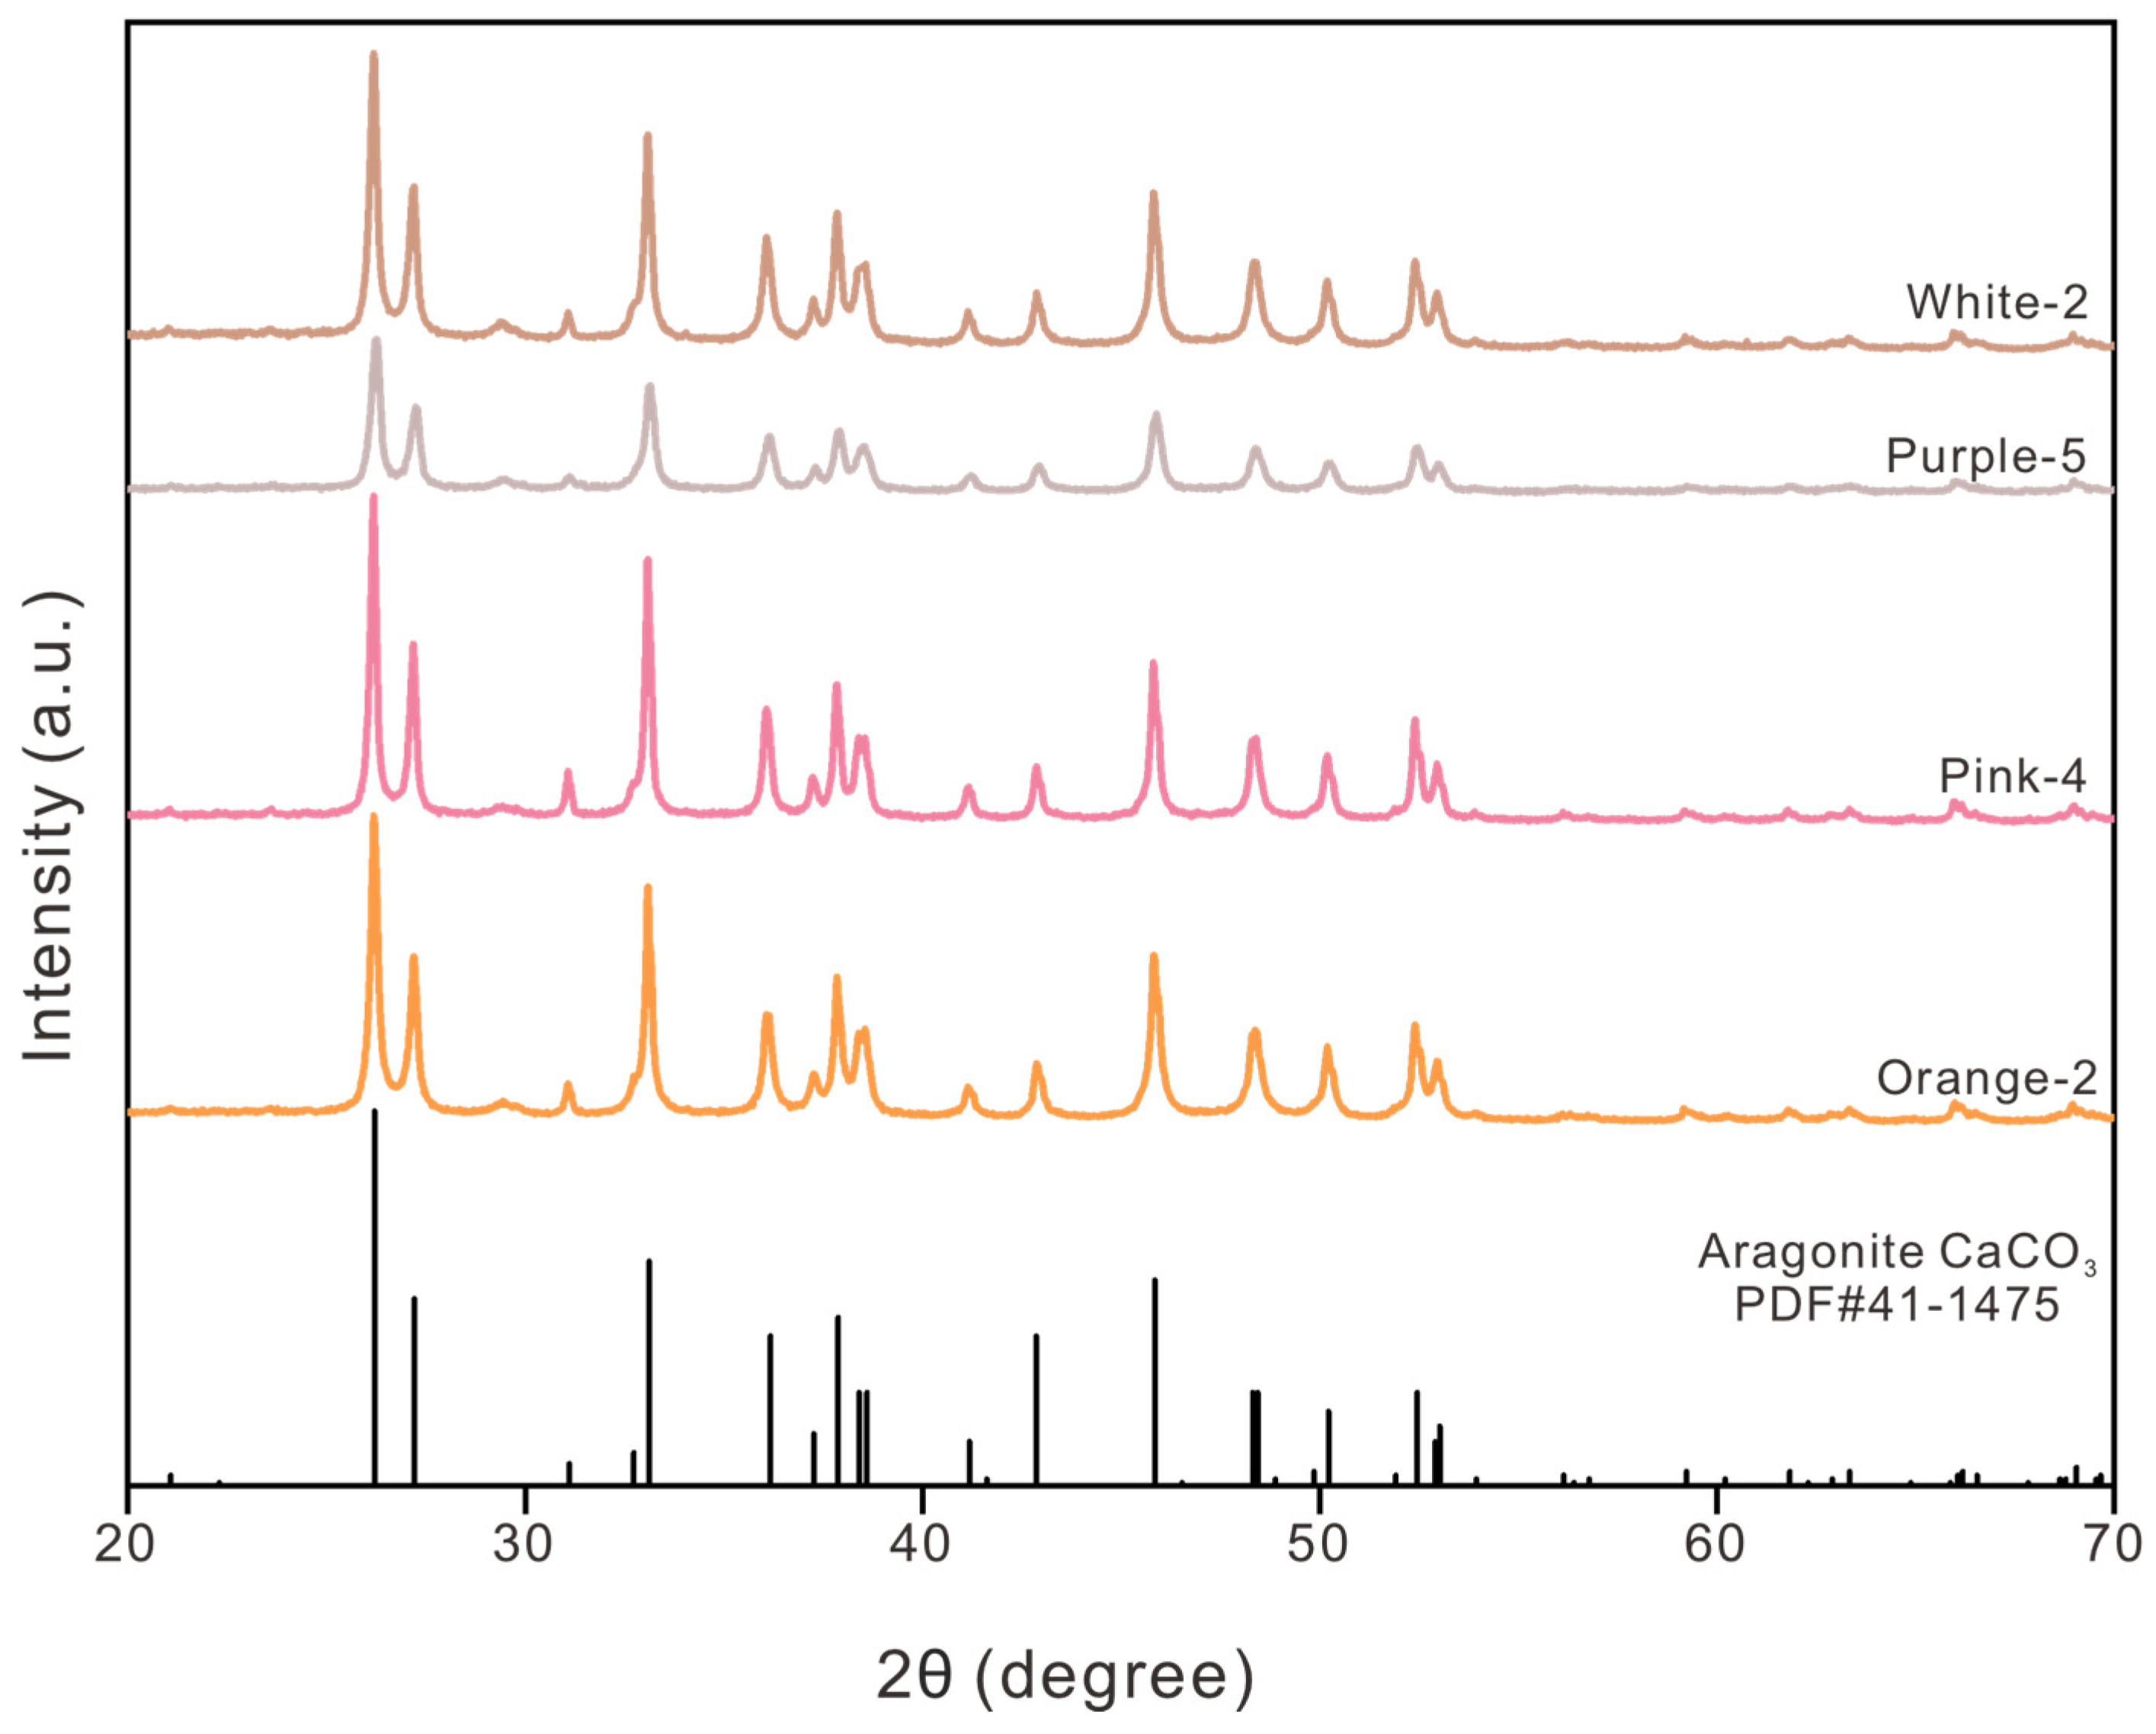
X-ray diffraction analysis was performed on powdered nacreous layers from pearls of different body colors. The diffraction patterns showed consistent peak positions and splitting characteristics across all colored samples (Figure 6). All samples exhibited diffraction patterns matching standard aragonite (PDF# 41-1475). No diffraction peaks corresponding to vaterite or other calcium carbonate polymorphs were detected. These results indicate that the nacreous layers of the examined freshwater cultured pearls consist exclusively of aragonite, with no detectable secondary crystalline phases present.

3.2. Scanning Electron Microscopy

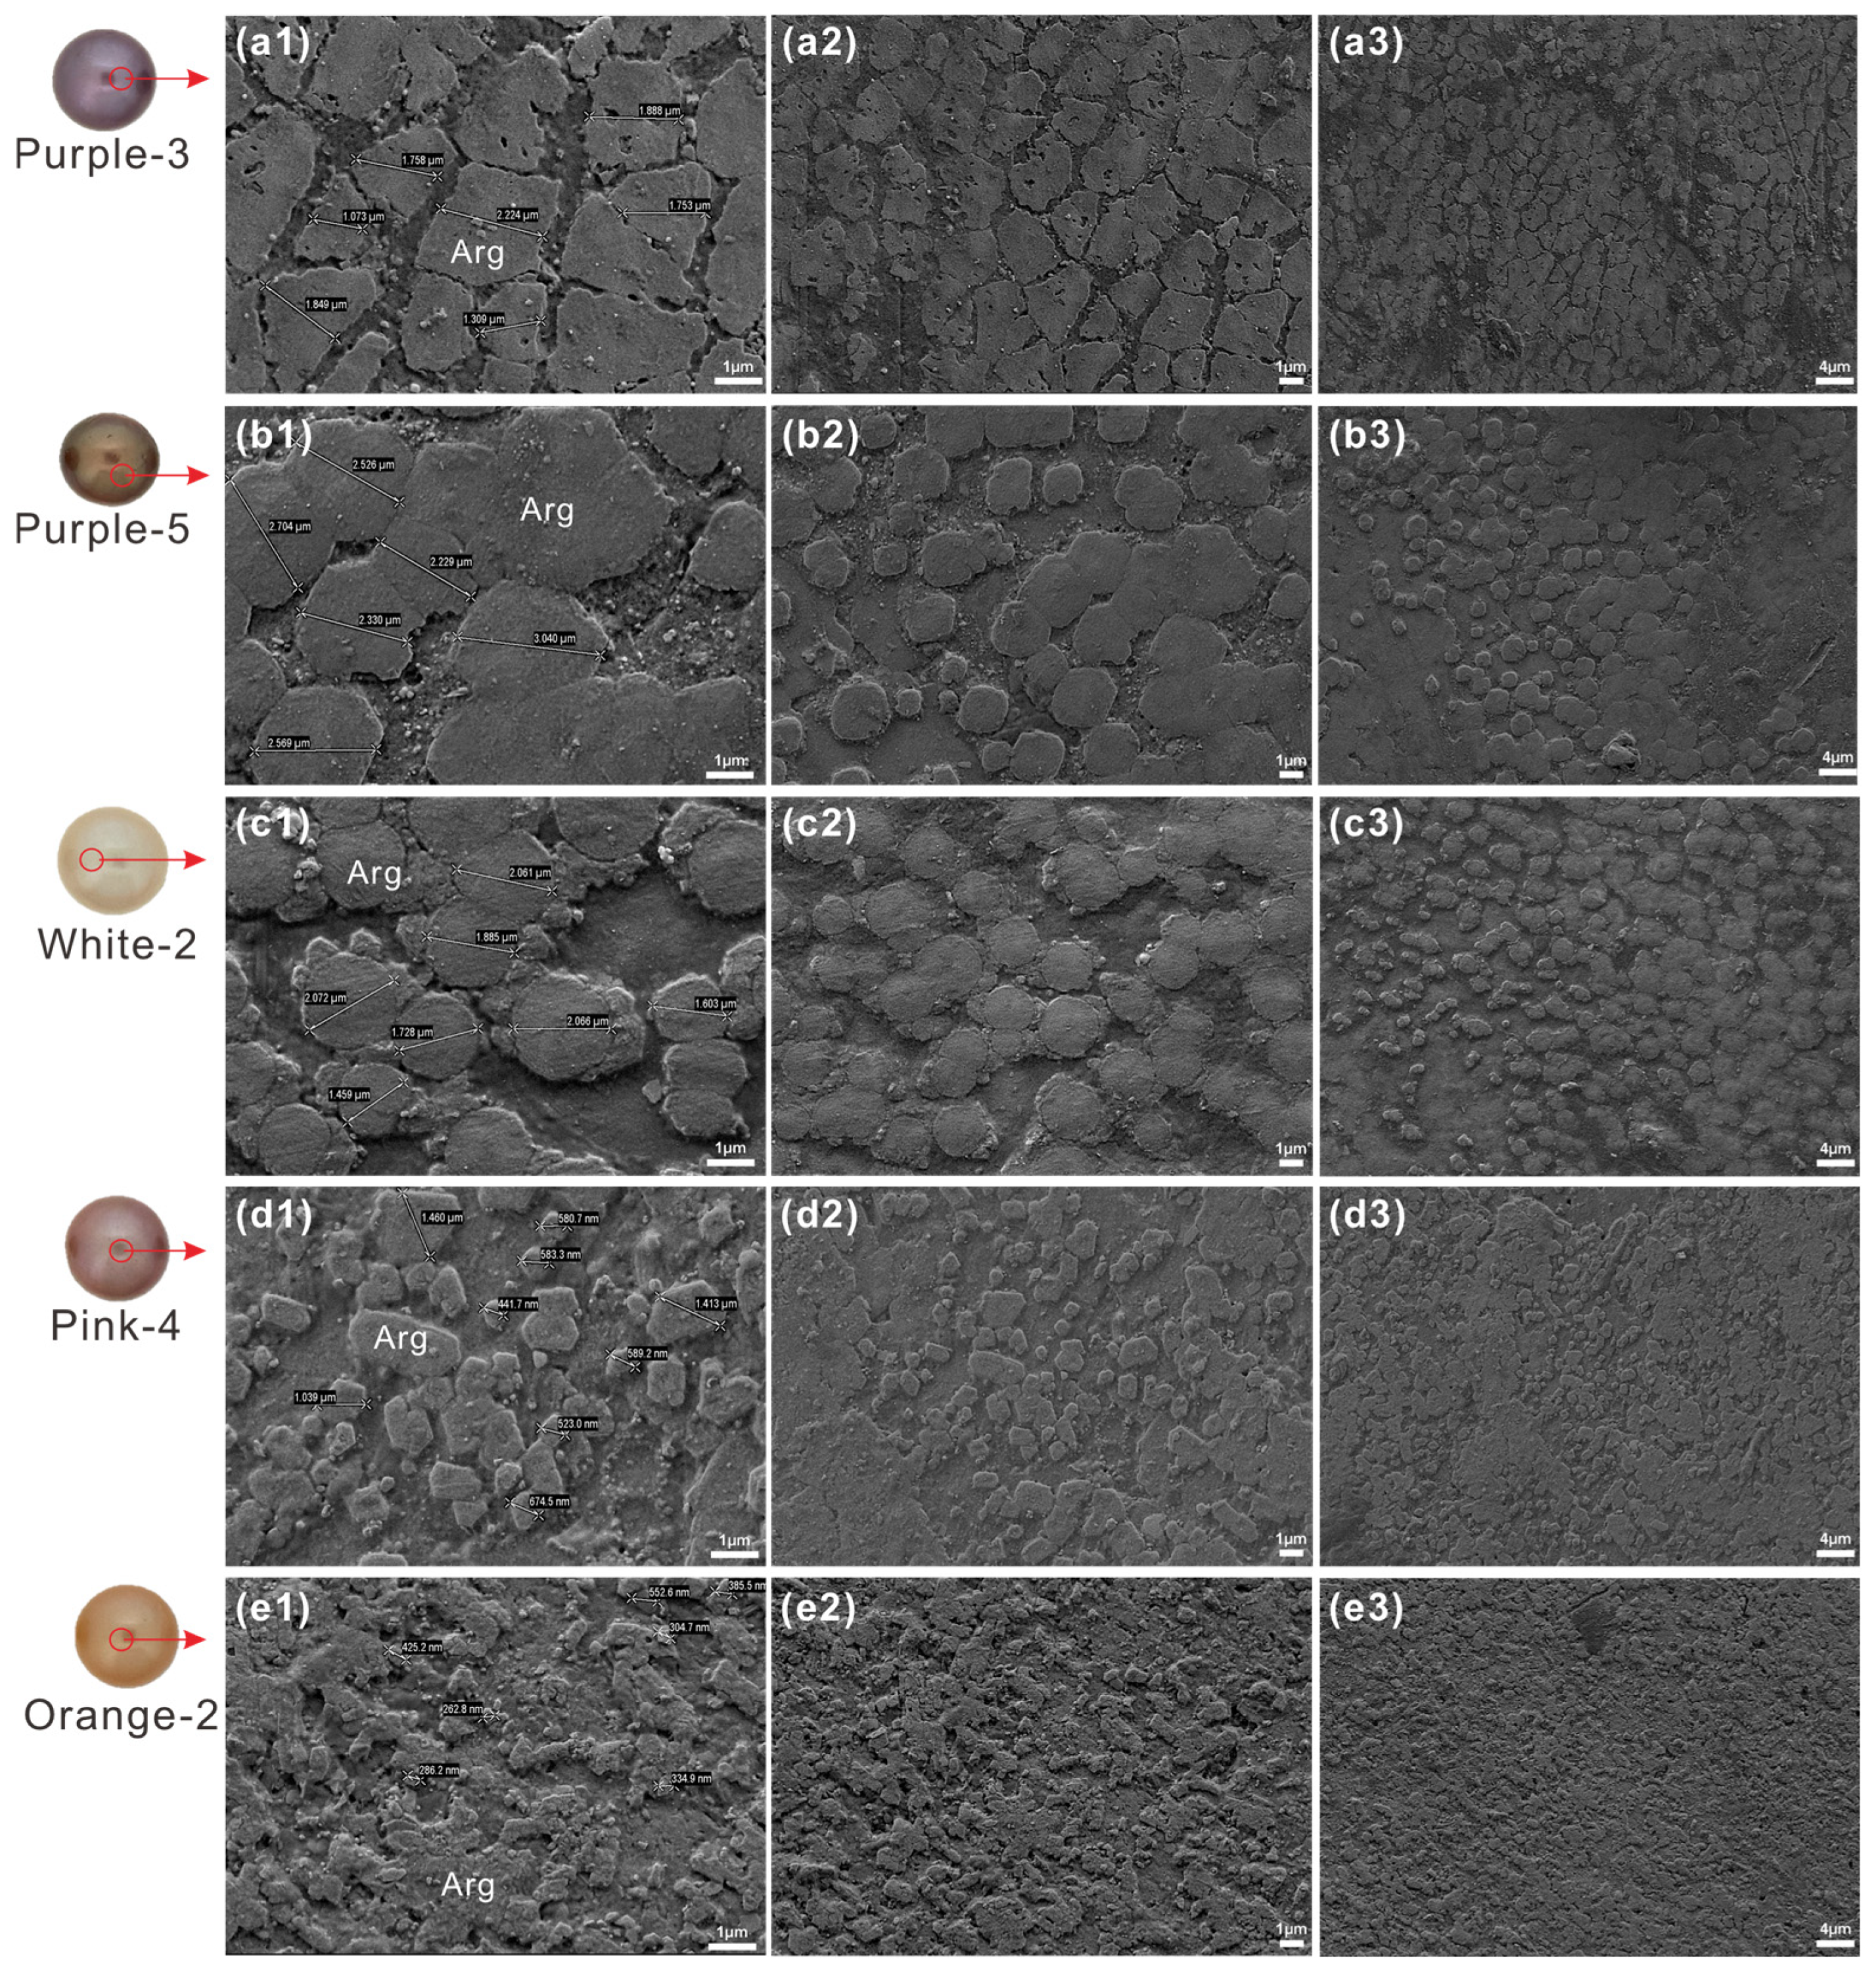
Surface microstructure heterogeneity among colored pearls was demonstrated via scanning electron microscopy at 10,000× magnification (Figure 7a–e). Purple pearls exhibit uniformly aligned lamellar tablets (1.07–1.88 µm) in compact arrays (Figure 7a). Gray-purple pearls (Purple 4–8) featured near-circular tablets (2.29–3.04 µm) with heterogeneous spatial distribution (Figure 7b). White pearls show densely arranged near-circular aragonite tablets (1.46–2.07 µm) separated by inter-tablet gaps (Figure 7c). Pink pearls display tightly packed irregular polygonal tablets (0.44–1.46 µm) (Figure 7d), while orange pearls comprise rounded polygonal tablets (0.26–0.55 µm) with regionally varying packing density (Figure 7e).
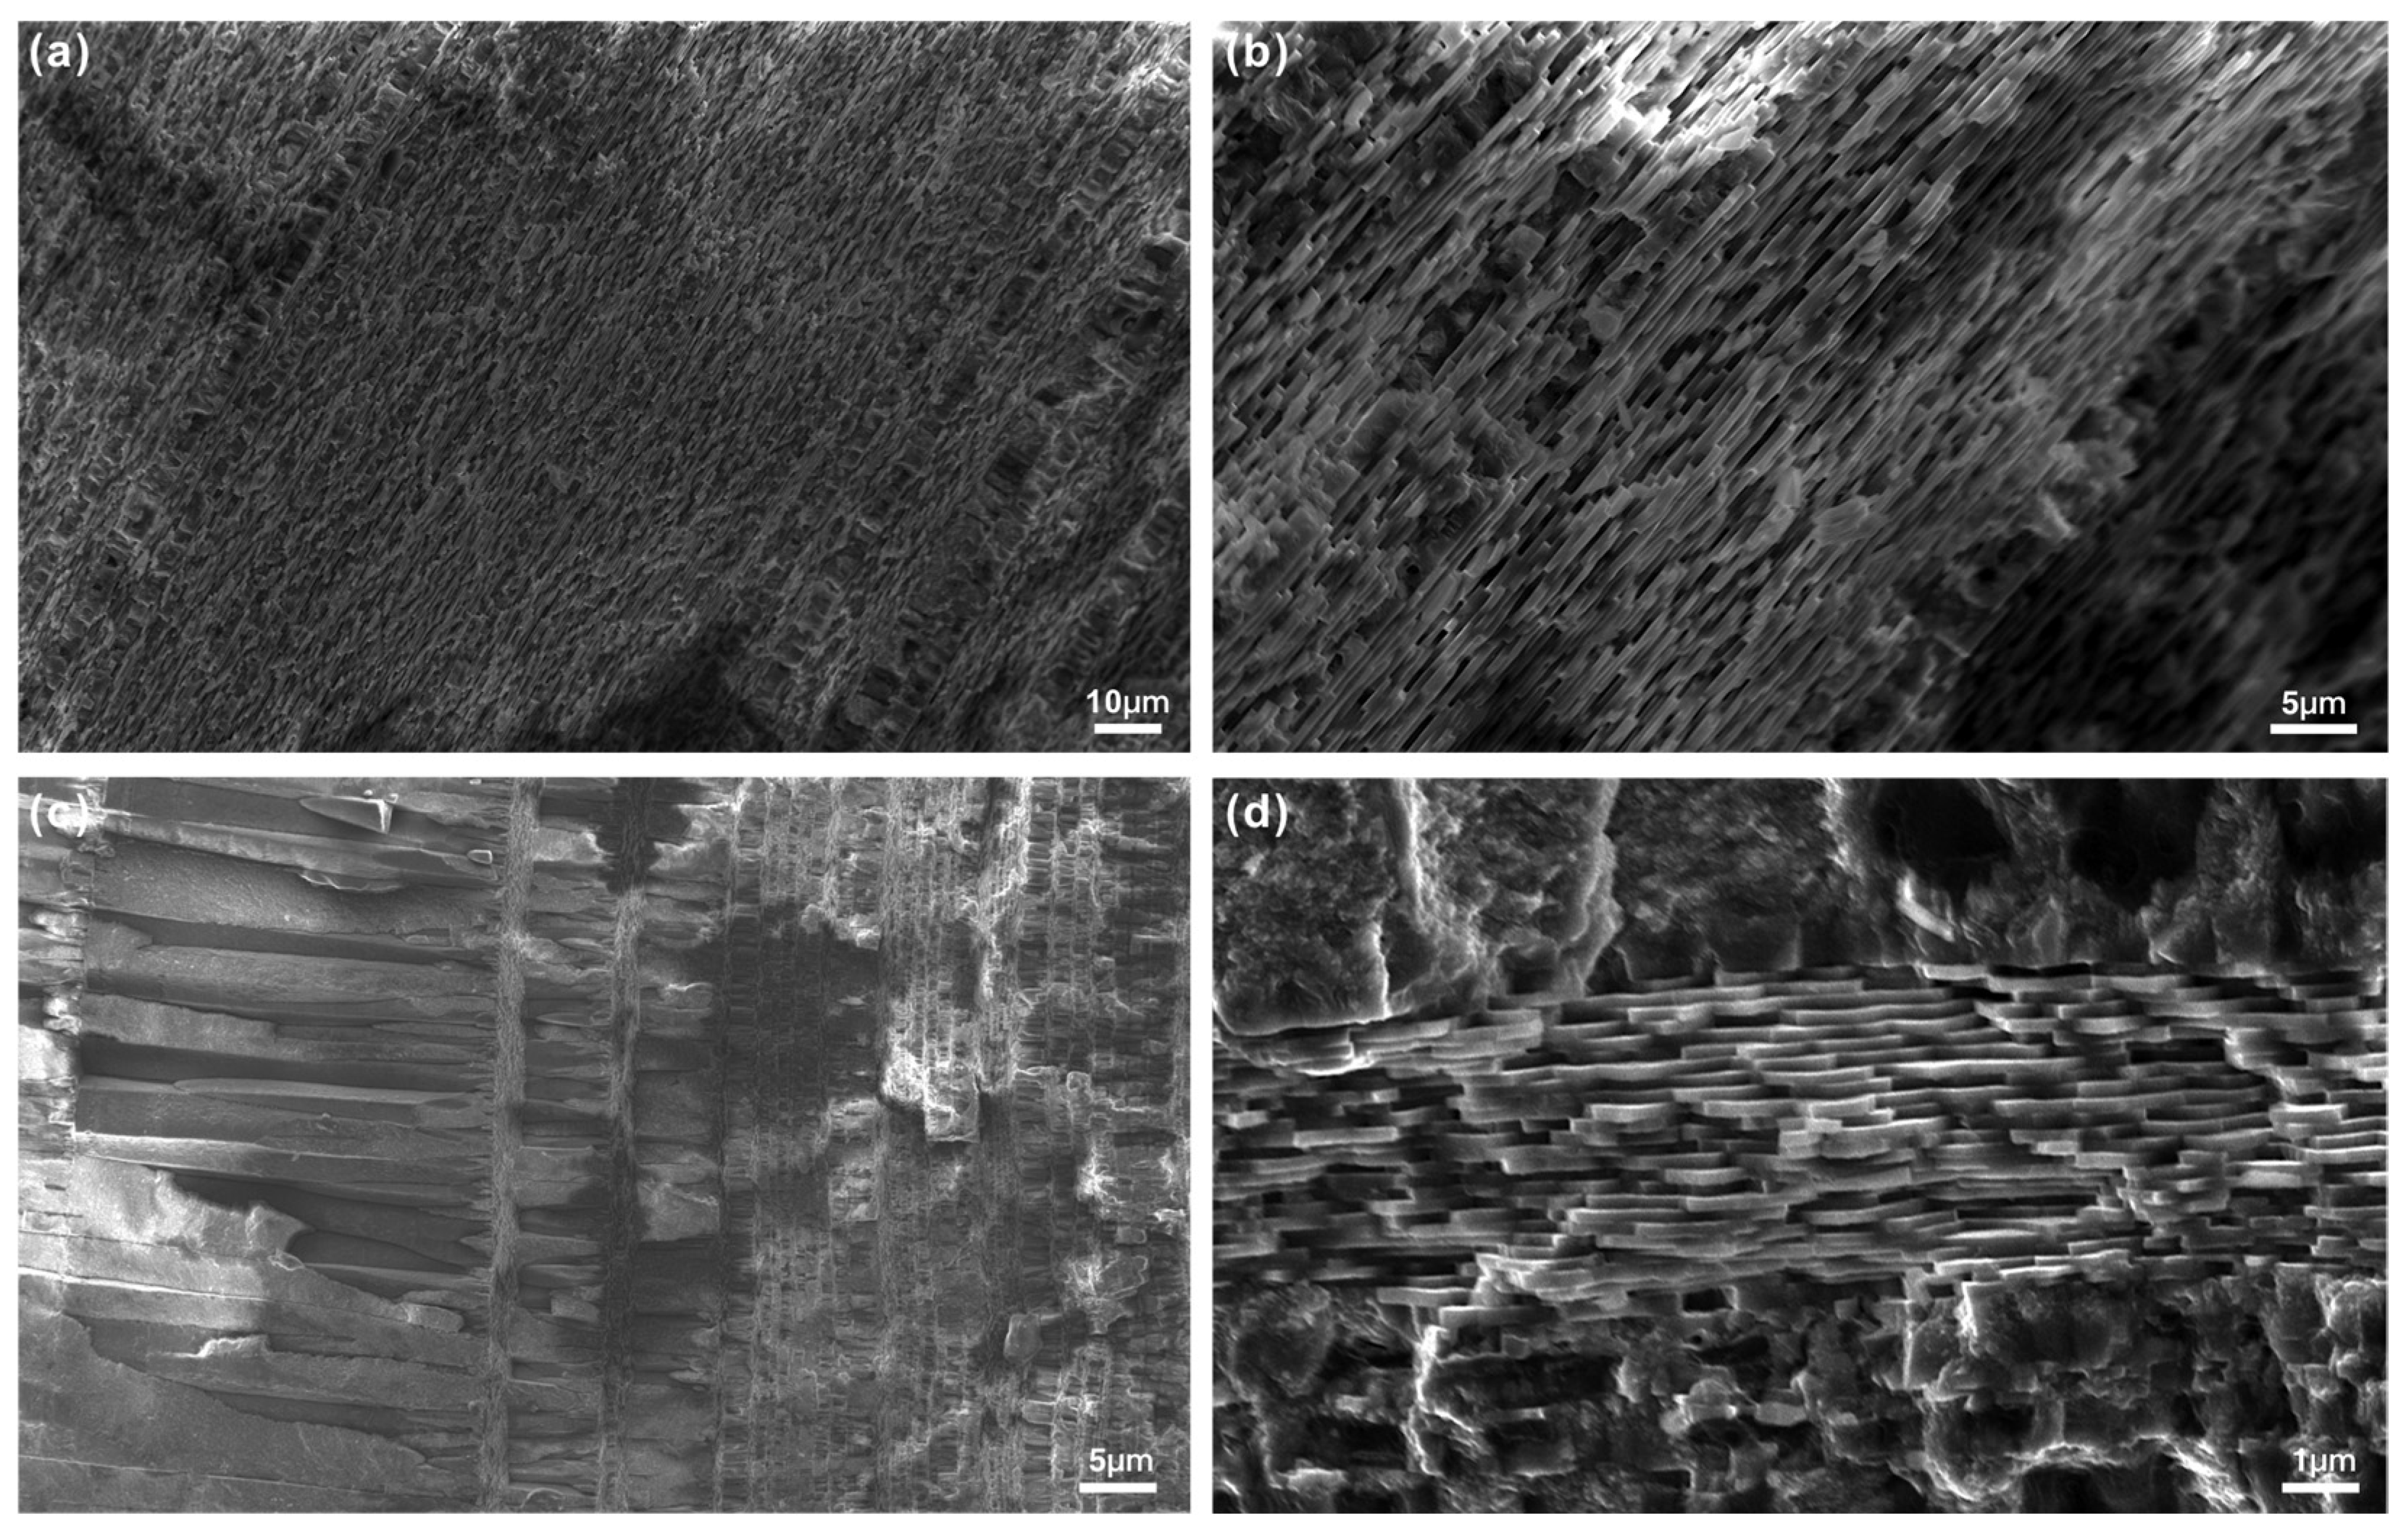
Fracture surface analysis further confirmed the aragonitic nature of pearl nacre. Cross-sectional SEM images revealed vertically aligned columnar tablets (Figure 8), demonstrating the classic tablet microstructure of aragonitic nacre: compact inter-tablet bonding without spherical or granular morphologies. The absence of spherulitic structures (characteristic of vaterite) and the consistent columnar architecture provide conclusive evidence that the pearl layers are exclusively composed of aragonite.

3.3. Trace Elements

LA-ICP-MS analysis quantified 17 trace elements on the surfaces of 20 freshwater nucleated cultured pearls. Significant compositional variations were observed among different color families. Purple pearls featured elevated Mn (87.4–353.9 ppm; mean 218.6 ± 85.3 ppm), Fe (87.4–229.4 ppm; mean 147.2 ± 47.1 ppm), and Sr (314.8–467.9 ppm) contents with consistently low Mg content (<40 ppm; mean 15.3±12.7 ppm). Pink pearls exhibited different kinds of Mn distribution (Pink-1 and 3: 140–450 ppm; Pink-2, 4 and 5: 771 to 2245 ppm) alongside Cu (0.3 to 0.7 ppm) and Zn (1.9 to 4.1 ppm). White pearls showed high Sr (625.1–1282.0 ppm; mean 960.3 ± 254.8 ppm), Ba (88.2–257.7 ppm), Mn (183.1 to 539.1 ppm) and Fe (88.3 to 213.9 ppm) contents. Orange pearls contained notable Cu (0.62–5.51 ppm), Zn (2.11–5.51 ppm), and Mn (1314.6–1400.9 ppm) contents (Table A1).
To evaluate potential host organism influences, corresponding mantle tissues of Hyriopsis cumingii mussels were analyzed at four standardized sampling points per specimen (Figure 1b,c), with color-group matching detailed in Table A2.

4. Discussion

4.1. Biological Factors of Coloration in Freshwater Nucleated Cultured Pearl Mechanism

Raman spectroscopy of freshwater nucleated cultured pearls revealed consistent inorganic signatures across all color variants, with characteristic aragonite peaks at 150 cm−1, 195 cm−1, 211 cm−1, 280 cm−1, 704 cm−14 CO32− bending), and 1086 cm−11 CO32− symmetric stretch). In addition, colored specimens exhibited significantly enhanced intensity in the 1000–1600 cm−1 organic fingerprint region compared to white pearls. This contrast was most pronounced at 1125–1135 cm−1 and 1509–1525 cm−1 (Figure 5a–d), where peak intensities in white pearls were markedly reduced. These spectral differences directly implicate the corresponding organic compounds as primary determinants of pearl coloration.
The chromophoric organic compounds in pearls remain debated, with primary hypotheses proposing either carotenoids or polyene compounds. Carotenoids typically exhibit diagnostic all-trans Raman signatures at 1003 cm−1 (C-CH3 deformation), 1152 cm−1 (C-C stretch), and 1510 cm−1 (C-C stretch). However, these characteristic peaks were absent in our spectra, definitively excluding carotenoids as color contributors. Instead, the observed Raman peaks at 1125 cm−1–1135 cm−12 C-C stretch) and 1509 cm−1–1525 cm−11 C=C stretch) aligned precisely with polyene vibrational modes. While these regions occasionally overlap with carotenoid signatures [23], the comprehensive absence of carotenoid-specific markers confirms polyenes as the dominant chromophores [6,24]. We therefore establish polyenes as the primary organic compounds governing coloration in freshwater nucleated cultured pearls [25].
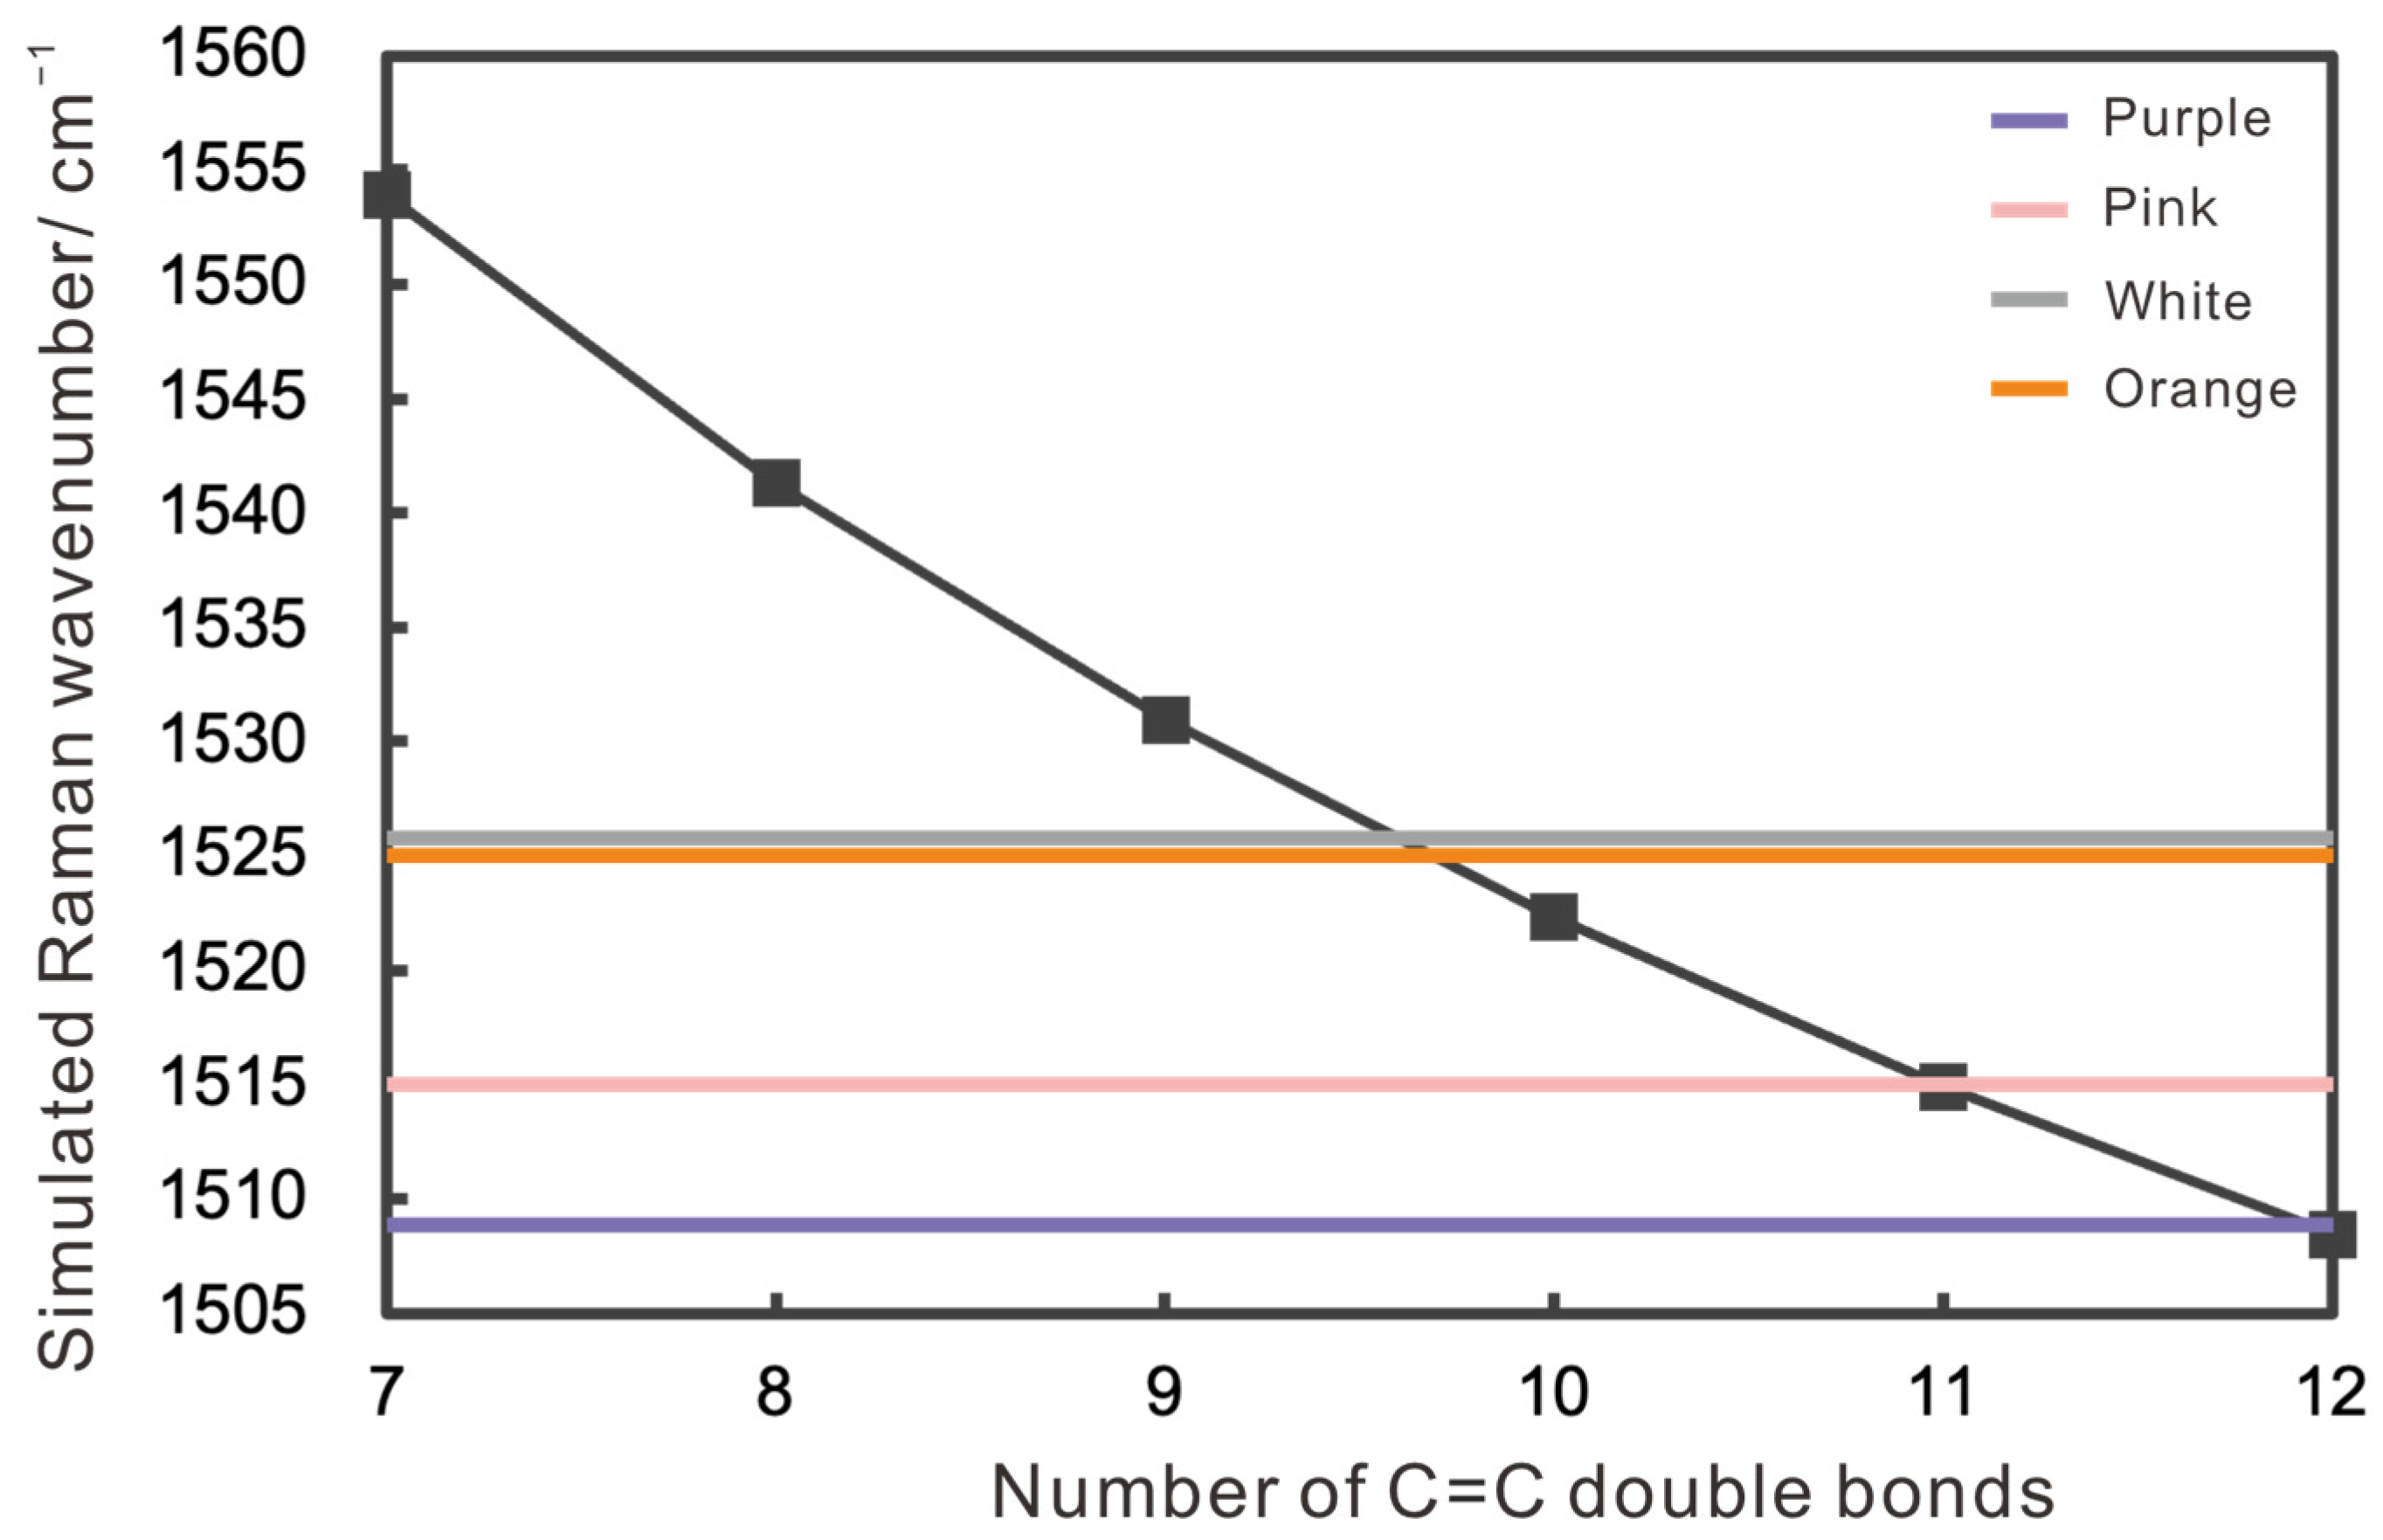
Raman spectral analysis establishes polyene pigments as the primary chromogenic agents in freshwater pearls, characterized by conjugated backbones of C=C and C-C bonds where C=C vibrations dictate optical properties [6]. Diagnostic ν1(C=C) and ν2(C-C) stretching modes at 1450–1600 cm−1 and 1100–1200 cm−1 enabled chain length quantification via empirical formulas [19,20,21] (Table 1), with averaged calculations minimizing error [22]. The analysis revealed distinct polyene characteristics across pearl color series. Purple pearls contain polyene pigments with 12 C=C bonds (range: 9–27) and pink pearls with 11 C=C bonds, while white and orange series pearls contain approximately 10 C=C bonds (orange range: 7–27) [26] (Figure 9). The polyene chain length directly influences light absorption properties: longer chains absorb longer wavelengths (yielding darker hues), while shorter chains absorb shorter wavelengths (yielding lighter colors). Critically, Raman peak intensities exhibit proportional enhancement with increasing polyene chain length [6,12] (Table 2), establishing the C=C bond count as the fundamental determinant of pearl body color. This causal relationship is further corroborated by consistent spectral trends across color series: both ν1(C=C) and ν2(C-C) vibration intensities escalate with color saturation, with the 1125–1135 cm−1 region (ν2 stretch) demonstrating particularly pronounced enhancement (Table 2). These collective observations confirm a robust positive correlation between polyene concentration and coloration, wherein peak heights directly quantify pigment abundance [7,27,28].

4.2. Factors Affecting Color Variation in Nucleated Cultured Pearls

4.2.1. Cooperative Color Regulation by Organic Matrix and Physical Structure

The pearl nacre constitutes a biomineralized structure formed through the systematic deposition of biological aragonite microcrystals with an organic matrix primarily composed of conchiolin [24]. This organic framework critically governs coloration through dual mechanisms: visible-spectrum pigment modulation and wavelength-selective light absorption. UV-vis spectroscopy reveals universal absorption bands at ~205 nm and ~280 nm (ultraviolet region), which are diagnostic markers for organic constituents. The 280 nm feature specifically correlates with protein-polysaccharide complexes that facilitate biogenic aragonite mineralization [30,31,32], confirming organic components as fundamental determinants of optical properties. Distinct absorption profiles within the visible spectrum demonstrate color-specific regulatory mechanisms. While the precise pigmentation mechanisms in pearls remain incompletely understood, the experimental data in this study support several key determinations regarding color formation. All samples exhibit a broad absorption band between 450 and 650 nm. This phenomenon is closely related to metalloporphyrin [33].
Pearl coloration is equally governed by structural characteristics [34,35], where comparative analysis reveals that darker freshwater pearls contain higher protein concentrations and thicker organic coatings than lighter specimens [36]. These compositional differences manifest in distinct morphological variations in the nacreous aragonite platelets, including platelet size, shape, and packing density (Figure 7). UV-visible spectral analysis combined with scanning electron microscopy demonstrates clear correlations between aragonite platelet dimensions and optical absorption features. Purple pearls with medium-sized tablets (1.07–1.88 μm and 2.29–3.04 μm) show cooperative interaction with their characteristic triple absorption bands at 454 nm, 502nm and 539 nm. Pink pearls featuring sub-micrometer tablets (0.44–1.46 μm) exhibit dominant 558 nm long-wavelength absorption. Orange pearls containing ultrafine tablets (0.26–0.55 μm) display enhanced 498 nm absorption. White pearls with submicron tablets (1.46–2.07 μm) demonstrate weakened 486 nm absorption due to broadband scattering. Notably, white pearls exhibit substantially larger inter-tablet spacing compared to colored variants, resulting from relatively insufficient protein secretion. Collectively, these findings establish pearl color intensification as a synergistic process governed by the interplay between organic chromophores and aragonite tablet architecture. Our SEM analysis reveals substantial variations in the tablet dimensions, morphology, and spatial arrangement of aragonite tablets across color variants (Figure 7a–e). These structural characteristics fundamentally influence the pearls’ optical properties. Purple pearls display a regular imbricate lamellar structure with tablet dimensions of 1.07–1.88 μm. This highly organized multilayered crystalline architecture intensifies selective light absorption in the 454–539 nm range through controlled reflection and interference effects that enhance both the saturation and uniformity of the characteristic violet coloration. In contrast to their purple counterparts, gray-purple pearls feature larger, nearly round tablets (2.29–3.04 μm) with uneven spatial distribution. This structural arrangement promotes multiple light scattering within interlamellar spaces, diminishing the dominant pigment absorption, and introduces a grayish tonal overlay. Surface features such as corrosion pits and adherent particles (Figure 7a,b) further modify light reflection pathways, creating localized variations in absorption and scattering that reduce overall color uniformity. Pink pearls display a distinct structural organization, characterized by tightly packed, irregular polygonal tablets of finer dimensions (0.44–1.46 μm). This structural configuration enhances the pink visual effect by synergistically combining amplified light refraction at lamellar interfaces, optimized diffuse reflection, and organic pigment interactions. White pearls contain closely arranged interstitial sub-rounded tablets (1.46–2.07 μm) that create a light-scattering microstructure, impeding specific pigment absorption to produce whiteness. Orange pearls possess the smallest tablets (0.26–0.55 μm), with irregular shapes and variable stacking densities, which likely cooperate with long-chain polyene pigments to modulate light absorption paths and reflection efficiency, resulting in orange coloration.
Therefore, aragonite tablet dimensions and spatial organization directly govern pearl coloration through wavelength-specific light absorption: sub-micrometer tablets (<1.5 μm) predominantly modulate long-wavelength absorption (>500 nm), while micrometer-scale tablets (>1.5 μm) regulate short-wavelength absorption (<500 nm). Previous studies have demonstrated that the nacre layer of pearls consists of aragonite plates tightly bound together by organic matrices acting as adhesives [37,38]. The denser the imbricate structure of the pearl, the thinner the pelage layer on the aragonite sheet’s outer surface. These organic components thus demonstrate dual functionality, orchestrating microstructure formation during biomineralization while physically determining optical parameters, thereby playing indispensable roles in chromatic development.
During nacre formation, the organic-mediated microstructure evolution drives color differentiation [10,11,39]. Structurally, proteins associate with the conchiolin layer to influence light reflection [40,41,42] while coordinating pigment synthesis [43]. Critically, organic components regulate aragonite tablet dimensions that subsequently determine specific visible wavelength absorption, ultimately producing the observed coloration through synergistic interactions.

4.2.2. Metal Ions and Metalloporphyrin

Pearls are primarily composed of CaCO3, with Ca playing a pivotal role in regulating their formation process [44]. As the fundamental constituent element of aragonite crystals, Ca directly influences the structural integrity and stability of pearl nacre. Concurrently, trace metal elements including Fe, Mn, Mg, and Cu significantly impact coloration in the pearl nacre layer, where distinct metal ion profiles produce characteristic color variations [9].
The distinct Sr-Mn signatures between freshwater and seawater pearls originate from fundamental environmental and biochemical differences. Marine environments provide high Sr bioavailability, enabling extensive Sr incorporation into seawater pearls through preferential aragonite lattice substitution. This process is mainly regulated by mantle tissue, the primary biomineralization site responsible for shell matrix protein secretion in pearl oysters [45]. Conversely, freshwater systems exhibit extremely low Sr concentrations, limiting Sr assimilation in Edison pearls (Table A1) despite similar bioconcentration factors. This limitation likely reflects environmental constraints on metabolic processes and energy allocation for biomineralization [45,46].
In this study, pearls revealed distinct metal distribution patterns across color variants. Purple series pearls exhibited notably elevated concentrations of Ti, V, Mg and Zn. This elemental signature aligns with established crystal substitution mechanisms, wherein metal ions replace calcium in carbonate lattices, as exemplified by Mn2+ substitution in both aragonite and calcite structures. This process could influence aragonite tablet development and ultimately pearl coloration [3], as substantiated by scanning electron microscopy evidence (Figure 7). Purple pearls exhibit significant Zn enrichment, suggesting dual functionality, facilitating organic matrix biosynthesis in nacre and potentially forming zinc–porphyrin complexes through metal–ligand coordination. Pink series pearls demonstrated marked accumulations of Ti, Fe, Mg, Mn and Cu, with Fe and Mn concentrations substantially exceeding those in purple and orange variants [9]. The elevated Fe/Mn content supports the potential biosynthesis of metalloporphyrin, where iron– and manganese–porphyrin complexes absorb specific visible wavelengths to generate pink coloration. Orange pearls exhibit distinctive enrichment of Cu, Zn and Mg concentrations alongside the highest Mn levels. Cu2+ and Zn2+ ions likely modify absorption spectra through chelate formation with organic pigments. The co-enrichment of Cu and Zn in orange pearls may create a chelation system with distinct absorption characteristics (498 nm), generating the orange-yellow hue through synergistic metal–pigment interactions.
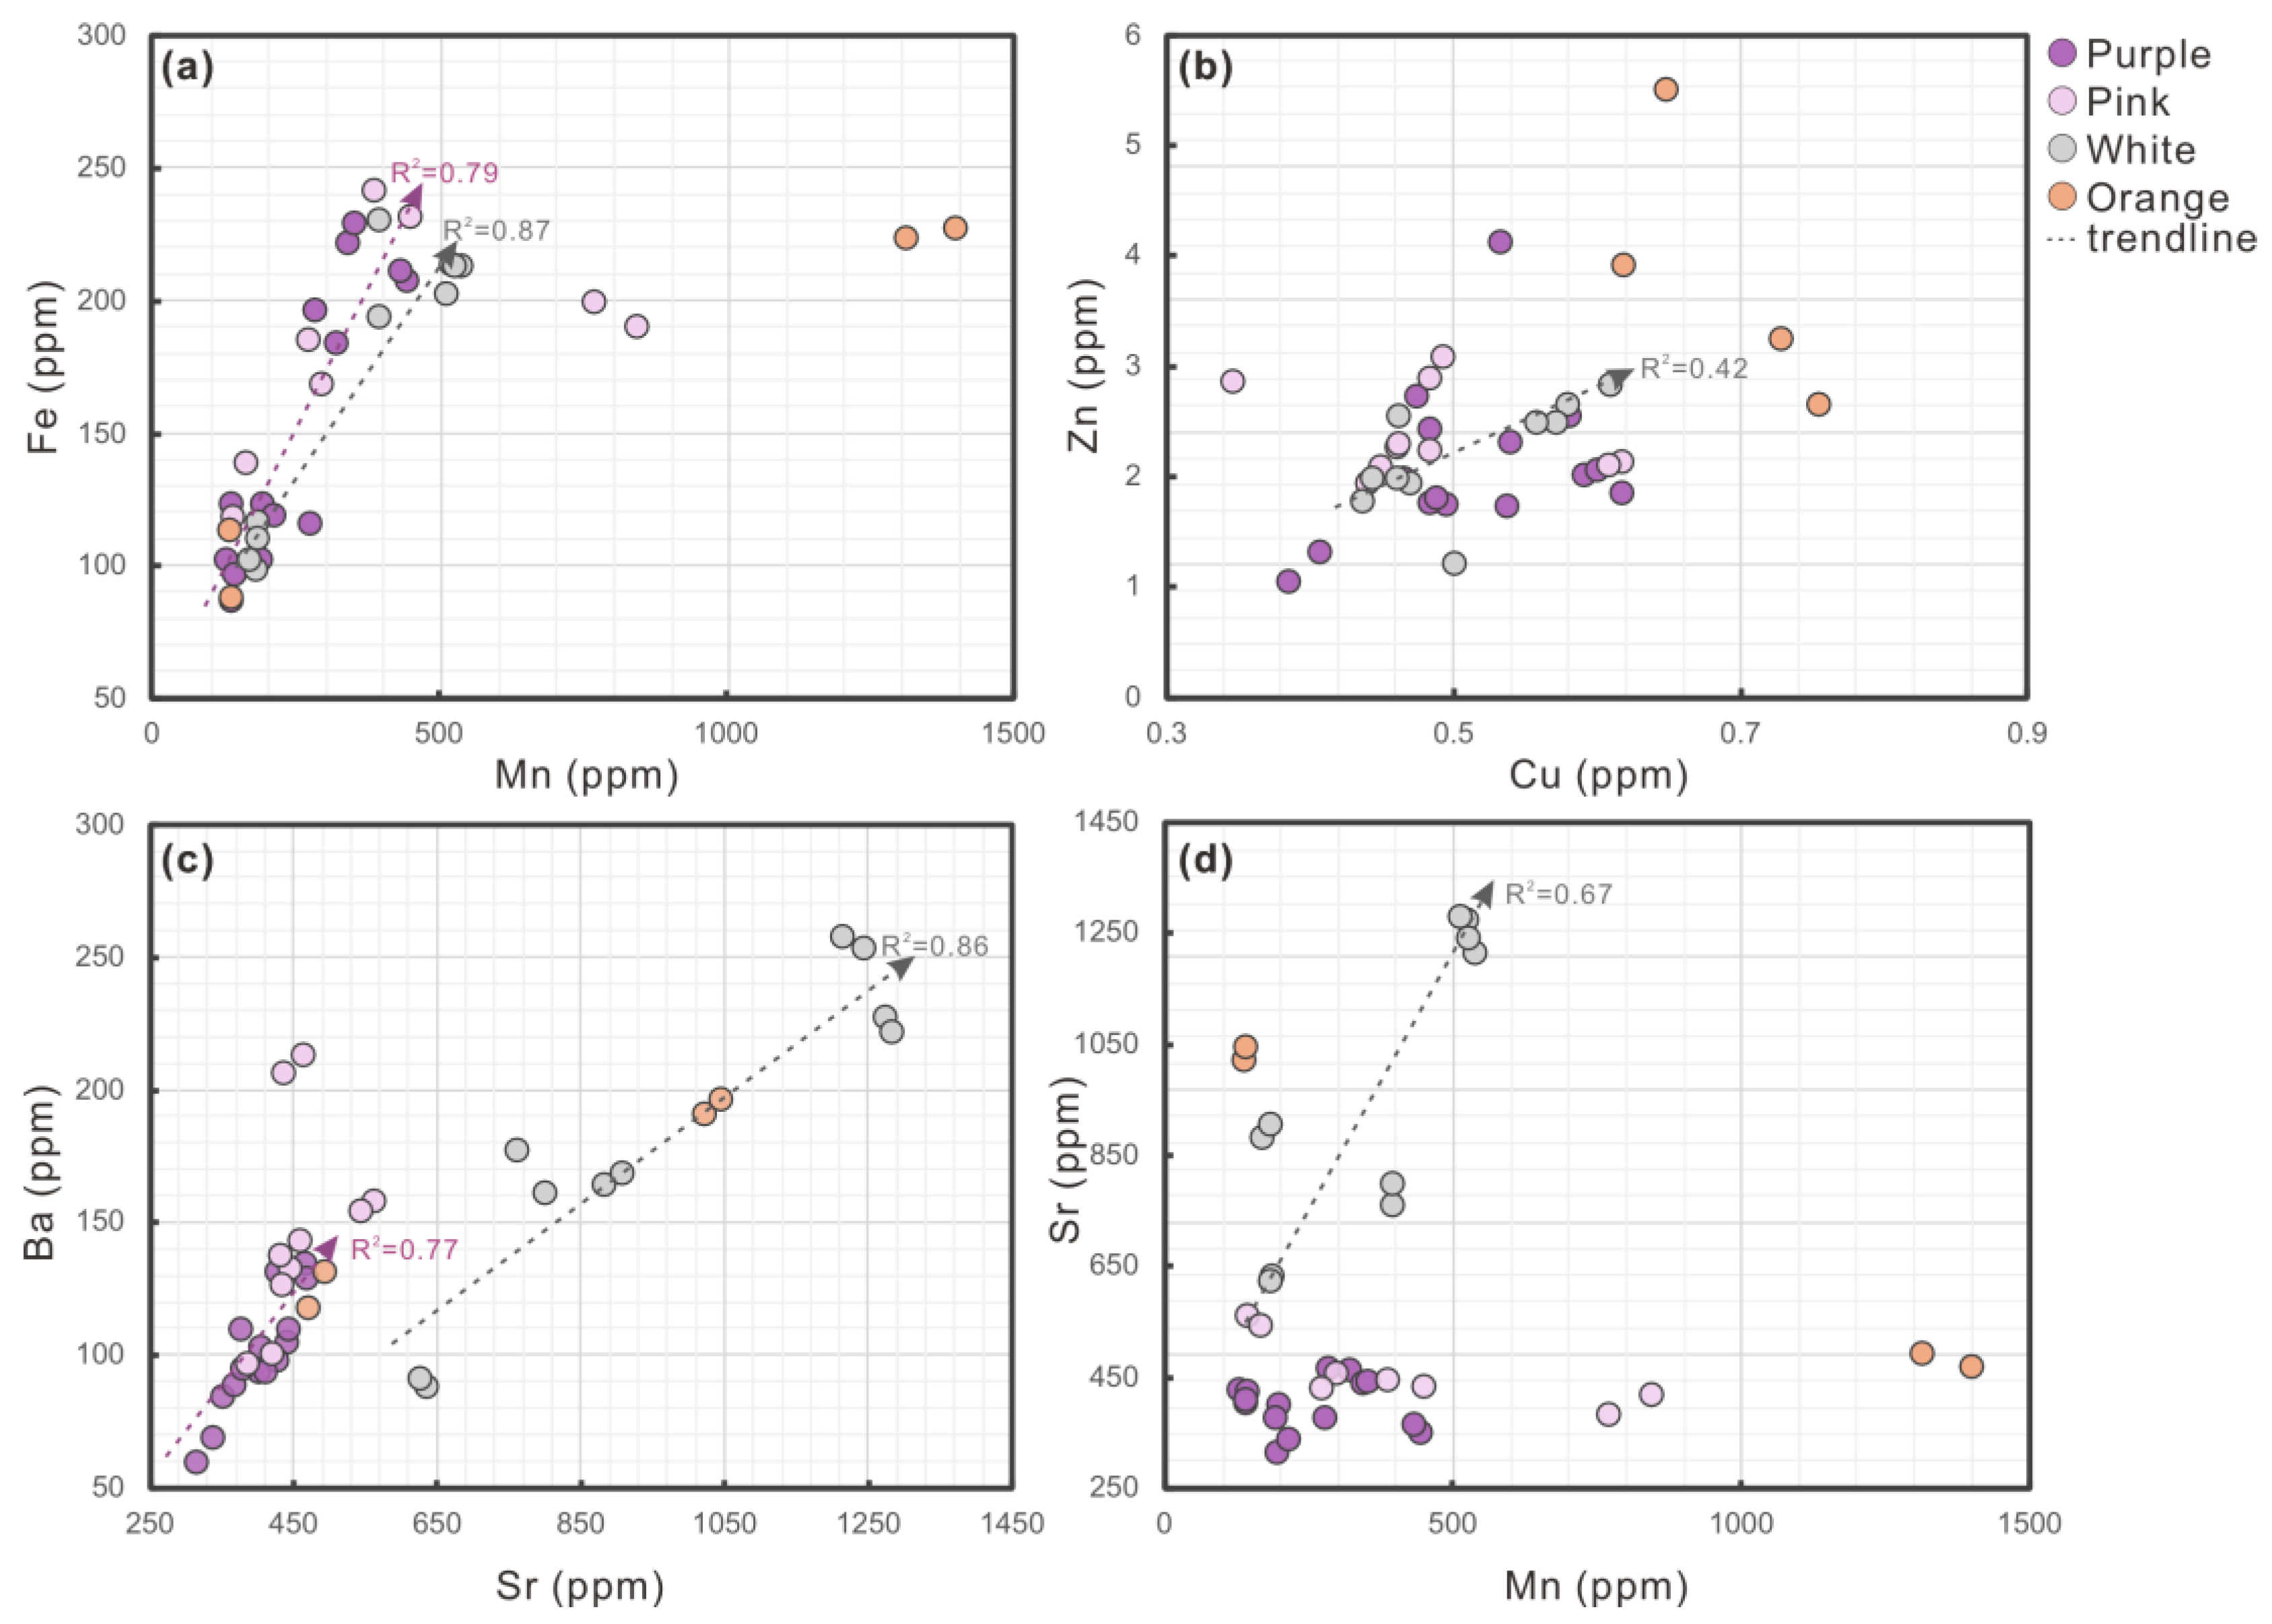
Elemental correlation analyses in freshwater cultured pearls reveal significant positive couplings between Mn-Fe, Cu-Zn, and Sr-Ba pairs (Figure 10a–c), indicating cooperative interactions during coloration. White pearls show correlation between Mn and Sr (Figure 10d), indicating synergistic interactions during color formation. The coupled behavior of these metal elements suggests a cooperative mechanism in pearl coloration. Elevated metal concentrations facilitate metalloporphyrin formation through porphyrin chelation, generating chromatically active complexes including manganese–, copper–, magnesium–, iron–, and zinc–porphyrins [3] that directly govern color development and intensification [12]. Additionally, these metal elements may substitute for Ca in the crystal lattice (e.g., Mn replacing Ca in the aragonite lattice), modifying the crystal structure and consequently altering visible light reflection and absorption properties. Such structural changes represent another pathway for color variation in pearls. Notably, white pearl coloration is attributed to iron– and manganese–porphyrin systems [3], further evidencing metals’ multifaceted regulatory roles in optical properties.
It is also worth noting the similarity in the position of both freshwater and seawater pearls within the CIE 1931 color space [47,48]. Pearl color diversity stems from wavelength-specific light absorption, likely mediated by metal ion–organic matrix interactions. It is consistent with our observations of Mn–porphyrin and Cu-Zn chelation effects. Dauphin et al. [49] have further revealed controlled metal ion partitioning during biomineralization, which may explain this color space overlap despite distinct trace element profiles. This suggests shared regulatory mechanisms in metal–organic color modulation.

4.3. Interaction Between Host Hyriopsis Cumingii and Pearl Coloration

The standardized culturing method demonstrated that pearls cultivated in high-light-exposure environments (larger water surfaces) developed enhanced color vibrancy due to light exposure. Water temperature exerted critical control over CaCO3 polymorphism: low temperatures promoted aragonite formation with fine-grained, ordered crystals, while high temperatures increased calcite content featuring coarse, disordered crystals. Optimal crystallization occurred under moderately alkaline conditions and elevated Ca concentration, accelerating biomineralization kinetics [34]. Crucially, this study systematically analyzed Hyriopsis cumingii mussels and their corresponding freshwater cultured pearls from a single Zhuji (Zhejiang Province) aquaculture base, thereby eliminating environmental variables as confounding factors in color development mechanisms.
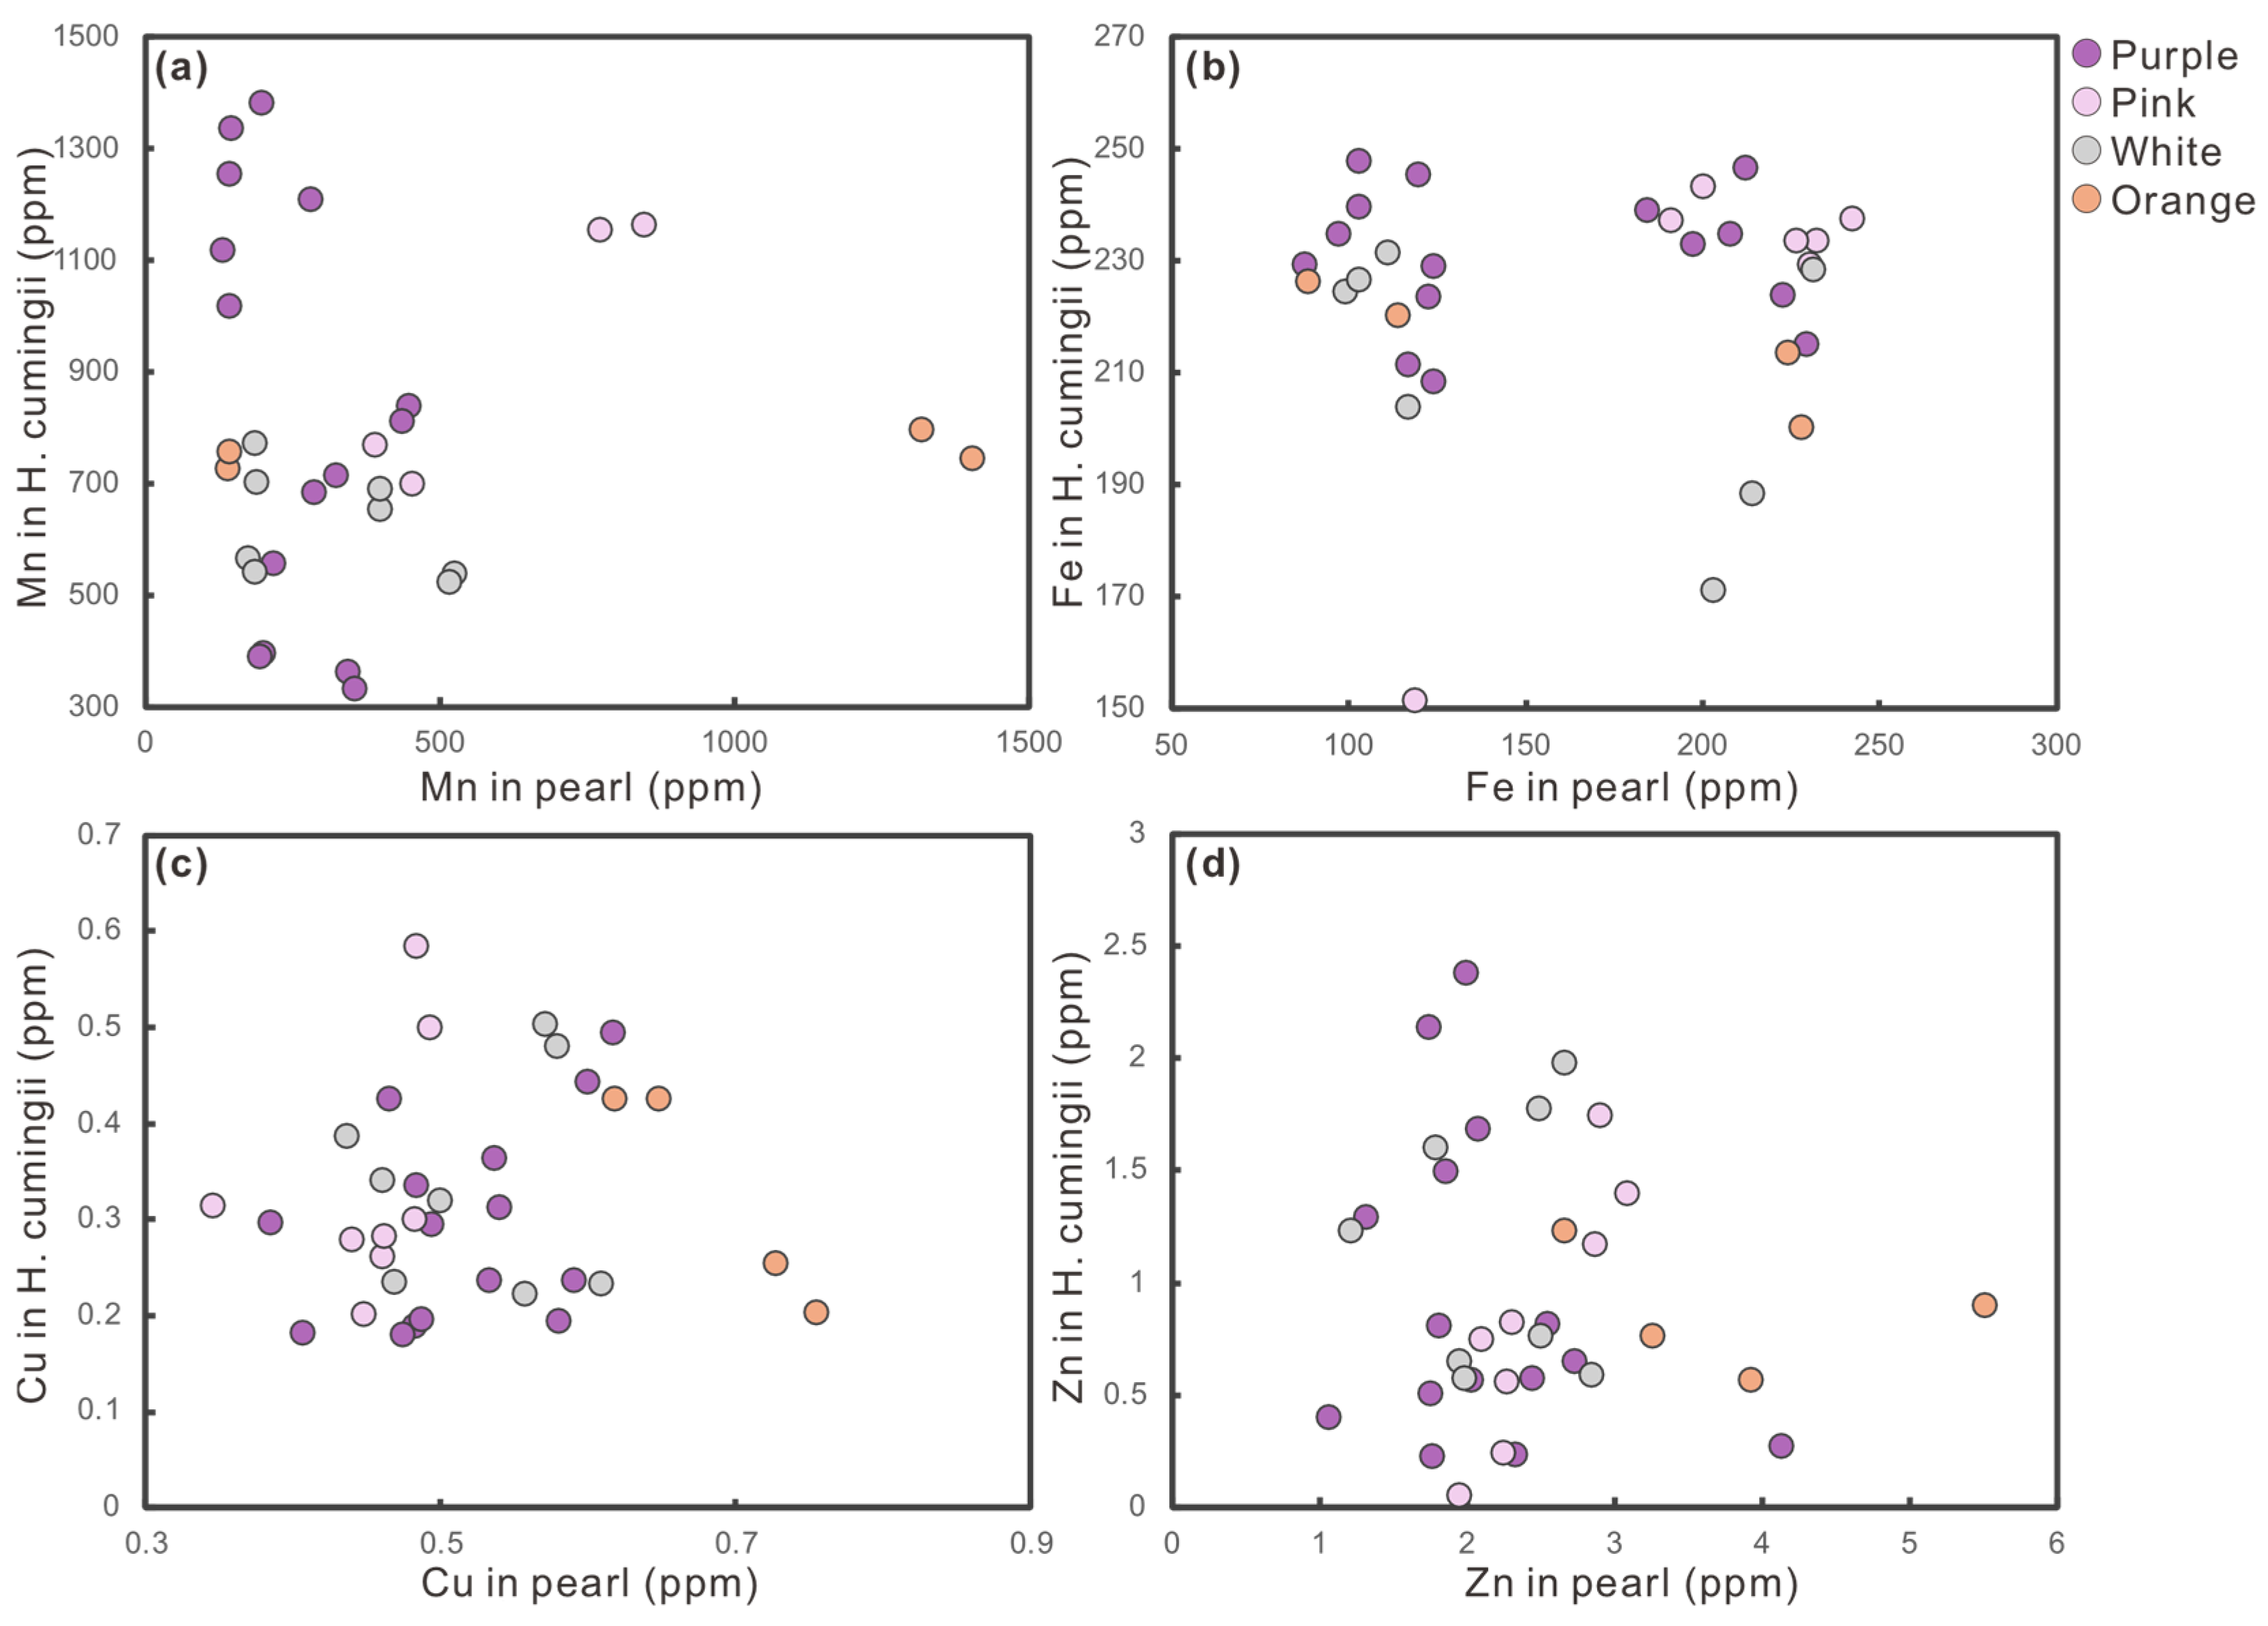
Previous studies proposed potential host mussel regulation of pearl coloration [15,30,49]. To test this hypothesis, we conducted a comparative analysis of trace element compositions in Hyriopsis cumingii peals and their corresponding mantle tissues. The results demonstrate no statistically significant correlation between the metallic elements in pearls and mantle tissues (Figure 11), effectively ruling out a regulatory role of the mother mussel in pearl coloration. Four key chromogenic elements, Mn, Fe, Cu, and Zn, were analyzed for their chromatic contributions (Figure 11a–d). These elements show no correspondence between pearl color and natal position within the host mussels (Figure 1). Collectively, these findings indicate that Hyriopsis cumingii does not play a decisive role in pearl coloration, demonstrating that pearl color develops independently of host mussel characteristics.

5. Conclusions

In this study, integrated chromogenic analysis of freshwater nucleated cultured pearls revealed the roles of organic matrix, physical structure, and trace elements in driving color variation. The main conclusions are as follows:
(1)
Polyenic compounds are mainly primary chromophores, with C=C chain length dictating core hue. The purple pearls had 12 C=C bonds, pink pearls had 11 C=C bonds, and white and orange pearls about 10 C=C bonds. Peak intensities in Raman spectra (1125–1135 cm−1 and 1509–1525 cm−1) correlate positively with color saturation.
(2)
Nacre microstructure can modulate color expression. Compactly stacked lamellar tablets (1.07–1.88 μm) in purple pearls enhance light interference, while irregular polygonal tablets (0.26–1.46 μm) in pink and orange pearls promote scattering. Elevated protein content in dark pearls enhances pigment binding capacity, intensifying color saturation.
(3)
Trace metal ions contribute via metalloporphyrin formation and lattice substitution. Identical culturing conditions and elemental profiles in pearls and host mussels indicate negligible nacre influence, confirming that color is endogenously regulated.

Author Contributions

Writing—original draft, B.Y.; writing—review and editing, Y.Z., S.Z. and Z.Z.; data curation, B.Y. and C.Z.; software B.Y.; methodology, B.X. and Y.Z. All authors have read and agreed to the published version of the manuscript.

Funding

This research was funded by the Open Fund Project of the Hainan Research Institute, China University of Geosciences (Beijing) (HNPY-202408), the National Natural Science Foundation of China (42202084, 42203034), and Fundamental Research Funds for the Central Universities (2-9-2023-046).

Data Availability Statement

The data presented in this study are available in this article.

Acknowledgments

We acknowledge Carl ZEISS (Shanghai) Management Co., Ltd. and ZEISS Microscopy Customer Center, Beijing lab, for providing Zeiss Sigma 360.

Conflicts of Interest

The authors declare no conflicts of interest.

Appendix A

Table A1. Trace-elements in mantle of different colored Edison pearls (in ppm).
SamplesNaMgAlKCaTiVCr
SRM 610104,108.09484.7911,260.00505.7685,713.25453.93457.71427.34
SRM 610104,650.02487.7311,318.66510.7086,184.35453.75458.27424.00
BCR-2G24,587.5123,579.4778,104.5716,230.8851,914.9313,171.81437.0117.13
BHVO-2G17,471.6446,062.7777,597.774759.7381,916.9915,883.83331.79289.41
Purple-1—12393.9911.041.0663.00392,252.450.000.052.52
Purple-1—22505.987.780.0071.52390,714.180.420.002.37
Purple-2—12829.3726.920.00146.20390,009.760.000.042.74
Purple-2—22668.1227.730.00136.22391,570.440.000.002.57
Purple-3—12530.8413.470.0080.73390,795.960.000.002.29
Purple-3—22489.7410.500.0071.50390,739.340.000.001.90
Purple-4—12477.869.050.0084.32392,137.220.000.002.10
Purple-4—22521.4410.540.02114.98392,056.000.000.002.38
Purple-5—12467.0539.360.0065.05391,006.990.000.002.60
Purple-5—22741.2436.610.0064.93392,160.730.000.073.09
Purple-6—12869.0710.550.0095.72391,850.050.000.001.42
Purple-6—22862.047.120.31104.58392,102.800.000.082.01
Purple-7—13025.2013.120.9719.37390,637.160.360.053.52
Purple-8—12620.580.600.0094.90392,702.850.000.003.03
Purple-8—22688.842.860.0094.59391,884.660.000.002.62
Pink-1—12417.9111.300.0789.99391,483.750.000.003.75
Pink-1—22459.4513.730.3186.21392,249.980.000.063.62
Pink-2—11777.3738.910.0043.63391,785.210.000.003.39
Pink-2—21870.6537.600.1432.94392,389.280.250.001.29
Pink-3—12551.7729.370.0051.45392,773.280.190.002.96
Pink-3—22581.6432.860.0058.52392,882.630.000.003.65
Pink-4—12143.4532.330.0297.32392,855.920.000.002.11
Pink-4—22144.6837.910.0080.90392,670.150.000.002.99
Pink-5—12777.7128.580.00101.60392,366.040.000.002.87
Pink-5—22573.9127.010.0090.02393,047.380.000.042.55
White-1—12743.7217.410.00231.53391,299.900.000.003.13
White-1—22767.4316.680.00230.42391,384.170.000.003.01
White-2—12907.0617.650.00153.01392,088.440.000.073.01
White-2—22950.3018.160.20149.76392,585.690.000.003.93
White-3—12868.587.560.5284.54393,301.930.000.003.55
White-3—23026.378.840.0792.92392,761.960.000.002.34
White-4—12587.884.310.36141.11393,446.810.000.002.12
White-4—22588.961.580.47142.33392,119.940.000.052.97
White-5—12383.7523.690.00127.30392,171.240.000.021.15
White-5—22253.9427.090.00116.11391,807.090.000.003.02
Orange-1—12563.3530.350.00354.20390,848.320.000.013.09
Orange-1—22653.0233.680.00313.24390,219.510.340.003.85
Orange-2—12673.6313.810.00110.46393,672.540.000.001.82
Orange-2—22659.2210.610.00113.14391,491.590.000.022.91
SamplesMnFeNiCuZnSrMoCsBa
SRM 610508.45467.11477.05452.44450.93550.17425.68383.11476.02
SRM 610505.90491.03477.19445.97453.03547.04422.28372.05470.52
BCR-2G1616.2258,382.0511.3119.04175.67343.35257.991.13679.77
BHVO-2G1382.6950,988.08127.71128.52132.31391.054.390.10128.51
Purple-1—1197.46122.230.000.541.73401.790.170.0193.70
Purple-1—2191.42102.890.000.461.99377.180.130.00110.09
Purple-2—1130.32102.670.000.592.02427.280.220.00131.61
Purple-2—2139.73123.690.000.542.32404.100.190.00103.43
Purple-3—1322.09184.380.000.491.75465.220.060.00134.76
Purple-3—2283.89197.020.000.481.76467.960.400.00129.28
Purple-4—1444.38207.900.000.482.44350.800.070.0084.60
Purple-4—2433.79211.800.220.534.12366.390.120.0189.10
Purple-5—1342.97222.340.000.602.07440.160.440.00105.30
Purple-5—2353.91229.380.750.621.85443.370.050.00109.93
Purple-6—1143.4297.160.090.491.81426.530.040.0098.23
Purple-6—2139.9387.360.060.582.55411.120.000.0093.91
Purple-7—1277.50116.581.200.472.73379.110.040.0095.11
Purple-8—1194.08123.670.000.411.31314.790.040.0159.84
Purple-8—2214.19119.460.460.381.06338.050.070.0069.37
Pink-1—1386.43241.960.000.452.10444.760.120.02133.03
Pink-1—2450.85232.140.870.462.27433.190.020.02126.80
Pink-2—12130.58226.310.000.352.86434.950.270.00206.35
Pink-2—22245.31230.420.670.462.30463.370.450.00213.11
Pink-3—1143.13118.680.130.493.08562.070.030.00158.28
Pink-3—2165.42139.420.000.482.89544.260.030.00154.46
Pink-4—1845.24190.910.260.482.25419.380.070.00100.63
Pink-4—2771.04200.200.180.441.94384.670.140.0197.18
Pink-5—1297.47169.190.750.622.13458.540.020.00143.38
Pink-5—2273.17185.540.390.612.10431.370.070.00137.92
White-1—1523.58213.920.540.582.661273.610.160.00227.87
White-1—2513.06202.690.270.572.491282.020.060.00222.09
White-2—1395.10194.410.240.562.50760.130.230.00177.58
White-2—2395.66230.980.200.612.84799.350.260.00161.43
White-3—1186.01116.720.520.471.94634.100.380.0188.17
White-3—2183.0799.170.050.461.98625.110.060.0091.43
White-4—1170.88102.920.350.501.21882.100.000.01164.49
White-4—2184.08111.100.770.441.78907.660.210.00168.67
White-5—1539.10213.270.350.441.981215.090.280.01257.73
White-5—2528.40213.520.000.462.541243.400.000.00253.59
Orange-1—11314.64224.050.000.623.92494.170.100.01131.53
Orange-1—21400.90228.020.130.655.51471.030.140.00118.02
Orange-2—1137.16113.960.000.752.651021.790.090.00190.90
Orange-2—2140.3288.320.320.733.251045.820.090.01196.40
Table A2. Trace-elements the mantle tissue of Hyriopsis cumingii mussels (in ppm).
SamplesNaMgKCaTiVCr
purple-b1—12782.091.069.42386,135.450.000.001.91
purple-b1—22807.730.1213.34385,828.100.000.002.05
purple-b2—12117.8118.0711.21388,335.950.000.082.26
purple-b2—22144.6415.9311.81389,402.200.000.001.15
purple-b3—12466.272.747.57386,567.840.000.022.41
purple-b3—22444.532.048.26386,004.600.000.002.43
purple-b4—12466.313.268.16383,117.800.220.011.98
purple-b4—22480.240.726.76386,841.010.000.002.15
gary-b1—12612.0516.5131.20389,928.330.000.082.72
gary-b1—22441.1416.2127.20386,538.040.000.001.73
gary-b2—11788.3923.5410.34385,854.930.000.002.24
gary-b2—21726.8622.0911.14383,039.900.000.002.23
gary-b3—11776.8925.6625.33384,840.780.220.001.28
gary-b3—21872.3528.9625.59384,277.140.290.002.07
gary-b4—12408.398.814.49382,570.680.000.052.63
gary-b4—22421.845.154.80384,593.280.040.002.74
pink-b4—12446.221.5219.88386,620.110.010.062.78
pink-b4—22484.903.0332.51383,433.150.000.001.38
PINKb-3—12403.870.0820.91389,764.580.000.003.62
PINKb-3—22368.950.0013.12388,687.730.000.001.73
PINKb-1—12614.9010.7215.04392,060.160.040.003.05
PINKb-1—22701.4112.8114.19393,621.930.000.012.94
PINKb-2—11951.0819.449.04392,408.430.000.033.58
PINKb-2—22021.7820.025.19393,945.550.000.022.97
orange-b1—11994.5228.987.41385,531.250.000.001.36
orange-b1—21953.3822.715.33386,445.210.000.001.61
orange-b2—11735.8216.359.20385,508.340.000.041.65
orange-b2—21796.3618.108.87384,758.480.000.061.19
orange-b3—12372.390.008.24383,737.730.000.002.84
orange-b3—22307.000.008.65383,969.100.000.051.38
orange-b4—12495.960.627.39384,190.830.500.021.81
orange-b4—22538.992.108.50382,632.620.000.082.76
White-b1—12277.080.004.94393,630.000.000.002.13
White-b1—22291.630.0010.18392,185.070.000.002.18
White-b2—12321.910.005.15390,402.590.000.072.91
White-b2—22245.950.005.57389,099.510.050.002.69
White-b3—12147.260.005.08389,814.590.000.012.31
White-b3—22363.850.007.40389,678.970.420.002.67
White-b4—12536.400.423.32388,803.490.000.002.58
White-b4—22527.990.145.92387,538.420.520.001.71
SamplesMnFeNiCuZnSrMoCsBa
purple-b1—1395.51223.640.780.362.14179.890.090.0055.09
purple-b1—2389.82247.760.440.432.38188.400.080.0063.41
purple-b2—11118.31239.620.380.240.57615.330.160.00181.59
purple-b2—21016.54208.310.000.310.23537.140.130.00166.90
purple-b3—1713.33238.980.210.290.50278.320.120.0182.90
purple-b3—2683.98232.920.280.340.23271.570.160.0080.23
purple-b4—1838.46234.860.200.190.57358.030.140.00115.68
purple-b4—2812.36246.740.360.240.27351.100.190.01114.05
gary-b1—1362.56223.820.170.441.69312.140.080.0073.90
gary-b1—2332.91215.120.020.501.49308.140.040.0062.84
gary-b2—11333.95234.730.390.200.81863.440.070.00251.25
gary-b2—21254.22229.460.460.190.81838.030.120.00266.04
gary-b3—11208.89211.610.000.180.65618.110.200.00164.26
gary-b3—21381.39229.070.570.181.29694.670.250.00182.72
gary-b4—1557.63245.310.110.300.40304.800.140.0075.48
gary-b4—2568.32255.930.440.250.53306.530.170.0177.68
pink-b4—1768.59237.450.120.200.75363.210.110.00105.05
pink-b4—2699.98233.690.030.260.56361.060.080.0294.07
PINKb-3—1587.61233.571.180.311.17239.450.110.0058.79
PINKb-3—2560.20229.230.740.280.82237.480.130.0057.69
PINKb-1—1227.28151.510.860.501.40259.370.040.0161.40
PINKb-1—2224.17122.470.170.581.74293.240.000.0175.05
PINKb-2—11161.84237.270.320.300.24571.780.560.00136.98
PINKb-2—21152.91243.270.380.280.05588.960.320.00148.21
orange-b1—1796.86213.740.230.430.561187.090.200.00218.46
orange-b1—2745.64200.160.000.430.891082.860.180.01183.27
orange-b2—1725.13220.150.380.201.231828.470.190.01411.49
orange-b2—2757.14226.270.230.250.761939.840.220.00454.13
orange-b3—1617.54248.120.000.350.62871.660.000.00135.53
orange-b3—2602.11243.610.400.331.26892.080.410.00133.98
orange-b4—1853.89265.410.830.330.571031.780.070.00158.40
orange-b4—2886.57262.070.570.270.551099.480.090.00169.52
White-b1—1538.20188.610.400.481.98735.290.240.00148.50
White-b1—2521.70171.350.000.501.77722.610.340.00143.03
White-b2—1651.960.000.000.220.76715.230.270.00146.50
White-b2—2689.29228.300.000.230.59722.300.360.02148.69
White-b3—1700.95204.060.000.230.65805.230.520.00163.44
White-b3—2772.33224.650.000.340.58856.750.300.01172.47
White-b4—1563.99226.650.840.321.23635.890.200.01120.78
White-b4—2540.10231.380.060.391.60604.650.290.00109.88

References

  1. Karampelas, S.; Fritsch, E.; Mevellec, J.-Y.; Sklavounos, S.; Soldatos, T. Role of polyenes in the coloration of cultured freshwater pearls. Eur. J. Mineral. 2009, 21, 85–97. [Google Scholar] [CrossRef]
  2. Sato, A.; Cartier, L.E. The Value of Pearls. Gemguide 2022, 1–8. [Google Scholar]
  3. Wang, Z.; Adzigbli, L.; Zheng, Z.; Yang, C.; Deng, Y. How cultured pearls acquire their colour. Aquac. Res. 2020, 51, 3925–3934. [Google Scholar] [CrossRef]
  4. Muhammad, G.; Fujimura, T.; Komaru, A. The effects of nacre microstructure on green and pink interference colors in Pinctada fucata martensii pearls. Aquaculture 2021, 535, 736424. [Google Scholar] [CrossRef]
  5. Li, L.P.; Yan, W.X. The relationship between the structure and luster of cultured pearls. China Gems 1998, 4, 68–70. [Google Scholar]
  6. Karampelas, S.; Fritsch, E.; Mevellec, J.Y.; Gauthier, J.P.; Sklavounos, S.; Soldatos, T. Determination by Raman scattering of the nature of pigments in cultured freshwater pearls from the mollusk Hyriopsis cumingi. J. Raman Spectrosc. 2007, 38, 217–230. [Google Scholar] [CrossRef]
  7. Yan, G.A.O.; Beili, Z. Research on Relationship between Colour and Raman Spectrum of Freshwater Cultured Pearl. J. Gems Gemmol. 2001, 3, 17–20. [Google Scholar]
  8. Zwaan, J.H.; Karampelas, S. An unusual black natural pearl from Mytilidae. J. Gemmol. 2021, 37, 461–463. [Google Scholar] [CrossRef]
  9. Shi, L.; Liu, X.; Mao, J.; Han, X. Study of coloration mechanism of cultured freshwater pearls from mollusk Hyriopsis cumingii. J. Appl. Spectrosc. 2014, 81, 97–101. [Google Scholar] [CrossRef]
  10. Karampelas, S.; Fritsch, E.; Gauthier, J.-P.; Hainschwang, T. UV-Vis-NIR reflectance spectroscopy of natural-color saltwater cultured pearls from Pinctada margaritifera. Gems Gemol. 2011, 47, 31–35. [Google Scholar] [CrossRef]
  11. Karampelas, S. Spectral characteristics of natural-color saltwater cultured pearls from Pinctada maxima. Gems Gemol. 2012, 48, 193–197. [Google Scholar] [CrossRef]
  12. Yan, X.; Jiang, Y.; Jin, H.; Chen, T.; Zhou, Y.; Liu, J.; Yan, J. Unique spectral characteristics of natural-color Edison pearls cultured in Hyriopsis cumingii, and its formation mechanisms. Micron 2022, 160, 103324. [Google Scholar] [CrossRef] [PubMed]
  13. Parker, A.R. The diversity and implications of animal structural colours. J. Exp. Biol. 1998, 201, 2343–2347. [Google Scholar] [CrossRef]
  14. Zhang, W.; Zhang, G. Dynamic structural color in the nacre of Hyriopsis Cumingii and its cause. Optik 2017, 135, 252–255. [Google Scholar] [CrossRef]
  15. McDougall, C.; Moase, P.; Degnan, B.M. Host and donor influence on pearls produced by the silver-lip pearl oyster, Pinctada maxima. Aquaculture 2016, 450, 313–320. [Google Scholar] [CrossRef]
  16. Shinohara, M.; Kinoshita, S.; Tang, E.; Funabara, D.; Kakinuma, M.; Maeyama, K.; Nagai, K.; Awaji, M.; Watabe, S.; Asakawa, S. Comparison of two pearl sacs formed in the same recipient oyster with different genetic background involved in yellow pigmentation in Pinctada fucata. Mar. Biotechnol. 2018, 20, 594–602. [Google Scholar] [CrossRef] [PubMed]
  17. Deng, Y.H.; Yuan, K.R. The factors for restricting quality of Chinese pearl. J. Guilin Univ. Technol. 2001, 21, 6–12. [Google Scholar]
  18. Chen, L.; Liu, Y.; Hu, Z.; Gao, S.; Zong, K.; Chen, H. Accurate determinations of fifty-four major and trace elements in carbonate by LA–ICP-MS using normalization strategy of bulk components as 100%. Chem. Geol. 2011, 284, 283–295. [Google Scholar] [CrossRef]
  19. Li, B.; Shen, A.H. Effect of Fe2O3@ SiO2 Core–Shell Nanoparticle Doping Ratio on Color Appearance of Synthetic Opal Films Inspired by Natural Fire Opal. Coatings 2025, 15, 646. [Google Scholar] [CrossRef]
  20. Xu, Z.; Li, R.; Guo, Q.; Cao, S.W. Discussion about the Test of Aragonite Crystal Orientation by IR Spectral Reflection. Infrared Technol. 2015, 37, 171–175. [Google Scholar]
  21. Urmos, J.; Sharma, S.; Mackenzie, F. Characterization of some biogenic carbonates with Raman spectroscopy. Am. Mineral. 1991, 76, 641–646. [Google Scholar]
  22. Zhang, G.; Xie, X.; Wang, Y. Raman spectra of nacre from shells of main pearl-culturing mollusk in China. Guang Pu Xue Yu Guang Pu Fen Xi Guang Pu 2001, 21, 193–196. [Google Scholar]
  23. Chen, C.; Yu, J.; Zhang, C.; Ye, X.; Shen, A.H. Nature of Pigments in Orange and Purple Coloured Chinese Freshwater Cultured Pearls: Insights from Experimental Raman Spectroscopy and DFT Calculations. Minerals 2023, 13, 959. [Google Scholar] [CrossRef]
  24. Du, X.; Fan, G.; Jiao, Y.; Zhang, H.; Guo, X.; Huang, R.; Zheng, Z.; Bian, C.; Deng, Y.; Wang, Q. The pearl oyster Pinctada fucata martensii genome and multi-omic analyses provide insights into biomineralization. Gigascience 2017, 6, gix059. [Google Scholar] [CrossRef] [PubMed]
  25. Qin, Z.; Ma, H.; Mu, S.; Tong, Z. Research on relationship between color and Raman Spectrum of freshwater cultured pearl of good quality. Acta Mineral. Sin. 2007, 27, 73–76. [Google Scholar]
  26. Hu, Y.; Fan, L.W.; Huang, Y.L. Research on Raman Spectra of Organic Ingredients on Colored Pearls. Spectrosc. Spectr. Anal. 2014, 34, 98–102. [Google Scholar]
  27. Schügerl, F.; Kuzmany, H. Optical modes of trans-polyacetylene. J. Chem. Phys. 1981, 74, 953–958. [Google Scholar] [CrossRef]
  28. Schaffer, H.; Chance, R.; Silbey, R.; Knoll, K.; Schrock, R. Conjugation length dependence of Raman scattering in a series of linear polyenes: Implications for polyacetylene. J. Chem. Phys. 1991, 94, 4161–4170. [Google Scholar] [CrossRef]
  29. Barnard, W.; De Waal, D. Raman investigation of pigmentary molecules in the molluscan biogenic matrix. J. Raman Spectrosc. 2006, 37, 342–352. [Google Scholar] [CrossRef]
  30. Jin, S.; Renfro, N.D.; Palke, A.C.; Ardon, T.; Homkrajae, A. Application of UV-VIS-NIR Spectroscopy to Gemology. Gems Gemol. 2024, 60, 456–473. [Google Scholar] [CrossRef]
  31. Jun, Y.; Shi, B.F.; Xue, J.Y.; Jia, W.S.; Jiang, X.; Chong, X.; Jian, Z. Study on the common effect of heat treatment, dyeing or irradiation treatment on UV-Vis diffuse reflectance spectra of pearls. Spectrosc. Spectr. Anal. 2022, 42, 3697–3702. [Google Scholar]
  32. Jachowicz, J.; McMullen, R.L. Tryptophan fluorescence in hair—Examination of contributing factors. J. Cosmet. Sci. 2011, 62, 291. [Google Scholar]
  33. Falk, H.; Mayr, E.; Richter, A.E. Simple diffuse reflectance UV-Vis spectroscopic determination of organic pigments (fringelites) in fossils. Microchim. Acta 1994, 117, 1–5. [Google Scholar] [CrossRef]
  34. Snow, M.R.; Pring, A.; Self, P.; Losic, D. The origin of the color of pearls in iridescence from nano-composite structures of the nacre. Am. Mineral. 2004, 89, 1353–1358. [Google Scholar] [CrossRef]
  35. Zhao, J.M.; Mei, K.S.; Zhang, W.B.; Xu, W.; Tan, B.P.; Ma, H.M.; Liufu, Z.G.; Ai, Q.H. A Review on Characteristic of Nacre and Its Potential for Biomimetic Applications. Chin. High Technol. Lett. 2003, 13, 94–98. [Google Scholar]
  36. Li, G.; Lin, L.; Sha, N.L.; Zhao, H.Y. A preliminary study on the relationship between luster, color and organic matter of freshwater cultured pearls. J. Guilin Univ. Technol. 2007, 27, 569–571. [Google Scholar]
  37. Leung, H.; Sinha, S.K. Scratch and indentation tests on seashells. Tribol. Int. 2009, 42, 40–49. [Google Scholar] [CrossRef]
  38. Li, X. Nanoscale structural and mechanical characterization of natural nanocomposites: Seashells. JOM 2007, 59, 71–74. [Google Scholar] [CrossRef]
  39. Ma, H.; Wei, Q.; Lu, S.; Mu, D.; Wu, M. The ultrastructure characterization of high-quality freshwater cultured pearls modified by color using physical method. Acta Mineral. Sin. 2012, 32, 139–145. [Google Scholar]
  40. Liu, Y.; Hurwit, K.N.; Tian, L. Relationship between the groove density of the grating structure and the strength of iridescence in mollusc shells. J. Aust. Gemmol. 2003, 21, 405–407. [Google Scholar]
  41. Yan, X.; Liu, X.; Zhou, W.; Zhou, D.; Liu, P.; Chen, T.; Yan, J. The gemological characteristics of yellow seawater bead-cultured pearl farming in Beihai City, southern China. Micron 2024, 176, 103558. [Google Scholar] [CrossRef] [PubMed]
  42. Satitkune, S.; Monarumit, N.; Boonmee, C.; Phlayrahan, A.; Promdee, K.; Won-In, K. Combination of FTIR and SEM for identifying freshwater-cultured pearls from different quality. Opt. Spectrosc. 2016, 120, 500–504. [Google Scholar] [CrossRef]
  43. Comfort, A. Acid-soluble pigments of molluscan shells. 5. Identity of some subsidiary fractions derived from Pinctada vulgaris. Biochem. J. Appl. Spectrosc. 1950, 47, 254–255. [Google Scholar] [CrossRef]
  44. Jackson, D.J.; McDougall, C.; Green, K.; Simpson, F.; Wörheide, G.; Degnan, B.M. A rapidly evolving secretome builds and patterns a sea shell. BMC Biol. 2006, 4, 40. [Google Scholar] [CrossRef]
  45. Joubert, C.; Linard, C.; Le Moullac, G.; Soyez, C.; Saulnier, D.; Teaniniuraitemoana, V.; Ky, C.L.; Gueguen, Y. Temperature and food influence shell growth and mantle gene expression of shell matrix proteins in the pearl oyster Pinctada margaritifera. PLoS ONE 2014, 9, e103944. [Google Scholar] [CrossRef]
  46. Dorant, Y.; Quillien, V.; Le Luyer, J.; Ky, C.-L. Comparative transcriptomics identifies genes underlying growth performance of the Pacific black-lipped pearl oyster Pinctada margaritifera. BMC Genom. 2024, 25, 717. [Google Scholar] [CrossRef]
  47. Dauphin, Y.; Cuif, J.-P. Trichromatic characterization of the “black pearls” from aquaculture centers of French Polynesia. Aquaculture 1995, 133, 113–121. [Google Scholar] [CrossRef]
  48. Dauphin, Y.; Cuif, J.P.; Cotte, M.; Salomé, M. Structure and composition of the boundary zone between aragonitic crossed lamellar and calcitic prism layers in the shell of Concholepas concholepas (Mollusca, Gastropoda). Invertebr. Biol. 2012, 131, 165–176. [Google Scholar] [CrossRef]
  49. Zhang, G.; Xu, S.; Fang, A. Graft tissue on the genesis of color of denuclearize pearl in mantle of Hyriopsis cumingii. Shuisheng Shengwu Xuebao 2013, 37, 581–587. [Google Scholar]
Figure 1. (a) Edison pearls (n = 20) showing four color variants. (b) Representative purple Hyriopsis cumingii specimen. (c) Representative white Hyriopsis cumingii specimen. The red circles and numbers represent the selected points and numbers for the LA-ICP-MS analysis.
Crystals 15 00797 g001
Figure 2. The representative UV–vis–NIR spectra of purple (a), pink (b), white (c) and orange (d) Edison pearls.
Crystals 15 00797 g002
Figure 3. CIE 1931 chromaticity coordinates calculated from the reflection spectra of Edison pearl films [19]. (a) Full CIE 1931 chromaticity diagram. (b) Zoomed-in CIE 1931 chromaticity diagram.
Crystals 15 00797 g003
Figure 4. The representative FTIR spectra of purple (a), pink (b), white (c) and orange (d) Edison pearls.
Crystals 15 00797 g004
Figure 5. The representative Raman spectra of purple (a), pink (b), white (c) and orange (d) Edison pearls.
Crystals 15 00797 g005
Figure 6. The XRD pattern of Edison pearls (colored lines) superimposed on standard aragonite reference (PDF#41-1475). The data obtained align closely with the standard reference card for aragonite, indicating a high degree of correlation.
Crystals 15 00797 g006
Figure 7. Backscattered electron (BSE) images showing the aragonite (Arg) tablet arrangement on pearl surfaces. From left to right in each row: 10,000×, 5000× and 2000× magnification. (a1a3) Purple pearls exhibit uniformly aligned lamellar tablets in compact arrays. (b1b3) Gray-purple pearls with a heterogeneous circular tablet distribution. (c1c3) White pearls with near-circular tablets. (d1d3) Pink pearls with tightly packed irregular polygonal tablets. (e1e3) Orange pearls with rounded polygonal tablets.
Crystals 15 00797 g007
Figure 8. Backscattered electron (BSE) images of aragonite tablet arrangement on pearl fracture surfaces at varying magnifications. Aragonite tablets in (a) 6200× (b) 7700× (c) 560× and (d) 19,000× magnification.
Crystals 15 00797 g008
Figure 9. Correlation between the count of C=C double bonds and the Raman band position of C=C stretching vibration (ν1; mean value derived from empirical formula) [23]. The black lines indicate the Raman shift values associated with polyenes containing varying numbers of C=C double bonds.
Crystals 15 00797 g009
Figure 10. Trace elements of the freshwater nucleated cultured pearl surface. (a) Mn vs. Fe. (b) Cu vs. Zn. (c) Sr vs. Ba. (d) Mn vs. Sr.
Crystals 15 00797 g010
Figure 11. Correlation of Mn (a), Fe (b), Cu (c) and Zn (d) contents between Edison pearl and their host Hyriopsis cumingii (H. cumingii).
Crystals 15 00797 g011
Table 1. The relationship between the number of C=C double bonds and the position of the C=C double bond stretching vibration (ν1) [27,28,29].
Number of C = C Double Bonds (N)Raman Shift ν1 (According to Schügerl et al., 1981) [27]Raman Shift ν1 (According to Schafer et al., 1991) [28]Raman Shift ν1 (According to Barnard et al., 2006) [29]
ν1 = 1459 + 720/(N + 1)ν1 = 1438 + 830/N (7 ≦ N ≦ 12)ν1 = 97.07 × ln(1/N) + 1745 (3 ≦ N ≦ 12)
41603/1610
51579/1589
61562/1571
7154915571556
8153915421543
9153115301532
10152415211521
11151915131512
12151415071504
131510//
141507//
Table 2. Maximum height (H) at 1125–1135 cm−1 and 1509–1525 cm−1 for Edison pearls.
Samples1125 cm−1–1135 cm−11509 cm−1–1525 cm−1
HH
Purple-15624.767091.08
Purple-212,092.5616,575.38
Purple-311,210.7314,973.70
Purple-48495.1310,648.60
Purple-512,572.4518,670.11
Purple-612,090.5312,965.54
Purple-712,875.1020,404.74
Purple-816,369.7416,480.06
Pink-11570.051390.24
Pink-22524.352535.04
Pink-33881.854967.69
Pink-44205.804952.88
Pink-59958.1415,164.71
White-11215.03215.64
White-2426.27560.86
White-31622.241295.58
White-41438.421458.21
White-51485.761493.50
Orange-12975.894450.27
Orange-23367.524182.97
Disclaimer/Publisher’s Note: The statements, opinions and data contained in all publications are solely those of the individual author(s) and contributor(s) and not of MDPI and/or the editor(s). MDPI and/or the editor(s) disclaim responsibility for any injury to people or property resulting from any ideas, methods, instructions or products referred to in the content.