Article

Mineralogical Characteristics and Color Genesis of Vesuvianite Jade from Hanzhong, Shaanxi Province, China

1
School of Gemology, China University of Geosciences, Beijing 100083, China
2
Hebei Key Laboratory of Green Development of Rock Mineral Materials, Hebei GEO University, Shijiazhuang 050031, China
*
Author to whom correspondence should be addressed.
These authors contributed equally to this work.
Crystals 2025, 15(9), 765; https://doi.org/10.3390/cryst15090765
Submission received: 24 July 2025 / Revised: 20 August 2025 / Accepted: 25 August 2025 / Published: 28 August 2025
(This article belongs to the Collection Topic Collection: Mineralogical Crystallography)

Abstract

A new type of vesuvianite jade has recently been discovered in Hanzhong City, Shaanxi Province, China. However, a systematic investigation into its mineralogical characteristics and the origin of its color is currently lacking. In this study, the gemological, mineralogical, and spectroscopic properties of the Hanzhong vesuvianite jade were comprehensively analyzed using a suite of modern analytical techniques, including standard gemological testing, polarizing microscopy, X-ray powder diffraction, Fourier-transform infrared spectroscopy, laser Raman spectroscopy, UV-visible absorption spectroscopy, and X-ray fluorescence spectroscopy. The origin of the jade’s color was also preliminarily investigated. The results indicate that the samples are primarily composed of vesuvianite, with associated minerals including minor amounts of grossular, chlorite, and diopside, and trace amounts of calcite, epidote, chromite, and titanite. The pale green patches consist mainly of chlorite and grossular, the dark green bands are predominantly chlorite, and the dark brown patches are composed of abundant, disseminated microcrystalline chromite intermixed with uvarovite (calcium chromium garnet). The major chemical components of the vesuvianite jade matrix are SiO2, Al2O3, and CaO. Specifically, SiO2 ranges from 37.01 to 38.54 wt.%, Al2O3 from 18.48 to 22.84 wt.%, and CaO from 37.16 to 40.04 wt.%. Minor amounts include MgO (0.76–4.39 wt.%) and FeOT (total iron expressed as FeO, 0.56–2.09 wt.%). The yellowish-green color of the matrix originates from a combination of ligand-to-metal charge transfer of Fe3+, crystal field transitions of Fe3+, and intervalence charge transfer between Fe2+ and Fe3+ in vesuvianite. The emerald-green color of the patches results from the synergistic effect of Fe and Cr; Fe provides a yellowish-green background color, upon which the crystal field transitions of Cr3+ (indicated by a doublet at 686/696 nm) impose strong absorption in the red region, resulting in a more vivid green hue.

1. Introduction

Vesuvianite is a complex sorosilicate mineral first discovered in 1795 on Mount Vesuvius, Italy, from which it derives its name [1]. Gem-quality vesuvianite crystals are primarily sourced from localities in Italy, the United States, Pakistan, and Canada. A high-quality single-crystal vesuvianite gemstone has also been reported from She County, Hebei Province, China [2,3,4,5,6]. Unlike traditional jades such as nephrite and jadeite, vesuvianite jade is defined as a polycrystalline aggregate composed predominantly of the mineral vesuvianite. Notable localities for vesuvianite jade include Norway, California, USA (where it is known as Californite), the Tawmaw mining area in Myanmar, as well as the Tongbai region in Henan and the Manas region in Xinjiang, China. In the Chinese jewelry market, high-quality vesuvianite jade is known as “Jincui jade” and is often mistaken for jadeite due to its similar appearance [7,8,9,10,11].
The general chemical formula for vesuvianite is Ca19Fe3+(Al10Me2+2)(Si2O7)4(SiO4)10 O(OH)9, where Me = Mg2+, Fe2+, Mn2+. Its crystal structure accommodates extensive isomorphous substitution. For instance, Ca2+ can be substituted by Na+, K+, Mn2+, and Ce3+; Mg2+ is often replaced by Fe2+, Zn2+, and Mn2+; and Al3+ can be substituted by Fe3+, Cr3+, and Ti4+. Some varieties may also contain Be2+ or Cu2+ [12,13,14,15]. This extensive elemental substitution at various crystallographic sites is the primary reason for vesuvianite’s wide spectrum of colors—ranging from colorless, yellow, green, and brown to blue and purple—and the significant variation in its physical properties, such as specific gravity and refractive index. Vesuvianite typically forms under medium- to high-temperature (300–600 °C) conditions in contact metasomatic settings, commonly found in calcareous skarns at the contact zones between granitoids/diorites and carbonate rocks (e.g., marble, limestone) [16,17,18]. Its associated minerals include grossular, diopside, epidote, and calcite [9,10,11,16,17,18]. During the late, or retrograde, stage of skarn evolution, vesuvianite is frequently altered to or replaced by chlorite and calcite. Its aluminum-rich varieties, such as those in the Qinjia deposit in Guangxi, are closely associated with copper-tin mineralization and can serve as a prospecting indicator [19].
Recently, a new variety of jade, characterized by hues of yellow and green (including light green, yellowish-green, and dark green), was discovered in the Hanzhong area of Shaanxi Province. Preliminary studies on this material identified it as vesuvianite jade based on X-ray powder diffraction (XRD) analysis, which indicated a composition of approximately 93% vesuvianite and less than 7% chlorite [20]. However, a systematic investigation into its mineralogical characteristics and the origin of its color has not yet been reported. Building upon previous work, this study employs modern analytical techniques to analyze the chemical composition, mineral constituents, and spectroscopic characteristics of the Hanzhong vesuvianite jade. Based on these findings, the origin of its color is discussed, thereby providing a scientific basis for its quality assessment and potential applications.

2. Materials and Methods

2.1. Samples

The vesuvianite jade samples studied herein were sourced from the Shimawan area of Liuba County, Hanzhong City, Shaanxi Province. Geologically, the jade occurs as stratiform or massive bodies within the contact zone between igneous and carbonate rocks. The surrounding host rock exhibits localized and pronounced chloritization and serpentinization [21]. Six vesuvianite jade samples (LB01–LB06) used in this study were obtained from specimens collected by the Hanzhong Natural Resources Bureau from the mining area. These samples were supplied to our laboratory in two distinct batches, and therefore, the exact collection coordinates for individual samples within the Shimawan area cannot be specified.
The samples are dense and massive, ranging from translucent to transparent, with a vitreous luster. The color distribution is uneven, predominantly in shades of light green, yellow–green, and green. All samples exhibit white areas, with some showing patches of vivid green and dark brown (Figure 1).

2.2. Methods

Standard gemological tests were performed at the Gemstone Identification Laboratory of the Gemology Experimental Teaching Center, China University of Geosciences, Beijing (CUGB). The refractive indices (RIs) of the samples were measured using a handheld refractometer (Baoguang GI-RZ5, Nanjing, China) via the spot reading method. Their fluorescence characteristics were observed under a UV lamp. The relative density was determined using a high-precision electronic balance (Yitenuo ET-320S, Beijing, China). Each measurement was repeated three times, and the average value was used for subsequent analysis.
Microscopic examination was conducted at the Structure and Morphology Observation Laboratory of the Gemology Experimental Teaching Center (CUGB). Microscopic features were observed and documented using a gemological photomicroscope (Baoguang GI-MP22, Nanjing, China). The mineral composition and microstructure were examined using a polarizing microscope (Olympus BX51, Tokyo, Japan).
Spectroscopic analyses were performed at the Molecular Spectroscopy Laboratory of the Gemology Experimental Teaching Center. Fourier-transform infrared (FTIR) absorption spectra were collected using a Bruker Tensor 27 spectrometer (Ettlingen, Germany). For this analysis, four representative samples from the initial study cohort, which were designated for all destructive testing, were ground to a fine powder (~200 mesh), mixed with spectroscopic-grade KBr at a weight ratio of approximately 1:100, and then pressed into transparent pellets. The analysis was performed with 32 scans at a resolution of 4 cm−1 over the range of 4000–400 cm−1. Micro-FTIR spectra were acquired in reflection mode using a Bruker LUMOS microscope (Ettlingen, Germany), with a 50 µm × 50 µm aperture defining the measurement area. The spectra were recorded with 64 scans at a resolution of 4 cm−1 in the 4000–600 cm−1 range.
Micro-Raman spectra were obtained using a Horiba LabRAM HR Evolution laser Raman spectrometer (Villeneuve d’Ascq, France). Prior to analysis, the spectrometer was calibrated using the 520.7 cm−1 peak of a single-crystal silicon wafer. The system was equipped with a 532 nm laser source (50 mW power), focused to a spot size of approximately 1 µm (spatial resolution). A 600 g/mm grating was used, providing a spectral resolution of about 1.5 cm−1, in combination with a 100 μm confocal aperture. Spectra were collected in the 100–1200 cm−1 range with an acquisition time of 5 s and 2 accumulations.
UV-visible (UV-Vis) absorption spectra were recorded using a Biaoqi GEM-3000 spectrophotometer (Guangzhou, China) in reflection mode. The acquisition parameters were an integration time of 180 ms, 10 averages, a smoothing width of 2, and a spectral range of 300–800 nm. The raw reflectance (R) data were subsequently converted to absorbance (A) units for analysis using the instrument’s software, which applies the relationship A ≈ log (1/R), a common approximation of the Kubelka–Munk function for opaque materials.
Semi-quantitative chemical analysis was performed at the Composition Analysis Laboratory of the Gemology Experimental Teaching Center using a Shimadzu EDX-7000 energy-dispersive X-ray fluorescence (EDXRF) spectrometer (Kyoto, Japan). Prior to analysis, one surface of each bulk sample was ground and polished to create a flat plane. For the measurement, the sample was mounted by placing its polished surface directly over the instrument’s analysis aperture. A specific target area on the sample was then selected using a built-in camera linked to the operating software. The analysis was conducted under vacuum. The instrument was equipped with a Rh target and operated at a current of 1000 μA with a 1 mm collimator. To optimize performance across the full elemental spectrum, a tailored three-condition analysis was employed, consisting of a 50 kV setting for heavy elements (Ti–U), a 15 kV setting for light elements (Al–Sc), and a dedicated 15 kV setting that utilized primary filter #2 for very light elements (S–Ca). Quantification of the elemental composition was performed using the Fundamental Parameter (FP) method, a theoretical approach inherent to the SHIMAZU EDX-7000 software (PCEDX-Navi Version 2.03). This method calculates elemental concentrations from first principles by modeling the entire X-ray fluorescence process. It utilizes a database of fundamental atomic parameters (such as fluorescence yields, mass absorption coefficients, and jump ratios) and known instrumental parameters (e.g., X-ray tube spectrum, incident/takeoff angles, and detector efficiency). A key advantage of the FP method is its ability to mathematically correct for complex inter-element matrix effects, including absorption and secondary fluorescence, without the need for matrix-matched standards. This makes it particularly suitable for the semi-quantitative analysis of geologically complex materials like ours. For elements detectable under multiple analysis conditions, the software automatically selected the optimal data for quantification.
X-ray powder diffraction (XRD) and scanning electron microscopy (SEM) analyses were conducted at the Experimental Center of the Institute of Geosciences, CUGB. For XRD analysis, approximately 400 mg of each sample was ground to a powder with a grain size of less than 300 mesh (approx. 50 μm) and mounted as a pressed pellet on a flat sample holder. The analysis was performed on a Rigaku Smart-Lab 9KW diffractometer (Tokyo, Japan). The analysis employed Cu Kα (λ = 1.5406 Å) radiation generated at 40 kV and 200 mA, with a graphite monochromator. Data were collected in reflection mode over a 2θ range of 3° to 70° via continuous scanning at a rate of 10°/min at room temperature (27 °C) and 28% relative humidity. XRD analysis was performed on four representative samples (Sample LB01–LB04) from the initial batch to confirm their primary mineral phase. Subsequent samples (Sample LB05–LB06), which were acquired later, were not subjected to XRD as non-destructive tests (e.g., FTIR and Raman) had already confirmed their mineralogical similarity to the initial batch.
For SEM analysis, fresh fracture surfaces of the samples were selected, gold-coated, and examined using a ZEISS SUPRA 55 field emission scanning electron microscope (Oberkochen, Germany). Imaging was performed at an accelerating voltage of 20 kV, achieving a resolution of 3 nm, with magnifications ranging from 2000× to 22,500×.

3. Results and Discussion

3.1. Conventional Gemological Testing

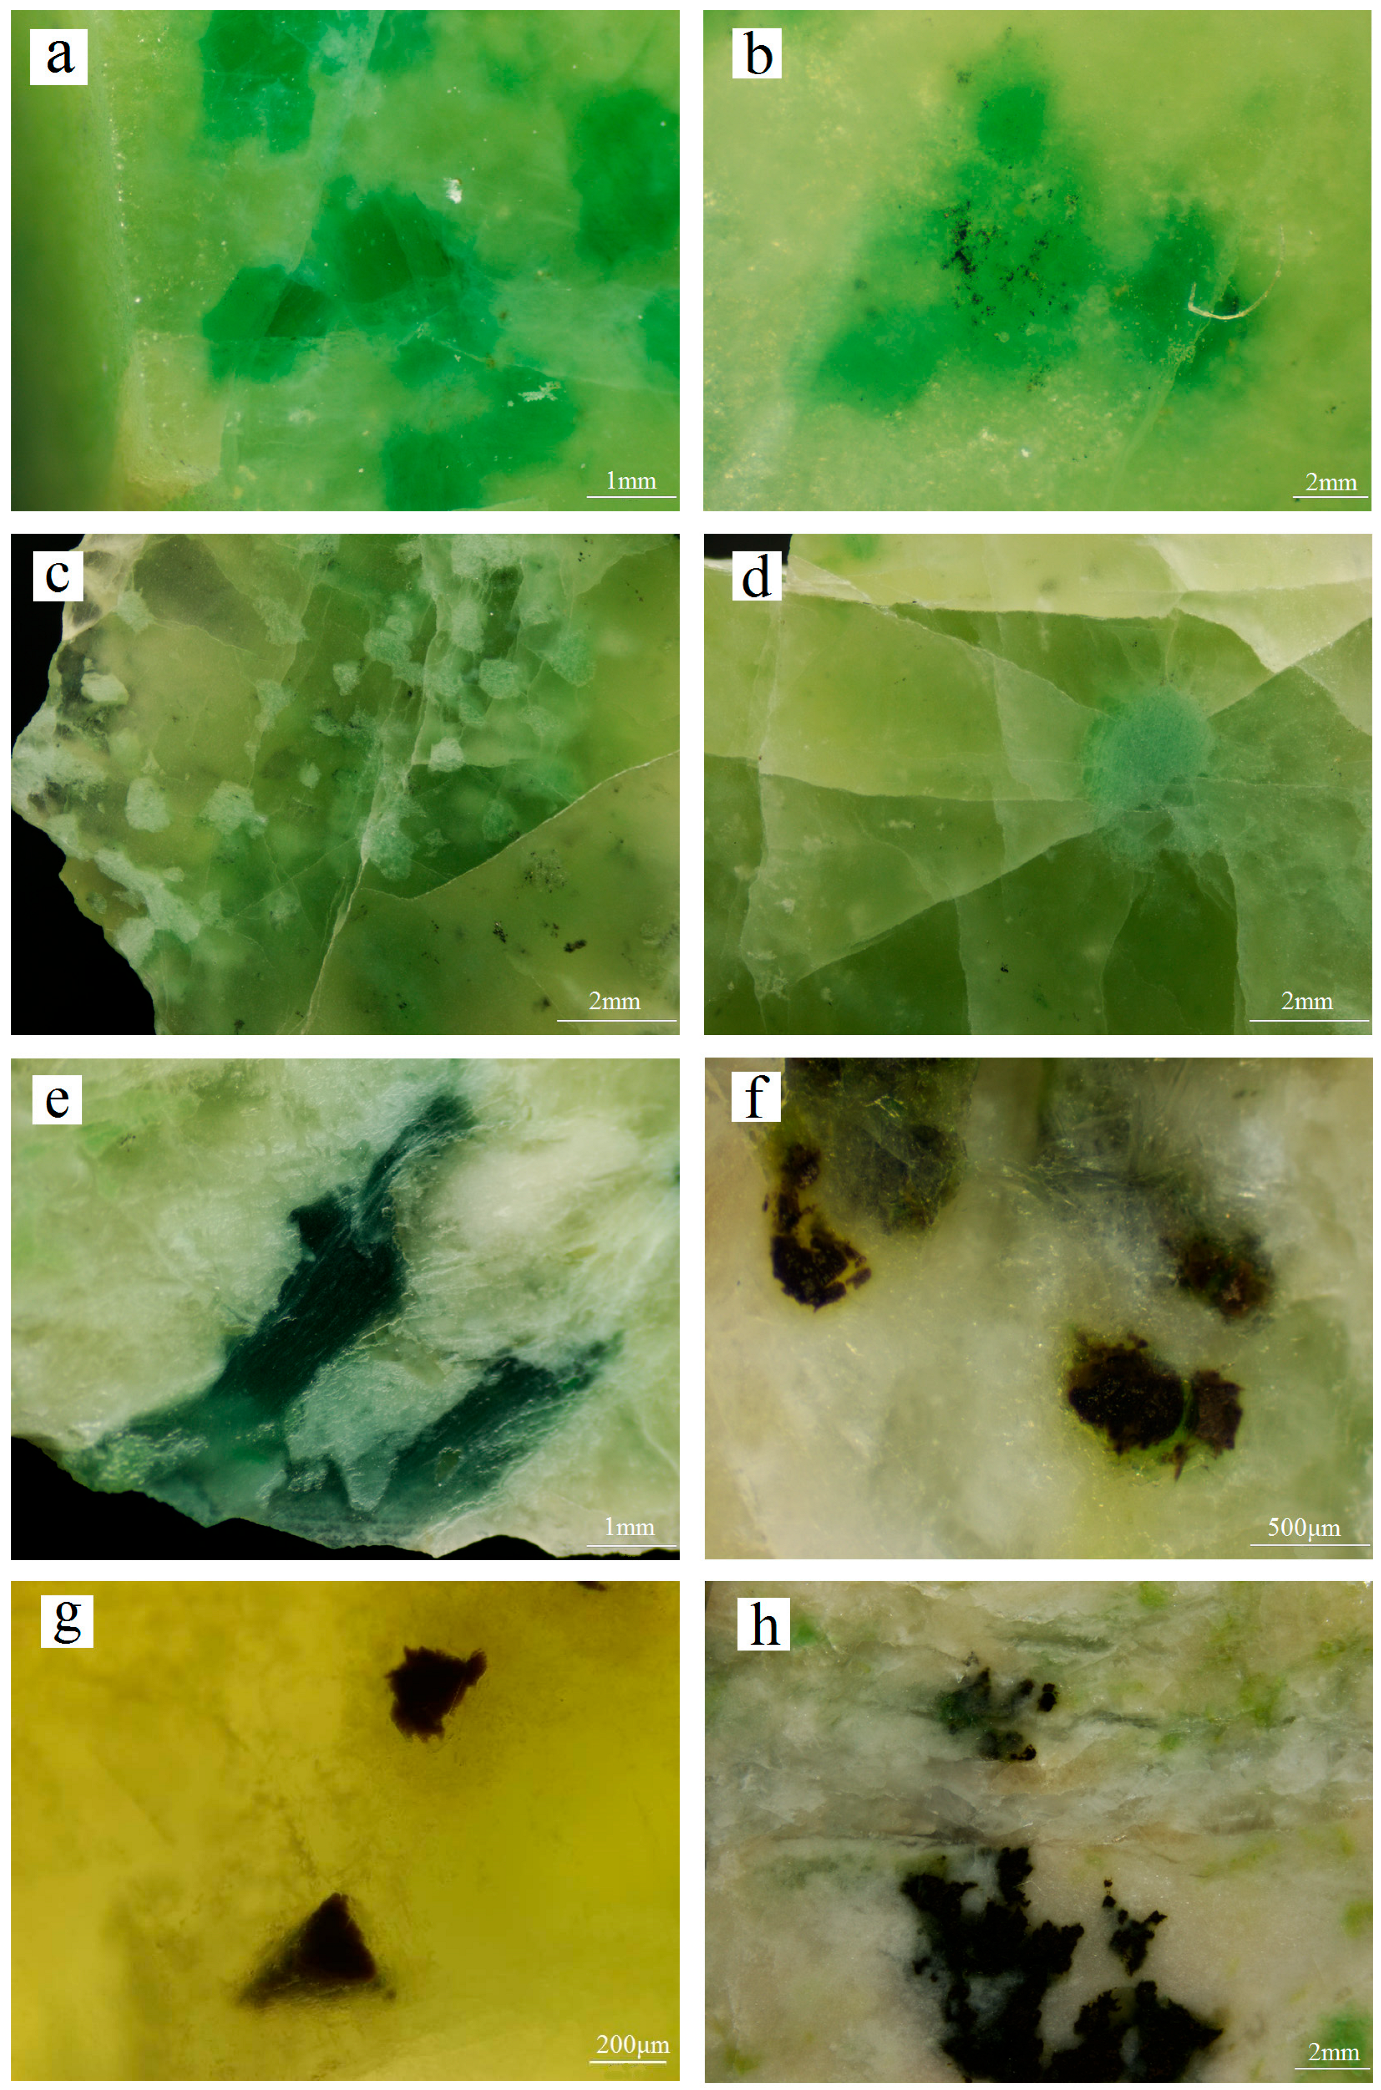
Under magnification, the samples exhibit a fine-grained texture and are predominantly yellowish-green and green in color. Samples LB01 and LB05 feature irregularly sized vivid green patches interwoven with the yellowish-green matrix (Figure 2a,b). Some of these vivid green patches contain black, punctate mineral inclusions. Most samples contain irregular, opaque, pale green patches (Figure 2c,d). Sample LB-06 additionally displays dark green bands (Figure 2e) and dark brown patches (Figure 2f,g), as well as intersecting white calcite veins (Figure 2h).
Other standard gemological tests revealed a refractive index (RI) of approximately 1.70–1.72 (spot reading) and a specific gravity (SG) ranging from 3.29 to 3.47. All samples exhibited no fluorescence under long-wave (365 nm) and short-wave (254 nm) ultraviolet radiation. Key gemological properties are summarized in Table 1.

3.2. Petrography and Microstructure

Petrographic and microstructural analyses reveal that the samples possess a predominantly granular mosaic texture and are mainly composed of vesuvianite (>90 vol.%), with accessory minerals including grossular garnet, clinochlore, diopside, epidote, tremolite, calcite, and opaque iron minerals.
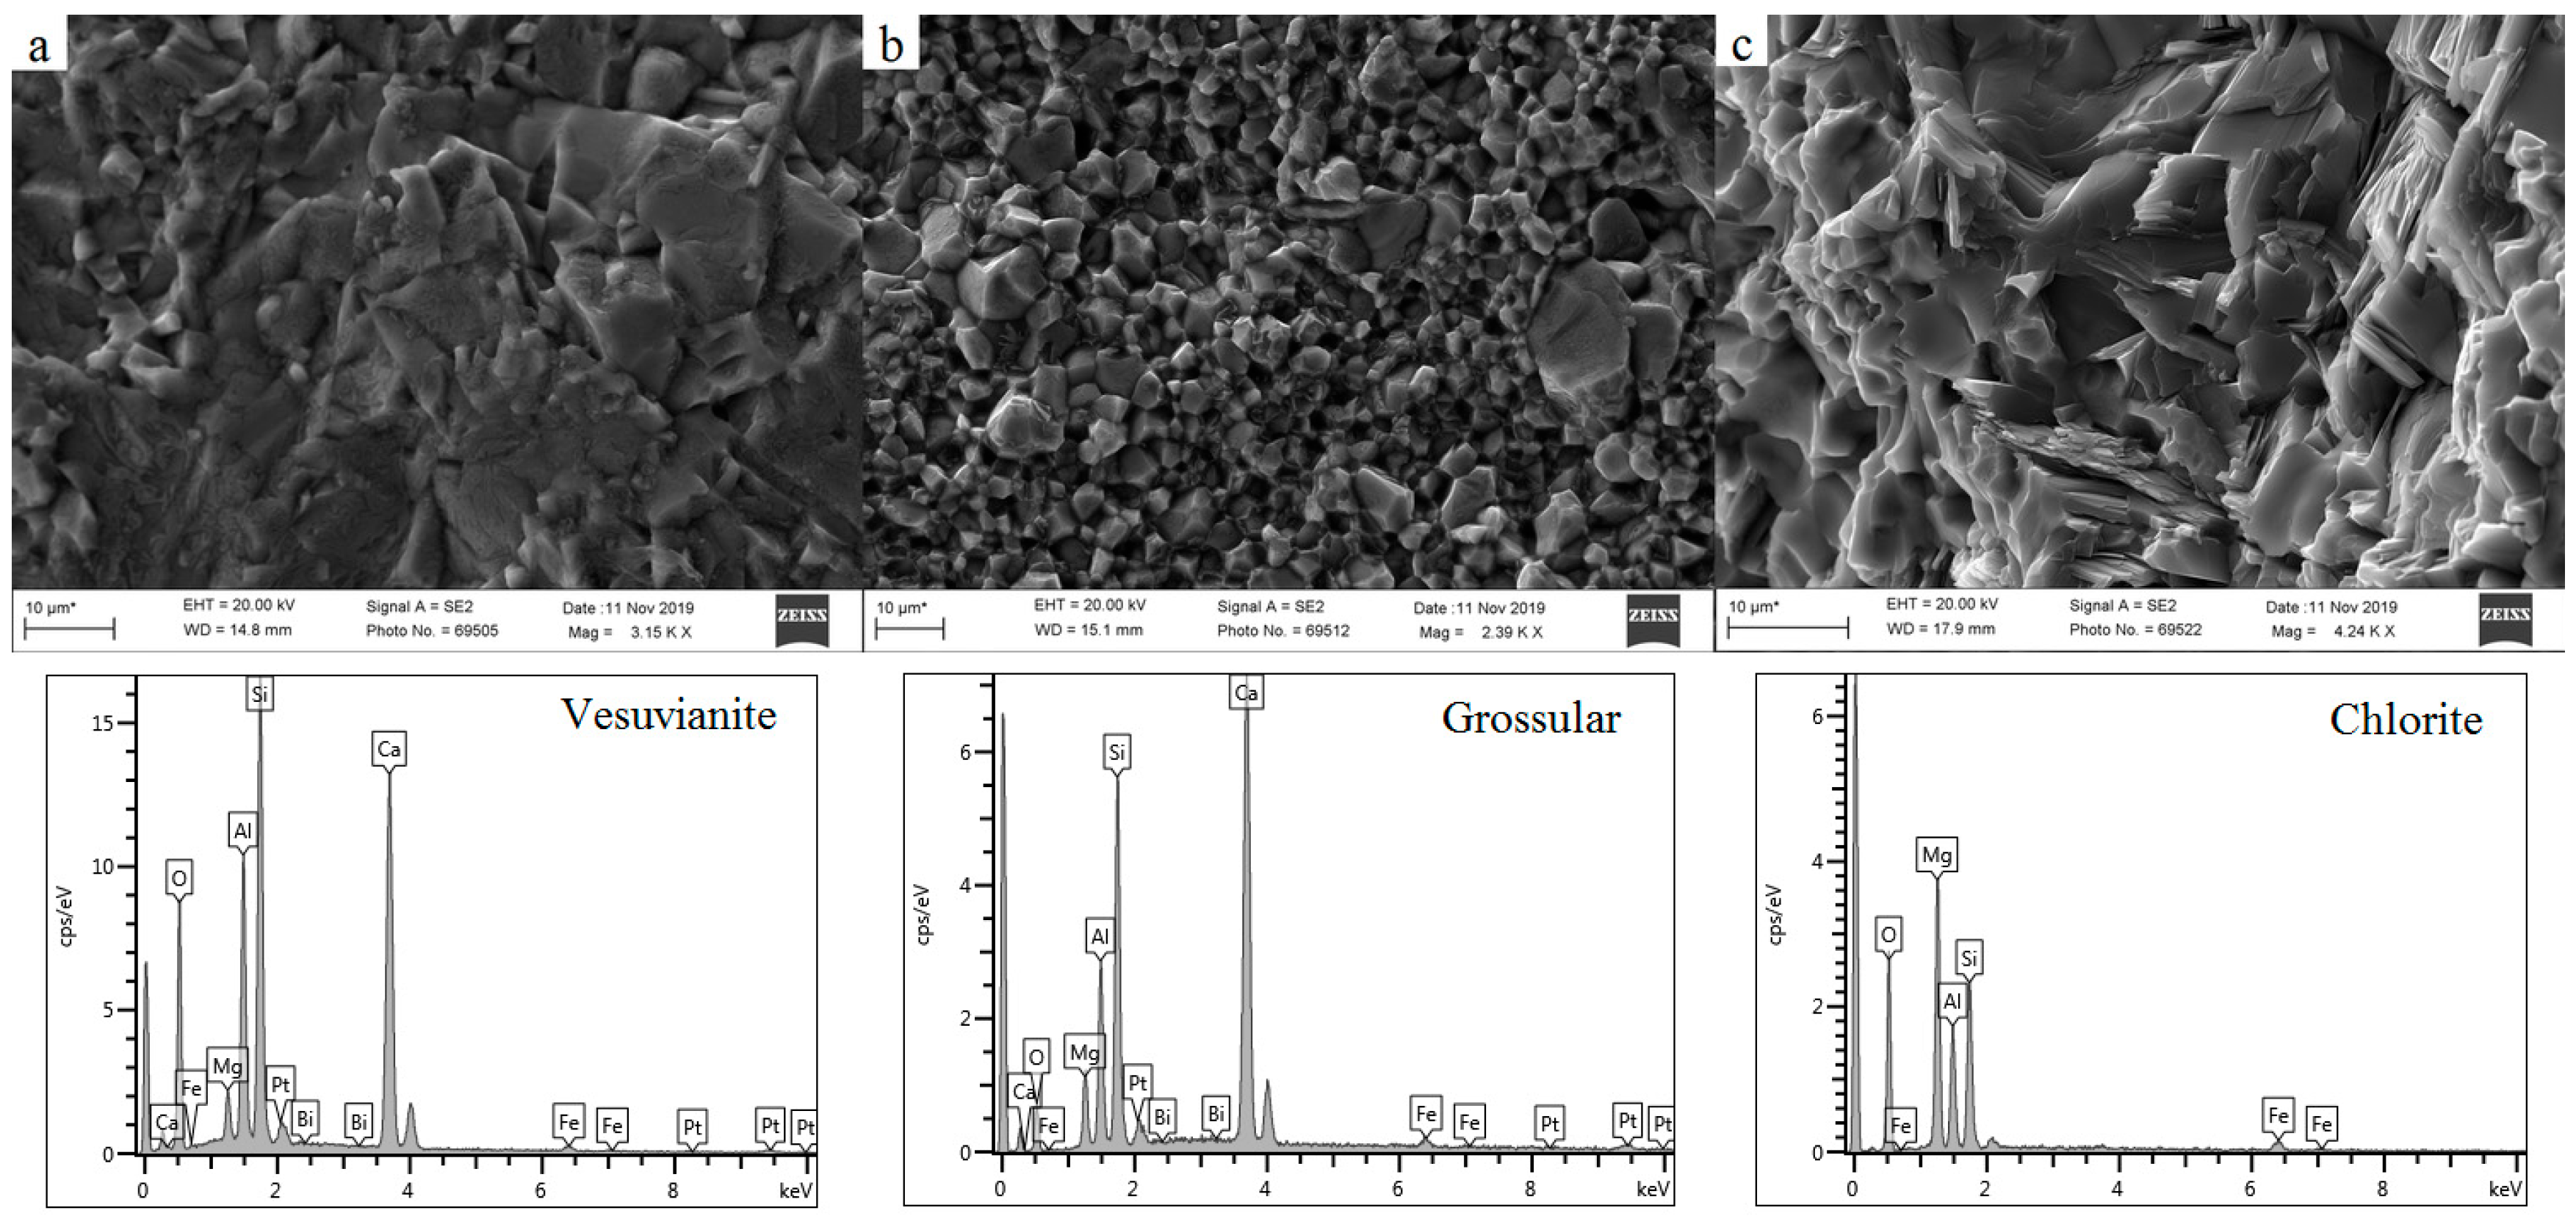
The main mineral, vesuvianite, exhibits complex multi-scale characteristics. In plane-polarized light (PPL), these crystals are typically colorless with moderate to high positive relief. Under crossed polars (XPL), they are characterized by distinctive anomalous interference colors, such as Prussian blue and brown, alongside low first-order gray birefringence. Optical microscopy indicates a wide grain size distribution for the overall vesuvianite crystals, ranging from approximately 5 μm to 100 μm (Figure 3a). However, higher-resolution imaging with scanning electron microscopy (SEM) clarifies that many of these larger optical grains are, in fact, aggregates composed of smaller, tightly intergrown subhedral sub-grains. The size of these constituent sub-grains predominantly ranges from 5 μm to 20 μm, and some display distinct tetragonal crystal habits (Figure 4a). This distinction between the overall aggregate size observed optically and the component sub-grain size resolved by SEM accounts for the different measurement ranges.
Among the accessory minerals, grossular garnet occurs as extremely fine, isotropic grains that are difficult to resolve optically (Figure 3a). SEM analysis reveals them to be granular, with some euhedral crystals showing a rhombic dodecahedral form and a relatively uniform grain size of approximately 5–10 μm (Figure 4b). A critical textural relationship is observed where larger, relict diopside grains (0.5–1 mm) are pervasively replaced by fine-grained vesuvianite, particularly along cleavage planes (Figure 3b), a process confirmed by in situ micro-Raman spectroscopy. Chlorite, which forms the pale green patches observed in hand specimens (Figure 3e), exhibits a characteristic lamellar or stacked texture under SEM, with slight bending and tearing at the flake edges (Figure 4c). Other accessory minerals include prismatic epidote crystals, often associated with clinochlore and showing high-order interference colors (Figure 3c); fibrous aggregates of tremolite (Figure 3d); irregular veins of calcite filling interstices (Figure 3f); and aggregates of fine-grained, anhedral opaque iron minerals (Figure 3g,h).
The chemical identity of all key mineral phases, including vesuvianite, grossular, and chlorite, was robustly confirmed by in situ Energy-Dispersive X-ray Spectroscopy (EDS) conducted during SEM analysis. Representative spectra for these minerals are presented in Figure 4.

3.3. X-Ray Powder Diffraction

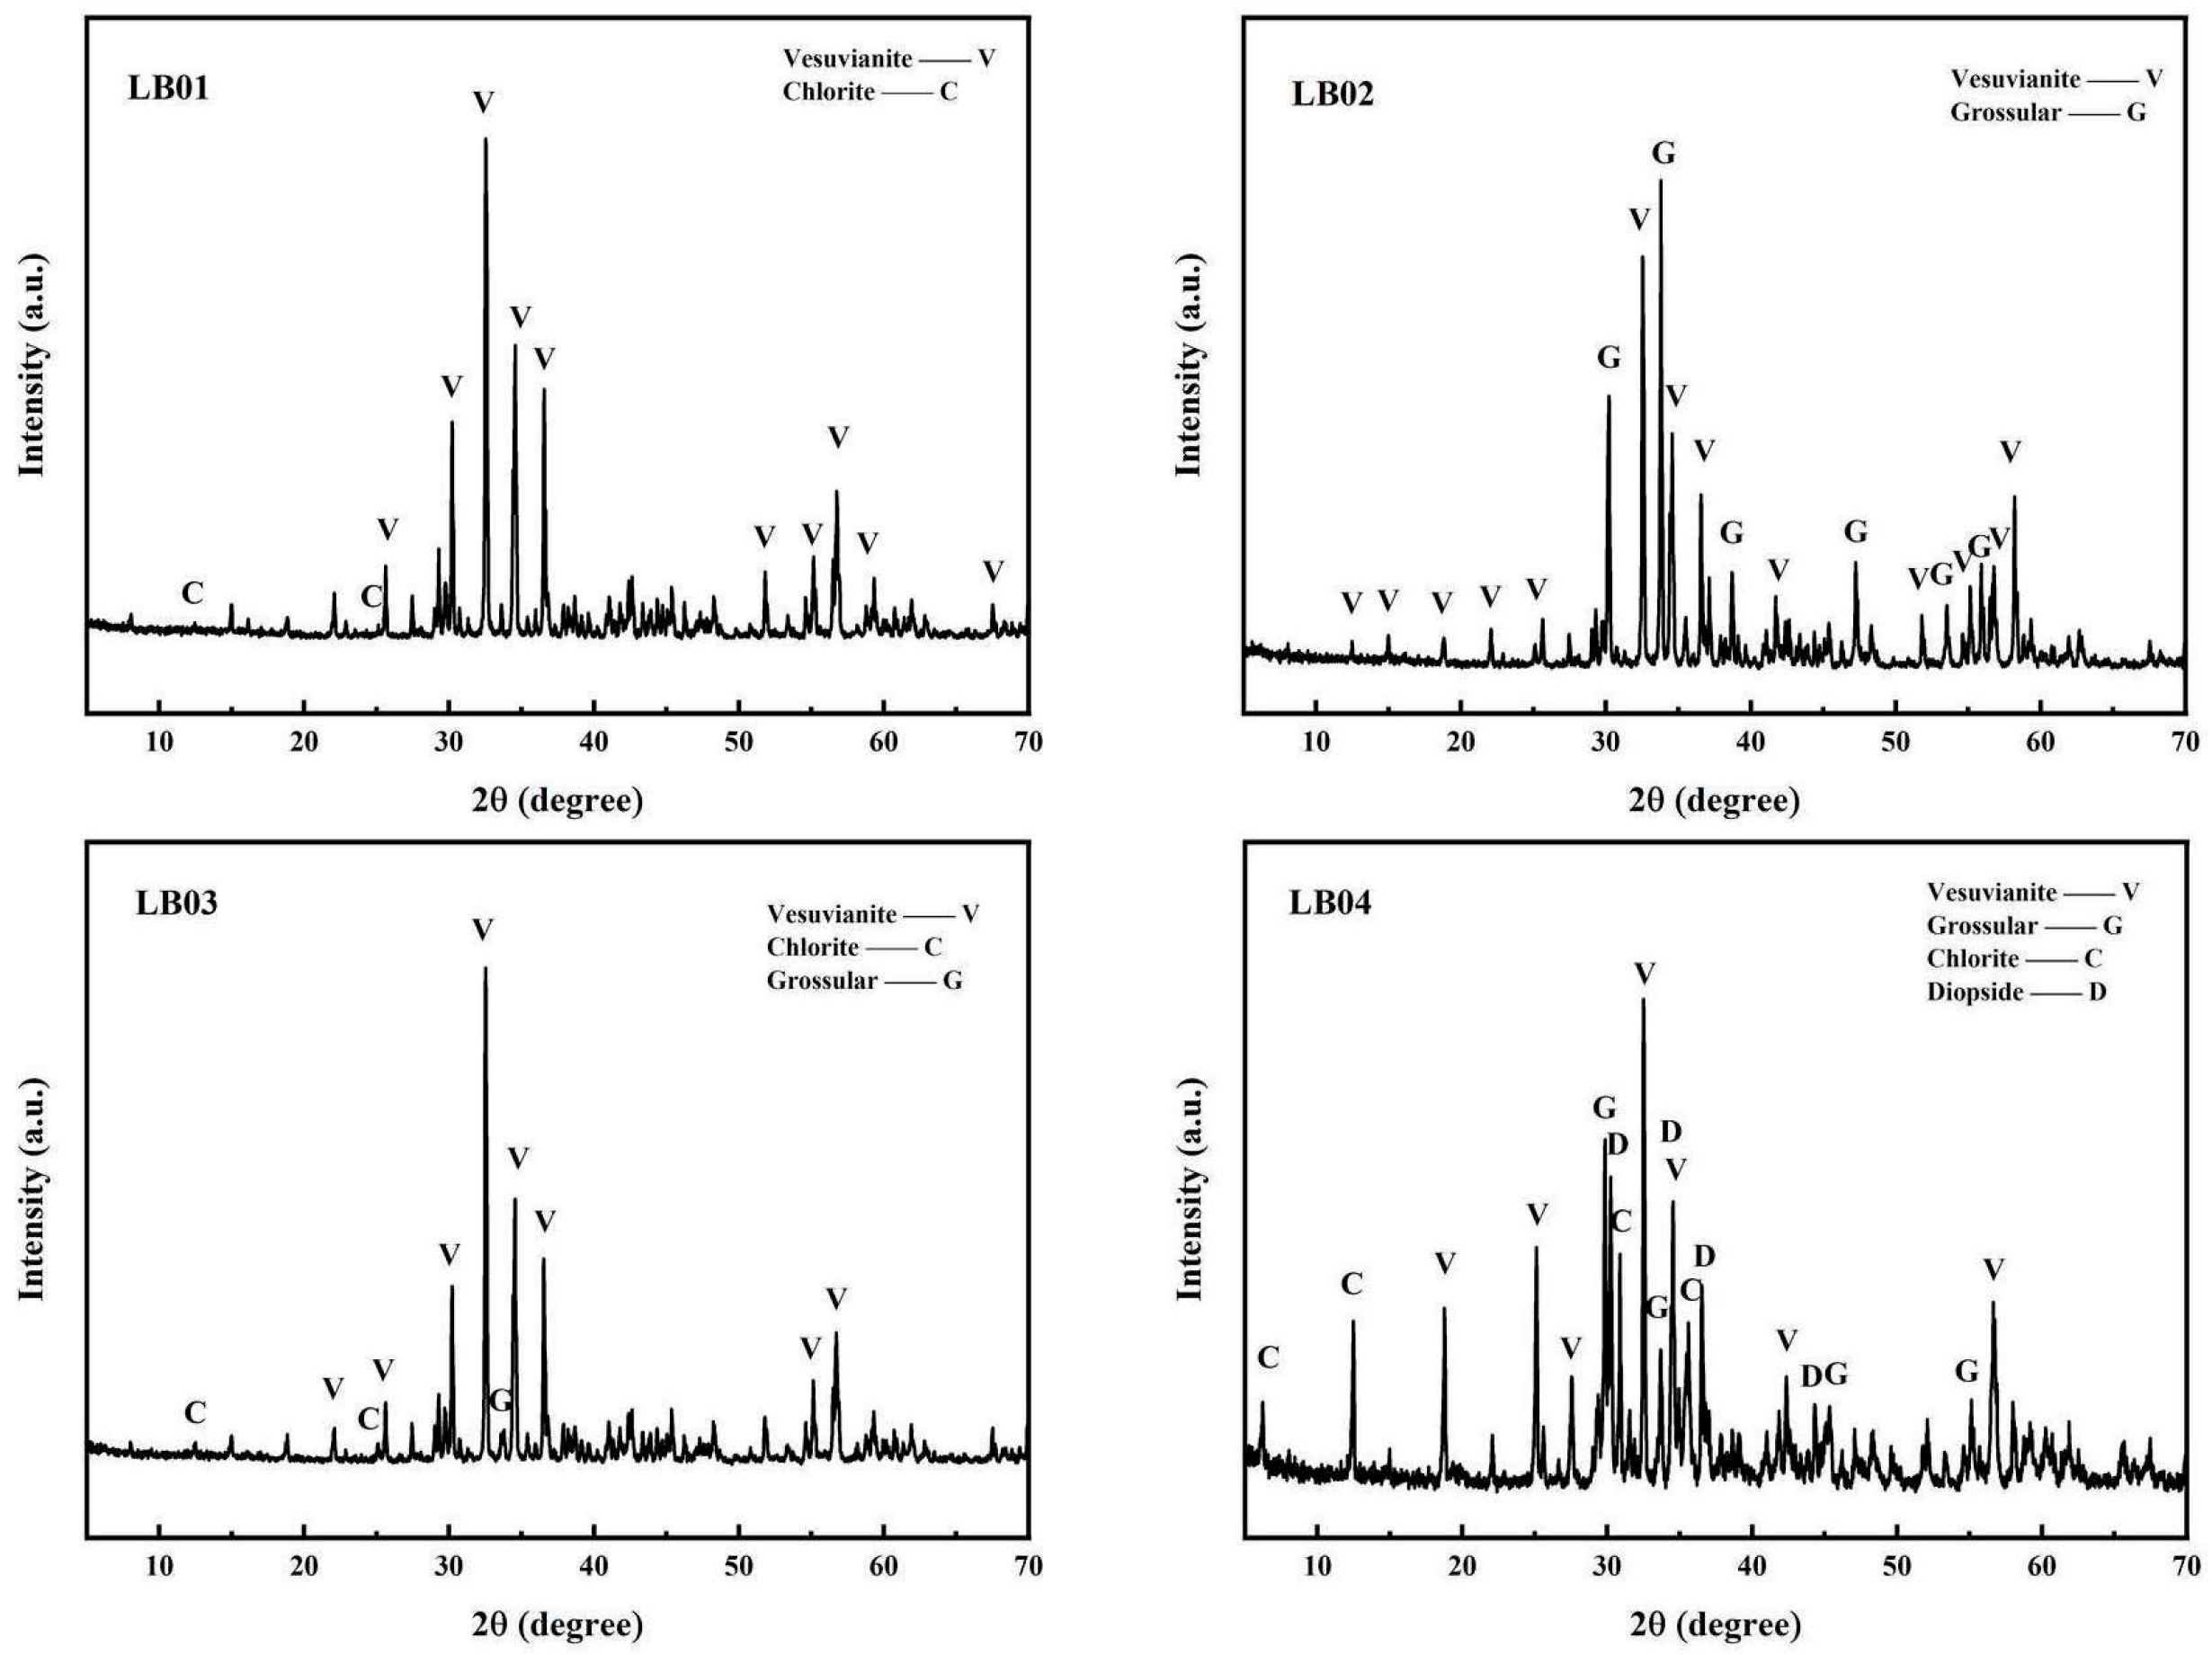
The resulting diffraction patterns were compared with the standard Powder Diffraction File (PDF) database from the ICDD (International Center for Diffraction Data). The XRD patterns are presented in Figure 5. The results indicate that although the four samples differ in color and appearance, the major diffraction peaks in their patterns—at d-spacings of 2.956 Å (2θ ≈ 30.2°), 2.751 Å (2θ ≈ 32.5°), 2.593 Å (2θ ≈ 34.6°), and 2.456 Å (2θ ≈ 36.6°)—are in good agreement with the standard pattern for vesuvianite (PDF#87-1119). This confirms that the primary mineral constituent of the samples is vesuvianite. Additionally, the samples contain minor amounts of other minerals. Characteristic peaks of grossular at 2.649 Å (2θ ≈ 33.8°), 2.418 Å (2θ ≈ 37.1°), and 2.325 Å (2θ ≈ 38.7°) (PDF#76-0871) were observed in samples LB-02, LB-03, and LB-04. Sample LB-04 also exhibited characteristic peaks of diopside at 2.992 Å (2θ ≈ 29.8°), 2.893 Å (2θ ≈ 30.9°), and 2.565 Å (2θ ≈ 34.9°) (PDF#99-0045). Furthermore, weak characteristic peaks for clinochlore at 7.087 Å (2θ ≈ 12.5°) and 3.545 Å (2θ ≈ 25.1°) (PDF#45-1321) were detected in all samples.

3.4. X-Ray Fluorescence Spectroscopy

X-ray fluorescence spectroscopy was performed on different colored matrix parts and green patches of the six vesuvianite jade samples, with results shown in Table 2. The matrix is primarily composed of SiO2, Al2O3, and CaO, with average contents of 37.59 wt.%, 19.95 wt.%, and 38.04 wt.%, respectively (SiO2: 37.01–38.54 wt%; Al2O3: 18.48–22.84 wt.%; CaO: 37.06–40.04 wt.%). Minor components include TFeO (total iron as FeO), ranging from 0.56 wt.% to 2.09 wt.% (avg. 1.29 wt.%), and MgO, ranging from 0.76 wt.% to 4.39 w.t% (avg. 2.80 wt.%). These results are largely consistent with the theoretical chemical composition of vesuvianite. A correlation was observed between the TFeO content and the intensity of the green hue; as the color transitions from yellowish-green to green, the TFeO content increases.
The emerald-green patches in three samples have a chemical composition similar to the vesuvianite matrix but contain small amounts of Cr2O3, ranging from 0.03% to 0.14%. Since Cr was not detected in the matrix of any sample, it is inferred that the vivid green coloration is attributable to the presence of chromium. The composition of the opaque, pale green patches prevalent in sample LB02 differs significantly from that of the matrix, characterized by a marked increase in MgO content and a sharp decrease in CaO content, which is likely due to a higher abundance of chlorite.
In sample LB06, the dark green bands have an MgO content as high as 35.04 wt.%, and the proportions of other oxides are consistent with the compositional range of chlorite, suggesting they are composed of relatively pure chlorite. The dark brown patches contain Cr2O3 at 16.67% and MgO at 14.11%, observed under microscopy as fine dark brown opaque minerals dispersed in the matrix with small metallic reflective points, likely composed of fine-grained chromite and chlorite.

3.5. Infrared Spectroscopy

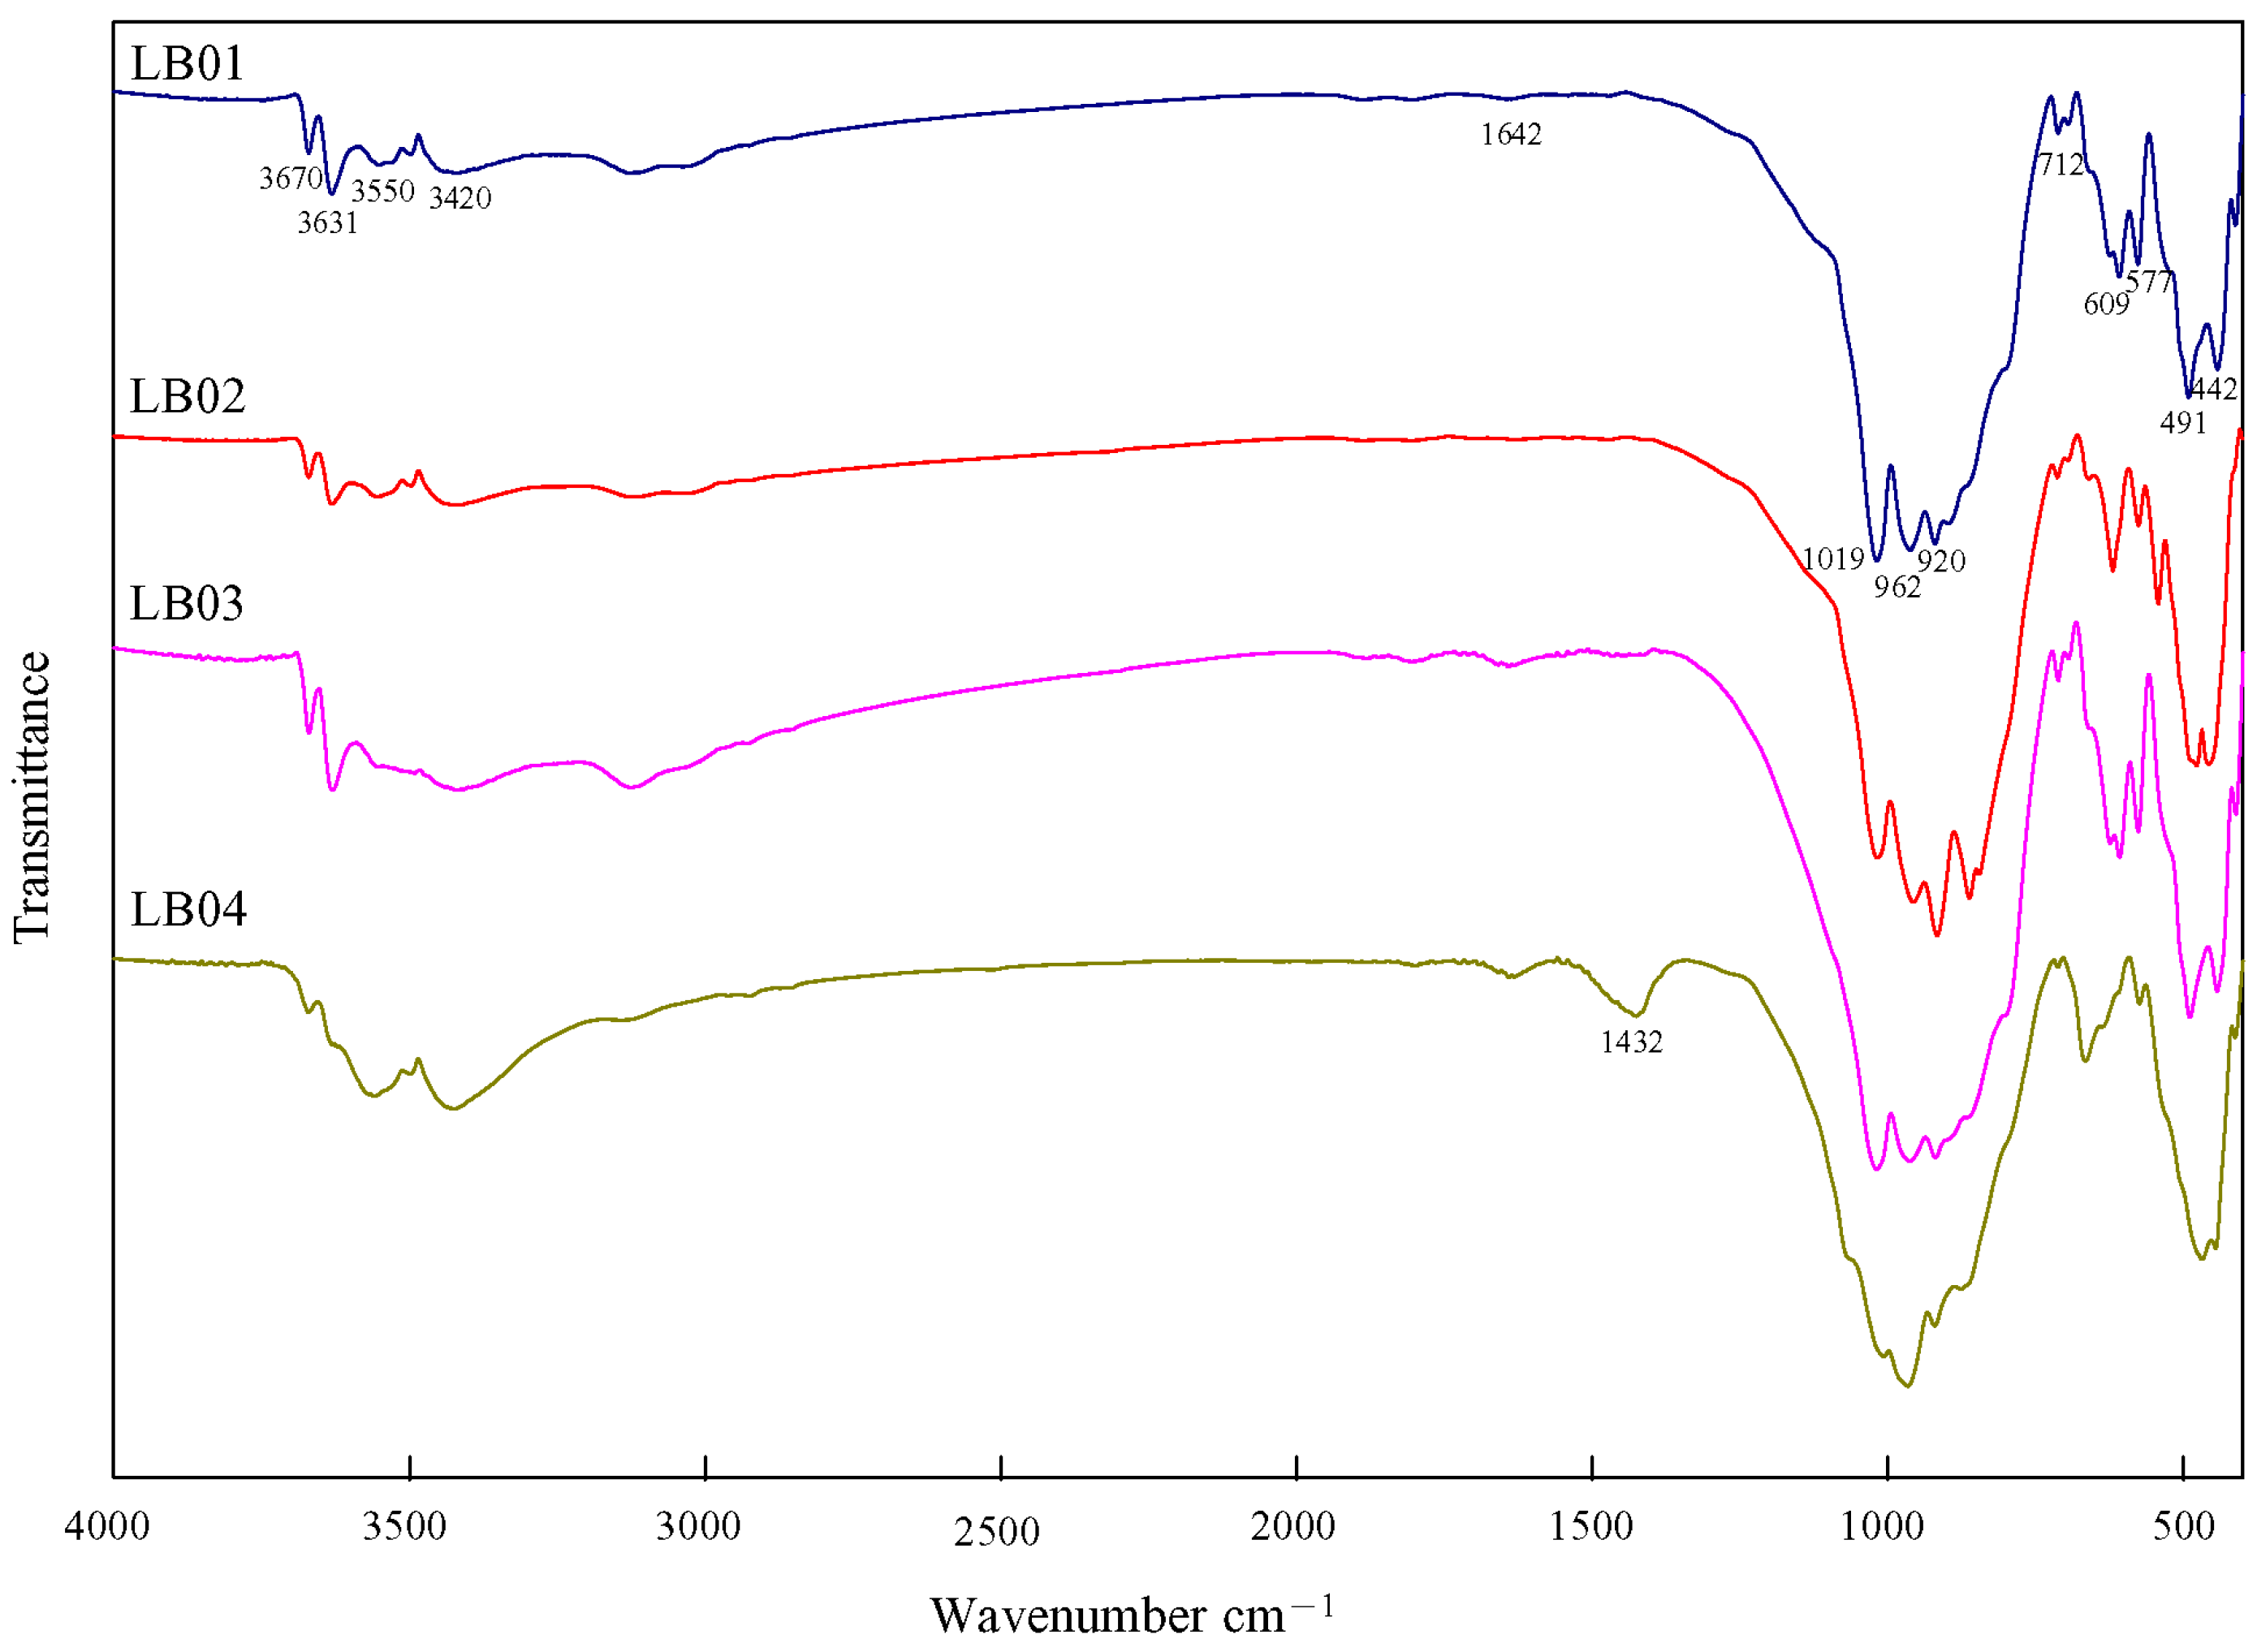
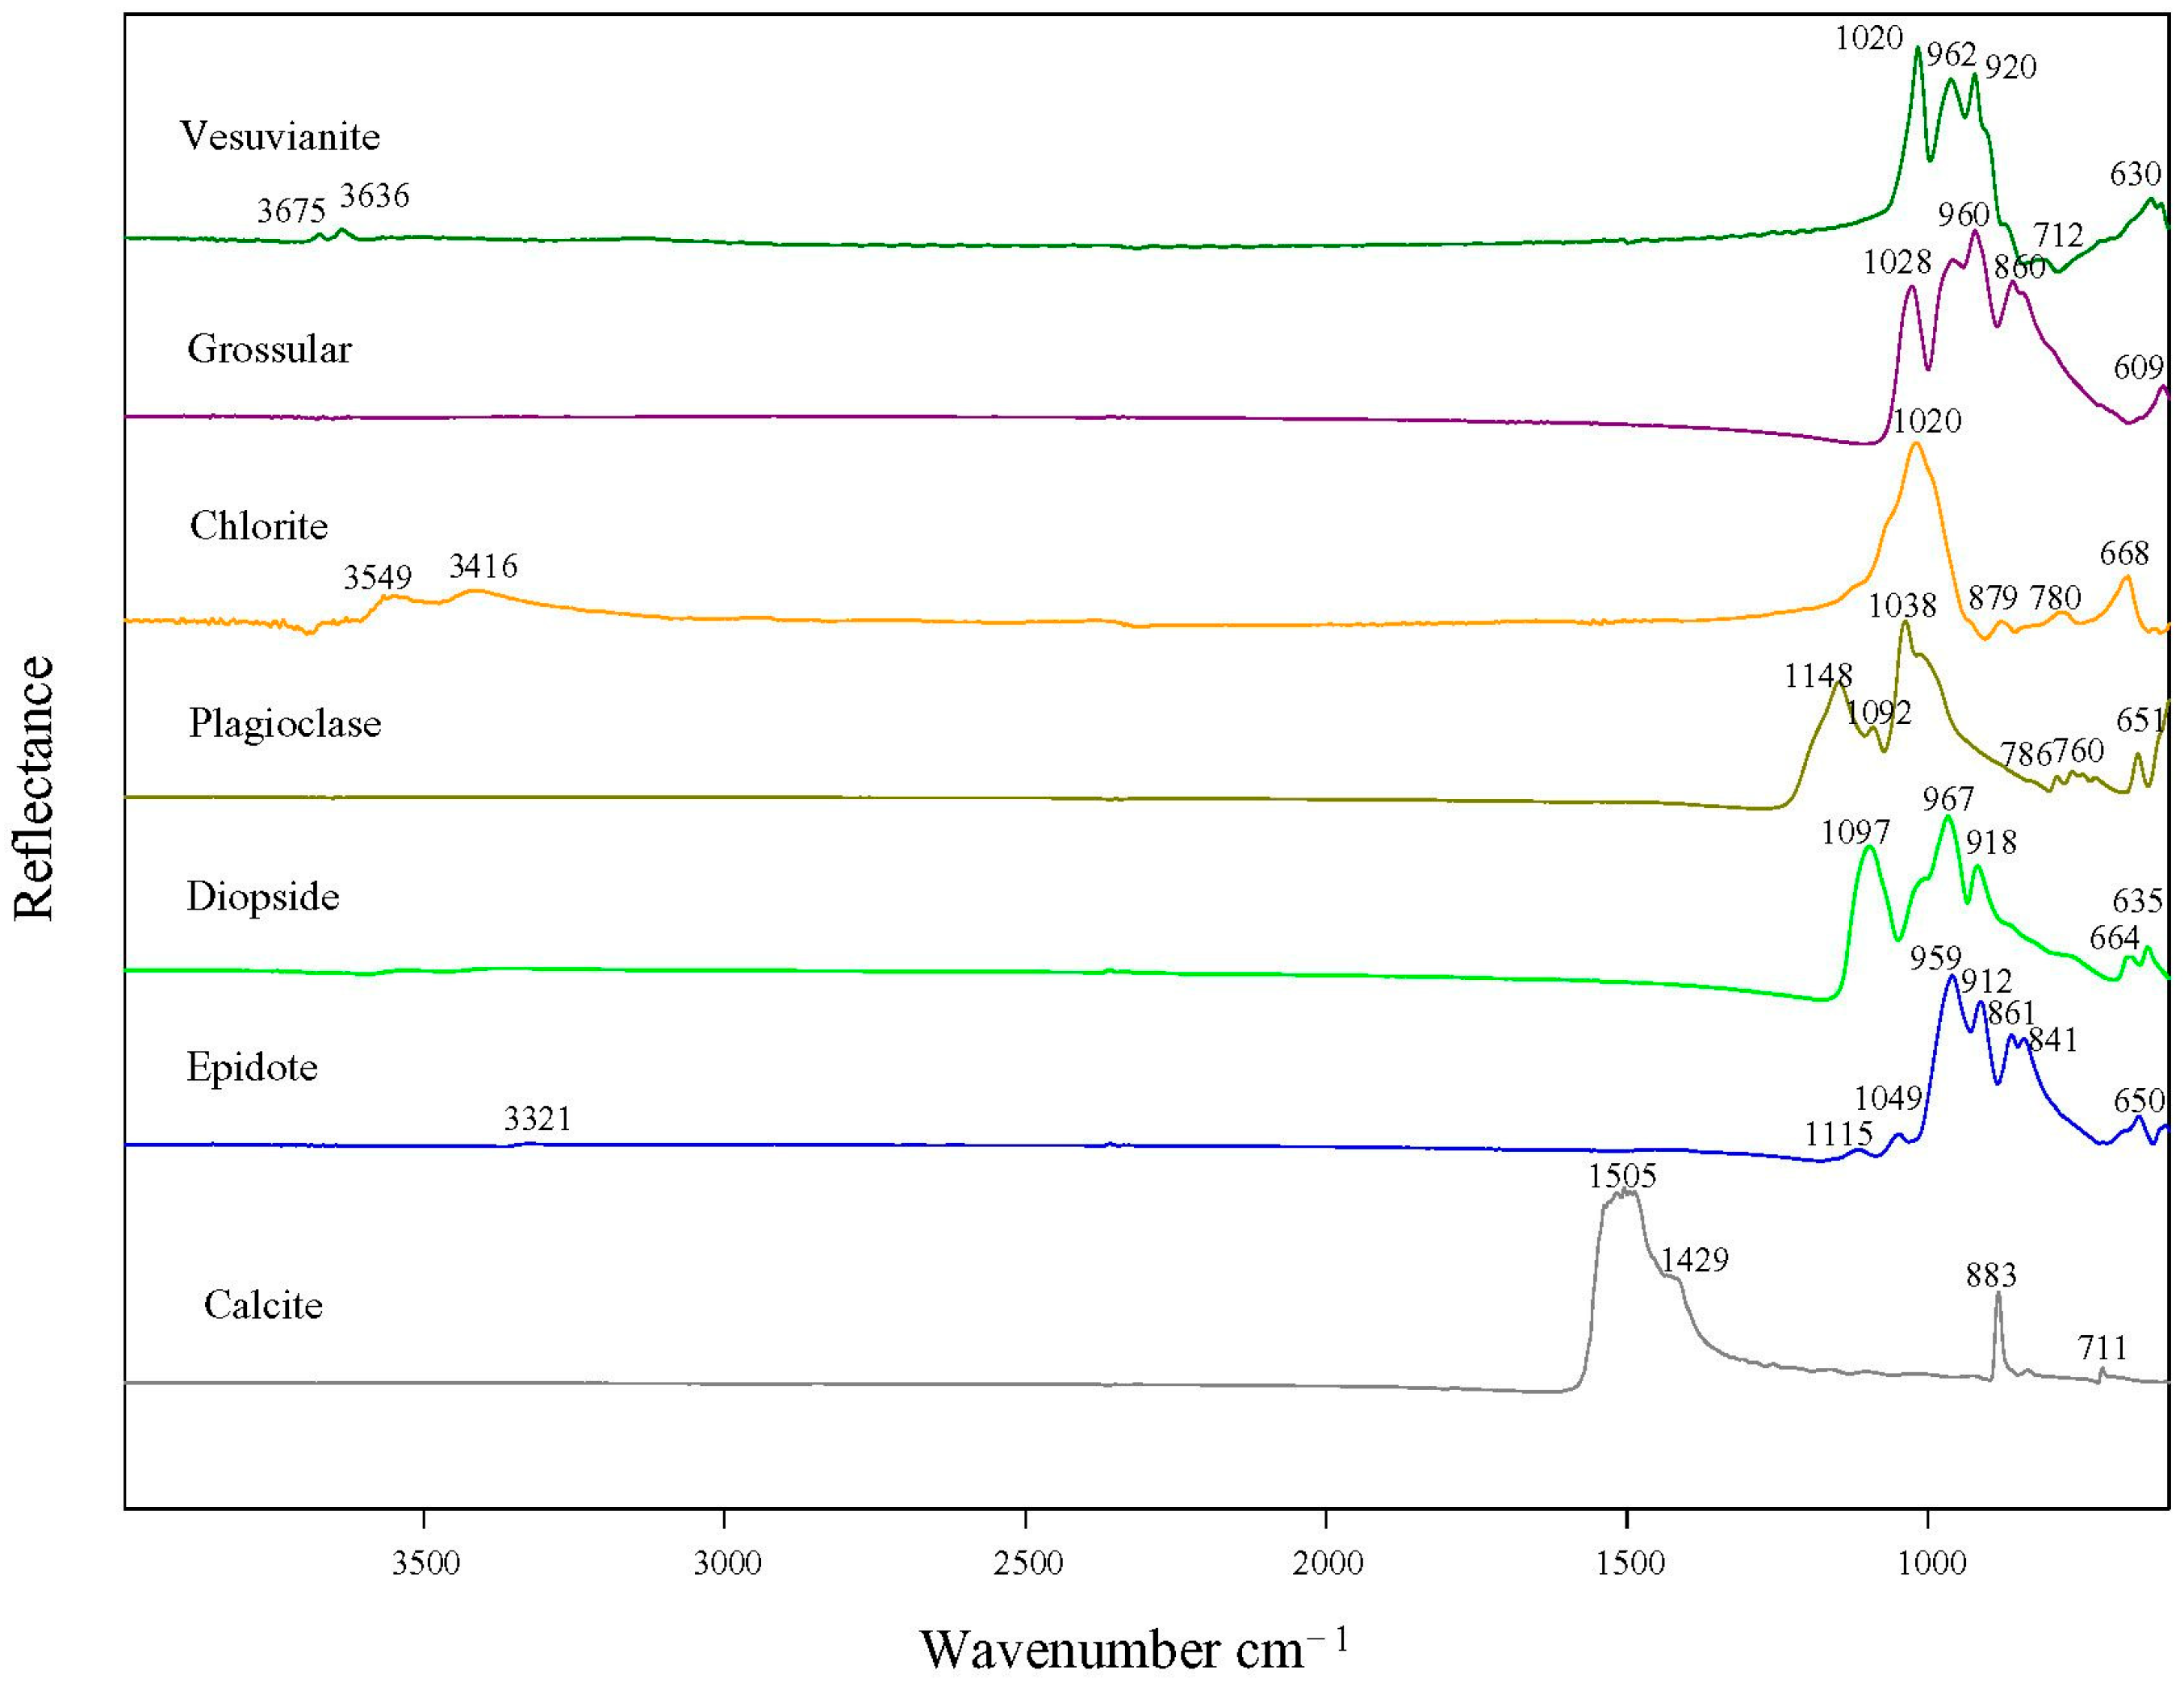
The resulting FTIR spectra are presented in Figure 6. The spectra of the four samples are largely similar, differing only slightly in peak intensity. To identify the primary mineral phase, the spectra were systematically compared with authoritative mineralogical databases. The observed absorption peaks—with prominent bands at approximately 3670, 3631, 1642, 1019, 962, 920, 712, 694, 609, 577, 491, 442, and 412 cm−1—show an excellent match with the reference spectrum for vesuvianite in the RRUFF database (RRUFF ID: R050056, R050035, R050233) [23]. This strong correlation provides a solid basis for the identification.
The assignment of these bands is also consistent with previous studies [24,25]. The bands at 1019, 962, and 920 cm−1 are assigned to the antisymmetric stretching vibrations of Si-O-Si bonds. The peaks at 712, 694, 609, and 577 cm−1 are attributed to symmetric Si-O-Si stretching, while absorptions at 491 and 442 cm−1 correspond to Si-O bending vibrations. In the high-frequency region, the sharp bands at 3670 and 3631 cm−1 are characteristic of O-H stretching vibrations in the vesuvianite structure, while the band near 1642 cm−1 is attributed to the O-H bending vibration of molecular water [25,26].
In addition to the primary vesuvianite signals, bands indicating mineral impurities were also identified. The bands observed at approximately 3550 cm−1 and 3420 cm−1 in all samples are attributed to chlorite impurities. The 3550 cm−1 band originates from Mg3-OH vibrations, which can be red-shifted by octahedral substitution (Fe2+/Al3+), while the broad 3420 cm−1 band reflects interlayer hydrogen-bonded water [27,28]. The significant intensity of the 3420 cm−1 band is consistent with the high hydrophilicity of clay minerals like chlorite [26,27,28]. Furthermore, an absorption band at 1432 cm−1, accompanied by bands near 870 cm−1 and 713 cm−1, detected in sample LB04, is indicative of minor calcite impurities [23].
Given that the samples are cryptocrystalline aggregates, diffuse reflectance (DRIFTS) and micro-FTIR spectroscopy were employed to precisely determine the composition of individual colored patches (Figure 7). The interpretation of these spectra was supported by a systematic comparison with reference data from the established mineralogical literature. This included detailed studies on vesuvianite and related gem minerals, which provided critical context for identifying the primary phases, as well as spectral libraries for other associated minerals [23,28,29,30,31,32]. A comprehensive analysis revealed that the vivid green patches are primarily composed of vesuvianite with minor amounts of grossular [29], while the pale green patches consist of vesuvianite along with characteristic peaks of chlorite and grossular [28,29]. The dark green bands predominantly exhibit the IR features of chlorite, confirming it as the main constituent in these areas, which is consistent with the XRF results. Although the dark brown patches were analyzed by micro-FTIR, the constituent particles were too fine and significantly smaller than the instrument’s aperture size (30–50 μm), consequently yielding a mixed spectrum resembling chlorite and grossular. In addition, other minerals such as diopside, epidote, and calcite were identified in various localized spots [30,31,32].

3.6. Raman Spectroscopy

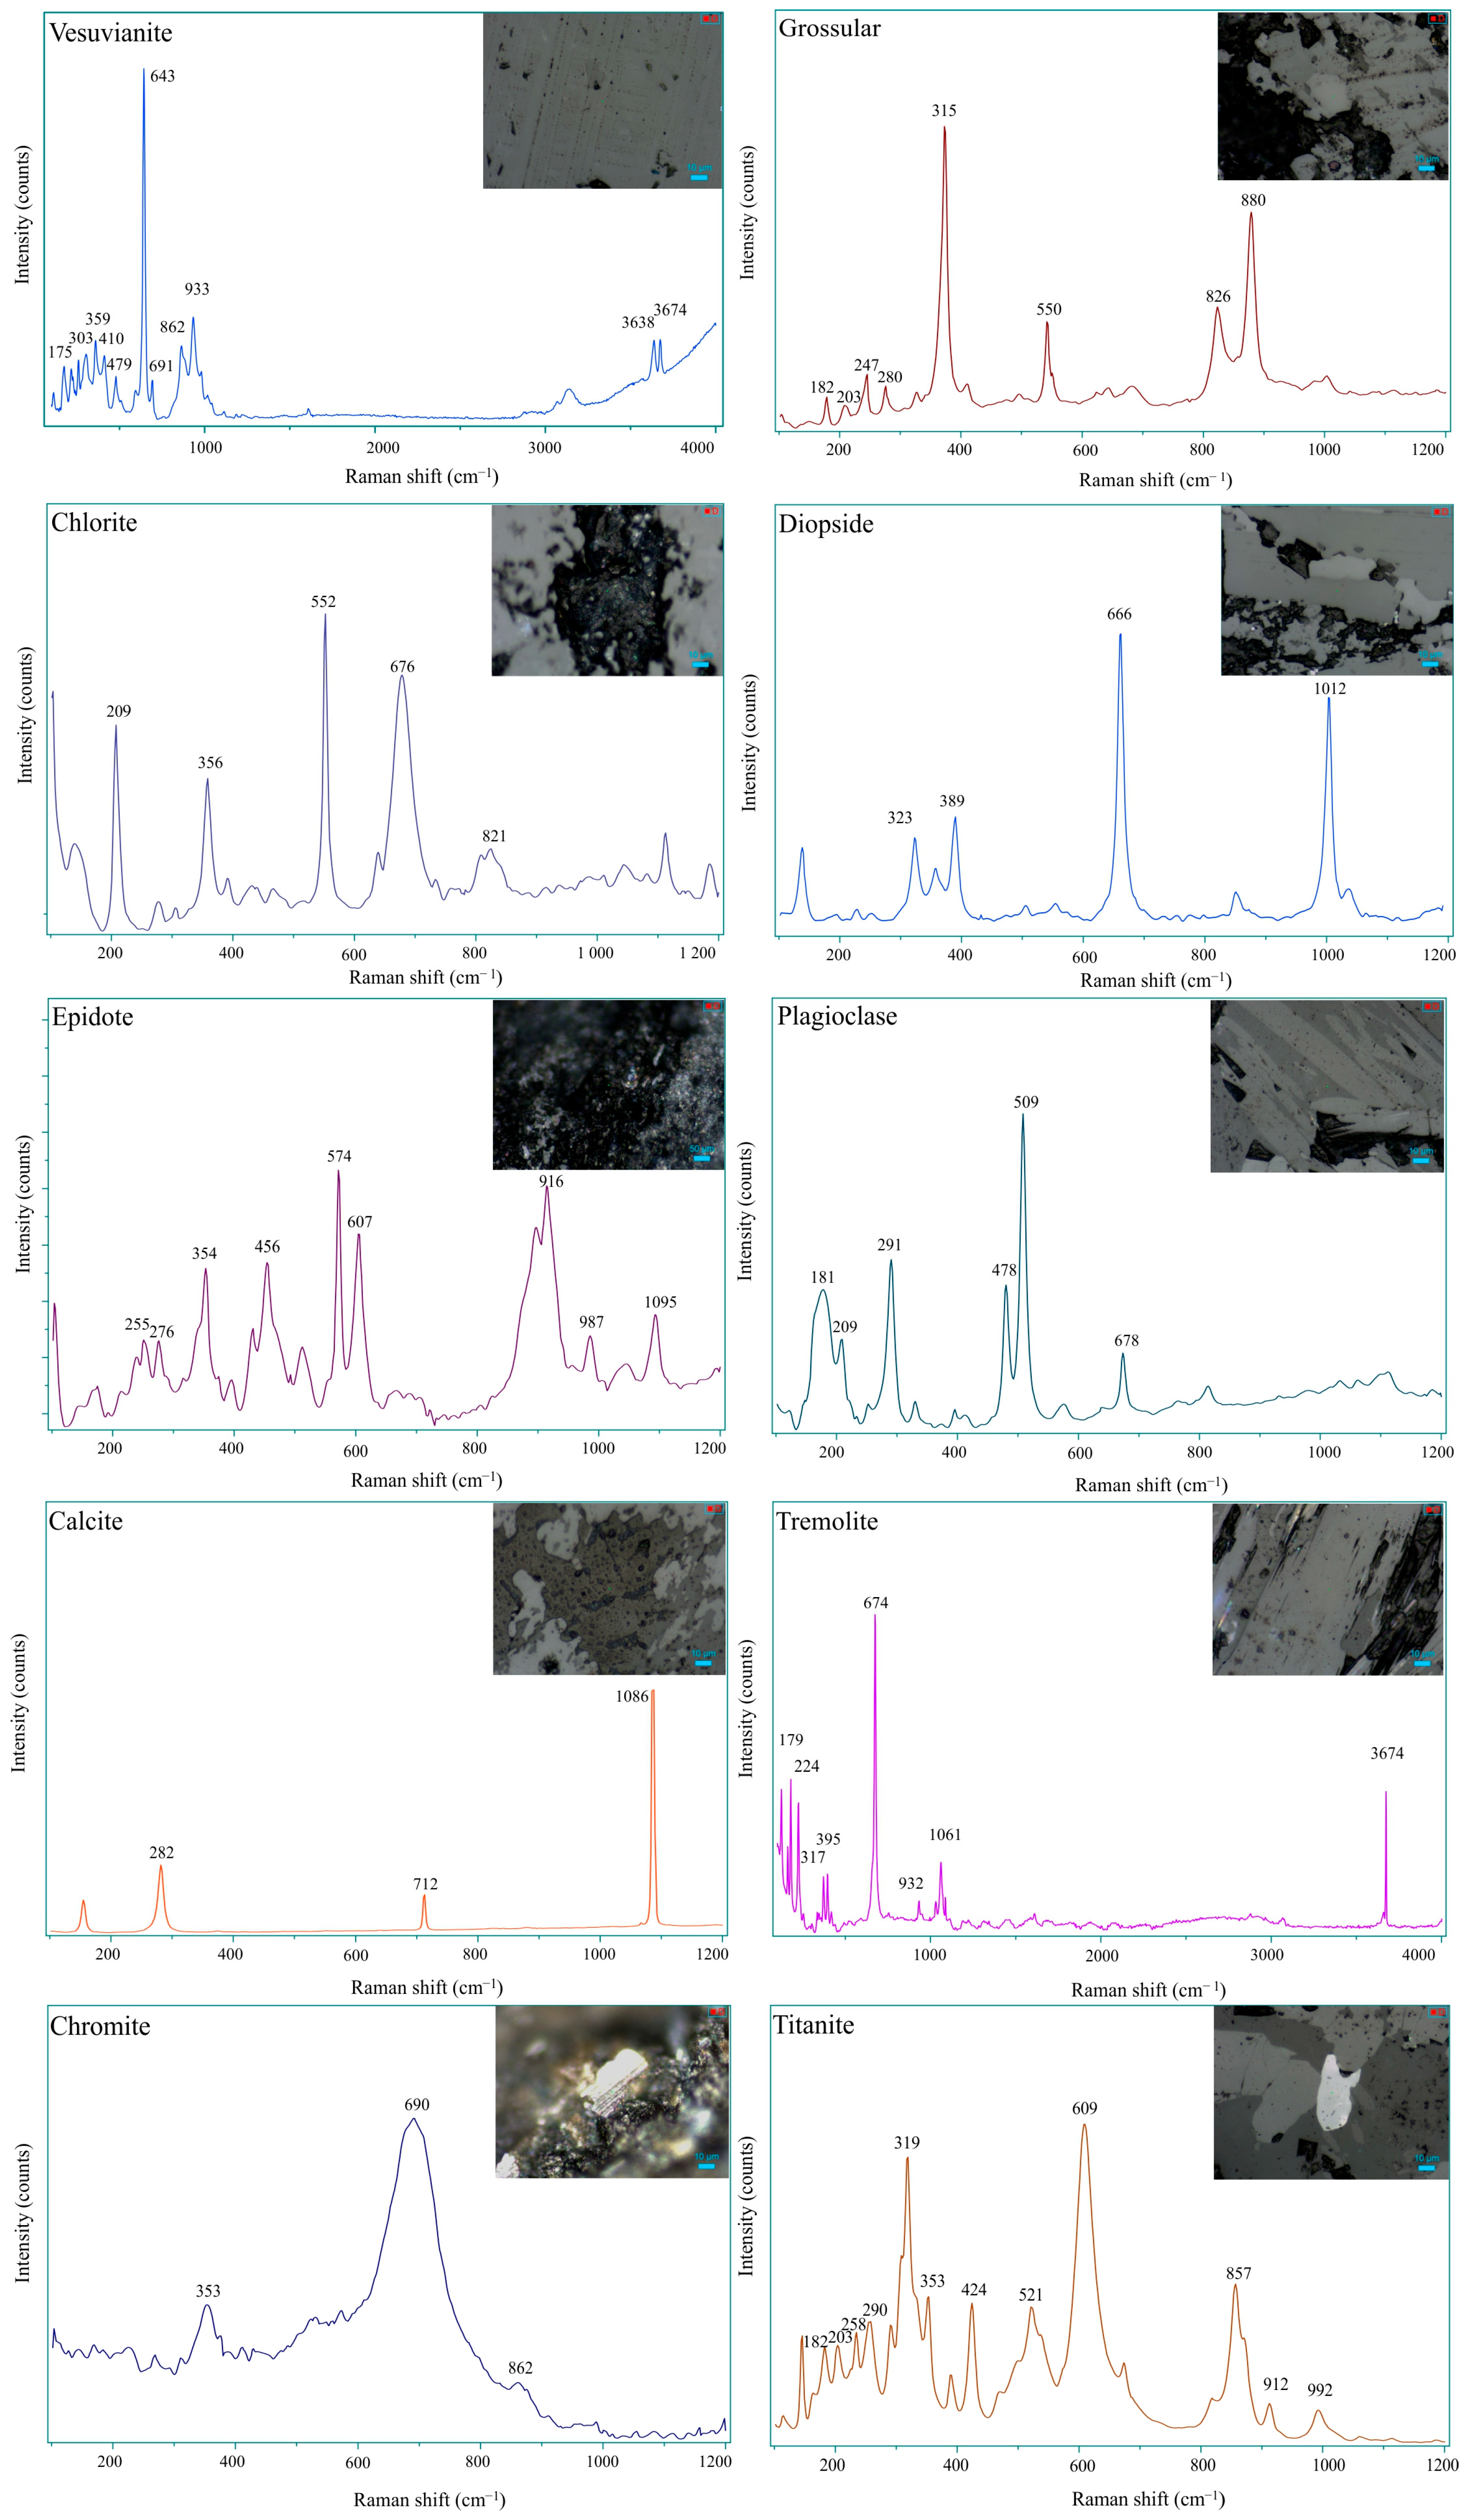
Micro-Raman (μ-Raman) spectroscopy, with its high spatial resolution (<10 μm), can effectively distinguish the fine-grained intergrown minerals within the vesuvianite jade. To ensure precise targeting and to facilitate understanding of the localized analyses, comprehensive Raman analyses were conducted on the matrix and colored patches of all six samples, with the resulting spectra presented in Figure 8. The matrix portion’s Raman spectra closely resemble the characteristic peaks of vesuvianite. The Raman spectrum of vesuvianite is dominated by vibrations of the silicate framework and metal–oxygen bonds, with characteristic fingerprint peaks concentrated in the 100–1200 cm−1 range [3,11,24,30]. Specifically, Raman shifts in the 800–1200 cm−1 region are due to Si-O stretching vibrations, while those in the 600–700 cm−1 region correspond to Si-O bending vibrations. The peaks near 373, 405, and 473 cm−1 are associated with translational vibrations of octahedrally coordinated metal ions (e.g., Al3+, Fe2+/Fe3+). Raman shifts related to O-H stretching vibrations are located in the 3600–3700 cm−1 region [3,24,30,33].
The primary mineral in the vivid green patches is vesuvianite, with minor amounts of grossular (characteristic Raman peaks at 376, 550, and 880 cm−1) [34,35]. Considering that grossular is present as a minor phase throughout the matrix, it is concluded that the vivid green color is caused by the incorporation of trace Cr3+ ions into the vesuvianite lattice, rather than by the presence of grossular. Chlorite (characteristic Raman peaks at 103, 207, 356, 550, and 678 cm−1) [36,37] is widely distributed as an accessory mineral. The pale green opaque patches are composed mainly of vesuvianite, chlorite, and grossular, while the dark green bands are also predominantly composed of chlorite.
In the dark brown patches, fine disseminated grains of chromite were identified. Its typical Raman spectrum is characterized by a strong peak at approximately 690 cm−1, which is dominated by the Cr-O symmetric stretching vibration [38]. The matrix surrounding the chromite inclusions in these dark brown areas exhibits Raman peaks corresponding to a mixture of uvarovite (calcium chromium garnet; characteristic peaks at 240, 350, and 862 cm−1) and chromite [39,40]. Chlorite is often observed at the periphery of these dark brown areas. Additionally, other minerals including diopside, epidote, calcite, plagioclase, tremolite, titanite, and rutile were identified in the samples [30,41].

3.7. UV-Visible Spectroscopy

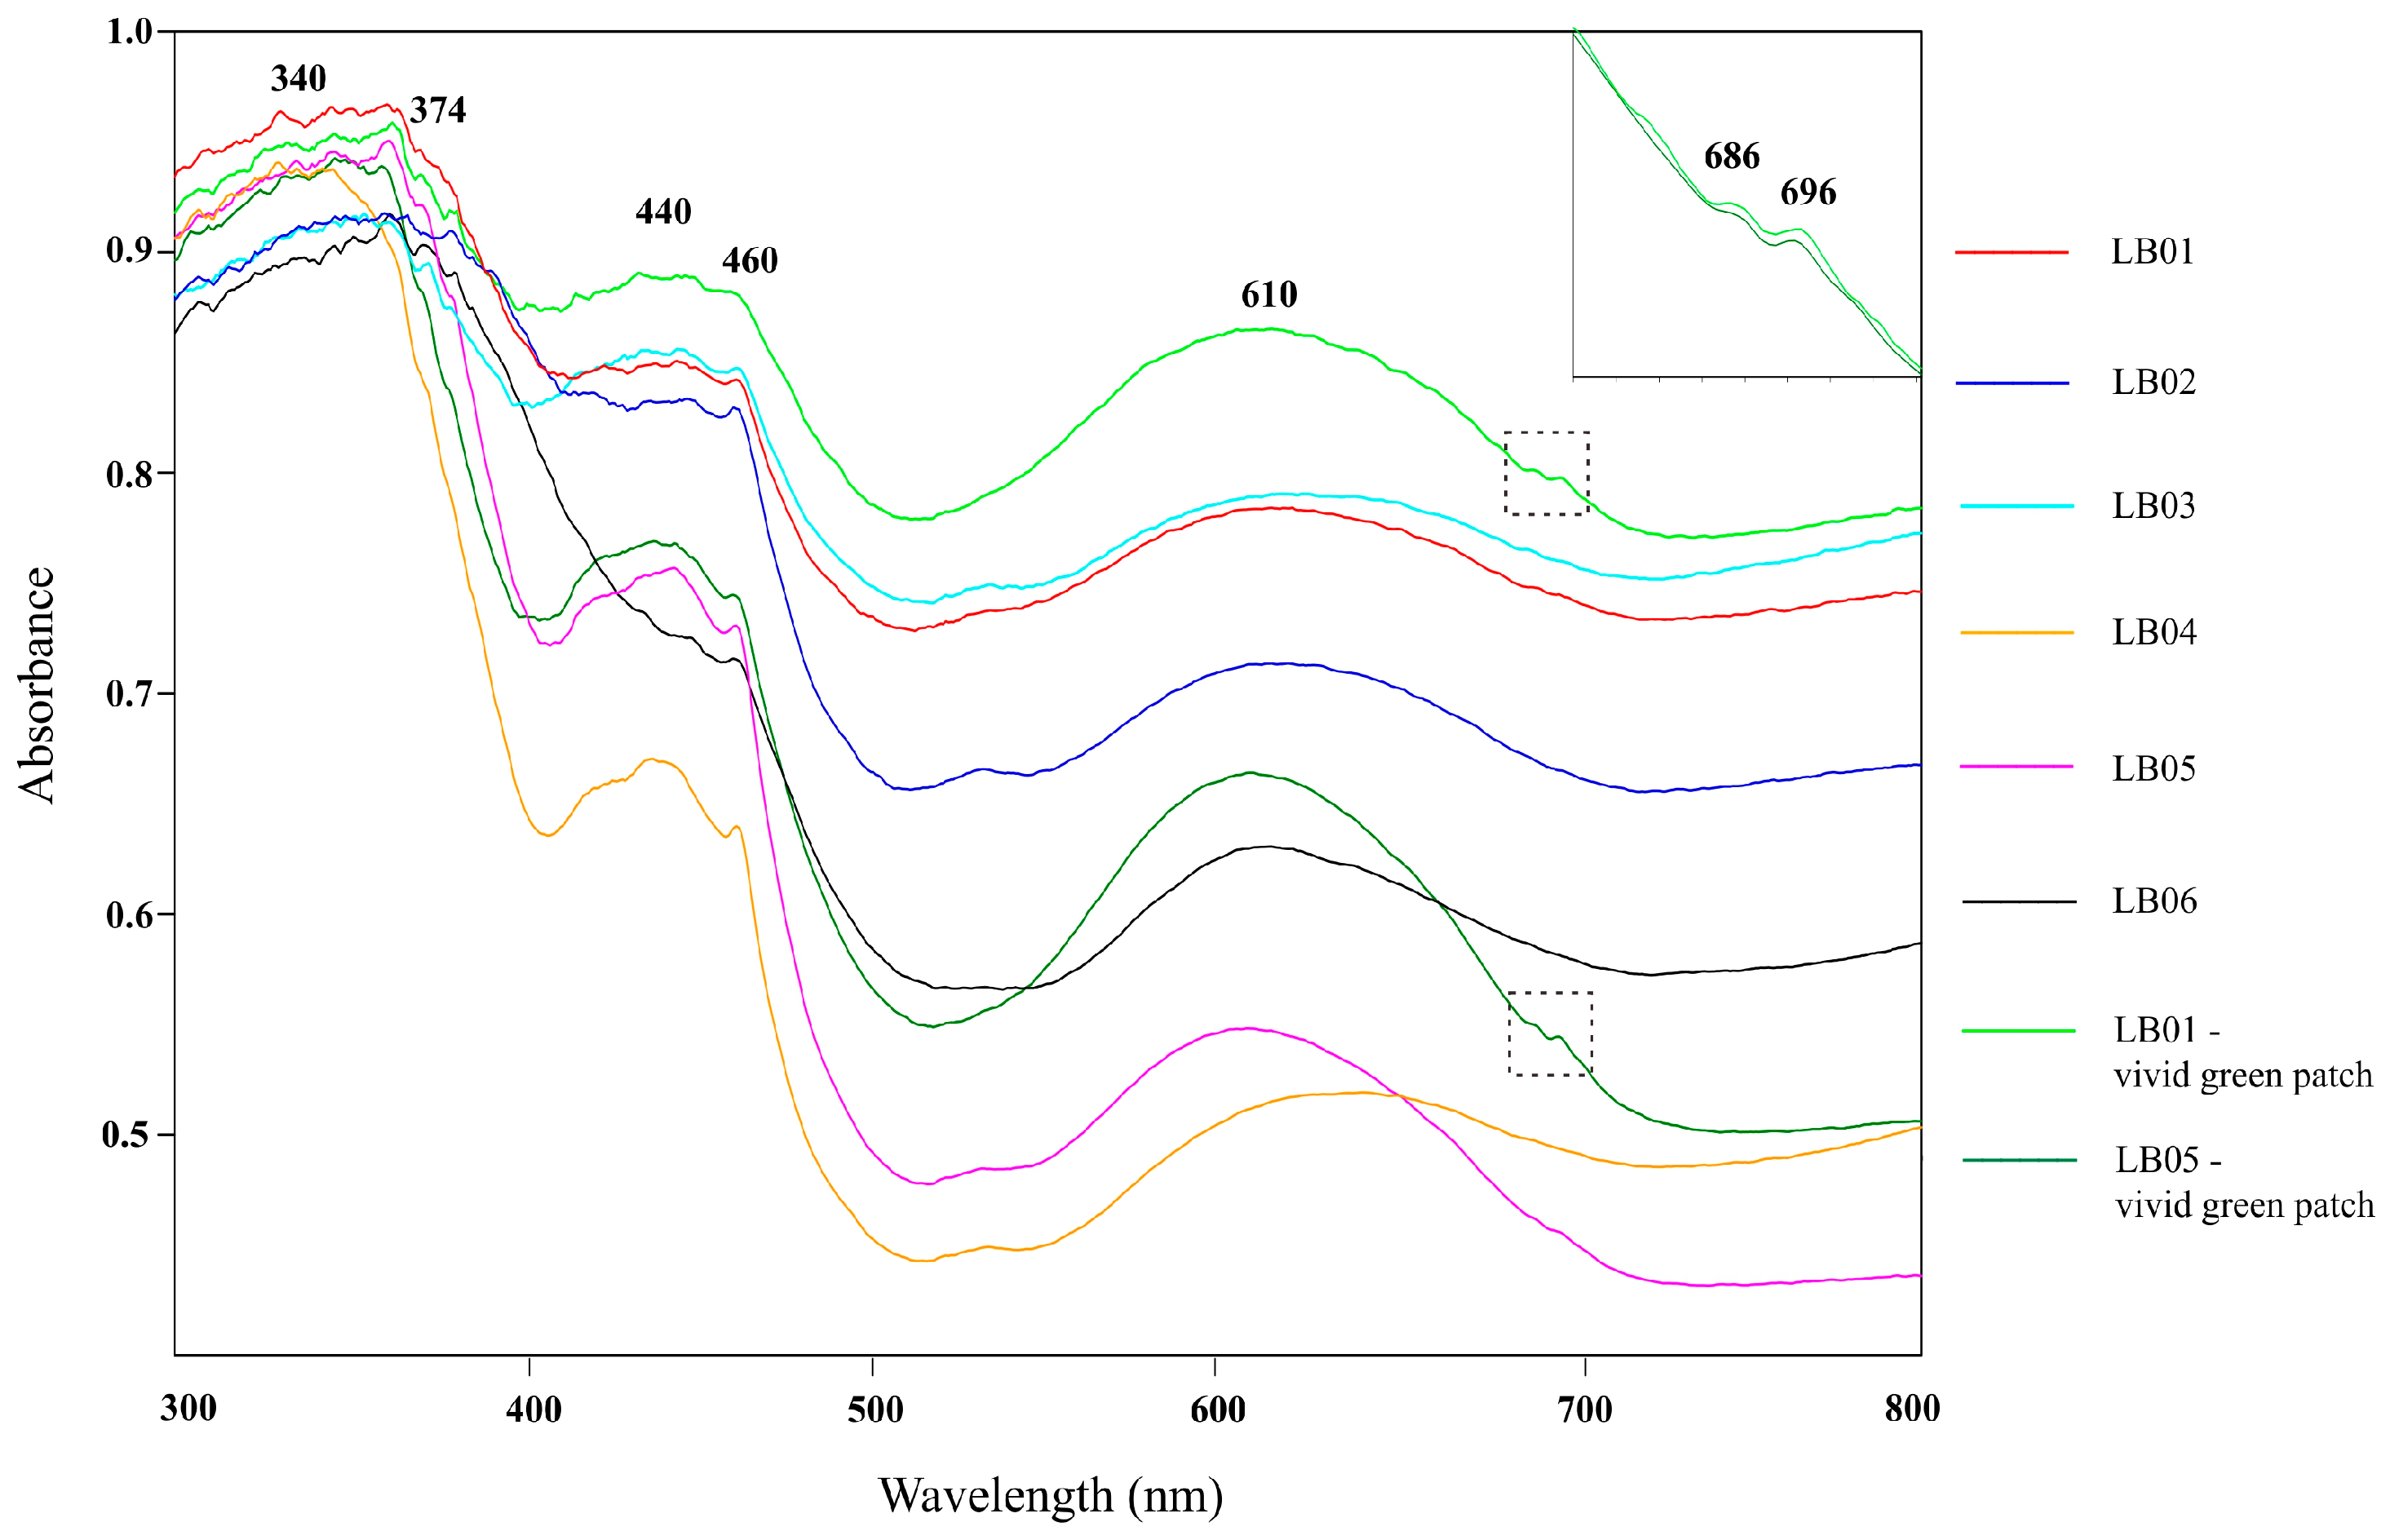
The yellowish-green matrix of all six samples and the emerald-green patches of samples LB01 and LB05 were analyzed using a UV-Vis spectrophotometer. The resulting spectra are shown in Figure 9. All samples exhibit strong, broad absorption bands centered at approximately 320–360 nm, 410–460 nm, and 610 nm, along with weak shoulder peaks near 374 nm and 460 nm. According to the XRF results, the yellowish-green matrix is essentially devoid of Cr but contains 0.56–2.13 wt.% TFeO. Therefore, these absorption features are primarily attributed to crystal field transitions of Fe3+ in octahedral coordination and Fe2+ → Fe3+ intervalence charge transfer (IVCT). The strong absorption band from 410 nm to 460 nm (centered at ~440 nm) is characteristic of the 6A1g4A1g(G) + 4Eg(G) transition of Fe3+, which is the most typical absorption responsible for yellow and green colors caused by iron. The weak shoulder at ~374 nm is also assigned to Fe3+, corresponding to the 6A1g4Eg(D) d-d transition, and serves as an important diagnostic feature for Fe3+ [3,22,42]. The strong absorption band from 320 nm to 360 nm is an O2− → Fe3+ ligand-to-metal charge transfer (LMCT) band. This absorption is very intense, and its tail extends into the violet region of the visible spectrum, working in conjunction with the d-d transitions of Fe3+ to absorb a significant amount of blue–violet light. The broad band near 610 nm is likely caused by Fe2+-Fe3+ IVCT [3,22,42,43,44].
The vivid green patches in samples LB01 and LB05 are distinguished by a weak absorption peak at 696 nm, accompanied by a weaker, broader feature near 686 nm. Correlating this with the XRF data for these areas (which show the presence of 0.13–0.14 wt.% Cr in addition to Fe), it is concluded that the vivid green color is directly related to the presence of chromium. The ionic radius of Cr3+ is similar to that of Al3+, facilitating its substitution for Al3+ in the octahedral sites of the vesuvianite structure. The weak and sharp peak at 696 nm is particularly diagnostic. It corresponds to the R-line resulting from the spin-forbidden d-d transition (2E → 4A2) of Cr3+ in an octahedral crystal field, serving as a definitive fingerprint for Cr3+ as a chromophore [43]. The presence of the adjacent weaker feature at ~686 nm could be attributed to Cr3+ ions occupying a crystallographically distinct octahedral site, a phenomenon plausible in the complex silicate structure of vesuvianite [45]. In addition to this sharp feature, Cr3+ is known to produce two broad, strong spin-allowed absorption bands in the blue–violet (~430 nm) and yellow–orange (~580–620 nm) regions. These bands overlap with and enhance the absorption features from iron ions. Specifically, the Cr3+ band in the blue–violet region superimposes on the Fe3+ absorption band (~410–460 nm), while the Cr3+ band in the yellow–orange region reinforces the absorption caused by the Fe2+/Fe3+ intervalence charge transfer (IVCT) band often observed near 610 nm [3,22,45,46,47,48].
Therefore, the color of the vivid green patches results from the combined effects of Fe and Cr. Fe provides the yellowish-green base color, while the addition of Cr is crucial for elevating the hue from yellowish-green to a vibrant vivid green.

4. Conclusions

Through standard gemological testing and a suite of modern analytical techniques, the mineralogical characteristics of the vesuvianite jade from Hanzhong, Shaanxi, were determined, and its color origins were investigated.
The primary mineral constituent of the vesuvianite jade is vesuvianite. Accessory minerals include grossular, chlorite, diopside, calcite, epidote, chromite, and titanite. The vivid green patches are composed mainly of Cr-bearing vesuvianite. The pale green patches consist primarily of chlorite and grossular, while the dark green bands are predominantly chlorite. The dark brown patches are composed of fine, disseminated, microcrystalline chromite intermixed with uvarovite.
The characteristic yellowish-green hue of the vesuvianite jade matrix is the result of a combination of ligand-to-metal charge transfer (LMCT) involving Fe3+, crystal field transitions of Fe3+, and intervalence charge transfer (IVCT) between Fe2+ and Fe3+. The color of the vivid green patches results from the combined effects of Fe and Cr, with Fe providing the yellowish-green base and Cr3+ crystal field transitions (686/696 nm doublet) significantly enhancing red light absorption, resulting in a more vibrant vivid green.

Author Contributions

Y.Y. and M.S. contributed equally to this work and share first authorship; methodology, Y.Y. and M.S.; software, Y.Y. and R.J.; validation, Y.Y. and M.S.; formal analysis, Y.Y. and M.S.; investigation, Y.Y., X.H. and Y.Z.; resources, M.S.; data curation, Y.Y. and M.S.; writing—original draft preparation, Y.Y.; writing—review and editing, Y.Y. and M.S.; visualization, Y.Y. and R.J.; funding acquisition, M.S. All authors have read and agreed to the published version of the manuscript.

Funding

The research was funded by the National Natural Science Foundation of China (Grant No. 42002156), the Excellent youth project of Hebei GEO University (Grant No. YQ202404), and the Doctoral research start-up fund project of Hebei GEO University (Grant No. BQ2024008). The APC was funded by the Doctoral research start-up fund project of Hebei GEO University, grant number [BQ2024008].

Data Availability Statement

The original contributions presented in this study are included in the article. Further inquiries can be directed to the corresponding author.

Acknowledgments

We thank the Gemology Experimental Teaching Center, China University of Geosciences (Beijing) for its help in sample testing. We sincerely appreciate the valuable feedback and constructive suggestions provided by the reviewers, which have greatly enhanced the quality of our work.

Conflicts of Interest

The authors declare no conflicts of interest.

References

  1. Spencer, L.J. Vesuvianite. In Encyclopædia Britannica, 11th ed.; Chisholm, H., Ed.; Cambridge University Press: Cambridge, UK, 1911; Volume 27, p. 1063. [Google Scholar]
  2. Caucia, F.P.; Marinoni, L.; Scacchetti, M.; Riccardi, M.P.; Bartoli, O. The Vesuvianite Gems of the Val d’Ala (Piedmont, Italy). Minerals 2020, 10, 535. [Google Scholar] [CrossRef]
  3. Lu, Z.; He, X.; Lin, C.; Liang, L.; Jin, X.; Guo, Q. Color and genesis of californite from Pakistan: Insights from μ-XRF mapping, optical spectra and X-ray photoelectron spectroscopy. Sci. Rep. 2020, 10, 285. [Google Scholar] [CrossRef]
  4. Pabst, A. Vesuvianite from Georgetown, California. Am. Mineral. 1936, 21, 1–10. [Google Scholar]
  5. Chamberlain, S.C. The Jeffrey mine: In Asbestos, Quebec, Canada. Rocks Miner. 1980, 55, 188–191. [Google Scholar] [CrossRef]
  6. Cao, Z.; Zhu, H. Mineralogical study on macrocrystals of vesuvianite. Acta Petrol. Mineral. 2020, 19, 69–77. [Google Scholar]
  7. Dyrek, K.; Platonov, A.N.; Sojka, Z.; Zabinski, W. Optical absorption and EPR study of Cu2+ ions in vesuvianite (“cyprine”) from Sauland, Telemark, Norway. Eur. J. Mineral. 1992, 4, 1285–1289. [Google Scholar] [CrossRef]
  8. Veblen, D.R.; Wiechmann, M.J. Domain structure of low-symmetry vesuvianite from Crestmore, California. Am. Mineral. 1991, 76, 397–404. [Google Scholar]
  9. Xu, Y. Gemmological and Mineralogical Studies on Characteristics of Hydrogrossular Jade and Vesuvianite Jade from Tawmaw Area, Burma. Master’s Thesis, China University of Geosciences (Beijing), Beijing, China, 2014. [Google Scholar]
  10. Zhong, H. Skarn-type vesuvianite jade: Discovery of the Huilong jade deposit and characteristics of the jade. Min. Resour. Geol. 1996, 10, 256–258, (In Chinese with English abstract). [Google Scholar]
  11. Li, G.; Yu, Y. Gemmological study on vesuvianite jade from Manasi, Xinjiang. In Proceedings of the International Symposium on Jade Science, Beijing, China, 11 September 2011; pp. 201–206, (In Chinese with English abstract). [Google Scholar]
  12. Groat, L.A.; Hawthorne, F.C.; Ercit, T.S. The chemistry of vesuvianite. Can. Mineral. 1992, 30, 19–48. [Google Scholar]
  13. Fitzgerald, S.; Leavens, P.B.; Rossman, G.R.; Yap, G.P.A.; Rose, T. Vesuvianite from Pajsberg, Sweden, and the role of Be in the vesuvianite structure. Can. Mineral. 2016, 54, 1525–1537. [Google Scholar] [CrossRef]
  14. Czaja, M.; Lisiecki, R.; Chrobak, A.; Mazurak, Z.; Fronc, K.; Kądziołka-Gaweł, M. The absorption- and luminescence spectra of Mn3+ in beryl and vesuvianite. Phys. Chem. Miner. 2018, 45, 475–488. [Google Scholar] [CrossRef]
  15. Fitzgerald, S.; Rheingold, A.L.; Leavens, P.B. Crystal structure of a Cu-bearing vesuvianite. Am. Mineral. 1986, 71, 1011–1014. [Google Scholar]
  16. Ahmed-Said, Y.; Leake, B.E. The conditions of metamorphism of a grossular-wollastonite vesuvianite skarn from the Omey Granite, Connemara, western Ireland, with special inference to the chemistry of vesuvianite. Mineral. Mag. 1996, 60, 541–550. [Google Scholar] [CrossRef]
  17. Dey, A.; Roy Choudhury, S.; Mukherjee, S.; Sanyal, S.; Sengupta, P. Origin of vesuvianite-garnet veins in calc-silicate rocks from part of the Chotanagpur Granite Gneiss Complex, East Indian Shield: The quantitative P-T-XCO2 topology in parts of the system CaO-MgO-Al2O3-SiO2-H2O-CO2 (+Fe2O3, F). Am. Mineral. 2019, 104, 744–760. [Google Scholar] [CrossRef]
  18. Ballivián Justiniano, C.A.; Rodríguez, M.G.; Panikorovskii, T.L.; Benítez, M.E.; Recio, C.; Ramos, C.P.; Lanfranchini, M.E.; Di Salvo, F. Vesuvianite as a key tool for the reconstruction of skarn formation conditions: An example from the Sauce Chico Complex, Argentina. Am. Mineral. 2025. [Google Scholar] [CrossRef]
  19. Zhao, Y.; Li, D. Study on vesuvianite in Qinjia copper-tin mine, Guangxi. Adv. Geosci. 2023, 13, 1296–1301. [Google Scholar] [CrossRef]
  20. Zhang, Q.; Zhao, Z.; Wang, Y. Gemological characteristics of ‘Baohecui’ from Hanzhong, Shaanxi Province, China. In Proceedings of the China International Jewelry Academic Exchange Conference, Beijing, China, 13 November 2019; pp. 330–333, (In Chinese with English abstract). [Google Scholar]
  21. Liu, H. Gemological and Mineralogical Characteristics and Genesis of the Idocrase Jade in Hanzhong, Shaanxi. Master’s Thesis, Guilin University of Technology, Guilin, China, 2022. [Google Scholar]
  22. Whitney, D.L.; Evans, B.W. Abbreviations for names of rock-forming minerals. Am. Mineral. 2010, 95, 185–187. [Google Scholar] [CrossRef]
  23. Lafuente, B.; Downs, R.T.; Horkowitz, H.R.; Pufahl, P.K. The RRUFF™ project: An integrated study of the chemistry, crystallography, Raman and infrared spectroscopy of minerals. In Highlights in Mineralogical Sciences; Armbruster, T., Danisi, R.M., Eds.; De Gruyter: Berlin, Germany, 2015; pp. 1–30. [Google Scholar]
  24. Paluszkiewicz, C.; Żabiński, W. Vibrational spectroscopy as a tool for discrimination of high and low vesuvianite. Vib. Spectrosc. 2004, 35, 77–80. [Google Scholar] [CrossRef]
  25. Groat, L.A.; Hawthorne, F.C.; Rossman, G.R.; Ercit, T.S. The infrared spectroscopy of vesuvianite in the OH region. Can. Mineral. 1995, 33, 609–626. [Google Scholar]
  26. Borovikova, E.Y.; Kurazhkovskaya, V.S. Infrared spectra and factor group analysis of vesuvianites in OH region. Vib. Spectrosc. 2005, 39, 95–98. [Google Scholar] [CrossRef]
  27. Yang, M.; Ye, M.; Han, H.; Ren, G.; Han, L.; Zhang, Z. Near-Infrared spectroscopic study of chlorite minerals. J. Spectrosc. 2018, 2018, 6958260. [Google Scholar] [CrossRef]
  28. Shirozu, H. Infrared spectra of trioctahedral chlorites in relation to chemical composition. Clay Sci. 1985, 6, 167–176. [Google Scholar]
  29. Liu, J.; Li, R.; Xie, M.; Xu, Z. Gemmological characteristics of grossular jade as jadeite imitation. J. Gems Gemmol. 2014, 16, 47–50, (In Chinese with English abstract). [Google Scholar]
  30. Zhang, Z. Gemological Characteristics of Vesuvianite Jade and Hydrogrossular Jade in Liuba, Shaanxi Province. Master’s Thesis, China University of Geosciences, Beijing, China, 2022. [Google Scholar]
  31. Hainschwang, T.; Notari, F. Specular reflectance infrared spectroscopy—A review and update of a little exploited method for gem identification. J. Gemmol. 2008, 17, 23–29. [Google Scholar] [CrossRef]
  32. Izzo, F.; Germinario, C.; Grifa, C.; Langella, A.; Mercurio, M. External reflectance FTIR dataset (4000–400 cm−1) for the identification of relevant mineralogical phases forming Cultural Heritage materials. Infrared Phys. Technol. 2020, 106, 103266. [Google Scholar] [CrossRef]
  33. Galuskin, E.; Janeczek, J.; Kozanecki, M.; Sitarz, M.; Jastrzębski, W.; Wrzalik, R.; Stadnicka, K. Single-crystal Raman investigation of vesuvianite in the OH region. Vib. Spectrosc. 2007, 44, 36–41. [Google Scholar] [CrossRef]
  34. Peng, M.; Mao, H.K.; Dien, L.; Chao, E.C.T. Raman spectroscopy of garnet-group minerals. Chin. J. Geochem. 1994, 13, 176–183. [Google Scholar] [CrossRef]
  35. Gillet, P.; Fiquet, G.; Malezieux, J.M.; Geiger, C.A. High-pressure and high-temperature Raman spectroscopy of end-member garnets: Pyrope, grossular and andradite. Eur. J. Mineral. 1992, 4, 651–664. [Google Scholar] [CrossRef]
  36. Prieto, A.C.; Dubessy, J.; Cathelineau, M. Structure-composition relationships in trioctahedral chlorites: A vibrational spectroscopy study. Clays Clay Miner. 1991, 39, 531–539. [Google Scholar] [CrossRef]
  37. Wang, A.; Freeman, J.J.; Jolliff, B.L. Understanding the Raman spectral features of phyllosilicates. J. Raman Spectrosc. 2015, 46, 829–845. [Google Scholar] [CrossRef]
  38. Akbulut, M. Raman spectral features of a natural chromitite from NW Türkiye: Characterization of magnesiochromite spectra and implications. Period. Mineral. 2025, 94, 21–36. [Google Scholar] [CrossRef]
  39. Chopelas, A. Single crystal Raman spectrum of uvarovite, Ca3Cr2Si3O12. Phys. Chem. Miner. 2005, 32, 525–530. [Google Scholar] [CrossRef]
  40. Bersani, D.; Andò, S.; Vignola, P.; Moltifiori, G.; Marino, I.-G.; Lottici, P.P.; Diella, V. Micro-Raman spectroscopy as a routine tool for garnet analysis. Spectrochim. Acta A Mol. Biomol. Spectrosc. 2009, 73, 484–491. [Google Scholar] [CrossRef] [PubMed]
  41. Chukanov, N.V.; Vigasina, M.F. Vibrational (Infrared and Raman) Spectra of Minerals and Related Compounds. In Springer Mineralogy; Springer: Cham, Switzerland, 2020; Chapter 4; pp. 741–1255. [Google Scholar] [CrossRef]
  42. Mattson, S.; Rossman, G. Identifying characteristics of charge transfer transitions in minerals. Phys. Chem. Miner. 1987, 14, 94–99. [Google Scholar] [CrossRef]
  43. Burns, R.G. Mineralogical Applications of Crystal Field Theory; Cambridge University Press: Cambridge, UK, 1993; pp. 222–227. [Google Scholar] [CrossRef]
  44. Evans, H.; Rossman, G. Fe2+/Fe3+ intervalence charge transfer and enhanced d-d absorption in mixed valence iron minerals at elevated temperatures. Am. Mineral. 2025. [Google Scholar] [CrossRef]
  45. Hålenius, U. Optical absorption spectra of Cr-bearing vesuvianite: Detection and measurement of Cr3+ at the octahedral Y3-site. Period. Mineral. 2000, 69, 35–48. [Google Scholar]
  46. Fritsch, E.; Rossman, G. An update on color in gems. Part I: Introduction and colors caused by dispersed metal ions. Gems Gemol. 1986, 23, 126–139. [Google Scholar] [CrossRef]
  47. Matsyuk, S.; Platonov, A.; Sobolev, N. Influence of crystallochemical factors on the optical spectra and color of chromium-containing garnets. J. Appl. Spectrosc. 1994, 60, 114–123. [Google Scholar] [CrossRef]
  48. Lachheb, R.; Herrmann, A.; Damak, K.; Rüssel, C.; Maâlej, R. Optical absorption and photoluminescence properties of chromium in different host glasses. J. Lumin. 2017, 186, 152–157. [Google Scholar] [CrossRef]
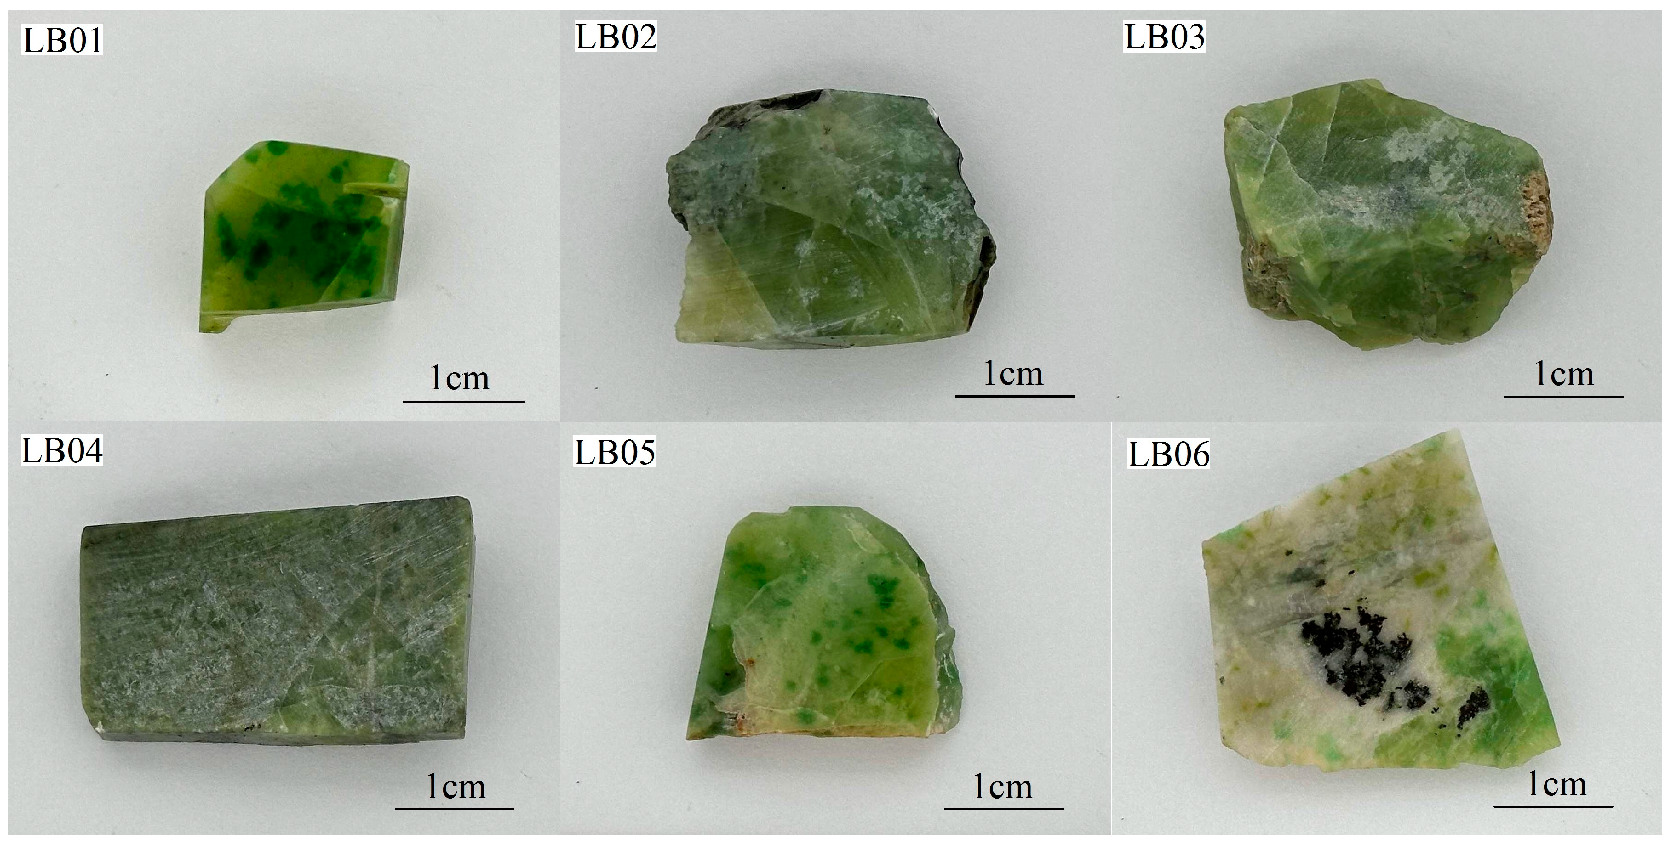
Figure 1. Hanzhong vesuvianite jade samples.
Crystals 15 00765 g001
Figure 2. Magnification features of vesuvianite samples. (a,b) Vivid green patches interwoven with the yellowish-green matrix (LB01 and LB05); (c,d) irregular, opaque, pale green patches in the samples (LB02); (e) dark green bands in the sample (LB06); (f,g) dark brown patches in the sample (LB06); (h) intersecting white calcite veins in the sample (LB06).
Crystals 15 00765 g002
Figure 3. Microphotographs under polarized light microscope. (a) Subhedral, granular vesuvianite crystals (XPL). (b) Coarse diopside grains are commonly replaced by vesuvianite along its cleavage planes (XPL). (c) Elongate prismatic epidote displays brilliant interference colors (XPL). (d) Tremolite appears as prismatic or fibrous aggregates (XPL). (e) Photomicrograph of the pale green patch in cross-polarized light (XPL). (f) Irregular veins or masses of calcite filling the interstices between vesuvianite crystals (XPL). (g) The dark brown patch consist of aggregates of fine-grained, anhedral, opaque iron minerals (XPL). (h) The dark brown patch exhibit a weak metallic luster in reflected light. Pgp: pale green patch; Dbp: deep brown patch. Mineral abbreviations are after Whitney & Evans [22]: Ves = vesuvianite, Grs = grossular, Di = diopside, Ep = epidote, Tr = tremolite, Chl = chlorite, Cal = calcite, Chr = chromite.
Crystals 15 00765 g003
Figure 4. SEM images and corresponding EDS spectra of samples. (a) Subhedral, inequigranular vesuvianite grains. (b) Euhedral grossular grains. (c) Stacked chlorite platelets.
Crystals 15 00765 g004
Figure 5. XRD patterns of vesuvianite jade samples.
Crystals 15 00765 g005
Figure 6. FTIR spectra of samples (KBr Pellet).
Crystals 15 00765 g006
Figure 7. Micro-infrared spectra of samples in reflection mode.
Crystals 15 00765 g007
Figure 8. Laser Raman spectra of samples. The inset in the top-right corner of each spectrum shows a microscopic image of the specific analysis spot captured during the micro-Raman measurement. The faint blue scale bar in the bottom-right corner of each inset represents 10 µm.
Crystals 15 00765 g008
Figure 9. UV-Vis spectra of samples. The inset shows a magnified view of the dashed box region, highlighting the absorption features around 686 nm and 696 nm.
Crystals 15 00765 g009
Table 1. Gemological characteristics of vesuvianite samples.
Sample NumberMicroscopic CharacteristicsRefractive IndexSpecific Gravity
LB01Predominantly yellowish-green with localized vivid green patches1.713.33
LB02Predominantly yellowish-green with localized pale green patches1.713.31
LB03Predominantly yellowish-green with localized pale gray patches1.713.30
LB04Predominantly light green exhibiting distinct granular texture1.703.29
LB05Predominantly yellowish-green with localized vivid green patches1.713.35
LB06Intergrowth of white and yellowish-green zones; dark brown patches and dark green bands present1.723.47
Table 2. XRF test results of vesuvianite samples (wt.%).
Sample NumberSiO2Al2O3CaOMgOTFeOCr2O3Analysis Region
LB01-137.8920.5937.722.870.72/yellowish-green matrix
LB01-237.1019.2539.342.740.900.14vivid green patch
LB02-138.5422.8437.160.760.56/yellowish-green matrix
LB02-237.0621.8238.251.790.98/green matrix
LB02-337.5320.0235.445.081.300.13vivid green patch
LB02-434.9321.4822.5418.961.060.32pale green patch
LB03-137.8919.6137.883.291.23/yellowish-green matrix
LB03-237.9819.0937.923.161.76/green matrix
LB04-138.0418.4837.453.862.09/yellowish-green matrix
LB04-237.8318.7636.814.392.13/green matrix
LB05-137.1418.9340.042.930.91/yellowish-green matrix
LB05-237.0119.6839.312.791.07/green matrix
LB05-337.0418.6440.112.790.960.03vivid green patch
LB06-137.9421.9736.202.551.06/yellowish-green matrix
LB06-237.2719.6338.912.391.63/green matrix
LB06-330.2331.150.0935.043.130.03dark green band
LB06-427.4521.5412.8014.116.5216.67deep brown patch
Disclaimer/Publisher’s Note: The statements, opinions and data contained in all publications are solely those of the individual author(s) and contributor(s) and not of MDPI and/or the editor(s). MDPI and/or the editor(s) disclaim responsibility for any injury to people or property resulting from any ideas, methods, instructions or products referred to in the content.