Article

Reliability and Failure Probability Analysis of Al-Mg-Si/Al2O3–SiC Composites Cast Under Different Mold Conditions Using Classical and Bayesian Weibull Models

by
Mohammed Y. Abdellah
1,2,*,
Fadhel T. Alabdullah
2,
Fadhel Alshqaqeeq
3 and
Mohamed K. Hassan
4
1
Mechanical Engineering Department, Faculty of Engineering, South Valley University, Qena 83521, Egypt
2
Mechanical Engineering Department, College of Engineering, Alasala Colleges, King Fahd Bin Abdulaziz Rd., Dammam 31483, Saudi Arabia
3
Industrial Engineering Department, College of Engineering, Alasala Colleges, King Fahd Bin Abdulaziz Rd., Dammam 31483, Saudi Arabia
4
Production Engineering & Design Department, Faculty of Engineering, Minia University, El-Minia 61111, Egypt
*
Author to whom correspondence should be addressed.
Crystals 2025, 15(9), 791; https://doi.org/10.3390/cryst15090791
Submission received: 2 August 2025 / Revised: 28 August 2025 / Accepted: 3 September 2025 / Published: 4 September 2025
(This article belongs to the Special Issue Microstructural Characterization and Property Analysis of Alloys)

Abstract

This study analyzes the compressive behavior and reliability of Al-Mg-Si (6061) metal matrix composites reinforced with different weight fractions of Al2O3 and SiC ceramics and cast with graphite and steel molds. Compression tests were carried out according to ASTM E9 with 0–8 wt.% reinforcement. The mold material significantly influenced the strength due to the cooling rate and interfacial adhesion. A two-parameter Weibull model assessed statistical reliability and extracted the shape (β) and scale (η) parameters using linear regression. Advanced models—lifelines (frequentist) and Bayesian models—were also applied. Graphite molds yielded composites with higher shape parameters (β = 6.27 for Al2O3; 5.49 for SiC) than steel molds (β = 4.66 for Al2O3; 4.79 for SiC). The scale values ranged from 490–523 MPa. The lifelines showed similar trends, with the graphite molds exhibiting higher consistency and scale (ρ = 7.45–9.36, λ = 479.71–517.49 MPa). Bayesian modeling using PyMC provided posterior distributions that better captured the uncertainty. Graphite mold samples had higher shape parameters (α = 6.98 for Al2O3; 8.46 for SiC) and scale values of 489.07–530.64 MPa. Bayesian models provided wider reliability limits, especially for SiC steel. Both methods confirmed the Weibull behavior. Lifelines proved to be computationally efficient, while Bayesian analysis provided deeper insight into reliability and variability.

1. Introduction

Metal matrix composites (MMCs) are regarded as promising alternatives to conventional metal alloys due to their broad applicability in sectors such as marine, automotive, and aerospace engineering [1]. Nevertheless, their fabrication remains complex and expensive, primarily due to the high cost of specialized equipment and tooling [2,3].
Numerous investigations have examined MMCs reinforced with silicon carbide (SiC) and titanium diboride (TiB2). For example, Sunghak Lee et al. [4] explored the microstructure of A356 aluminum composites reinforced with SiC particles, employing squeeze casting and permanent mold recasting techniques. Their study assessed fracture toughness using advanced testing procedures and revealed that the composites contained densely packed SiC and silicon particles embedded within the solidified matrix.
The effects of reinforcement type, particle size, and processing technique on the mechanical behavior of aluminum-based MMCs (AMMCs) have also been widely studied. It is well established that mechanical performance is strongly influenced by manufacturing precision and microstructural homogeneity. These factors are frequently evaluated using statistical models such as the Weibull distribution to assess strength reliability [5]. Recent research has focused on hybrid aluminum composites containing multiple ceramic phases, highlighting the complex interactions between matrix and reinforcements. Through statistical modeling and empirical analysis, these studies have demonstrated that hybrid reinforcements can enhance strength and stiffness, though they also introduce variability that necessitates reliability evaluation using models like the Weibull distribution. Predictive modeling is therefore critical for optimizing composite design and ensuring consistent mechanical performance [6].
Similarly, Sugimura and Suresh [7] investigated fatigue crack propagation in cast aluminum MMCs with varying SiC content. Their experiments involved constant stress testing under different loading conditions, coupled with microscopic analysis of crack growth. They found that SiC particles inhibited ductile tearing of the matrix, although features such as striations and voids indicative of ductile failure were still observed. Crack propagation accelerated when the reinforcing particles fractured.
In another study, Veeresh Kumar et al. [8] examined the physical, mechanical, and tribological properties of Al 6063 alloy reinforced with silicon nitride via stir casting. Composites containing 0% to 10% reinforcement in 2% increments were tested. The results indicated that silicon nitride significantly improved hardness, density, and wear resistance. Given the relatively soft nature of Al 6063, the added reinforcement substantially enhanced the composite’s strength and durability. These improvements were confirmed through SEM analysis following mechanical testing.
Further research has addressed the interpretation of Weibull probability plots for mechanical test data, particularly in cast components. This work was divided into two parts: Part I outlined the principles of Weibull analysis, while Part II introduced mathematical models of Weibull mixtures and their correlation with casting parameters. Based on five case studies involving six re-analyzed datasets, it was concluded that tensile and fatigue life data require distinct interpretations. For tensile data, Weibull mixtures stem from two defect types: “old” bifilms from prior processing and “young” bifilms from mold filling. Fatigue life data, on the other hand, reflect two failure mechanisms—crack initiation from surface and internal defects—with surface defects being more influential. The study recommended the mutually exclusive Weibull mixture model as the most suitable framework for interpreting such datasets [9].
The Weibull distribution has proven to be a versatile and effective tool for assessing the reliability of composite materials, owing to its adaptable probability density function. For instance, when the shape parameter (β) equals 1, the distribution simplifies to a two-parameter exponential form, losing its shape dependency [10]. As β approaches 3, the distribution becomes nearly symmetric, resembling a normal distribution [10]. The two-parameter Weibull model offers several advantages [11]: (a) its simplicity facilitates practical application, (b) it accurately represents static strength and fatigue life, (c) standard tables and computational resources are readily available, (d) its interpretations are grounded in physical principles, supporting reliable A-Basis and B-Basis values, and (e) it supports established statistical hypothesis testing.
Additionally, a study on ultravacuum-assisted die casting of Al-Si-Mn-Mg alloys employed Weibull modeling to evaluate mechanical reliability and defect sensitivity. Analysis of fracture strength distributions using Weibull parameters demonstrated improved consistency and reduced scatter in mechanical properties, underscoring the model’s utility in quantifying the effects of casting processes on material reliability [12].
Reliability-based methodologies are crucial for evaluating the mechanical integrity of structural aluminum alloys, particularly in applications where failure risk must be minimized. Research has emphasized the use of Weibull statistics to model strength variability and predict performance, offering a quantitative foundation for reliability assessment. These approaches enable engineers to account for manufacturing inconsistencies and defects, thereby enhancing the safety and robustness of component design [13].
Bayesian inference has also emerged as a powerful tool for predicting mechanical properties in complex materials. In dual-phase steels, where traditional regression models often fall short, Bayesian methods integrate prior knowledge with experimental data to generate probabilistic predictions of yield and tensile strength, along with quantified uncertainties. This approach enhances reliability assessment and process optimization, especially in contexts marked by data scarcity and variability [14].
Bayesian techniques have further been applied to spherical indentation tests, where conventional inverse methods are sensitive to noise and modeling errors. By providing posterior distributions for properties such as elastic modulus and hardness, Bayesian inference improves the robustness and reliability of mechanical property estimation, particularly in small or heterogeneous material systems [15]. Numerous studies have adopted Bayesian models for predicting mechanical behavior [16,17,18].
Recent work has also highlighted the value of Bayesian inference in characterizing biological tissues, where experimental data are often limited or variable. For example, Bayesian methods have been used to estimate the mechanical properties of normal, aneurysmal, and atherosclerotic aortic tissues by integrating experimental testing, constitutive modeling, and histological analysis. This probabilistic framework allows for the estimation of posterior distributions for key parameters (e.g., stiffness, strength), accounting for biological variability and measurement uncertainty. Compared to deterministic approaches, this method offers more reliable and robust predictions of tissue behavior [19].
Despite significant efforts to refine stir casting, persistent issues such as gas entrapment [20], shrinkage porosity [21], variations in temperature, stir speed, and stir time [22], and clustering of ceramic reinforcements [23] continue to affect the process. These defects contribute to increased scatter in strength data and reduce the predictability of MMCs [24,25,26]. While many studies employ microstructural techniques such as SEM and XRD to identify these flaws [27,28], fewer have attempted to quantify their statistical impact on compressive strength reliability. The innovation of the present study lies in its use of reliability-based approaches—including Weibull analysis, lifeline modeling, and Bayesian inference—to assess variability induced by casting defects, without relying on extensive microstructural characterization.
Although numerous studies have examined the mechanical properties of metal matrix composites (MMCs), a significant gap persists in the application of statistical methodologies to assess their static mechanical performance. Previous research by the authors has provided comprehensive microstructural analyses of Al-Mg-Si/ceramic composites produced under varying casting conditions, highlighting the influence of mold type, cooling rate, and reinforcement distribution on porosity formation and grain refinement [29,30]. These investigations employed scanning electron microscopy (SEM) and metallographic techniques to elucidate defect formation mechanisms. However, the use of statistical distribution models in MMC analysis remains limited. To address this shortcoming, the present study focuses on Al-Mg-Si matrix composites reinforced with Al2O3 and SiC particles, manufactured via stir casting using two different mold materials—steel and graphite. The primary aims of this research are: (1) to assess the compressive strength of the composites, (2) to model the strength data using the two-parameter Weibull distribution, defined by the shape parameter (β) and scale parameter (η), and (3) to conduct reliability and uncertainty evaluations through lifeline modeling and Bayesian inference techniques.

2. Material and Method

The base material employed in this investigation was aluminum alloy 6061, sourced from the Aluminum Company of Egypt, located in Nag Hammadi. This alloy is widely recognized for its high mechanical strength, favorable weldability, and superior wear resistance—properties that are primarily attributed to its distinct chemical composition. The principal alloying constituents include magnesium (0.8–1.2 wt.%) and silicon (0.4–0.8 wt.%). Furthermore, aluminum 6061 demonstrates considerable fracture toughness, which enhances its overall mechanical reliability. These compositional attributes are fundamental to the alloy’s desirable performance characteristics.

2.1. Stir Casting

Segments of aluminum alloy were initially placed in a ceramic crucible and subsequently introduced into an electric furnace capable of reaching temperatures up to 1500 °C. The alloy was heated to 650 °C and maintained at this temperature for two hours to ensure complete melting, compositional uniformity, and solute distribution. This temperature was selected as it exceeds the alloy’s melting point of 580 °C [29], thereby allowing sufficient time for the integration of ceramic reinforcements—specifically alumina (Al2O3) and silicon carbide (SiCp) particles—procured from El-Gomhouria for Medicines and Medical Supplies, Cairo, Egypt. The ceramic powders, with an average particle size ranging from 40 to 60 µm, were chosen based on prior research demonstrating improved wettability and dispersion within the molten aluminum matrix, promoting mechanical interlocking rather than diffusion-based bonding [3,30].
Following the holding period, the crucible (1.5 kg capacity) was extracted from a resistance box muffle furnace (Brother Furnace, Zhengzhou, China), which has a maximum operating temperature of 1400 °C, and transferred to a mechanical stirring unit (refer to Figure 1). The stirring process commenced as the preheated ceramic reinforcements were gradually added. Preheating of the ceramic particles was conducted at 650 °C using the same furnace employed for melting. The melting operation was performed under ambient atmospheric conditions without the use of flux. Each crucible batch contained approximately 350 g of alloy. Stirring was limited to under 30 s to minimize oxidation and reduce metal loss, after which the molten composite was promptly poured into pre-prepared molds. The stirrer used featured a four-blade flat paddle design with a diameter of 40 mm and blade height of 10 mm, operating at a speed of 100 rpm.
Two distinct mold materials were utilized for casting:
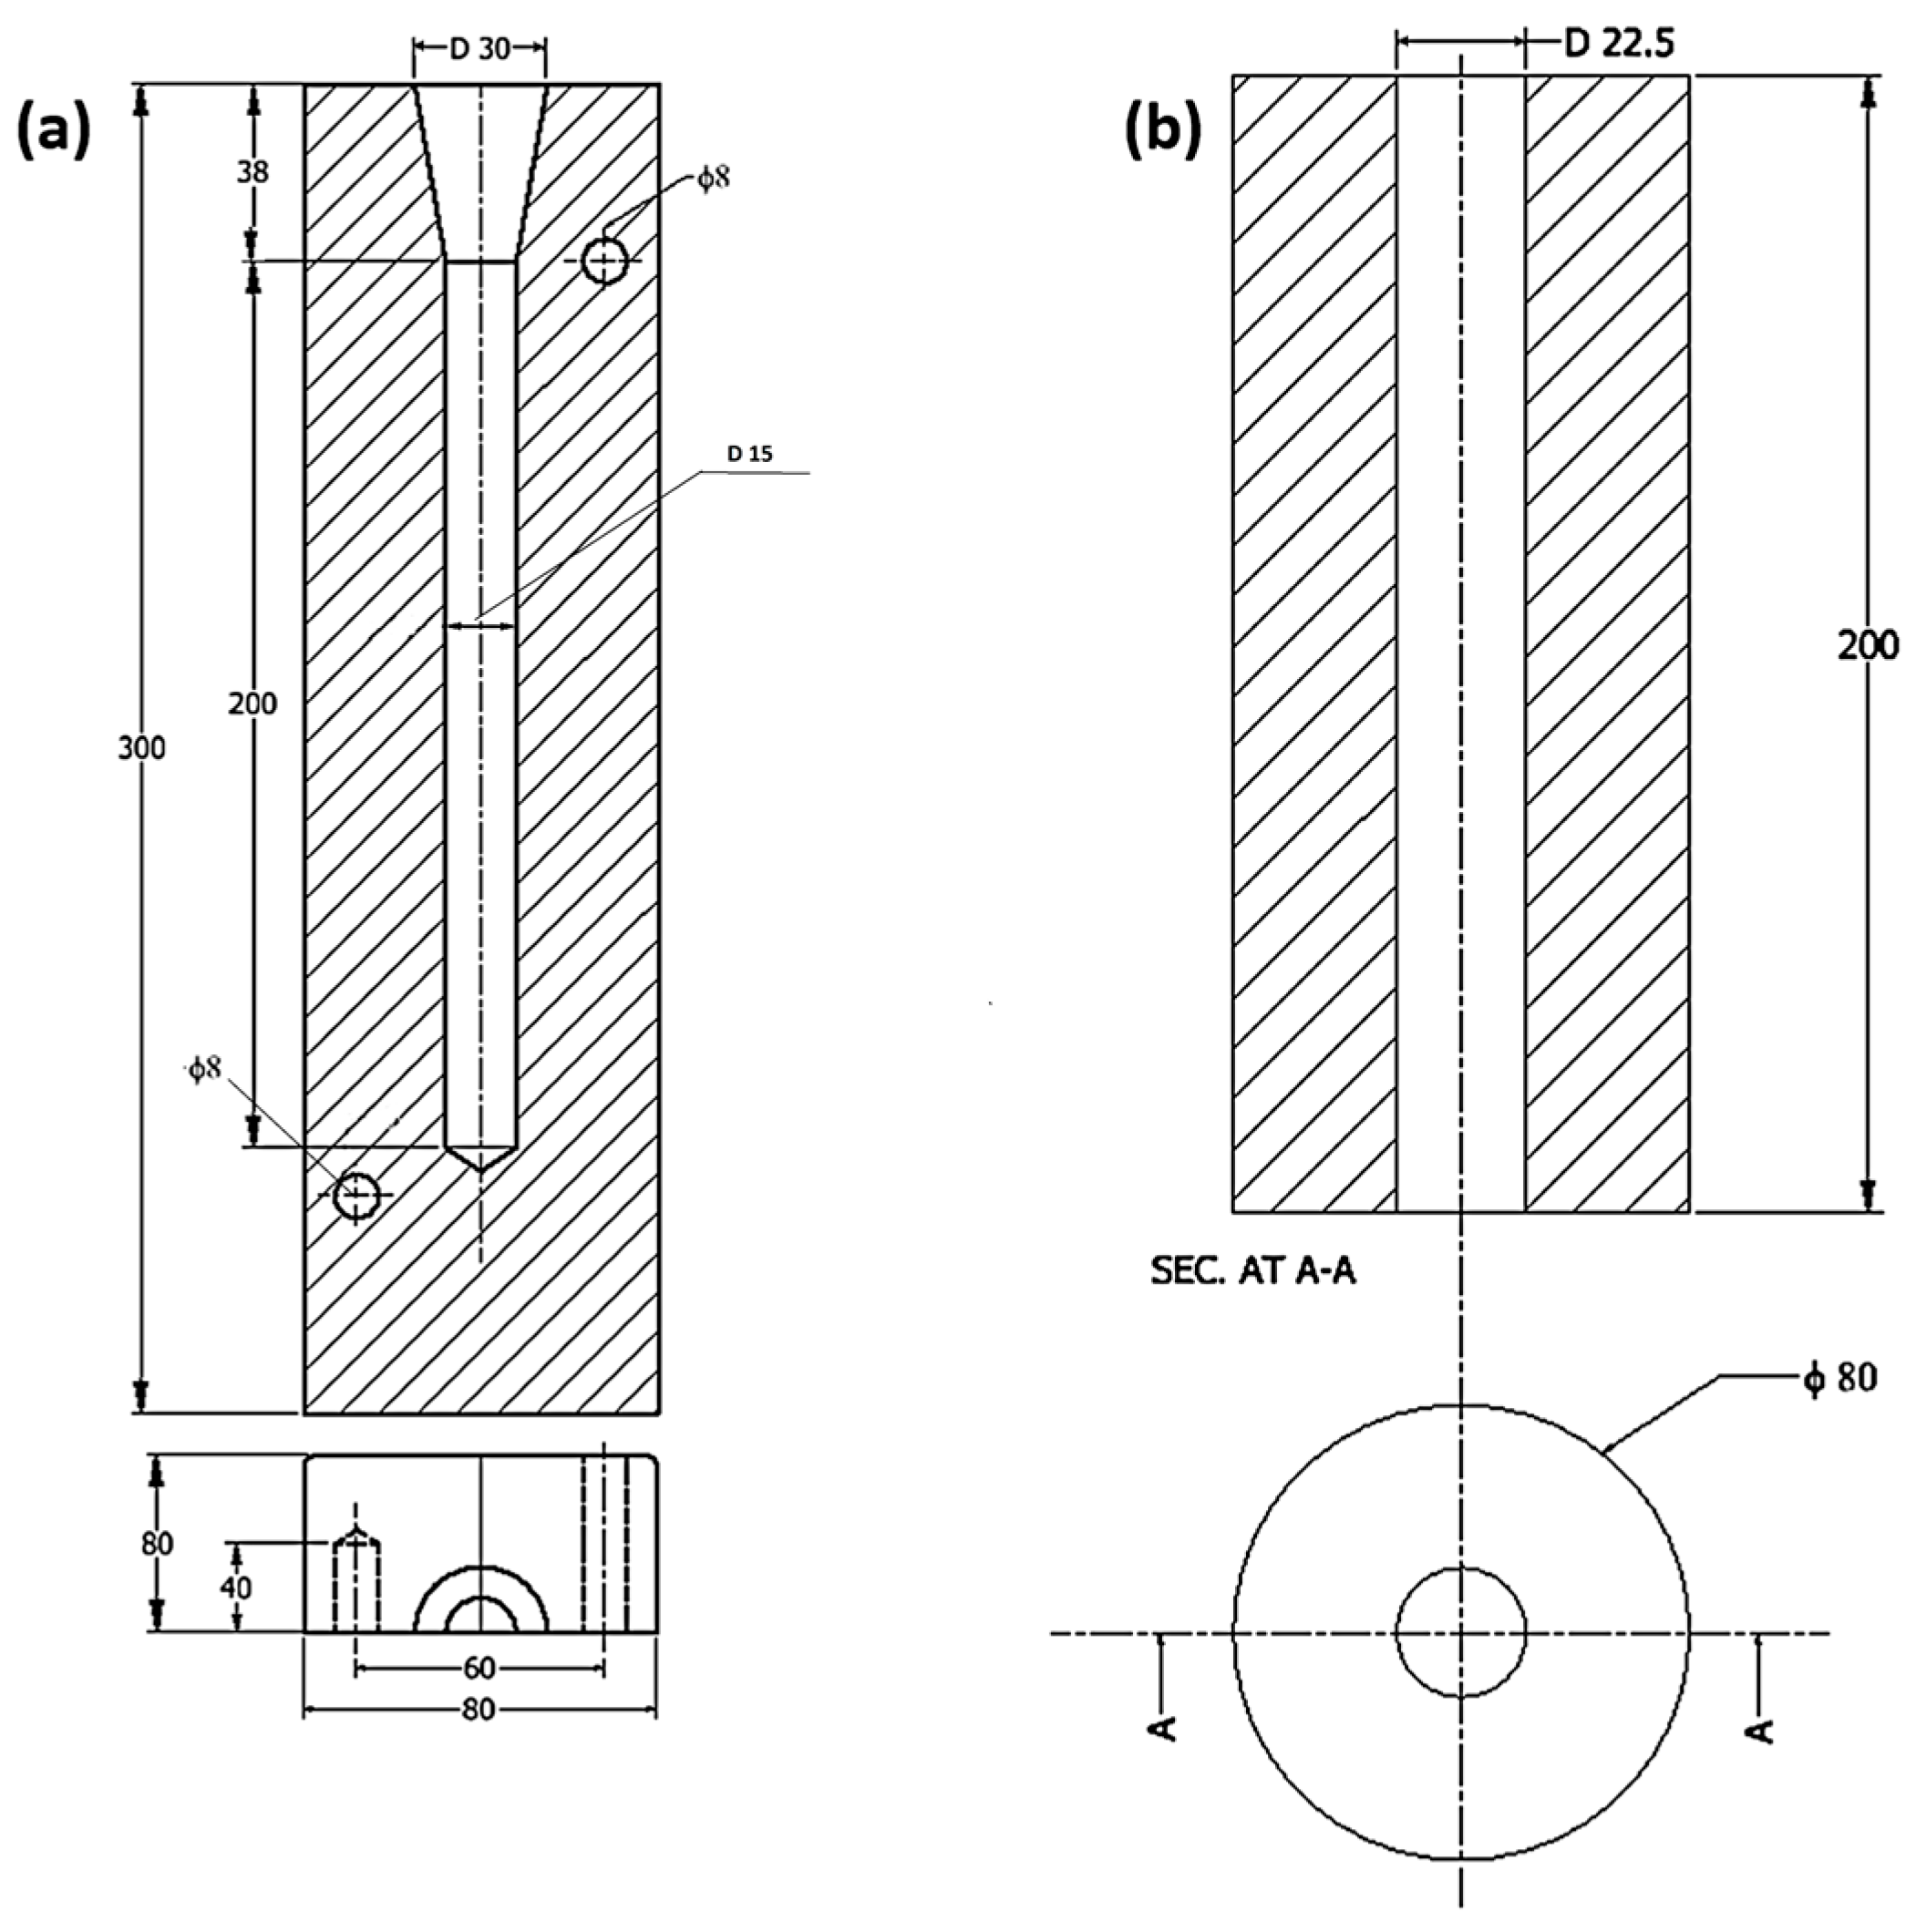
(a) H13 steel alloy, characterized by a thermal conductivity of 24.3 W/m·K and a specific heat capacity of 0.460 J/g·°C [3] (Figure 2a), (b) synthetic graphite, derived from petroleum coke, needle coke, and coal pitch, exhibiting a higher thermal conductivity of 121.1 W/m·K and a specific heat capacity of 1.732 J/g·°C [3,31] (Figure 2b).
Casting experiments were conducted using both the base aluminum alloy and composites reinforced with Al2O3 and SiC particles at concentrations ranging from 0.5 to 8 wt.%. These ceramic reinforcements are thermodynamically stable and chemically inert, with melting points significantly higher than that of aluminum, preventing dissolution during stir casting [32]. As a result, the final products are classified as metal matrix composites (MMCs) [30,31,32,33].
The castings produced were cylindrical in shape, with dimensions of 238 mm in height and 15 mm in diameter for steel molds, and 200 mm in height and 22.5 mm in diameter for graphite molds. The cast specimens were machined to their nominal dimensions using a lathe. Final specimen dimensions were 200 mm in height and 12 mm in diameter for steel mold castings, and 180 mm in height and 20 mm in diameter for graphite mold castings. Each specimen was sectioned into three equal segments along its longitudinal axis to reduce material inhomogeneity and minimize experimental error during repeated testing. This segmentation strategy ensured consistency across samples, as all segments originated from the same casting, thereby mitigating the effects of segregation, as previously reported in [30,31].

2.2. Compression Test

Compression testing was performed at ambient temperature in accordance with the ASTM E9 standard [34]. The test was designed to evaluate compressive strength, Young’s modulus, and strain at failure. A universal testing machine (Model WDW-100, Jinan Victory Instrument Co., Ltd., Jinan, China) with a maximum load capacity of 100 kN was employed, operating at a constant loading rate of 2 mm/min. Load measurements were obtained via the machine’s integrated load cell, while deformation was monitored using a precision dial gauge with a resolution of 0.005 mm, affixed to the moving platen.
Specimens were positioned between two hardened, parallel steel plates to ensure uniform load application and to prevent misalignment during testing, in accordance with ASTM E9 guidelines [34]. No lubricants were applied between the specimen and the plates. The test was continued until the appearance of a visible surface crack. Specimen heights were recorded both before and after testing using a vernier caliper with 0.05 mm accuracy.
Compression tests were conducted on all samples, including those with and without ceramic reinforcements, and cast using both steel and graphite molds. As stipulated by ASTM E9 [34], the specimens were short cylindrical samples with a high thickness-to-diameter ratio (h/d ≈ 0.8), ensuring compliance with standard dimensional requirements for compression testing.

3. Statical Analysis

3.1. Weibull-Based Statistical and Reliability Study

The two-parameter Weibull distribution was used to model the compressive strength results. For each group of samples, the cumulative failure probability was estimated using the median rank method. The linearized Weibull function was then fitted using linear regression to extract the scale (η) and shape (β) parameters. The subsequent reliability analysis was performed using the de-rivified Weibull model to visualize the PDF and survival probability. The complete understanding of the failure behavior enabled a better design, a safer design, and more efficient systems for quality control of failures.
The Weibull distribution function can be implemented using a probability density function (PDF) f σ and the associated cumulative distribution function P f σ and R σ as follows [35]:
f σ = β η σ η β 1 e x p σ η β
This function considered the likelihood of failure at exactly σ , where η is scale parameter (characteristic stress), β is shape parameter (Weibull modulus), and σ is the applied stress (compressive strength in MPa). It gives the probability that failure may occur at or before the compressive strength level reaches.
Then, the cumulative distribution functions (CDF) P f σ and R σ can be calculated as follows in Equations (2) and (3).
P f σ = F σ = C D F σ = 1 e x p σ η β
R σ = 1 P f σ = e x p σ η β
where P f σ is the probability of failure under compression stress σ , and R σ is the probability of survival beyond compressive stress. To indicate the instantaneous rate of failure, where the probability survived up to compressive stress σ , it should calculate the hazard rate function which can be called failure rate as follows in Equation (4).
h σ = f σ R σ = β η σ η β 1
The hazard function is important to describe the instantaneous risk, by assuming the material has survived up to compressive strength σ .
To find the main Weibull 2-paramters β and η form the compressive test data for aluminum alloy 6061, it should apply the linearized form of CDF after rewriting Equation (2) as follows:
ln σ = 1 β ln ln 1 1 P f σ + ln η
This is an equation of straight lines of first degree of the form y = b x + C where y = ln σ , x = ln ln 1 1 P f σ , b = 1 β and C = ln η . The two variables b and C are determined from the experimental data of compression test of aluminum alloy 6061. The median rank of the experimental data stored in ascending order were as follows:
F i = i n + 1
where i is the rank of the data point and n is the total number of samples
Then, the two parameters of Weibull distribution ( β and η ) can be calculated using the least squares fit of coefficient of regression R 2 , which can be calculated using the following equation:
R 2 = 1 y i y f i t 2 y i y ¯ 2
where y i is the actual ln σ , y f i t is the predicted form regression, and y ¯ is the mean of y i .
Three samples were cast and tested for each reinforcement percentage and mold combination. A total of 12 specimens (3 values per group × 4 conditions) were used in the Weibull analysis.

3.2. Lifelines (Frequentist Weibull)

Lifelines use the Weibull distribution with a parametric survival model, estimated by maximum likelihood [36] with the following parameters: shape parameter ρ and scale parameter λ .
Therefore, the hazard function of Equation (4) can be written using these two parameters as follows:
h σ = ρ λ σ λ ρ 1
Then, the cumulative hazard can be in the following form:
H σ = σ λ ρ
From that, the survival function can be calculated related to lifelines parameters such as:
s σ = e H ( σ ) = e ( σ / λ ) ρ
To align the lifelines with standard or classical Weibull distribution analysis, it should let ( η = λ 1   ) and ( β = ρ ).

3.3. Bayesian Reliability Analysis (Bayesian Weibull)

Using Bayesian Reliability with PyMC (Python Markov Chain Monte Carlo), the Weibull likelihood is defined as [37,38]:
f σ | α ,   β = α β α σ α 1 e x p σ β α
where ( α ) is shape parameter, and ( β ) is scale parameter.
The survival function is:
s σ = e ( σ / β ) α
Then, the likelihood is calculated by [39]:
log L = i log α log β +     α 1   log σ i β σ i β α
PyMC then samples the posterior of α and β using Bayesian inference (e.g., NUTS sampler).

4. Results and Discussion

4.1. Experimental Results

Figure 3 presents the average compressive strength values obtained from the tested specimens. For aluminum alloys cast in graphite molds (Figure 3a,c), samples without Al2O3 reinforcement exhibited compressive strengths exceeding 500 MPa. In contrast, alloys cast in steel molds (Figure 3b,d) demonstrated a decline in compressive strength with increasing Al2O3 content, likely due to deformation-related effects. This trend is attributed to the higher thermal conductivity and emissivity (ε) of steel molds, which facilitate rapid heat dissipation during solidification. Consequently, alloys cast in steel molds solidified more quickly, resulting in finer grain structures [40]. Conversely, graphite and ceramic molds, characterized by lower thermal conductivity and emissivity, slowed the cooling process, producing coarser grains. Finer grains are generally advantageous for enhancing mechanical strength and minimizing defect formation.
Regarding aluminum composites reinforced with SiC particles and cast in graphite molds, additions of 0.5, 3, and 8 wt.% SiC yielded compressive strength and strain values comparable to the unreinforced base alloy. For composites cast in steel molds (Figure 3b,d), compressive strength increased with higher SiC content. However, reductions in strength were observed at 1 wt.% and 3 wt.% SiC, likely due to segregation during casting—a phenomenon that remains challenging to eliminate entirely [30,31].
Table 1 and Table 2 summarize the average results from three compressive tests conducted on Al–Mg–Si alloys with ceramic reinforcements, cast in graphite and steel molds, respectively. In Table 1, the highest average compressive strength recorded was 530.37 MPa (standard deviation: 1.06 MPa) for the specimen containing 1 wt.% Al2O3. The greatest deformation, 55.45 MPa (SDV: 29.12 MPa), was observed in the 4 wt.% Al2O3 sample, both cast in graphite molds. For SiC-reinforced specimens, 1 wt.% SiC achieved 525.98 MPa (SDV: 3.37 MPa), while 4 wt.% SiC reached 545.92 MPa (SDV: 3.7 MPa). The lowest percentage errors—0.61% for 1 wt.% Al2O3 and 0.9% for 3 wt.% SiC—indicate high repeatability and measurement stability. Notably, the specimen with 4 wt.% SiC exhibited the greatest height reduction (54.4%), suggesting enhanced ductility and deformation capacity. These improvements in compressive performance are attributed to the uniform dispersion of SiC particles, particularly at reinforcement levels exceeding 0.5 wt.% (Figure 3).
Table 2 details the results for specimens cast in steel molds. The highest compressive strength was 623.53 MPa (SDV: 24.99 MPa) for the 8 wt.% Al2O3 sample, followed by 574.77 MPa (SDV: 19.08 MPa) for the 4 wt.% Al2O3 specimen. Among SiC-reinforced samples, the highest strength was recorded at 4 wt.% SiC (539.46 MPa, SDV: 16.3 MPa), with 8 wt.% SiC achieving 537.65 MPa (SDV: 3.59 MPa). The greatest ductility, indicated by a 59% reduction in height, was also observed in the 4 wt.% SiC specimen. Although casting in steel molds generally resulted in higher compressive strength values, the associated variability was slightly greater compared to specimens cast in graphite molds.

4.2. Weibull Distribution Analysis

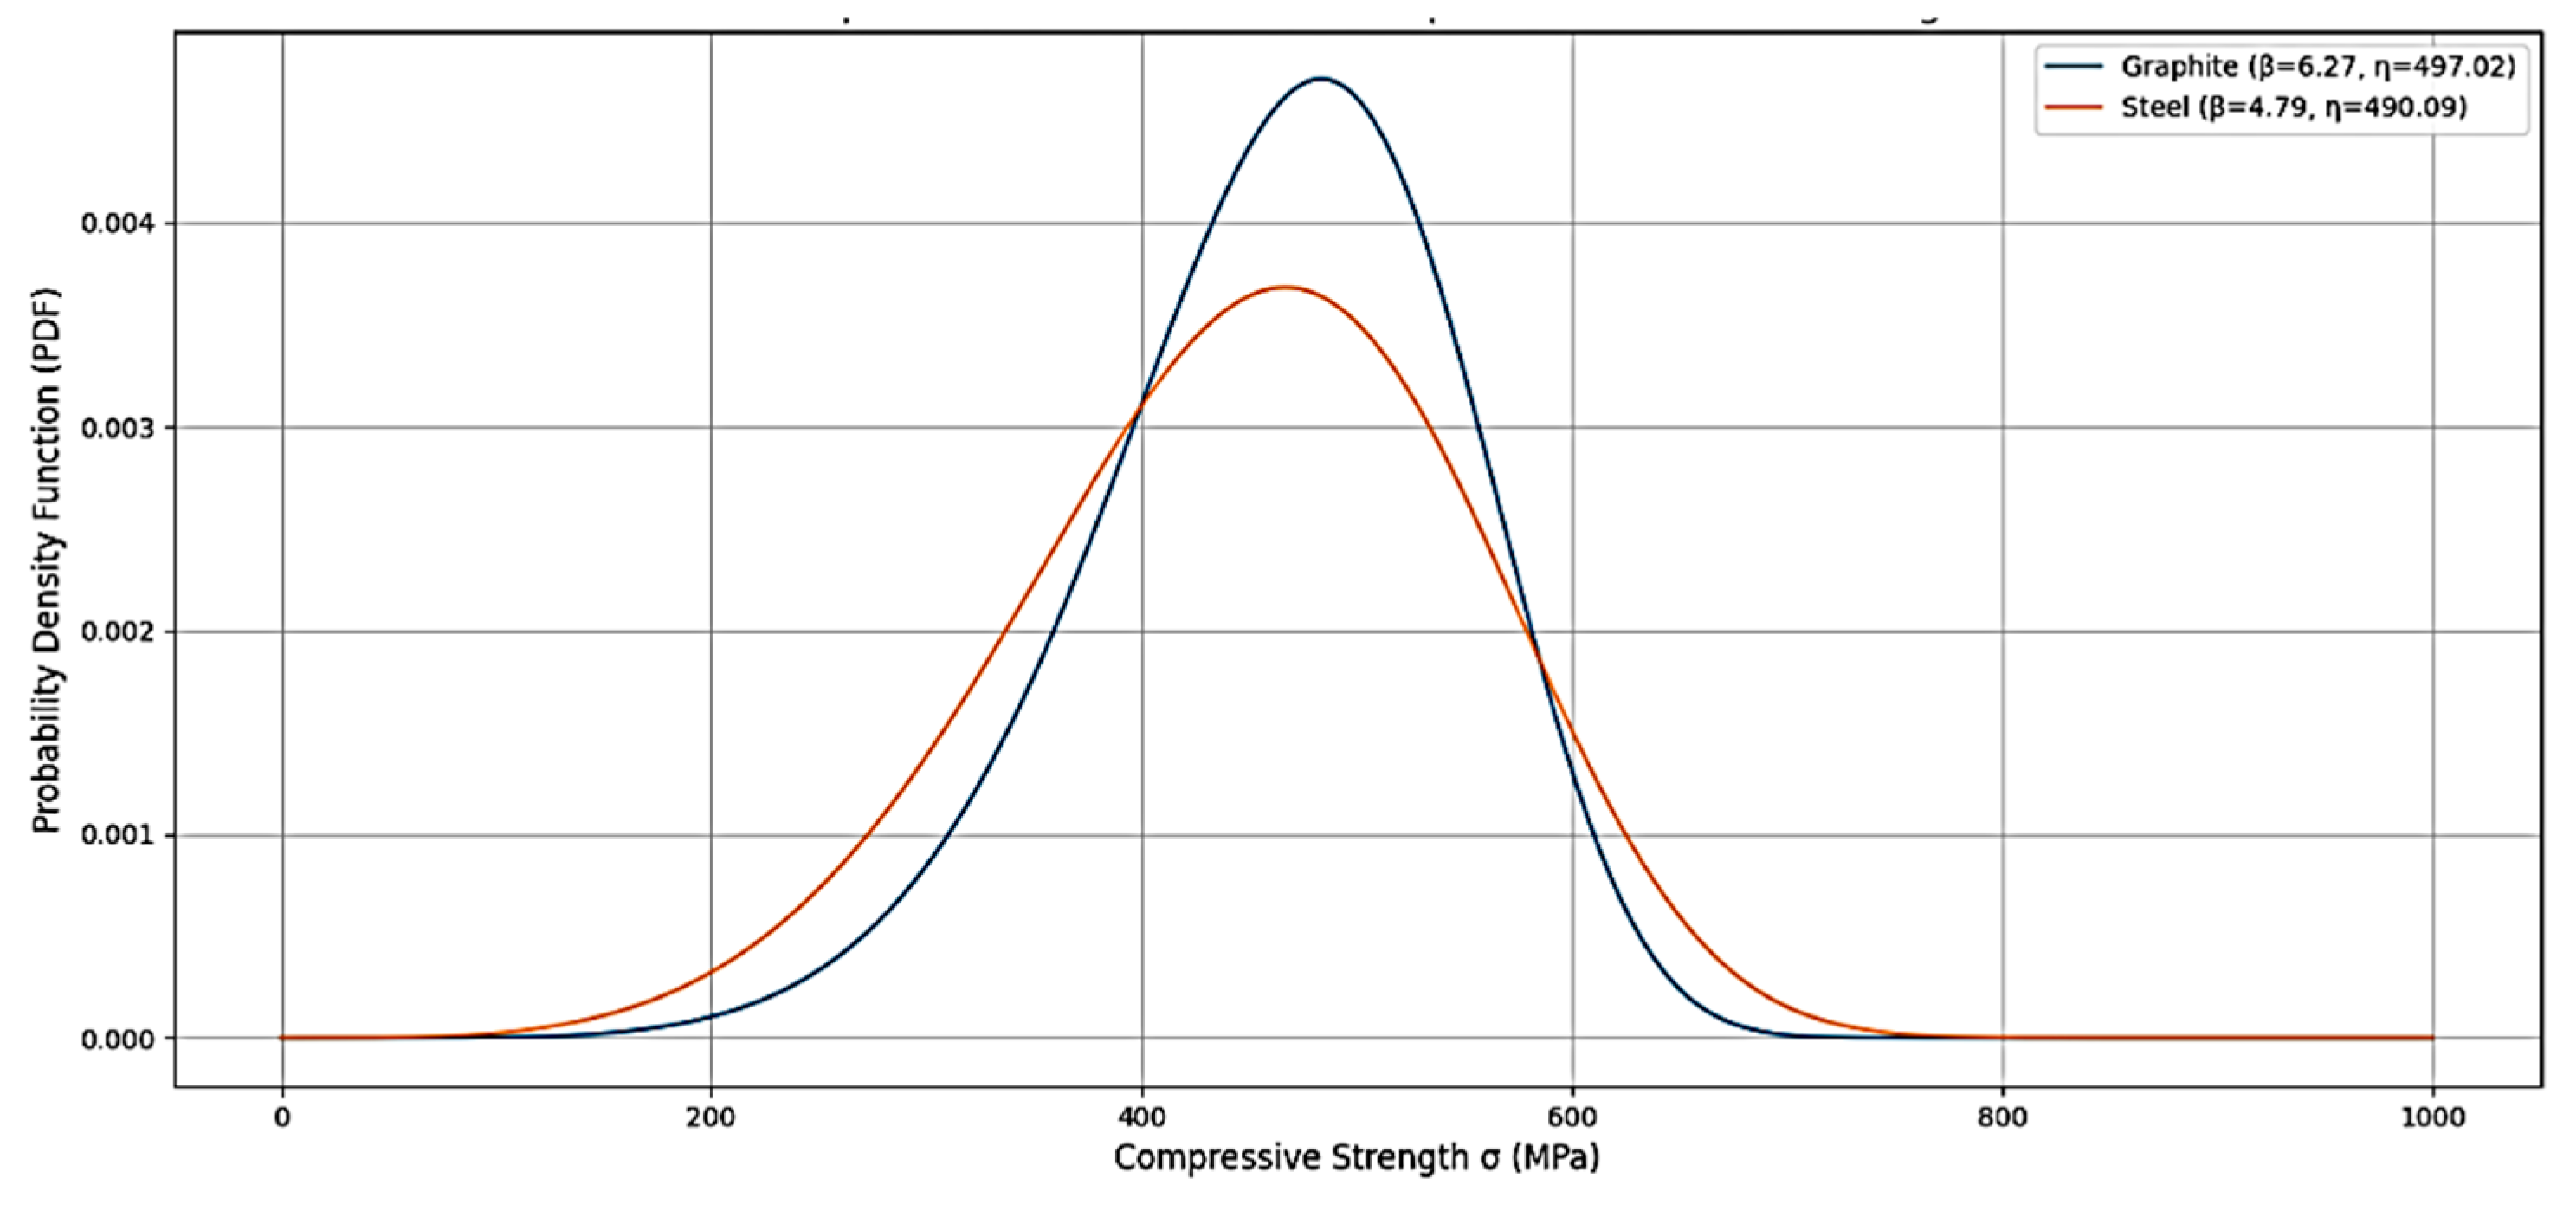
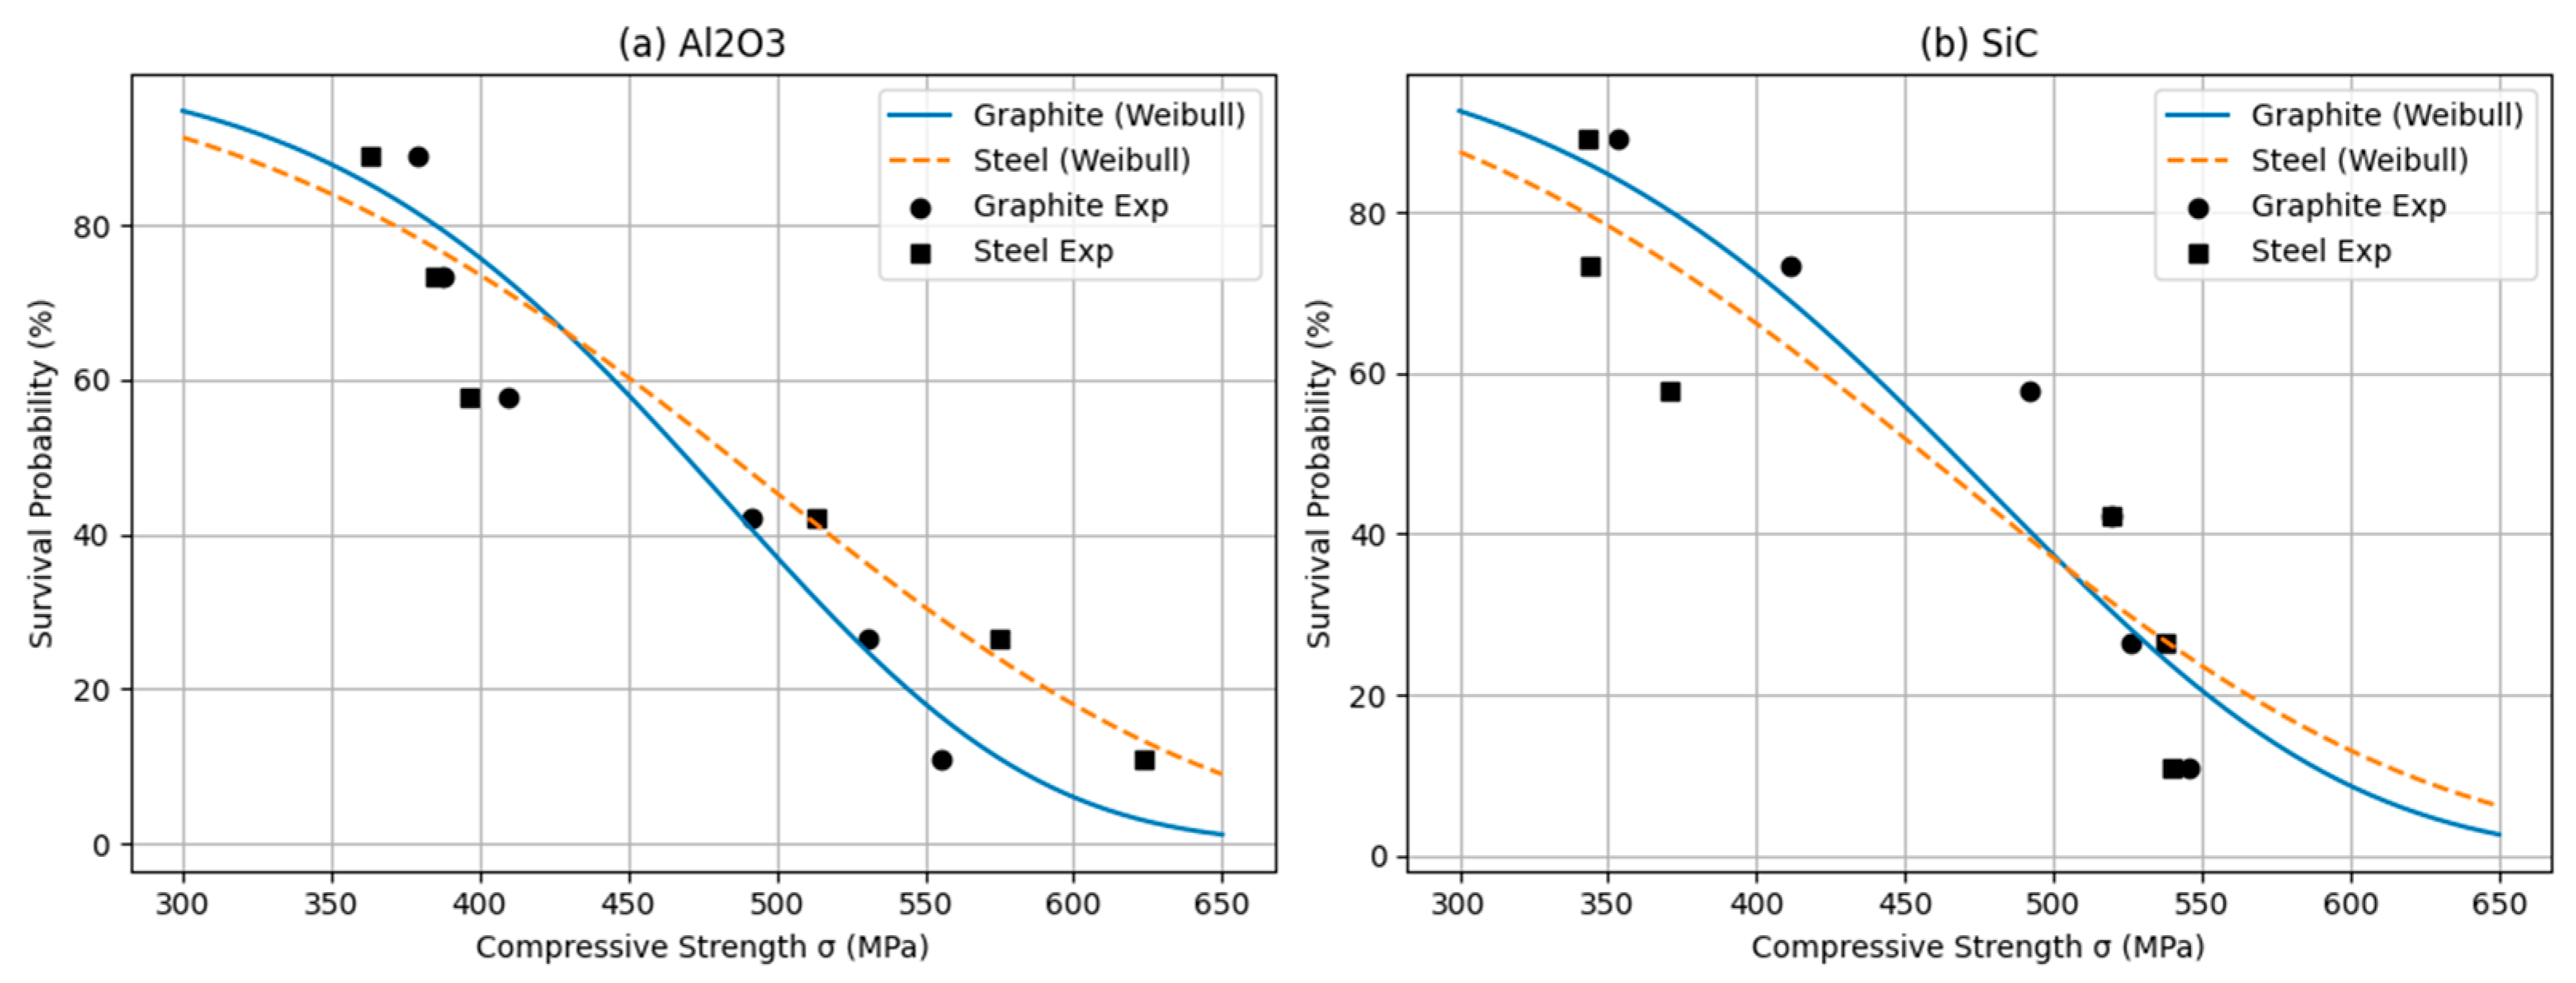
To facilitate statistical modeling and reliability analysis, representative compressive strength values were selected based on the range and trends observed in the original experimental data. This approach was adopted to streamline the Weibull distribution fitting and Taguchi optimization process without significantly affecting the accuracy or validity of the conclusions. The selected values fall within the observed experimental range, ensuring that the statistical behavior and reliability predictions remain consistent with the actual material performance. The reliability in engineering indicates that the probability of a product or system will behave with its design functions under a given set of operating conditions for a specific period. It can also know by “probability of survival”. Table 3 listed the Weibull distribution function two parameters; these two parameters were measured using fitting of linear regression (Figure 4). The Shape β maximum value was 6.27 for Al2O3, which was cast in graphite, and minimum 4.66 for SiC, which was casted in steel mold. It means strength values are more uniform and reliable, compared to steel molds. When β is larger, the data points are closer together around the characteristic Scale (η). This means the material or system is more predictable and fails in a narrower range of stress or life and also better reliability [41]. The effect of shape factors corresponding to Scale (η) on probability density function (PDF) explained that a higher Weibull shape parameter (β) indicates a lower degree of scatter in material strength or life data, suggesting more consistent and predictable failure behavior. When β > 1, failures are generally due to wear-out mechanisms rather than random occurrences. As β increases further (typically above 3), the material exhibits a narrower failure distribution, implying enhanced reliability and structural uniformity. For example, materials with β > 5 are considered highly uniform, as the probability of failure becomes tightly clustered around the characteristic strength (η). This makes such materials highly desirable in critical engineering applications where consistency is essential. In Weibull probability plots, higher β values result in steeper slopes, which directly correlate with improved reliability and less variation in measured properties such as compressive strength or fatigue life [41]. Figure 5 shows the actual data for higher shape parameter (β) values (6.27) obtained using the graphite mold for Al2O3, which was cast in steel, and for minimum one (4.79), which was for SiC casted in steel; the higher value is observed clearly. The Weibull distribution function curves were very important to understand the probability survival trends, which in all cases has the same trend, but with the graphite mold it gives more stability as it has higher values. Also, they help determine the probability of failure at specific stress levels, which was determined as listed in Table 3, where the maximum failure strength predicted was 523.19 MPa established for Al2O3 cast into steel mold. This prediction was similar to that in the experimental results. The probability of survival was shown in Figure 6, in which it was perfectly observed that the casting in graphite mold gives a better fit with the experimental data, both the in case of Al2O3 and SiC particles. It refers to the fact that among the various probability distributions (e.g., normal, lognormal, exponential), the Weibull distribution most accurately represents the pattern of failure or survival observed in the experimental data set. When analyzing reliability and survival data, the survival probability, S(t), represents the chance that a component or material will survive to a certain time (compressive strength) without failure [10].

4.3. Bayesian Model Analysis

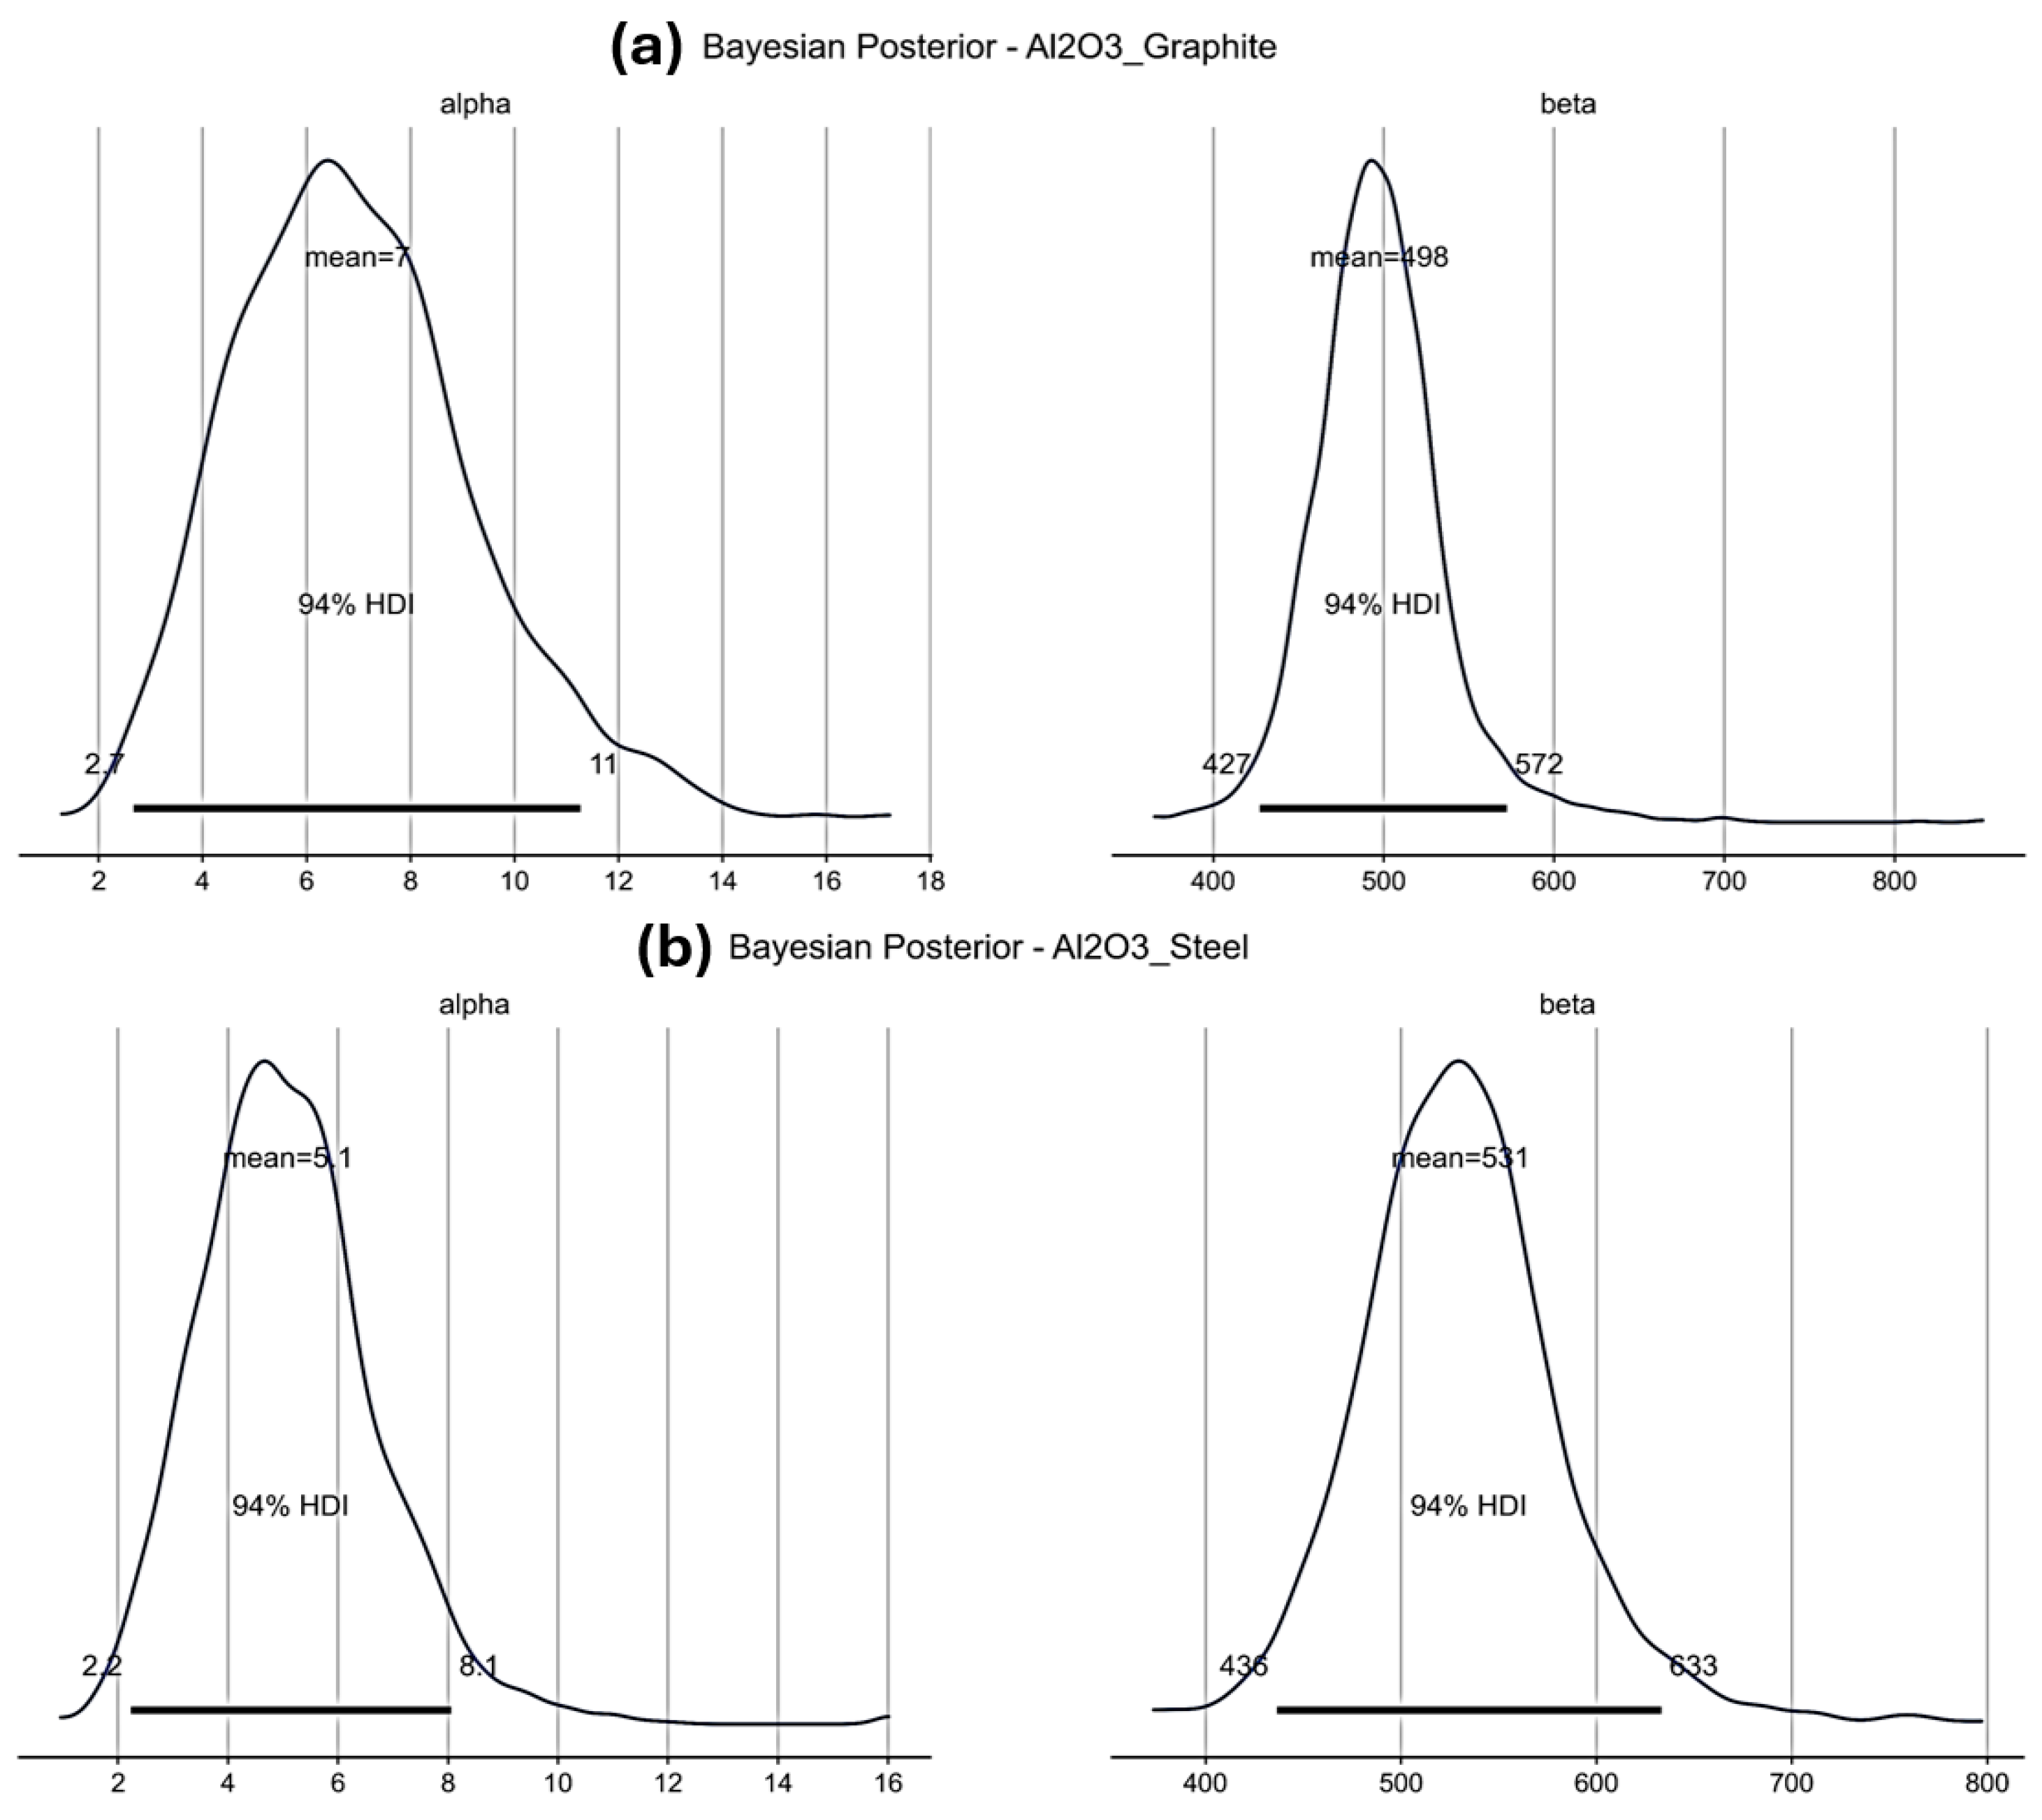
Figure 7 illustrated the Bayesian posterior distribution of the Weibull shape factor (α) and scale factor (β) for aluminum composite reinforced by Al2O3 cast in both steel and graphite. For the group of Al2O3 cast in graphite (Figure 7a), it was observed that the mean shape parameter (α) value was 7, with a 94% highest density interval (HDI) range between 2.7 to 11. The relatively higher value of (α) refers to narrow failure distribution for compressive samples, which indicates good consistent and reliable mechanical performance with minimal scatter in compressive strength, whereas the scale factor of 498 MPa with 94% HDI ranges between 427 MPa to 572 MPa, which reflects the distinguished strength of the material. In contrast, the Al2O3 group cast in steel mold (see Figure 7b) gave lower shape factor (α) of 5.1, with HDI ranges 2.2 to 8.1. This would lead to larger variance of failure and, consequently, greater variability in material behavior. However, the scale factor (β) was higher at 531 with HDI 436 MPa to 633 MPa, which indicates relatively good compressive strength with respect to the graphite mold.
For the group of specimens reinforced by SiC manufactured in the graphite mold, which was shown in Figure 8a, the Bayesian posterior distribution gave a higher shape factor (α) value 8.5, which referred to strength behavior of more reliability and consistency with scale factor (β) 510 MPa through narrow HDI ranges between 446 MPa and 567 MPa. On the other hand, the SiC cast in the steel mold gives a lower shape factor (α) of 5.5, which refers to larger variance in the failure strength, while the scale factor (β) 489 MPa is still similar but in a wider range of HDI between 397 MPa to 576 MPa (see Figure 8b). The observed differences can be attributed to the mold material’s influence on cooling rates and microstructural homogeneity. Graphite molds, with their lower thermal conductivity, facilitate slower cooling and more uniform solidification, leading to enhanced reliability. Conversely, the rapid cooling associated with steel molds promotes thermal gradients, resulting in microstructural inconsistencies that manifest as increased scatter in mechanical properties.

4.4. Comparison of Weibull Distribution Analysis (Classic) with Lifelines and Bayesian Model

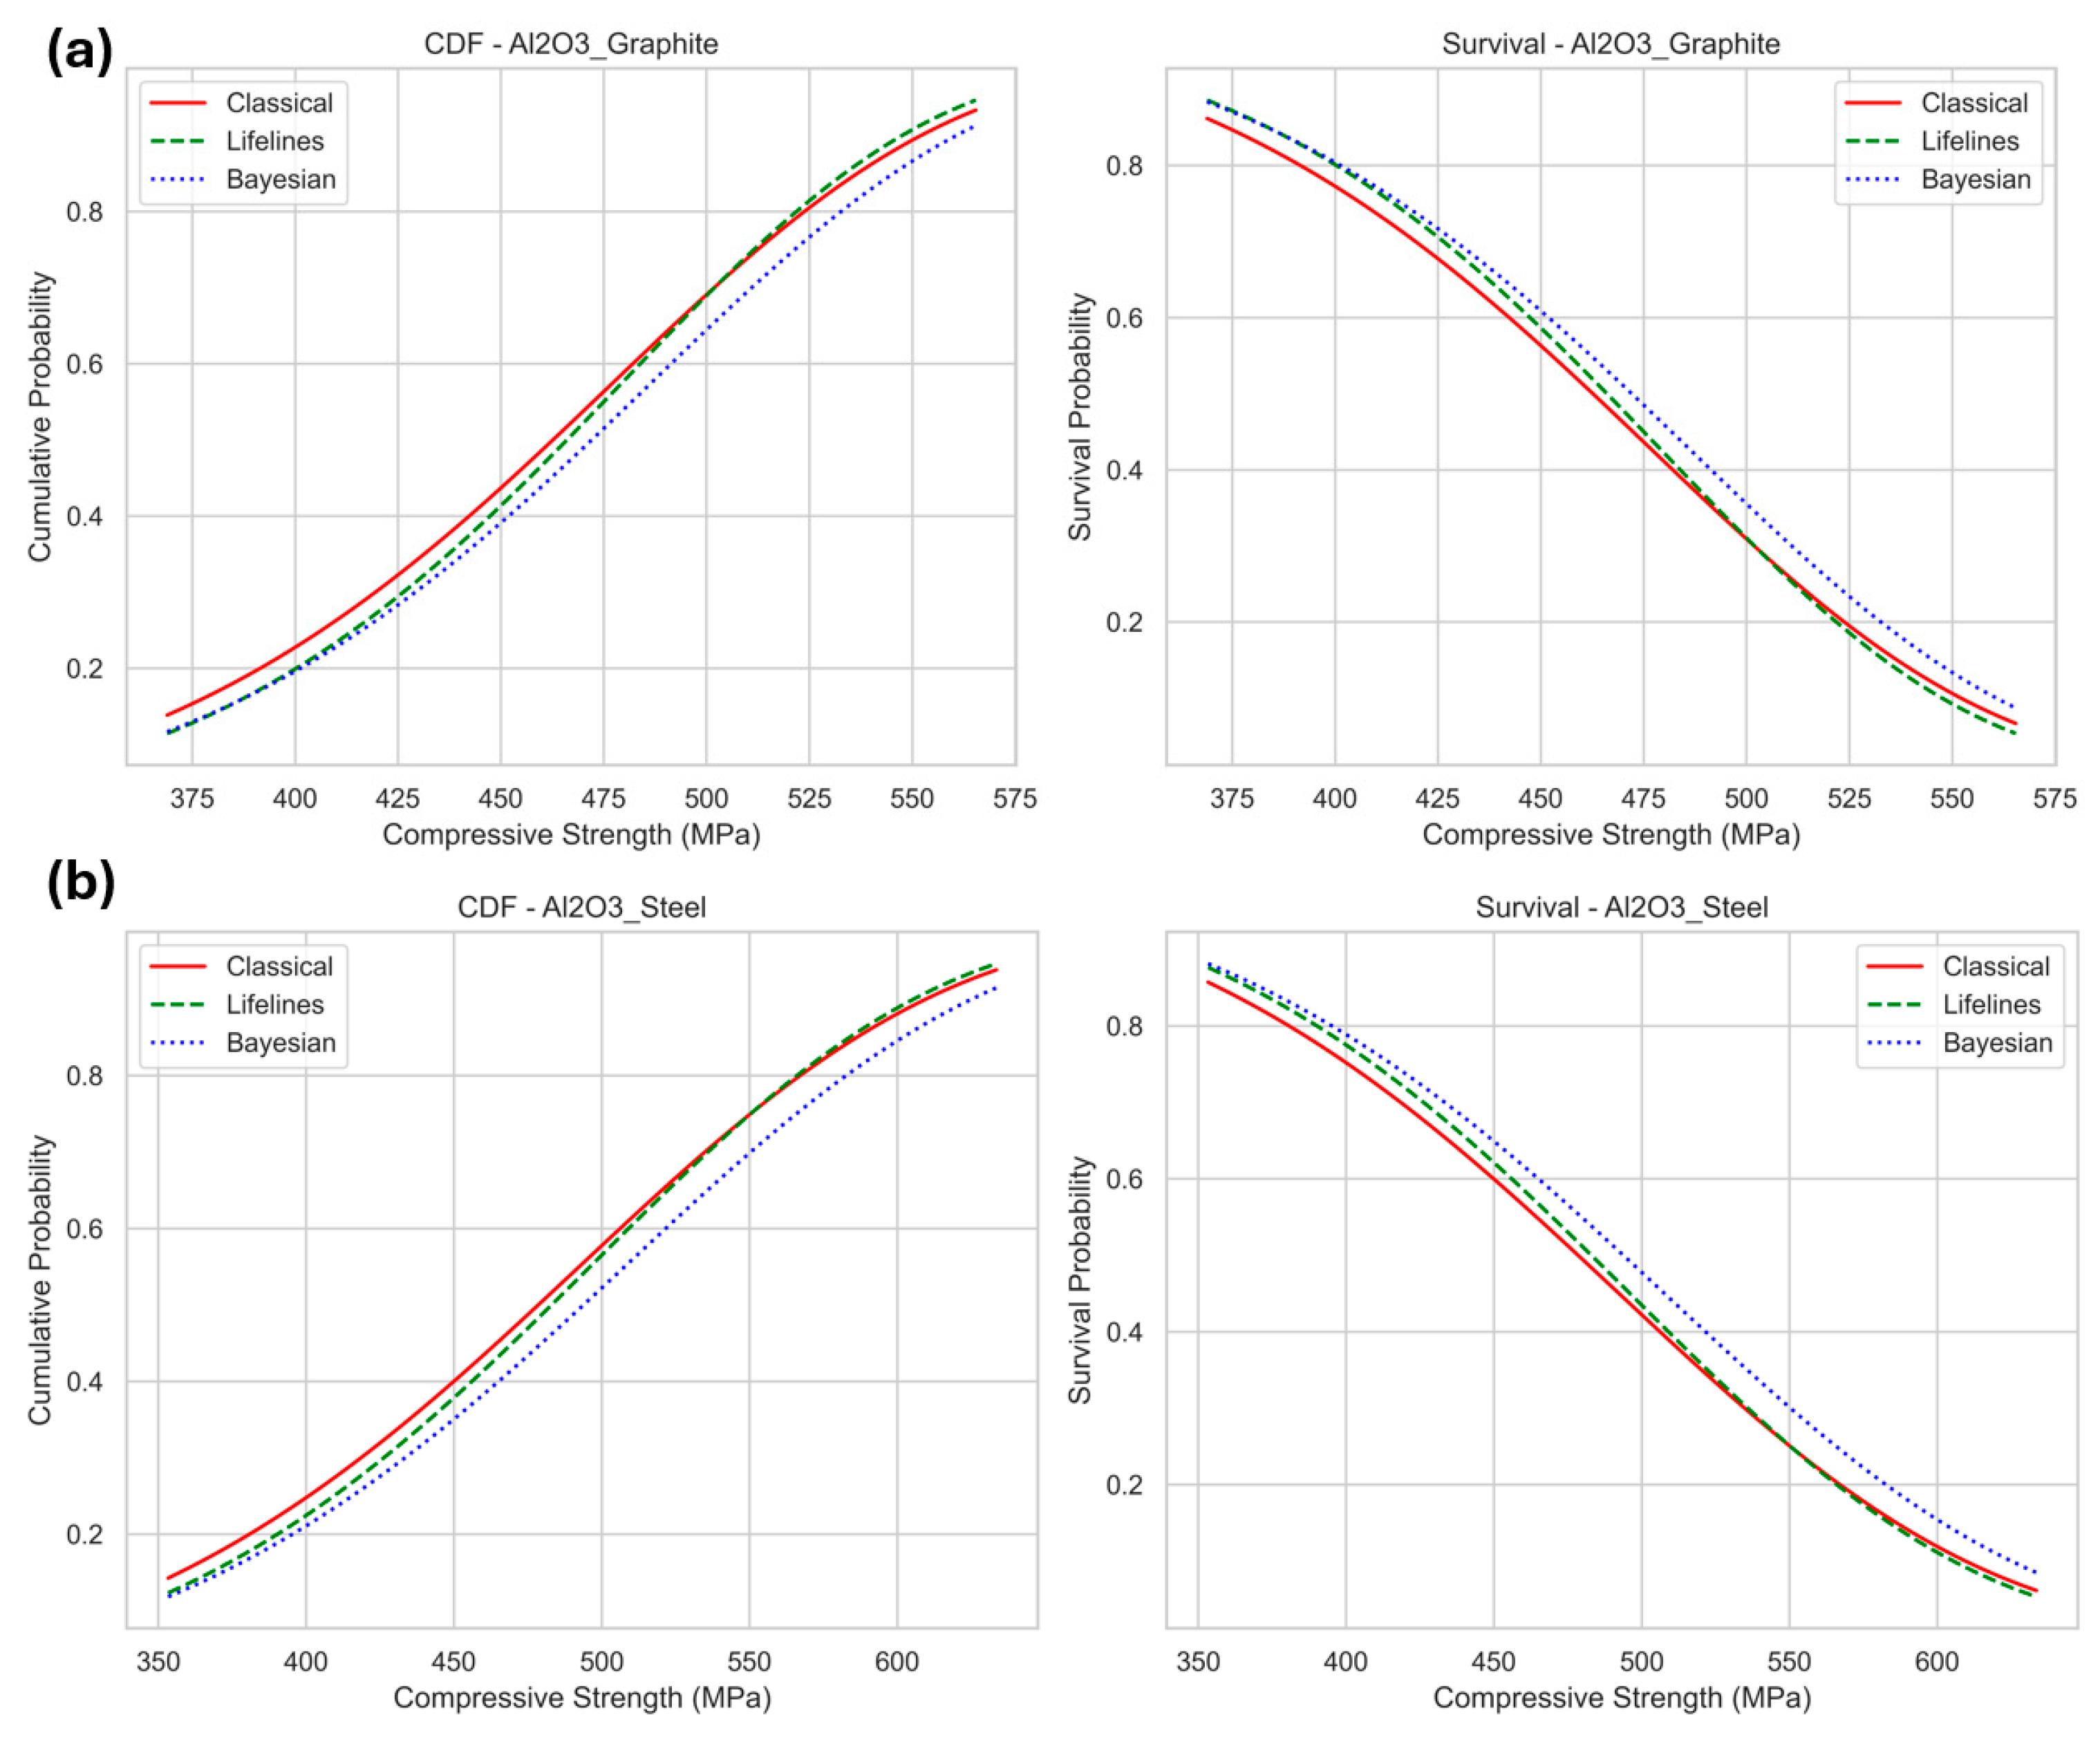
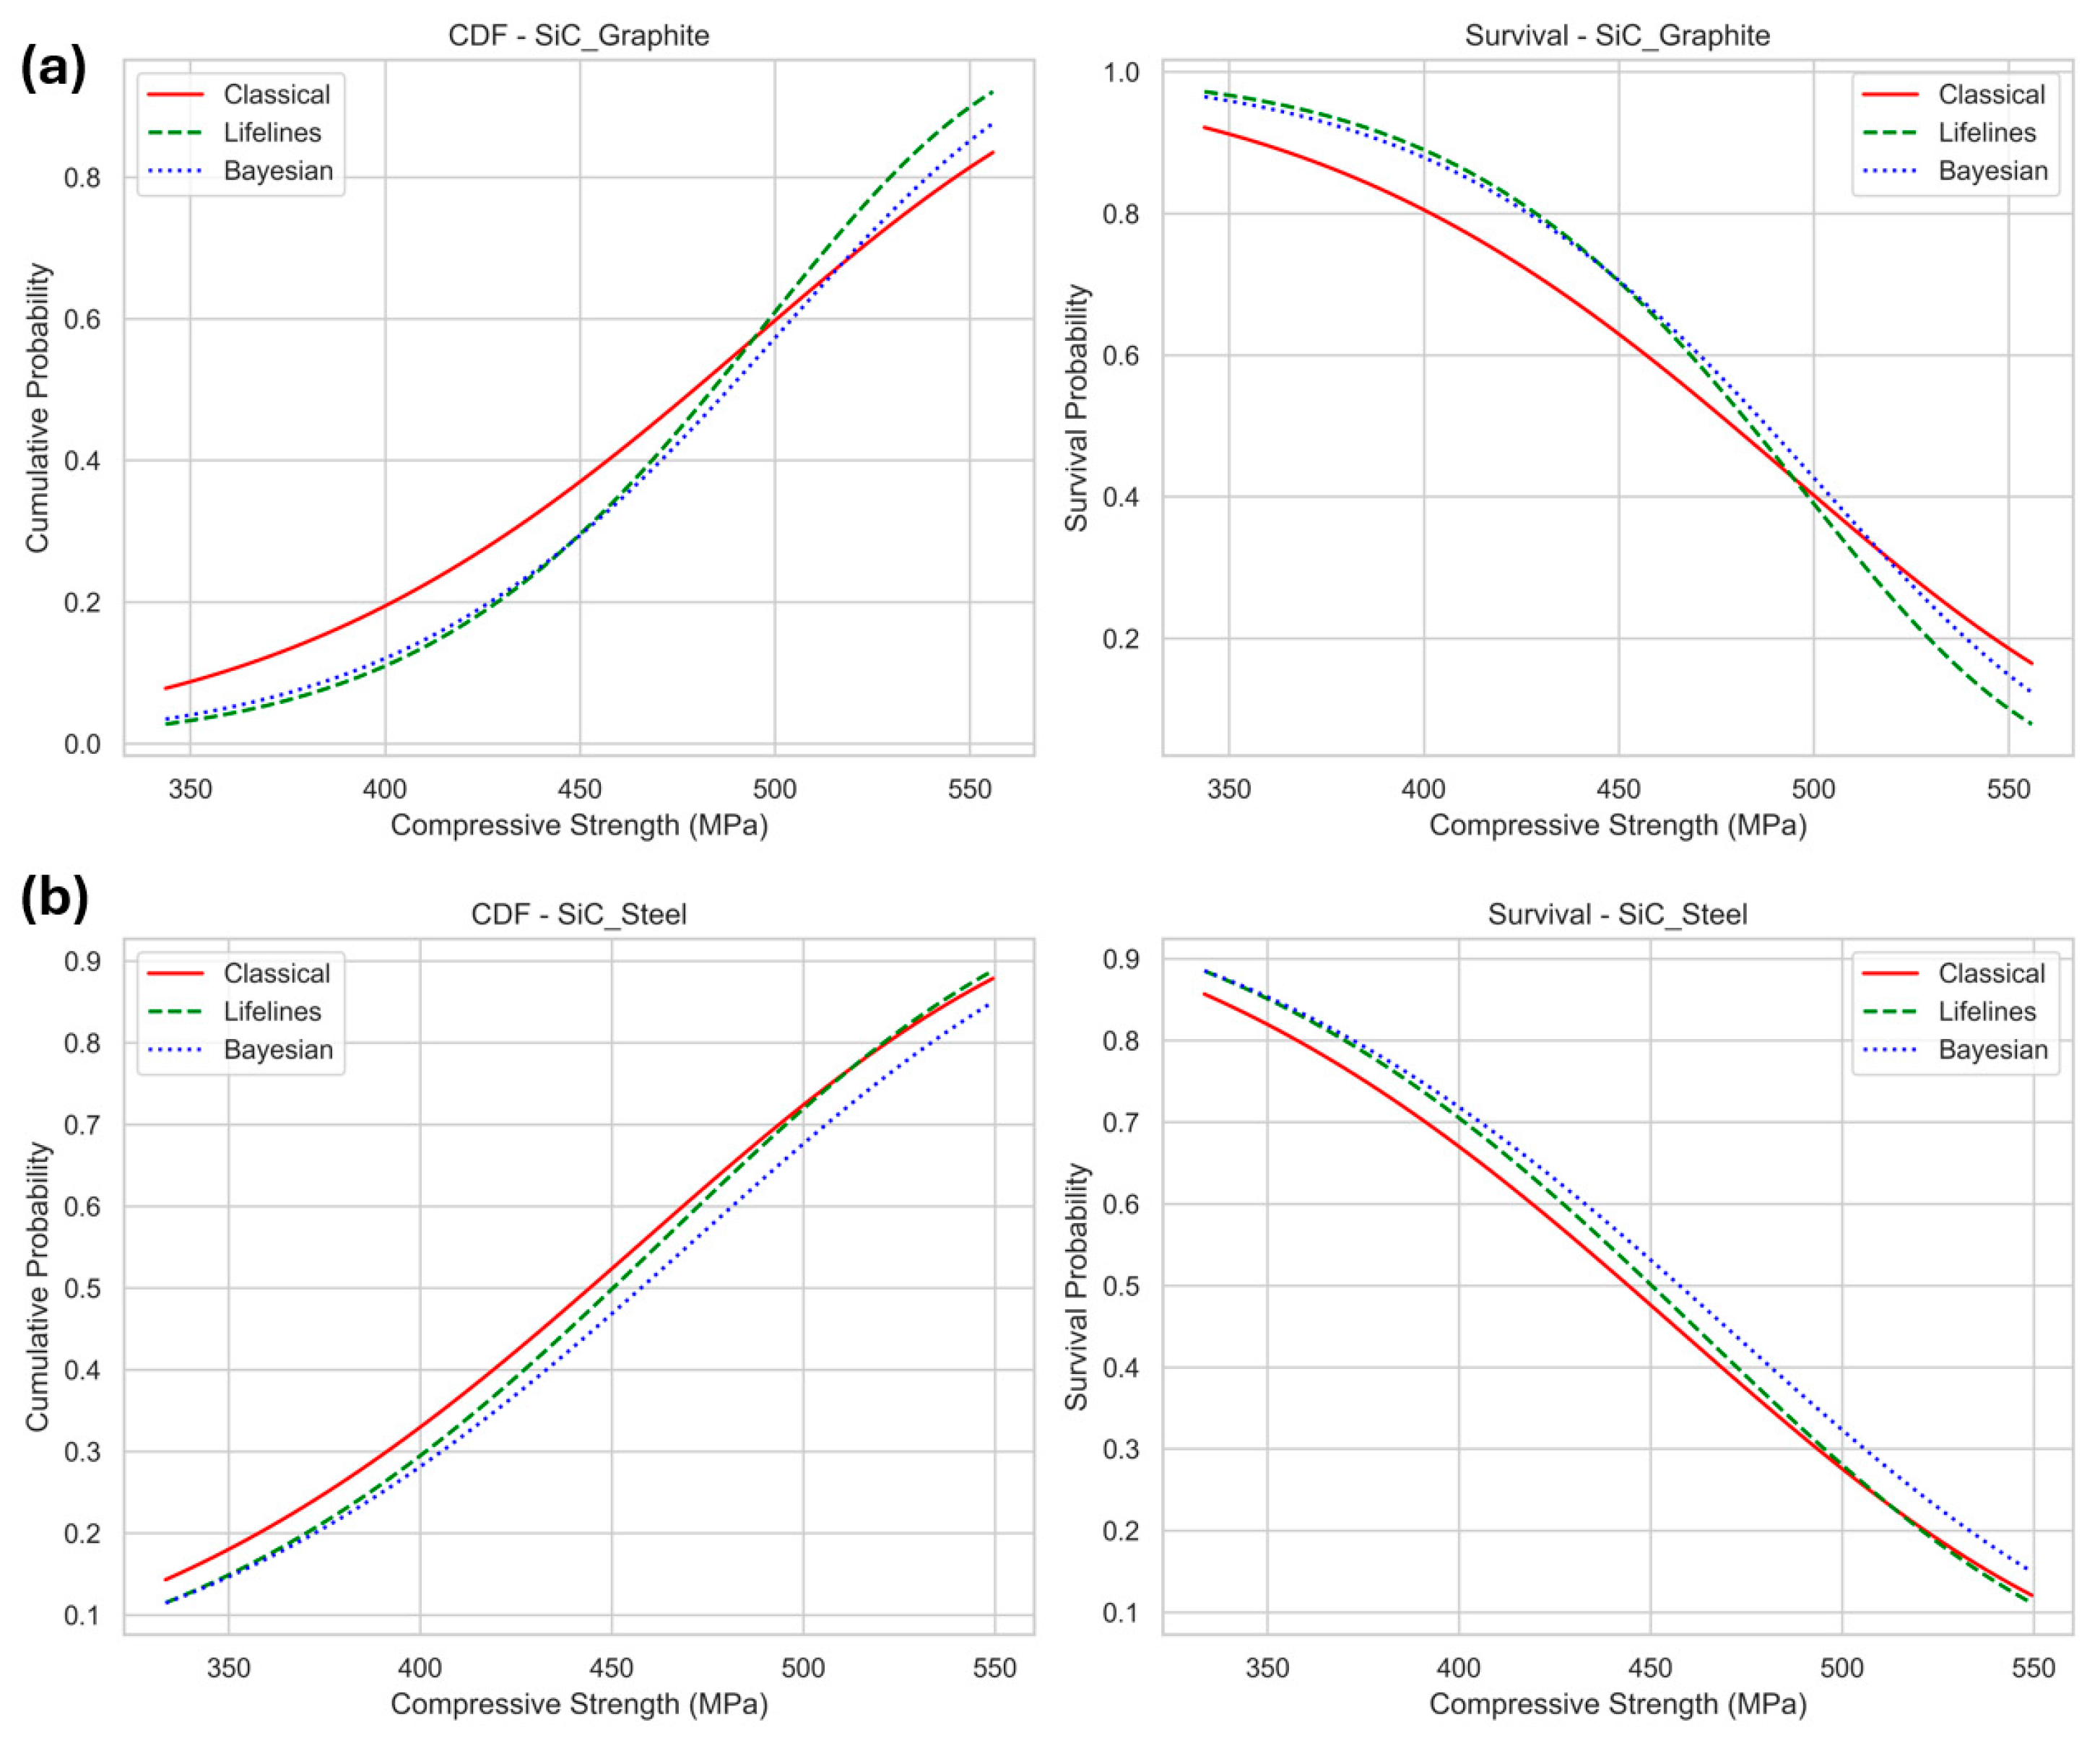
Figure 9a,b shows the CDF and survival curves for the composite of Al2O3 cast in both the graphite mold (Figure 9a) and steel mold (Figure 9b). These curves reveal good agreement between classic Weibull and lifeline distribution models, especially in the range of mild strengths; in contrast, the Bayesian model deviates little where it predicted lower cumulative failure probability at the same level of strength. The Bayesian Survival curves continually suggested a higher survival probability at lower strengths; this represented the prior uncertainty and the small sample size. These observations refer to the robustness of classical Weibull and lifeline models when dealing with small samples, while the Bayesian approach gives a larger probability where it would be useful in design in terms of safety and reliability. The same trend was observed in the case of SiC cast in graphite (Figure 10a) and in steel mold (Figure 10b). It was observed that lifelines and Bayesian models give closer trends while the classic Weibull gives a slightly deviated trend in the case of manufacturing in the graphite mold, while the trend was similar for the steel mold.

5. Conclusions

A composite made of Al-Mg-Si with Al2O3 and SiC particles was created by stir casting in steel and graphite molds. Compression tests and Weibull analyses were conducted. Steel molds yielded higher compressive strength, reaching 623.53 MPa with 8% Al2O3. However, the graphite molds provided more stable and predictable results with a higher Weibull reliability value (β = 6.27 for Al2O3). Graphite molds cooled more slowly due to lower heat transfer, resulting in larger grains that improved flexibility and consistency. In contrast, steel molds cooled faster and formed smaller grains with higher strength but greater fluctuations. Strength measurements in graphite molds, especially with Al2O3, resulted in a tighter consistency. The lowest reliability was found with SiC-reinforced samples from steel molds (β = 4.66), which showed a greater scatter in strength. Weibull modelling showed how the type of mold and choice of particles affected strength and reliability. Although graphite sometimes had lower strength than steel, it was more durable, important for reliable engineering use. Lifelines and Bayesian modelling provided additional information about confidence and uncertainty, but the classical methods were most useful because of their simplicity and consistency with test results. Bayesian analysis helped estimate uncertainty, while lifelines were better for precise values. Together, they support the observed Weibull patterns.

Author Contributions

Conceptualization, M.Y.A. and F.A. methodology, M.Y.A. and F.T.A.; software, M.Y.A., M.K.H. and F.A.; validation, F.T.A.; formal analysis, M.Y.A. and F.A.; investigation, M.Y.A.; resources, F.A.; writing—original draft preparation, M.Y.A. and M.K.H.; writing—review and editing, F.T.A.; supervision, M.Y.A.; project administration, F.A.; funding acquisition, F.A. and M.K.H., All authors have read and agreed to the published version of the manuscript.

Funding

This research received no external funding.

Institutional Review Board Statement

Not applicable.

Data Availability Statement

The original contributions presented in this study are included in the article. Further inquiries can be directed to the corresponding author.

Acknowledgments

During the preparation of this manuscript/study, the authors used [instatext.io, free version and Microsoft copilot, free version] for the purposes of [Editing and grammar]. The authors have reviewed and edited the output and take full responsibility for the content of this publication.

Conflicts of Interest

The authors declare no conflicts of interest.

References

  1. Biswal, S.R.; Sahoo, S. A Comparative Analysis on Physical and Mechanical Properties of Aluminum Composites with AlO and WS Reinforcement. In Recent Advances in Mechanical Engineering; Springer: Berlin/Heidelberg, Germany, 2023; pp. 597–603. [Google Scholar]
  2. Sujatha, S. Valuation of Strength Enhancement in Heat Treated SiC Nanoparticles Reinforced 2024 Aluminum Alloy Metal Matrix Composites Using FEA. Master’s Thesis, College of Engineering, JNT University, Hyderabad, India, 2024. [Google Scholar]
  3. Abdellah, M.Y.; Fadhl, B.M.; El-Ainin, H.M.A.; Hassan, M.K.; Backar, A.H.; Mohamed, A.F. Experimental Evaluation of Mechanical and Tribological Properties of Segregated Al-Mg-Si Alloy Filled with Alumina and Silicon Carbide through Different Types of Casting Molds. Metals 2023, 13, 316. [Google Scholar] [CrossRef]
  4. Lee, S.; Suh, D.; Kwon, D. Microstructure and fracture of SiC-particulate-reinforced cast A356 aluminum alloy composites. Metall. Mater. Trans. A 1996, 27, 3893–3901. [Google Scholar] [CrossRef]
  5. Chakrapani, P.; Suryakumari, T. Mechanical properties of aluminium metal matrix composites—A review. Mater. Today Proc. 2021, 45, 5960–5964. [Google Scholar] [CrossRef]
  6. Girimurugan, R.; Pugazhenthi, R.; Suresh, T.; Maheskumar, P.; Vairavel, M. Prediction of mechanical properties of hybrid aluminium composites. Mater. Today Proc. 2021, 39, 712–716. [Google Scholar] [CrossRef]
  7. Sugimura, Y.; Suresh, S. Effects of sic content on fatigue crack growth in aluminum alloys reinforced with SiC particles. Metall. Trans. A 1992, 23, 2231–2242. [Google Scholar] [CrossRef]
  8. Kumar, G.V.; Panigrahy, P.P.; Nithika, S.; Pramod, R.; Rao, C. Assessment of mechanical and tribological characteristics of Silicon Nitride reinforced aluminum metal matrix composites. Compos. Part B Eng. 2019, 175, 107138. [Google Scholar] [CrossRef]
  9. Tiryakioğlu, M. Weibull analysis of mechanical data for castings II: Weibull mixtures and their interpretation. Metall. Mater. Trans. A 2015, 46, 270–280. [Google Scholar] [CrossRef]
  10. Khashaba, U. Fatigue and reliability analysis of unidirectional GFRP composites under rotating bending loads. J. Compos. Mater. 2003, 37, 317–331. [Google Scholar] [CrossRef]
  11. Cohen, D. Application of reliability and fiber probabilistic strength distribution concepts to composite vessel burst strength design. J. Compos. Mater. 1992, 26, 1984–2014. [Google Scholar] [CrossRef]
  12. Yang, J.; Liu, B.; Shu, D.; Li, H.; Yang, Q.; Hu, T.; Wang, Z.; Zeng, Y.; Huang, J.; Tang, X. Effect of ultra vacuum assisted high pressure die casting on the mechanical properties of Al-Si-Mn-Mg alloy. J. Alloys Compd. 2025, 1026, 180531. [Google Scholar] [CrossRef]
  13. Skejić, D.; Dokšanović, T.; Čudina, I.; Mazzolani, F.M. The basis for reliability-based mechanical properties of structural aluminium alloys. Appl. Sci. 2021, 11, 4485. [Google Scholar] [CrossRef]
  14. Jung, J.; Yoon, J.I.; Park, H.K.; Kim, J.Y.; Kim, H.S. Bayesian approach in predicting mechanical properties of materials: Application to dual phase steels. Mater. Sci. Eng. A 2019, 743, 382–390. [Google Scholar] [CrossRef]
  15. Fernandez-Zelaia, P.; Joseph, V.R.; Kalidindi, S.R.; Melkote, S.N. Estimating mechanical properties from spherical indentation using Bayesian approaches. Mater. Des. 2018, 147, 92–105. [Google Scholar] [CrossRef]
  16. Sun, G.; Li, Z.; Jiao, Y.; Wang, Q. Application of Bayesian Statistics in Analyzing and Predicting Carburizing-Induced Dimensional Changes in Torsion Bars. Metals 2025, 15, 546. [Google Scholar] [CrossRef]
  17. Vafadar, F.; Collins, S.; Fink, G. Bayesian modeling of finger joints’ tensile and bending properties considering censored data. Eur. J. Wood Prod. 2025, 83, 110. [Google Scholar] [CrossRef]
  18. Yang, J.; Liu, B.; Shu, D.; Li, H.; Yang, Q.; Hu, T.; Wang, Z.; Zeng, Y.; Haung, J.; Tang, X. Effect of Casting Pressure on Porosity, Microstructure, and Mechanical Properties of Large Die Casting Aluminum Alloy Parts. Int. J. Met. 2025, 1–15. [Google Scholar] [CrossRef]
  19. Wang, S.; Tokgoz, A.; Huang, Y.; Zhang, Y.; Feng, J.; Sastry, P.; Sun, C.; Figg, N.; Lu, Q.; Sutcliffe, M.P.F. Bayesian inference-based estimation of normal aortic, aneurysmal and atherosclerotic tissue mechanical properties: From material testing, modeling and histology. IEEE Trans. Biomed. Eng. 2019, 66, 2269–2278. [Google Scholar] [CrossRef] [PubMed]
  20. Hashim, J. The production of cast metal matrix composite by a modified stir casting method. J. Teknol. (Sci. Eng.) 2001, 35, 9–20. [Google Scholar] [CrossRef]
  21. Aqida, S.N.; Ghazali, M.I.; Hashim, J. Effect of porosity on mechanical properties of metal matrix composite: An overview. J. Teknol. (Sci. Eng.) 2004, 40, 17–32. [Google Scholar] [CrossRef]
  22. Ravichandran, M.; Meignanamoorthy, M.; Chellasivam, G.P.; Vairamuthu, J.; Kumar, A.S.; Stalin, B. Effect of Stir Casting Parameters on Properties of Cast Metal Matrix Composite. Mater. Today Proc. 2020, 22, 2606–2613. [Google Scholar] [CrossRef]
  23. Morsiya, C.; Pandya, S. EffEct of stir caSting ProcESS ParamEtErS and StirrEr BladE gEometry on mEchanical ProPErtiES of al mmcS—A Review. Arch. Metall. Mater. 2023, 68, 1473–1495. [Google Scholar] [CrossRef]
  24. Gugulothu, B.; Nagarajan, N.; Pradeep, A.; Saravanan, G.; Vijayakumar, S.; Rao, J.; Vijayan, V. Analysis of Mechanical Properties for Al-MMC Fabricated through an Optimized Stir Casting Process. J. Nanomater. 2022, 2022, 2081189. [Google Scholar] [CrossRef]
  25. Baisane, V.; Sable, Y.; Dhobe, M.; Sonawane, P. Recent development and challenges in processing of ceramics reinforced Al matrix composite through stir casting process: A Review. Int. J. Eng. Appl. Sci. 2015, 2, 257814. [Google Scholar]
  26. Aqida, S.; Ghazali, M.; Hashim, J. The effects of stirring speed and reinforcement particles on porosity formation in cast MMC. J. Mech. 2003, 16, 22–30. [Google Scholar]
  27. Sajjadi, S.; Ezatpour, H.; Beygi, H. Microstructure and mechanical properties of Al–Al2O3 micro and nano composites fabricated by stir casting. Mater. Sci. Eng. A 2011, 528, 8765–8771. [Google Scholar] [CrossRef]
  28. Alam, M.T.; Ansari, A.H. X-ray diffraction analysis and microstructural examination of al-sic composite fabricated by stir casting. Int. J. Sci. Technol. Manag. 2015, 4, 941–956. [Google Scholar]
  29. Kaufman, J.G. Introduction to Aluminum Alloys and Tempers; ASM International: Almere, The Netherlands, 2000. [Google Scholar]
  30. Ei-Aini, H.A.; Mohamed, K.; Mohammed, Y.H. Effect of mold types and cooling rate on mechanical properties of Al alloy 6061 within ceramic additives. In Proceedings of the 2nd International Conference on Energy Engineering ICEE-2, Manama, Bahrain, 18–22 December 2010. [Google Scholar]
  31. Hassan, M.K.; Mohammed, Y.; Abu, E. Improvement of Al-6061 alloys mechanical properties by controlling processing parameters. Int. J. Mech. Mechatron. Eng. 2012, 12, 14–18. [Google Scholar]
  32. Kaczmar, J.; Pietrzak, K.; Włosiński, W. The production and application of metal matrix composite materials. J. Mater. Process. Technol. 2000, 106, 58–67. [Google Scholar] [CrossRef]
  33. Anyalebechi, P.N. Analysis of the effects of alloying elements on hydrogen solubility in liquid aluminum alloys. Scr. Metall. Et Mater. 1995, 33, 1209–1216. [Google Scholar] [CrossRef]
  34. ASTM, E. Standard Test Methods of Compression Testing of Metallic Materials at Room Temperature; ASTM International: West Conshohocken, PA, USA, 2000; pp. 98–105. [Google Scholar]
  35. Tanimoto, T.; Amijima, S.; Ishikawa, H. A reliability analysis approach to fatigue life dispersion of laminated glass fiber composite materials. Mech. Behav. Mater. 1980, 207–216. [Google Scholar]
  36. NN_Developer. Logic to Caluclate Shape and Scale Parameter in Survival Analysis. Available online: https://stats.stackexchange.com/questions/618645/logic-to-caluclate-shape-and-scale-parameter-in-survival-analysis (accessed on 13 June 2023).
  37. The PyMC Development Team. Weibull Distribution—PyMC v5.10.1 Documentation. 2024. Available online: https://www.pymc.io/projects/docs/en/v5.10.1/api/distributions/generated/pymc.Weibull.html (accessed on 1 August 2025).
  38. Data Camp. Probability Distributions in Python. Available online: https://projector-video-pdf-converter.datacamp.com/25923/chapter3.pdf (accessed on 28 July 2025).
  39. Lawless, J.F. Statistical Models and Methods for Lifetime Data; John Wiley & Sons: Hoboken, NJ, USA, 2011. [Google Scholar]
  40. Liang, G.; Ali, Y.; You, G.; Zhang, M.-X. Effect of cooling rate on grain refinement of cast aluminium alloys. Materialia 2018, 3, 113–121. [Google Scholar] [CrossRef]
  41. Barbero, E.; Fernández-Sáez, J.; Navarro, C. Statistical analysis of the mechanical properties of composite materials. Compos. Part B Eng. 2000, 31, 375–381. [Google Scholar] [CrossRef]
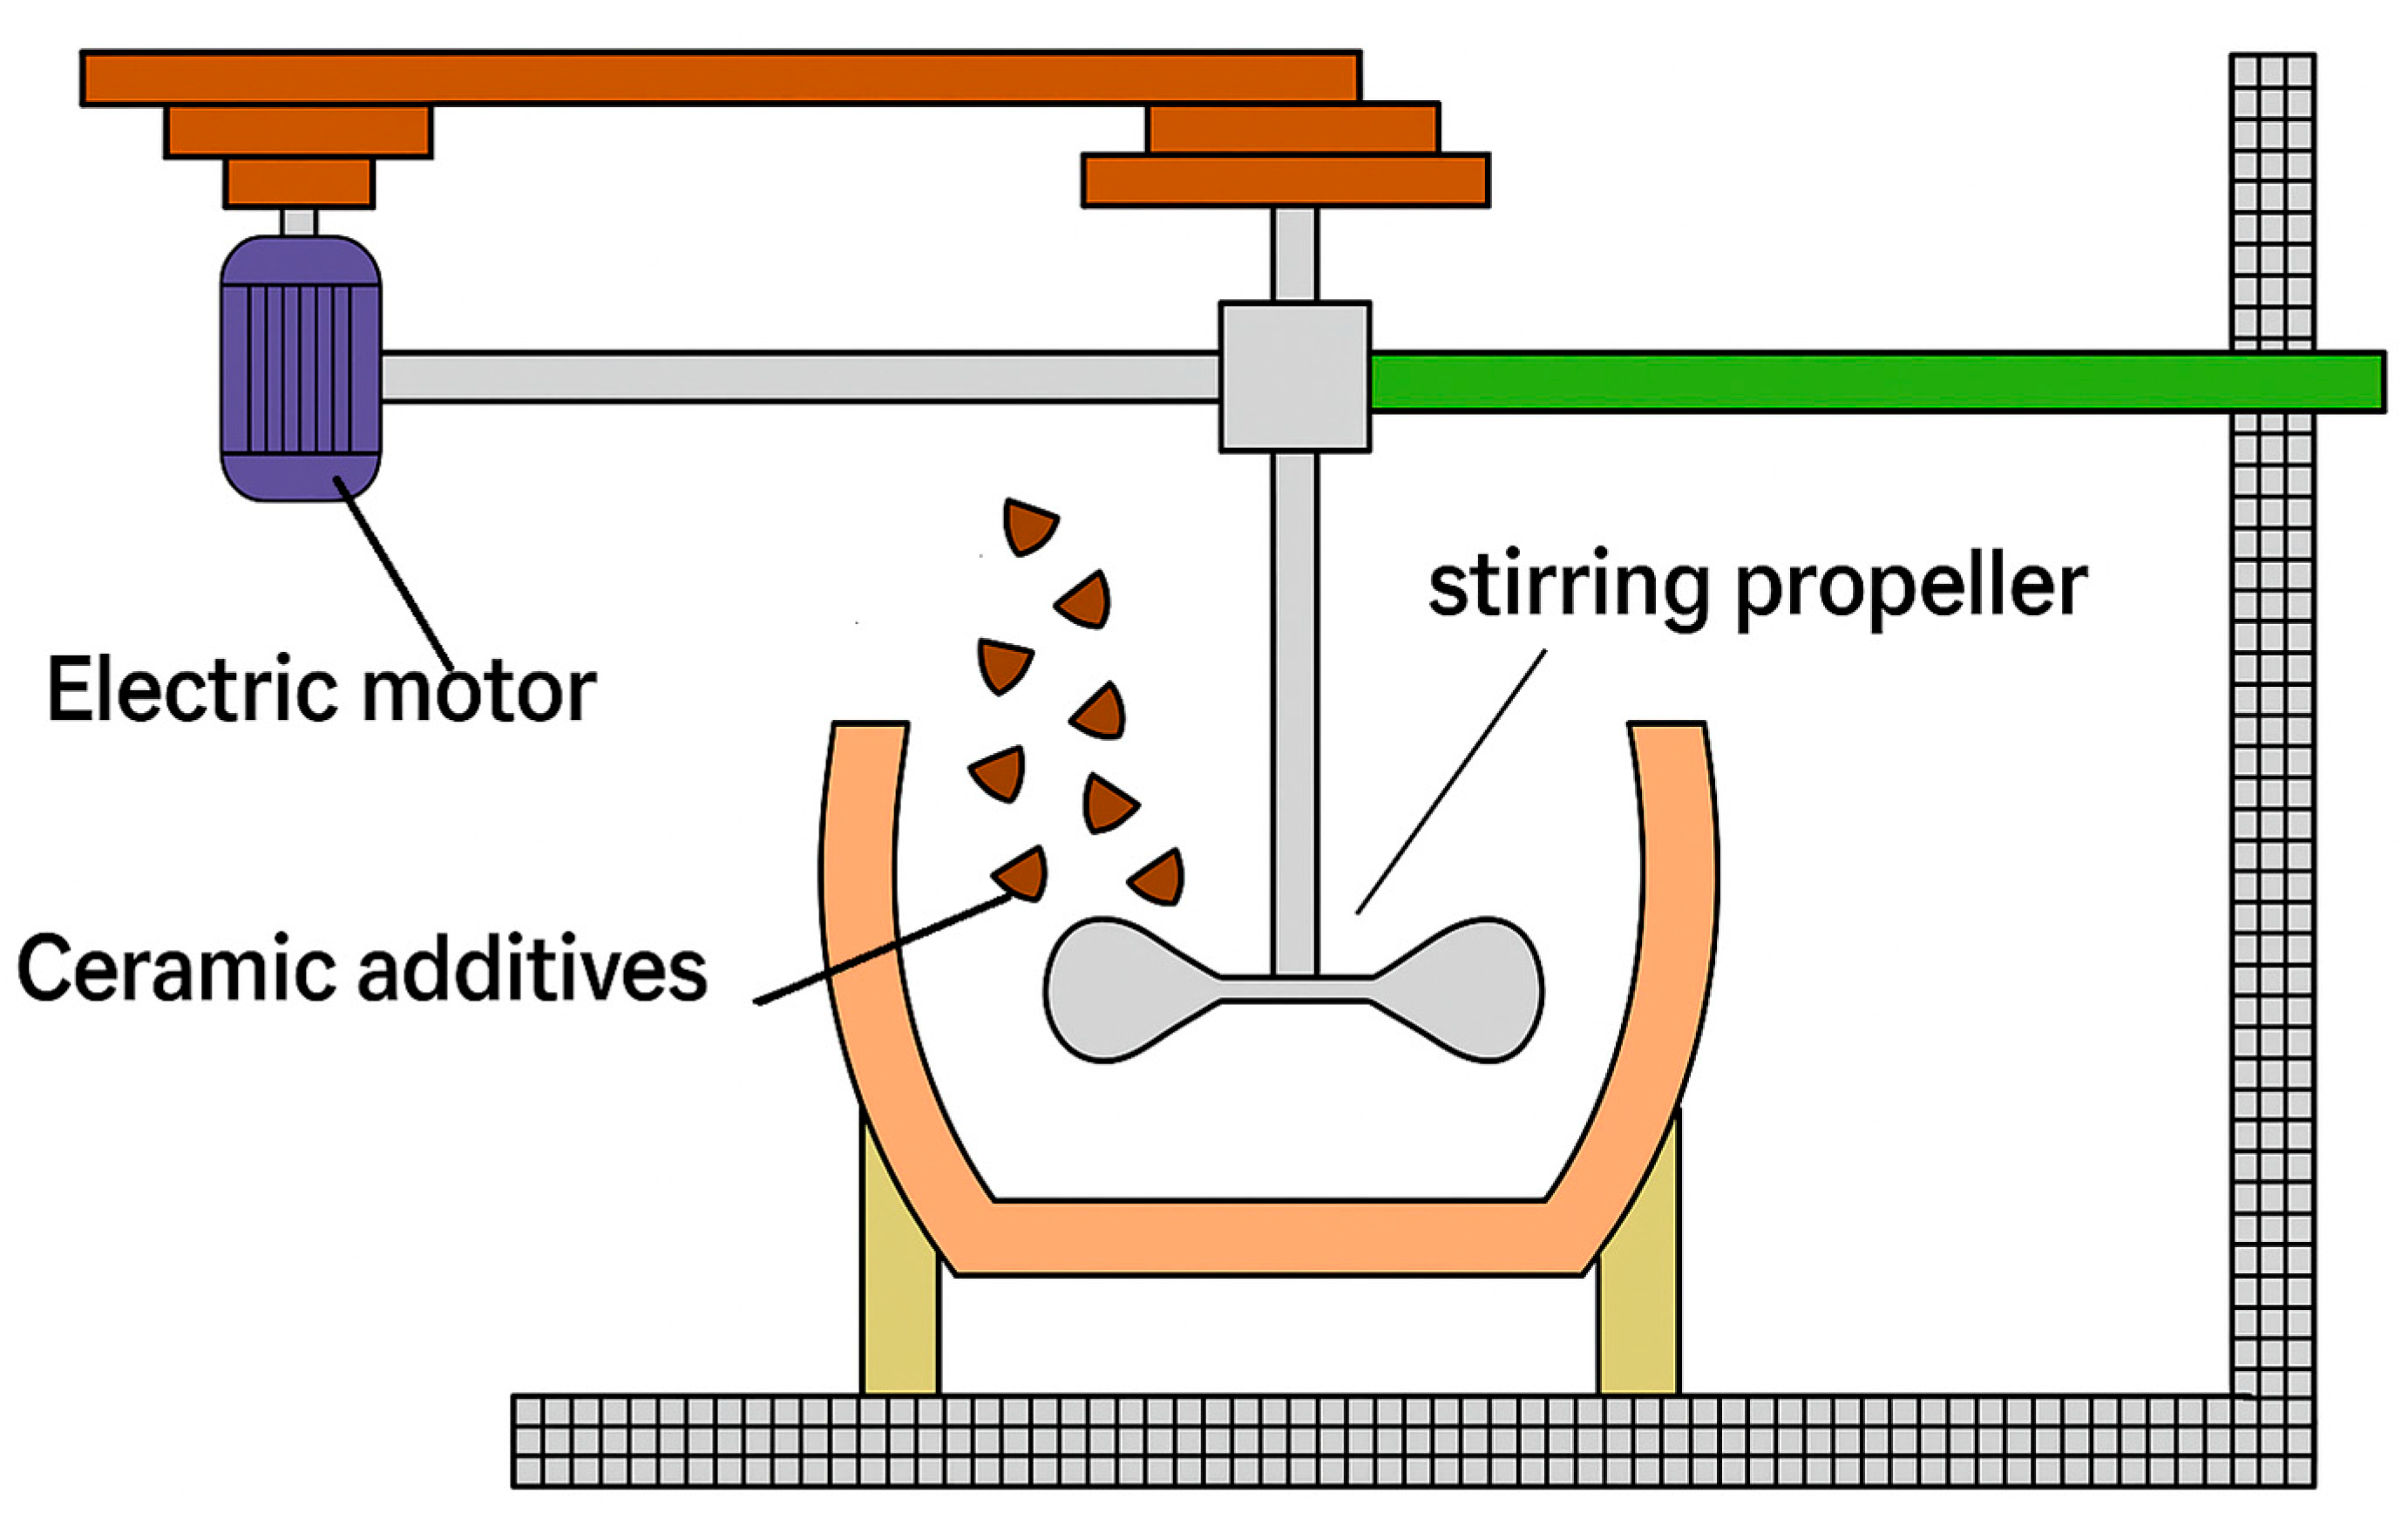
Figure 1. Schematic drawing of stir casting setup.
Crystals 15 00791 g001
Figure 2. Different types of casting molds: (a) H13 steel alloy, (b) synthetic graphite.
Crystals 15 00791 g002
Figure 3. Compressive strength (MPa) of composites with varying wt.% additives for different molds and reinforcement types: (a) graphite mold—bar chart, (b) steel mold—bar chart, (c) graphite mold—line chart, and (d) steel mold—line chart.
Crystals 15 00791 g003
Figure 4. Compressive strength linear Weibull distribution; (a) graphite Al2O3, (b) graphite SiC, (c) Steel Al2O3, and (d) steel SiC.
Crystals 15 00791 g004
Figure 5. Comparison of Weibull PDF for graphite versus steel mold casting.
Crystals 15 00791 g005
Figure 6. Probability survival versus compressive strength for different reinforcement; (a) Al2O3, (b) SiC.
Crystals 15 00791 g006
Figure 7. Bayesian posterior for Al2O3 cast; (a) graphite, (b) steel.
Crystals 15 00791 g007
Figure 8. Bayesian posterior for SiC cast; (a) graphite, (b) steel.
Crystals 15 00791 g008
Figure 9. Comparison of Weibull distribution models for Al2O3 at (a) graphite, (b) steel.
Crystals 15 00791 g009
Figure 10. Comparison of Weibull distribution models for SiC at (a) graphite, (b) steel.
Crystals 15 00791 g010
Table 1. Compression test results (graphite mold).
Wt.% Additivesσ (Al2O3) (MPa)SDV (Al2O3)%Error (Al2O3)σ (SiC) (MPa)SDV (SiC)%Error (SiC)% Height Reduction (Al2O3)% Height Reduction (SiC)
0504.889.065.23504.885.235.233939
0.5378.8727.0715.62411.7226.3215.1930.734.8
1530.371.060.61545.923.371.9547.739
2409.3017.279.97373.3614.548.3926.826.8
3387.6918.3010.50353.610.90.522919.7
4555.4329.1216.81525.983.72.1354.449.7
8491.8526.4015.29519.6112.307.1041.943.1
Table 2. Compression test results (steel mold).
Wt.% Additivesσ (Al2O3) (MPa)SDV (Al2O3)%Error (Al2O3)σ (SiC) (MPa)SDV (SiC)%Error (SiC)% Height Reduction (Al2O3)% Height Reduction (SiC)
0513.3030.0717.36513.3130.0717.3652.652.6
0.5396.8532.6418.82370.5722.3112.8834.338.1
1513.295.913.42519.1225.7314.864648.6
2384.731.811.04343.669.185.304230.5
3363.2913.567.80343.502.581.493825.8
4574.7719.0811.02539.4616.939.775059.8
8623.5324.9914.42537.653.592.074134.4
Table 3. Comparison of Weibull parameters for graphite and steel molds.
MaterialMold TypeShape βScale η (MPa)R2 (Goodness of Fit)Interpretation
Al2O3Graphite6.27497.020.911Narrow failure distribution, more uniform strength, better reliability
SiCGraphite5.49497.340.911
Al2O3Steel4.66523.190.912
SiCSteel4.79490.090.821Wider failure distribution → more scatter in strength, less consistent performance
Disclaimer/Publisher’s Note: The statements, opinions and data contained in all publications are solely those of the individual author(s) and contributor(s) and not of MDPI and/or the editor(s). MDPI and/or the editor(s) disclaim responsibility for any injury to people or property resulting from any ideas, methods, instructions or products referred to in the content.