Article

Investigating the Influence of Cerium Doping on the Structural, Optical, and Electrical Properties of ZnCexCo2xO4 Zinc Cobaltite Thin Films

1
Materials, Systems and Energy Engineering Laboratory (MaSEEL), Department of Physics, Faculty of Sciences and Technology of Tangier, Abdelmalek Essaadi University, Tetouan 90040, Morocco
2
Laboratory of Materials Physics and Subatomic (LMPS), Department of Physics, Faculty of Science, Ibn Tofail University, Kenitra 14000, Morocco
3
Laboratory of Chemical Engineering and Valorization of Resources, Faculty of Sciences and Techniques, Abdelmalek Essaadi University, Tangier 93000, Morocco
*
Author to whom correspondence should be addressed.
Crystals 2025, 15(8), 742; https://doi.org/10.3390/cryst15080742
Submission received: 21 July 2025 / Revised: 11 August 2025 / Accepted: 16 August 2025 / Published: 20 August 2025
(This article belongs to the Special Issue Advances in Thin-Film Materials and Their Applications)

Abstract

Cerium-doped zinc cobaltite spinel thin films, Z n C e x C o 2 x O 4   ( 0.00 x 0.05 ) , were synthesized via spray pyrolysis, and their structural, morphological, optical, and electrical properties were analyzed. X-ray diffraction (XRD) confirmed a cubic spinel structure with a predominant (311) orientation across all compositions. Raman spectroscopy further verified this phase, revealing four active vibrational modes at 180 cm−1, 470 cm−1, 515 cm−1, and 682 cm−1. Scanning electron microscopy (SEM) indicated a uniform grain distribution, while energy-dispersive X-ray spectroscopy (EDS) confirmed the presence of Ce, Zn, Co, and O. Optical measurements revealed two distinct bandgaps, decreasing from 2.32 eV to 2.20 eV for the lower-energy transition and from 3.38 eV to 3.18 eV for the higher-energy transition. Hall effect measurements confirmed p-type conductivity in all films. Electrical analysis showed a reduction in resistivity, from 280.3 Ω·cm to 15.4 Ω·cm, along with an increase in carrier concentration from 1.15 × 1016 cm−3 to 8.15 × 1017 cm−3 with higher Ce content. These results demonstrate that spray pyrolysis is a cost-effective and scalable method for producing Ce-doped ZnCo2O4 thin films with tunable properties, making them suitable for electronic and optoelectronic applications.

1. Introduction

Nanosized metal oxide complexes have attracted significant attention for their broad applications in various technological fields. These semiconductor-based nanomaterials exhibit unique properties, such as a high surface-to-volume ratio, quantum confinement effects, enhanced reaction kinetics, and interparticle interactions [1,2]. Among them, mixed oxide spinels are particularly notable for their applications in electrical, electrochemical, optoelectronic, and magnetoelectronic devices [3,4]. Spinel oxides are widely utilized in solid oxide fuel cells (SOFCs), energy conversion systems, lithium-ion batteries, supercapacitors, and gas and oxygen sensors [5,6,7,8]. These heterometallic oxides can be synthesized using various methods, including co-precipitation, combustion, sol–gel synthesis, sputtering, electrodeposition, and hydrothermal techniques [9,10,11,12,13]. Among these, spray pyrolysis stands out due to its simplicity, cost-effectiveness, scalability, and environmental friendliness. Among binary metal oxide spinels such as NiCo2O4 [14], CuCo2O4 [15], MnCo2O4 [16], and FeCo2O4 [17], zinc cobaltite (ZnCo2O4) has gained attention due to its tunable structure and promising chemical, electrical, magnetic, and electrochemical properties [18]. ZnCo2O4 exhibits high oxygen ion conductivity, making it a suitable electrolyte material for SOFCs. Its properties can be further optimized through controlled cation doping [19]. Zinc cobaltite has a normal spinel structure where Zn2+ ions occupy tetrahedral sites and Co3+ ions reside in octahedral sites. The coexistence of these cations, along with dopants, enables multiple oxidation states, enhancing charge transport and electrical conductivity, making it a viable interconnect material for SOFCs [18]. Its physical and chemical properties depend on synthesis methods, charge carrier distribution, ion occupancy, dopant type, and concentration. Rare-earth-doped ZnCo2O4 nanomaterials (Nd, Sm, Gd, Dy, Y) have been investigated using chemical and physical synthesis techniques. A correlation has been observed between the ionic radius of the dopant and the structural and electrical properties of ZnCo2O4. The ionic radius gradually decreases from neodymium (0.983 Å) to samarium (0.958 Å), gadolinium (0.938 Å), dysprosium (0.912 Å), and finally yttrium (0.900 Å), with these microstructural variations influencing material characteristics [20]. For the first time, Ce-doped ZnCo2O4 thin films have been synthesized on glass substrates using spray pyrolysis. The interaction between unpaired 3d electrons of transition metals and 4f orbitals of rare-earth elements significantly impacts electrical properties. Rare-earth ions preferentially occupy octahedral (B) sites, partially substituting Co3+ ions due to their larger ionic radii. However, exceeding the solubility limit can lead to the formation of an additional orthorhombic phase (RCoO3), hindering electron transfer between Co3+ and Co2+ ions [21]. Rare-earth doping induces lattice strain due to the larger ionic radii of rare-earth ions compared to Co3+, Co2+, and Zn2+. This B-site substitution leads to structural distortions, significantly influencing the electrical properties of the spinel matrix, highlighting the importance of dopant selection in tailoring material characteristics [22].
In this work, XRD analysis confirms the formation of single-phase Ce-doped ZnCo2O4 thin films, with no secondary phases detected, indicating efficient Ce incorporation within the solubility limit of the spinel lattice. This highlights the effectiveness of spray pyrolysis in producing homogeneous rare-earth-doped spinel structures within a short processing time. Although many studies have examined doped ZnCo2O4 prepared by chemical routes for applications in photocatalysis, supercapacitors, and gas sensing, investigations on Ce-doped ZnCo2O4 thin films with electrical properties evaluated by Hall effect remain limited. Moreover, the effect of Ce incorporation on the electrical properties of spinel cobaltites has not yet been thoroughly investigated. This study provides new insights to help bridge this research gap.

2. Materials and Methods

Z n C e x C o 2 x O 4   ( 0.00 x 0.05 ) thin films were synthesized via spray pyrolysis. A 0.05 M aqueous solution of Zn(NO3)2·6H2O and Co(NO3)2·6H2O in a 1:2 molar ratio served as the precursor for ZnCo2O4 deposition, while Ce(NO3)2·6H2O was used as the Ce source for doping. Solutions with varying Ce concentrations (x = 0.0, 0.01, 0.03, and 0.05) were mixed with the precursor and stirred for 3–5 min to achieve homogeneity. Before deposition, glass substrates were sequentially cleaned in HCl, ethanol, acetone, and distilled water for 15 min each and then dried using an air stream. The homogeneous solution was sprayed onto preheated glass substrates at 450 °C (Figure 1). The process was optimized with a 40 cm spray-tip distance, a constant flow rate of 1.5 mL/min, and an 8 min spraying duration. The substrate temperature was crucial in ensuring proper decomposition of the solution, leading to high-quality ZnCexCo2-xO4 thin films with strong adhesion.
The crystal structure of Z n C e x C o 2 x O 4   ( x   =   0.0 ,   0.01 ,   0.03 ,   0.05 ) thin films was examined via X-ray diffraction (XRD) using Cu Kα radiation on a Bruker D8 Advance Eco diffractometer. Raman spectroscopy, performed with a Bruker Senterra spectrometer and a 532 nm diode laser, further verified the structural characteristics. Surface morphology and elemental composition were analyzed using a QUATTRO S-FEG scanning electron microscope (SEM) equipped with energy-dispersive X-ray spectroscopy (EDX). Optical properties, including absorbance, transmittance, and bandgap energy, were determined from UV–Vis-NIR transmission spectra obtained with a SHIMADZU UV–Vis–NIR spectrophotometer. Electrical properties were assessed through Hall effect measurements at room temperature.

3. Results

3.1. XRD Analysis

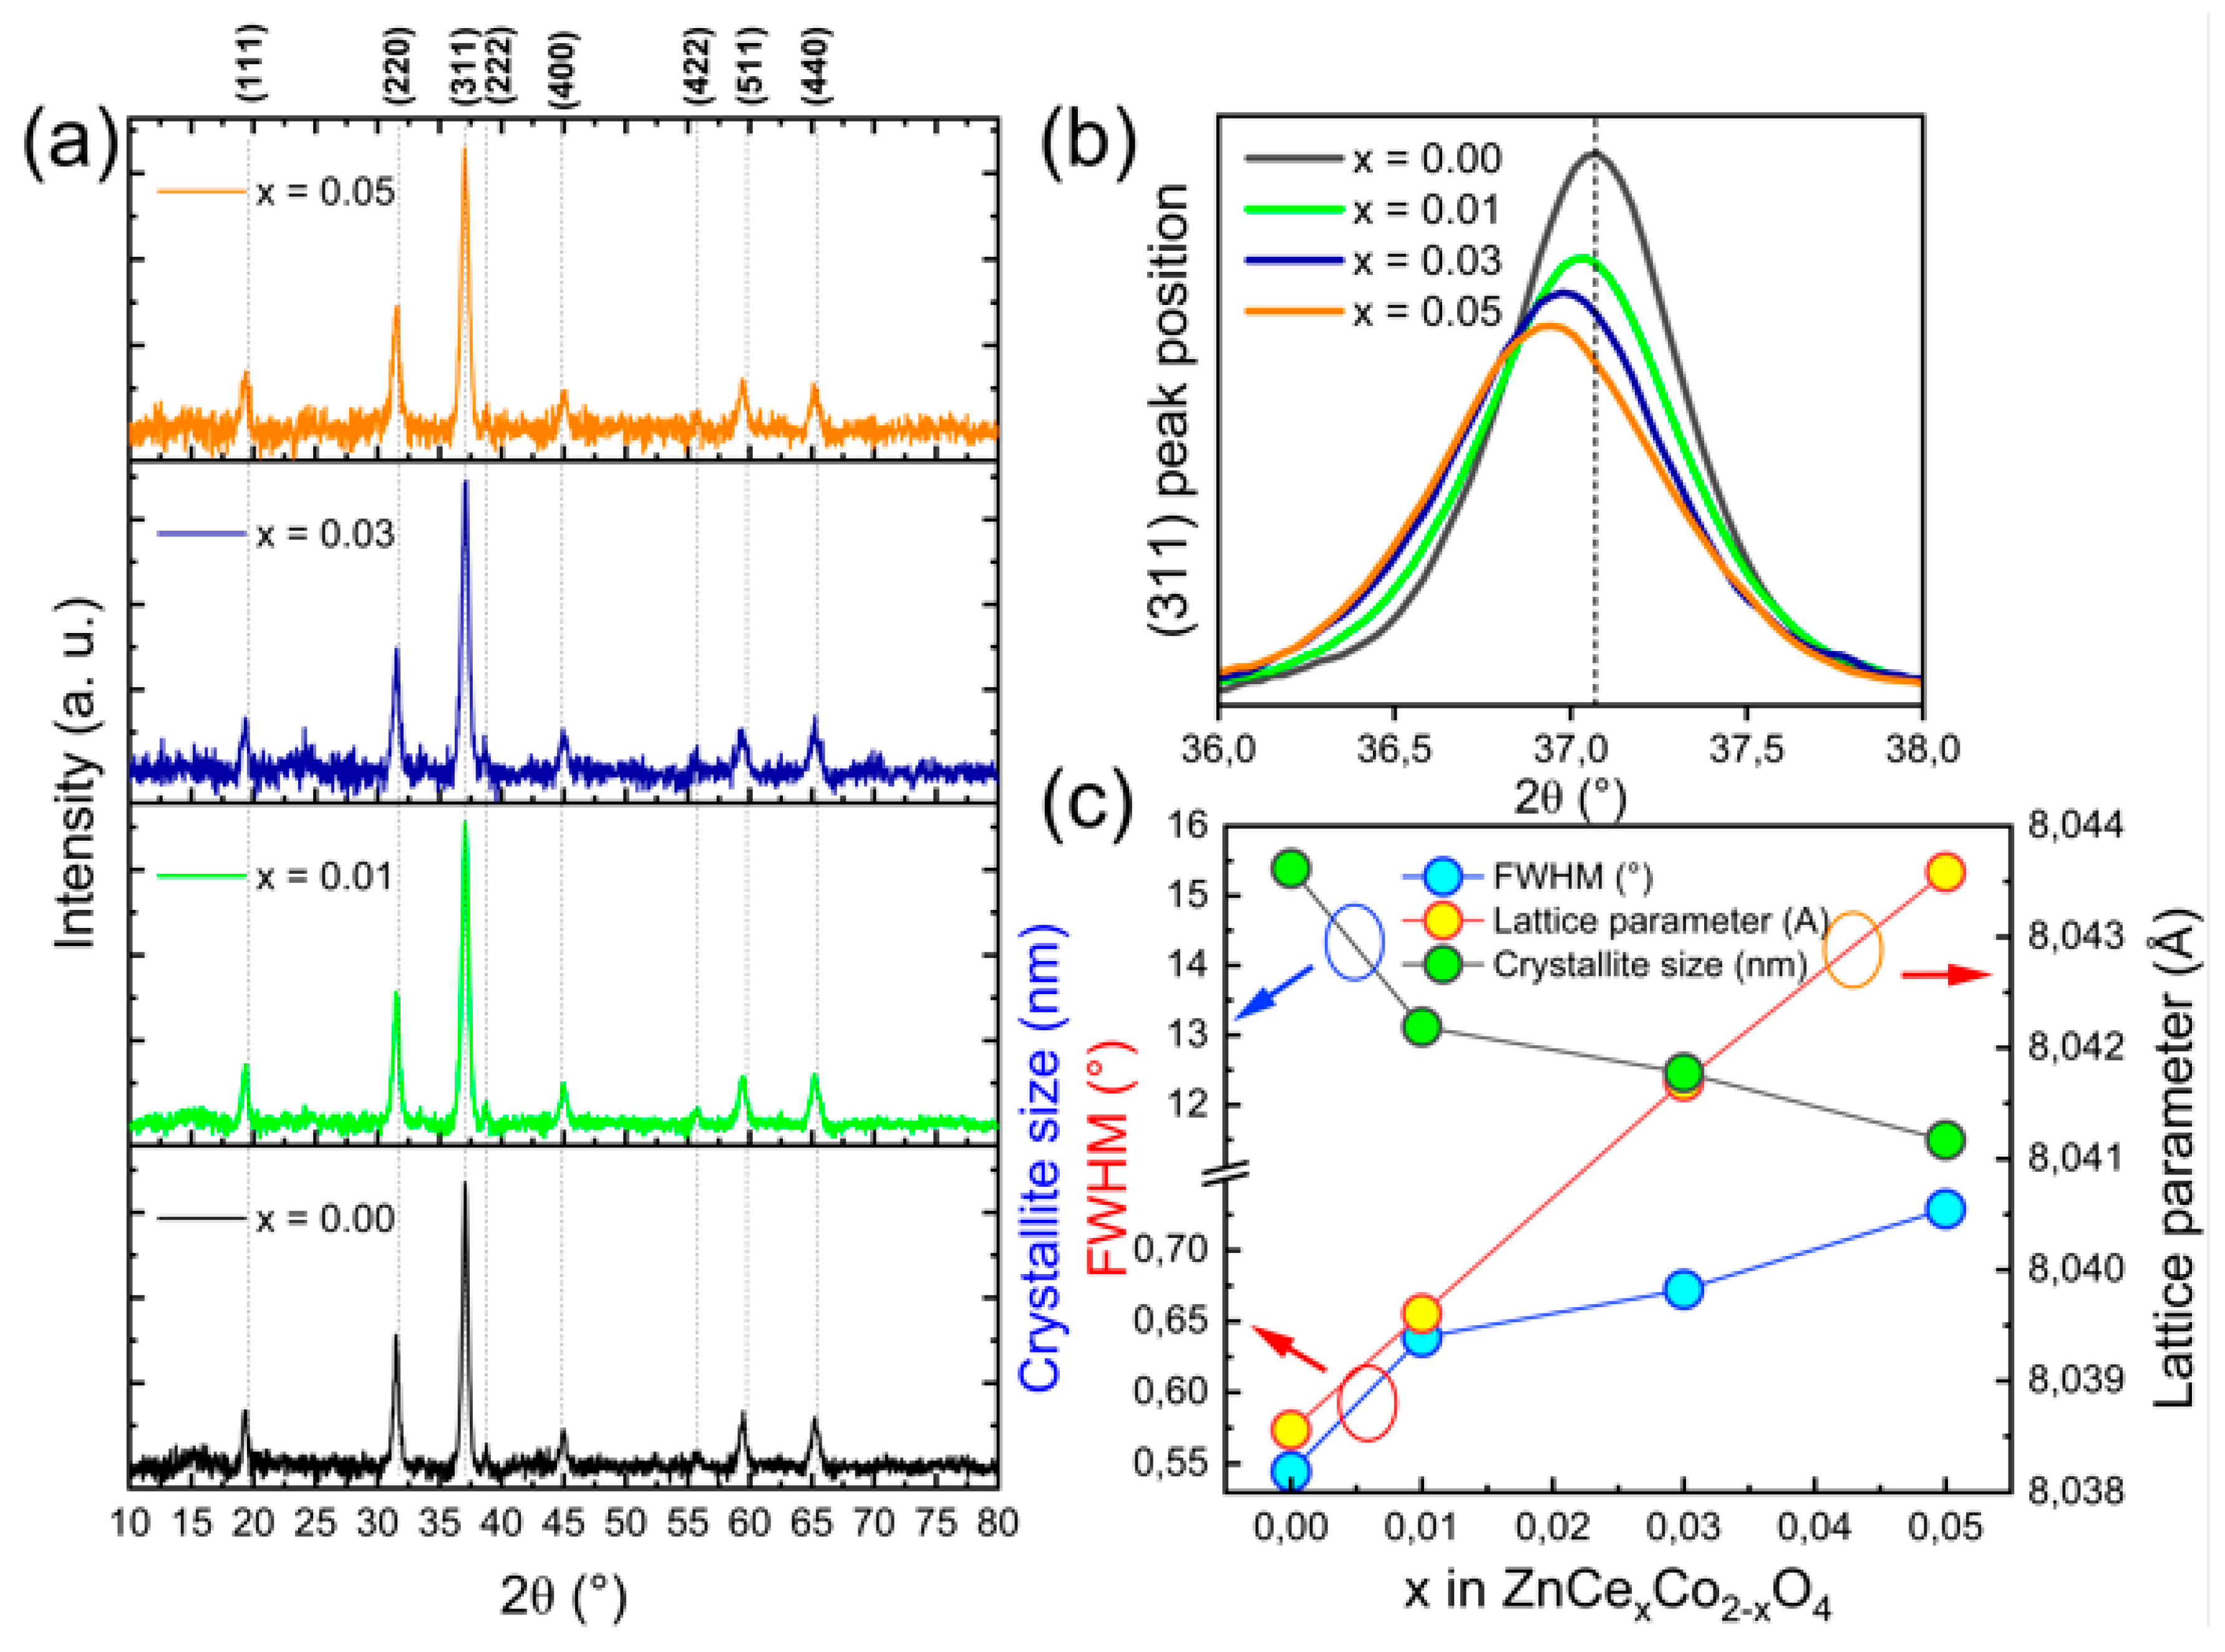
The X-ray diffraction (XRD) patterns of Z n C e x C o 2 x O 4   ( x   =   0.0 ,   0.01 ,   0.03 ,   0.05 ) samples, shown in Figure 2a, align with the JCPDS database (file no. 23-1390) [23] within the 2θ range of 10° to 80°, confirming the formation of a single-phase cubic spinel ZnCo2O4 structure. The absence of secondary peaks in Ce-doped samples indicates the successful incorporation of Ce ions without disrupting the spinel structure. The sharp, intense diffraction peaks reflect the high crystallinity of both undoped and Ce-doped ZnCo2O4. The diffraction peaks at 2θ values of 18.94°, 31.23°, 36.81°, 38.49°, 44.78°, 55.63°, 59.29°, and 65.21° correspond to the (111), (220), (311), (222), (400), (422), (511), and (440) planes, confirming the spinel ZnCo2O4 structure (space group: Fd-3m) [24]. These reflections confirm the polycrystalline nature and nanocrystalline character of the thin films. As shown in Figure 2c, increasing Ce concentration broadens the diffraction peaks, indicating a reduction in crystallite size. The crystallite size was estimated using the Scherrer equation [25]:
D = 0.9 λ β cos θ
where λ is the X-ray wavelength (1.5406 Å), β is the full width at half maximum (FWHM) of the most intense peak (in radians), and θ is the corresponding Bragg angle. The average crystallite size ranged from 15 to 11 nm. This decrease is attributed to structural reorganization and the presence of Ce ions, which reduce the diffusion rate in the synthesized cobaltite, thereby inhibiting nucleation and growth. Previous studies have linked ionic radius differences between host and dopant materials to crystallization hindrance [26].
The substitution of rare-earth elements in ZnCo2O4 influences the lattice parameter. Since Ce ions are larger than Co ions, they are more likely to occupy the B site of the spinel lattice. However, their smaller size introduces lattice strain. The microstrain (ε) was calculated using the Cullity formula [27]:
ε = β cos θ 4
In addition, the lattice constant (a) was determined by using the following equation:
a = λ 2 sin θ h 2 + k 2 + l 2
Here, (hkl) represents the crystal plane (311) that was considered for the calculation of crystallite size, θ represents Bragg’s angle, and λ assumes the wavelength of the X-ray (1.5406 Å). As shown in Table 1 and presented in Figure 2c, the lattice parameter exhibits a clear linear increase with rising Ce content. A linear fit of the lattice parameter versus Ce doping level yields relation (4):
a ( x ) = 8.036 + 0.012 x   ( i n   Å )
with a coefficient of determination R2 = 0.995, confirming an excellent linear correlation. This behavior is consistent with Vegard’s law and confirms the successful incorporation of Ce3+ ions into the Z n C e x C o 2 x O 4 spinel lattice. The observed increase in lattice parameter is attributed to the substitution of Co3+ ions at the octahedral (B) sites by larger Ce3+ ions, in line with their preferential octahedral coordination.
The dislocation density (δ), presented in Table 1, was calculated using expression (5):
δ = 1 D 2
where D is the crystallite size obtained from XRD analysis. This parameter gives an indication of the defect density within the crystal structure. An increase in δ with higher Ce doping levels is observed, which corresponds to the reduction in crystallite size. This trend suggests that the incorporation of Ce3+ ions introduces structural imperfections in the lattice, likely due to local distortions and mismatch effects associated with the ionic size difference between Ce3+ and Co3+ at the octahedral sites.

3.2. Raman Analysis

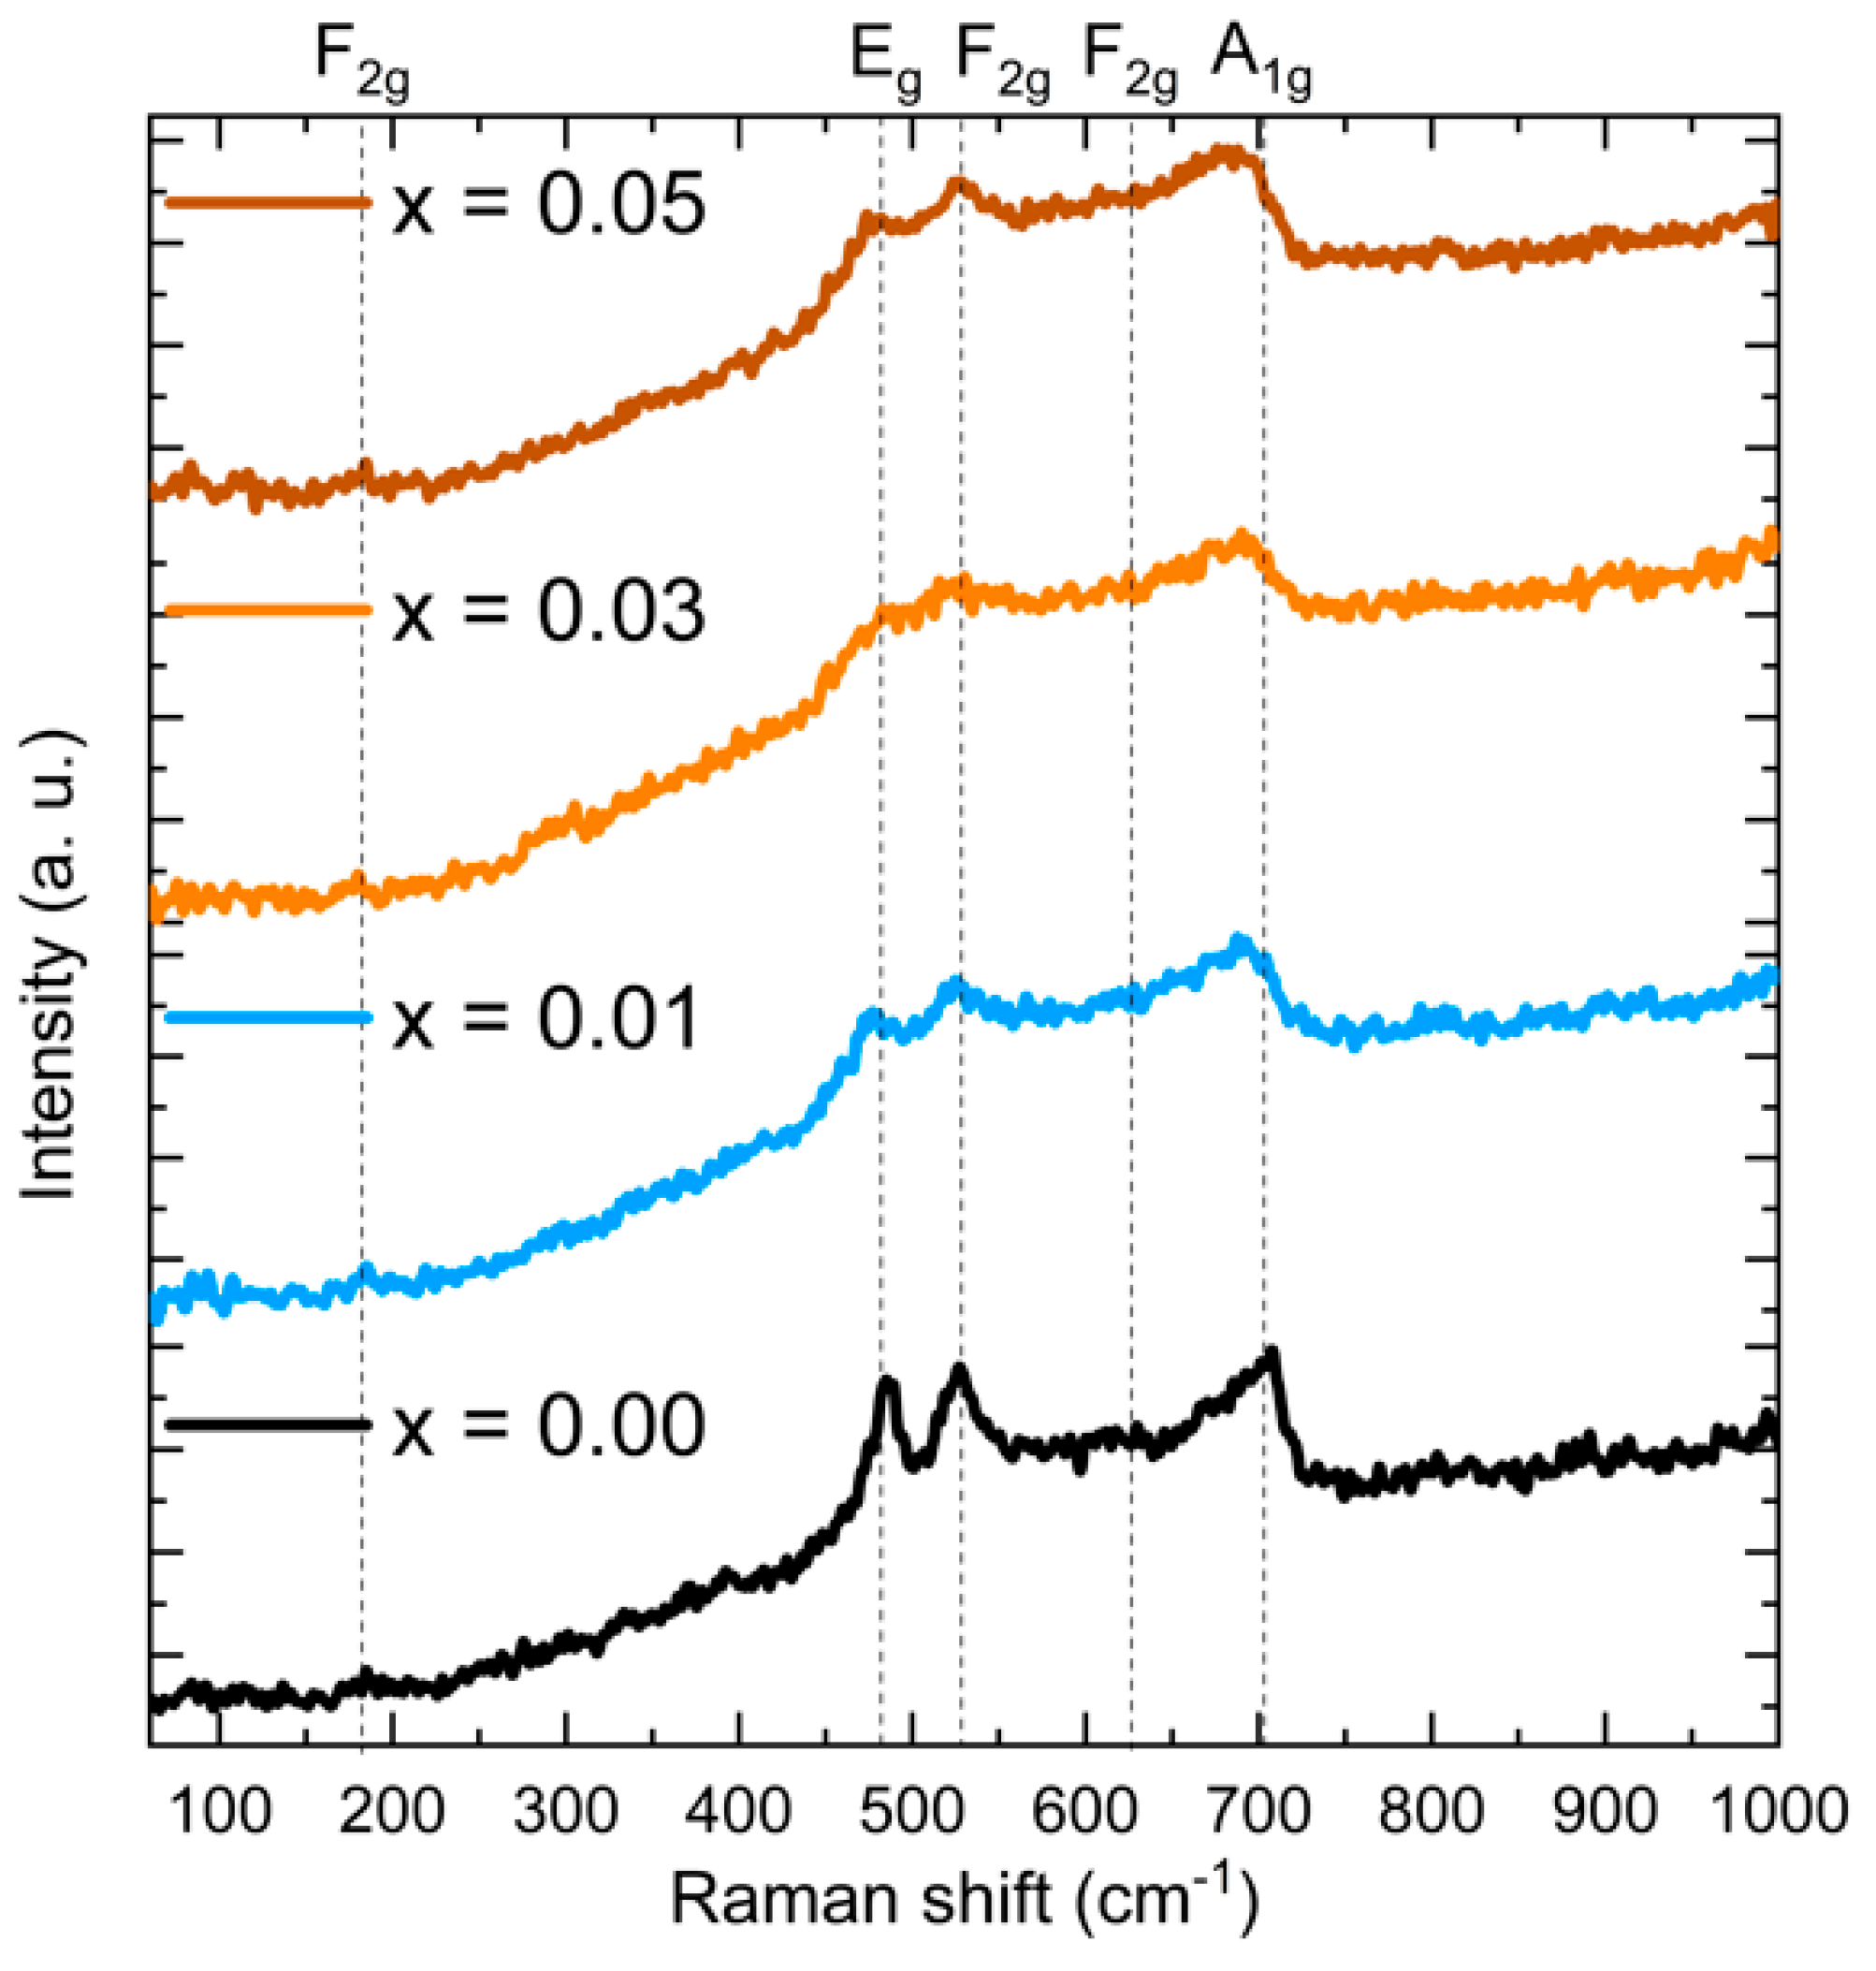
Raman spectroscopy is a non-destructive technique used to analyze the functional properties of thin films. The Raman spectra of Z n C e x C o 2 x O 4   ( x   =   0.0 ,   0.01 ,   0.03 ,   0.05 ) , shown in Figure 3, were recorded over a wavelength range of 50 to 1000 cm−1. The cubic spinel ZnCo2O4, belonging to the Fd-3m space group, exhibits five distinct Raman-active vibrational modes: F2g(1), Eg, F2g(2), F2g(3), and A1g. In this work, the Raman spectrum of the undoped film exhibits four distinct Raman-active modes, closely aligning with previously reported ZnCo2O4 data [28]. The peak observed at 180 cm−1 corresponds to the F2g vibrational mode associated with Co-O bonds in tetrahedral coordination. Peaks at 470 cm−1 and 515 cm−1, corresponding to the Eg and F2g(2) modes, originate from symmetric phonon vibrations of O atoms linked to Co-O and Zn-O stretching at tetrahedral and octahedral sites, respectively [29]. The A1g mode at 682 cm−1, associated with Co-O stretching in AB2O4 spinels, corresponds to bond vibrations at octahedral Co sites in ZnCo2O4. In doped samples, the A1g mode exhibits notable broadening compared to the undoped ones, attributed to factors such as grain size reduction, defect formation, local lattice strain, and structural distortions [30]. The observed shifts in the characteristic peaks of crystalline spinel metal oxides by a few cm−1 can be ascribed to structural changes caused by the incorporation of Ce into the ZnCo2O4 lattice. Moreover, the lack of separate peaks attributable to individual oxide phases supports the structural integrity observed in the XRD analysis. These Raman results are in line with the findings of Ming Ya et al. [30] and confirm the formation of the cubic spinel phase.

3.3. SEM-EDS-Mapping Analysis

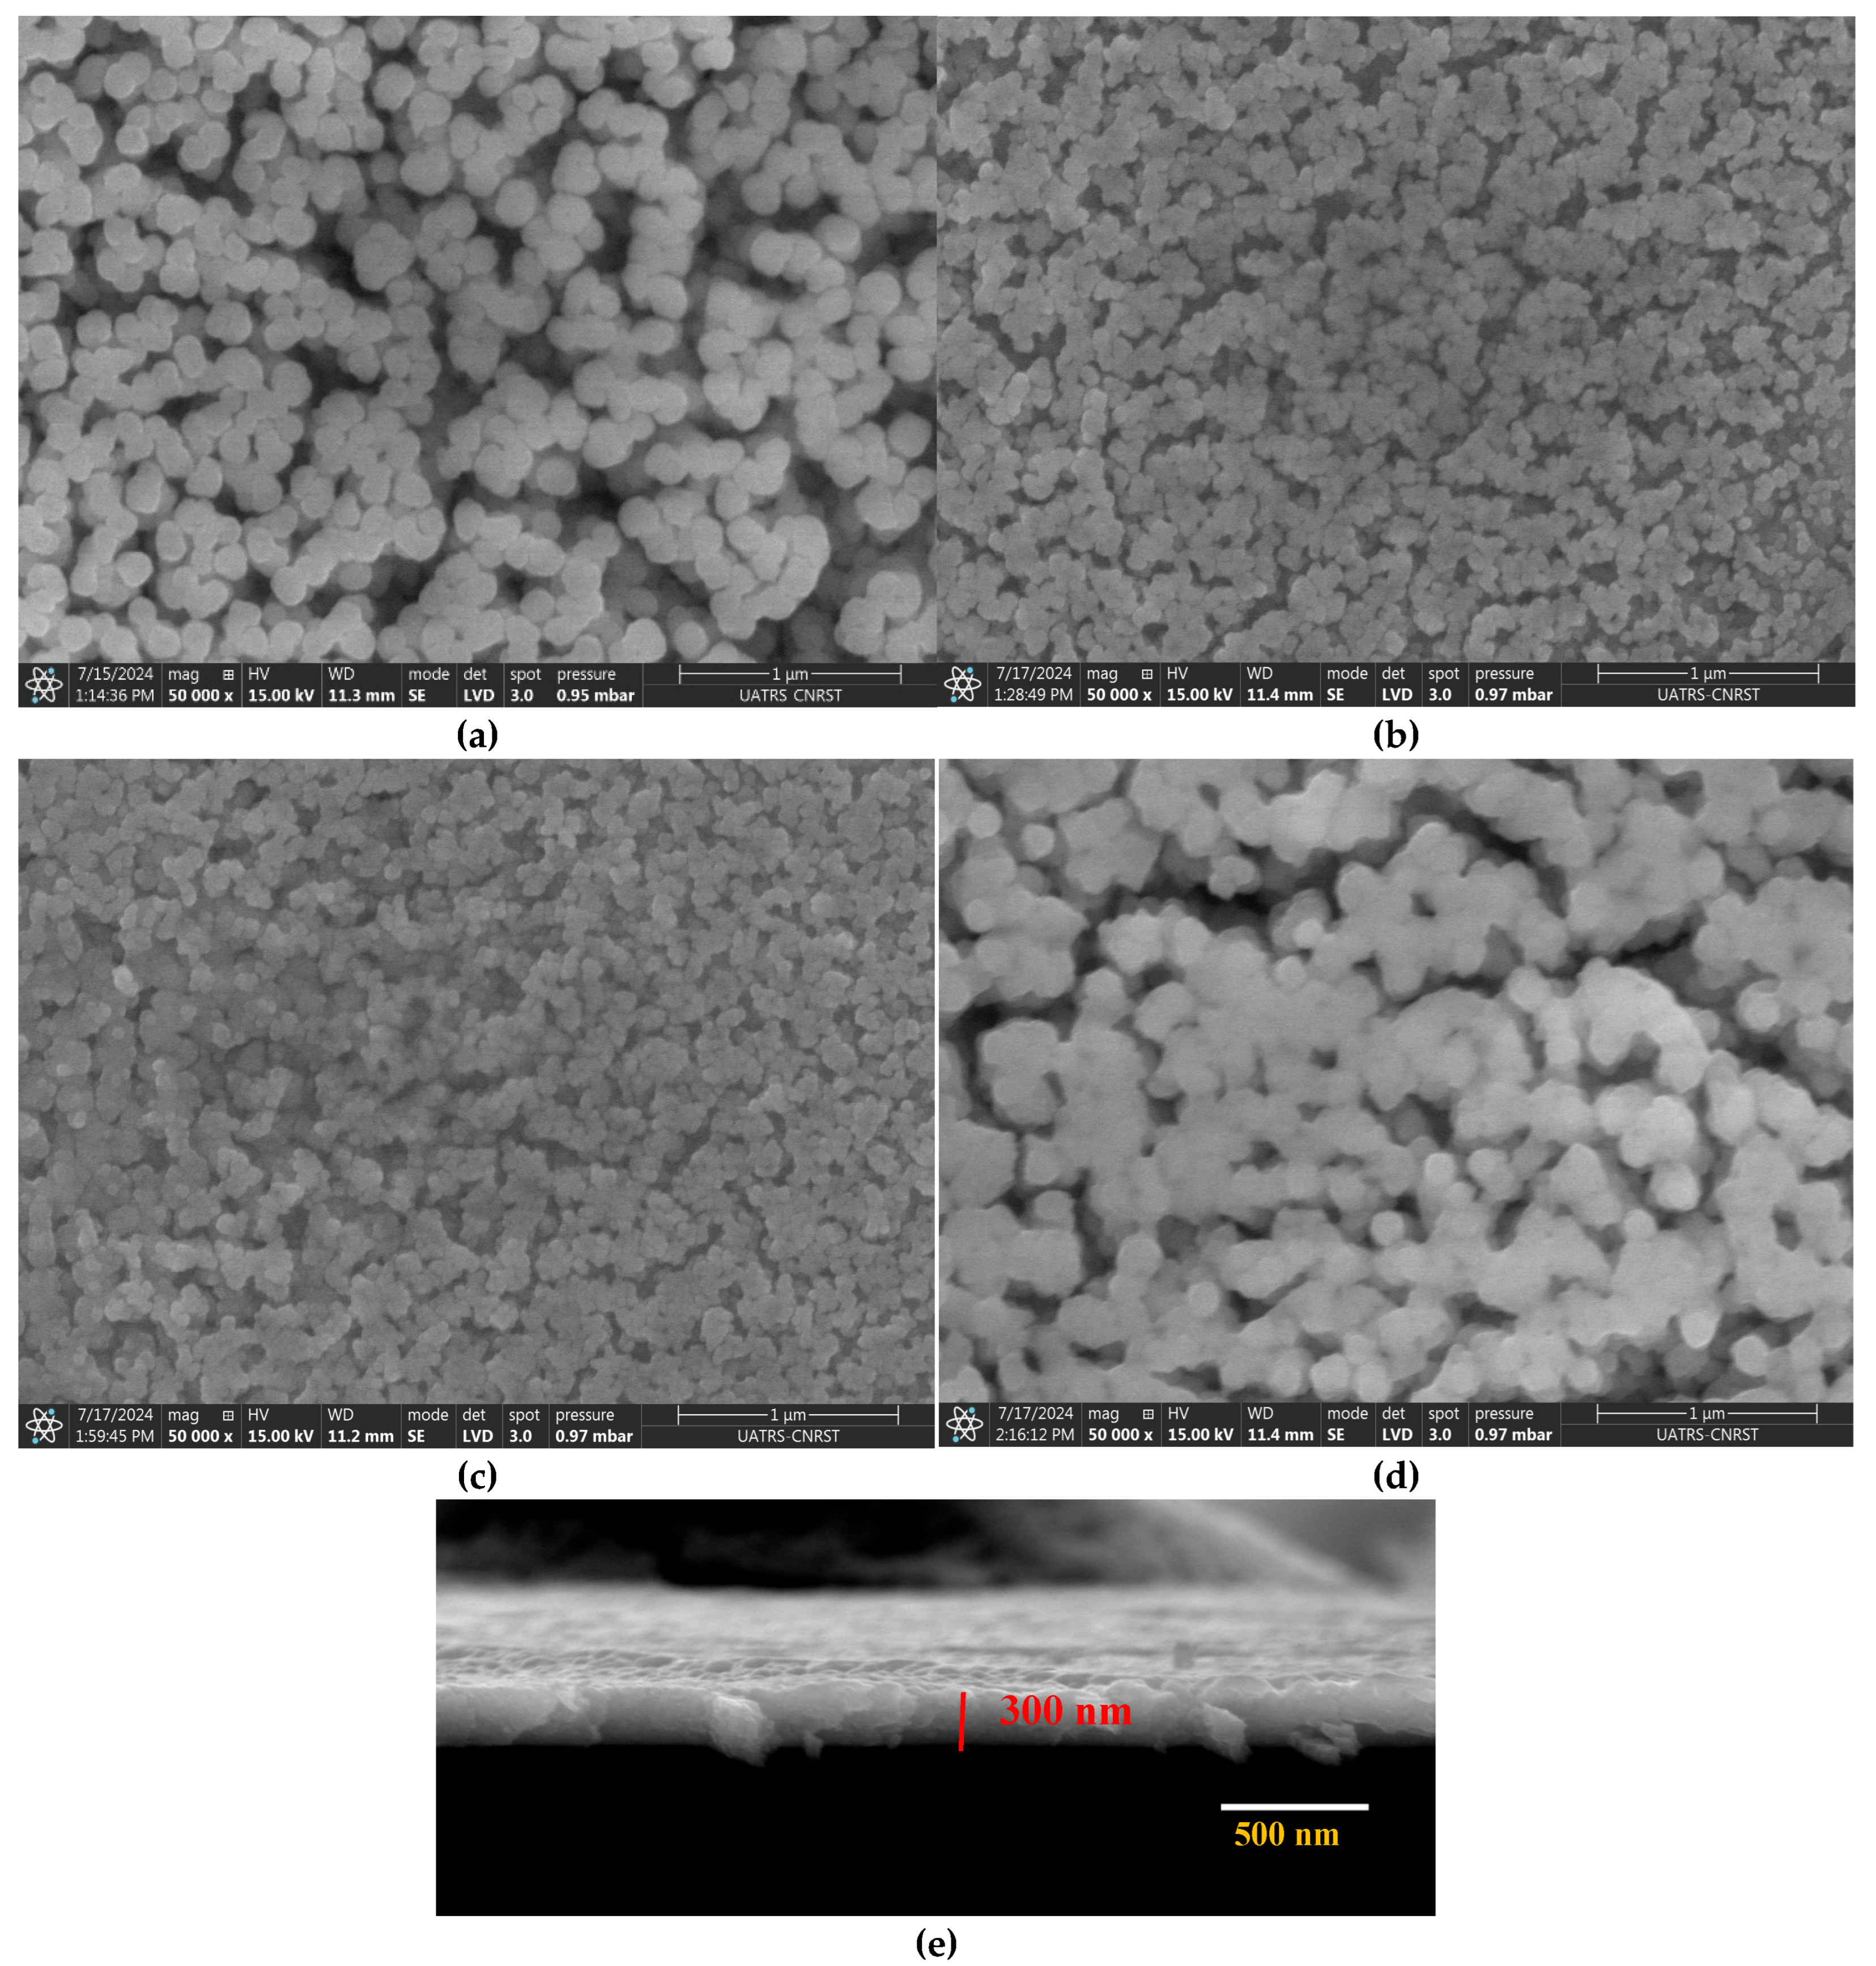
Scanning electron microscopy (SEM) was employed to investigate the surface morphology of ZnCexCo2−xO4 thin films, as shown in Figure 4. The micrographs of the undoped ZnCo2O4 sample reveal a compact and continuous layer consisting of grains with relatively large sizes and varied shapes. Upon cerium doping, notable morphological changes appear. The doped films show evident particle agglomeration, and as the Ce content increases, the film surfaces evolve into more aggregated and densely packed granular structures. This transformation suggests that Ce incorporation influences the growth mechanism and grain connectivity within the ZnCo2O4 matrix.
The cross-sectional SEM image of the undoped film (Figure 4e) displays a uniform thickness of approximately 300 nm, a value that remains consistent across all Ce doping levels. This indicates that the addition of Ce does not significantly alter the film deposition rate or vertical growth characteristics.
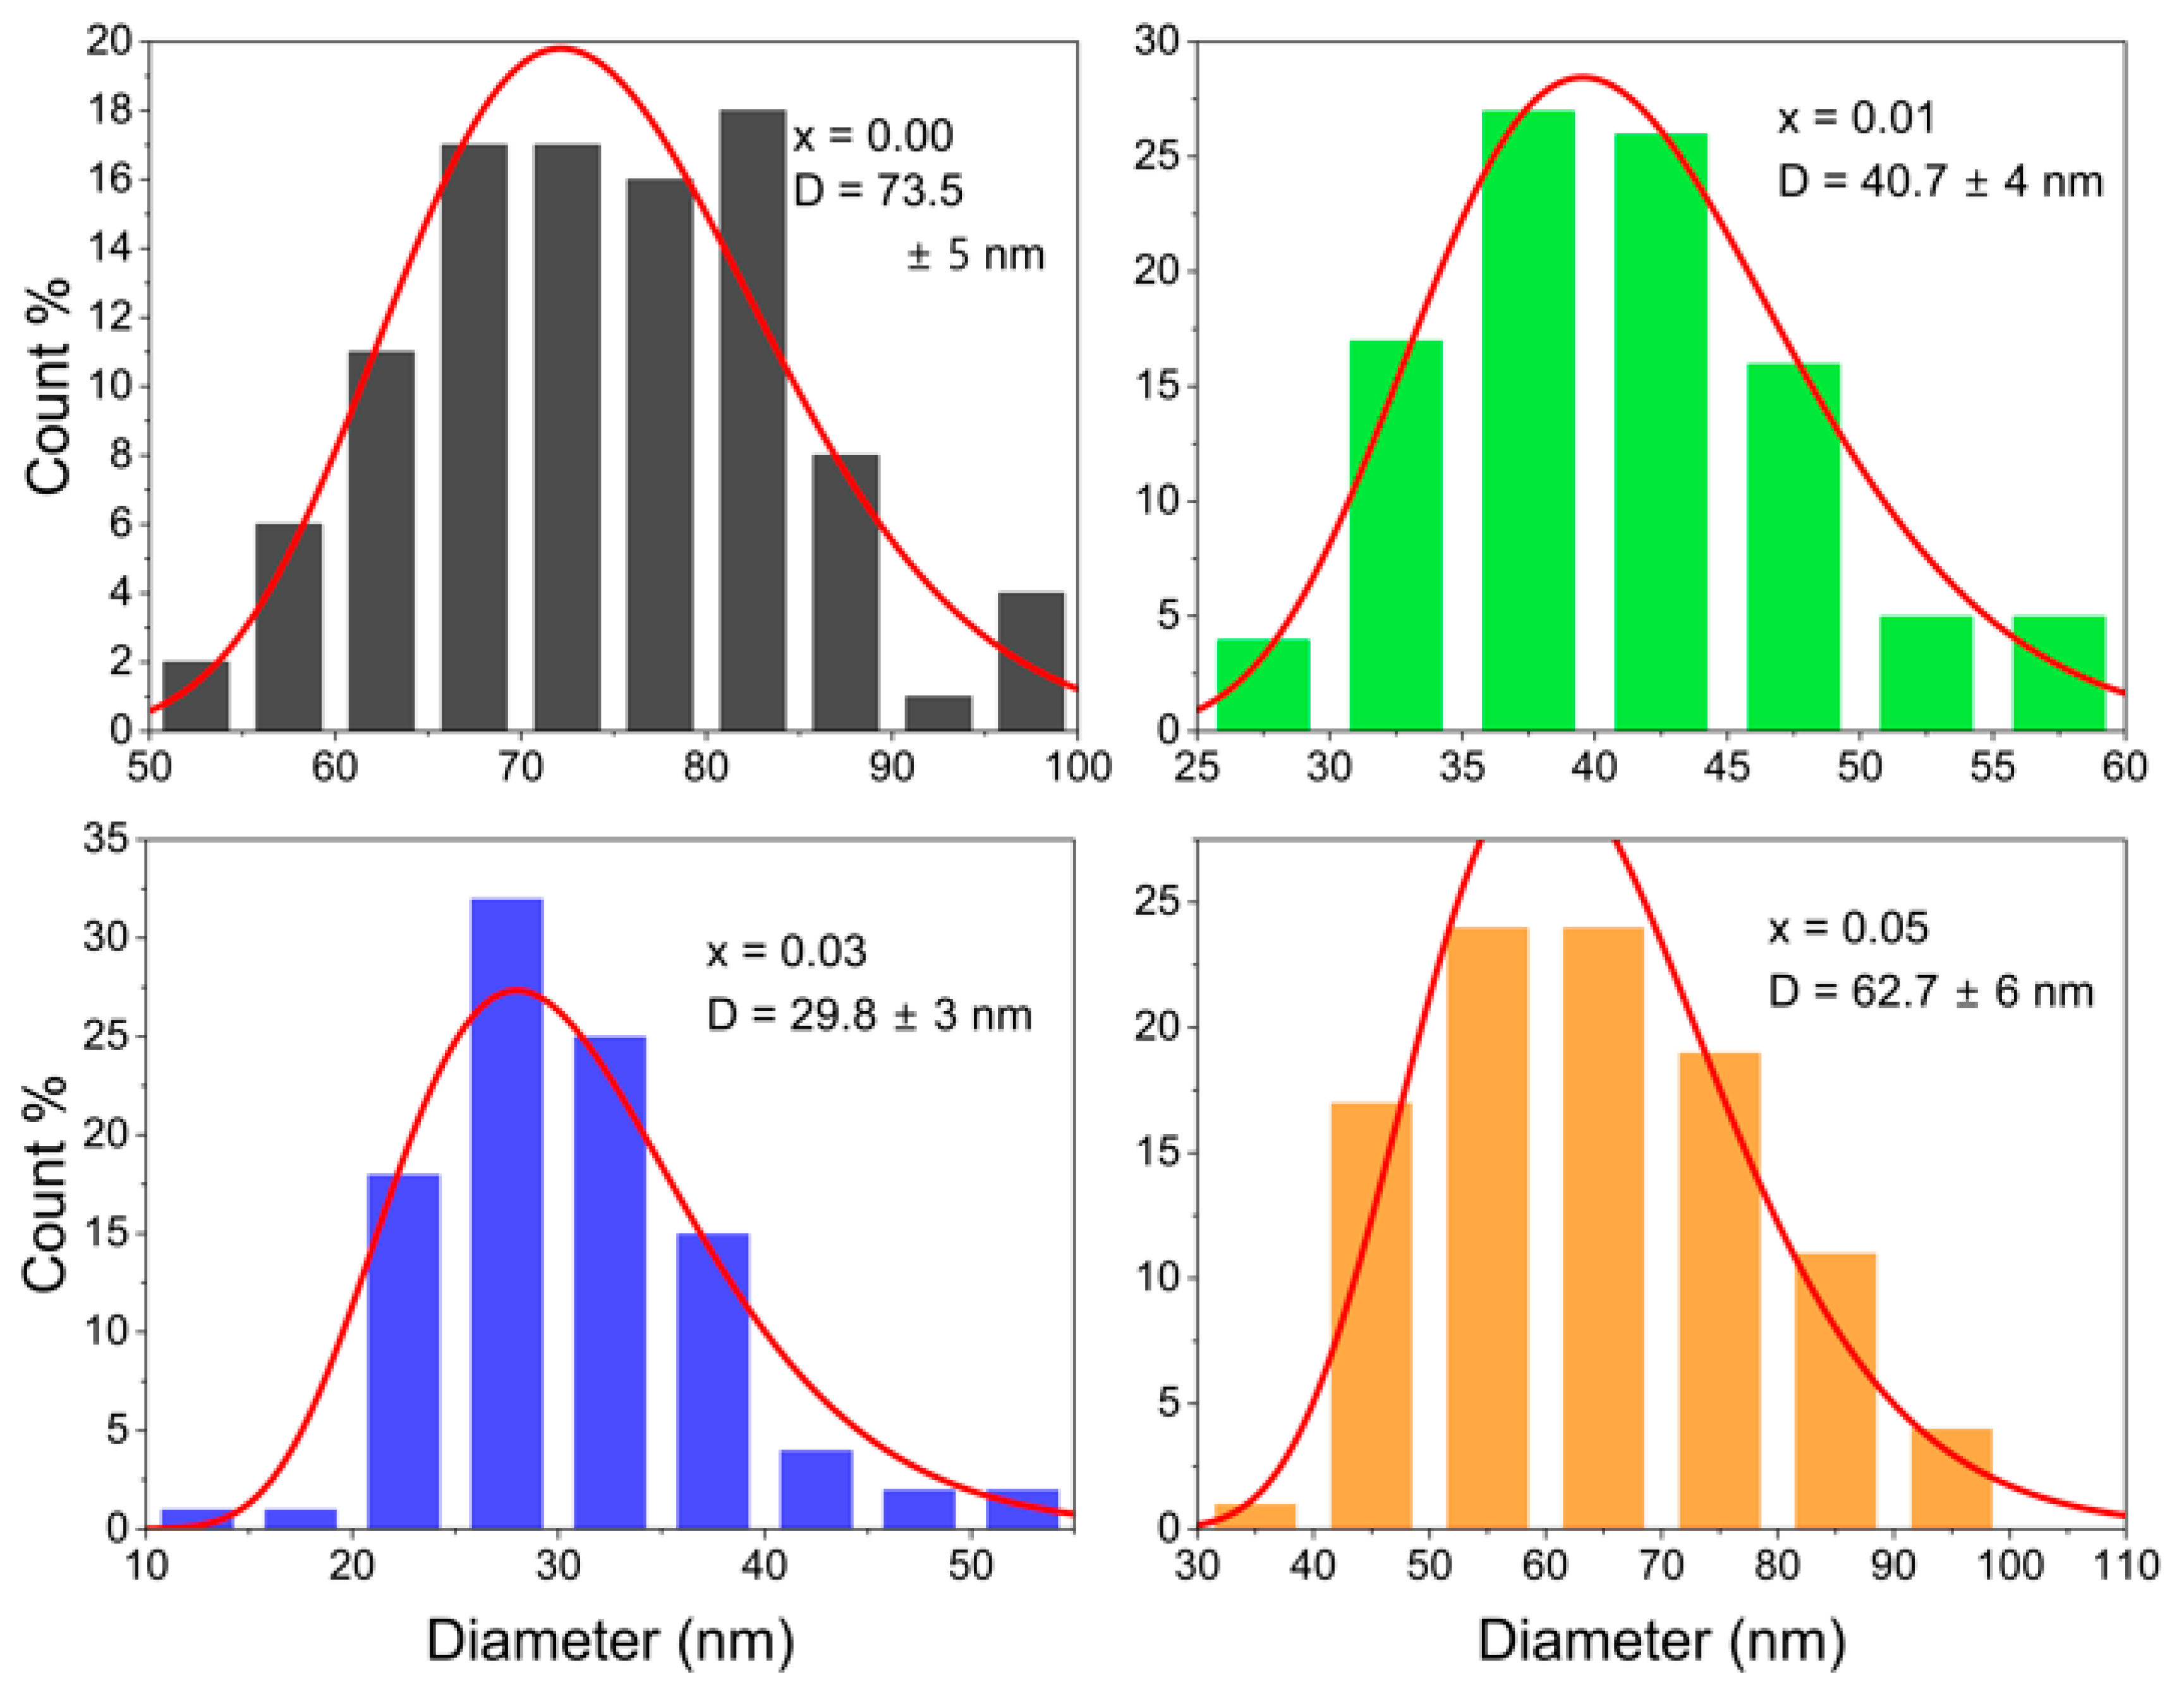
Grain size distribution was analyzed using ImageJ software(Version 1.54k), with histogram fits based on lognormal functions (Figure 5). The average grain sizes were estimated to be 73.5 ± 5 nm, 40.7 ± 4 nm, 29.8 ± 3 nm, and 62.7 ± 6 nm for x = 0.00, x = 0.01, x = 0.03, and x = 0.05, respectively. These SEM-based values are larger than the crystallite sizes obtained from XRD analysis, which is expected since SEM assesses surface-level aggregated grains, while XRD measures the coherent diffracting domains at the atomic scale. The tendency of nanoparticles to cluster is a typical result of surface energy minimization processes [31].
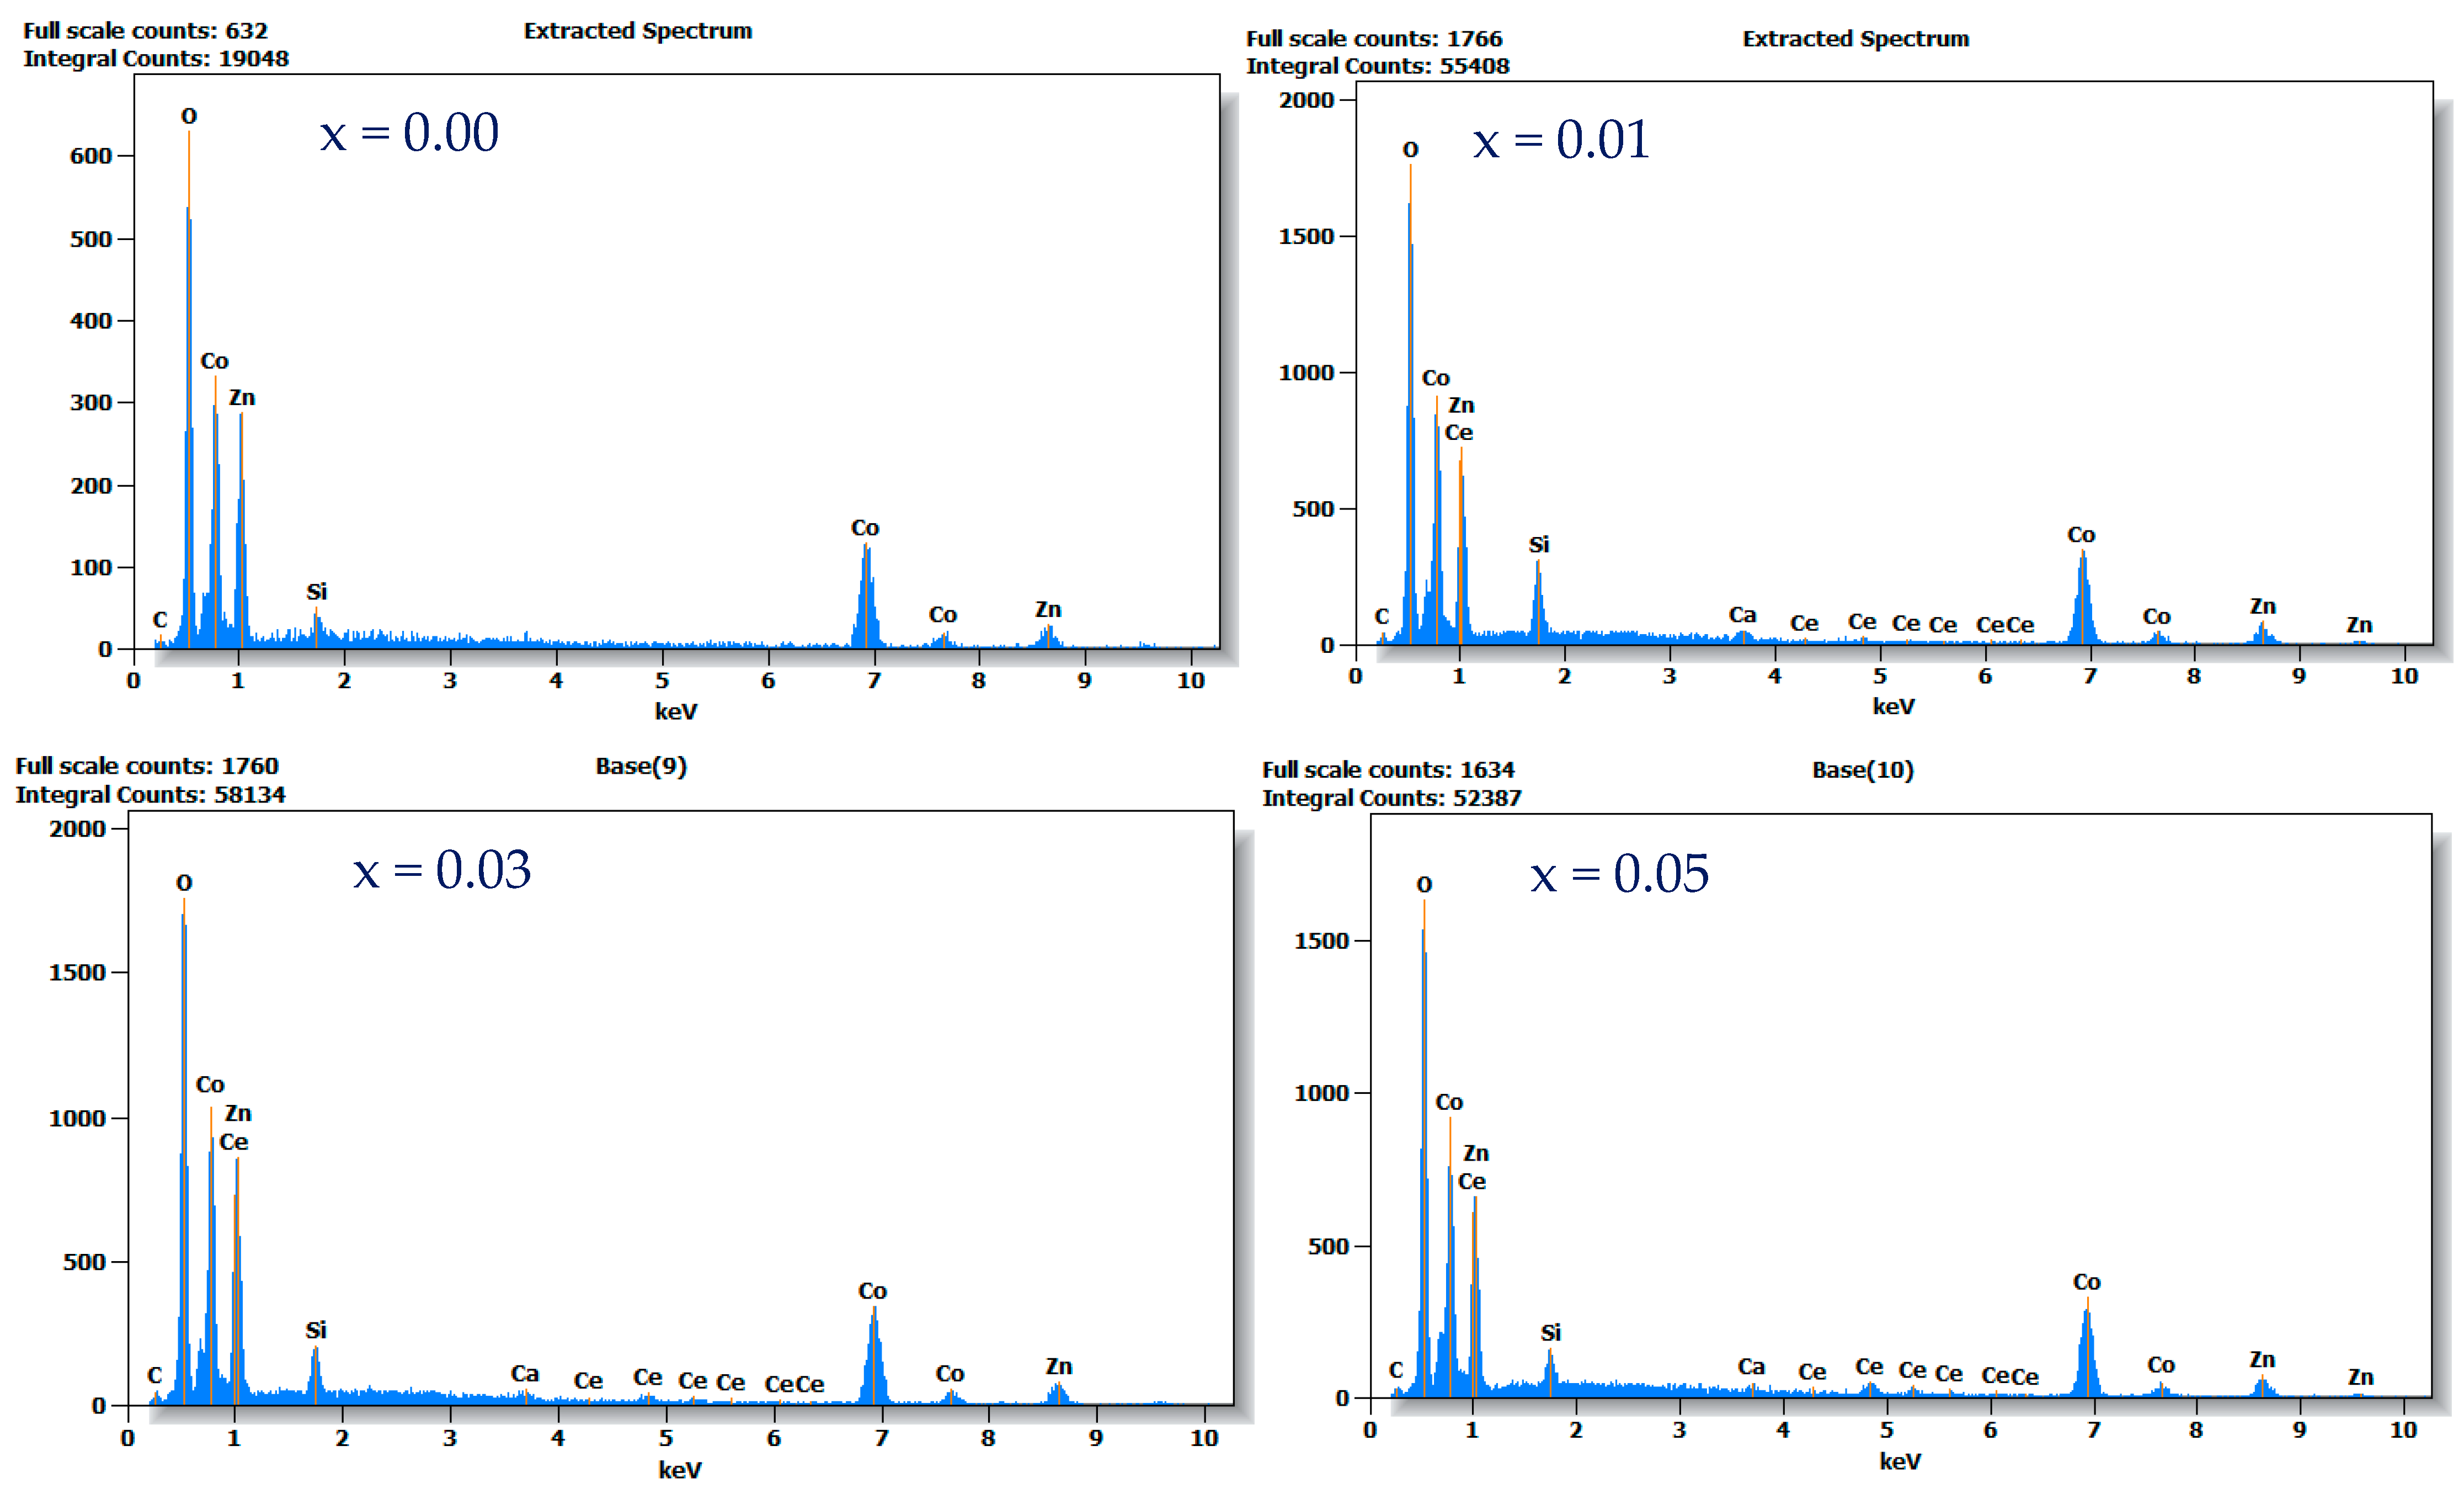
Energy-dispersive X-ray spectroscopy (EDS) was used to confirm the elemental composition of the thin films (Figure 6). The spectra clearly indicate the presence of Zn, Co, O, and Ce in the doped samples. Elemental mapping results (Figure 7) demonstrate a uniform spatial distribution of these elements across the film surface, confirming effective and homogeneous Ce incorporation. Additional signals corresponding to C, Si, and Ca are attributed to the underlying glass substrate used during deposition.

3.4. Optical Properties

3.4.1. Absorbance and Transmittance

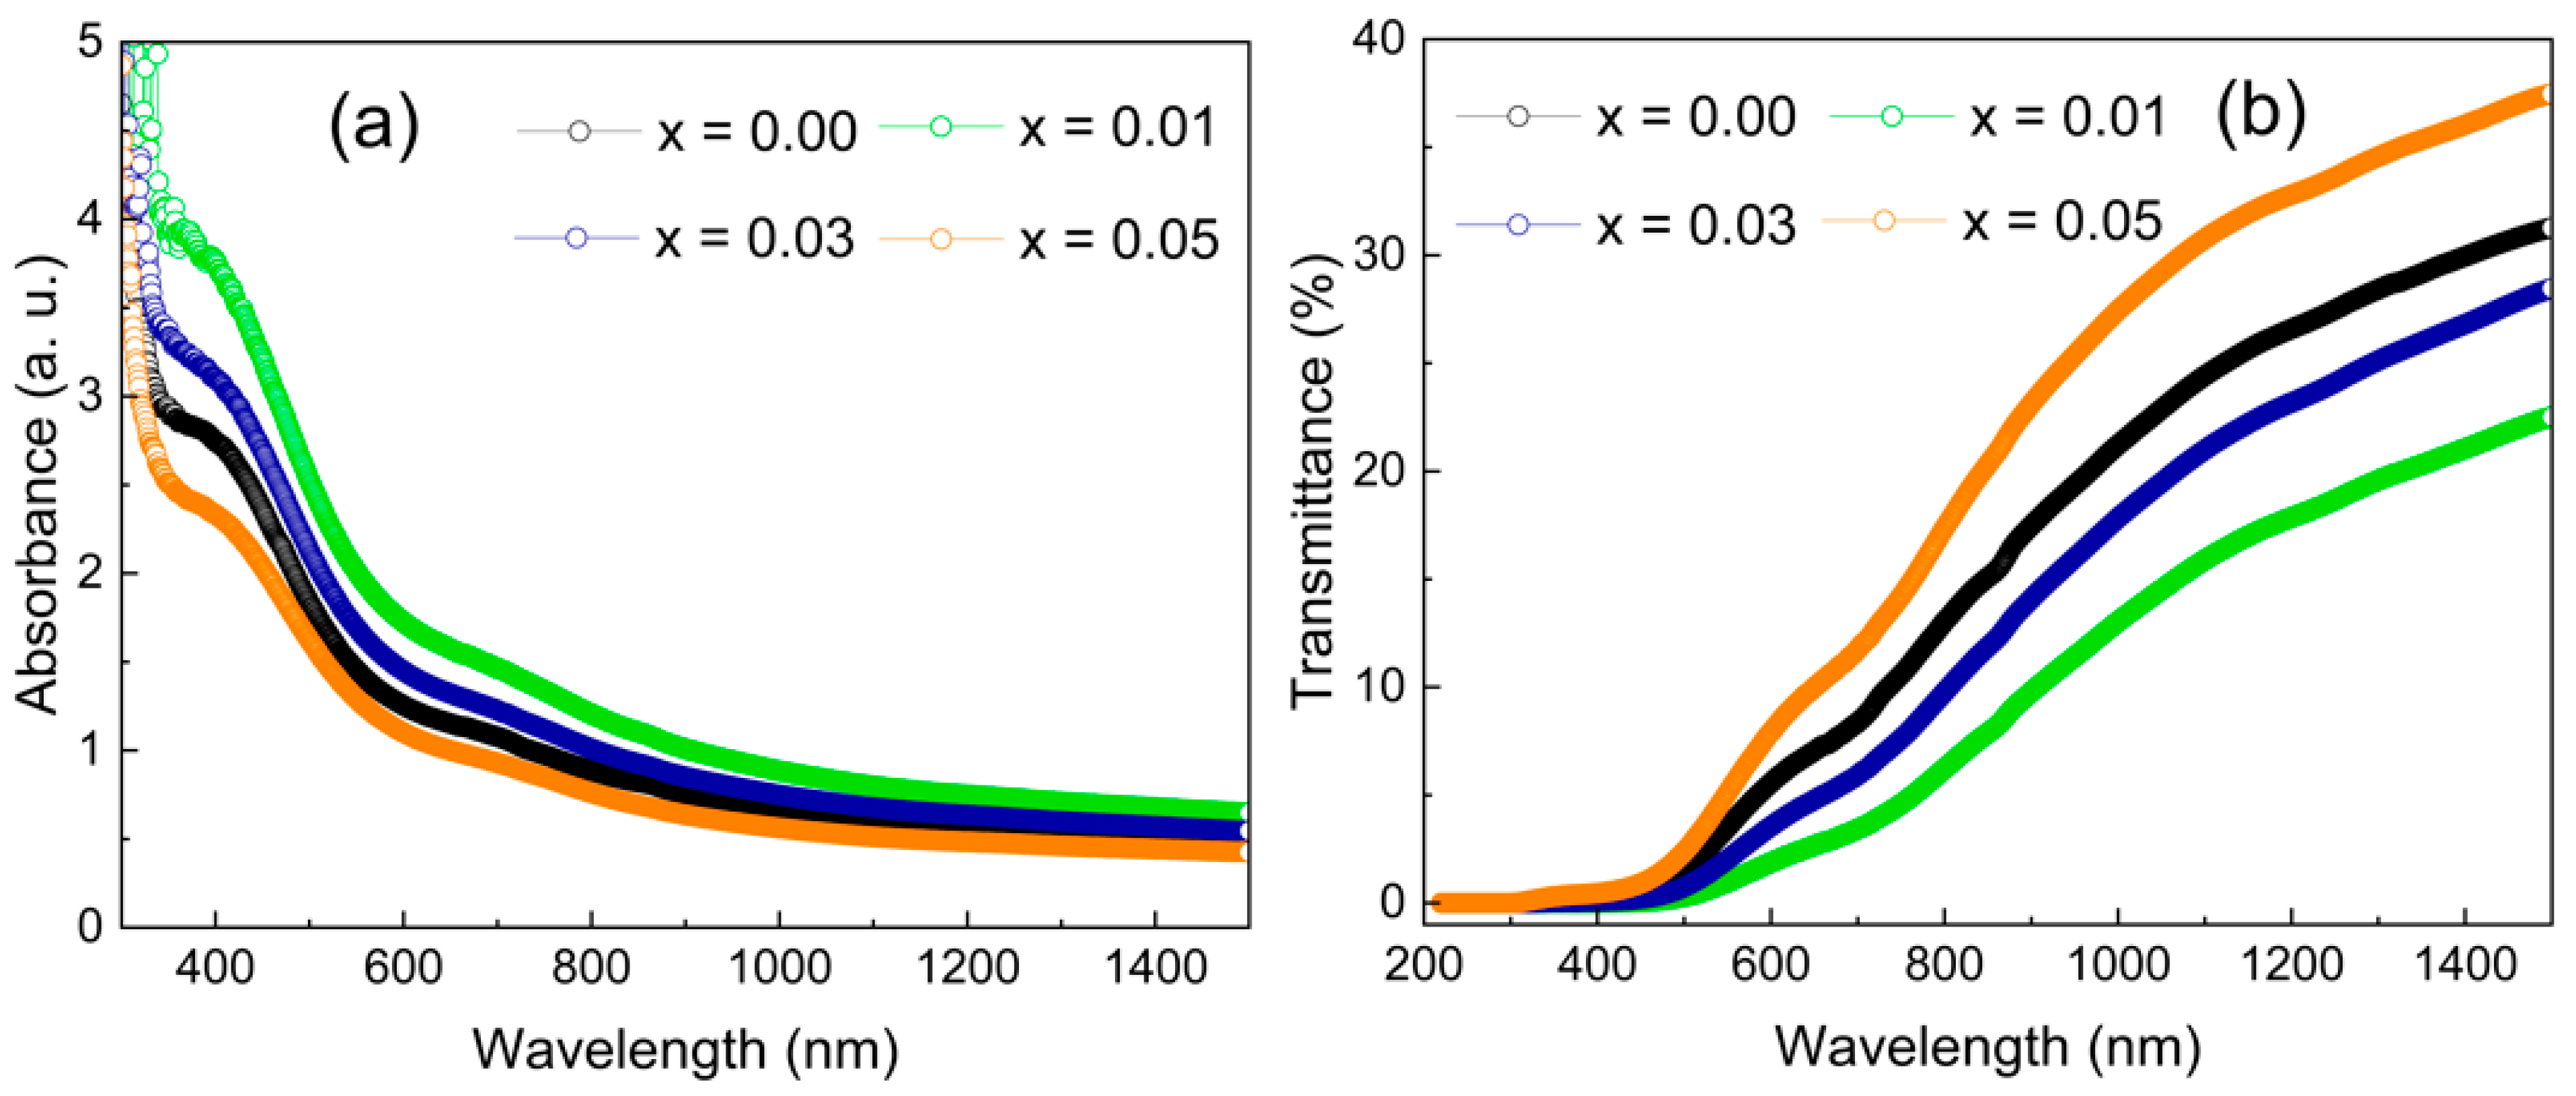
To assess the influence of Ce doping, the optical properties of Z n C e x C o 2 x O 4   ( x   =   0.0 ,   0.01 ,   0.03 ,   0.05 ) thin films deposited on glass substrates were examined using UV–Vis–NIR spectroscopy. Figure 8a,b presents the absorbance (A) and transmittance (T) spectra for varying Ce concentrations. The absorption spectra exhibit two prominent bands centered around 428 nm and 698 nm, which are attributed to electronic transitions from the O 2p valence band to the Co 3d-eg and Co 3d-t2g states, respectively [32,33]. As the Ce content increases, particularly at x = 0.01 and x = 0.03, a noticeable enhancement in absorbance is observed, indicating the introduction of intra-bandgap states and a possible narrowing of the optical bandgap. These modifications in the electronic structure facilitate more efficient photon absorption, thereby suggesting improved light-harvesting capability. Concurrently, the transmittance spectra show a general increase with higher Ce doping levels, particularly for x = 0.05, reflecting reduced optical losses and enhanced transparency in the visible to near-infrared region. This combination of increased absorption and transmittance highlights the potential of Ce doping in tuning the optical properties of ZnCo2O4 thin films for use in optoelectronic applications.

3.4.2. Optical Band Gap and Urbach Energy Determination

The absorption coefficient (α) is a key parameter that describes the extent to which a material can absorb light at a given wavelength, and it depends on both the optical density and the thickness of the film. For the Z n C e x C o 2 x O 4 ( x   =   0.0 ,   0.01 ,   0.03 ,   0.05 ) thin films, α was calculated using the following relation:
α = 2.303   A t
where A represents the absorbance and t is the film thickness. As presented in Table 2, the calculated absorption coefficients are in the range of 104 to 105 cm−1, indicating strong light absorption in the visible region, typical of semiconductor behavior. The optical bandgap (Eg) of the films was estimated using the Tauc relation:
α h ν 2   = A h ν E g
where hν is the photon energy, A is a constant, and Eg is the optical bandgap energy. Figure 9 shows the Tauc plots based on (αhν)2 versus hν, from which the bandgap energies were extracted by extrapolating the linear regions. Interestingly, the presence of two absorption features suggests that the films exhibit dual optical bandgaps. The lower-energy bandgaps were determined to be 2.32, 2.28, 2.25, and 2.22 eV for x = 0.00, 0.01, 0.03, and 0.05, respectively, which are consistent with values reported in earlier works [34]. In addition, higher-energy transitions yielded bandgaps of 3.38, 3.29, 3.24, and 2.98 eV across the same doping levels. The gradual decrease in the primary bandgap with increasing Ce content can be attributed to structural distortions and the introduction of Ce-induced defect states near the band edges, leading to band tailing effects. These observations align with previously reported results for polycrystalline materials where rare-earth doping alters the electronic structure and enhances sub-bandgap absorption [35].
The Urbach energy (Eu) provides insight into the degree of structural disorder and the presence of localized states within the band structure of semiconducting materials. It was estimated from the optical absorption spectra using the following empirical relation:
α = α 0 e x p h ν E u
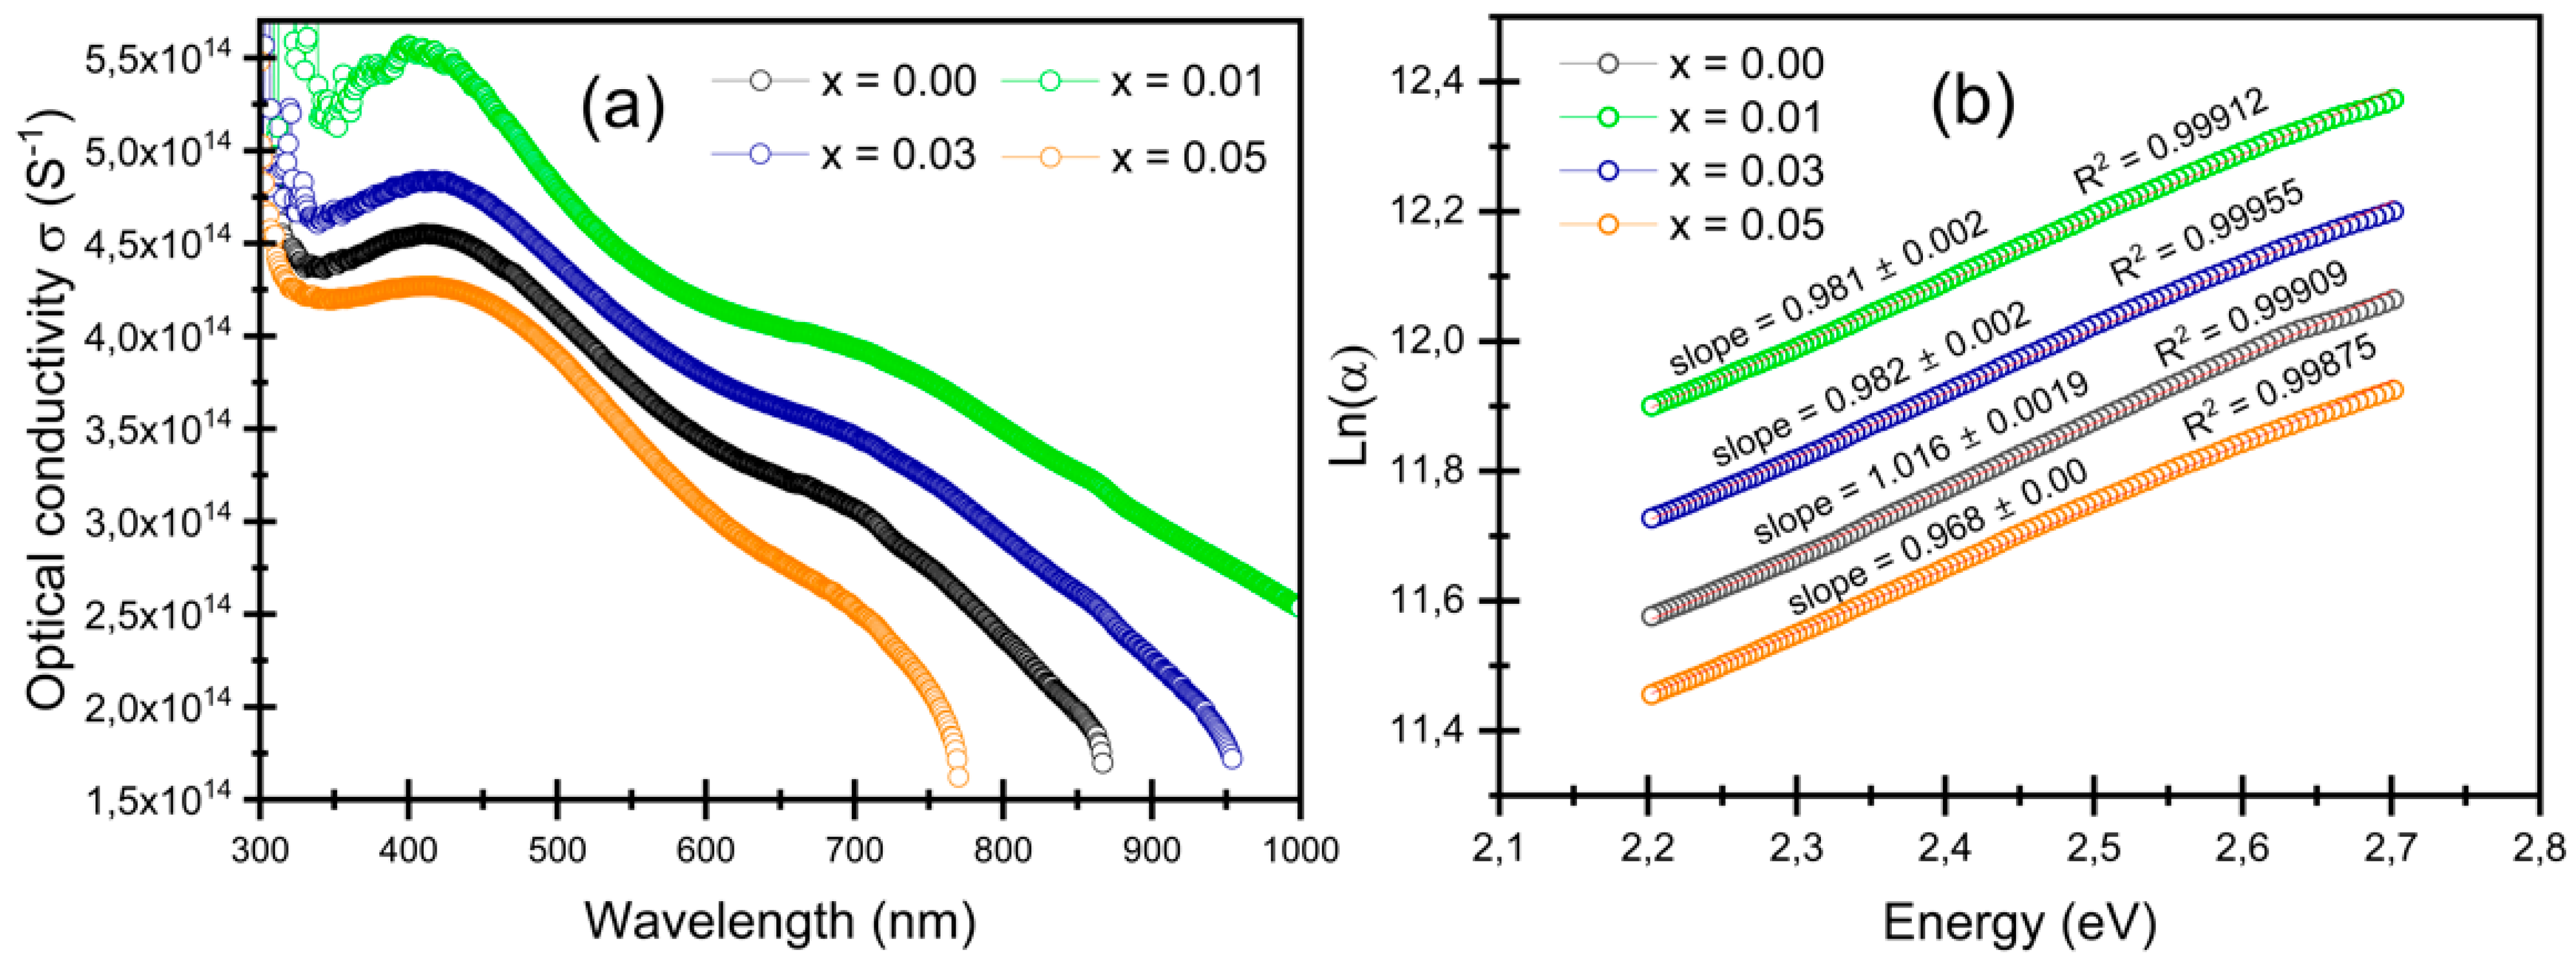
where α is the absorption coefficient, α0 is a material-dependent constant, hν is the photon energy, and Eu is the Urbach energy. To extract Eu, the natural logarithm of α was plotted against photon energy, and the Urbach energy was determined from the inverse of the slope of the linear region in the ln(α) versus hν plot, according to
l n   α = l n   α 0 + h ν E u
The calculated Eu values for the Z n C e x C o 2 x O 4 thin films range from 0.984 to 1.033 eV, showing a slight increase with higher Ce content. This rise in Eu reflects a progressive increase in structural disorder and defect density within the films, which is consistent with the XRD results indicating crystallographic distortion upon Ce doping. Moreover, a clear inverse relationship is observed between the Urbach energy and the optical bandgap (Eg1), in agreement with reported trends in disordered semiconductors [36]. As Ce content increases from x = 0.00 to x = 0.05, Eg1 decreases from 2.32 to 2.20 eV, while Eu rises from 0.984 to 1.033 eV. This behavior indicates that Ce incorporation introduces localized states within the bandgap, leading to band tailing and a reduction in the effective bandgap energy. In Ce-doped spinel oxides, such localized states arising from intrinsic defects like oxygen vacancies and antisite disorders can produce absorption features that overlap with the fundamental edge, as highlighted in optical data interpretation studies [37] and defect-level analyses in MgAl2O4 [38,39]. Interestingly, a similar but less pronounced variation is observed in the higher-energy bandgaps (Eg2), which further supports the presence of dual transitions influenced by Ce-induced electronic states. These findings confirm that Ce doping not only modifies the fundamental optical transitions but also enhances sub-bandgap absorption due to increased disorder, making Urbach energy a sensitive probe of the microstructural and electronic modifications induced by dopant incorporation.

3.4.3. Refractive Index and Extinction Coefficient

The refractive index (n) is a dimensionless parameter that describes the speed at which light propagates through a material relative to its speed in a vacuum. It is defined as the ratio of the speed of light in vacuum to that in a non-absorbing medium. The refractive index can be calculated using the relation
n = 1 + R 1 R + 4 R 1 R 2 k 2 1 / 2
where R is the reflectance and k the extinction coefficient. Both n and k were derived from spectral measurements of reflectance and transmittance performed on samples with varying cerium doping concentrations. The refractive index values summarized in Table 2 reveal a decrease at doping levels x = 0.01 and x = 0.03, followed by an increase at x = 0.05. This behavior is likely related to changes in the material’s polarizability caused by the gradual incorporation of Ce ions into the ZnCo2O4 lattice, which alters the electronic environment and local polarizability [40].
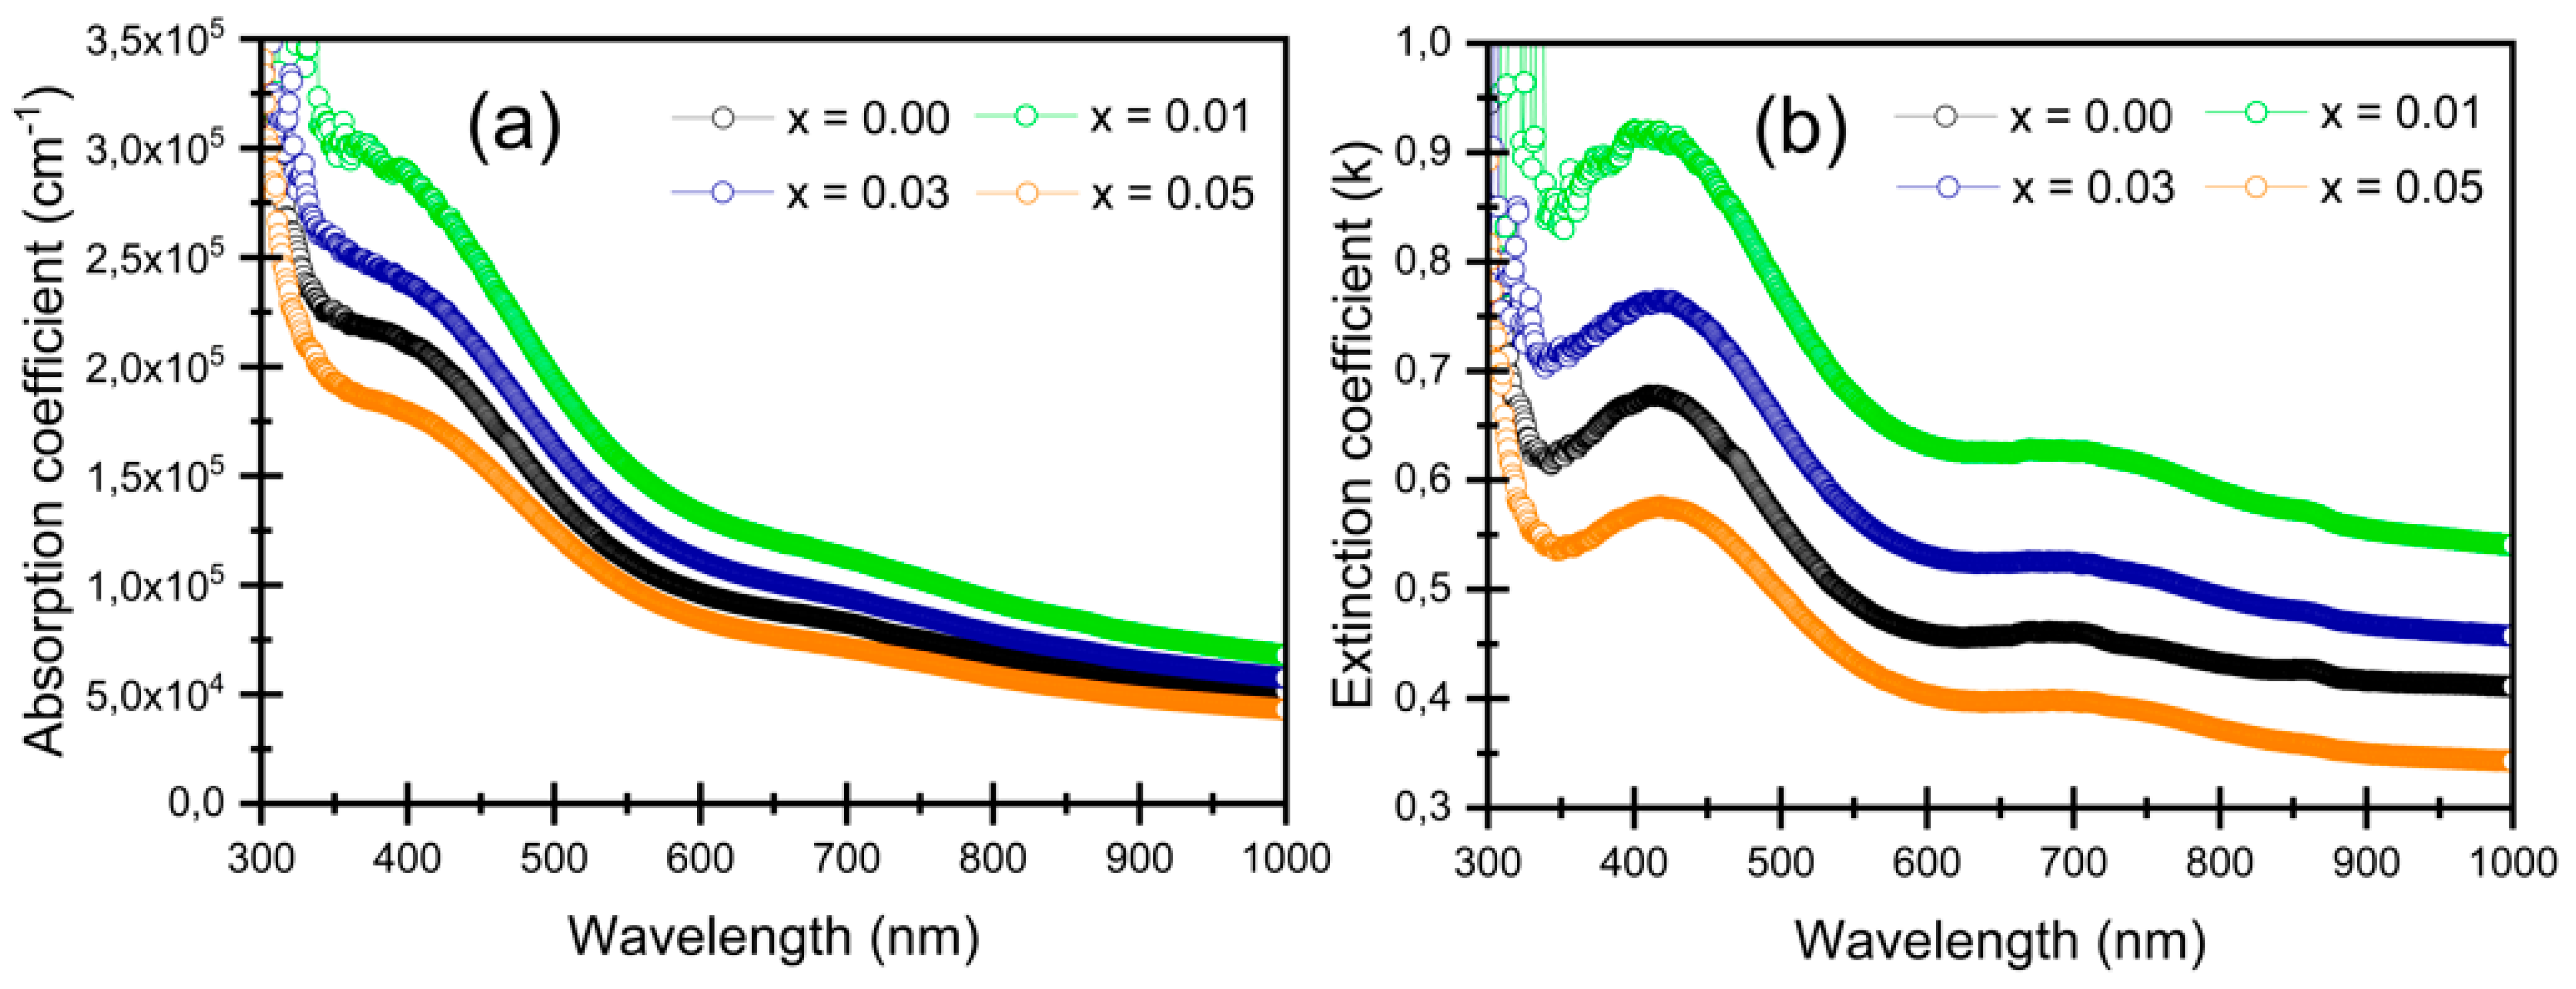
The extinction coefficient (k) quantifies the loss of light intensity per unit volume due to absorption and scattering effects. It is calculated from the transmission and reflection data using the formula
k = α λ 4 π
where α is the absorption coefficient and λ the wavelength of incident light. Figure 10b illustrates the wavelength dependence of k, which closely follows the absorption coefficient spectrum α. Values of k presented in Table 2 show that Ce doping affects the extinction coefficient significantly. For instance, at 550 nm, k increases from 0.488 in the undoped sample to 0.674 for the film doped at x = 0.01. An increase in k is observed for the doping levels x = 0.01 and x = 0.03, while a decrease occurs at x = 0.05. These variations reflect modifications in the absorption and scattering processes induced by the changes in the electronic structure upon Ce incorporation.

3.4.4. Optical Conductivity Determination

The optical conductivity (σopt) of Z n C e x C o 2 x O 4 thin films provides insight into the charge carrier transport behavior induced by Ce doping. This parameter is calculated using the following relation:
σ o p t = α n c 4 π
where α is the absorption coefficient, n is the refractive index, and c is the speed of light. These quantities were extracted from optical measurements performed on the doped and undoped films. As shown in Figure 11a, the optical conductivity increases significantly at Ce doping levels x = 0.01 and x = 0.03, indicating that cerium incorporation enhances charge carrier activity and facilitates optical transitions within the material. This enhancement is typically attributed to the introduction of additional donor states or improved carrier mobility due to Ce substitution in the ZnCo2O4 lattice. However, at a higher doping concentration (x = 0.05), a decline in σopt is observed, which may result from increased structural disorder or the formation of defect states that act as carrier traps, thereby limiting conductivity. This behavior suggests an optimal doping threshold beyond which the beneficial effects of cerium on carrier generation are diminished. Furthermore, the optical conductivity decreases progressively with increasing wavelength. This trend implies that at lower photon energies, the number of photo-generated carriers contributing to conduction diminishes, likely due to their recombination or trapping within localized states in the band gap. The relatively high σopt observed in the UV–visible range can be attributed to the excitation of free carriers by high-energy photons, which possess sufficient energy to overcome potential barriers and activate conduction pathways [41].

3.5. Electrical Properties

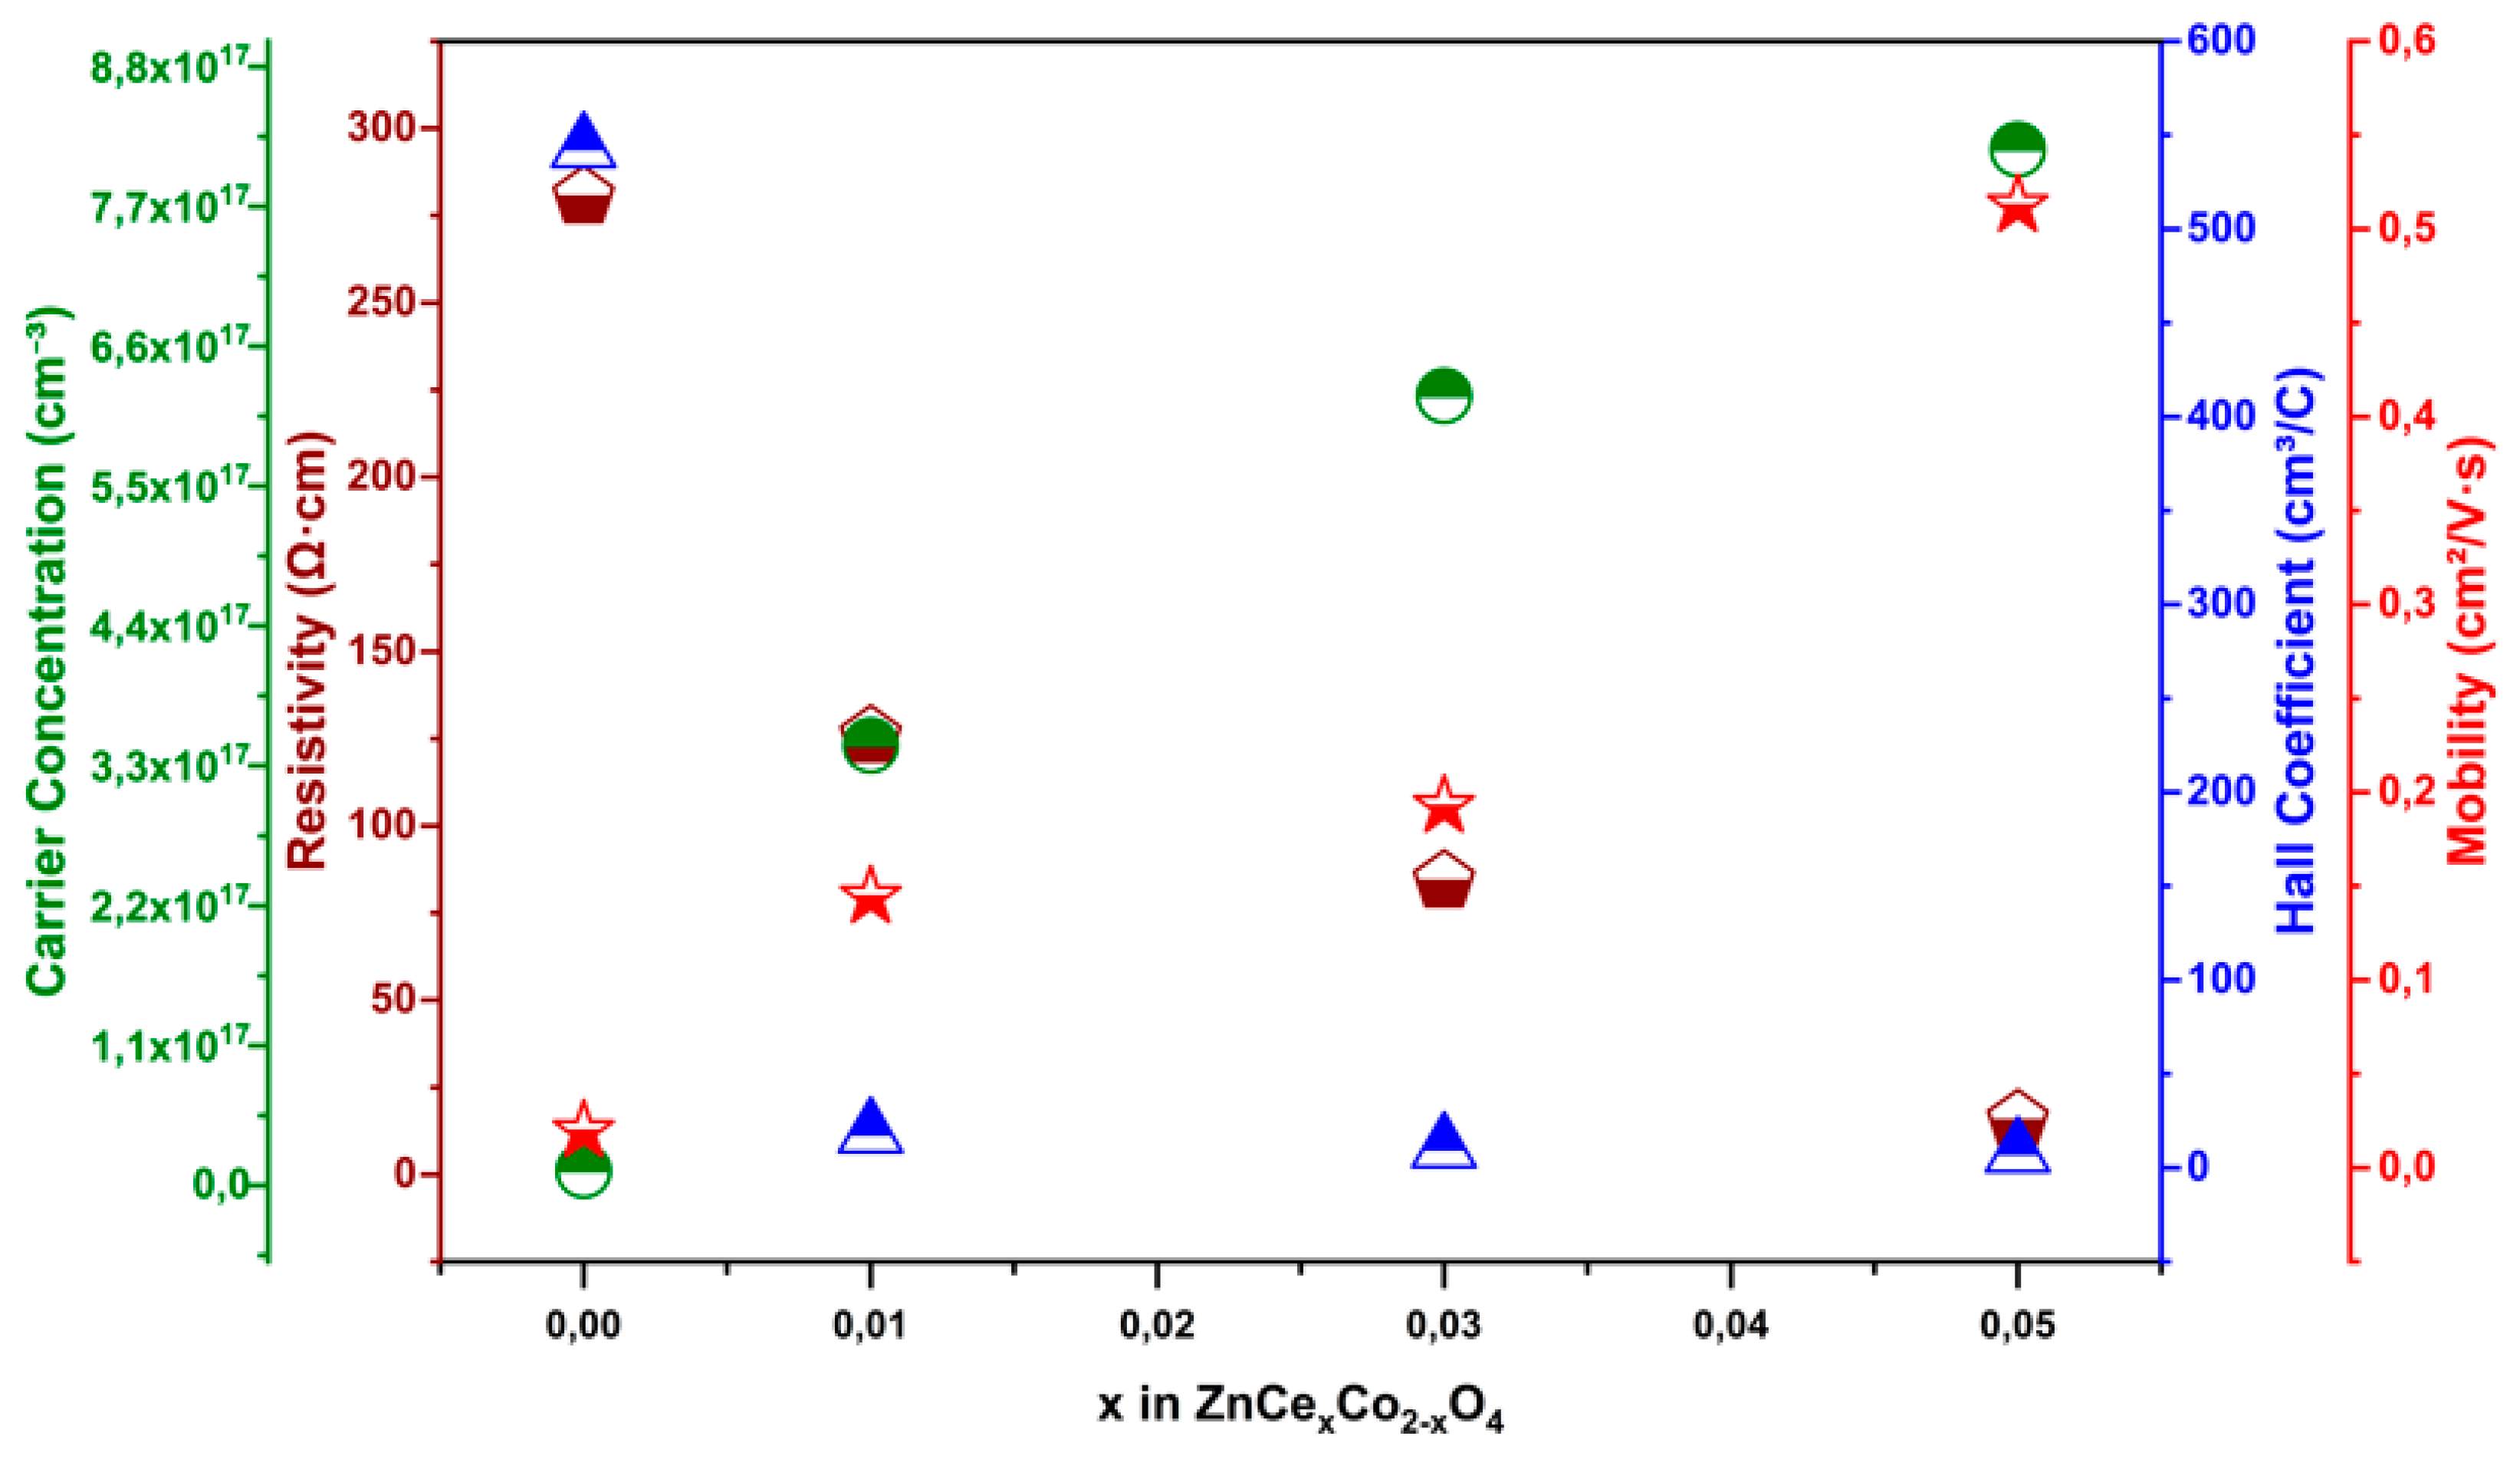
Figure 12 presents the electrical properties of Z n C e x C o 2 x O 4   ( x   =   0.0 ,   0.01 ,   0.03 ,   0.05 ) thin films, measured using the Hall effect, including resistivity, carrier concentration, conductivity, mobility, and the Hall coefficient. The Hall effect analyzer enables the measurement of key electrical parameters such as resistivity, carrier concentration, conductivity, and the Hall coefficient [42]. These analyses help assess whether cerium (Ce3+) doping in ZnCo2O4 thin films effectively substitutes cobalt (Co3+) ions, potentially enhancing both carrier concentration and electrical conductivity. The electrical properties of ZnCo2O4 films were examined to evaluate the impact of Ce doping on cobalt substitution, carrier concentration, and resistivity. A significant reduction in resistivity is observed with increasing Ce content, dropping from 280.3 Ω·cm for the undoped film to 15.4 Ω·cm at x = 0.05. Simultaneously, the carrier concentration increases markedly, from 1.15 × 1016 cm−3 (x = 0.00) to 8.15 × 1017 cm−3 (x = 0.05). This increase in charge carriers confirms that Ce3+ plays an active role in modifying the electronic structure, promoting p-type conductivity in the spinel lattice. The positive Hall coefficient values across all compositions indicate that holes remain the majority charge carriers, confirming the p-type semiconducting behavior of the films. The decreasing trend of the Hall coefficient with increasing Ce content reflects the rise in carrier density and supports previous findings that oxygen-rich conditions promote hole conductivity in ZnCo2O4 [32,43]. Although mobility changes less dramatically, it contributes to the overall decrease in resistivity when combined with the increasing carrier concentration. Despite the larger ionic radius of cerium ions compared to cobalt ions, their incorporation into the ZnCo2O4 spinel lattice induces lattice distortions and creates oxygen vacancies. These defects promote charge compensation, increase active sites, and enhance electrical transport in Z n C e x C o 2 x O 4 materials [23]. Moreover, repeated electrical and optical measurements conducted several weeks after film synthesis under ambient conditions showed negligible changes, confirming the stability and reproducibility of the Ce-doped ZnCo2O4 thin films.

4. Conclusions

Z n C e x C o 2 x O 4 thin films with varying cerium concentrations (x = 0.00, 0.01, 0.03, and 0.05) were deposited by spray pyrolysis. X-ray diffraction (XRD) analysis confirmed the formation of a cubic spinel structure in both undoped and Ce-doped samples, with no detectable secondary phases, indicating successful incorporation of Ce into the lattice. Scanning electron microscopy (SEM) revealed that the average grain size decreased from 73 nm in the undoped film to 29 nm at x = 0.03, before slightly increasing at the highest doping level, reflecting the effect of Ce on grain growth and aggregation during deposition. Optical measurements showed strong absorption in the ultraviolet and visible regions, primarily associated with O 2p–Co 3d charge-transfer transitions and intra-d transitions within the Co sublattice. The optical band gap decreased progressively from 2.32 eV for pure ZnCo2O4 to 2.20 eV at x = 0.05, which can be attributed to structural defects and localized states introduced by Ce doping. The refractive index at 550 nm increased moderately with doping, from 1.19 to 1.40, while the extinction coefficient varied between 0.433 and 0.674, suggesting enhanced light–matter interactions due to changes in the electronic structure. Optical conductivity analysis indicated improved charge carrier dynamics, reaching maximum values at intermediate Ce contents. Hall-effect measurements further demonstrated that Ce incorporation increases both conductivity and carrier mobility, likely as a result of higher free carrier concentration and modified scattering processes. Overall, Ce doping in ZnCo2O4 thin films induces notable modifications in structural, optical, and electrical characteristics, underlining their suitability for advanced optoelectronic applications.

Author Contributions

Conceptualization: A.E.-H., M.O., S.H., M.E.B. and Y.N.; methodology: M.A.; formal analysis: A.Y. and M.O.; resources: S.H. and M.D.; data curation: A.Y.; writing—original draft: A.E.-H.; writing—review and editing: A.E.-H.; visualization: A.A. and F.E.M.; supervision: M.A. and A.A. All authors have read and agreed to the published version of the manuscript.

Funding

This research received no external funding.

Data Availability Statement

The data that support the findings of this study are included within the article.

Acknowledgments

The authors would like to thank the National Centre for Scientific and Technical Research of Morocco (CNRST) for providing technical facilities for characterization.

Conflicts of Interest

The authors declare no conflicts of interest.

References

  1. Kotwal, P.; Jasrotia, R.; Himanshi; Prakash, J.; Kandwal, A.; Raja, V.; Sharma, N.; Kumar, R. A Review on the Synthesis, Properties and Multifunctional Applications of Transition and Rare-Earth Doped Nickel Spinel Ferrite. E3S Web Conf. 2024, 509, 01011. [Google Scholar] [CrossRef]
  2. AlMatri, E.; Madkhali, N.; Mustafa, S.; Lemine, O.M.; Algessair, S.; Mustafa, A.; Ali, R.; El-Boubbou, K. Preparation, Characterization, and Antibacterial Activity of Various Polymerylated Divalent Metal-Doped MF2O4 (M = Ni, Co, Zn) Ferrites. Polymers 2025, 17, 1171. [Google Scholar] [CrossRef]
  3. Roy, P.; Hoque, S.M.; Akter, S.; Liba, S.I.; Choudhury, S. Study on the Chemical Co-Precipitation Synthesized CoFe2O4 Nanoparticle for Magnetocaloric Performance in the Vicinity of Superparamagnetic Blocking Temperature. Heliyon 2024, 10, e34413. [Google Scholar] [CrossRef]
  4. Divyarani, K.; Sreenivasa, S.; Kumar, S.; Vinod, A.; Alharethy, F.; Jeon, B.-H.; Devi, V.S.A.; Martis, P.; Parashuram, L. Fabrication of a Novel MOF Template-Derived ZnCo2O4 Composite for the Non-Enzymatic Electrochemical Detection of Glucose. Results Chem. 2024, 8, 101604. [Google Scholar] [CrossRef]
  5. Lin, Z.; Ma, B.; Chen, Z.; Cheng, L.; Zhou, Y. Exploring B-Site High-Entropy Configuration of Spinel Oxides for Improved Cathode Performance in Solid Oxide Fuel Cells. J. Eur. Ceram. Soc. 2024, 44, 2233–2241. [Google Scholar] [CrossRef]
  6. Helal, H.; Ahrouch, M.; Rabehi, A.; Zappa, D.; Comini, E. Nanostructured Materials for Enhanced Performance of Solid Oxide Fuel Cells: A Comprehensive Review. Crystals 2024, 14, 306. [Google Scholar] [CrossRef]
  7. Bashal, A.H.; Hefnawy, M.A.; Ahmed, H.A.; El-Atawy, M.A.; Pashameah, R.A.; Medany, S.S. Green Synthesis of NiFe2O4 Nano-Spinel Oxide-Decorated Carbon Nanotubes for Efficient Capacitive Performance—Effect of Electrolyte Concentration. Nanomaterials 2023, 13, 2643. [Google Scholar] [CrossRef]
  8. Zhang, R.; Qin, C.; Bala, H.; Wang, Y.; Cao, J. Recent Progress in Spinel Ferrite (MFe2O4) Chemiresistive Based Gas Sensors. Nanomaterials 2023, 13, 2188. [Google Scholar] [CrossRef]
  9. Sani, Y.; Syahidah Azis, R.; Ismail, I.; Yaakob, Y.; Karim, M.K.A.; Binti Saad, N.K.; Mohammed, J. Structural, Thermal Morphological, and Magnetic Properties of Ni1−xLaxFe2−xCsxO4 (x = 0.1,0.2) Spinel Ferrite Prepared via Coprecipitation Method. Nano-Struct. Nano-Objects 2024, 37, 101093. [Google Scholar] [CrossRef]
  10. Nyamaa, O.; Kang, G.-H.; Huh, S.-C.; Yang, J.-H.; Nam, T.-H.; Noh, J.-P. Unraveling the Mechanism and Practical Implications of the Sol-Gel Synthesis of Spinel LiMn2O4 as a Cathode Material for Li-Ion Batteries: Critical Effects of Cation Distribution at the Matrix Level. Molecules 2023, 28, 3489. [Google Scholar] [CrossRef]
  11. Mykhailovych, V.; Caruntu, G.; Graur, A.; Mykhailovych, M.; Fochuk, P.; Fodchuk, I.; Rotaru, G.-M.; Rotaru, A. Fabrication and Characterization of Dielectric ZnCr2O4 Nanopowders and Thin Films for Parallel-Plate Capacitor Applications. Micromachines 2023, 14, 1759. [Google Scholar] [CrossRef] [PubMed]
  12. Tong, W.; Wang, W.; Leng, X.; Song, J. Influences of Composite Electrodeposition Parameters on the Properties of Ni-Doped Co-Mn Composite Spinel Coatings. Materials 2024, 17, 1200. [Google Scholar] [CrossRef] [PubMed]
  13. Ghalib, B.; Hessien, M. Magnetic and Antibacterial Properties of Substituted Cobalt Spinel Ferrite Nanocomposites Synthesized via Henna Green Microwave Hydrothermal Method. Sci. Rep. 2025, 15, 16653. [Google Scholar] [CrossRef] [PubMed]
  14. Alamro, F.S.; Hefnawy, M.A.; Nafee, S.S.; Al-Kadhi, N.S.; Pashameah, R.A.; Ahmed, H.A.; Medany, S.S. Chitosan Supports Boosting NiCo2O4 for Catalyzed Urea Electrochemical Removal Application. Polymers 2023, 15, 3058. [Google Scholar] [CrossRef]
  15. Amirthavalli, R.; Begum, A.N.; Parthibavarman, M.; Mithran K S, V. A Study of Electrochemical Properties of Fe Doped Spinel Copper Cobaltite CuCo2O4 for Supercapacitor Application. Chem. Phys. Impact 2025, 11, 100907. [Google Scholar] [CrossRef]
  16. Emami, S. Oxalate-Assisted Synthesis of MnCo2O4 Nanoparticles on Layered MXene (Ti3C2Tx) for Supercapacitor Application. Electrochem. Commun. 2025, 178, 107995. [Google Scholar] [CrossRef]
  17. Radhi, A.A.; Al-Rubaiey, S.I.J.; Al-Rubaye, S. Ordered FeCo2O4 & Polypyrrole Particles/Branch Nanotrees Arrays Grown on Carbon Fiber Cloth Substrate for Energy Storage Applications. Mater. Today Commun. 2024, 38, 108345. [Google Scholar] [CrossRef]
  18. Sitole, S.; Bilibana, M.P.; Ross, N. Electrochemical Performance of ZnCo2O4: Versatility in Applications. J. Compos. Sci. 2025, 9, 105. [Google Scholar] [CrossRef]
  19. Wang, S.; Ding, N.; Han, D.; Wang, P.; Dang, Y.; Xu, P.; Sui, Y.; Wei, Y. Synergistic Effect of Fluorine Doping and Oxygen Vacancies on Electrochemical Performance of ZnCo2O4 for Advanced Supercapacitors and Zn-Ion Batteries. Acta Mater. 2023, 257, 119190. [Google Scholar] [CrossRef]
  20. Anwar, A.; Zulfiqar, S.; Yousuf, M.A.; Ragab, S.A.; Khan, M.A.; Shakir, I.; Warsi, M.F. Impact of Rare Earth Dy+3 Cations on the Various Parameters of Nanocrystalline Nickel Spinel Ferrite. J. Mater. Res. Technol. 2020, 9, 5313–5325. [Google Scholar] [CrossRef]
  21. Yaemphutchong, S.; Singkammo, S.; Suetrong, N.; Jantaratana, P.; Chanseanpak, K.; Chuewongkam, N.; Pinitsoontorn, S.; Panomsuwan, G.; Chaiamart, N.; Hanlumyuang, Y.; et al. Effects of Sm3+ Doping on Magnetic and Electrical Properties of Ternary Cobaltite Spinels. Ceram. Int. 2025, 51, 26811–26820. [Google Scholar] [CrossRef]
  22. Mandal, B.; Roy, R.; Mitra, P. Fabrication of Different Rare Earth Incorporated ZnCo2O4 Matrix via Chemical-Mechanical Hybrid Mechanism and Study Their Charge Carrier Dynamics by Motts VRH Model. J. Alloys Compd. 2021, 879, 160432. [Google Scholar] [CrossRef]
  23. Yin, D.; Yang, H.; Wang, S.; Yang, Z.; Liu, Q.; Zhang, X.; Zhang, X. Ce-Doped ZnCo2O4 Nanospheres: Synthesis, Double Enzyme-like Performances, Catalytic Mechanism and Fast Colorimetric Determination for Glutathione. Colloids Surf. A Physicochem. Eng. Asp. 2020, 607, 125466. [Google Scholar] [CrossRef]
  24. Khaled, I.; Bagtache, R.; Kadri, M.; Chergui, A.; Trari, M. Physical and Photo-Electrochemical Properties of the Hetero-Junction ZnCo2O4/ZnO Prepared by Nitrate Route: Application to Photodegradation of Indigo Carmine. Inorg. Chem. Commun. 2024, 159, 111818. [Google Scholar] [CrossRef]
  25. El-Habib, A.; Brioual, B.; Zimou, J.; Rossi, Z.; Marjaoui, A.; Zanouni, M.; Aouni, A.; Jbilou, M.; Diani, M.; Addou, M. Comparative Studies on the Structural, Optical and Electrochemical Properties of Gd, Nd and In-Doped CeO2 Nanostructured Thin Films. Mater. Sci. Semicond. Process. 2024, 176, 108287. [Google Scholar] [CrossRef]
  26. Gouadria, S.; Abudllah, M.; Ahmad, Z.; John, P.; Nisa, M.U.; Manzoor, S.; Aman, S.; Ashiq, M.N.; Ghori, M.I. Development of Bifunctional Mo Doped ZnAl2O4 Spinel Nanorods Array Directly Grown on Carbon Fiber for Supercapacitor and OER Application. Ceram. Int. 2023, 49, 4281–4289. [Google Scholar] [CrossRef]
  27. Priyadharshini, P.; Pushpanathan, K. Synthesis of Ce-Doped NiFe2O4 Nanoparticles and Their Structural, Optical, and Magnetic Properties. Chem. Phys. Impact 2023, 6, 100201. [Google Scholar] [CrossRef]
  28. Silambarasan, M.; Ramesh, P.S.; Geetha, D.; Ravikumar, K.; Ali, H.E.; Algarni, H.; Soundhirarajan, P.; Chandekar, K.V.; Shkir, M. A Facile Preparation of Zinc Cobaltite (ZnCo2O4) Nanostructures for Promising Supercapacitor Applications. J. Inorg. Organomet. Polym. Mater. 2021, 31, 3905–3920. [Google Scholar] [CrossRef]
  29. Cui, Q.; Yang, Q.; Wang, W.; Yao, J.; Liu, Z.; Zuo, X.; Zhu, K.; Li, G.; Jin, S. Controllable Synthesize Core-Shelled Zn0.76Co0.24S Nanospheres as the Counter-Electrode in Dye-Sensitized Solar Cells and Its Enhanced Electrocatalytic Performance. J. Mater. Sci. Mater. Electron. 2020, 31, 1797–1807. [Google Scholar] [CrossRef]
  30. Ya, M.; Wang, Y.; Wang, J.; Gao, G.; Zhao, X.; Geng, Z.; Li, G.; Li, L. Temperature-Induced Lattice Distortion in ZnCo2O4 for Improving Electrocatalytic Oxygen Evolution Reaction. ACS Sustain. Chem. Eng. 2023, 11, 15451–15459. [Google Scholar] [CrossRef]
  31. Dolla, T.H.; Lawal, I.A.; Kifle, G.W.; Jikamo, S.C.; Matthews, T.; Maxakato, N.W.; Liu, X.; Mathe, M.; Billing, D.G.; Ndungu, P. Mesoporous Mn-Substituted MnxZn1−xCo2O4 Ternary Spinel Microspheres with Enhanced Electrochemical Performance for Supercapacitor Applications. Sci. Rep. 2024, 14, 11420. [Google Scholar] [CrossRef]
  32. Chen, J.; Zhan, J.; Zhang, Y.; Tang, Y. Construction of a Novel ZnCo2O4/Bi2O3 Heterojunction Photocatalyst with Enhanced Visible Light Photocatalytic Activity. Chin. Chem. Lett. 2019, 30, 735–738. [Google Scholar] [CrossRef]
  33. Heiba, Z.K.; Mohamed, M.B.; Abdellatief, M.; Arafat, S.W.; Sanad, M.M.S.; Badawi, A. Enhancement the Electrical and Linear/Nonlinear Optical Properties of ZnCo2O4 through Al3+ doping. Phys. B Condens. Matter 2024, 689, 416172. [Google Scholar] [CrossRef]
  34. Chen, H.-Y.; Chen, P.-C. P-Type Spinel ZnCo2O4 Thin Films Prepared Using Sol-Gel Process. Appl. Surf. Sci. 2020, 505, 144460. [Google Scholar] [CrossRef]
  35. Abd-Elrahman, M.I.; Rashad, L.; Mohamed, H.A.; Taya, Y.A.; Abu El-Fadl, A. Novel Syntheses of Wide-Band Gap Semiconducting CdxZnx−1Co2O4 of Spinel Nanostructure: Characterization and Optical Properties. J. Inorg. Organomet. Polym. Mater. 2024, 35, 3857–3864. [Google Scholar] [CrossRef]
  36. El-Habib, A.; Brioual, B.; Bouachri, M.; Zimou, J.; Aouni, A.; Diani, M.; Addou, M. Synthesis and Characterization of Nd-Doped CeO2 Thin Films Grown by Spray Pyrolysis Method: Structural, Optical and Electrochemical Properties. Surf. Interfaces 2024, 45, 103859. [Google Scholar] [CrossRef]
  37. Brik, M.G.; Srivastava, A.M.; Popov, A.I. A Few Common Misconceptions in the Interpretation of Experimental Spectroscopic Data. Opt. Mater. 2022, 127, 112276. [Google Scholar] [CrossRef]
  38. Seeman, V.; Feldbach, E.; Kärner, T.; Maaroos, A.; Mironova-Ulmane, N.; Popov, A.I.; Shablonin, E.; Vasil’chenko, E.; Lushchik, A. Fast-Neutron-Induced and as-Grown Structural Defects in Magnesium Aluminate Spinel Crystals with Different Stoichiometry. Opt. Mater. 2019, 91, 42–49. [Google Scholar] [CrossRef]
  39. Kiryakov, A.N.; Zatsepin, A.F.; Osipov, V.V. Optical Properties of Polyvalent Iron Ions and Anti-Site Defects in Transparent MgAl2O4 Ceramics. J. Lumin. 2021, 239, 118390. [Google Scholar] [CrossRef]
  40. Heiba, Z.K.; Ahmed, M.A.; Hassan, M.; Badawi, A.; El-naggar, A.M.; Mohamed, M.B. Sonochemical Synthesis of Ag2CO3/CeO2 p-n Heterojunction for Decomposition of Rhodamine B Dye. Opt. Mater. 2023, 141, 113945. [Google Scholar] [CrossRef]
  41. Elthair, N.A.; Mustafa, E.M.; Elbadawi, A.A. The Electrical and Optical Properties of Zn0.5Li2xMg0.5-xFe2O4 Lithium Doped Nanoparticle Prepared by Coprecipitation Method. Open J. Appl. Sci. 2020, 10, 551–560. [Google Scholar] [CrossRef]
  42. Lin, S.-H.; Wu, Y.-L.; Yu, R.-S.; Liu, J.-H.; Kaneko, S.; Miao, H.-Y. Characterization of Semiconductor Properties and Applications of Mg-Doped ZnCo2O4 Spinel-Structured Thin Films. Mater. Chem. Phys. 2025, 342, 130943. [Google Scholar] [CrossRef]
  43. Javed, H.; Iqbal, F.; Agboola, P.O.; Khan, M.A.; Warsi, M.F.; Shakir, I. Structural, Electrical and Magnetic Parameters Evaluation of Nanocrystalline Rare Earth Nd3+-Substituted Nickel-Zinc Spinel Ferrite Particles. Ceram. Int. 2019, 45, 11125–11130. [Google Scholar] [CrossRef]
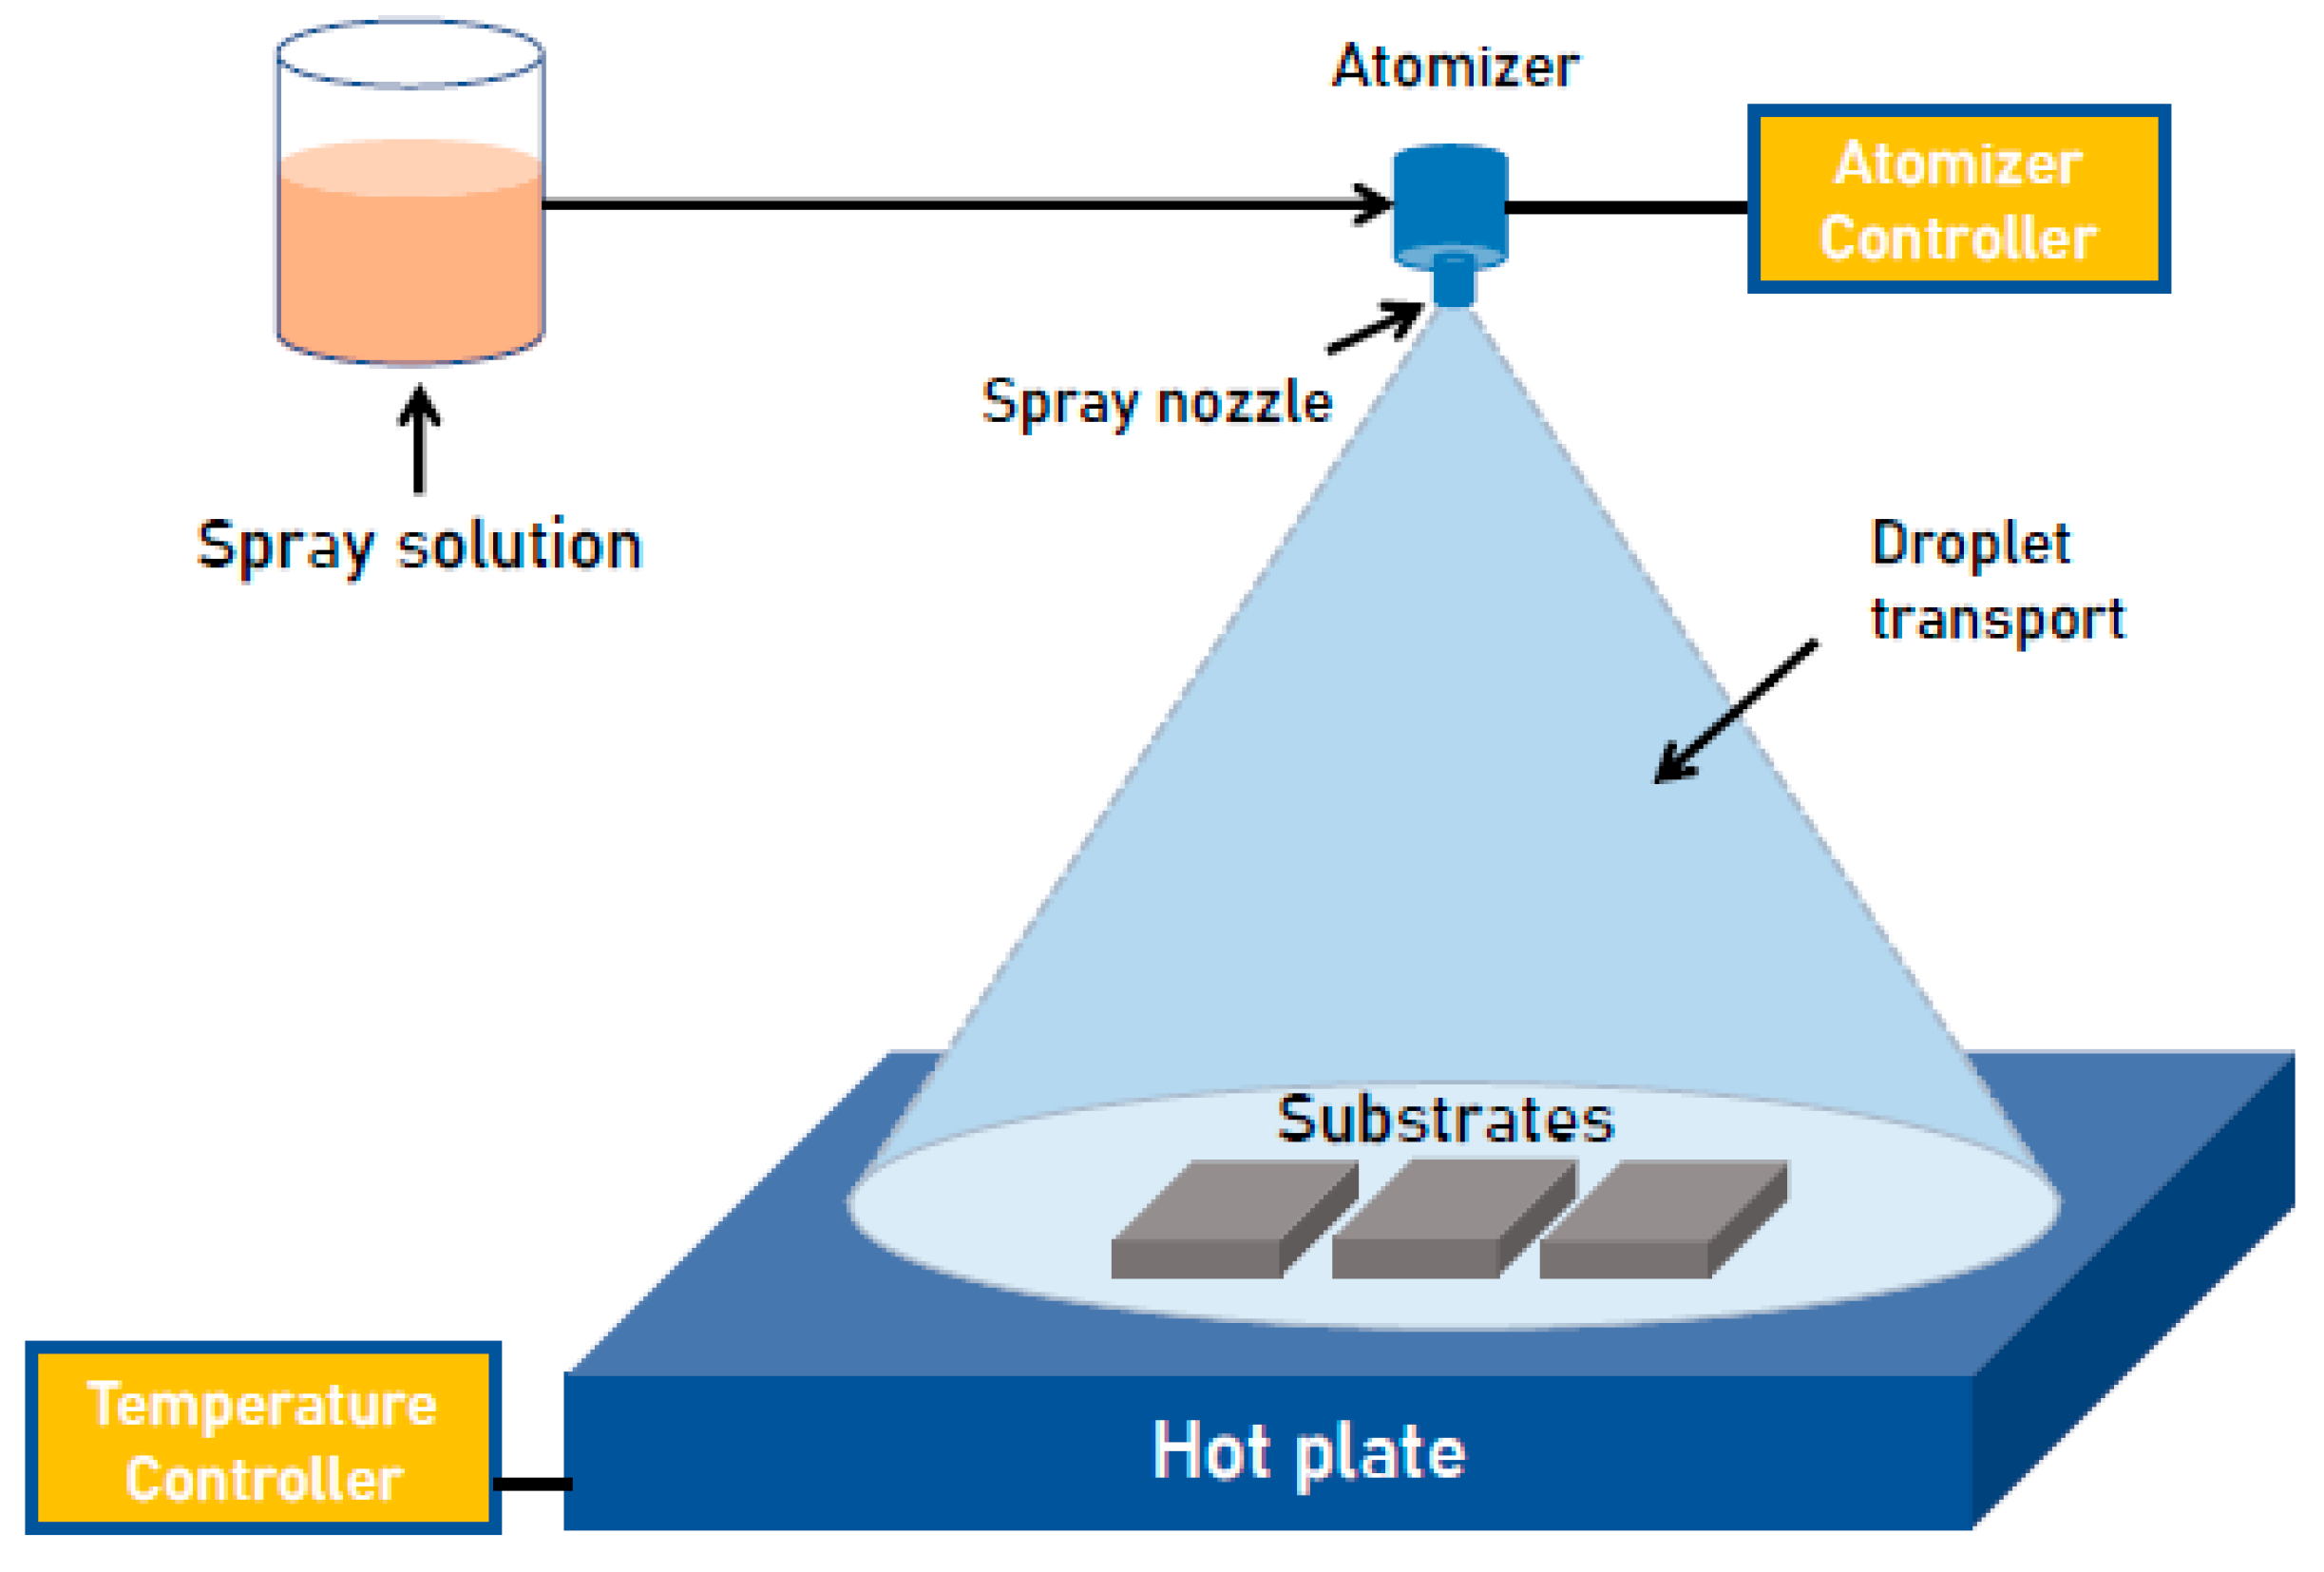
Figure 1. Schematic representation of the formation process of Z n C e x C o 2 x O 4   ( x   =   0.0 ,   0.01 ,   0.03 ,   0.05 ) nanostructured thin films.
Crystals 15 00742 g001
Figure 2. (a) XRD patterns of Z n C e x C o 2 x O 4   ( x   =   0.0 ,   0.01 ,   0.03 ,   0.05 ) thin films. (b) Shifts in the (311) diffraction peak due to doping. (c) Lattice parameter, FWHM (Gaussian fit), and crystallite size (D) from the Debye–Scherrer equation, shown as a function of dopant rate.
Crystals 15 00742 g002
Figure 3. Raman spectra of Z n C e x C o 2 x O 4 thin films with different concentrations of Ce (x = 0.00, x = 0.01, x = 0.03, x = 0.05), under an excitation of λ = 532 nm.
Crystals 15 00742 g003
Figure 4. SEM images of Z n C e x C o 2 x O 4 films with different doping concentrations: (a) x = 0.00, (b) x = 0.01, (c) x = 0.03, and (d) x = 0.05. (e) Cross-sectional image of the undoped film.
Crystals 15 00742 g004
Figure 5. The particle size distribution histograms of Z n C e x C o 2 x O 4   ( x   =   0.0 ,   0.01 ,   0.03 ,   0.05 ) films, analyzed using ImageJ, were fitted to lognormal curves represented by solid red lines.
Crystals 15 00742 g005
Figure 6. EDS spectra of Z n C e x C o 2 x O 4   ( x = 0.0 , 0.01 , 0.03 , 0.05 ) nanostructured thin films.
Crystals 15 00742 g006
Figure 7. The EDS mapping spectra of Z n C e x C o 2 x O 4 thin films for x = 0.00, x = 0.01, x = 0.03, and x = 0.05.
Crystals 15 00742 g007
Figure 8. (a) Absorbance and (b) transmittance spectra of Z n C e x C o 2 x O 4   ( x   =   0.0 ,   0.01 ,   0.03 ,   0.05 ) samples.
Crystals 15 00742 g008
Figure 9. Tauc plot for Z n C e x C o 2 x O 4   ( x   =   0.0 ,   0.01 ,   0.03 ,   0.05 ) samples.
Crystals 15 00742 g009
Figure 10. Variation of the absorption coefficient α (a) and the extinction coefficient k (b) as a function of wavelength for Z n C e x C o 2 x O 4   ( x   =   0.0 ,   0.01 ,   0.03 ,   0.05 ) thin films.
Crystals 15 00742 g010
Figure 11. (a) Correlation between optical conductivity (σ) and wavelength (λ). (b) Plot of ln (α) vs. hν for Z n C e x C o 2 x O 4   ( x   =   0.0 ,   0.01 ,   0.03 ,   0.05 ) thin films.
Crystals 15 00742 g011
Figure 12. Hall-effect measurements of Z n C e x C o 2 x O 4   ( x   =   0.0 ,   0.01 ,   0.03 ,   0.05 ) thin films showing carrier concentration, Hall coefficient, resistivity, and mobility.
Crystals 15 00742 g012
Table 1. Structural characteristics of nanostructured Z n C e x C o 2 x O 4   ( x   =   0.0 ,   0.01 ,   0.03 ,   0.05 ) thin films, as determined through XRD analysis.
Samples2θ (°)FWHM (Rad)a (Å)D (nm)ε × 10−3δ × 10−3 (nm−2)
x = 0.0037.0620.00958.0384 ± 0.00215.388 ± 0.8102.253 ± 0.1194.223 ± 0.444
x = 0.0137.0570.01118.0394 ± 0.00213.119 ± 0.5882.642 ± 0.1195.810 ± 0.521
x = 0.0337.0470.01178.0413 ± 0.00212.461 ± 0.5312.782 ± 0.1196.440 ± 0.549
x = 0.0537.0380.01278.0432 ± 0.00211.492 ± 0.4523.016 ± 0.1197.572 ± 0.595
Table 2. Optical parameters were measured at a wavelength of 550 nm for Z n C e x C o 2 x O 4   ( x   =   0.0 ,   0.01 ,   0.03 ,   0.05 ) films.
Samplesnkσopt × 1014 (S−1)α (×104 cm−1)Eg (eV)Eu (eV)
Eg1 (eV)Eg2 (eV)
x = 0.001.40 ± 0.100.488 ± 0.0183.74 ± 0.3011.16 ± 0.402.32 ± 0.023.38 ± 0.020.984 ± 0.02
x = 0.011.19 ± 0.100.674 ± 0.0244.41 ± 0.3615.45 ± 0.562.26 ± 0.023.18 ± 0.021.019 ± 0.02
x = 0.031.30 ± 0.100.567 ± 0.0204.05 ± 0.3313.01 ± 0.472.23 ± 0.023.24 ± 0.021.018 ± 0.02
x = 0.051.46 ± 0.100.433 ± 0.0163.46 ± 0.279.91 ± 0.362.20 ± 0.023.35 ± 0.021.033 ± 0.02
Disclaimer/Publisher’s Note: The statements, opinions and data contained in all publications are solely those of the individual author(s) and contributor(s) and not of MDPI and/or the editor(s). MDPI and/or the editor(s) disclaim responsibility for any injury to people or property resulting from any ideas, methods, instructions or products referred to in the content.