Review

Field-Effect Crystal Engineering in Proton–π-Electron Correlated Systems

Core Electronics Technology Research Institute (CETRI), National Institute of Advanced Industrial Science and Technology (AIST), Tsukuba 305-8565, Japan
*
Author to whom correspondence should be addressed.
Crystals 2025, 15(8), 736; https://doi.org/10.3390/cryst15080736
Submission received: 20 June 2025 / Revised: 15 August 2025 / Accepted: 16 August 2025 / Published: 19 August 2025
(This article belongs to the Special Issue Polymorphism and Phase Transitions in Crystal Materials)

Abstract

Dielectric crystals with switchable electric polarizations represent the key functional materials utilized for a broad range of practical applications. They allow for academically intriguing platforms, where the use of a strong external electric field can potentially unveil hidden crystal phases. Proton–π-electron correlated bistable systems turn out to be promising for exploring such electrically induced crystal polymorphisms, mainly because strong π-electronic polarization can be sensitively switched depending on mobile hydrogen locations. Pseudo-symmetry and hydrogen disorder are utilized as clues for the data mining of the Cambridge Structural Database in the search for molecular candidates with novel switchable dielectrics. The polarization hysteresis, electrostriction, and second harmonic generation of the candidates were experimentally evaluated, together with the re-inspection of crystal structure. This feature article highlights the rich variation and competition of some candidate polarization configurations and switching modes in close relation to high and efficient electrical energy storage/discharge, large electrostriction effects, polarization rotations, and multistage switching phenomena. The experimental findings are well-reproduced by the computational optimization of crystal structure and the simulation of the switchable polarization, piezoelectric coefficients, and relative stability for each of the real or hypothetical hydrogen-ordered crystal phases. Effective prediction and strategic design are thereby guaranteed by systematically understanding the appropriate integration of experimental, computational, and data sciences.

1. Introduction

Polymorphism is the ability of a solid-state compound to exist in two or more crystalline modifications through variations of the interatomic and intra/inter-molecular interactions. Enantiotropic polymorphism, which transforms polymorphs into one another via reversible phase transitions, is a ubiquitous phenomenon in materials and can change a variety of their physical properties and functionalities. Particularly, those transforming solid-state polarization states can, in principle, be coupled with the electric input, and this continues to be a hot research target from the viewpoint of developing modern electronic, electromagnetic, electro-optic, electromechanical, and electrocaloric devices [1,2]. Typical polarization-switching phenomena can be related to specific dielectric crystals called ferroelectrics and antiferroelectrics, in which the switchable dipole moments at polar sites can be reversibly flipped by inverting the direction of the external electric field. Hydrogen-bonded bistable π-molecular systems are attractive targets because the delocalized π-electrons can generate switchable polarizations strongly coupled with mobile hydrogen locations. Here, we provide a comprehensive overview of the recent experimental and theoretical findings regarding the rich variation of π-molecular systems and the competition of candidate polarization configurations and switching modes, which occasionally cause high and efficient electrical energy storage/discharge, large electrostriction effects, polarization rotations, and multistage switching phenomena. Section 1.1 introduces polarization configurations for ferroelectrics, antiferroelectrics, and paraelectrics, as well as their schematic transformations under external stimuli. Section 1.2 explains why we have focused on hydrogen-bonded π-molecular organic crystals as promising research targets. After an overview of the materials and properties of antiferroelectric compounds developed in the precedented works, this section closes with an outline of the whole article.

1.1. Polarization Configurations and Crystal Polymorphs

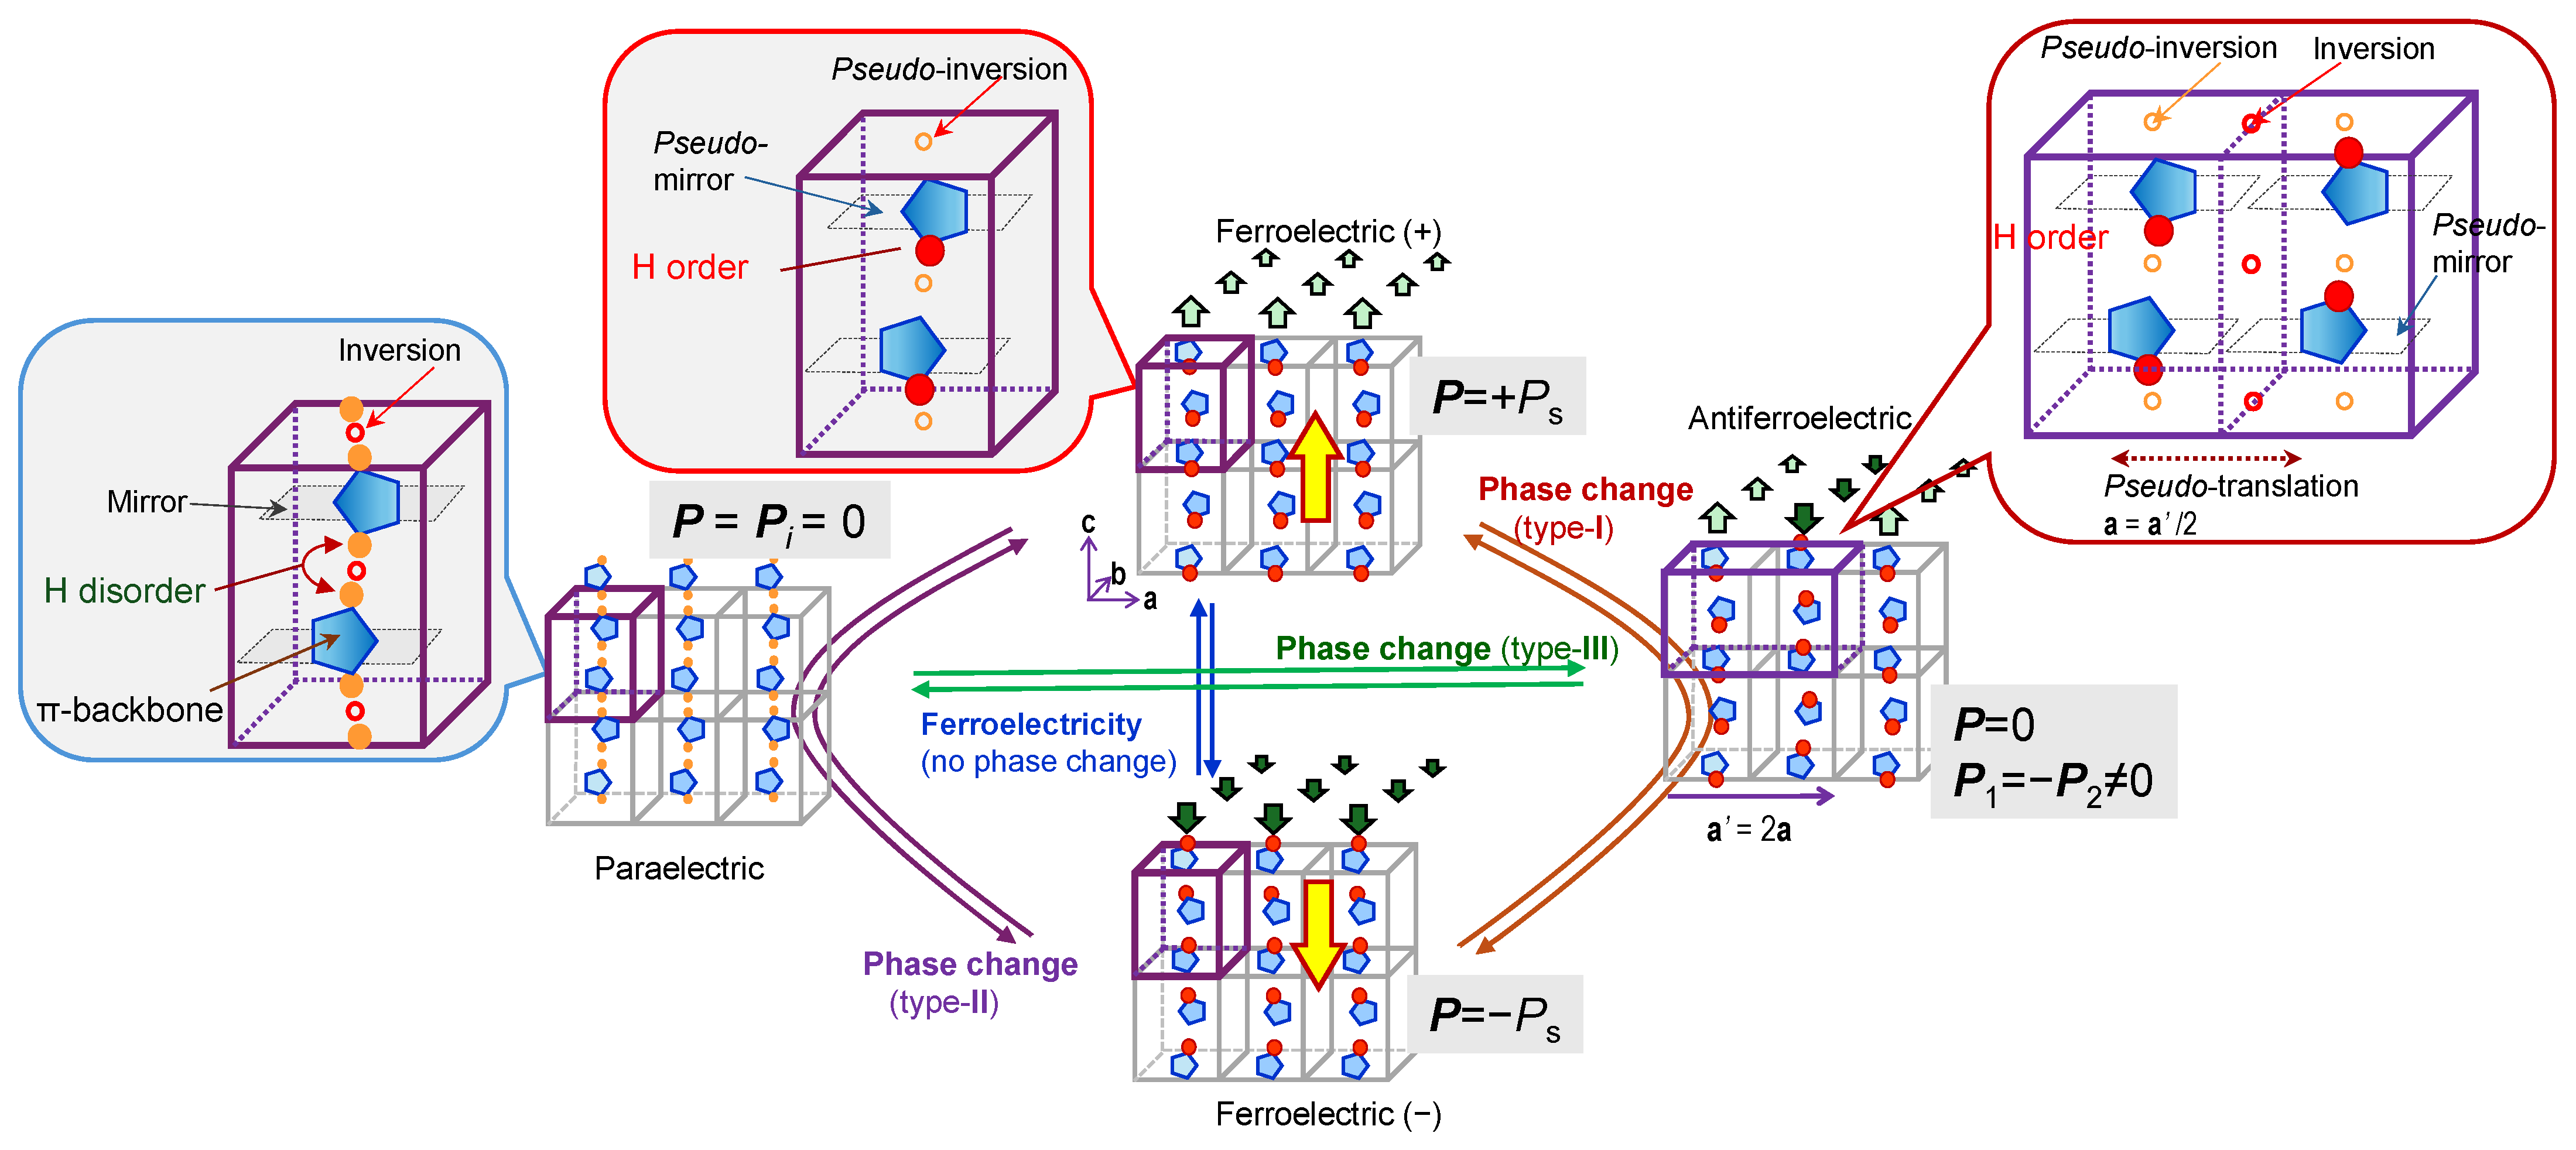
Figure 1 schematically depicts the simplest ionic displacement model, with representative configurations of the site polarization that emerges with electrically driven phase transitions/polymorphisms. Ferroelectric materials belong to a special class of polar crystalline compounds; they consist of an ordered (crystalline) array of switchable polarizations, which all point in the same direction, generating spontaneous polarization Ps. Their typical polarization–electric field (PE) curve draws a single loop that has a rectangular shape. Note that normal “ferroelectricity” itself is not categorized according to phase transition, that is, the reversal/rotation of Ps under external field E retains the same ferroelectric crystal form. The most familiar phase transition of ferroelectrics is the thermally induced version called ferroelectric transition, where the polar crystal sites are lost in the paraelectric (PE) phase through the orientational disorder or displacement of atoms to new symmetric locations above the Curie temperature. At temperatures just above the first-order ferroelectric phase transition, the strong electric field can induce the ferroelectric (FE) phase, accompanied by the PE double loop [3]. Hereafter, the field-induced PE–FE transition is denoted as a “type-II phase change” to avoid confusion with the antiferroelectrics discussed below.
The main target dielectrics in this article are those that undergo a field-induced FE state, as observed in antiferroelectrics (AFEs), the sister of ferroelectrics. In the AFE crystal, there remain polar crystal sites, but the antiparallel arrangement with their adjacent versions cancels out the macroscopic switchable polarization. The antiferroelectric (AFE) crystal form is described by the interpenetrating sublattices, in which there are finite switchable (sublattice) polarizations P1, P2, ⋯ (PiPj for ij). Here, the i P i = 0 corresponds to antiferroelectrics; otherwise, the relation corresponds to ferrielectrics. Figure 1 illustrates the two sublattice models with P2 = −P1. The important characteristic of antiferroelectrics is that the energy stability of the AFE state relative to its FE modification should be tiny enough to be reversed with the application of the external field. Although the electrically induced AFE–FE transition (designated as “type-I phase change” herein) draws a double PE hysteresis loop, observation alone cannot discriminate type-I and type-II processes. The PE and AFE phases of zero polarization are distinguished from each other by the absence and presence of the interpenetrating polar sublattices, respectively, conveniently observed using any diffraction techniques. After the theoretical prediction and experimental confirmation of this in PbZrO3 ceramics [4,5,6] in the early 1950s, antiferroelectricity was mainly revealed in oxides and inorganic salts, such as many lead perovskite compounds, NaNbO3, NH4H2PO4 (ADP), and Hf1−xZrxO2. For a long time, it received much less interest than ferroelectricity, until becoming a hot research target for applications regarding electrostatic energy storage devices, including high- or pulsed power systems [7]. Note that the promising candidates are not limited to electrically induced FE states [8]. The latest investigations unravel field-induced PE–PE phase transitions without the FE phase emerging in 2%mol-Y2O3-ZrO2 crystals [9]. This phenomenon is called “susceptibility mismatch phase transformation” because its driving force is the difference in dielectric susceptibility between the two PE phases. The corresponding PE hysteresis curve is different from that of type I and type II when compared (Figure 1). For convenience herein, this PE–PE transition will be called type IV, whereas type III designates the AFE–PE transition, which a temperature change can typically induce.

1.2. Hydrogen Bonds for Strong Polarizations

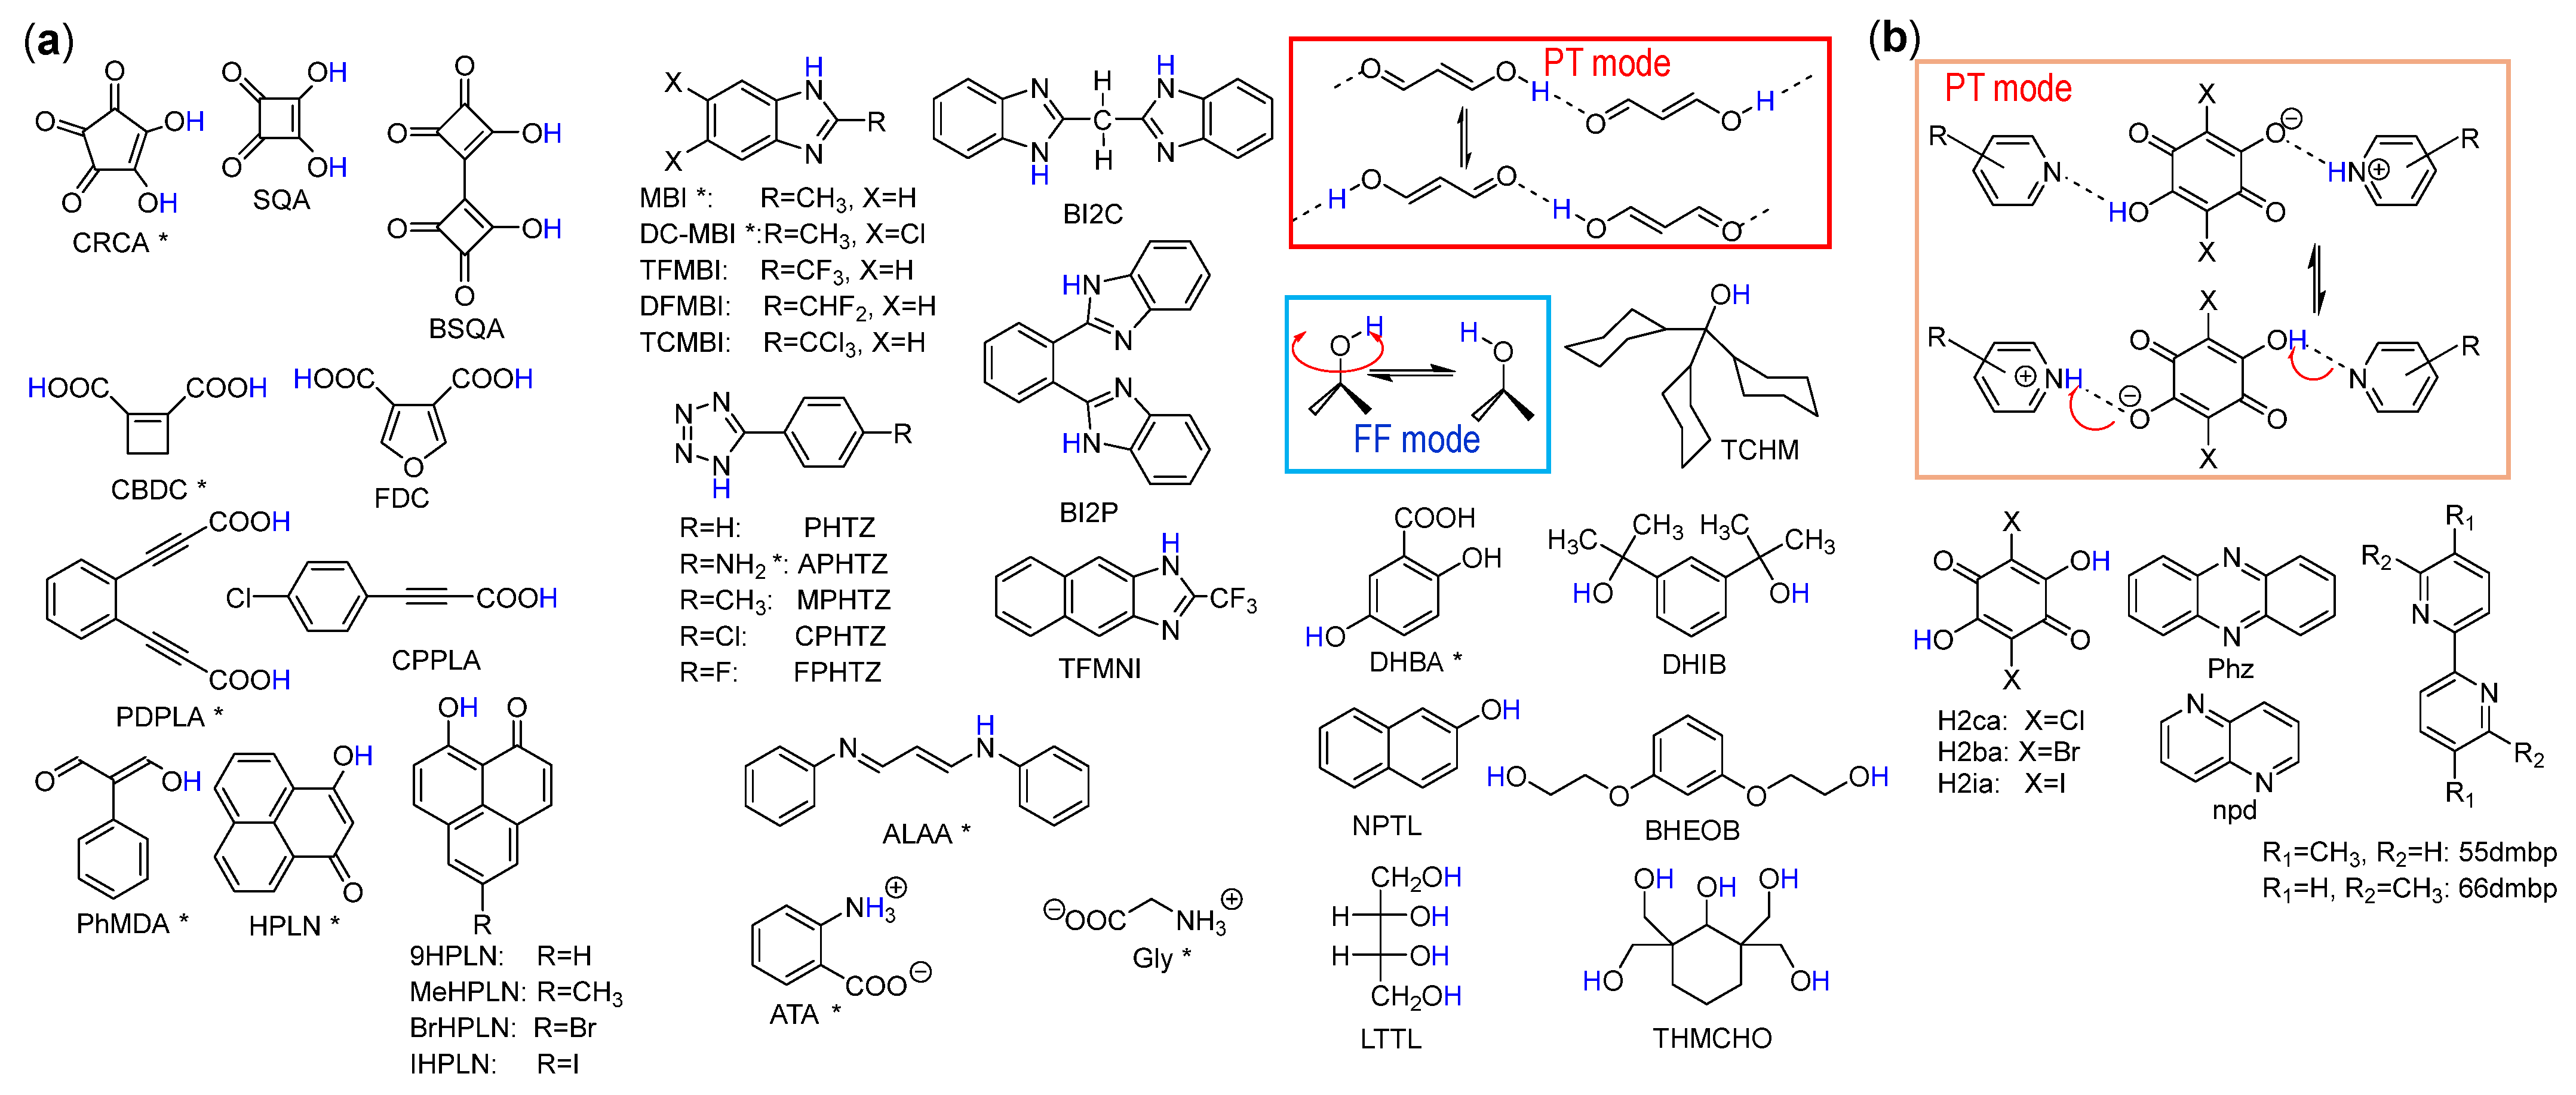
Organic molecular ferroelectrics and antiferroelectrics are lead-free alternative candidates and have potential industrial advantages such as flexibility, biocompatibility, light weight, and low-temperature processability. Nevertheless, overcoming the outstanding performance of existing lead-based ferroelectrics is still a challenging task [10,11,12,13,14,15,16,17,18,19]. In the last two decades, extensive explorations on the bistable hydrogen-bonded molecular sequence have disclosed strong polarization, low-field operation, and above-room-temperature (anti)ferroelectricity [10,20]. Figure 2 shows the chemical structures for the hydrogen-bonded dielectrics considered in this article, including the single-component ferroelectrics and phase-change dielectrics studied in this work (listed in Table 1). Proton–π-electron correlated systems, such as a β-diketone O=C–C=C–OH unit [21], represent the most successful designs, as highlighted in the top box of the figure. The switchable dipoles are formed by asymmetric locations of hydrogen atoms within the hydrogen bonds. The switchable polarizations not only originate from the relative ionic displacement of H+ (proton) within the hydrogen bond due to thermal hopping or tunneling motion (the so-called “proton transfer” (PT) process) but are also greatly amplified by the simultaneous readjustment of the π-electronic state through coupling to the hydrogen. The record high switchable polarizations of croconic acid (CRCA; 30 μC/cm2) and squaric acid (SQA; 17 μC/cm2) [22,23,24,25] among the molecular systems are generated by the cooperative prototropy (or “proton tautomerism”) of π-molecules, which relocate the hydrogen positions and simultaneously interchange double bonds with the adjacent single bonds [26,27]. Another class comprises binary molecular compounds, in which cooperative motion of protons between acid and base molecules triggers the reversal of spontaneous or sublattice polarization [14,20]. For example, in the neutral or proton-transferred ionic cocrystals of anilic acids (2,5-dihalo-3,6-dihydroxy-p-benzoquinones), the hydrogen-bonded supramolecular architectures of alternating acid and base molecules are dipolar and bistable (Figure 2b). The advantage of hydrogen-bonded ferroelectrics above is the low coercive field Ec (typically 0.5~50 kV/cm) in comparison with those of ferroelectric polymers (>0.3 MV/cm) [11]. The thermally robust FE phase often veils the Curie point Tc, even beyond the temperatures of fusion, sublimation, or decomposition.

1.3. Hydrogen-Bonded Antiferroelectric Crystals in Earlier Studies

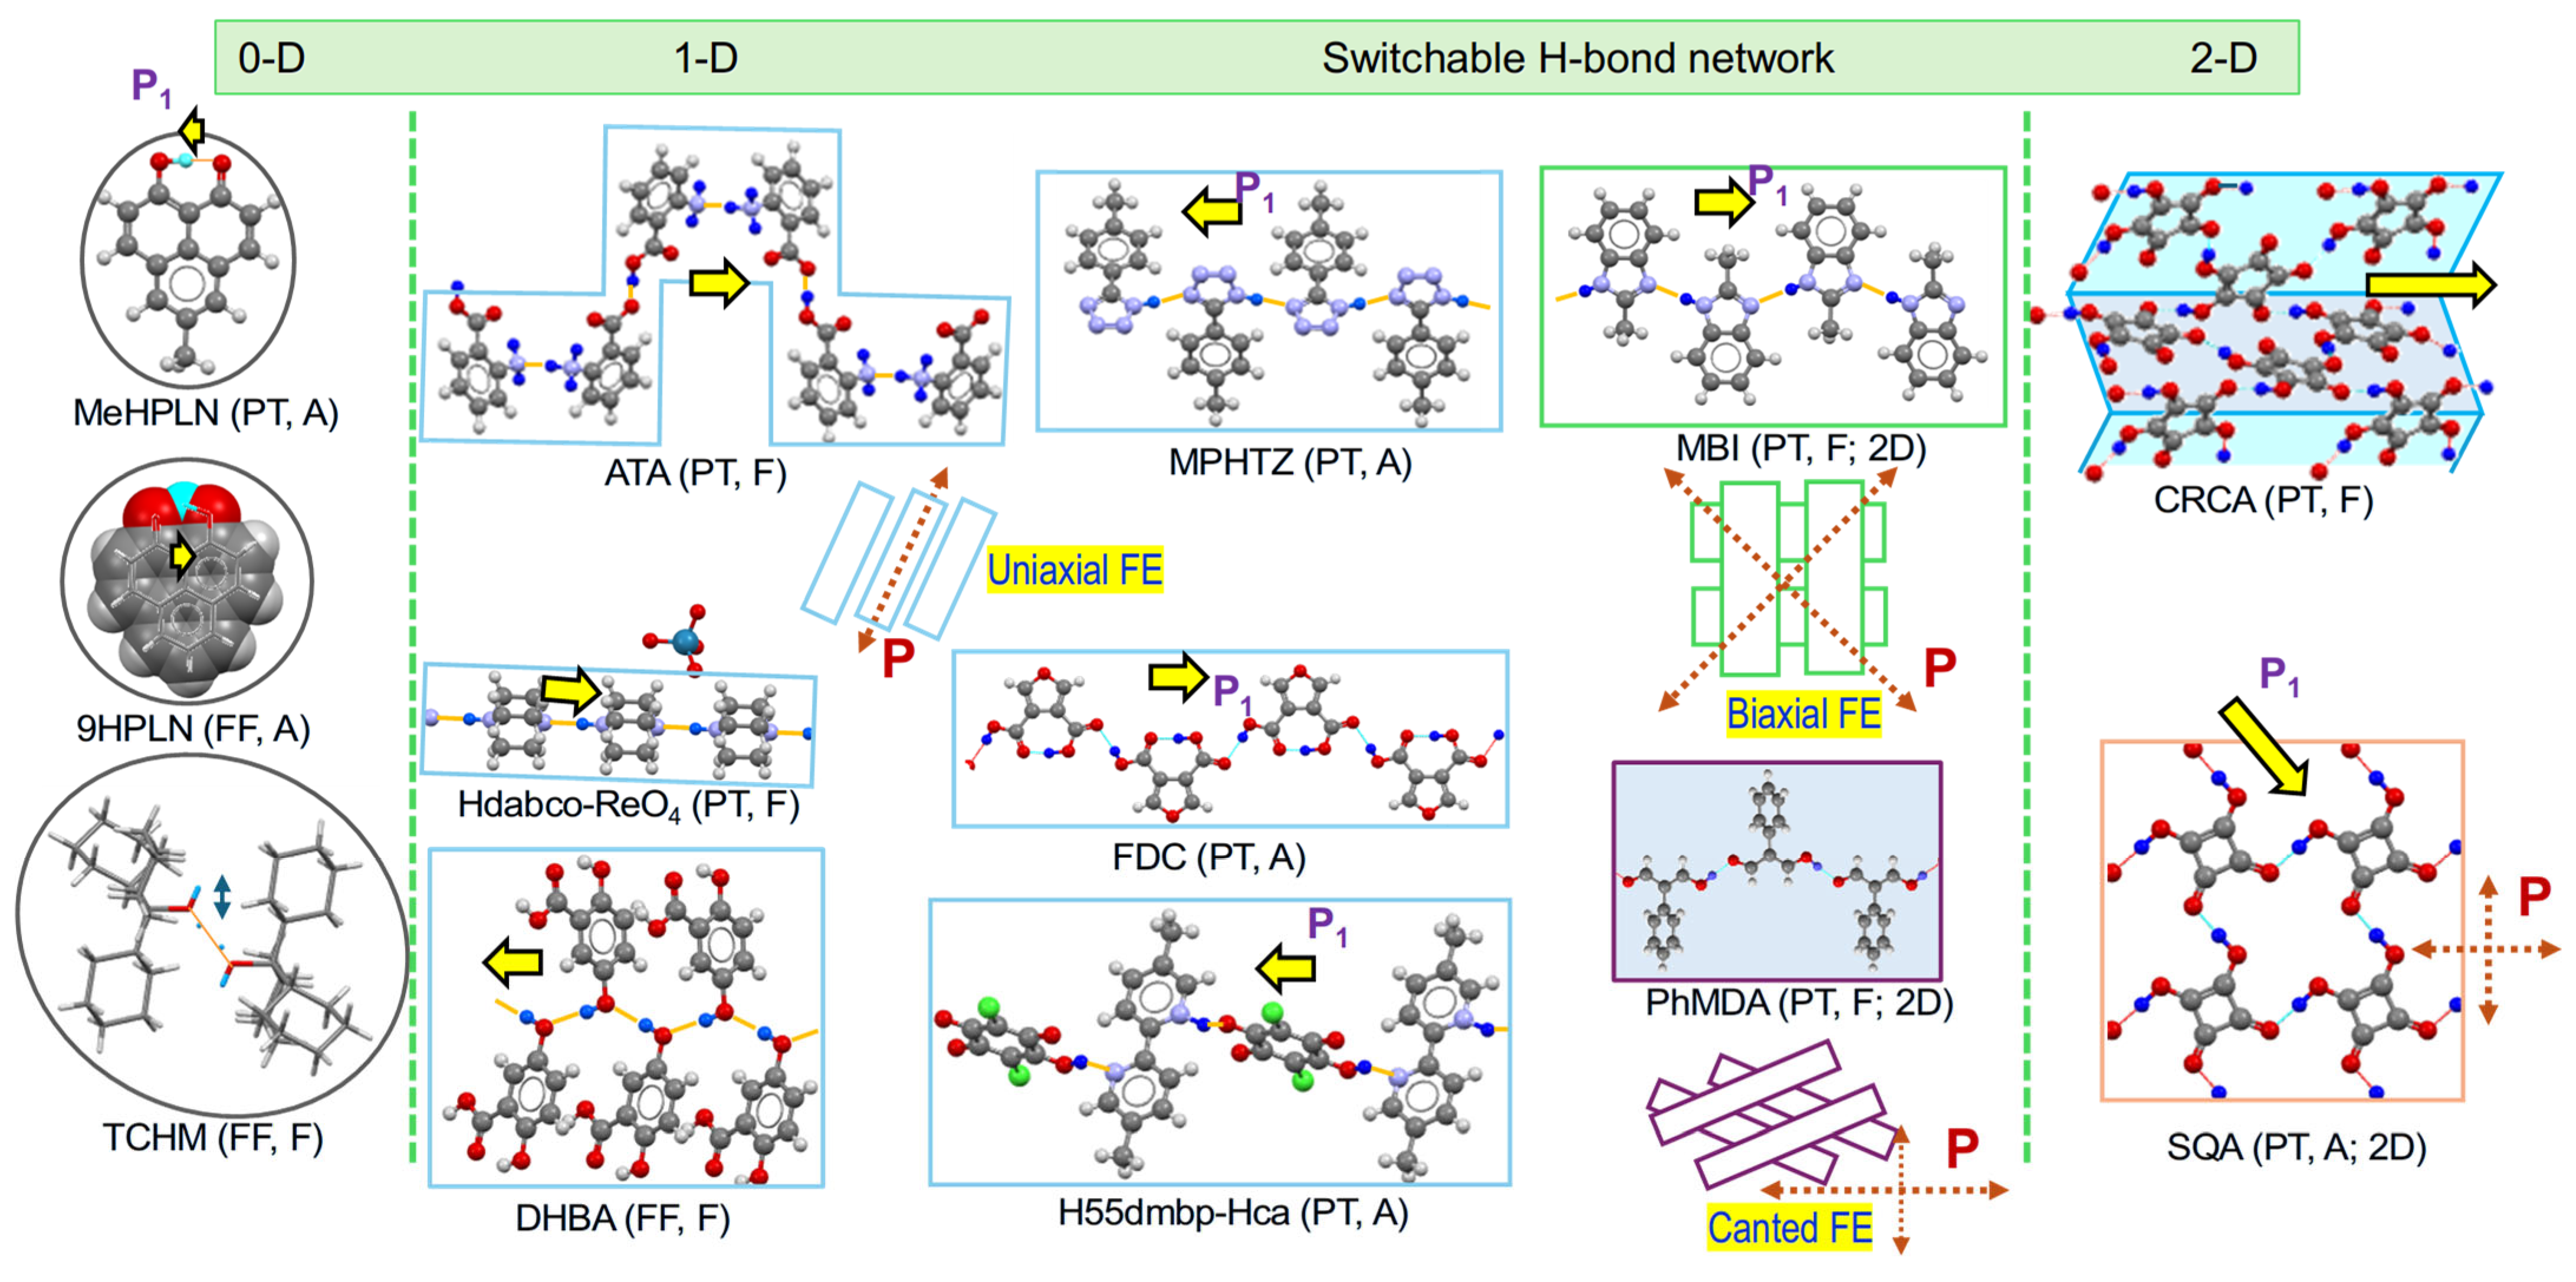
Before our work, several hydrogen-bonded organic crystals were regarded as antiferroelectrics, but their electrically induced FE phases were not demonstrated via PE hysteresis experiments. The polarization switching of SQA (3,4-dihydroxy-3-cyclobutene-1,2-dione) was uncharacterized until more than half a century after its synthesis [55]. One of the major reasons is the required switching fields being much higher than the Ec of ferroelectric counterparts, as shown below. In contrast to the symmetric potential profile for the FE state, the asymmetric AFE–FE switching should overcome the energy barrier being lifted by the finite energy difference between the AFE and FE states. The temperature-induced PE–AFE phase transition (type-III process), signaled by a sharp peak or cusp in the temperature-dependent permittivity, often replaces the traditional criterion of judging antiferroelectrics. Including these examples, more than 10 antiferroelectrics belong to the prototropic type. Here, we introduce the reported prototropic antiferroelectrics classified according to the dimensionality of the hydrogen-bonded network (Figure 3), and we provide an overview of their chemical variations with some intriguing physical properties.
A few prototropic antiferroelectrics constitute zero-dimensional (0-D) systems, in which keto–enol forms are exchanged rapidly by the tautomerization process within the molecule at room temperature. The isomorphous series of 5-substituted 9-hydroxyphenalenones (9HPLN) revealed some intriguing dielectric physics associated with proton tunneling after the discovery by Sugawara and Mochida et al. [56,57,58,59]. In a 5-methyl-substituted MeHPLN crystal, the proton motion inverts the transverse dipole moment of ~0.4 D dynamically. It triggers the AFE ordering at 41 K, accompanied by a sharp permittivity peak [56] and the formation of a twofold superlattice [60]. The AFE order emerges because the tunneling frequency is reduced by the lowered local symmetry about the methyl group. In contrast, the halogen-substituted BrHPLN [56] and IHPLN [59] crystals display quantum paraelectricity; the permittivity monotonously increases with decreasing temperature and levels off below 10 K without the occurrence of a phase transition. Deuterium substitution of the hydrogen atom involved in a hydrogen bond can cause a reappearance of suppressed phase transition [59,61]. Each hydrogen atom occupies two equivalent sites, as revealed by both nuclear and electron density distributions from the neutron and X-ray diffraction studies by Kiyanagi et al. [62]. All the observations above have been consistently understood by using the tunneling mechanism. Note that the proton tunneling observed herein does not modify the intramolecular O···O distance on the rigid π-bond backbone. This observation contrasts with the case of KDP ferroelectrics, in which geometrical isotope effects cause positive feedback, accelerating the increment in Tc. Note that the dielectric behavior observed in the unsubstituted 9HPLN is relevant to the bulk flip motion of the dipolar molecular disk itself, instead of the inner prototropic process [58].
Many hydrogen-bonded dielectrics comprise one-dimensional (1-D) extended chains or 2-D layers formed by intermolecular hydrogen bonds in head-to-tail configurations (Figure 3). Each molecule should accommodate the hydrogen donor and acceptor moieties on both ends of the molecule. The switchable polarizations adopt uniaxial orientation because all the hydrogen-bonded chains are parallel, unless specifically noted (Figure 3). At the early stage, Katrusiak and Szafrański et al. investigated structural phase transitions in the antipolar crystals of OH···O bonded 1-D molecular chains of the cyclic β-diketoalkanes. However, the transition behaviors were different from those typical of antiferroelectric transition [63]. Their succeeding studies discovered ferroelectricity and large spontaneous polarizations along the NH···N bonded bistable 1-D chains of monoprotonated aliphatic ammonium cations Hdabco+ (dabco = diazabicyclo[2.2.2]octane) in organic–inorganic hybrid compounds [64]. The first ferroelectric proton–π-electron correlated system discovered in our studies is a phenazine-chloranilic acid (Phz-H2ca) cocrystal, which comprises 1-D supramolecular chains of alternating quasi-neutral acid and base molecules [65]. Soon after, several antiferroelectric crystals exhibiting Tc near or above room temperature were obtained from the proton-transfer reaction of anilic acids with different π-electron bases such as dimethyl-2,2′-bipyridines (55dmbp, 66dmbp) or 1,5-naphthyridine (npd) (Figure 2) [66,67]. Occasionally, the hydrogen-bonded chains are arranged in orthogonal or inclined arrays, as shown in Figure 3, causing noncollinear (biaxial or canted) sublattice polarizations, together with interesting switching phenomena, as shown in Section 5. From the viewpoint of improving polarizations, the extended 1-D or 2-D architectures are advantageous over the 0-D systems noted above; the mobile protons and π-electron systems serve as additive (or subtractive) contributions to the switchable polarizations in the former (or the latter) systems [23,60]. Later, this molecular design principle, combined with the data mining of the crystal structural database, led us to find several single-component ferroelectrics and antiferroelectrics, as shown in Section 3.
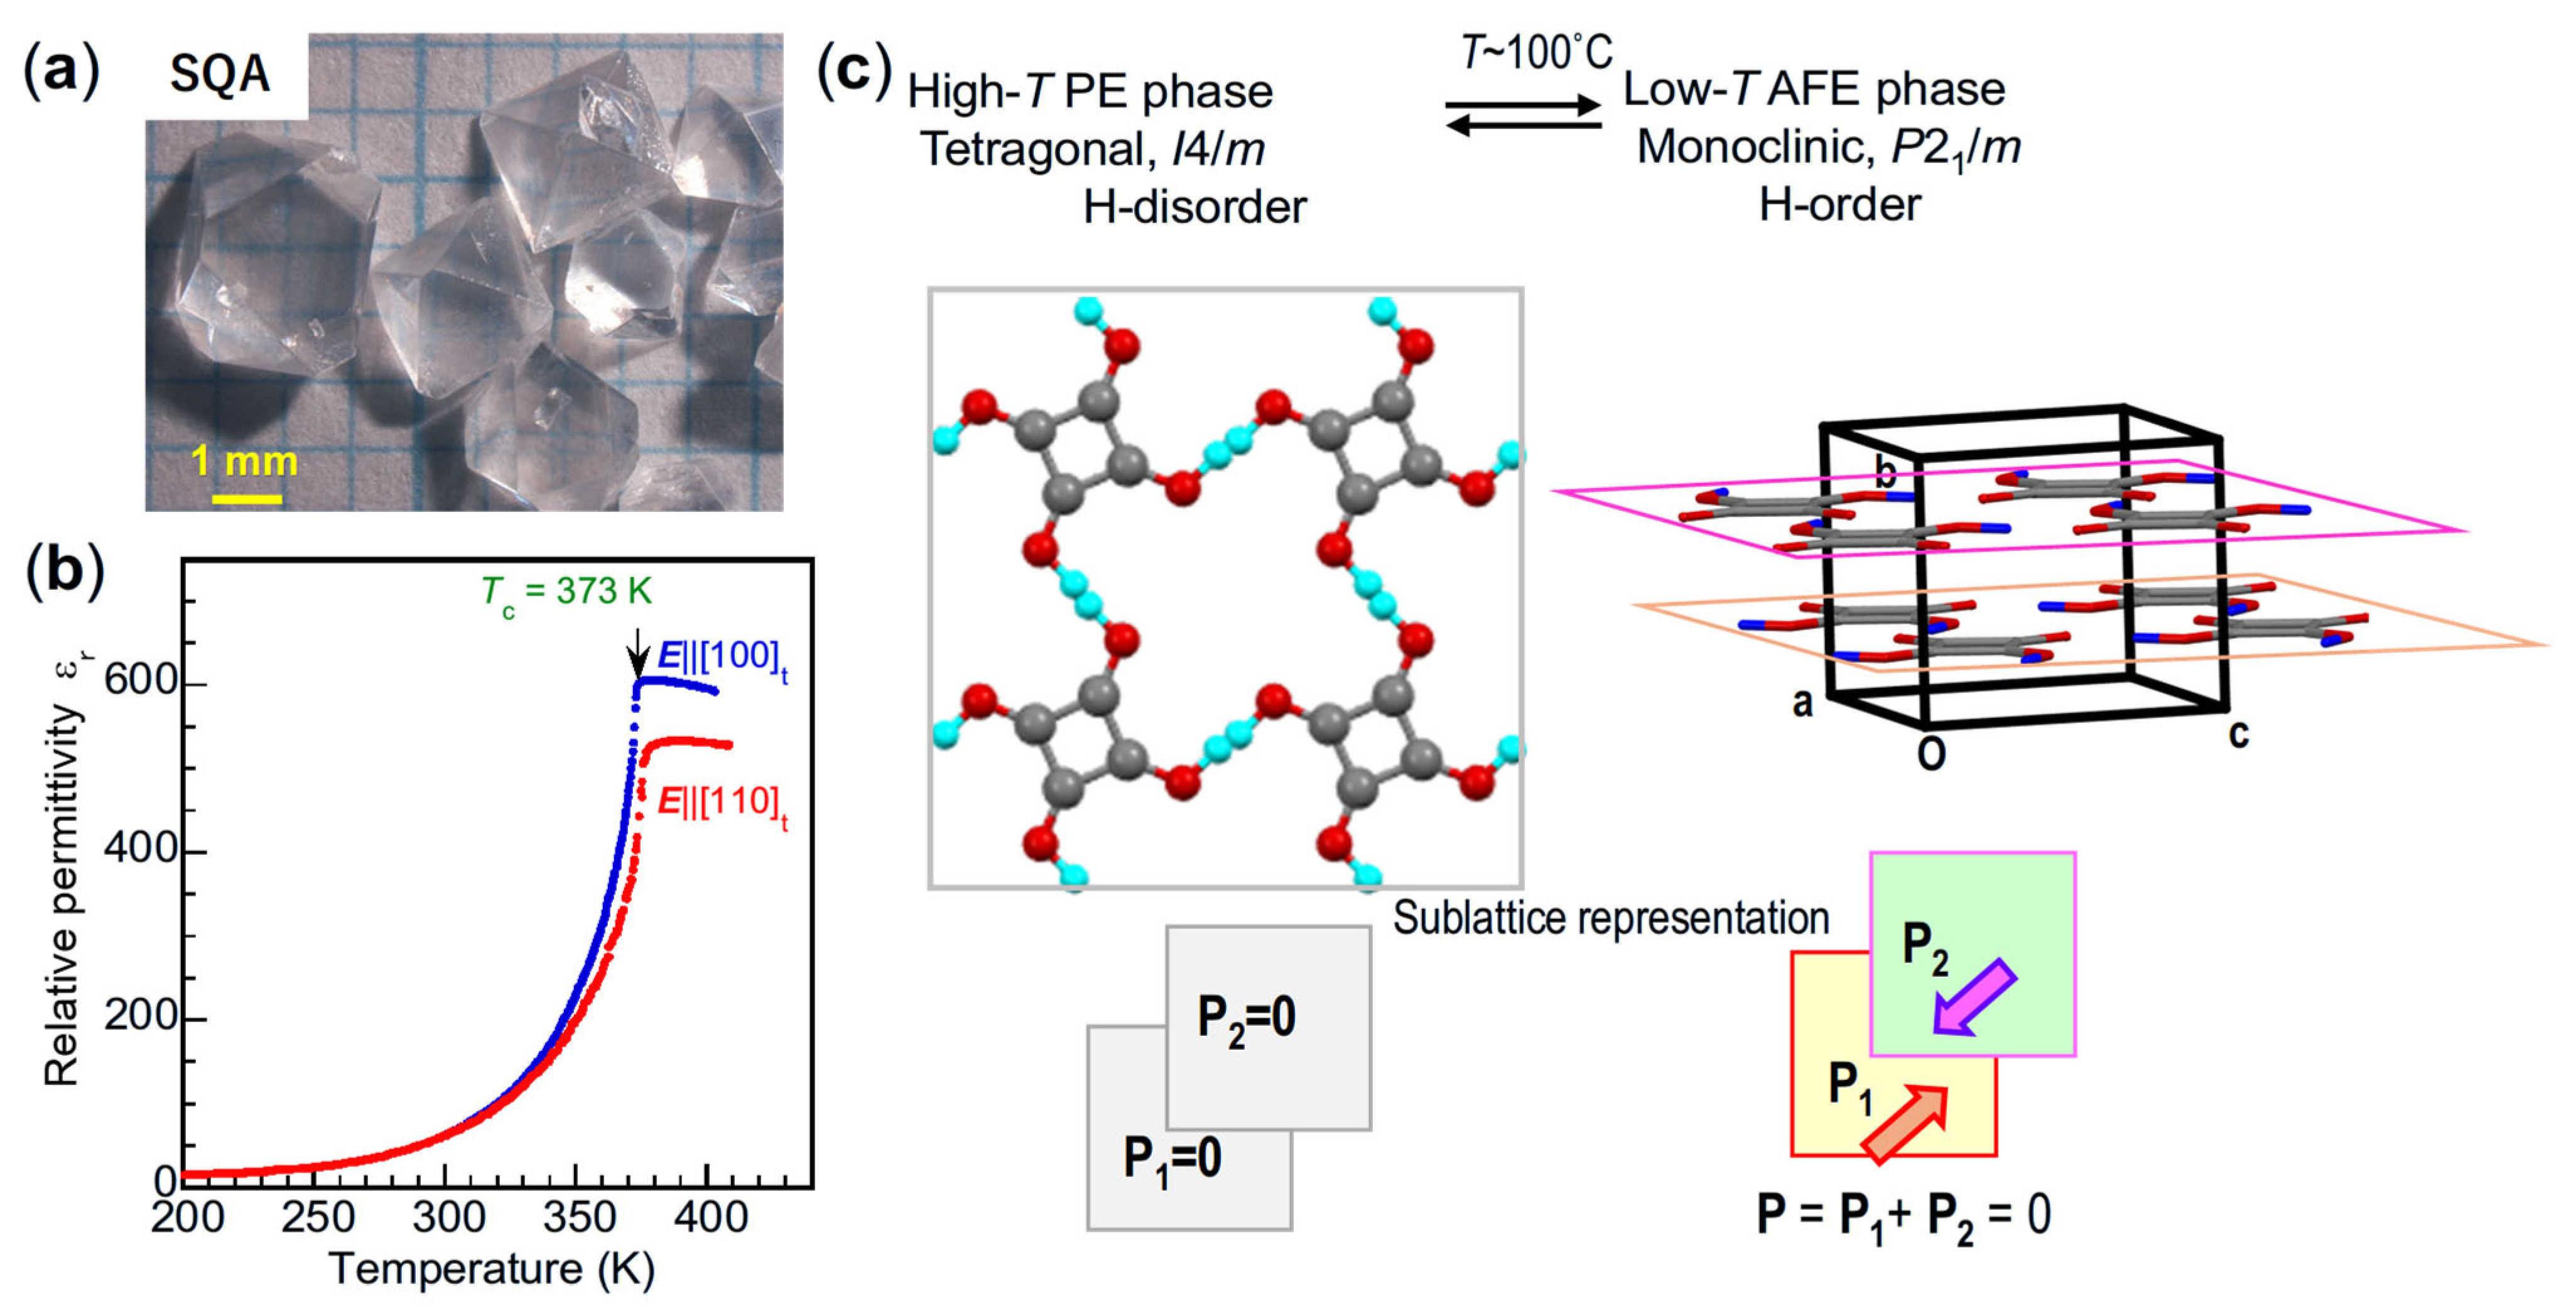
The square planar SQA molecule has a peculiar chemical structure, affording a biaxial nature in both the hydrogen-bonded molecular sequences and polarization orientations. Semmingsen discovered that the linear chain network formed by the intermolecular OH∙∙∙O hydrogen bonds is orthogonally crossed at each molecule, forming a flat, 2-D sheet parallel to the crystallographic ac plane (Figure 4) [36,55]. The structural change at Tc = 373 K reveals characteristics of order–disorder dynamics [68]. The PE phase belongs to the body-centered tetragonal lattice of space group I4/m. The disordered proton over each O∙∙∙O hydrogen bond and a C4O42− unit of exactly square symmetry (D4h) changes the polar crystal sites into nonpolar versions. In the AFE phase, the symmetry is reduced to a primitive monoclinic lattice with space group P21/m, and proton ordering is accompanied by C1h-type asymmetric distortion of the C4O4 core with alternating single and double bonds. Each crystallographic mirror plane accommodates the molecular sheet, which acquires a sublattice polarization P1, therein being antiparallel to the sublattice polarization P2 = −P1 of the nearest neighbor planes. The in-plane permittivity εr exhibits a large maximum, exceeding 600 at Tc, below which εr starts to steeply decrease (Figure 4b) [69]. This partly explains the origin of the good electrostatic energy storage properties, as shown in Section 5.7. The SQA crystal demonstrates many fascinating phase transition chemistry attributes and physics: proton tunneling [70], 2-D antiferroelectricity [71], molecular symmetry changes from C1h to C4h, quantum phase transition under high pressure [72], and the coexistence of displacive and order–disorder features at the phase transition [73], as well as finding structurally related, 2-D dielectric, bisquaric acids [74,75].
The realization of 3-D polarization switching is a remaining challenge for π-molecular ferroelectrics and antiferroelectrics. As the details are organized as follows, uniaxial and biaxial polarization switching can endow enriched variation and/or competition of local polarization configurations and switching modes, enough to cause high functionalities and scientifically exotic findings.
Section 2 starts with the data mining principle using pseudo-symmetry and hydrogen disorder with the crystal structural database for screening ferroelectrics and antiferroelectrics. Section 3 addresses the experimental evaluations and results of electric and second harmonic generation (SHG) measurements performed on a variety of extracted candidates. Section 4 describes the theoretical evaluation background and computational methods for simulating electric polarizations and related properties. The density functional theory calculations, together with the Berry phase formalism, reproduce the experimentally observed parameters; this is appealing for precise predictions from the crystal structures. In Section 5, integrated experimental and theoretical assessments are applied to gain a systematic understanding of the inter-relationship among microscopic, mesoscopic, and macroscopic properties, which are summarized for establishing future effective materials prediction and design strategies. This article also contains some new results: SHG (Section 3.2), electromechanical properties (Section 5.8), and case studies (Section 5.10).

2. Material Explorations Using the Crystal Structural Database

2.1. Pseudo-Symmetry Assessment

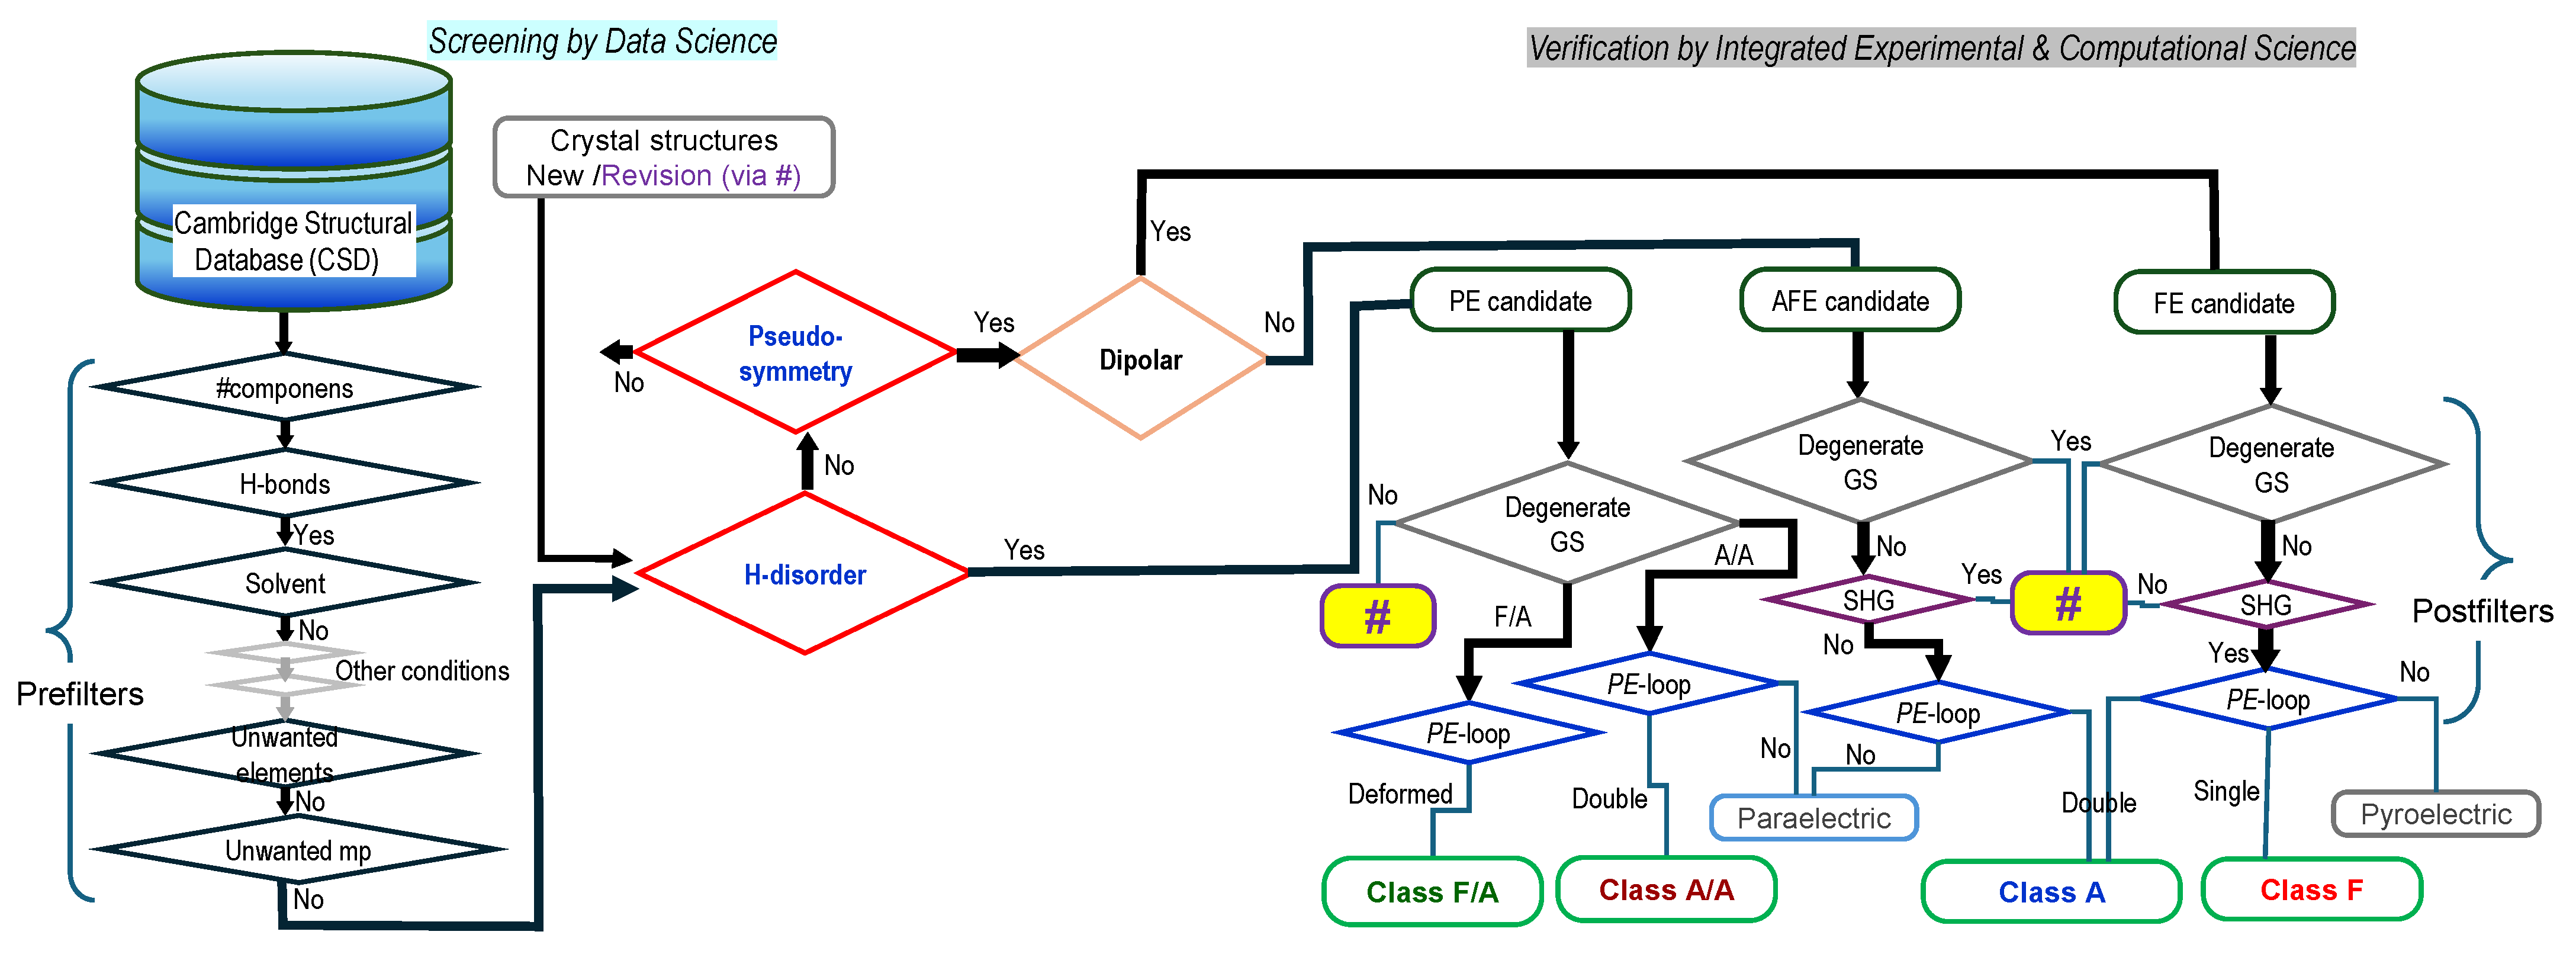
As explained by Figure 1 and Figure 5, ferroelectrics and antiferroelectrics have their specific structure–property relationships, which are suitable for emerging materials informatics. These can be used to realize the high-throughput screening of target functional materials among numerous known compounds by applying the principles of informatics [76]. In our investigations, the corresponding decoding of material-specific information has been carried out considering two structural requirements; the first one concerns the overall crystal symmetry. The crystal structures of ferroelectrics belong to one of ten polar point-group symmetries, 1 (C1)*, 2 (C2)*, m (C1h), mm2 (C2v), 4 (C4)*, 4mm (C4v), 3 (C3)*, 3m (C3v), 6 (C6)*, or 6mm (C6v) (an asterisk denotes chiral symmetry), and all of them are accompanied by piezoelectricity [1]. On the other hand, antiferroelectrics require the interpenetrated plural sublattices of non-zero switchable polarizations. The existence of inversion symmetry is characteristic of most antiferroelectric crystals. Otherwise, a polar antiferroelectric represents an exceptional case. For instance, the sublattice polarizations being switchable parallel to the hydrogen-bonded chains happen to be normal in relation to the additional permanent crystal polarity remaining along the longitudinal molecular axis in the PHTZ [31] and TCMBI [29] crystals. In such cases, the corresponding relationships between the sublattice polarizations (PiPj for ij and i P i = 0 ) should be restricted to the switchable components of polarization hereafter. The second requirement of ferroelectrics and antiferroelectrics is the spatial degrees of freedom permitting the reversibility of spontaneous and sublattice polarizations, respectively. Easier polarization switching is expected with the smaller structural deviation from their polarity-averaged intermediate structure, that is, the hypothetical PE-phase prototype. Therefore, the ferroelectrics and antiferroelectrics should have the latent “pseudo elements of symmetry” as key crystallographic signatures that will revive in their respective prototype structures. In proton–π-electron coupled molecular systems, the pseudo-symmetry emerges by ignoring the mobile hydrogen atoms, as schematically illustrated in Figure 5. In the actual structural assessments using the Cambridge Structural Database (CSD), the pseudo-symmetry analysis has been quite successful in discovering many organic ferroelectrics and antiferroelectrics so far. Simultaneously, we noticed that this approach alone is not sufficient for screening, as is detailed below.
The latent “pseudo-symmetry” can be easily detected through the routine validation of CIF files using the ADDSYM function of the PLATON program [77], which is implemented as a part of the IUCr checkCIF program. The inversion symmetry was successfully detected, together with either a rotation, screw, mirror, or glide symmetry, as the missed set of additional symmetries for more than 90% of PT mode ferroelectrics, as shown in Table 1. The hidden “pseudo-inversion symmetry” should be the key clue as the first step of screening unknown ferroelectrics [78,79,80,81,82], especially those of the PT mode [28,83].
Note that antiferroelectric candidates can be found using the analogous screening procedures by focusing on the pseudo-symmetry other than the “pseudo-inversion symmetry”. Recently, Guenon et al. proposed two symmetry-based criteria for the generalization of the definition of antiferroelectric phase transitions [84]. The first is “at the paraelectric to antiferroelectric transition, a set of crystallographic sites undergo a symmetry lowering that results in the emergence of polar sites and gives rise to a local polarization.” The second criterion is “the antiferroelectric space group has a symmorphic polar subgroup coinciding with the local symmetry of emerging polar sites.” The first criterion demands some pseudo-symmetries, which are specified according to the second one. Let us recall that the simplest sublattice model exemplified in Figure 5 exhibits the characteristic pseudo-symmetries of the translational type (accompanying the reduction in or centering of a Bravais lattice). As listed in Table 1, this feature applies to many of the hydrogen-bonded AFE crystals. Moreover, there are also a few alternative cases in which the pseudo-glide plane symmetry plays alternative roles of the translational symmetry.

2.2. Hydrogen Disorder Assessment

The alternative clue regarding screening is the hydrogen disorder in the hydrogen bonds in relation to the appearance versus disappearance, respectively, of desired FE or AFE crystal forms. The hydrogen atom has the least X-ray scattering factor among all the elements and generally contributes little to the reliability factor of structural analysis. This principle makes using the X-ray structural analysis difficult when deciding the crystal symmetry properly regarding whether the hydrogen location is assumed to be symmetric (as centered or twofold disordered) by treating the “pseudo-symmetries” as proper (in the prototype PE crystal form) or not (i.e., the H-ordered FE or AFE crystal form). Drawing such conclusions from a diffraction experiment faces further difficulty when the set of candidate space groups obeys the same systematic extinctions (e.g., C2/c versus Cc space groups) [85]. This is one of the reasons why we often encounter inconsistency between the reported crystal symmetry and our experimental findings. In a series of our studies, the above difficulties were diminished by checking the presence/absence of spontaneous polarization and/or SHG. Explicitly speaking, the hydrogen-disordered PE structures found in the CSD may represent the direct and indirect signs of new ferroelectrics and antiferroelectrics as follows. The “indirect” system means that the FE or AFE crystal form becomes available only after thermal and/or electrical treatment, if the hydrogen disorder is as true as reported. The direct case means that the FE or AFE structure is mistaken for the prototype PE version. Therefore, the hydrogen disorder and pseudo-symmetry may be regarded as two sides of the same coin regarding the clues of data mining the structural database for hydrogen-bonded compounds, except for those with the H-centered hydrogen bonds.

2.3. Additional Issues on Screening

Recently, the CSD contents have reached approximately one million crystal structures [86]. The assessment examined in 2021 found the pseudo-symmetric structures in about 3700 (in total, including duplicates with independent experiments) single-, binary-, or ternary-component, small molecular compounds after eliminating the datasets that contain hydrates, more than 20 carbon atoms, and/or inorganic elements. However, most of these selected datasets at this stage are not satisfactory for the following reasons. Most undesirable are meaninglessly tiny spontaneous (or sublattice) polarizations, which arise from trivial changes in both crystal structures and associated electronic states from the prototype versions. The other unavailable cases stem from the inevitable steric hindrance in the transient state of any switching paths. Many of the candidates were not examined for other reasons: a low melting point or potentially volatile characteristic (including the solvated crystal), chemical instabilities, such as fragility against air oxidation, humidity, thermal, and/or mechanical inputs (shocks), and those evoking concern from the viewpoint of fabrication processes, endurance, and safety issues for practical uses. This article focuses mainly on single-component-type molecular compounds for the sake of systematic arguments.

2.4. Hydrogen-Bonded Dielectrics Extracted

The pseudo-symmetry assessment on CSD successfully shed light on CRCA as the first prototropic ferroelectric [22]. This methodology opened the door to the successful discovery of a series of OH···O bonded ferroelectrics, 2-phenylmalondialdehyde (PhMDA), cyclobutene-1,2-dicarboxylic acid (CBDC), and HPLN soon after [28]. In the subsequent discovery of an NH···N-bonded ferroelectric, 2-methylbenzimidazole (MBI) [29], we noticed that hydrogen disorder was the complementary key to data mining the CSD. At the same time, this benzimidazole unit turned out to be the efficient building block of switchable dielectrics: one ferroelectric (DCMBI) and a few antiferroelectric crystals (TFMBI, DFMBI, and TCMBI) were revealed via crystal structure assessments on commercially available similar benzimidazole derivatives [29]. Anthranilic acid (ATA) crystal (polymorph I) was found to be a unique ferroelectric comprising a 1:1 mixture of neutral and zwitterionic molecules, which has pseudo-inversion symmetry located on each of the intermolecular OH···O and N+H···N bonds [30]. A previous review [20] summarizes more details about the materials discovered above during an earlier period (~2016) of our investigations. In the succeeding sections, we focus on the materials discovered in the latter investigations, together with special emphasis on much enriched variations and competition in the dipole configurations, macroscopic switching behaviors, and microscopic switching mechanisms in a systematic manner.
The latest discovered single-component ferroelectrics and phase-change dielectrics are summarized in Table 1 and Figure 2 (for their chemical structures) [30,31,32,33]. bis(benzimidazole) (BI2P), a series of phenyl-tetrazoles (MPHTZ, APHTZ, and CPHTZ), as well as PDPLA, CPPLA, and DHIB, were extracted using hydrogen disorder, whereas FDC (α-form), BI2C, and DHBA (Form I) were extracted using pseudo-symmetry. The crystal structure of PHTZ was reported first in the hydrogen-ordered FE crystal form and then reinterpreted using hydrogen disorder.

3. Preparation and Property Evaluations

In this study, the improvement of maximum applied fields exceeding 200 kV/cm dramatically increased the opportunity to discover polarization switching, as well as the hidden new phases electrically. The actual screening using the PE hysteresis measurements combined with the database mining resulted in finding many materials and exotic properties, without distinction regarding ferroelectrics and antiferroelectrics. The polarization responses are often accompanied by hybrid behaviors and some confusing characteristics of the crystal structures, as discussed below. In this study, the SHG activity on powdered specimens was also measured on a series of hydrogen-bonded ferroelectrics and antiferroelectrics for supplementary checks regarding the presence/absence of crystal centro-symmetry. One of the most important outcomes is the discovery of SQA exhibiting excellent and efficient electrostatic energy storage. The others include expanded diversity in macroscopic switching type, mesoscopic polarization configurations, and microscopic switching mechanisms.

3.1. Experimental Procedure

The single-component antiferroelectrics, ferroelectrics, and their candidates were purified by temperature-gradient sublimation in a vacuum (if applicable); otherwise, only repeated recrystallization was used. Some compounds are simultaneously obtained as single crystals of suitable size for physical property measurements; otherwise, the slow cooling or evaporation of solution, or sublimation under ambient/reduced pressure, is additionally required. See the corresponding original papers for the sources and detailed preparation procedures specific to each material. The X-ray crystal structure determination or re-examination of candidates was performed at room temperature using a four-circle diffractometer equipped with a 2-D hybrid pixel detector (Rigaku AFC10 with PILATUS200K). CrystalStructure crystallographic software packages [Molecular Structure Corp. (MSC; Woodlands, TX, USA) and Rigaku Corp. (Tokyo, Japan)] were used for the direct method and refinement of the structures. For more details specific to the compounds studied, see the corresponding original references cited in Table 1.
All the electric and electromechanical measurements were performed on single crystals with painted silver electrodes. The crystallographic axes for these measurements were assigned with the aid of X-ray diffraction experiments on the same crystal specimen or a different crystal having a very similar appearance. As-grown crystals with smooth surfaces were used for the experiments unless cuts were needed to diminish the applied maximum voltage. The electric polarization−electric field (PE) hysteresis curves were recorded by applying a high-voltage triangular wave field at various alternating frequencies using a ferroelectrics evaluation system (FCE-1; Toyo Corp., Tokyo, Japan) and a voltage amplifier (HVA4321; NF Corp., Yokohama, Japan). Most of the antiferroelectrics have switching fields much higher than 30 kV/cm (i.e., the approximate dielectric strength of air). Therefore, all the electric measurements were conducted by immersing the crystals in electrically insulating silicone oil.
The direct piezoelectric coefficient d33 was measured using the Berlincourt method within a piezometer system (PM300, PiezoTest Ltd., London, UK). The poled specimen was clamped at its two electrode-painted crystal surfaces, with a constant force of 0.3–1.0 N applied. The measured piezoelectric charge resulted from the action of an additional dynamic force of 0.05–0.10 N (rms) oscillating at a frequency of 110 Hz.
The measurements of the longitudinal electromechanical strain of the single crystal synchronized with the PE hysteresis properties were examined by additionally equipping a heterodyne interferometer (LV-2100; Ono Sokki, Yokohama, Japan) on the FCE-1 system. The fully poled single crystal was completely immersed in insulating silicone oil and sandwiched between the bottom electrode and a thin aluminum-rod electrode (3 mm in diameter, 4 cm in length, weighing 1.29 g, and with a 0.5 mm diameter tip), which was placed on it. This experiment required crystals of a sufficient size, especially in terms of the areas (typically, ~1 mm2) of the flat surfaces for the two electrodes. The vertical displacement Δl of the top electrode surface on the crystal was monitored by reflecting an incident He–Ne laser beam from the top mirror of the rod electrode. The strain was obtained as x3 = l l , where the crystal length l is the interval between the two electrodes. The sample stage and the interferometer were settled on an active vibration-isolation table. To minimize noise levels in the strain, the data were collected at a frequency of 30–50 Hz and averaged over 100 cycles.
For evaluation of the macroscopic optical nonlinearity of the crystals, the Kurtz and Perry powder test [87] was performed using a Q-switched Nd:YAG laser (pulse width 6 ns, repetition frequency 10 Hz, pulse energy 100 μJ, pulse spot size 3 mm, and wavelength 1.064 μm) with an optical path length of 200 μm by measuring the transmitted SHG efficiency relative to urea. Note that all the dielectric crystals examined so far were colorless or yellow. The crystals were crushed simply by pushing a wrapping paper that was sandwiching them, and they were sieved to obtain the microcrystalline product, with a particle size of around 63–150 μm. The powdered crystalline CRCA, having the approximate efficiency of 47 times that of urea, was also repeatedly examined to regularly check the apparatus and find the standard deviation of ~30% (on average) of 14 specimens.

3.2. Macroscopic Switching

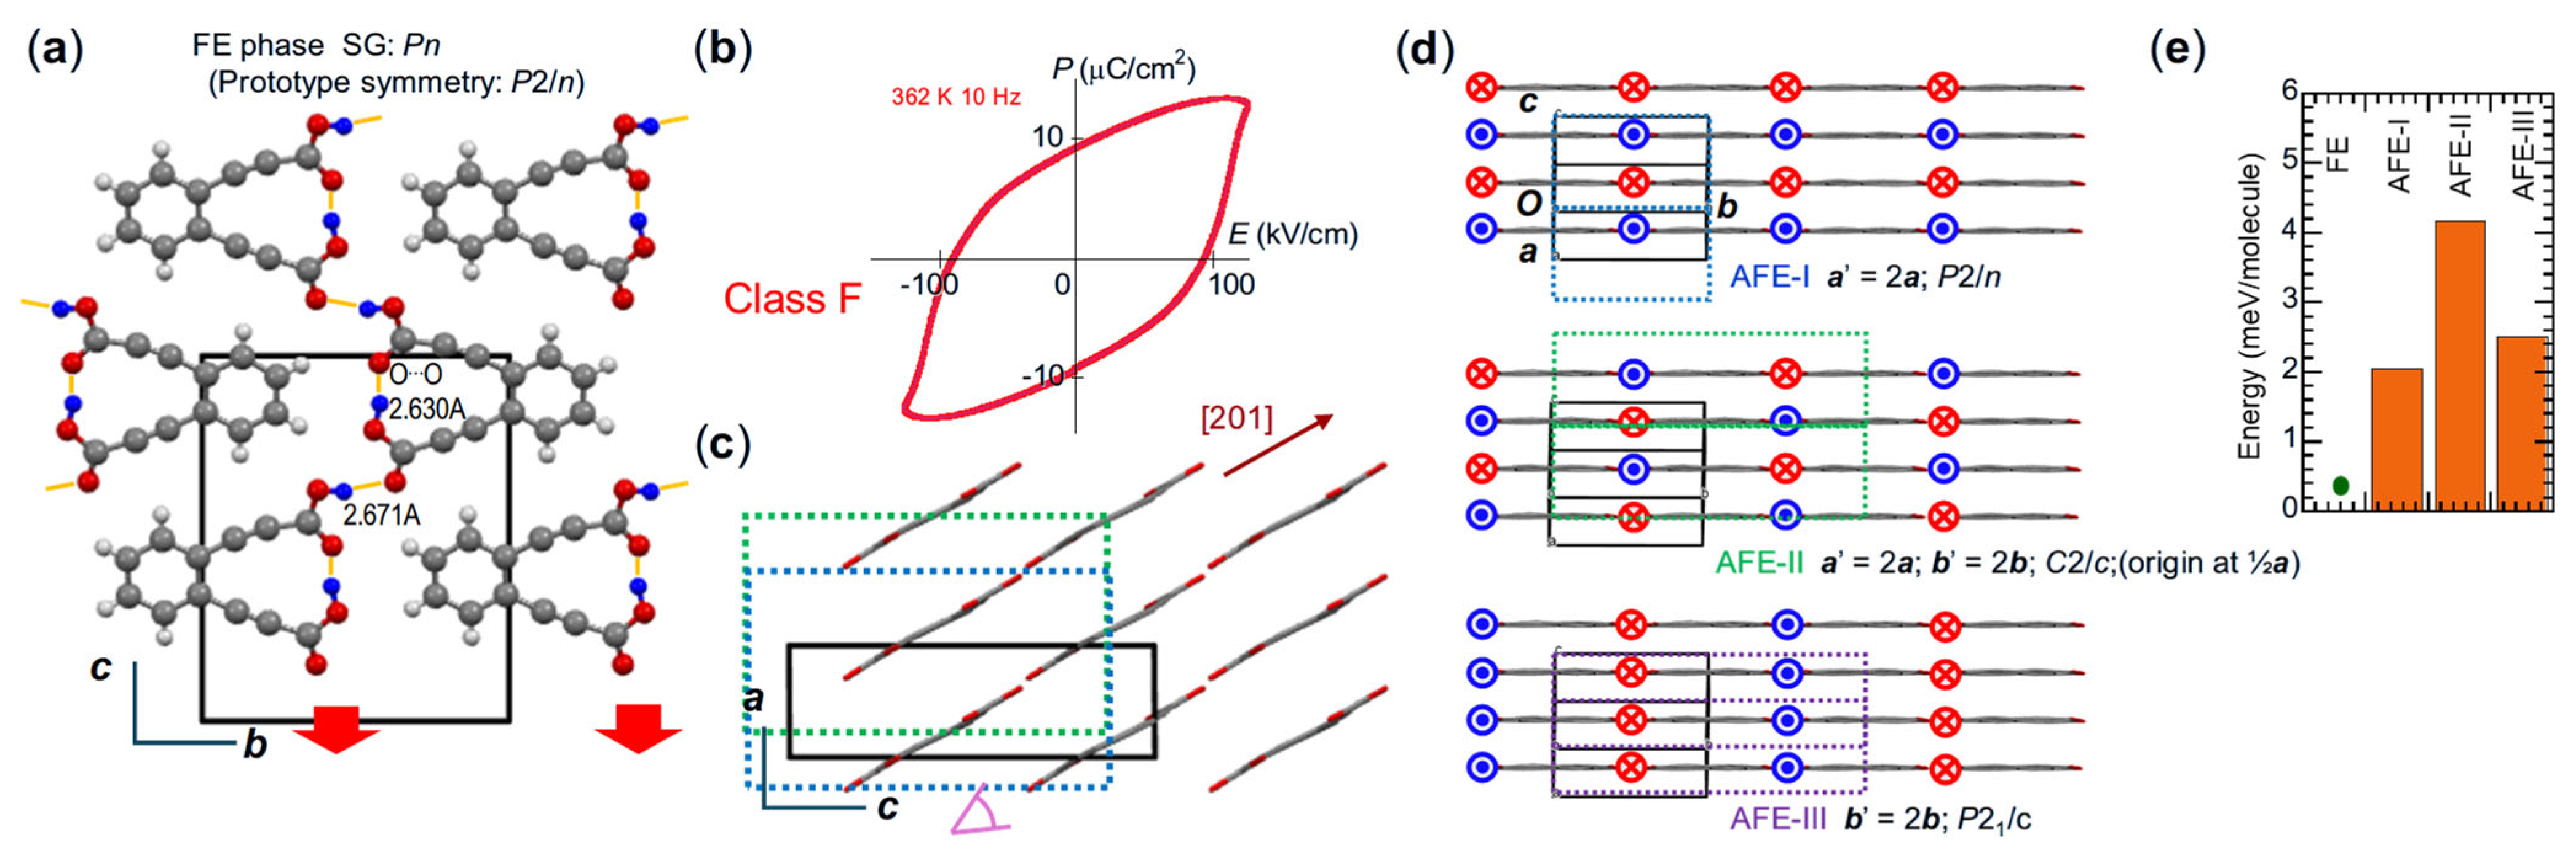
Table 1 summarizes the ferroelectric or antiferroelectric switching type and the polarization switching properties, crystal symmetry, hydrogen bond length, and powder SHG efficiency at room temperature for the hydrogen-bonded, single-component molecular crystals examined in our group. The switching class F (or A) denotes the corresponding polar (or antipolar) hydrogen order that exhibits the ferroelectric single hysteresis (or antiferroelectric double hysteresis (type-I)) loops. The recently discovered PT mode ferroelectrics are APHTZ [31] and PDPLA, exhibiting spontaneous polarizations (7–9 μC/cm2) as large as those of ferroelectric polymers [11]. The SHG is active for all the ferroelectrics, as expected. The excellent optical nonlinearity of CRCA, in agreement with the precedented work [88], led us to the latest discovery of highly performing electro-optic (Pockels) effects [89]. Other prototypical ferroelectrics, such as PhMDA and HPLN, also exhibit SHG efficiencies exceeding that of urea. The SHG signals were undetectable for all the class A crystals with centro-symmetry, as expected. The remaining compounds exhibit hydrogen disorder, the origin of which is attributed to the competition of multiple hydrogen-ordered forms. When the antiferroelectric order competes with the polar order, the polarization switching behaves like their intermediate, and this is classified as “class F/A.” Class F/A has a PE structure, and field-induced switching is denoted by type II. The SHG activity is quite weak. The analogous definition of “class A/A” can be applied to the competition of plural antiferroelectric ordered forms, causing frustration regarding the hydrogen location. Class A/A should be related to type-II phase switching, which cannot be discriminated from the type-I phase switching of class A solely from the double PE hysteresis loop, as well as from silent SHG activity.
It is interesting to note that ferroelectricity and antiferroelectricity seem to be encountered pairwise over various prototropic compounds: the FE (versus AFE) examples are CRCA (SQA), 3HPLN (MePHLN), CBDC (FDC), PDPLA (CPPLA), MBI (TFMBI, DFMBI, TCMBI), and APHTZ (MPHTZ) (see Table 1 and Figure 2 for the chemical structures). This finding reflects the small difference and delicate balance in energy between the underlying FE and AFE states. As discussed in detail in Section 5.9, the simulations of the relative stabilities of a variety of ordered configurations successfully predict the class of polarization switching, its performance, and the order/disorder of hydrogen precisely from the available crystal structural data [31]. The upper and lower parts of Table 1 distinguish the switching mechanisms, as explained in the succeeding section.

3.3. Effects of Microscopic Switching Mechanisms

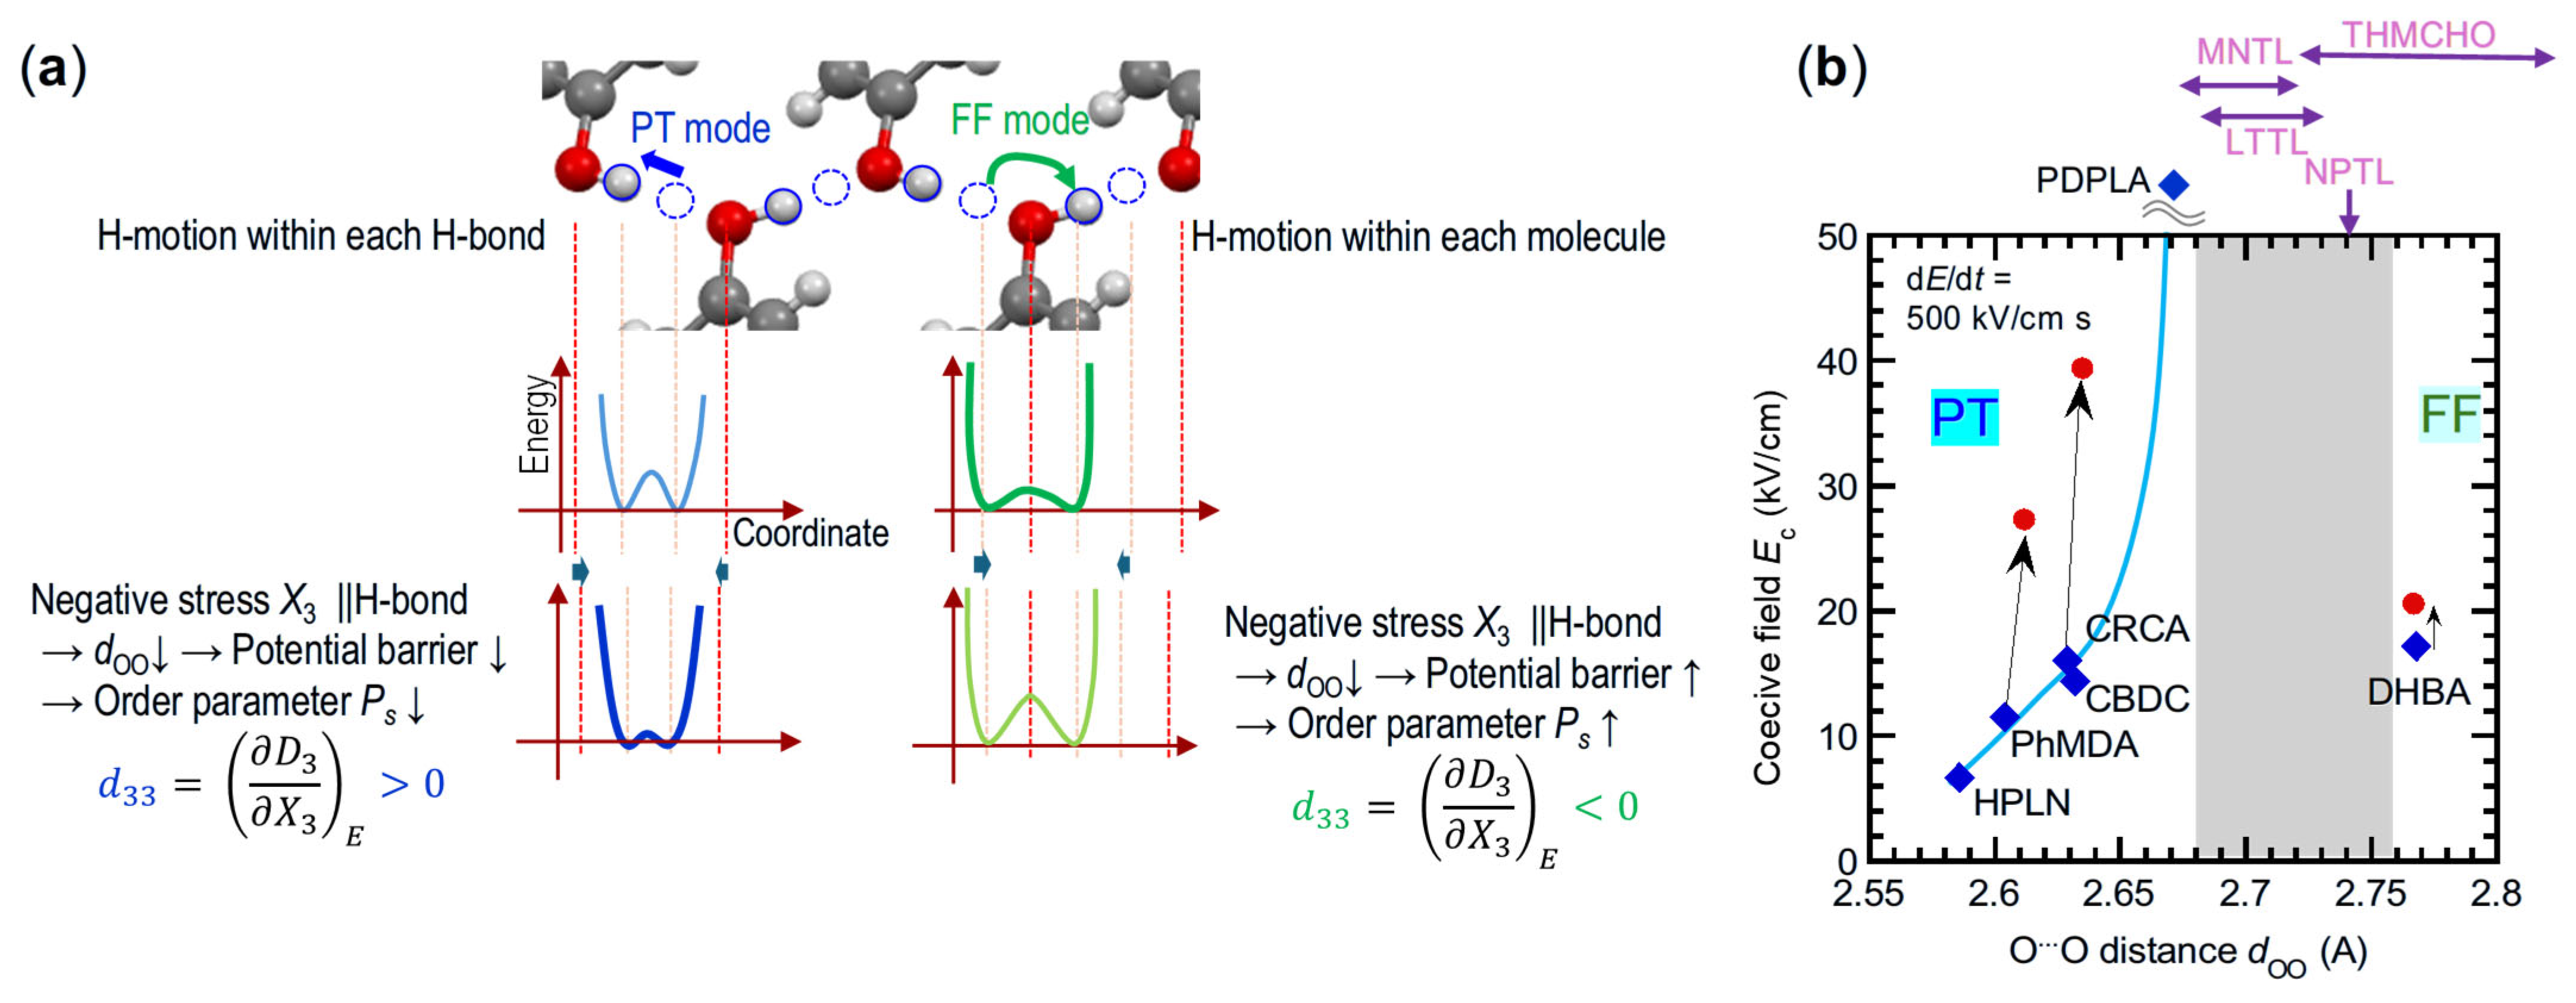
Ferroelectricity and antiferroelectricity on the hydrogen bonds mostly arise from the hopping (or tunneling motion) of hydrogen therein. The CRCA, β-diketones, imidazoles, and anilate salts represent the typical examples of this, which is called the “PT mode.” The hydrogen-bonded structure of the Form I crystal of 2,5-dihydroxybenzoic acid (DHBA) with a polar space group Pa (Ref codes: BESKAL01) [48] informed us of the alternative switching mechanism called “flip-flop motional (FF) mode” [49] in the infinite chains of the ···OH···OH··· sequence. This mode consists of breaking and repairing hydrogen bonds, which accompany the swing motion of the O−H group about each oxygen atom, as schematically illustrated in Figure 6a. In sharp contrast, the PT mode proceeds with breaking and repairing the covalent O−H bond. DHBA crystals have just the novel hydrogen bond geometry that addresses many instructive questions about the two distinct modes.
Here, we provide a conjecture about the switching mode of the DHBA crystal from the experimental findings. One of the clues is the effects of hydrogen bond geometry on the double-well potentials (Figure 6a). The energetic barrier for hydrogen hopping generally increases with hydrogen-bonded O···O distance dOO for the PT mode, as well as with deuterium substitution. This principle is reflected in the positive correlation between the coercive field Ec and dOO, as shown in Figure 6b. The observed Ec of DHBA is too low considering a dOO (2.77 Å) of 0.14 Å, which is beyond the maximal distance of the PT mode ferroelectrics. When the hydrogen bonds are weakened enough by their elongation, their breakage and repair processes will become easier, in favor of the FF mode. The FF mode view of DHBA is supported by the comparisons between the calculated energy profiles of the two modes [49], and this does not conflict with the least deuterium substitution effects observed for Ec.
There are some variations of the FF mode in hydrogen-bonded dielectrics. The tricyclohexylmethanol (TCHM) crystal constructs the OH···O hydrogen-bonded dimer (i.e., 0-D system) with a long dOO (2.95 Å), and the hydroxyl flip motion is responsible for the improper ferroelectricity with minute spontaneous polarization (6 × 10⁻³ μC/cm2) at low temperatures [90]. In the piezoelectric β-glycine crystal, the flip motion of the C-NH3+ group requires the breaking and repairing of hydrogen bonds and then quite a high Ec [91]. The observation of the FF mode breeds a new question regarding what will happen with an intermediate dOO between the PT mode ferroelectrics and DHBA (i.e., the shaded area in Figure 6b). One can easily imagine that the coexisting FF and PT modes could open the channel for proton transport throughout the crystals, unless the barrier is heightened. The experimental observation contradicts this expectation regarding the OH···O hydrogen-bonded systems herein: polarization switching is inactive in a few corresponding crystals extracted as the ferroelectric candidates by the CSD assessments: NPTL, LTTL, MNTL, and THMCHO, with the shortest dOO in the range of 2.67–2.74 Å (Table 1). A new ferroelectrics design strategy was completed from PT to FF modes through the inactive intermediate zone with increasing dOO. Section 5 explains how the switching modes are identified using the integrated experimental and theoretical assessments.

4. Functional Prediction Using Computational Science

Thanks to the modern theory of electric polarization, precise theoretical simulations have been established for the evaluation and interpretation of experimental results. Here, we show that computational assessment and prediction can complement the proper feedback of the materials search, even for candidates lacking availability or sufficient chemical stability, crystal size, habit, and/or quality for reliable electric measurements on crystalline specimens.

4.1. Computational Methods

For theoretical evaluations of the structural, dielectric, and electromechanical properties of molecular ferroelectrics, the electronic states of ferroelectric and antiferroelectric molecular crystals were simulated using the calculation code QMAS [92,93] based on the plane wave basis and the Projector Augmented-Wave (PAW) method [94]. Unless noted specifically, the simulations employed the crystal structure dataset determined by the single crystal X-ray diffraction experiments. The hydrogen atomic positions are always positionally optimized, unless they are determined accurately using the neutron source. The local density approximation (LDA) [95,96] or the Perdew–Burke–Ernzerhof version of the generalized gradient approximation (GGA-PBE) [97] is commonly used for evaluations of electric polarizations. However, they cannot reproduce the lattice constant of organic molecular crystals accurately. We also implemented exchange-correlation functionals based on the van der Waals density functional theory (vdW-DFT) [98], as noted below.

4.2. Evaluations of Electric Polarizations

According to modern theory, the electric polarization in an infinitely periodic solid, like a crystal, is exactly formulated by the quantum mechanical phase of the electronic wavefunctions called the Berry phase [99,100]. An excellent introductory guide can be found in Ref. [101]. The spontaneous polarization is evaluated from the change in the total polarization P t o t , which is obtained as a summation of the ionic contribution P i o n and the electronic value P e l . The ionic contribution is simply obtained from the valence charges and the displacements of the atoms in the unit cell. The electronic contribution P e l is obtained using the Berry phase approach [99,100]. When calculating polarization, a parameter denoted as λ is often introduced to control the adiabatic switching of the polarization. λ = 0 corresponds to the (virtual) PE phase, whereas λ = 1 corresponds to the target FE phase. Since P e l is multivalued, often P e l values are calculated as a function of λ to confirm that the same branch is traced.
The Berry phase corresponds to the sum of the Wannier centers of the occupied states [99,100,101]. The electronic polarization can also be calculated using maximally localized Wannier orbitals (MLWOs) themselves. MLWOs can be further utilized to elucidate the mechanism behind ferroelectricity [102,103]. The spontaneous polarization Ps is obtained as the difference P tot 1 P tot 0 , or alternatively, 1 2 P tot 1 P tot 1 , if the hypothetical λ = 0 state cannot be properly constructed by averaging λ = 1 and its polarity-inverted ferroelectric (λ = −1) structures (typically, in FF mode cases). The analogous procedure on the periodic crystals of a polar i-th sublattice is employed for the evaluation of the sublattice polarization Pi of the antiferroelectric. The polarization jump ΔP obtained from the double PE hysteresis loop was theoretically related to a change in the vector sum of the flipping sublattice polarization.
The difference between the calculated value and the measured value was usually in the range of 0~20% (Figure 7a,b). The theoretically predicted polarization value can be used as a target value for the optimization of the crystallization and post-processing processes. See recent papers [20,25,42,104] and Table 1.

4.3. Simulations of Crystal Structure and Piezoelectricity

The structural parameters optimized by the DFT calculations noted above correspond to those at zero temperature. The best reproduction of experimental versions was searched for by testing various exchange-correlation functionals on the hydrogen-bonded organic ferroelectrics, of which the experimental structures at low temperatures are available for a comparison using an extrapolation to 0 K [105]. The GGA-PBE method does not correctly reproduce van der Waals interactions and significantly overestimates lattice constants. The LDA method tends to undervalue the hydrogen bond distances remarkably and is not suitable for predicting spontaneous polarizations, which have a strong correlation with the hydrogen bond lengths. On the other hand, the van der Waals density-functional consistent exchange (vdW-DF-cx) [106] and the revised Vydrov–van Voorhis (rVV10) methods [107,108] reproduce the crystal structures with good accuracy. In a series of our investigations, the latter functionals were used for a simulation of the direct and converse piezoelectric effects through crystal structure optimization under uniaxial stress or electrostatic field. The piezoelectric d coefficients thereby obtained are in reasonable agreement with the experimental results for various organic ferroelectrics (Figure 7c,d) [105].

5. Integrated Experimental and Computational Approaches for Systematic Understanding

5.1. Assessments of Switching Mechanisms from Polarizations

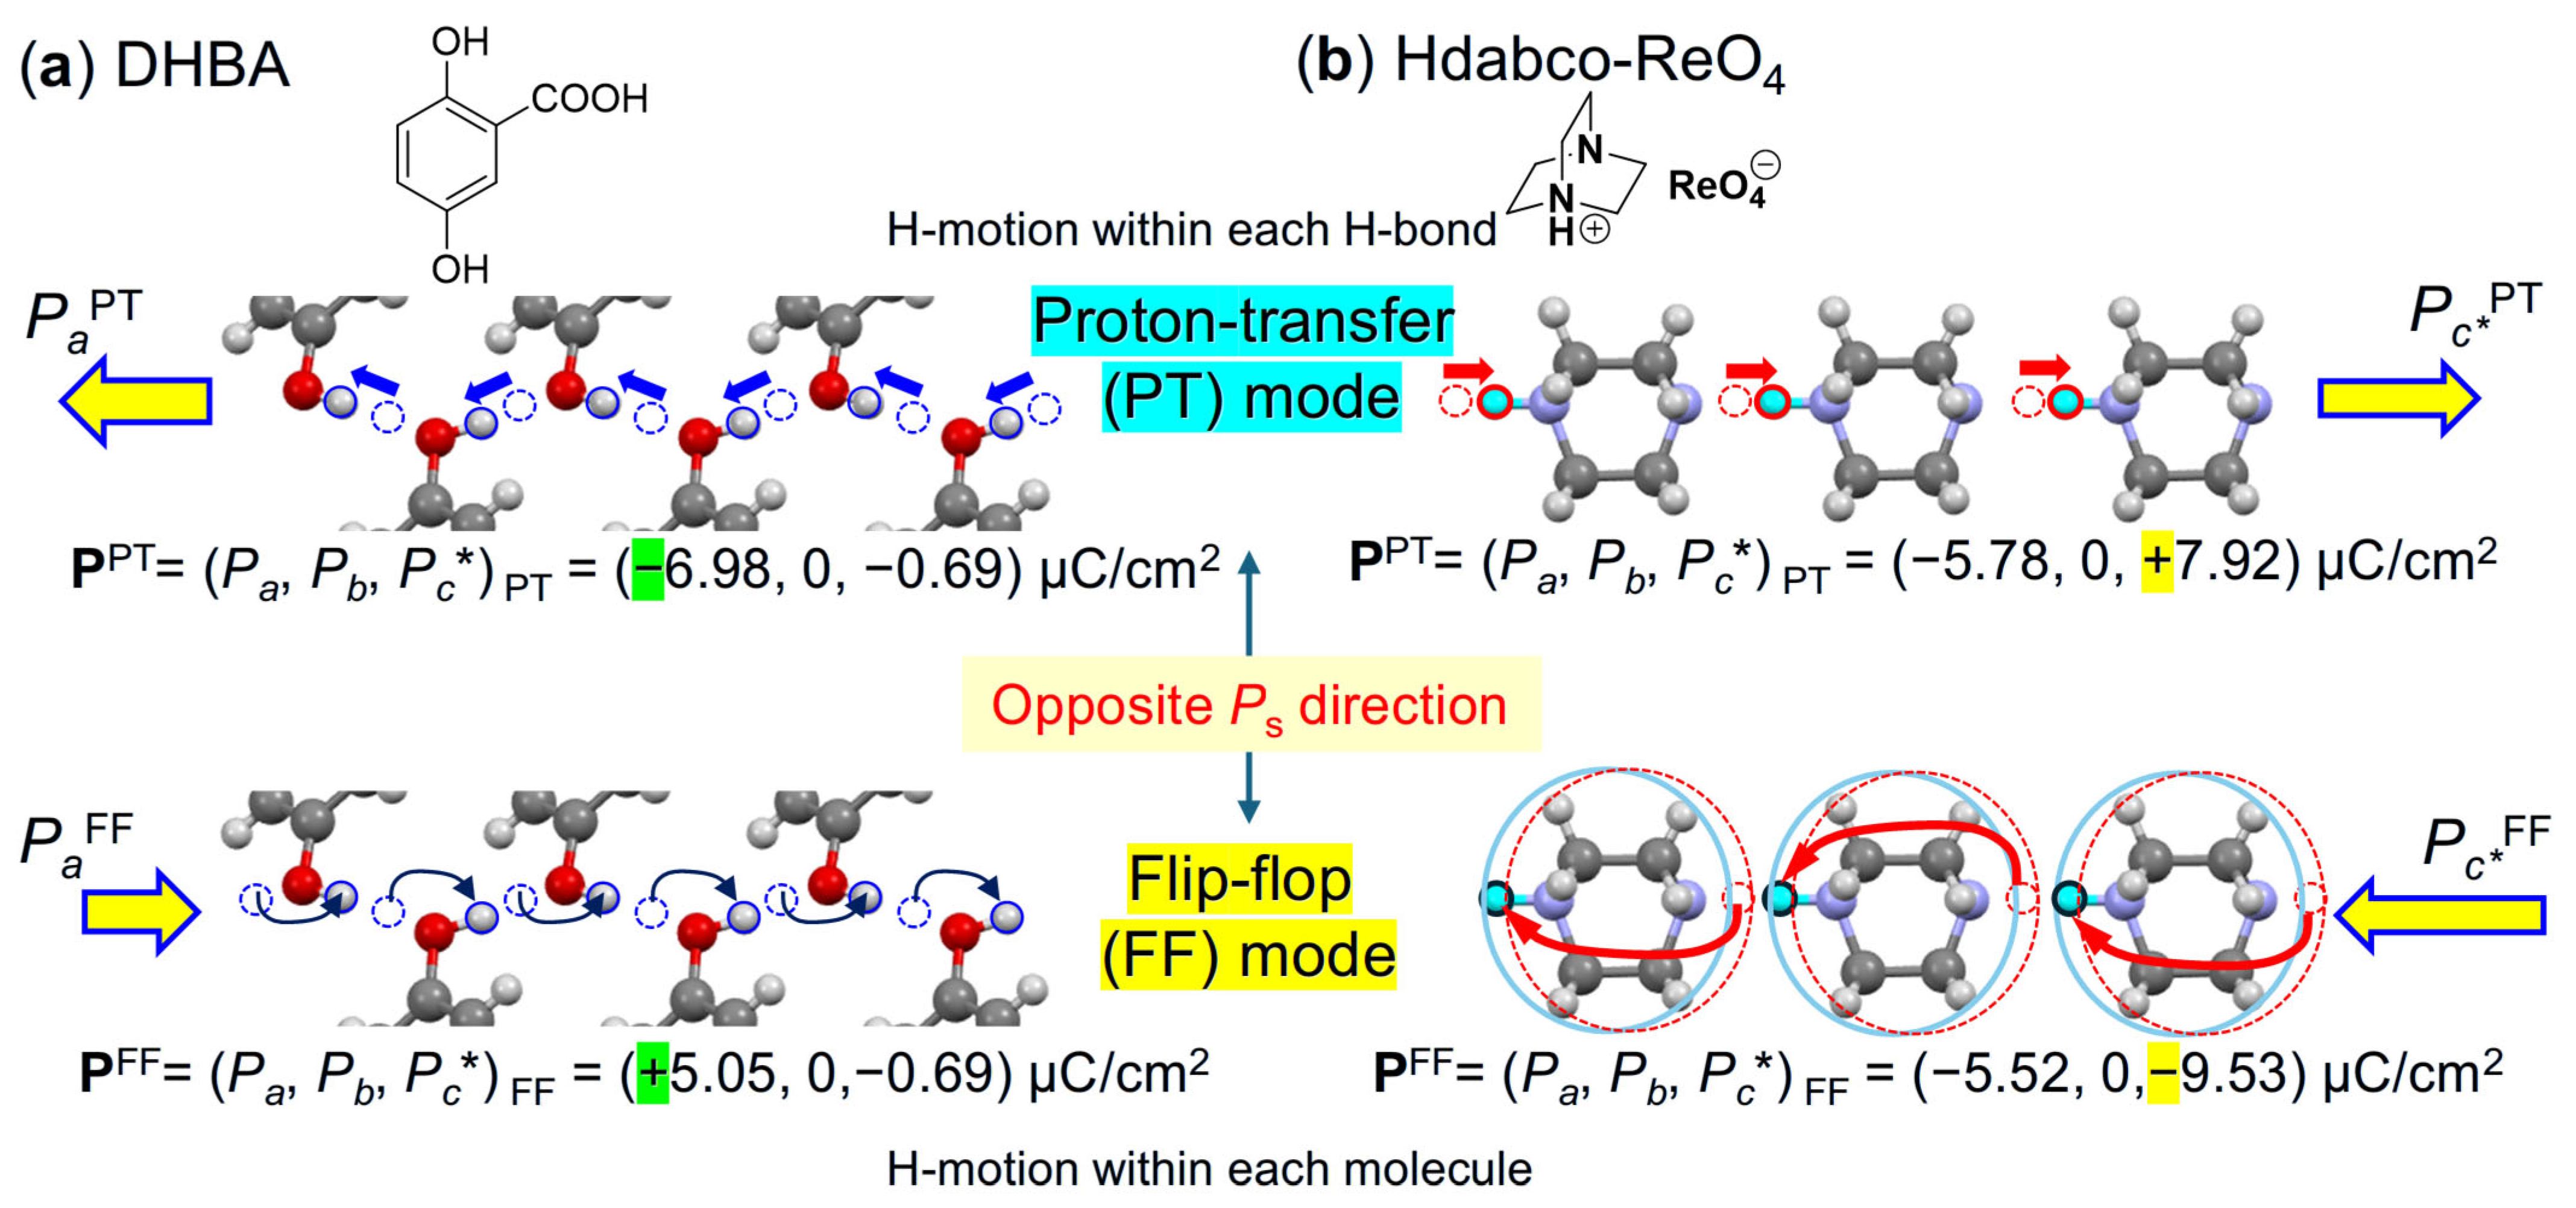
The inter-relationship between electric polarization and two distinct switching mechanisms (i.e., PT versus FF modes) is one of the most fundamental issues regarding hydrogen-bonded ferroelectrics and antiferroelectrics. Although these two modes are regarded as competitive in some hydrogen-bonded crystals [109,110], their appearance happens to be mutually exclusive as the function of dOO in OH···O-bonded ferroelectrics, as argued in Section 3.3. For a deeper understanding of their nature and discrimination, further theoretical assessments on the electric polarizations and piezoelectric coefficients were performed for the two model ferroelectrics, DHBA [49] and Hdabco-ReO4 [64], which permit both switching paths geometrically. Note that in the Hdabco-ReO4 salt, globular Hdabco+ cations can undergo either bulk rotation (i.e., FF mode) or PT.
Let us compare the FF and PT modes by setting the common target ferroelectric structure (λ = 1) for the evaluation of spontaneous polarizations. The polarity-inverted ferroelectric (λ = −1) states might be wrongly interpreted as equal, irrespective of the two paths, because their periodic units hold an identical structure. Instead, these two λ = −1 forms are different in the crystal surface state (i.e., the hydrogen locations at both terminals of the chain), causing a naturally distinct spontaneous polarization (PPTPFF). The important finding in Figure 8 is that the simulated PPT and PFF are in approximately reversed directions from each other. This means that the following principle can discriminate these two modes: the poling field of opposite polarities is required for polarization switching from the λ = −1 state to the 1 state, which drifts hydrogen atoms oppositely along the hydrogen-bonded chains. The DHBA and Hdabco-ReO4 crystals are regarded as the ferroelectrics of the FF and PT modes, respectively, by comparing the respective spontaneous polarizations between the experimental (5.2, 8.5 μC/cm2) and GGA-PBE-based theoretical amplitudes of PPT (6.98, 7.92 μC/cm2) and PFF (5.05, 9.53 μC/cm2) along the H-bonded chains [111]. Although conclusive identification of the mode could be made based on the absolute OH hydrogen orientations with respect to the poling field direction, the corresponding experiments are not applicable to DHBA due to tiny anomalous X-ray scattering effects of light elements.

5.2. Assignments of Switching Mechanisms from Piezoelectricity

As the alternative clue of switching modes, we have noticed that the sign of the longitudinal piezoelectric coefficient d33 directly correlates with the sign of dielectric displacement D (and, consequently, macroscopic polarization P) through the direct piezoelectric effect, defined by
d 33 = D 3 X 3 E
where D3 and X3 are dielectric displacement and stress, respectively, in the longitudinal direction 3 [111]. Let us recall the relationship between the hydrogen-bonded geometry parameters, such as dOO, and the potential barrier height for switching, as discussed in Section 3.3. By applying negative longitudinal stress X3, the shortened dOO makes the FE phase unstable for the PT mode, and then the diminished order parameter PPT is reflected as the positive d33 [112]. For the FF mode, the opposite changes give rise to the negative d33. Figure 7c,d depicts the comparison between the experimental and theoretical d33 values, including the sign. The experimentally determined direct and converse piezoelectric d33 values are −7.7 pC/N and −4.8 pm/V, respectively, in DHBA. Both the amplitude and negative sign are consistent with the respective computed versions for the FF mode (−6.79 pC/N and −2.95 pm/V by rVV10). The unambiguous assignment to the FF mode agrees with the previous conjecture from the other experimental results shown before. In contrast, the PT mode is judged from the direct piezoelectric d33 values for Hdabco-ReO4 crystals (experimental +5.1 pC/N versus theoretical +6.64 pC/N by rVV10).
Although the negative d33 was thought as the rare phenomenon [113,114,115] previously, the examples are ubiquitous, as exemplified by ferroelectric polymers (–30~–40 pC/N) [116,117,118], nylons [119], tris(4-acetylphenyl)amine (–3.6 pC/N) [104], and a series of columnar-type ferroelectric liquid crystals, such as trialkylbenzene-1,3,5-tricarboxamides [120]. The observation of the negative d33 stands, regardless of the absence of the hydrogen bonds, and it could then be regarded as the characteristics of the FF mode in a broader sense. As far as the poling procedure (with polarization reversal) is applicable, it is relatively facile to determine the sign of the piezoelectric constant. This assignment methodology is promising, as it can uniquely identify the mechanism even on a mesoscopic scale by using a piezoelectric response microscope. Closely related to our study, both positive and negative piezoelectric constants have been reported experimentally for HfO2 [121,122], and theoretical calculations have revealed that they correspond to two different ferroelectric transition paths [123]. A new class of ferroelectrics has been proposed, namely, “double-path” ferroelectrics.

5.3. Identification of Field-Induced Crystal Forms

As listed in Table 1, many examples of classes A, A/A, and F/A have been obtained from the screening experiments so far. For classes A and A/A, the polarization jump ΔP is experimentally available from the PE loops. In the class A crystals, except for γ-FDC [25], two sublattices with sublattice polarizations P1 and P2 interpenetrate each other, constructing the antipolar (P2 = −P1) or dipole canted (noncollinear) structure (P1kP2 where k is a scalar). Crystallographically independent sublattice polarizations Pi are computed using the conventional Berry phase method applied to the corresponding sublattice extracted as a periodic polar crystal lattice. Together with its symmetry-related sublattice polarization Pj (ij), the theoretical polarization jump is calculated as ΔPcal = ±(P2P1) for the case of two sublattices. For an evaluation of ΔPcal and phase stability in the hydrogen-disordered compounds, the hypothetical FE and AFE models are built by locating the ordered NH hydrogen atoms, before the positional optimization of all atoms under the lattice parameters fixed at room-temperature values.
Regarding the furan-3,4-dicarboxylic acid (FDC) crystals, we found one AFE candidate polymorph α (monoclinic, Ref codes: FURDCB and FURDCB01) from the CSD [43,44] and two new antipolar polymorphs, β (orthorhombic) and γ (triclinic), from the experiments [25]. Although the α-polymorph is confirmed to be a class A candidate, as shown by a pseudo-translation symmetry c/2, its small crystal size precluded satisfactory PE hysteresis measurements. The β-polymorph lacks any pseudo-symmetry, and so polarization switching is hardly expected. The γ-polymorph has a pseudo-translation symmetry a/2 in the triclinic P 1 _ cell. For the E||[ 1 _ 02 ] configuration, the polarization jump ΔP (15.1 μC/cm2, Figure 9a) of the γ-FDC crystal is slightly smaller than that of SQA (Figure 9b). However, it is the second highest among those of organic antiferroelectric crystals. The large unit cell of the γ-FDC crystal accommodates four sublattices: P1, P2 (=−P1), P3, and P4 (=−P3). Therefore, flipping P1 and P3 (or P2 and P4) gives rise to ΔPcal = ±2(P1 + P3). The theoretical and experimental polarizations are in excellent agreement, corroborating the assignment of this FE phase as the field-induced version [25].
Another antiferroelectric CPPLA was extracted from the CSD, as a hydrogen-disordered PE crystal form (ref code: SUHSET and SUHSET01) [39,40]. In contrast, our re-examination of X-ray diffraction measurements revealed an antipolar crystal structure with a doubled unit cell, suggesting class A [25]. The PE curve measured along the [110] direction shows a double hysteresis loop, with a maximum field amplitude of less than 70 kV/cm. Unexpectedly, the higher field amplitude causes a quadruple polarization hysteresis loop (see also Section 5.8). The entire polarization jump of the quadruple hysteresis loops (4.3 μC/cm2) can be ascribed to the full alignment of chain polarizations (the E||[110] direction component of ΔPcal = ±2P1 is 4.8 μC/cm2). This behavior is understood by field-induced successive phase transitions via an intermediate ferrielectric phase [25].
The same experimental evaluation cannot be applied to class F/A, showing the ill-defined ΔP due to amalgamation into ferroelectric type hysteresis; Table 1 includes only ΔPcal. Instead, class F/A can be easily distinguished from the others by the appearance of deformed PE hysteresis loops and hydrogen disorder, as exemplified by FPHTZ and CPHTZ [31].
On the other hand, MPHTZ of class A and PHTZ of class A/A exhibit almost the same double hysteresis loop [31]. In such cases, the poorer quality of AFE crystals may prevent long-range ordering, leading us to misjudgments about the class being A/A. The final judgement on these classes should be accompanied by computational evaluations of the relative phase stability, as discussed in Section 5.9.

5.4. PT Mode Switching on Ladder Architectures

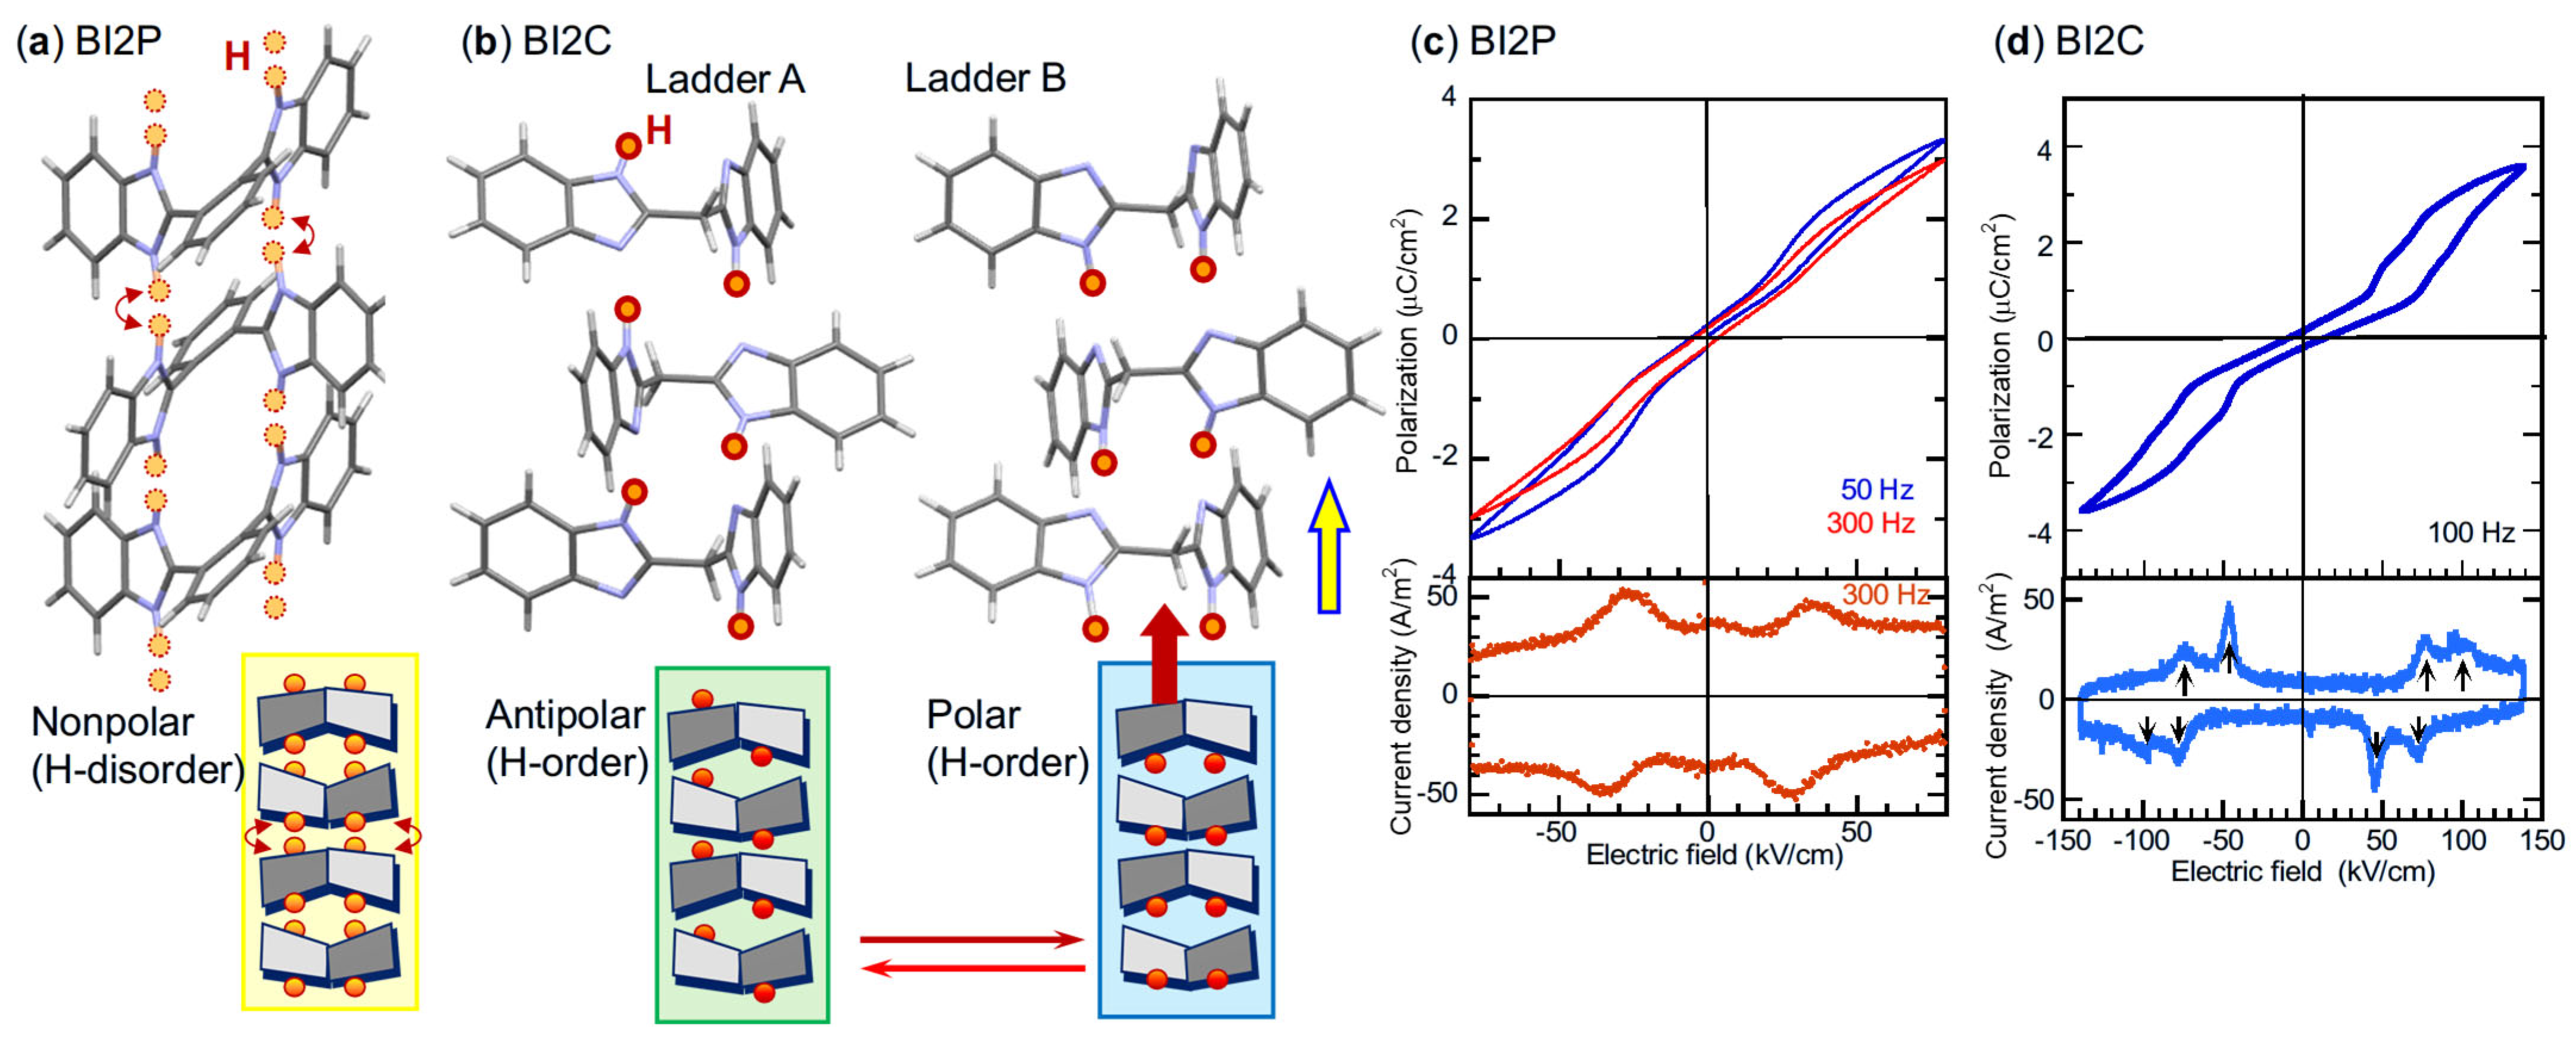
The covalent linkage of plural switching fragments is one of the bottom-up strategies used for multiple, metastable states, causing exotic properties and electronic states. Because some imidazoles are found to be suitable for thin-film crystallization from a solution, their bridging expansion is also motivated to improve their thermal endurance, as per ferroelectric devices. Most of the bisbenzimidazoles (BIs) crystals examined in the screening retain relatively good solubility in polar organic solvents, whereas their melting points are increased by about 100 degrees from their corresponding monomer, as desired [47]. Large polarization responses drawing S-shaped double loops (Figure 10c,d) are observed on the phenylene-bridged BI2P and methylene-bridged BI2P. Both crystals, which were extracted as candidates having hydrogen disorder when data mining the CSD, comprise novel, ladder-like networks formed by two straight hydrogen bonds and covalent bridges [42,47]. The crystal structure of BI2P, which was re-assessed in our studies, well reproduces the reported one [46]. The BI2P molecule is nearly nonpolar owing to the disorder of two hydrogen atoms in a centrosymmetric orthorhombic crystal form (Figure 10a,b). Considering the faint SHG activity also observed, the disorder might be explained by a class F/A paraelectric, reflecting the temporal competition of FE- and AFE-ordered forms. The observed double hysteresis loop (Figure 10c) looks somewhat anomalous compared with those of conventional type I and type II. The PE curve retains a proportional relationship at the high field regime, instead of the polarization saturation characteristic of the FE state, and the maximum polarization of ~3 μC/cm2 is far below the theoretical ΔP (8.8 μC/cm2). These features are rather reminiscent of the latest discovery of a new scenario in 2%mol-Y2O3-ZrO2 crystals [9], revealing a “susceptibility mismatch phase transition” (phase change of new type IV, Figure 1), in which the original paraelectric phase is suddenly switched to a new paraelectric one with higher permittivity under a high field. Further studies are required to verify speculation about the new possibility of PE–PE phase transformation.
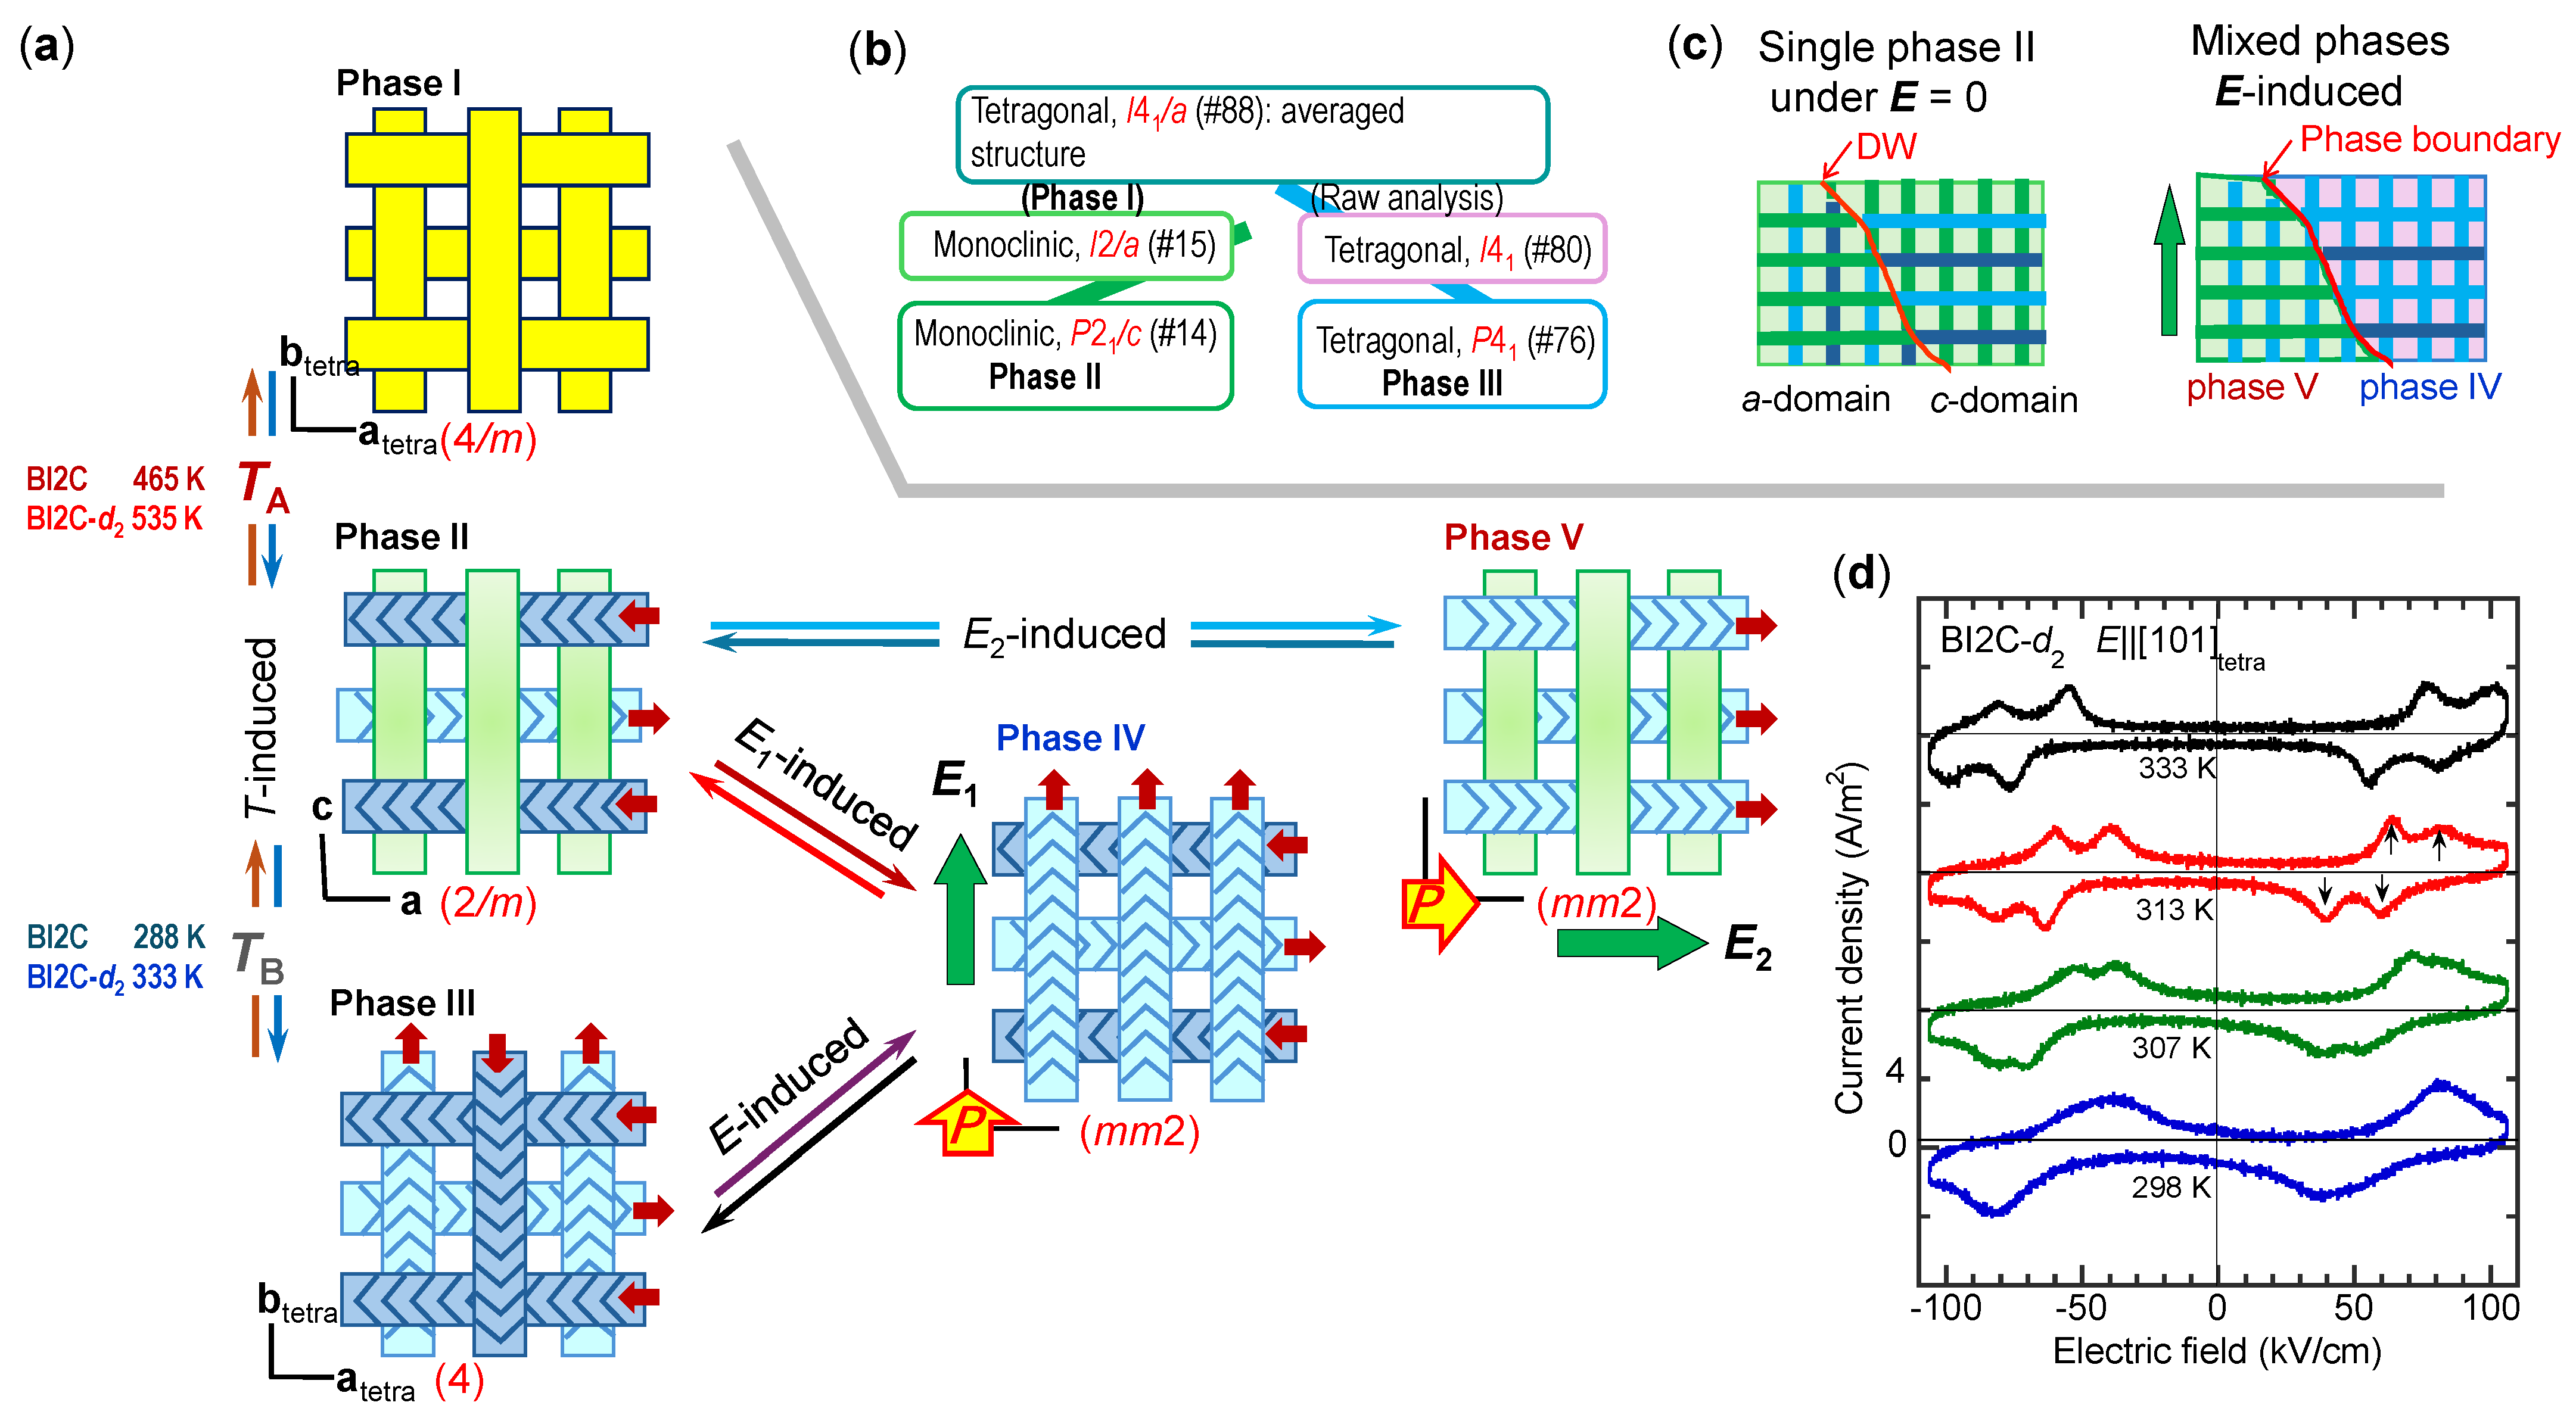
The other bridged molecule, BI2C, exhibits polarization switching, accompanied by a current peak split into a doublet (arrows in the bottom panel of Figure 10d) at room temperature [42]. The crystals tend to be twinned by recrystallization from a solution. Our structural analysis on a single domain specimen grown from vapor could capture the genuine symmetry of monoclinic space group P21/c, namely, a two-rank subgroup of the tetragonal space group I41/a symmetry (CSD ref. codes: XAVFEG, XAVFEG02), which was originally reported by Duan et al. [41], but the latter symmetry is judged herein as artifacts from crystal twinning. The monoclinic phase II crystal has a pseudo-tetragonal structure built from the orthogonally crossed array of ladders A and B (Figure 11b). Two kinds of ladders are distinguished by the hydrogen ordering pattern turning the molecular dipole moment on and off; the orientation of NH hydrogen atoms is antiparallel between two benzimidazole rings, causing the nearly zero dipole within ladder A, whereas a collinearly aligned NH orientation generates the large polarization along each ladder B.
The temperature- or field-induced PT processes on the BI2C crystal derive a variety of phases, as schematically shown in Figure 11a [42]. The X-ray diffraction of the high-temperature (phase I) structure shows systematic absences compatible with the tetragonal I41/a symmetry. However, its full analysis (at T > 192 °C) has not been completed due to crystal sublimation. Deuteration at room temperature or lowering the temperature transforms the SHG silent phase II into phase III, which exhibits faint SHG efficiency (0.02 times that of urea) for BI2C-d2. The phase III structure with the tetragonal P41 symmetry, another two-rank subgroup of I41/a, crosses the antiparallel array of dipolar ladders B. The double hysteresis curves are observed for both phases II and III, as shown by the data for BI2C-d2 (Figure 11d). The potentially switchable units are antipolar dipoles located within each ladder A, whereas an antipolar pair of neighboring ladders can define those interpenetrating sublattices for dipolar B ladders. Note that for the E||[110]tetra configuration, each peak in the displacement current is split from a broad singlet into a sharp doublet, with a phase change from tetragonal III to pseudo-tetragonal II. The splitting of switching fields could be related to the twinning generated through this symmetry reduction, as schematically illustrated in Figure 11a. All the ladders B in tetragonal phase III are equivalent, and their dipoles can align homogeneously, causing the field-induced new phase IV. On the other hand, the phase II crystal is generally twinned, and two inequivalent sublattice orientations relative to the applied field direction E||[110]tetra can generate phases IV and V separately under different fields. In the figure, phase IV is generated by transforming ladder A into B, whereas phase V is formed by simply aligning the B ladders from an antiparallel to a parallel order. The doublet peak of displacement current is then naturally understood by the different switching field amplitudes E1 and E2 required for phase changes between II–IV and II–V (Figure 11a), accompanying the transformation between the multidomain state and the phase mixture (Figure 11c).

5.5. Amphoteric Switching on Dipole-Canted Systems

Let us consider special crystal structures, in which the sublattice polarization vectors are canted (noncollinear) with each other (i.e., P1kP2, where k is a scalar). Ferroelectric and antiferroelectricamphoteric behaviors have been demonstrated in the PhMDA single crystal with an orthorhombic space group Pna21 [25]. The polar hydrogen-bonded chains along the [102] are intersected with those along the [ 1 _ 02] direction. The sublattice polarizations P1 and P2 defined by the [102] and [ 1 _ 02] chains (Figure 12), respectively, have their polarization components, which are antiparallel in the a direction and parallel in the c direction with each other. When the applied electric field is parallel to the polar c direction (or zero), the total sum of the sublattice polarizations emerges as the spontaneous polarization +PsI or −PsI in this direction, and it behaves as a normal ferroelectric state, referred to here as FE-I. The ferroelectric switching is caused by flipping both sublattice polarizations (see Figure 12).
For the E||a configuration, antiferroelectric-like switching with a polarization jump ΔP of 5.8 μC/cm2 appears. The critical field of ~110 kV/cm is much higher than the coercive field measured with E||c (~20 kV/cm, Figure 12) [25]. The field-induced new polar FE-II phase explains this behavior: the increasing/decreasing electric field amplitude flips either sublattice polarization, which flips the total polarization vector by 90° from the c to a direction and vice versa. This argument is corroborated by the excellent agreement between the experimental Ps and ΔP (9 and 5.8 μC/cm2, respectively) and the corresponding simulated values (9.0 and 6.1 μC/cm2). The GGA-PBE-based simulation shows that the FE-II phase has 0.79 meV higher total energy per molecule than FE-I. This example shows that the electrostatic energy storage functionality can also be designed on dipole-canted ferroelectrics.

5.6. Two-Dimensional Switching System

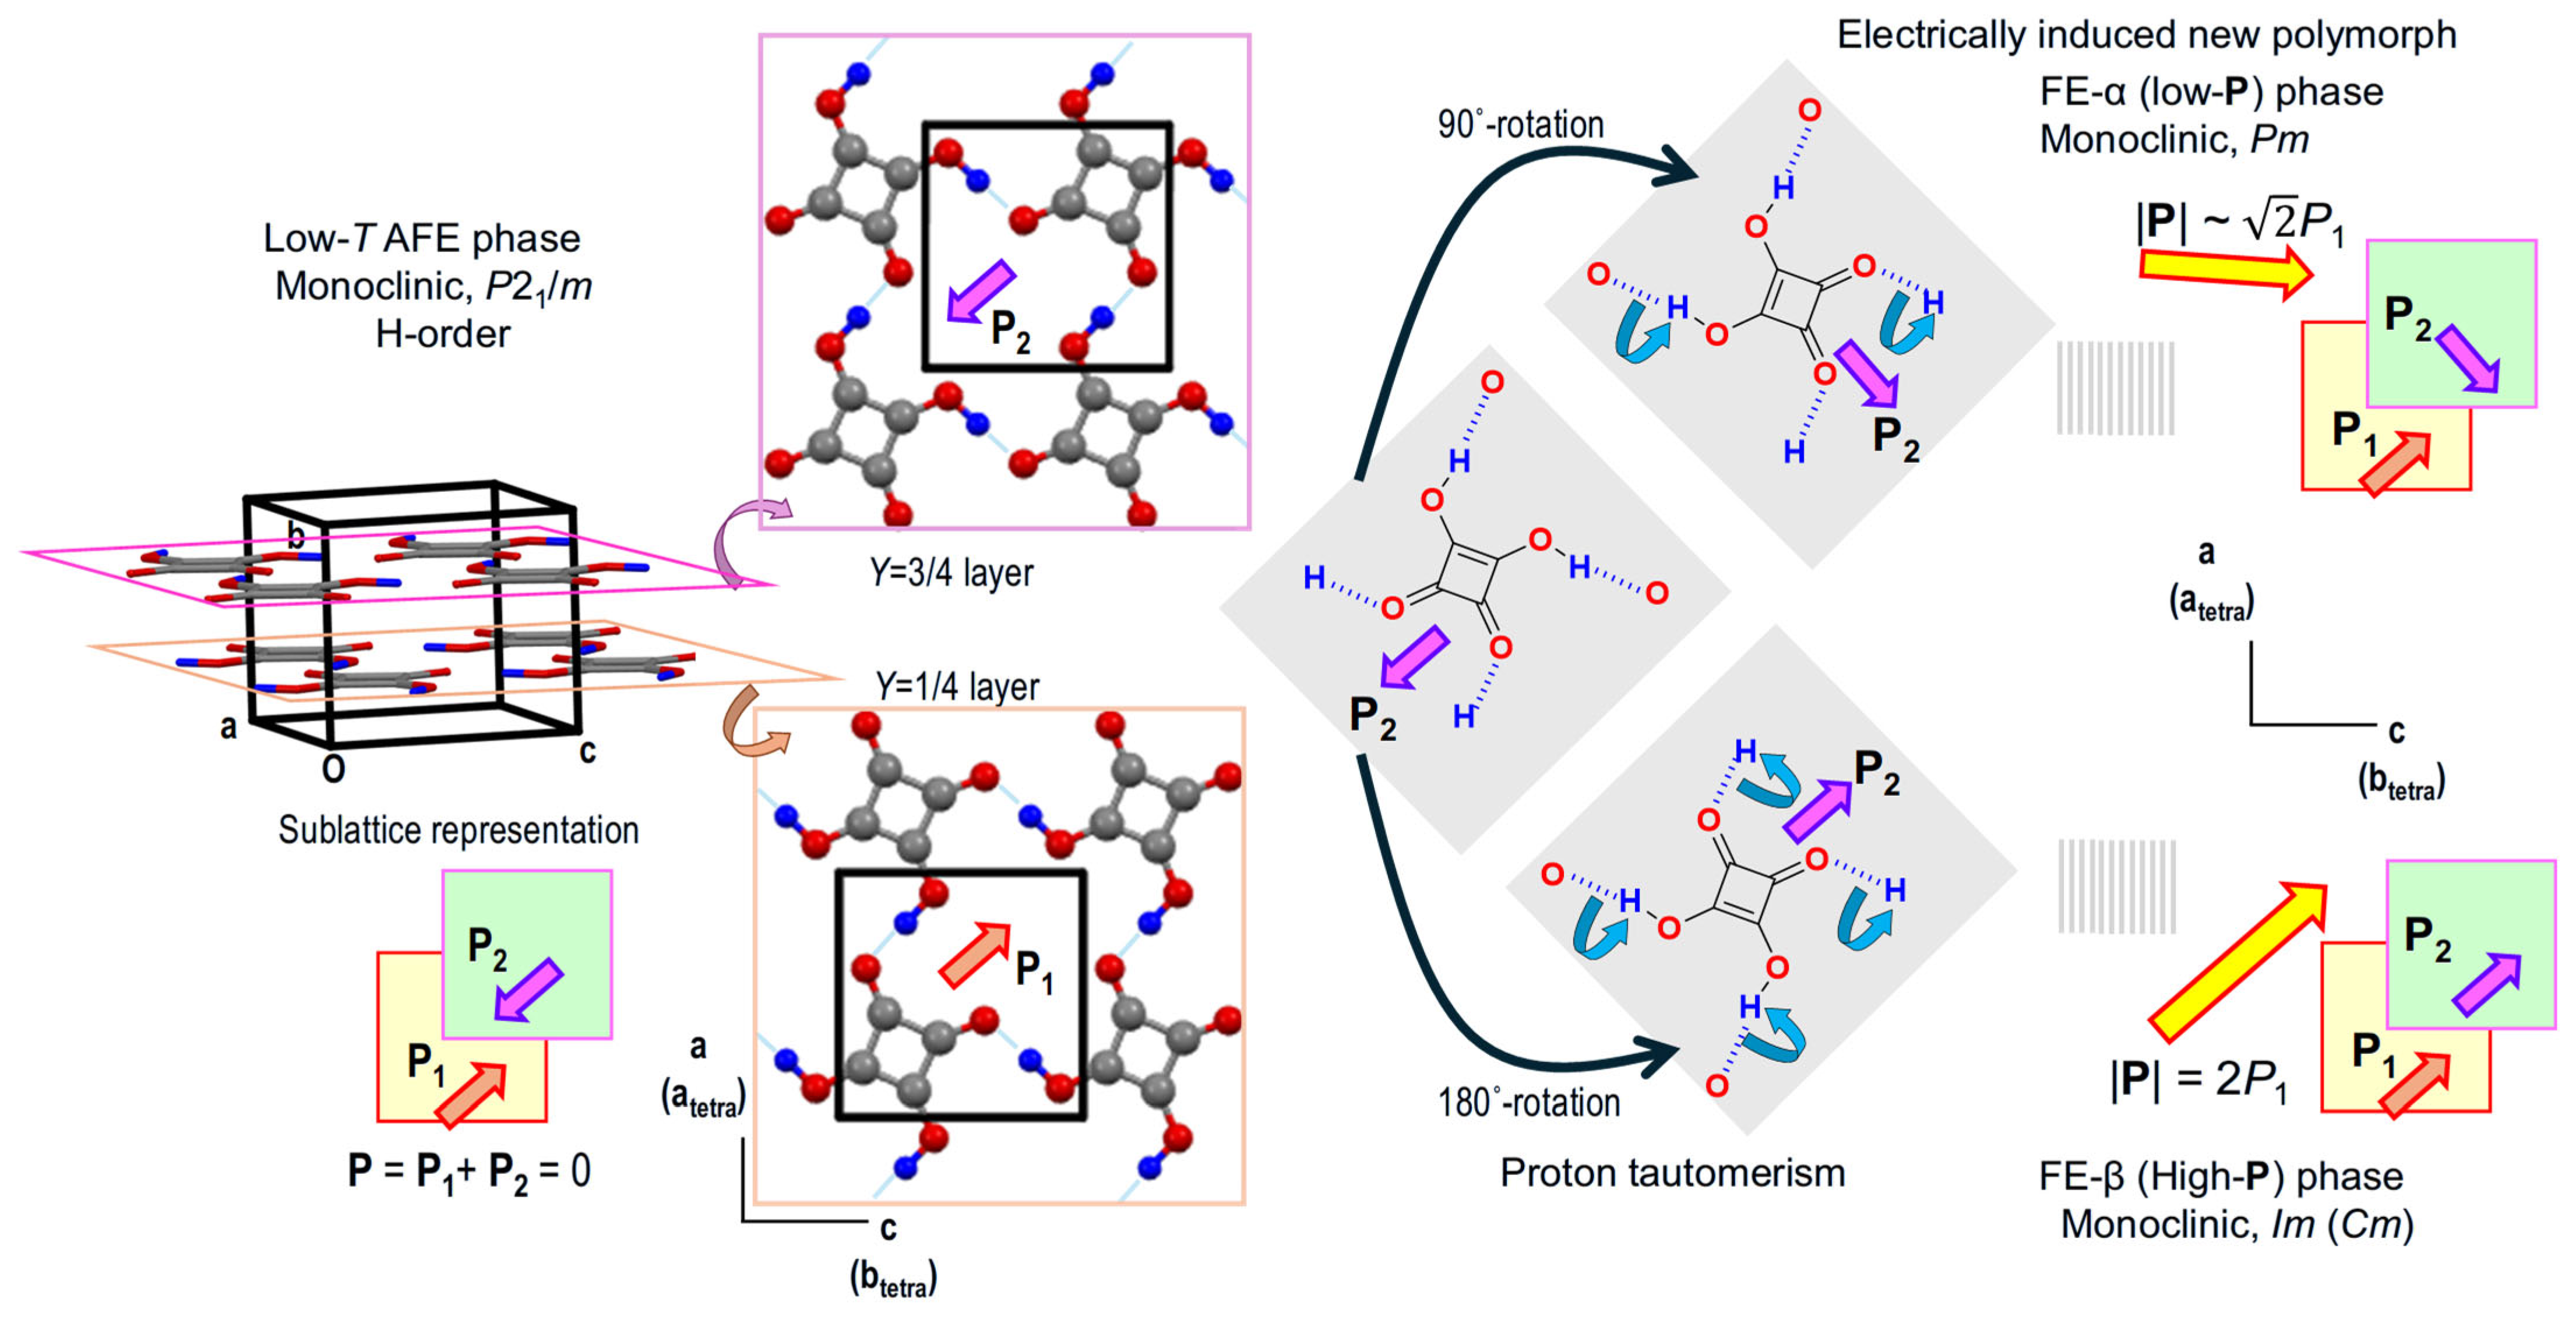
The AFE crystal form of the SQA crystal (Figure 13) belongs to the monoclinic space group P21/m, in which each hydrogen-bonded molecular sheet coincides with the crystallographic mirror plane. The proton ordering accompanied by C1h-type asymmetric distortion of the C4O4 core acquires a sublattice polarization P1, therein being antiparallel to the sublattice polarization P2 = −P1 of the nearest neighbor planes. The PE crystal form belongs to the body-centered tetragonal lattice of space group I4/m. The disordered proton over each O∙∙∙O hydrogen bond and a C4O42− unit of exactly square symmetry (D4h) causes nonpolar symmetry at any sites.
The pseudo-tetragonal crystal symmetry permits a 90° rotation of 2-D sublattice polarizations by transferring only one proton per molecule, in addition to the 180° inversion through a double PT (Figure 13). The atomic positions determined by the neutron diffraction [36] were employed for the GGA-PBE-based simulation, which gave the sheet polarizations of (|P1|; P1a, P1b, P1c*) = (11.6; 7.6, 0, 8.8) μC/cm2. The 90° rotation and 180° inversion of the sublattice sheet polarization P2 in the crystal transform the AFE structure into two kinds of polar structures called, respectively, FE-α and FE-β hereafter (Figure 13). The FE-α form belongs to a monoclinic space group Pm, in which the crossed P1 and P2 yield the total polarization P of magnitude 2 |P1| (=16.4 μC/cm2), directed along atetra. In FE-β, the 180° inversion of the P2 could generate a monoclinic Im crystal symmetry and an optimum polarization of 2|P1| = 23.2 μC/cm2, which agrees well with the calculated polarization (23.3 μC/cm2) reported by Ishii et al. [124], and this (expectedly) approaches the record of Ps among organic systems (30 μC/cm2 of CRCA [23]).
Field-induced AFE-to-FE switching was computationally simulated with full structural optimization using rVV10, which can accurately reproduce the observed lattice parameters (error ≤ 0.2%) [125]. For the E||atetra configuration, the FE-α phase was induced, as experimentally confirmed below. Additionally, the FE-β phase, which has yet to be experimentally confirmed, was obtained with the E||[110]tetra configuration. Both the field-induced FE-α and FE-β phases were found to be metastable at a zero field, and their total energy per unit cell (or molecule) is 2.5 (1.25) and 4.9 (2.45) meV higher than that of AFE, respectively. Their total polarizations of 14.5 and 20.6 μC/cm2, respectively, decreased by 11–12% from the corresponding 2 |P1| and 2|P1| estimated from the sublattice model, which neglects the interactions between the two sublattices. Note that the simulation corresponds to zero Kelvin, which is far from room temperature, and Tc = 373 K. This might cause some discrepancies between the theoretical and experimental results: the stability of the field-induced two phases (metastable versus unstable) and the longitudinal piezoelectric constant d33 for FE-α (calculated as ∼10 pm/V versus the experimental value of 33 pm/V from the electromechanical strain measurements below (see Section 5.8)).
The double hysteresis loop of SQA was discovered with a maximum field amplitude of ~150 kV/cm [24]. The polarization jump ΔP of 10.5 μC/cm2 turns out to be still insufficient at that time, judging from the behavior of the displacement current. Later, the maximum field strength improved up to 220–230 kV/cm by suppressing the electric breakdown using a freshly prepared higher-quality single crystal. For an E||atetra configuration at room temperature, the ΔP of SQA (Figure 9a and Figure 14a) and the deuterated SQA-d2 crystals is optimized to 17.2 and 18.4 μC/cm2, respectively [25]. The field-induced phase is attributed to FE-α, considering the theoretical polarizations above [125] and finding atetra as the easy-switching axis. Attempts to induce the FE-β form have not been successful yet, even for the E||[110]tetra configuration at room temperature.
The above picture represents an oversimplified sublattice model because the P1 and P2 in the AFE phase are not completely cancelled by each other under a finite electric field, and the polarization rotation cannot be strictly fixed to 90° or 180°. The electric and thermodynamic effects on the polarization states were simulated by the pseudospin model in more detail by Moina, with intriguing findings, such as a greater variety of noncollinear polarization states in the T-E phase diagram [126], as well as negative and positive electrocaloric effects [127]. According to recent investigations (for instance, see [128]), it is noted that the inverse electrocaloric effect is related to the competing phases or states that are close in energy and can be easily transformed by a field (as is relevant to antiferroelectrics).

5.7. Energy Storage

Antiferroelectric materials are desired for high-power electrical energy storage, which is increasingly demanded in the expansion of modern commercialization [129]. See Figure 9 for the most fundamental parameters representing device performance in relation to the PE hysteresis curves. Stored energy density Ws during the forward (AFE-to-FE) phase change, the recoverable version Wr during the backward (FE-to-AFE) change, and efficiency η can be evaluated through the numerical integration of the PE curves according to the following equations:
W s = 0 P m E d P
W r = P m P r E d P
η = W r / W s
Here, Pm and Pr are the maximum and remanent polarizations, respectively. From the figure, it is evident that the type-I and type-II phase change dielectrics, accompanied by the S-shaped double PE loops, are advantageous over linear dielectrics and ferroelectrics. Moreover, the forward and backward switching fields (EF and EA) should be as close as possible to each other to maximize efficiency η. An especially high performance is achieved with lead-containing antiferroelectrics [130,131], such as (Pb,La)(Zr,Ti)O3 (PLZT) compounds [132], and these have been applied to commercial use in dc link condensers. Recent extensive research has remarkably increased stored electric energy density, even for lead-free alternatives [131,133,134]. Excellent η values, together with ultra-high energy storage (Figure 9c), have also been achieved by collapsing the hysteresis by making the field-induced change diffusive through further modifications of these antiferroelectrics into relaxors.
Among the organic type-I and II phase change dielectrics, SQA and FDC have the best (~18 μC/cm2) and second-best performances (~15 μC/cm2) in terms of the magnitude of ΔP. In particular, improved dielectric strength resulted in excellent energy-storage performance, including a high Wr (3.3 J/cm3), while maintaining a nearly ideal η (90%) for SQA. Low crystal density represents an advantage of organic molecular systems. The corresponding energy density per mass (Wr′ = 1.75 J/g) is higher than those (Wr′ < 1.3 J/g) derived from the highest Wr values (~8–11 J/cm3) [129,133] reported for several bulk antiferroelectric ceramics. At present, one of the important challenges for the organic phase-change dielectrics is the further improvement of dielectric strength. This will expand variations of target compounds and provide the possibility of disclosing hidden polarization-optimized phases (such as the FE-β form of SQA) for a record update in performance.

5.8. Electromechanical Properties

Ferroelectric and antiferroelectric materials exhibit piezoelectricity and electrostriction, respectively, as important electromechanical functionalities [1,2] (Figure 14a). In antiferroelectrics, piezoelectric activity is lost, and only electrostriction remains as the quadratic effect due to the centro-symmetric crystal structures in general (note that the arguments herein exclude the exceptional polar AFE compounds such as TCMBI). There are two types of electromechanical response. An analog type, in which an applied field induces a large displacement continuously, which is promising for applications such as ultra-precision positioners, displacement transducers, and energy harvesting. On the other hand, a digital type is accompanied by a jump in electromechanical strain at a critical field EF, which can be applied to digital displacement transducers and shape memories [135,136].
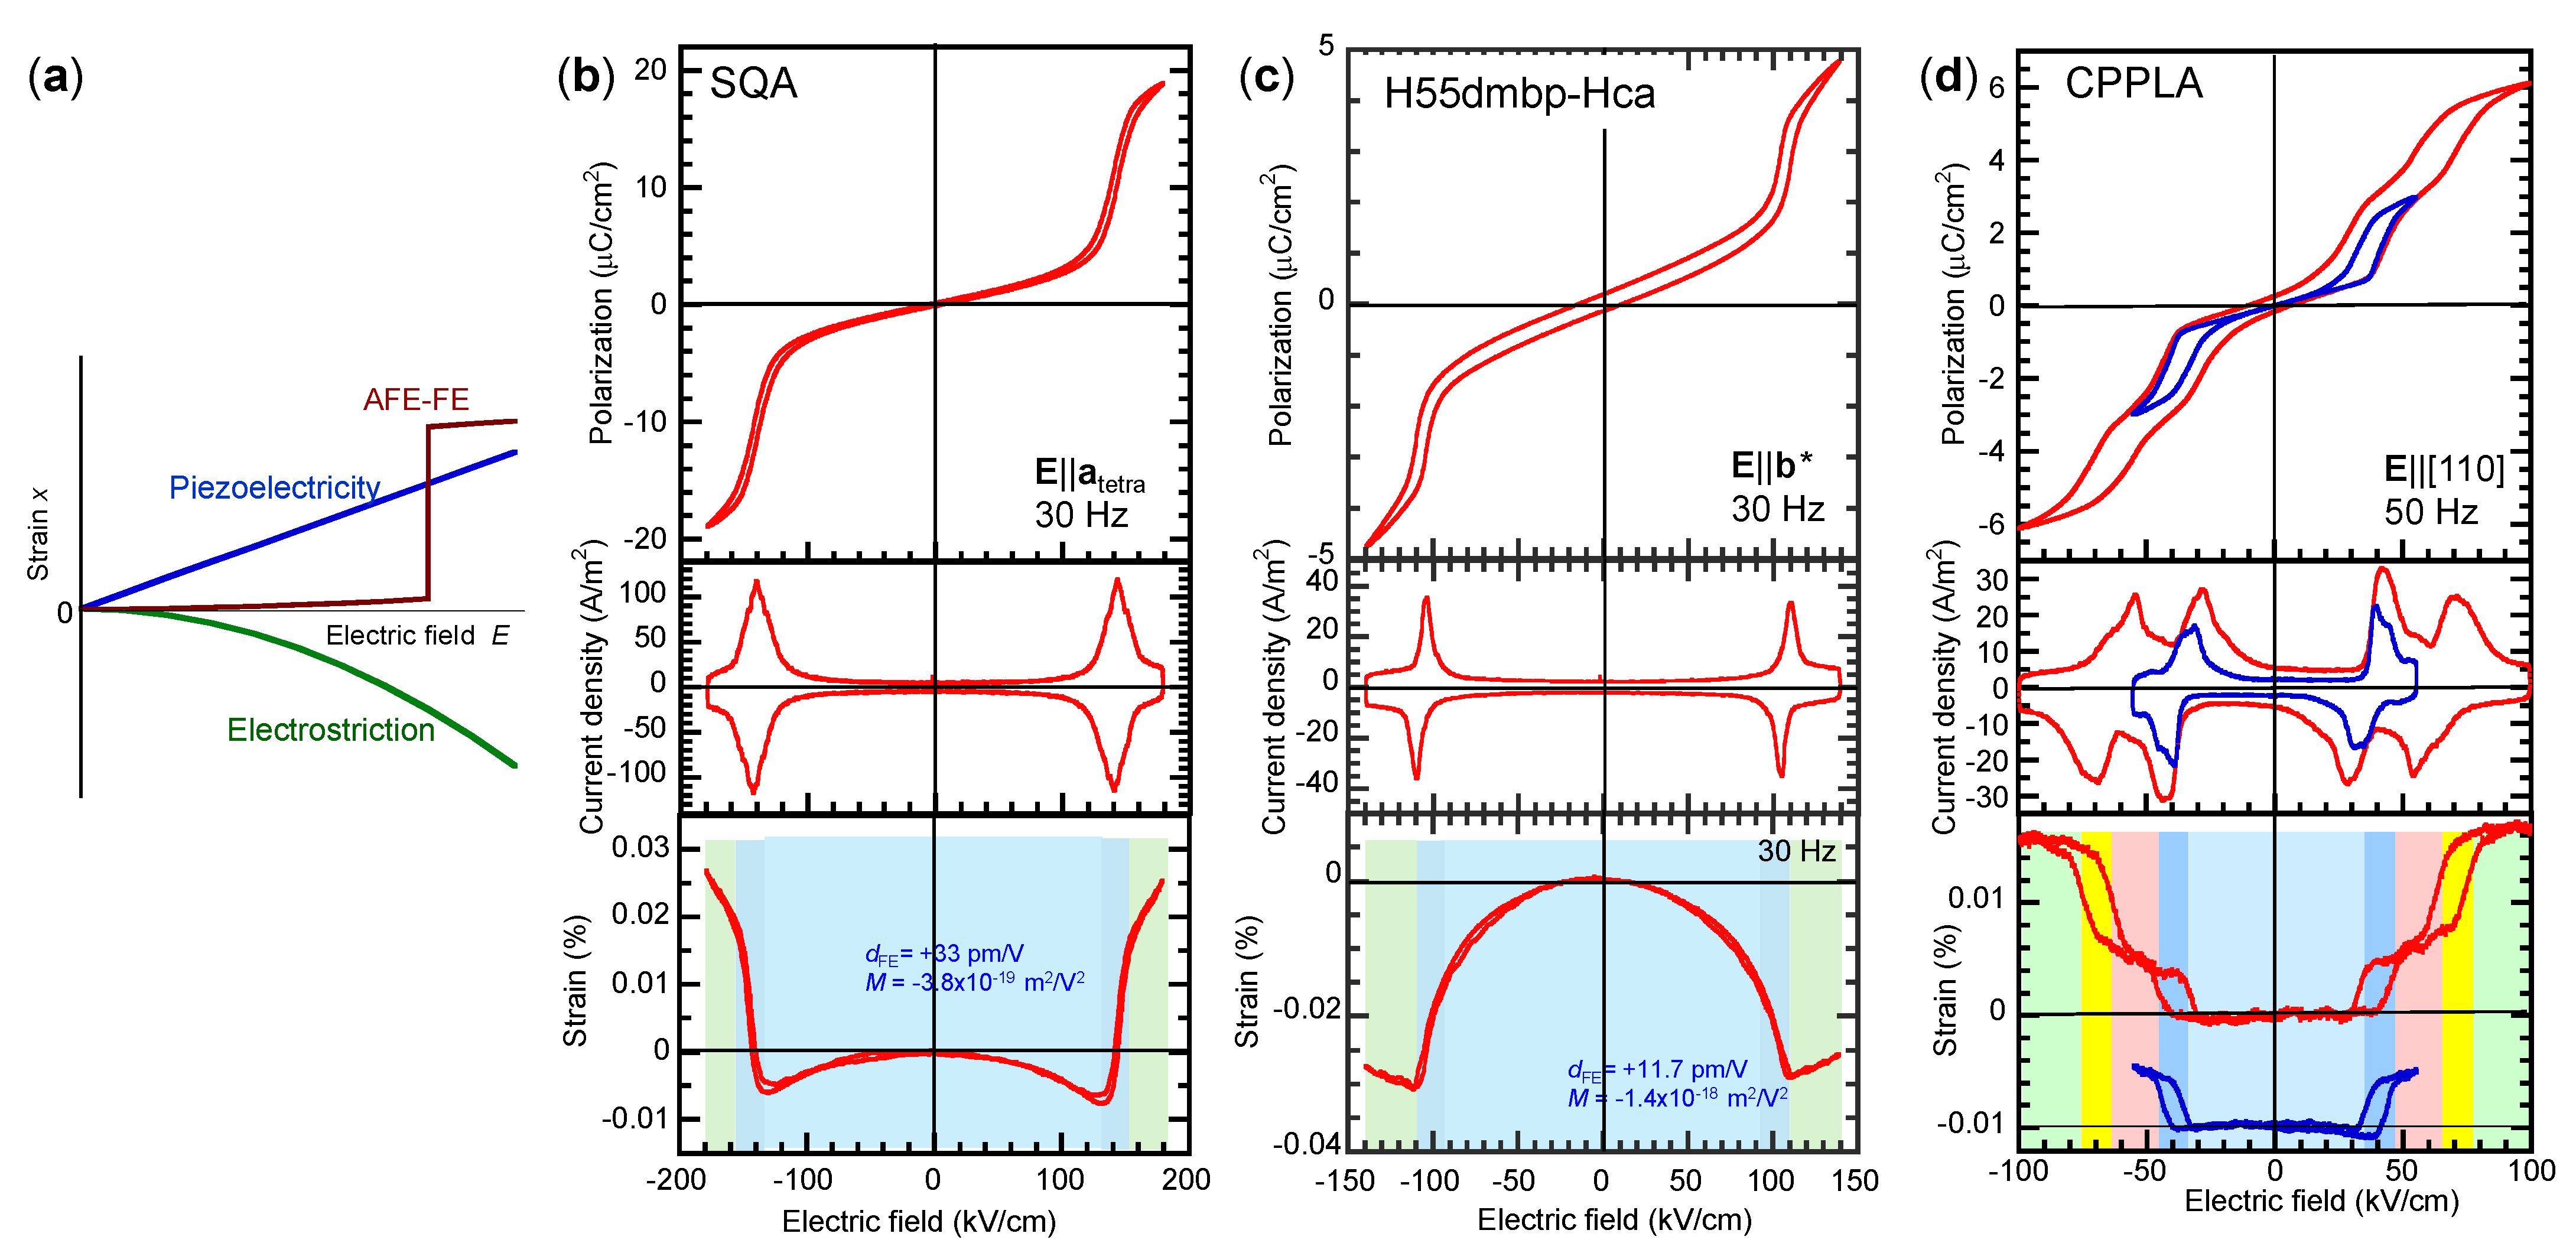
As mentioned in Section 5.2, direct and converse piezoelectricity have been observed with moderate performance mainly for several PT mode ferroelectrics. Here, we show the electromechanical strain of a few PT mode antiferroelectrics for the first time using the same experimental procedures employed for measurements of the converse piezoelectric effects of organic ferroelectric crystals [111]. The longitudinal strain of SQA, H55dmbp-Hca, and CPPLA single crystals synchronized with the PE hysteresis properties are presented in Figure 14b–d. Regarding field E-dependence, the former two crystals show the three characteristic regimes, as distinguished by the colored hatches. The crystals commonly shrink with quadratic dependence in the low field region, whereas the phase switching regime is accompanied by an upward or downward jump in strain simultaneously with the peaks in the displacement current. The electrostrictive coefficients M defined by X3 = ME2 [2,3] are −3.8 × 10⁻¹⁹ and −1.4 × 10⁻¹⁸ m2/V2 for SQA and H55dmbp-Hca crystals, respectively. Linear field dependence in the high-field regime can be attributed to the piezoelectric effect arising from the field-induced FE state. From the slope, the longitudinal piezoelectric coefficients are +33 and +11.7 pm/V for SQA and H55dmbp-Hca crystals, respectively. CPPLA shows that the two-step phase changes exhibit five regimes, which consist of faint electrostriction in the low-E region, a jump and hysteresis in strain, emerging in the two phase transition regimes and a linear E-dependence in the field-induced two ferroelectric (FE-I and FE-II) regimes. An overall magnitude of strain of 0.02–0.03% for the three antiferroelectrics is several times larger than the piezoelectric strain of PT mode ferroelectrics (such as CRCA and PhMDA) [112]. However, it is one or two orders of magnitude smaller than the piezoelectricity of (relaxor) ferroelectric ceramics and crystals [137,138] and the electrostriction of antiferroelectric oxides [139,140].
Compared with ferroelectrics, there should be fewer clues for identifying the phase switching modes (such as PT versus FF) for antiferroelectrics, as the poled crystal state is usually unstable in a zero field. One of the best clues could be the sign of converse longitudinal piezoelectric coefficients, available from the electromechanical strain measurements. The positive slope of the strain commonly observed in the high-E region is consistent with the PT mode switching for three antiferroelectric compounds.
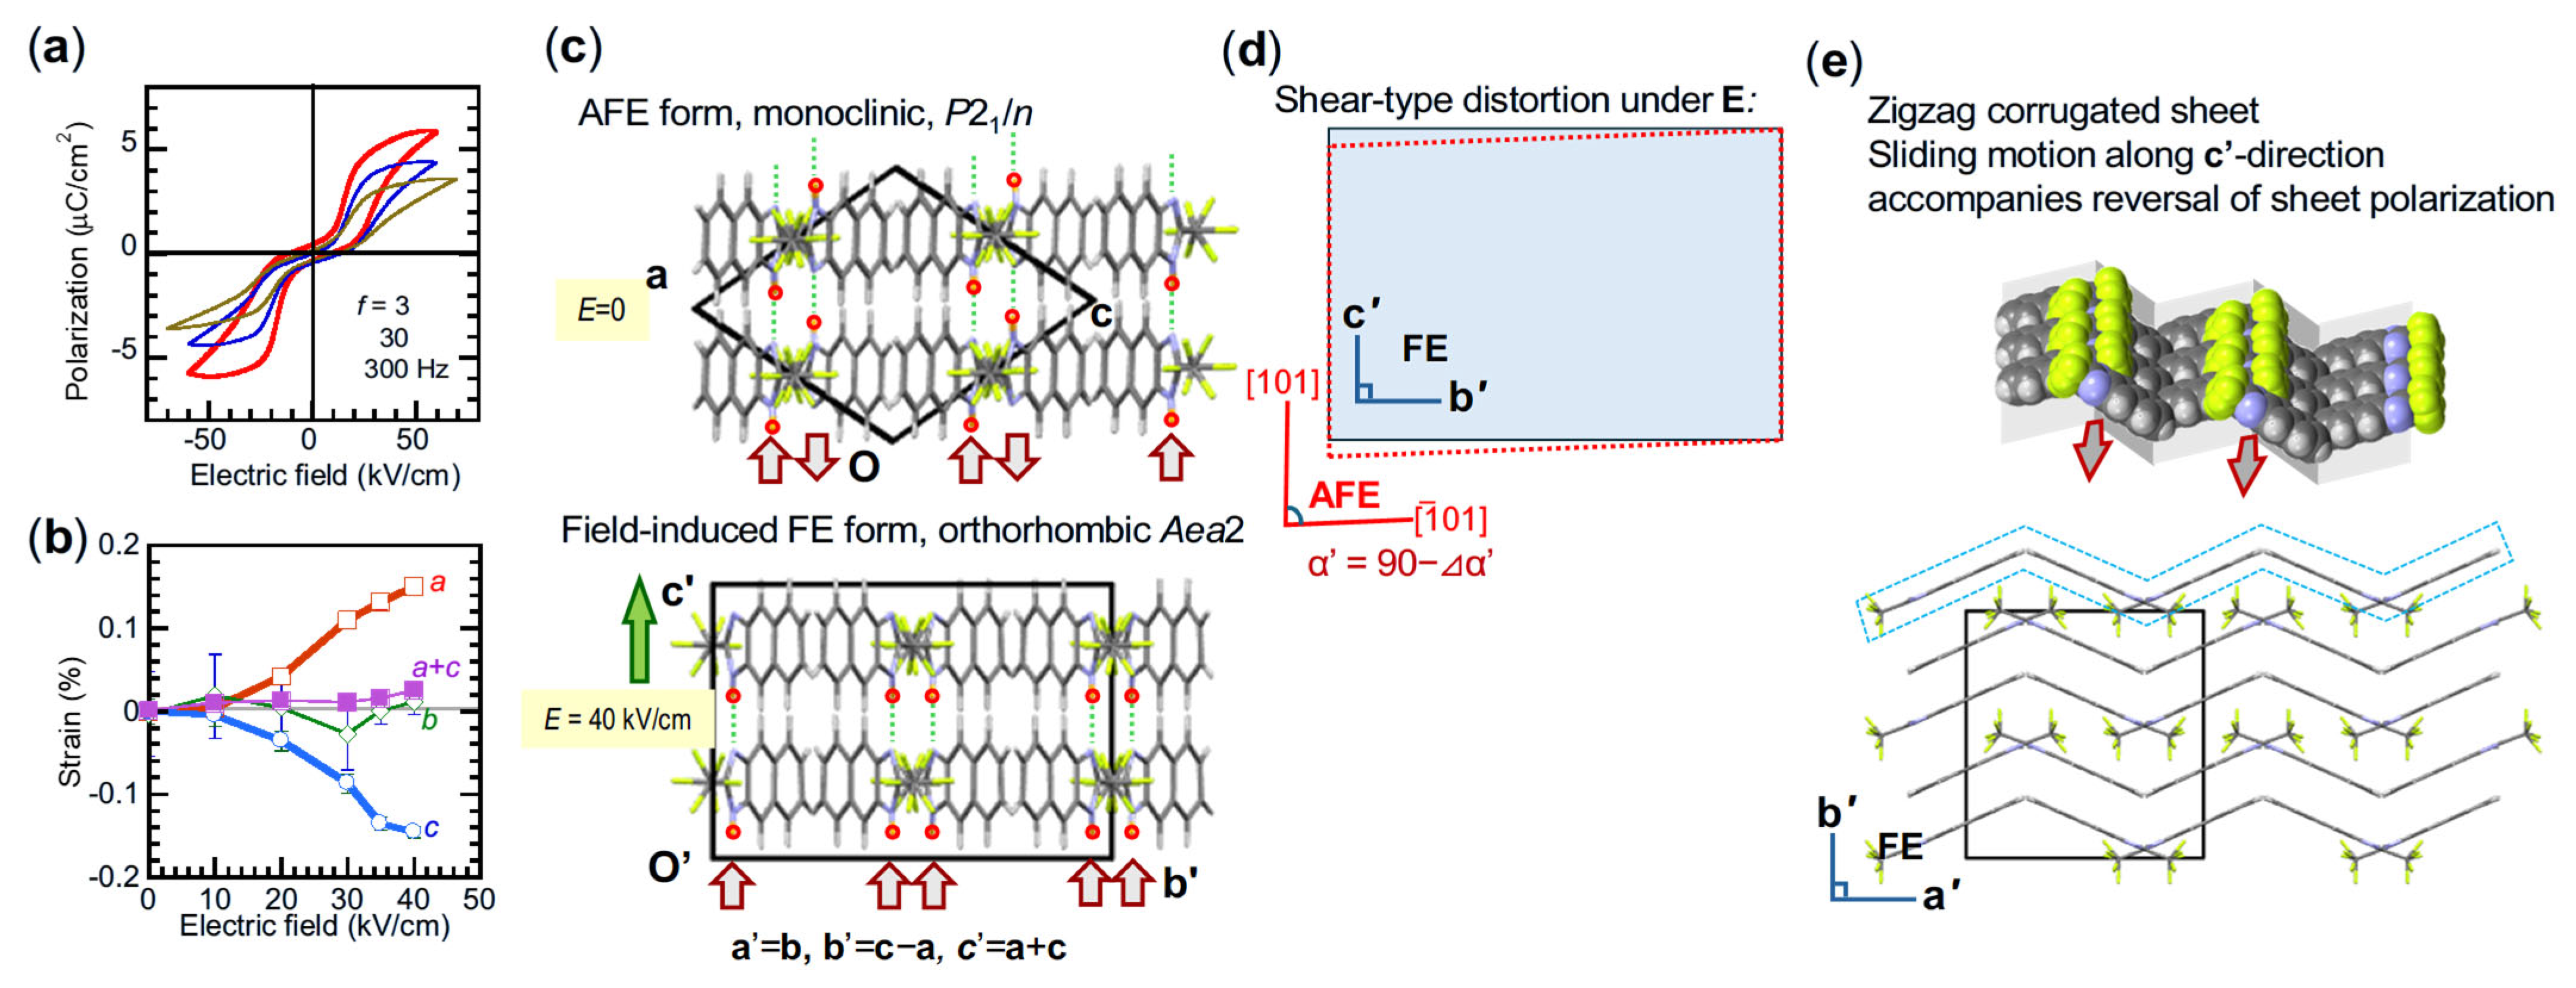
Another fascinating finding in the hydrogen-bonded organic crystals is the giant electromechanical strain discovered for an antiferroelectric 2-trifluoromethylnaphthimidazole (TFMNI) crystal [37]. Although the crystal size was insufficient for the measurements of longitudinal strain synchronized with the PE hysteresis, the small switching field of 20–30 kV/cm enabled us to capture the DC-field-induced antipolar-to-polar structural transition in air using a synchrotron X-ray source (Figure 15). The strain level (0.15% at 40 kV/cm) corresponds to a piezoelectric coefficient of 380 pm/V. It is one order larger in magnitude compared with the typical organic ferroelectrics (|d33| ≤ 30 pm/V) [11,12], and it is comparable with those of the commonly used piezoelectric ceramics (∼370 pm/V) [141]. The unit cell transformation indicates shear-type strain [37]. The crystal structure comprises a stack of zigzag, corrugated dipolar sheets, each of which is built from hydrogen-bonded molecular chains of the collinear polarizations. The field-induced AFE–FE transition corresponds to the switching between the antipolar and polar stackings of the sheets. The large shear strain is explained by the sliding of the sheets along the hydrogen-bonded chain (arrows in Figure 15e).

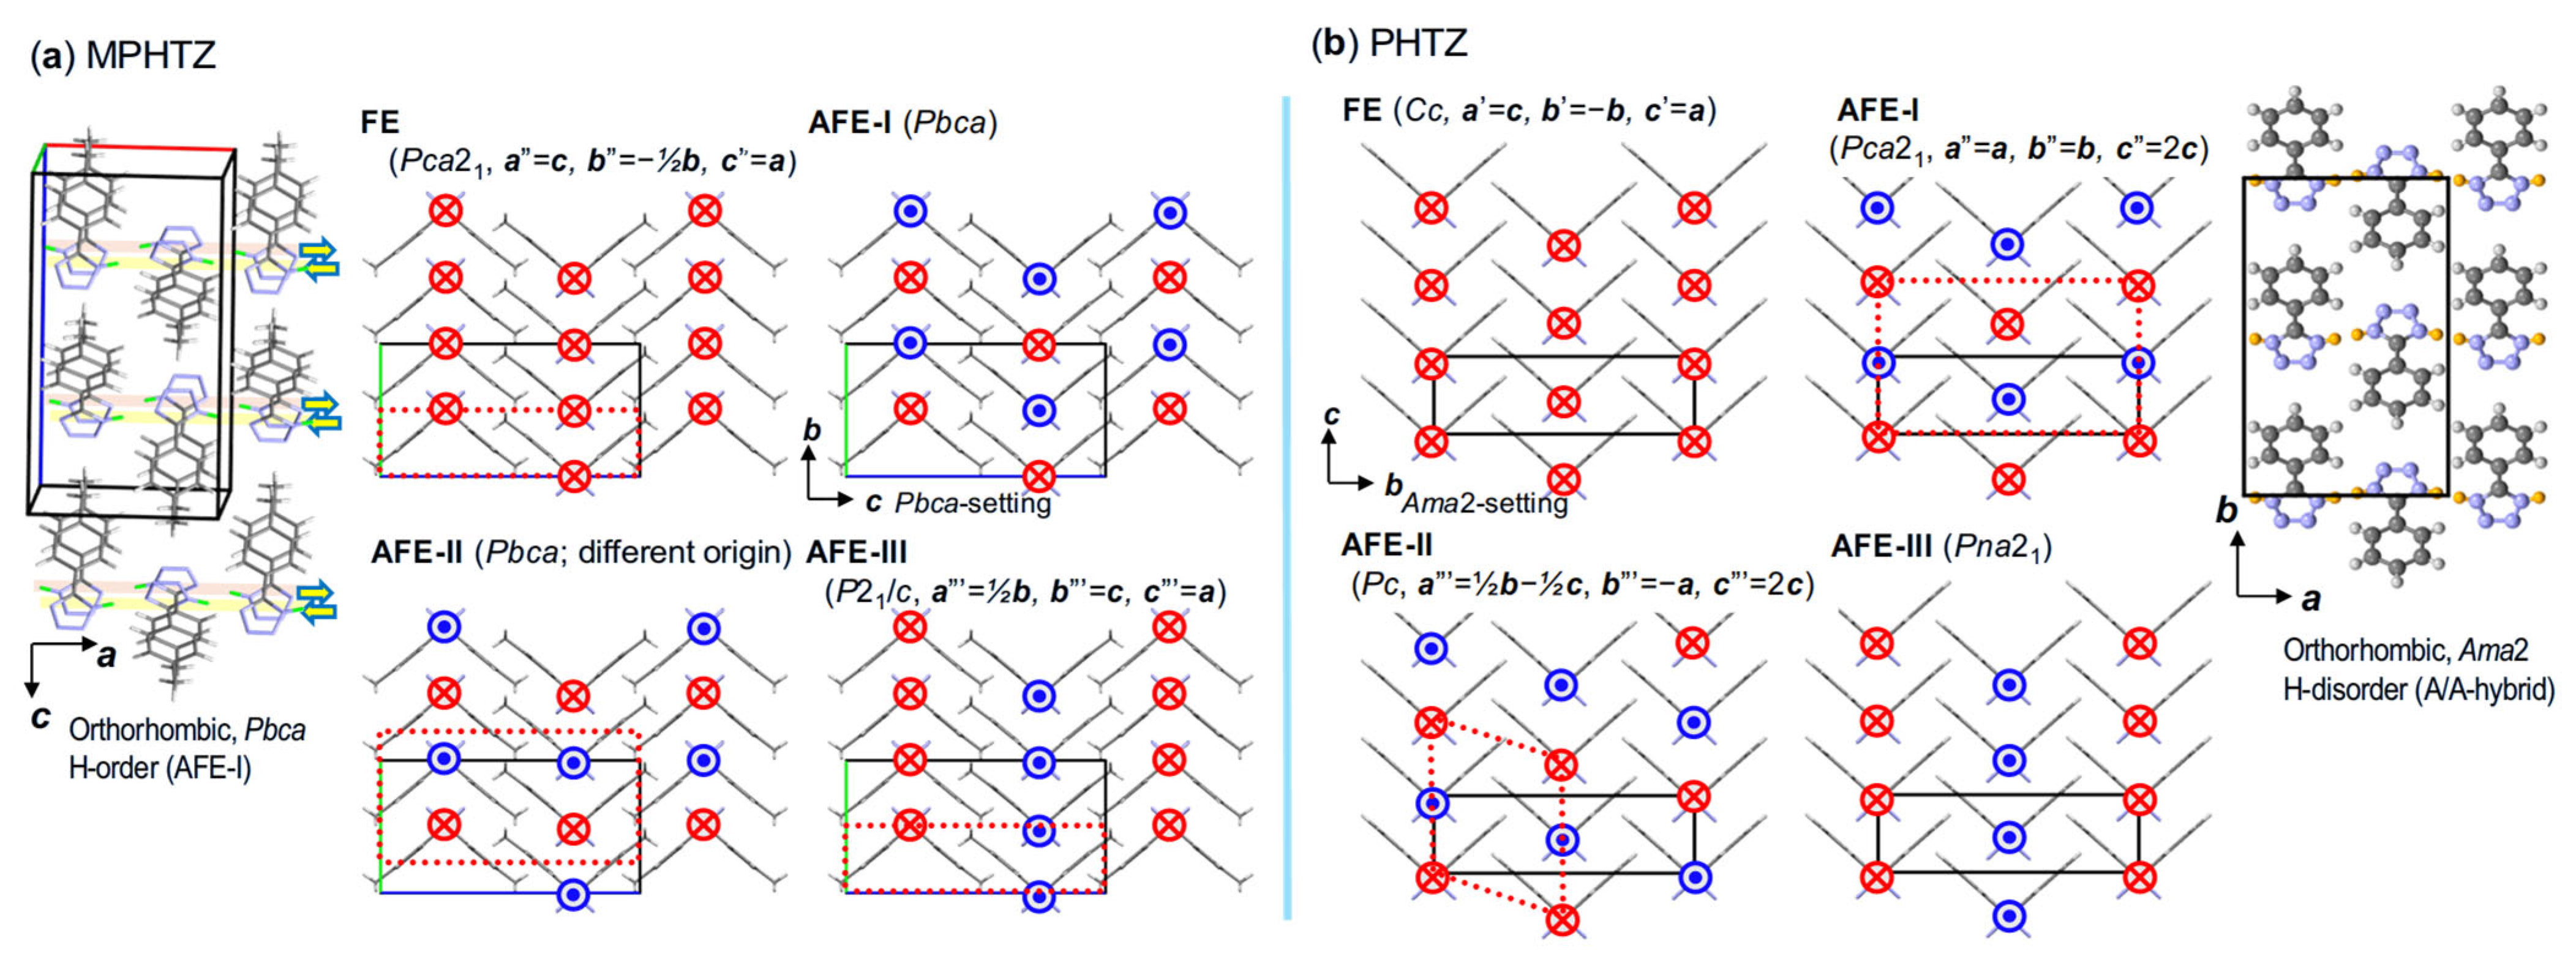
5.9. Analysis of Relative Phase Stability

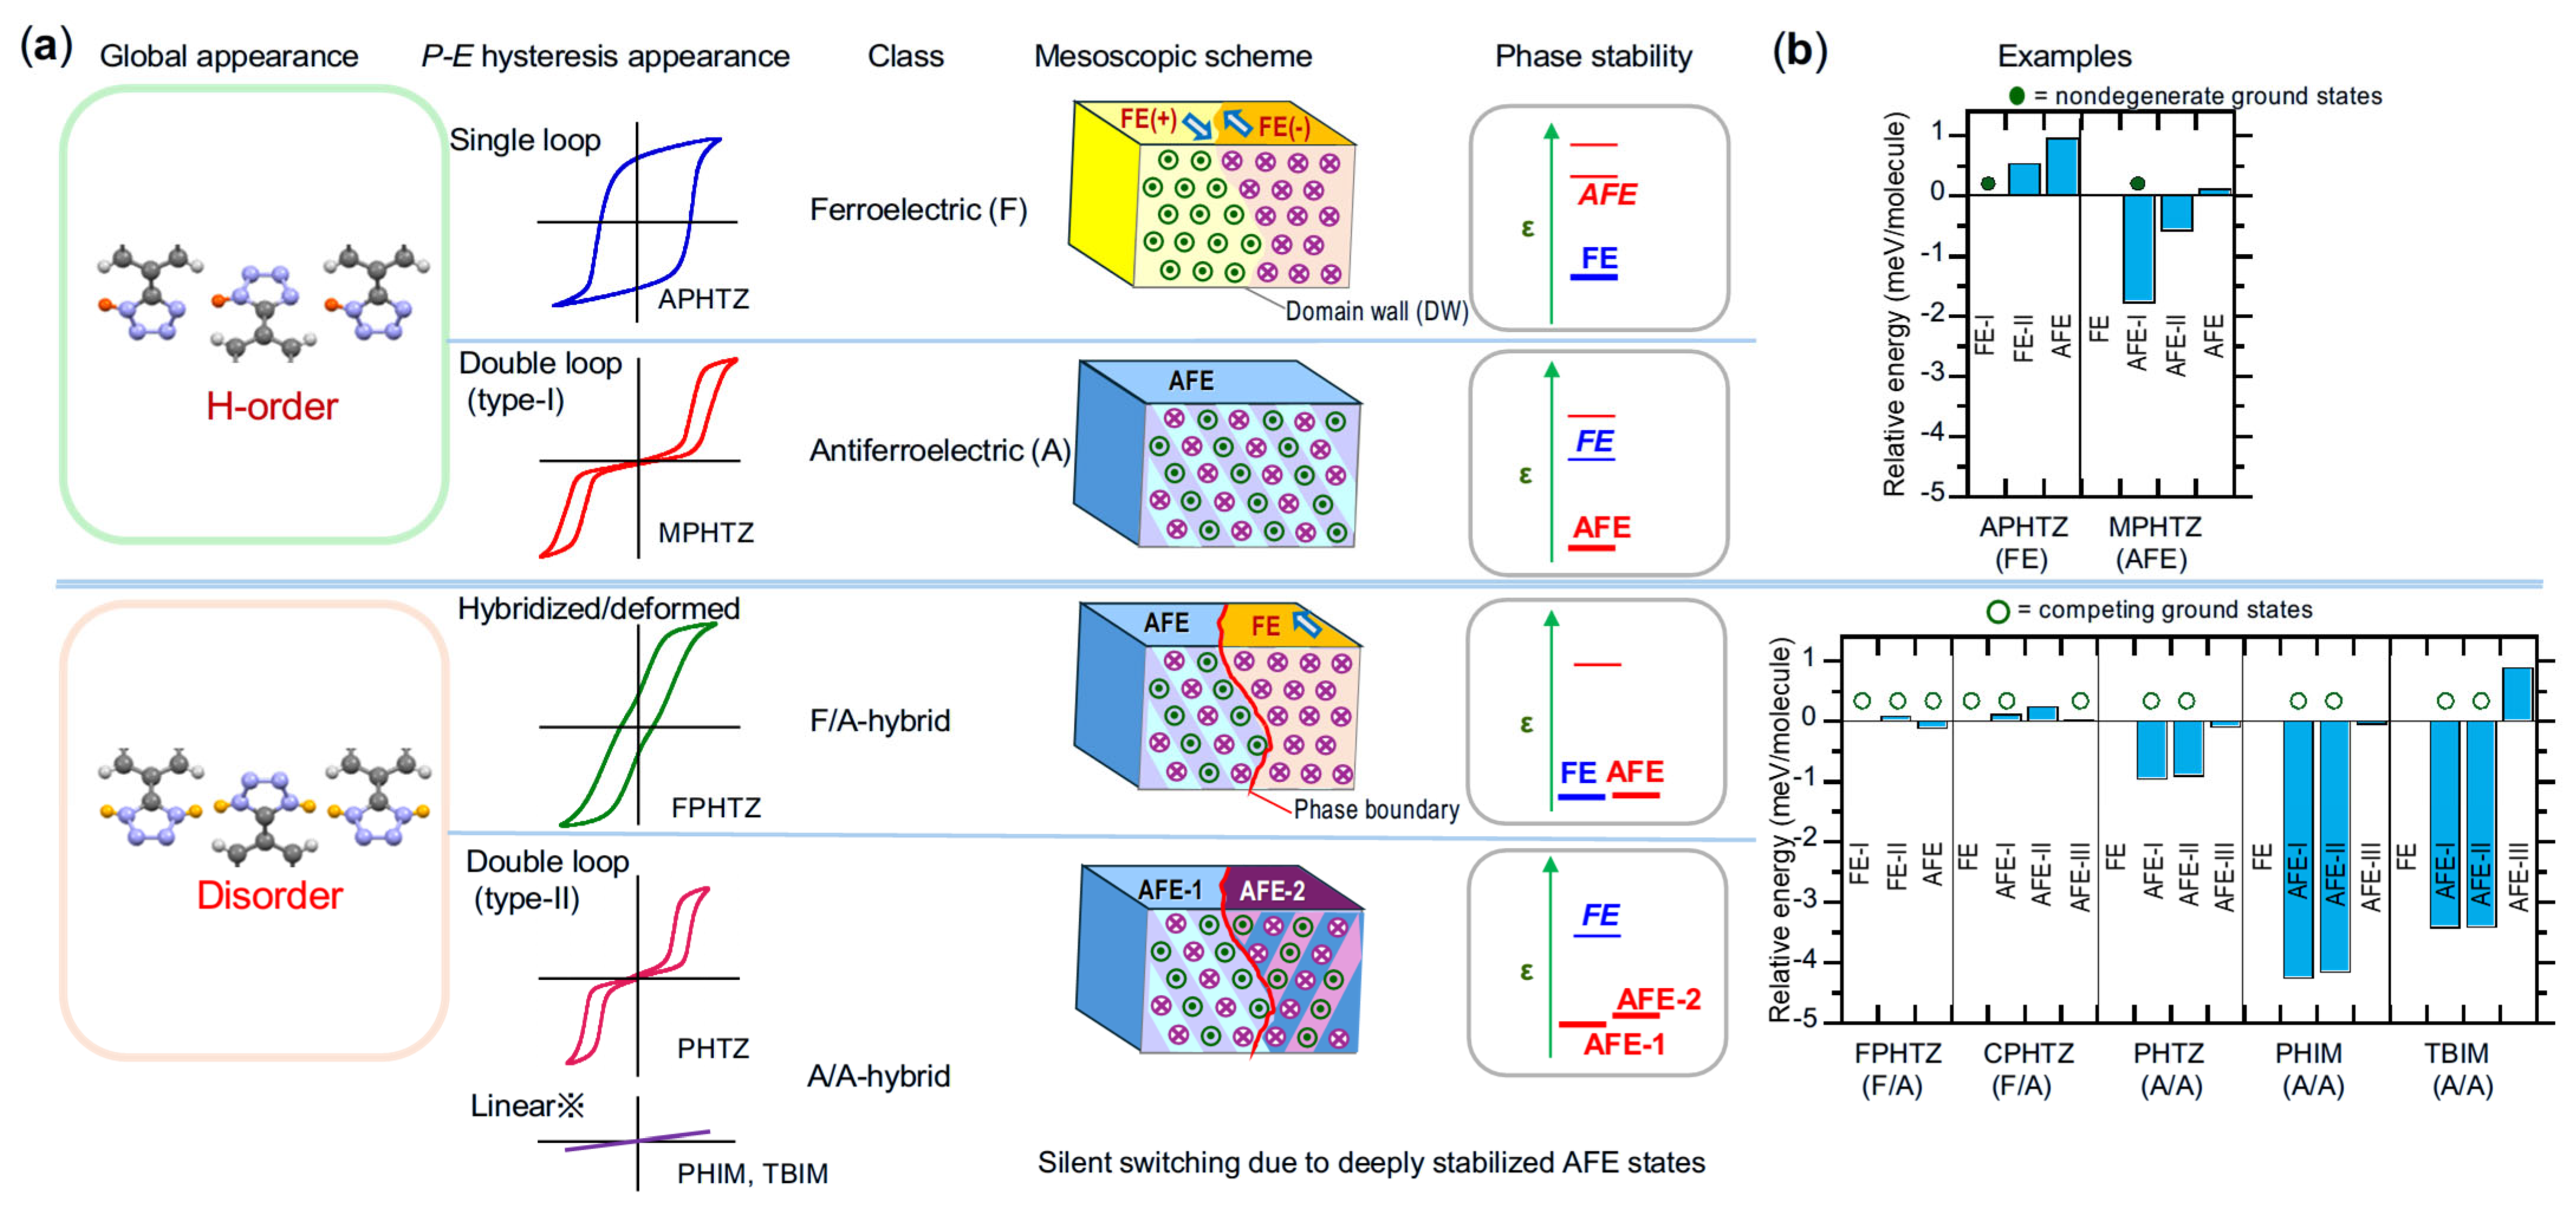
As the knowledge and variations of the polarization configurations increase (as shown above), integrated experimental and theoretical assessments are ready to portray the whole systematics of structure–property inter-relationships. A series of 2-phenyl-1H-tetrazoles (PHTZs) and imidazoles suggests suitable clues for solving this issue [31] because all four classes are available, despite their close structural similarities. Here, we examine the relative phase stability systematically. The previous DFT calculations report a small energy difference ΔU between the AFE and FE phases (a few meV per formula unit (f.u.)) for antiferroelectric ADP [142], and even a tiny one (+0.5 meV/f.u.) for AgNbO3, showing AFE–FE phase coexistence [143]. Figure 16 summarizes the classification of the hydrogen-bonded dielectrics according to mesoscopic and microscopic schemes, which are responsible for the macroscopic polarization switching and presence or absence of long-range hydrogen orders. The observed N···N separation (>2.7 A) is long enough to exclude the centered hydrogen location in the azole crystals studied. Therefore, the hydrogen disorder observed in the structural analysis seems to reflect the presence of competing ground states. This hypothesis has been justified by the DFT calculations of the relative stability among the FE and AFE (including a few hypothetically ordered) states (Figure 16b) [31]. The hydrogen-ordered ferroelectric APHTZ and antiferroelectric MPHTZ crystals exhibit sufficient energy separation (i.e., ΔU > 0.5 meV/molecule) between their respective ground state and other candidate ordered forms (the upper panel of the figure). In contrast, the FPHTZ and CPHTZ crystals reveal degenerate FE and AFE states (ΔU < 0.2 meV/molecule; the lower panel), which reasonably explain the F/A hybrid behaviors accompanied by the intermediate (or coexisting) shapes of single and double PE loops.
The other previously overlooked scenario is a different kind of hybrid state (class A/A), where the nearly degenerate ground states are all antipolar [31]. Figure 17 displays the candidate FE and AFE structural forms examined in simulations for the hydrogen-ordered MPHTZ and the disordered PHTZ crystals. The MPHTZ crystal belongs to class A, and the observed crystal form AFE-I is proven to be the most stable. As for the PHTZ crystal, the polarization vectors in the figure represent only a switchable dipole component, directed parallel to the a axis. In contrast, the permanent dipoles along the longitudinal molecular axis generate a fixed c direction component. The AFE-I and AFE-II forms, having dipole alternation along the c axis, are found to be nearly degenerate and much more stable compared with the AFE-III and FE versions. PHTZ, then, is regarded as belonging to class A/A, as the coexistence of these forms at the mesoscopic scale prevents the long-range order of NH hydrogen atoms. Note that the appearance of a double hysteresis loop shape looks very similar between the MPHTZ and PHTZ crystals. Therefore, the energy storage and its related applications can be expected, irrespective of whether the antipolar structural ordering range is long (class A) or short (class A/A). From further exploration of the hydrogen-disordered crystals of imidazoles PHIM and TBIM, neither FE nor AFE switching has been observed, even with a strong electric field (the maximum of 150–200 kV/cm) applied along the hydrogen-bonded chains. Such silent switching has been explained by the large stabilization energy of the degenerate AFE-I and AFE-II forms relative to the FE form (ΔU > 3 meV/molecule). The theoretical simulations can thereby predict whether the hydrogen atoms frozen in a disordered state can be aligned easily with a strong field or not in class A/A crystals [31].

5.10. Case Studies with Applied Integrated Approach

The candidate dielectrics discovered by data mining the CSD have been successfully classified into class F, A, F/A, or A/A through integrated experimental and theoretical assessments. Summarizing the arguments above, the procedures can be traced for full assignments of the dielectric classes according to the flowcharts shown in Figure 18. The effectiveness can be verified via the successful application to two of the most recently discovered dielectrics, PDPLA (Figure 19) and DHIB (Figure 20), as shown below. The redetermined crystallographic data are included as CIF files in the Supplementary Materials for two compounds.
The previously reported crystal structure of PDPLA (CSD ref. code:HOQMEG; monoclinic space group, P2/c) assumes hydrogen disorder on the COOH groups [33]. In contrast, our observations of single PE hysteresis loops and moderate SHG activity indicate class F, requiring a re-examination of crystal structure analysis regarding carefully grown single crystals. A polar crystal with a space group Pc gives the best reliability factor, together with the proper chemical structure, consistent with the observations of ferroelectricity along the c direction. The simulation confirms the validity of the assignment according to its relative stability against the other few hypothetical AFE structures (Figure 19). Note that the dOO of PDPLA approaches the longest limit for the PT mode (Figure 6b). This is a likely reason why the observation of PE hysteresis required a high temperature for the reduction of a large coercive field.
A pseudo-translation symmetry b/2 was detected for the reported crystal structure of DHIB (CSD ref. code: SIXNAP; monoclinic space group, P21/c [50]). However, the reported OH hydrogen locations are improperly assigned without considering the orientational disorder; they collide with each other as OH-HO due to the inversion symmetry located at each center of intermolecular OH···OH hydrogen bonds. The reassessments of crystal structure yield the best solution, with a b/2 periodicity and a centric space group P2/c. The hydrogen disorder and deformed PE loop are consistent with the F/A hybrid state, which is also justified by the computational finding of the competing two AFE and one FE phases within 0.12 meV/molecule (Figure 20). FF mode switching is suggested by the long dOO (2.90–2.91 Å). The theoretical polarization along the c direction (4.6 μC/cm2) agrees well with the saturated polarization observed in the PE curve. Despite the existing diverse combinations of switching classes and modes, class A of the FF mode is still missing among the hydrogen-bonded single-component compounds (Table 1). On the other side, AFE switching with moderate polarizations has been recently demonstrated by the FF motion of organic ammonium cations on several inorganic–organic hybrid perovskites [144,145,146].
The process requiring special care is the feedback for the redetermination of crystal structures, as indicated by # in the flowchart (Figure 18). The reported crystal structure frequently turns out to be inconsistent with our PE hysteresis and/or SHG test results, as shown by the examples above. The first routine procedures required for finding appropriate lattice and space group symmetry are careful re-examinations of whether the corresponding superlattice reflections and systematic absences are present or not and whether the molecules retain normal geometries after structural refinements with a minimized R. The overlooking of weak reflections may be diminished using the synchrotron X-ray source. However, the actual success of this assessment depends largely on the qualities of the single crystals used. These problems may arise partly from the intrinsically least structural difference among the FE, AFE, and PE phases. Under these circumstances, the frustration of plural ordered states makes it easier to disturb the long-range structural order by embedding the defects and domain walls densely inside the crystals, especially when the crystals are prepared after insufficient purification and careless crystal growth. The loss of long-range polar or antipolar order causes the spatially averaged symmetry in the structural analysis (i.e., the hydrogen-disordered crystal structure). Therefore, to see genuine crystal symmetry, this artifact should be eliminated as much as possible by developing the coherently ordered regions. According to our experience, one of the best methods is thermal annealing at high temperatures, especially for crystal growth during the temperature gradient vacuum sublimation (purification) process. The electric treatment could serve as an alternative solution, if we recall that the relevant issue is that the switching properties can be optimized on many hydrogen-bonded ferroelectrics by removing the pinned domain walls [23,147].

6. Outlook and Perspective

Nowadays, antiferroelectrics and related polarization switchable dielectrics attract increasing research interest regarding their field effect functionalities, such as electrostatic energy storage for high- or pulsed power systems, analog or digital electromechanical devices, and electric cooling devices. The latest explorations of such dielectrics on hydrogen-bonded organic crystals, especially proton–π-electron correlated systems, led us to discover many intriguing crystal phases and properties regardless of the FE, AFE, and PE crystal forms. Squaric acid is highlighted due to its extraordinarily large electrostatic energy storage with excellent efficiency. In search for other promising candidates, “pseudosymmetry” and “hydrogen disorder” serve as the most effective and complementary clues in data mining on CSD; this is because they represent both sides of the same principles of crystal symmetry changes in ferroelectrics and antiferroelectrics. The obtained dielectrics are divided into FF and PT switching types, which are rationally distinguished using the opposite sign of polarizations or electromechanical responses. The advanced DFT calculations combined with the Berry phase theory of electric polarizations satisfactorily reproduced many experimental observations, such as the emergence/absence, performance, and mode of dielectric switching, as well as their microscopic crystal structures. The dielectrics were further classified into four classes, F, A, F/A, and A/A, the origins of which are all systematically understood, ranging from microscopic to macroscopic scales, by integrating the experimentally obtained structural, nonlinear optical, and dielectric properties with the theoretical simulations. This means that computational studies could supplement some macroscopic properties and their microscopic origins, which remain unmeasured. On the other hand, for completing the field effect in crystal engineering, it becomes more important to overcome the tough challenge of predicting the molecular arrangement precisely from the molecules concerned in the future.
Additionally, the integrated experimental and computational approaches unraveled several novel competition phenomena. A variety of discovered competing plural ground states reminds us of the possible emergence of a gigantic physical response (such as piezoelectricity), as is expected near a morphotropic phase boundary. Likewise, some exotic phenomena may be expected through the competition between plural switching paths, such as PT versus FF modes. Many of the ideas and principles described above could be applied to materials other than hydrogen-bonded dielectrics as well. This feature article demonstrates several phase-change dielectrics with enriched structural variations; however, the observed design and working principles are not limited to the proton–π-electron correlated systems focused on herein. We hope this article will stimulate future work as milestones toward field-effect crystal engineering for designing novel functionalities.

Supplementary Materials

CIF files of the structures were deposited by the Cambridge Crystallographic Data Centre: 2464774 (PDPLA) and 2464451 (DHIB). The copy can be obtained free of charge by accessing http://www.ccdc.cam.ac.uk (accessed on 18 August 2025).

Author Contributions

Conceptualization, S.H. and S.I.; methodology, J.T.; software, S.I. and H.M.; validation, S.H. and S.I.; investigation, S.H. and S.I.; writing—original draft preparation, S.H.; writing—review and editing, S.H., H.M., J.T. and S.I.; visualization, S.H. and H.M.; supervision, S.H.; project administration, S.H.; funding acquisition, S.H. All authors have read and agreed to the published version of the manuscript.

Funding

This work is supported by JSPS KAKENHI (Grant Numbers 21H04679, 25H00836) and JST CREST (Grant Number JPMJCR18J2), Japan.

Data Availability Statement

Data is available from the authors upon reasonable request.

Acknowledgments

S.H. thanks K. Kobayashi and R. Kumai for supplying the synchrotron X-ray diffraction data, S. Aoyagi for the synthesis of bis(benzimidazole)s, N. Fujiki for the SHG measurements, and Y. Shimoi for the theoretical simulations and materials screening using the CSD. Some of the computations in this work were carried out using the facilities at the Supercomputer Center, the Institute for Solid State Physics, The University of Tokyo, and the supercomputer “Flow” at the Information Technology Center, Nagoya University.

Conflicts of Interest

The authors declare that there are no competing interests.

Abbreviations

The following abbreviations are used in this manuscript:
PEparaelectric
FEferroelectric
AFEantiferroelectric
PEpolarization–electric field
SHGsecond harmonic generation
CSDCambridge Structural Database
IUCrInternational Union of Crystallography
FFflip-flop
PTproton transfer
DFTdensity functional theory
LDAlocal density approximation
GGA-PBEPerdew–Burke–Ernzerhof version of the generalized gradient approximation
vdWvan der Waals
DF-cxdensity-functional consistent-exchange
rVVrevised Vydrov–van Voorhis
CRCAcroconic acid
SQAsquaric acid
KDPpotassium dihydrogen phosphate (KH2PO4)
ADPammonium dihydrogen phosphate (NH4H2PO4)
9HPLN9-hydroxyphenalenone
MeHPLN5-methyl-9-hydroxyphenalenone
BHPLN5-bromo-9-hydroxyphenalenone
IHPLN5-iodo-9-hydroxyphenalenone
dabcodiazabicyclo[2.2.2]octane
Phzphenazine
H2cachloranilic acid
H2babromanilic acid
H2iaiodanilic acid
55dmbp5,5′-dimethyl-2,2′-bipyridine
66dmbp6,6′-dimethyl-2,2′-bipyridine
npd1,5-naphthyridine
PhMDA2-phenylmalondialdehyde
CBDCcyclobutene-1,2-dicarboxylic acid
HPLN3-hydroxyphenalenone
MBI2-methylbenzimidazole
DCMBI5,6-dichloro-2-methylbenzimidazole
ALAA3-anilinoacrolein anil
ATAanthranilic acid
APHTZ5-(4-aminophenyl)-1H-tetrazole
PDPLA1,2-phenylenedipropiolic acid
CPHTZ5-(4-chlorophenyl)-1H-tetrazole
FPHTZ5-(4-fluorophenyl)-1H-tetrazole
TFMBI2-trifluoromethylbenzimidazole
DFMBI2-difluoromethylbenzimidazole
TCMBI2-trichloromethylbenzimidazole
TFMNI2-trifluoromethylnaphthimidazole
MPHTZ5-(4-methylphenyl)-1H-tetrazole
CPPLA3-(4-chlorophenyl)propiolic acid
FDC3,4-furandicarboxylic acid
BI2Cbis-(1H-benzimidazol-2-yl)methane
PHTZ5-phenyl-1H-tetrazole
BI2P2,2′-(1,2-phenylene)bis-1H-benzimidazole
DHBA2,5-dihydroxybenzoic acid
DHIBα,α’-dihydroxy-1,3-diisopyopylbenzene
NPTL2-naphthol
LTTLL-threitol
MNTLDL-mannitol
THMCHO2,2,6,6-tetrakis(hydroxymethyl)cyclohexanol
BHEOB1,3-bis(2-hydroxyethoxy)benzen
TCHMtricyclohexylmethanol

References

  1. Lines, M.E.; Glass, A.M. Principles and Applications of Ferroelectrics and Related Materials; Oxford University Press: New York, NY, USA, 1977. [Google Scholar]
  2. Uchino, K. Ferroelectric Devices; Marcel Dekker: New York, NY, USA, 2000. [Google Scholar]
  3. Merz, W.J. Double Hysteresis Loop of BaTiO3 at the Curie Point. Phys. Rev. 1953, 91, 513–517. [Google Scholar] [CrossRef]
  4. Sawaguchi, E.; Maniwa, H.; Hoshino, S. Antiferroelectric Structure of Lead Zirconate. Phys. Rev. 1951, 83, 1078. [Google Scholar] [CrossRef]
  5. Shirane, G.; Sawaguchi, E.; Takagi, Y. Dielectric Properties of Lead Zirconate. Phys. Rev. 1951, 84, 476–481. [Google Scholar] [CrossRef]
  6. Kittel, C. Theory of Antiferroelectric Crystals. Phys. Rev. 1951, 82, 729–732. [Google Scholar] [CrossRef]
  7. Randall, C.A.; Fan, Z.; Reaney, I.; Chen, L.-Q.; Trolier-McKinstry, S. Antiferroelectrics: History, fundamentals, crystal chemistry, crystal structures, size effects, and applications. J. Am. Ceram. Soc. 2021, 104, 3775–3810. [Google Scholar] [CrossRef]
  8. Koch, C.C. Experimental evidence for magnetic or electric field effects on phase transformations. Mater. Sci. Eng. 2000, A281, 213–218. [Google Scholar] [CrossRef]
  9. Lai, A.; Schuh, C.A. Direct Electric-Field Induced Phase Transformation in Paraelectric Zirconia via Electrical Susceptibility Mismatch. Phys. Rev. Lett. 2021, 126, 015701. [Google Scholar] [CrossRef]
  10. Asadi, K. (Ed.) Woodhead Publishing Series in Electronic and Optical Materials; Organic Ferroelectric Materials and Applications; Woodhead Publishing: Duxford, UK, 2022. [Google Scholar]
  11. Furukawa, T. Ferroelectric properties of vinylidene fluoride copolymers. Phase Trans. 1989, 18, 143–211. [Google Scholar] [CrossRef]
  12. Nalwa, H.S. (Ed.) Ferroelectric Polymers; CRC Press: Boca Raton, FL, USA, 1995. [Google Scholar]
  13. Park, C.; Lee, K.; Koo, M.; Park, C. Soft Ferroelectrics Enabling High-Performance Intelligent Photo Electronics. Adv. Mater. 2020, 33, 2004999. [Google Scholar] [CrossRef]
  14. Horiuchi, S.; Tokura, Y. Organic ferroelectrics. Nat. Mater. 2008, 7, 357–366. [Google Scholar] [CrossRef] [PubMed]
  15. Tayi, A.S.; Kaeser, A.; Matsumoto, M.; Aida, T.; Stupp, S.I. Supramolecular ferroelectrics. Nat. Chem. 2015, 7, 281–294. [Google Scholar] [CrossRef] [PubMed]
  16. Harada, J. Plastic/ferroelectric molecular crystals: Ferroelectric performance in bulk polycrystalline forms. APL Mater. 2021, 9, 020901. [Google Scholar] [CrossRef]
  17. Zhang, W.; Xiong, R.G. Ferroelectric Metal-Organic Frameworks. Chem. Rev. 2012, 112, 1163–1195. [Google Scholar] [CrossRef]
  18. Liu, H.Y.; Zhang, H.Y.; Chen, X.G.; Xiong, R.G. Molecular Design Principles for Ferroelectrics: Ferroelectrochemistry. J. Am. Chem. Soc. 2020, 142, 15205–15218. [Google Scholar] [CrossRef]
  19. Akutagawa, T. Chemical Design and Physical Properties of Dynamic Molecular Assemblies. Bull. Chem. Soc. Jpn. 2021, 94, 1400–1420. [Google Scholar] [CrossRef]
  20. Horiuchi, S.; Ishibashi, S. Hydrogen-Bonded Small-Molecular Crystals Yielding Strong Ferroelectric and Antiferroelectric Polarizations. J. Phys. Soc. Jpn. 2020, 89, 051009. [Google Scholar] [CrossRef]
  21. Gilli, G.; Bertolasi, V.; Ferretti, V.; Gilli, P. Resonance-assisted hydrogen bonding. III. Formation of intermolecular hydrogen-bonded chains in crystals of β-diketone enols and its relevance to molecular association. Acta Crystallogr. Sect. B 1993, 49, 564–576. [Google Scholar] [CrossRef]
  22. Horiuchi, S.; Tokunaga, Y.; Giovannetti, G.; Picozzi, S.; Itoh, H.; Shimano, R.; Kumai, R.; Tokura, Y. Above-room-temperature ferroelectricity in a single-component molecular crystal. Nature 2010, 463, 789–792. [Google Scholar] [CrossRef]
  23. Horiuchi, S.; Kobayashi, K.; Kumai, R.; Ishibashi, S. Proton tautomerism for strong polarization switching. Nat. Commun. 2017, 8, 14426. [Google Scholar] [CrossRef]
  24. Horiuchi, S.; Kumai, R.; Ishibashi, S. Strong Polarization Switching with Low-Energy Loss in Hydrogen-Bonded Organic Antiferroelectrics. Chem. Sci. 2018, 9, 425–432. [Google Scholar] [CrossRef] [PubMed]
  25. Horiuchi, S.; Ishibashi, S. Large Polarization and Record-High Performance of Energy-Storage Induced by a Phase Change in Organic Molecular Crystals. Chem. Sci. 2021, 12, 14198–14206. [Google Scholar] [CrossRef]
  26. Sugawara, T.; Takasu, I. Tautomerism in the Solid State. Adv. Phys. Org. Chem. 1999, 32, 219–265. [Google Scholar]
  27. Hadjoudis, E.; Mavridis, I.M. Photochromism and thermochromism of Schiff bases in the solid state: Structural aspects. Chem. Soc. Rev. 2004, 33, 579–588. [Google Scholar] [CrossRef]
  28. Horiuchi, S.; Kumai, R.; Tokura, Y. Hydrogen Bonding Molecular Chains for High-Temperature Ferroelectricity. Adv. Mater. 2011, 23, 2098–2103. [Google Scholar] [CrossRef] [PubMed]
  29. Horiuchi, S.; Kagawa, F.; Hatahara, K.; Kobayashi, K.; Kumai, R.; Murakami, Y.; Tokura, Y. Above-room-temperature ferroelectricity and antiferroelectricity in benzimidazoles. Nat. Commun. 2012, 3, 1308. [Google Scholar] [CrossRef] [PubMed]
  30. Horiuchi, S.; Noda, Y.; Hasegawa, T.; Kagawa, F.; Ishibashi, S. Correlated proton transfer and ferroelectricity along alternating zwitterionic and nonzwitterionic anthranilic acid molecules. Chem. Mater. 2015, 27, 6193–6197. [Google Scholar] [CrossRef]
  31. Horiuchi, S.; Minemawari, H.; Ishibashi, S. Competition of Polar and Antipolar States Hidden Behind a Variety of Polarization Switching Modes in Hydrogen-Bonded Molecular Chains. Mater. Horiz. 2023, 10, 2149–2159. [Google Scholar] [CrossRef]
  32. Zou, Y.; Hong, S.; Park, M.; Chun, H.; Lah, M.S. Selective gas sorption property of an interdigitated 3-D metal–organic framework with 1-D channels. Chem. Commun. 2007, 5182–5184. [Google Scholar] [CrossRef]
  33. Saravanakumar, R.; Varghese, B.; Sankararaman, S. Hydrogen-bond network in isomeric phenylenedipropynoic acids and their DABCO salts. Water mediated helical hydrogen bond motifs. CrystEngComm 2009, 11, 337–346. [Google Scholar] [CrossRef]
  34. Hasegawa, T.; Inoue, S.; Tsuzuki, S.; Horiuchi, S.; Matsui, H.; Okada, T.; Kumai, R.; Yonekura, K.; Maki-Yonekura, S. Exploration and development of molecule-based printed electronics materials: An integrated approach using experimental, computational, and data sciences. Sci. Technol. Adv. Mater. 2024, 25, 2418282. [Google Scholar] [CrossRef]
  35. Xu, L.; Gu, L.-Y.; Zhao, D.-Y.; Wang, B.; Kang, T.-G. 5-(4-Chlorophenyl)-1H-tetrazole. Acta Crystallogr. Sect. E Struct. Rep. Online 2010, 66, o742. [Google Scholar] [CrossRef]
  36. Semmingsen, D.; Hollander, F.J.; Koetzle, T.F. A neutron diffraction study of squaric acid (3,4-dihydroxy-3-cyclobutene-1,2-dione). J. Chem. Phys. 1977, 66, 4405–4412. [Google Scholar] [CrossRef]
  37. Kobayashi, K.; Horiuchi, S.; Ishibashi, S.; Murakami, Y.; Kumai, R. Field-induced antipolar-polar structural transformation and giant electrostriction in organic crystal. J. Am. Chem. Soc. 2018, 140, 3842–3845. [Google Scholar] [CrossRef] [PubMed]
  38. Hu, D.-Y.; Chu, X.-W.; Qu, Z.-R. 5-p-Tolyl-1H-tetrazole. Acta Crystallogr. Sect. E Struct. Rep. Online 2009, 65, o2463. [Google Scholar] [CrossRef] [PubMed]
  39. Desiraju, G.R.; Murty, B.N.; Kishan, K.V.R. Unexpected Hydrogen Bonding in the Crystal Structure of (4-Chlorophenyl)propiolic Acid. Role of C–H···O Hydrogen Bonds in Determining O–H···O Networks. Chem. Mater. 1990, 2, 447–449. [Google Scholar] [CrossRef]
  40. Das, D.; Jetti, R.K.R.; Boese, R.; Desiraju, G.R. Stereoelectronic Effects on Substituent Groups in the Solid State. Crystal Chemistry of Some Cubanecarboxylic and Phenylpropiolic Acids. Cryst. Growth Des. 2003, 3, 675–681. [Google Scholar] [CrossRef]
  41. Duan, G.-Y.; Sun, Y.-W.; Liu, J.-Z.; Wang, J.-W. Bis(benzimidazol-2-yl)methane. Acta Crystallogr. Sect. E Struct. Rep. Online 2005, 61, o3476–o3477. [Google Scholar] [CrossRef]
  42. Horiuchi, S.; Ishibashi, S.; Haruki, R.; Kumai, R.; Inada, S.; Aoyagi, S. Metaelectric Multiphase Transitions in a Highly Polarizable Molecular Crystal. Chem. Sci. 2020, 11, 6183–6192. [Google Scholar] [CrossRef]
  43. Williams, D.E.; Rundle, R.E. Crystal Structure of 3,4-Furandicarboxylic Acid. J. Am. Chem. Soc. 1964, 86, 1660–1666. [Google Scholar] [CrossRef]
  44. Semmingsen, D.; Nordenson, S.; Aasen, A. The molecular and Crystal Structure of 3,4-Furandicarboxylic Acid. Acta Chem. Scand. A 1986, 40, 559–565. [Google Scholar] [CrossRef]
  45. Krygowski, T.M.; Cyranski, M. Separation of the energetic and geometric contributions to the aromaticity. Part IV. A general model for the π-electron systems. Tetrahedron 1996, 52, 10255–10264. [Google Scholar] [CrossRef]
  46. Bei, F.; Jian, F.; Yang, X.; Lu, L.; Wang, X.; Raj, S.S.S.; Fun, H.-K. 1,4-Bis(2-benzimidazolyl)benzene. Acta Crystallogr. Sect. C Cryst. Struct. Commun. 2000, 56, 718–719. [Google Scholar] [CrossRef] [PubMed]
  47. Horiuchi, S.; Ishibashi, S.; Inada, S.; Aoyagi, S. Hydrogen-Bonded Architectures and Field-Induced Polarization Switching in Bridged Bis(benzimidazole) Crystals. Cryst. Growth Des. 2019, 19, 328–335. [Google Scholar] [CrossRef]
  48. Haisa, M.; Kashino, S.; Hanada, S.I.; Tanaka, K.; Okazaki, S.; Shibagaki, M. The structures of 2-hydroxy-5-methylbenzoic acid and dimorphs of 2,5-dihydroxybenzoic acid. Acta Crystallogr. Sect. B 1982, 38, 1480–1485. [Google Scholar] [CrossRef]
  49. Shimoi, Y.; Tsuzuki, S.; Kumai, R.; Sotome, M.; Horiuchi, S. Competing Ferroelectric Polarization: Hydroxyl Flip-Flop versus Proton-Transfer Mechanisms. J. Mater. Chem. C 2022, 10, 10099–10105. [Google Scholar] [CrossRef]
  50. Dahlenburg, L.; Treffert, H.; Heinemann, F.W. 1,3-Bis(α-aminoisopropyl)benzene, meta-C6H4(CMe2NH2)2: An N,N-bridging and N,C,N-cyclometalating ligand. Inorg. Chim. Acta 2008, 361, 1311–1318. [Google Scholar] [CrossRef]
  51. Kopf, J.; Morf, M.; Zimmer, B.; Haupt, E.T.K.; Jarchow, O.; Koll, P. The crystal and molecular structure of threitol. Carbohydr. Res. 1993, 247, 119–128. [Google Scholar] [CrossRef]
  52. Kanters, J.A.; Roelofsen, G.; Smits, D. The crystal and molecular structure of DL-mannitol at −150 °C. Acta Crystallogr. Sect. B 1977, 33, 3635–3640. [Google Scholar] [CrossRef]
  53. Hua, C.; Li, X.G.; Xu, S.M. 2,2,6,6-Tetrakis(hydroxymethyl)cyclohexanol. Acta Crystallogr. Sect. E Struct. Rep. Online 2007, 63, o547–o548. [Google Scholar] [CrossRef]
  54. Gibadullina, E.M.; Kayupov, A.R.; Voronina, Y.K.; Syakaev, V.V.; Pudovik, M.A.; Burilov, A.R. Phosphorylation of oxyethylated resorcinol and calix[4]resorcinarene with P(III) acid amides. Phosphorus Sulfur Silicon Relat. Elem. 2018, 193, 787–795. [Google Scholar] [CrossRef]
  55. Semmingsen, D.; Feder, J. A structural phase transition in squaric acid. Solid State Commun. 1974, 15, 1369–1372. [Google Scholar] [CrossRef]
  56. Mochida, T.; Izuoka, A.; Sugawara, T.; Moritomo, Y.; Tokura, Y. Organic hydrogen-bonded dielectrics: Quantum paraelectricity based on tautomerization of 9-hydroxyphenalenone derivatives. J. Chem. Phys. 1994, 101, 7971–7974. [Google Scholar] [CrossRef]
  57. Abrahams, S.C.; Bair, H.E.; Haddon, R.C.; Stillinger, F.H.; Svenseon, C. Order–disorder phase transitions in 9-hydroxyphenalenone. J. Chem. Phys. 1981, 74, 644–646. [Google Scholar] [CrossRef]
  58. Mochida, T.; Izuoka, A.; Sugawara, T.; Moritomo, Y.; Tokura, Y. Dielectric relaxation derived from collective molecular reorientation of 9-hydroxyphenalenone in the solid state. J. Chem. Phys. 1994, 100, 6646–6648. [Google Scholar] [CrossRef]
  59. Mochida, T.; Suzuki, S.; Takasu, I.; Sugawara, T. Synthesis, crystal structure, and dielectric constants of 9-hydroxy-5-iodophenalen-1-one and its deuteroxy analogue. J. Phys. Chem. Solids 2003, 64, 1257–1260. [Google Scholar] [CrossRef]
  60. Kiyanagi, R.; Kojima, A.; Kimura, H.; Watanabe, M.; Noda, Y.; Mochida, T.; Sugawara, T. Phase Transition Scheme of Isolated Hydrogen-bonded Material h-MeHPLN Studied by Neutron and X-ray Diffraction. J. Phys. Soc. Jpn. 2005, 74, 613–620. [Google Scholar] [CrossRef]
  61. Matsuo, T.; Kohno, K.; Inaba, A.; Mochida, T.; Izuoka, A.; Sugawara, T. Calorimetric study of proton tunneling in solid 5-bromo-9-hydroxyphenalenone and deuteration-induced phase transitions in its deuteroxy analog. J. Chem. Phys. 1998, 108, 9809–9816. [Google Scholar] [CrossRef]
  62. Kiyanagi, R.; Kimura, H.; Watanabe, M.; Noda, Y.; Mochida, T.; Sugawara, T. Indication of Tunneling State of Hydrogen Atom in Hydrogen-Bonded Material 5-Bromo-9-hydroxyphenalenon Studied by X-ray and Neutron Diffractions. J. Phys. Soc. Jpn. 2008, 77, 064602. [Google Scholar] [CrossRef]
  63. Szafrański, M.; Czarnecki, P.; Katrusiak, A.; Habrylo, S. DTA Investigation of Phase Transitions in 1,3-Cyclohexanedione under High Pressures. Solid State Commun. 1992, 82, 277–281. [Google Scholar] [CrossRef]
  64. Szafrański, M.; Katrusiak, A.; McIntyre, G.J. Ferroelectric order of parallel bistable hydrogen bonds. Phys. Rev. Lett. 2002, 89, 215507. [Google Scholar] [CrossRef] [PubMed]
  65. Horiuchi, S.; Ishii, F.; Kumai, R.; Okimoto, Y.; Tachibana, H.; Nagaosa, N.; Tokura, Y. Ferroelectricity near room-temperature in co-crystals of nonpolar organic molecules. Nat. Mater. 2005, 4, 163–166. [Google Scholar] [CrossRef]
  66. Kumai, R.; Horiuchi, S.; Okimoto, Y.; Tokura, Y. Large Dielectric Susceptibility Associated with Proton Transfer in a Supramolecular Structure of Chloranilic Acid and 5,5’-Dimethyl-2,2’-Bipyridine. J. Chem. Phys. 2006, 125, 084715. [Google Scholar] [CrossRef] [PubMed]
  67. Kobayashi, K.; Horiuchi, S.; Ishibashi, S.; Kagawa, F.; Murakami, Y.; Kumai, R. Structure–property relationship of supramolecular ferroelectric 6,6’-dimethyl-2,2’-bipyridinium chloranilate accompanied by high polarization, competing structural phases, and polymorphs. Chem.–Eur. J. 2014, 20, 17515. [Google Scholar] [CrossRef]
  68. Hollander, F.J.; Semmingsen, D.; Koetzle, T.F. The molecular and crystal structure of squaric acid (3,4-dihydroxy-3-cyclobutene-1,2-dione) at 121 °C: A neutron diffraction study. J. Chem. Phys. 1977, 67, 4825–4831. [Google Scholar] [CrossRef]
  69. Maier, H.-D.; Müller, D.; Petersson, J. Temperature and Frequency Dependence of the Dielectric Constant and Proton NMR near the Structural Phase Transition of Squaric Acid. Phys. Status Solidi B 1978, 89, 587–593. [Google Scholar] [CrossRef]
  70. Bussmann-Holder, A.; Michel, K.H. Bond Geometry and Phase Transition Mechanism of H-Bonded Ferroelectrics. Phys. Rev. Lett. 1998, 80, 2173–2176. [Google Scholar] [CrossRef]
  71. Feder, J. Two dimensional ferroelectricity. Ferroelectrics 1976, 12, 71–83. [Google Scholar] [CrossRef]
  72. Moritomo, Y.; Tokura, Y.; Takahashi, H.; Mōri, N. Quantum paraelectricity and subsequent disappearance of bond alternation of molecule caused by proton dynamics in squaric acid crystal. Phys. Rev. Lett. 1991, 67, 2041–2044. [Google Scholar] [CrossRef]
  73. Dalal, N.; Klymachyov, A.; Bussmann-Holder, A. Coexistence of Order-Disorder and Displacive Features at the Phase Transitions in Hydrogen-Bonded Solids: Squaric Acid and its Analogs. Phys. Rev. Lett. 1998, 81, 5924–5927. [Google Scholar] [CrossRef]
  74. Palomar, J.; Klymachyov, A.N.; Panizian, D.; Dalal, N.S. Bisquaric Acid: Unusual Solid State NMR, Electronic Structure, and a Predicted Order−Disorder Transition. J. Phys. Chem. A 2001, 105, 8926–8930. [Google Scholar] [CrossRef]
  75. Takasu, I.; Sugawara, T.; Mochida, T. Dielectric Response in Bisquaric Acid Crystal: Possible Generation of Protonic Soliton in a Quasi-One-Dimensional Hydrogen-Bonded System. J. Phys. Chem. B 2004, 108, 18495–18499. [Google Scholar] [CrossRef]
  76. Hong, S.; Liow, C.H.; Yuk, J.M.; Byon, H.R.; Yang, Y.; Cho, E.; Yeom, J.; Park, G.; Kang, H.; Kim, S.; et al. Reducing Time to Discovery: Materials and Molecular Modeling, Imaging, Informatics, and Integration. ACS Nano 2021, 15, 3971–3995. [Google Scholar] [CrossRef] [PubMed]
  77. Spek, A.L. Single-crystal structure validation with the program PLATON. J. Appl. Cryst. 2003, 36, 7–13. [Google Scholar] [CrossRef]
  78. Abrahams, S.C. Structurally based prediction of ferroelectricity in inorganic materials with point group 6 mm. Acta Crystallogr. B 1988, 44, 585–595. [Google Scholar] [CrossRef]
  79. Abrahams, S.C. Systematic prediction of new ferroelectrics on the basis of structure. Ferroelectrics 2011, 104, 37–51. [Google Scholar] [CrossRef]
  80. Capillas, C.; Tasci, E.S.; de la Flor, G.; Orobengoa, D.; Perez-Mato, J.M.; Aroyo, M.I. A new computer tool at the Bilbao Crystallographic Server to detect and characterize pseudosymmetry. Z. Kristallogr. Cryst. Mater. 2011, 226, 186–196. [Google Scholar] [CrossRef]
  81. Ricci, F.; Reyes-Lillo, S.E.; Mack, S.A.; Neaton, J.B. Candidate ferroelectrics via ab initio high-throughput screening of polar materials. Npj Comp. Mater. 2024, 10, 15. [Google Scholar] [CrossRef]
  82. Thompson, S.Y.; Stokes, H.T.; Campbell, B.J.; Goldberg, E.D.; Evans, J.S.O. Exploitation of pseudo-symmetry in the Cambridge Structural Database for molecular ferroelectric discovery. CrystEngComm 2025. Advance Article. [Google Scholar] [CrossRef]
  83. Seyedraoufi, S.; Sødahl, E.D.; Görbitz, C.H.; Berland, K. Database mining and first-principles assessment of organic proton-transfer ferroelectrics. Phys. Rev. Mater. 2024, 8, 054413. [Google Scholar] [CrossRef]
  84. Tolédano, P.; Guennou, M. Theory of antiferroelectric phase transitions. Phys. Rev. B 2016, 94, 014107. [Google Scholar] [CrossRef]
  85. Marsh, R.E. The perils of Cc revisited. Acta Crystallogr. Sect. B 1997, 53, 317–322. [Google Scholar] [CrossRef]
  86. Taylor, R.; Wood, P.A. A Million Crystal Structures: The Whole Is Greater than the Sum of Its Parts. Chem. Rev. 2019, 119, 9427–9477. [Google Scholar] [CrossRef]
  87. Kurtz, S.K.; Perry, T.T. A powder technique for evaluation of nonlinear optical materials. J. Appl. Phys. 1968, 39, 3798–3813. [Google Scholar] [CrossRef]
  88. Sawada, R.; Uemura, H.; Sotome, M.; Yada, H.; Kida, N.; Iwano, K.; Shimoi, Y.; Horiuchi, S.; Okamoto, H. Large second-order optical nonlinearity in a ferroelectric molecular crystal of croconic acid with strong intermolecular hydrogen bonds. Appl. Phys. Lett. 2013, 102, 162901. [Google Scholar] [CrossRef]
  89. Sunami, K.; Horiuchi, S.; Ishibashi, S.; Tsutsumi, J. Unveiling High Electro-Optic Performance in a Proton–π-Electron-Coupled Ferroelectric Crystal. Adv. Electron. Mater. 2024, 2024, 2400346. [Google Scholar] [CrossRef]
  90. Szklarz, P.; Bator, G. Pyroelectric properties of tricyclohexylmethanol (TCHM) single crystal. J. Phys. Chem. Solids 2005, 66, 121–125. [Google Scholar] [CrossRef]
  91. Zelenovskii, P.S.; Vasileva, D.S.; Vasilev, S.G.; Kopyl, S.; Kholkin, A. Ferroelectricity in glycine: A mini-review. Front. Mater. 2022, 9, 918890. [Google Scholar] [CrossRef]
  92. Ishibashi, S.; Tamura, T.; Tanaka, S.; Kohyama, M.; Terakura, K. Ab Initio Calculations of Electric-Field-Induced Stress Profiles for Diamond/c−BN (110) Superlattices. Phys. Rev. B 2007, 76, 153310. [Google Scholar] [CrossRef]
  93. Available online: http://www.qmas.jp/ (accessed on 18 August 2025).
  94. Blöchl, P.E. Projector Augmented-Wave Method. Phys. Rev. B 1994, 50, 17953–17979. [Google Scholar] [CrossRef]
  95. Ceperley, D.M.; Alder, B.J. Ground State of the Electron Gas by a Stochastic Method. Phys. Rev. Lett. 1980, 45, 566–569. [Google Scholar] [CrossRef]
  96. Perdew, J.P.; Zunger, A. Self-interaction correction to density-functional approximations for many-electron systems. Phys. Rev. B 1981, 23, 5048–5079. [Google Scholar] [CrossRef]
  97. Perdew, J.P.; Burke, K.; Ernzerhof, M. Generalized Gradient Approximation Made Simple. Phys. Rev. Lett. 1996, 77, 3865–3868. [Google Scholar] [CrossRef]
  98. Dion, M.; Rydberg, H.; Schröder, E.; Langreth, D.C.; Lundqvist, B.I. Van der Waals Density Functional for General Geometries. Phys. Rev. Lett. 2004, 92, 246401. [Google Scholar] [CrossRef]
  99. King-Smith, R.D.; Vanderbilt, D. Theory of Polarization of Crystalline Solids. Phys. Rev. B 1993, 47, 1651–1654. [Google Scholar] [CrossRef] [PubMed]
  100. Resta, R. Macroscopic Polarization in Crystalline Dielectrics: The Geometric Phase Approach. Rev. Mod. Phys. 1994, 66, 899–915. [Google Scholar] [CrossRef]
  101. Spaldin, N.A. A beginner’s guide to the modern theory of polarization. J. Solid State Chem. 2012, 195, 2–10. [Google Scholar] [CrossRef]
  102. Ishibashi, S.; Terakura, K.J. Exotic Ferroelectricity in Tetrathiafulvalene-p-Chloranil: Anomalous Effective Charges and a Picture in the Framework of Maximally Localized Wannier Orbitals. J. Phys. Soc. Jpn. 2014, 83, 073702. [Google Scholar] [CrossRef]
  103. Terakura, K.; Ishibashi, S. Mechanism of covalency-induced electric polarization within the framework of maximally localized Wannier orbitals. Phys. Rev. B 2015, 91, 195120. [Google Scholar] [CrossRef]
  104. Horiuchi, S.; Kumai, R.; Ishibashi, S. Single-component organic molecular ferroelectrics based on disk- or wheel-like rotation. J. Mater. Chem. C 2021, 9, 13739–13747. [Google Scholar] [CrossRef]
  105. Ishibashi, S.; Horiuchi, S.; Kumai, R. Hydrogen-bonded single-component organic ferroelectrics revisited by van der Waals density-functional theory calculations. Phys. Rev. Mater. 2021, 5, 094409. [Google Scholar] [CrossRef]
  106. Berland, K.; Hyldgaard, P. Exchange functional that tests the robustness of the plasmon description of the van der Waals density functional. Phys. Rev. B 2014, 89, 035412. [Google Scholar] [CrossRef]
  107. Vydrov, O.A.; Van Voorhis, T. Nonlocal van der Waals density functional: The simpler the better. J. Chem. Phys. 2010, 133, 244103. [Google Scholar] [CrossRef]
  108. Sabatini, R.; Gorni, T.; de Gironcoli, S. Nonlocal van der Waals density functional made simple and efficient. Phys. Rev. B 2013, 87, 041108. [Google Scholar] [CrossRef]
  109. Saenger, W.; Betzel, C.; Hingerty, B.; Brown, G.M. Flip-flop hydrogen bonding in a partially disordered system. Nature 1982, 296, 581–583. [Google Scholar] [CrossRef]
  110. Chen, P.; Marianski, M.; Baldauf, C. H-Bond Isomerization in Crystalline Cellulose III: Proton Hopping versus Hydroxyl Flip-Flop. ACS Macro Lett. 2016, 5, 50–54. [Google Scholar] [CrossRef] [PubMed]
  111. Ishibashi, S.; Kumai, R.; Horiuchi, S. A straightforward method using the sign of the piezoelectric coefficient to identify the ferroelectric switching mechanism. Sci. Rep. 2023, 13, 8810. [Google Scholar] [CrossRef] [PubMed]
  112. Horiuchi, S.; Tsutsumi, J.; Kobayashi, K.; Kumai, R.; Ishibashi, S. Piezoelectricity of Strongly Polarized Ferroelectrics in Prototropic Organic Crystals. J. Mater. Chem. C 2018, 6, 4714–4719. [Google Scholar] [CrossRef]
  113. Liu, S.; Chen, R.E. Origin of Negative Longitudinal Piezoelectric Effect. Phys. Rev. Lett. 2017, 119, 207601. [Google Scholar] [CrossRef]
  114. You, L.; Zhang, Y.; Zhou, S.; Chaturvedi, A.; Morris, S.A.; Liu, F.; Chang, L.; Ichinose, D.; Funakubo, H.; Hu, W.; et al. Origin of giant negative piezoelectricity in a layered van der Waals ferroelectric. Sci. Adv. 2019, 5, eaav3780. [Google Scholar] [CrossRef]
  115. Ghosh, P.S.; Lisenkov, S.; Ponomareva, I. Negative longitudinal piezoelectricity coexisting with both negative and positive transverse piezoelectricity in a hybrid formate perovskite. ACS Appl. Mater. Interfaces 2022, 14, 46449–46456. [Google Scholar] [CrossRef]
  116. Furukawa, T.; Wen, J.X. Electrostriction and Piezoelectricity in Ferroelectric Polymers. Jpn. J. Appl. Phys. 1984, 23, L677–L679. [Google Scholar] [CrossRef]
  117. Katsoureas, I.; Asadi, K.; Li, M.; Van Dreil, T.B.; Kjaer, K.S.; Zhao, D.; Lenz, T.; Gu, Y.; Blom, P.W.M.; Damjanovic, D.; et al. The negative piezoelectric effect of the ferroelectric polymer poly(vinylidene fluoride). Nat. Commun. 2016, 15, 78–84. [Google Scholar] [CrossRef]
  118. Liu, Y.; Wang, Q. Ferroelectric Polymers Exhibiting Negative Longitudinal Piezoelectric Coefficient: Progress and Prospects. Adv. Sci. 2020, 7, 1902468. [Google Scholar] [CrossRef]
  119. Liu, S.; Cui, Z.; Fu, P.; Liu, M.; Zhang, Y.; Jia, R.; Zhao, Q. Piezoelectricity and ferroelectricity in odd-odd nylons with long alkane segments. Appl. Phys. Lett. 2014, 104, 172906. [Google Scholar]
  120. Urbanaviciute, I.; Meng, X.; Biler, M.; Wei, Y.; Cornelissen, T.D.; Bhattacharjee, S.; Linares, M.; Kemerink, M. Negative piezoelectric effect in an organic supramolecular ferroelectric. Mater. Horiz. 2019, 6, 1688–1698. [Google Scholar] [CrossRef]
  121. Lu, H.; Kim, D.-J.; Aramberri, H.; Holzer, M.; Buragohain, P.; Dutta, S.; Schroeder, U.; Deshpande, V.; Íñiguez, J.; Gruverman, A.; et al. Electrically induced cancellation and inversion of piezoelectricity in ferroelectric Hf0.5Zr0.5O2. Nature Commun. 2024, 15, 860. [Google Scholar] [CrossRef]
  122. Dutta, S.; Buragohain, P.; Glinsek, S.; Richter, C.; Aramberri, H.; Lu, H.; Schroeder, U.; Defay, E.; Gruverman, A.; Íñiguez, J. Piezoelectricity in hafnia. Nat. Commun. 2021, 12, 7301. [Google Scholar] [CrossRef]
  123. Qi, Y.; Reyes-Lillo, S.E.; Rabe, K.M. Sign of the piezoelectric response in double-rath ferroelectrics. Phys. Rev. B 2025, 111, L180101. [Google Scholar] [CrossRef]
  124. Ishii, F.; Nagaosa, N.; Tokura, Y.; Terakura, K. Covalent ferroelectricity in hydrogen-bonded organic molecular systems. Phys. Rev. B 2006, 73, 212105. [Google Scholar] [CrossRef]
  125. Ishibashi, S.; Horiuchi, S.; Kumai, R. Computational finding of metastable ferroelectric phases of squaric acid. Phys. Rev. B 2018, 97, 184102, Erratum in: Phys. Rev. B 2023, 108, 059903. [Google Scholar] [CrossRef]
  126. Moina, A.P. Polarization rotation by external electric field in the two-dimensional antiferroelectric squaric acid H2C4O4. Phys. Rev. B 2021, 103, 214104. [Google Scholar] [CrossRef]
  127. Moina, A.P. Negative/positive electrocaloric effect in antiferroelectric squaric acid. J. Appl. Phys. 2023, 133, 094101. [Google Scholar] [CrossRef]
  128. Grünebohm, A.; Ma, Y.-.B.; Marathe, M.; Xu, B.-X.; Able, K.; Kalcher, C.; Meyer, K.-C.; Shvartsman, V.V.; Lupascu, D.C.; Ederer, C. Origins of the Inverse Electrocaloric Effect. Energy Technol. 2018, 6, 1491–1511. [Google Scholar] [CrossRef]
  129. Wang, G.; Lu, Z.; Li, Y.; Li, L.; Ji, H.; Feteira, A.; Zhou, D.; Wang, D.; Zhang, S.; Reaney, I.M. Electroceramics for High-Energy Density Capacitors: Current Status and Future Perspectives. Chem. Rev. 2021, 121, 6124–6172. [Google Scholar] [CrossRef]
  130. Liu, Z.; Lu, T.; Ye, J.; Wang, G.; Dong, X.; Withers, R.; Liu, Y. Antiferroelectrics for Energy Storage Applications: A Review. Adv. Mater. Technol. 2018, 3, 1800111. [Google Scholar] [CrossRef]
  131. Yang, L.; Kong, X.; Li, F.; Hao, H.; Cheng, Z.; Liu, H.; Li, J.F.; Zhang, S. Perovskite lead-free dielectrics for energy storage applications. Prog. Mater. Sci. 2019, 102, 72–108. [Google Scholar] [CrossRef]
  132. Hao, X.; Zhai, J.; Kong, L.B.; Xu, Z. A comprehensive review on the progress of lead zirconate-based antiferroelectric materials. Prog. Mater. Sci. 2014, 63, 1–57. [Google Scholar] [CrossRef]
  133. Yan, F.; Qian, J.; Wang, S.; Zhai, J. Progress and outlook on lead-free ceramics for energy storage applications. Nano Energy 2024, 123, 109394. [Google Scholar] [CrossRef]
  134. Park, M.H.; Hwang, C.S. Fluorite-structure antiferroelectrics. Rep. Prog. Phys. 2019, 82, 124502. [Google Scholar] [CrossRef]
  135. Berlincourt, D. Transducers using forced transition between ferroelectric and antiferroelectric states. IEEE Trans. Sonics Ultrason. 1966, 13, 116–124. [Google Scholar] [CrossRef]
  136. Uchino, K. Antiferroelectric Shape Memory Ceramics. Actuators 2016, 5, 11. [Google Scholar] [CrossRef]
  137. Narayan, B.; Malhotra, J.S.; Pandey, R.; Yaddanapudi, K.; Nukala, P.; Dkhil, B.; Senyshyn, A.; Ranjan, R. Electrostrain in excess of 1% in polycrystalline piezoelectrics. Nat. Mater. 2018, 17, 427–431. [Google Scholar] [CrossRef]
  138. Park, S.; Shrout, T.R. Ultrahigh Strain and piezoelectric behavior in relaxor based ferroelectric single crystals. J. Appl. Phys. 1997, 82, 1804–1811. [Google Scholar] [CrossRef]
  139. Zhuo, F.; Li, Q.; Zhou, Y.; Ji, Y.; Yan, Q.; Zhang, Y.; Xi, X.; Chu, X.; Cao, W. Large field-induced strain, giant strain memory effect, and high thermal stability energy storage in (Pb,La)(Zr,Sn,Ti)O3 antiferroelectric single crystal. Acta Mater. 2018, 148, 28–37. [Google Scholar] [CrossRef]
  140. Pan, H.; Zhu, M.; Banyas, E.; Alaerts, L.; Acharya, M.; Zhang, H.; Kim, J.; Chen, X.; Huang, X.; Xu, M.; et al. Clamping enables enhabnces electromechanical responses in antiferroelectric thin films. Nat. Mater. 2024, 23, 944–950. [Google Scholar] [CrossRef]
  141. Piezoelectric Materials Data Book; Ferroperm Ltd.: Kvistgard, Denmark, 1996.
  142. Lasave, J.; Koval, S.; Dalal, N.S.; Migoni, R.L. Origin of Antiferroelectricity in NH4H2PO4 from First Principles. Phys. Rev. Lett. 2007, 98, 267601. [Google Scholar] [CrossRef]
  143. Moriwake, H.; Konishi, A.; Ogawa, T.; Fisher, C.A.J.; Kuwabara, A.; Fu, D. The electric field induced ferroelectric phase transition of AgNbO3. J. Appl. Phys. 2016, 119, 064102. [Google Scholar] [CrossRef]
  144. Li, P.F.; Liao, W.Q.; Tang, Y.Y.; Ye, H.Y.; Zhang, Y.; Xiong, R.G. Unprecedented Ferroelectric–Antiferroelectric–Paraelectric Phase Transitions Discovered in an Organic–Inorganic Hybrid Perovskite. J. Am. Chem. Soc. 2017, 139, 8752–8757. [Google Scholar] [CrossRef]
  145. Wu, Z.; Liu, X.; Ji, C.; Li, L.; Wang, S.; Peng, Y.; Tao, K.; Sun, Z.; Hong, M.; Luo, J. Discovery of an Above-Room-Temperature Antiferroelectric in Two-Dimensional Hybrid Perovskite. J. Am. Chem. Soc. 2019, 141, 3812–3816. [Google Scholar] [CrossRef]
  146. Liu, Y.; Ma, Y.; Zeng, X.; Xu, H.; Guo, W.; Wang, B.; Hua, L.; Tang, L.; Luo, J.; Sun, Z. A high-temperature double perovskite molecule-based antiferroelectric with excellent anti-breakdown capacity for energy storage. Nat. Commun. 2023, 14, 2420. [Google Scholar] [CrossRef]
  147. Kagawa, F.; Horiuchi, S.; Minami, N.; Ishibashi, S.; Kobayashi, K.; Kumai, R.; Murakami, Y.; Tokura, Y. Polarization switching ability dependent on multidomain topology in a uniaxial organic ferroelectric. Nano Lett. 2014, 14, 239–243. [Google Scholar] [CrossRef] [PubMed]
Figure 1. Systematic illustrations of ion-displacement-type dielectrics undergoing structural changes among the polar, antipolar, and nonpolar crystal forms, with the corresponding polarization (P)-electric field (E) hysteresis curves. P1, P2: sublattice polarizations; sw: switching; FE: ferroelectric; AFE: antiferroelectric; PE: paraelectric; T (or temp.): temperature.
Crystals 15 00736 g001
Figure 2. Chemical structures of hydrogen-bonded organic dielectrics. (a) Single-component compounds, including some candidates (ferroelectric compounds are marked with asterisks). (b) Binary-component compounds. (Box) Representative chemical schemes for polarization switching.
Crystals 15 00736 g002
Figure 3. Hydrogen-bonded molecules and their 1-D or 2-D sequences with local (sublattice) polarizations P1 (open arrows) and possible orientations of total polarizations P (dotted arrows). The nearly isotropic disk shape of 9HPLN in the space-filling drawing facilitates the flip-flop molecular rotation for polarization switching. The parenthesis after the materials’ abbreviations denotes the proton-transfer (PT) or flip-flop (FF) switching mode, ferroelectricity (F) or antiferroelectricity (A), and 2-D orientation of P, if applicable. The molecules were drawn using the crystallographic visualization software Mercury, produced by the Cambridge Crystallographic Data Centre (CCDC).
Crystals 15 00736 g003
Figure 4. Antiferroelectric squaric acid (SQA) crystal. (a) Crystal photograph. (b) Temperature-dependent dielectric permittivity measured using E||atetra and E||[110]tetra, with the configurations being parallel to the hydrogen-bonded sheets. (c) Order–disorder phase transition at 373 K, turning on/off the antiparallel sublattice polarizations, P1 and P2 (open arrows). The original data were partially published in Ref. [24] by the Royal Society of Chemistry (2017).
Crystals 15 00736 g004
Figure 5. Microscopic structural models of hydrogen-bonded molecular crystals undergoing structural changes between the ferroelectric (FE), antiferroelectric (AFE), and paraelectric forms through the proton-transfer (PT) mode. Small and large block arrows indicate the orientations of sublattice polarizations Pi and spontaneous polarization Ps, respectively.
Crystals 15 00736 g005
Figure 6. Hydrogen-bonding geometric effects on the two switching modes. (a) Schematic drawing for the structural origin of opposite signs of the longitudinal piezoelectric constant, explained by the change in double potential wells for PT (left) and FF (right) before (upper) and after the contraction of the hydrogen-bonded chain (lower). (b) Changes in the coercive field Ec at dE/dt = 500 kV/cm s for DHBA and the OH···O bonded PT-type ferroelectrics. The blue line is a guide for the eye. The red, filled circles with arrows indicate the changes in Ec by deuterating the hydrogen bonds. Both switching modes are prohibited for ferroelectric candidates NPTL, LTTL, MNTL, and THMCHO, with dOO (purple arrows) ranging in the intermediate regime, as shaded in the figure.
Crystals 15 00736 g006
Figure 7. Comparison of experimental and simulated parameters for hydrogen-bonded dielectrics. (a) Spontaneous polarizations of ferroelectrics Ps. (b) Switchable sublattice polarizations |ΔP|. (c) Direct piezoelectric coefficients d33. (d) Converse piezoelectric coefficients d33. The theoretical polarizations and d33 were obtained based on GGA-PBE and vdW-DF-cx (or rVV10), respectively. The insets indicate the strain (x)–electric field (E) hysteresis curves of CRCA (upper) and DHBA (lower). The original data were partially published in Refs. [23,25].
Crystals 15 00736 g007
Figure 8. Switching schemes and theoretical spontaneous polarizations of PT and FF modes in (a) DHBA (Form I) and (b) Hdabco-ReO4 salt.
Crystals 15 00736 g008
Figure 9. Energy storage properties measured from the electric polarization (P) versus electric field (E) hysteresis experiments. (a) Experimental results of antiferroelectric FDC (γ) (left) and SQA crystals with E||[ 1 _ 02 ] and E||atetra configurations (right), respectively. (b) Schematic illustrations for ferroelectrics and paraelectrics. (c) Comparisons of efficiency and recoverable energy density for various organic phase change dielectrics. The original data were partially published in Ref. [25] by the Royal Society of Chemistry (2021).
Crystals 15 00736 g009
Figure 10. Molecular arrangements and field-induced phase changes in bis(benzimidazole) crystals. Ladder-like NH···N hydrogen-bonded molecular sequences of (a) BI2P molecules with H-disorder and (b) polar and antipolar BI2C molecules, which can be transformed into each other using intermolecular proton transfer. (c,d) PE hysteresis loops (top) and their corresponding displacement current densities (bottom) measured at room temperature with the applied triangular waveform voltage. (c) BI2P crystal with E||c configuration (parallel to the ladder). (d) Sublimed BI2C(s) crystal (phase II) with an f = 100 Hz and E||[101]tetra configuration. The arrows indicate the fields of multiple switching. The original data were partially published in Refs. [42,47] by the Royal Society of Chemistry (2020) and the American Chemical Society (2018).
Crystals 15 00736 g010
Figure 11. Multiple phases and their inter-relations for the BI2C crystal. (a) Schematic three-dimensional arrangements of ladders A (green tapes) and B (blue hatched tapes) in the thermally induced phases I, II, and III, as well as the electrically induced versions, IV and V. The small brown arrows indicate the polarity of each ladder B. Long green and short yellow arrows represent the directions of external electric fields and polarizations, respectively. (b) The group–subgroup inter-relationship of crystal symmetries between the phase II and III structures. (c) Electrically induced mesoscopic schemes changing the phase II multidomain structure into a phase IV–V mixture as the plausible cause of double-step polarization switching. (d) The displacement current density obtained from the corresponding PE hysteresis loops of a deuterated BI2C-d2 crystal (91%D) with an f = 100 Hz and E||[101]tetra configuration at various temperatures. The field-induced switching changes from single- to double-step mode in response to the phase III–II transition. The original data were partially published in Ref. [42] by the Royal Society of Chemistry (2020).
Crystals 15 00736 g011
Figure 12. Amphoteric behaviors of 2-phenylmalondialdehyde (PhMDA). (a) Hydrogen-bonded polar molecular sequence (top) and b-axis projection of the crystal structure (bottom). (b) Anisotropic behaviors of PE hysteresis loops at room temperature and their corresponding switching schematics for changes in sublattice polarizations P1 and P2 and total polarization (large open arrows). The original data were partially published in Ref. [25] by the Royal Society of Chemistry (2021).
Crystals 15 00736 g012
Figure 13. Structural models of possible field-induced switching mechanisms in an SQA crystal based on sheet-type sublattice polarizations. Open straight arrows represent the directions of sublattice polarizations P1 and P2 and total polarization P. The original data were partially published in Ref. [25], published by the Royal Society of Chemistry (2021).
Crystals 15 00736 g013
Figure 14. Electromechanical properties of antiferroelectrics. (a) Schematics of longitudinal electromechanical strain for piezoelectricity, electrostriction, and AFE–FE transition. (bd) Electric polarization (P) versus electric field (E) hysteresis curve (top), the corresponding E-dependent displacement current density (J) (middle), and the simultaneous electromechanical strain (bottom) for (b) SQA, (c) H55dmbp-Hca, and (d) CPPLA. The direction and frequency of the applied field are given in the panel.
Crystals 15 00736 g014
Figure 15. Field effect polymorphism of 2-trifluoromethynaphthimidazole (TFMNI) at room temperature with the E||c’ configuration parallel to the hydrogen-bonded chains. (a) The polarization hysteresis with various ac frequencies. (b) The DC field-induced changes Δl/l for various lattice constants l in the monoclinic (AFE form) setting for the polymorph. (c) Changes in hydrogen ordering (small orange circles), chain polarizations (open arrows), and crystal symmetry from the AFE form with E = 0 (upper) to the field-induced FE form (lower). (d) Shear-type deformation of the unit cell. (e) Sliding of the zigzag corrugated sheets, causing a large strain. The original data were partially published in Ref. [37] by the American Chemical Society (2018).
Crystals 15 00736 g015
Figure 16. Classification of ferroelectrics (F), antiferroelectrics (A), and their hybrid (F/A and A/A) states. (a) Schematic illustrations of the hydrogen order/disorder, PE hysteresis, mesoscopic picture, and energy diagram. Dots and crosses in circles on the crystal surfaces denote the forward and backward polarizations, respectively, of the hydrogen bonded chains. Open arrows represent the direction of spontaneous polarization. (b) Energy histogram of candidate H-ordered states relative to each FE (or FE-I) form. Filled and open circles represent the non-degenerate and nearly degenerate ground states, respectively. The figure was partially adapted from Ref. [31], published by the Royal Society of Chemistry (2023).
Crystals 15 00736 g016
Figure 17. Schematic arrangements of switchable dipole moments (arrowheads) in the candidate ferroelectric and antiferroelectric structural forms of (a) MPHTZ and (b) PHTZ crystals. Blue dots and red crosses in circles denote the forward and backward polarizations, respectively, of the hydrogen bonded chains. Open rectangles define the a-axis projection of the (a, b, c) axes of the fundamental orthorhombic (Pbca or Ama2) structure. The polar PHTZ crystal has a non-switchable polarization component pointing in the c direction, but the corresponding presentation is omitted for clarity in the panel (b). The top of each panel denotes the new space group and required transformation (if necessary) into the new unit cell (red dotted squares). The figure was adapted from Ref. [31], published by the Royal Society of Chemistry (2023).
Crystals 15 00736 g017
Figure 18. Data mining and screening flowcharts for exploration of polarization switchable dielectrics of hydrogen-bonded molecular crystals. The mark # represents the warning feedback that the crystal structural symmetry should be carefully re-examined, as it conflicts with other observations.
Crystals 15 00736 g018
Figure 19. PDPLA crystal. (a) Molecular arrangement and hydrogen bonds (orange lines) viewed along the a direction. (b) Polarization hysteresis properties with the E||c configuration at 362 K. (c) Molecular arrangement viewed along the b direction. (d) Schematic arrangements of switchable dipole moments (arrowheads) in hypothetical AFE structural forms. The open black rectangles define the [201] direction projection of the (a, b, c) axes of the fundamental monoclinic structure, whereas the dotted rectangles represent the lattice-transformed (a’, b’, c’) axes, respectively. Blue dots and red crosses in circles denote the forward and backward polarizations, respectively, of the hydrogen bonded chains. (e) Energy histogram of candidate H-ordered states relative to the most stable FE form.
Crystals 15 00736 g019
Figure 20. DHIB crystal. (a) Molecular arrangement viewed along the a direction. The light-blue circles specify the disordered hydrogen locations. (b) Polarization hysteresis properties for the E||c configuration at room temperature. (c) Schematic arrangements of switchable dipole moments (arrowheads) in candidate FE and AFE structural forms. The black, open rectangles and the blue, dotted ones define the c-axis projection of the (a, b, c) axes of the fundamental monoclinic structure and of the lattice-transformed (a’, b’, c’) axes, respectively. Blue dots and red crosses in circles denote the forward and backward polarizations, respectively, of the hydrogen bonded chains. The relative energy, as well as the new space group and required lattice transformation (if necessary) into the new unit cell, are given at the bottom of each panel.
Crystals 15 00736 g020
Table 1. Classifications (or temporal ones in parenthesis), experimental (or theoretical in parenthesis) polarization switching properties |Ps| and |ΔP| with measured crystal orientations, powder SHG efficiencies relative to urea, proper {or pseudo-symmetric} crystal space groups, pseudo elements of symmetry, CSD reference codes and references of the structural datasets, hydrogen-bonded lengths dOO and dNN, coercive fields Ec, the average and difference switching (sw.) fields (EFA and ΔEFA, respectively) between the forward and backward sw. fields (EF and EA, respectively) {measured at frequency f}, and minimum FE-AFE energy separation ΔU of hydrogen bonded single-component organic ferroelectric, antiferroelectrics, and candidate dielectric crystals.
CompoundClassPolarization (μC/cm2)SHG a (×urea)Space Gr@RT b Proper {psd-sym}Pseudo-Symmetry ElementsCSD RefcodeRefs.Hydrogen Bondsw. Field (kV/cm) dΔU (meV/molecule) e
|Ps||ΔP|AxisdOO (Å)dNN (Å)Ec cEFAEFA) {f (Hz)}
Proton-transfer type
CRCAF30 (29.4) c47 ± 13Pca21 {Pcam}−1, mGUMMUW[22,23]2.62–2.63 16.0/39.3
CBDCF13.2 (15.1) [ 10 1 _ ]0.23Cc {C2/c}−1, 2CBUDCX[23,28]2.63–2.64 14.3
PhMDAF9 (9.0)5.8 (6.1)c; a17.2Pna21 {Pnab}−1, bPROLON[25,28]2.60 11.5/27.2110 (59) {100}0.79
HPLNF5.6 (5.2) a1.4Pn {P21/n}−1, 21TAPZIT[28]2.55–2.59 6.7
MBIF7.4 (7.1) atetra0.14Pn {P42/n}−1, 42KOWYEA[29] 2.86–2.9715.4
DCMBIF10 (10.0) c0.56Pca21 {Pcam}−1, mREZBOP[29] 2.98
ALAAF3.6 (4.2) c-Iba2 {Ibca}−1, aANPHPR[23] 2.9726
ATAF5.6 (5.97) a0.25P21cn {Pccn}−1, cAMBACO[30]2.542.87
APHTZF7.0 (7.5) a0.09Pn {P21/n}−1, 21CITVIL[31,32] 2.90–2.9134.4
PDPLAF9 (8.8) [201]0.28Pc {P2/c}−1, 2HOQMEG[33,34]2.63–2.67
CPHTZF/A (9.2)[101]NDP2/c (*) KUSLUG[31,35] 2.89
FPHTZF/A (7.9)a0.01P21/n (*) VIHLUX[31] 2.91
SQAA 17.2 (16.4)atetraNDP21/m {I4/m}I, 4KECYBU[24,25,36]2.55 166 (6) {50}1.27
TFMBIA 7.8 (8.0)cNDP21/c {Pbcm}b, mZAQRIU[29] 2.87 13 (8) {0.2}
DFMBIA 8.0 (10.0)cNDP21/c {Pbcm}b, mREZBIJ[29] 2.85 67 (12) {2}
TCMBIA 7.0 (7.0)a2.4P21 {Pmc21} #c, mREZBAB[29] 2.80–2.81 49 (22) {10}
TFMNIA 4.8 (7.8)[101]NDP21/n {Cmce}C, m, 2NIBCAF[37] 2.97 24 (11) {100}1.01
MPHTZA 8.2 (8.8)aNDPbca {Pbcm}T, mQUCJII[31,38] 2.80 88 (24) {100}1.78
CPPLAA 4.3 (4.8)bNDP-1 {1/2c}T, −1SUHSET[25,39,40]2.61–2.65 55 {100}0.19
BI2CA 4.1 (4.6)atetraNDP21/c {I41/a}I, 41XAVFEG[41,42] 2.77–2.85 75 (32) {100}
FDC (γ)A 15.1 (13.6)[ 1 _ 02 ]NDP-1 {1/2a; P21/c}T, dFURDCB[25]2.54–2.65 62 (40) {50}0.62
FDC (α)(A) (13.7)b-P21/c {1/2c; P21/m}T, mFURDCB[25,43,44]2.54–2.65 2.98
PHTZA/A 6.9 (8.1)a-Ama2 (*) # TOSJOA[31,45] 2.83 65 (21) {100}0.96
BI2PF/A (8.8)c0.02Pccn (*) AWEHAL[46,47] 2.86 31 (8) {300}
Hydrogen flip-flop type
DHBAF5.2 (5.0) a0.02Pc {P21/c}−1, 21BESKAL[48,49]2.77 17.1/20.5
DHIBF/A (4.6)cNDP2/c (*) SIXNAP[34,50]2.90–2.91 24 (26) {100}
NPTL(F)ND c0.09Cc {C2/c}−1, 2NAPHOB[49]2.74 >180
LTTL(F)ND c0.01P32 {P3212}2, 2LEDPUF[34,51]2.68–2.73 >100
MNTL(F)ND c0.07Pna21 {Pnam}−1, mDLMANT[34,52]2.67–2.72 >360
THMCHO(F)ND c0.01Pna21 {Pnam}−1, mYEYLUK[34,53]2.72–2.83 >300
BHEOB(A/A) >1cNDC2/c (*) XAHBOB[34,54]2.75–2.83 >130
a ND = not detected. b # Polar crystal symmetry due to non-switchable dipole moment; (*) hydrogen disordered paraelectric structure. c Extrapolated values at dE/dt = 500 kV/cm s at room temperature. Italic Ec values are obtained on the corresponding deuterated crystal. d EFA = (EF + EA)/2; ΔEFA = EFEA. e † Minimum energy difference between FE-I and II phases.
Disclaimer/Publisher’s Note: The statements, opinions and data contained in all publications are solely those of the individual author(s) and contributor(s) and not of MDPI and/or the editor(s). MDPI and/or the editor(s) disclaim responsibility for any injury to people or property resulting from any ideas, methods, instructions or products referred to in the content.