Article

Molecular Dynamics Simulations on the Deformation Behaviors and Mechanical Properties of the γ/γ′ Superalloy with Different Phase Volume Fractions

1
School of Electronic and Information Engineering, Anshun University, Anshun 561000, China
2
Guizhou Province Higher Education Schools Integrated Tacking Large Platform, Anshun University, Anshun 561000, China
3
College of Materials and Metallurgy, Guizhou University, Guiyang 550025, China
*
Author to whom correspondence should be addressed.
Crystals 2025, 15(8), 706; https://doi.org/10.3390/cryst15080706 (registering DOI)
Submission received: 26 June 2025 / Revised: 26 July 2025 / Accepted: 30 July 2025 / Published: 31 July 2025
(This article belongs to the Special Issue Advances in High-Performance Alloys)

Abstract

Based on molecular dynamics simulation, we conducted a comprehensive study on the tensile behaviors and properties of the γ (Ni)/ γ (Ni3Al) superalloy with varying γ (Ni3Al) phase volume fractions ( V γ ) under high-temperature, high-strain-rate service environments. Our investigation revealed that the tensile behavior of the superalloy depends critically on the V γ . When the V γ increased from 13.5 to 67%, the system’s tensile strength exhibited a non-monotonic response, peaking at V γ = 40.3% before progressively decreasing. Conversely, the maximum uniform plastic strain decreased linearly and significantly when V γ increased. These results establish an atomistically informed framework that elucidates the composition–microstructure–property relationships in γ (Ni)/ γ (Ni3Al) superalloys, specifically addressing how V γ governs variations in deformation mechanisms and mechanical performance. Furthermore, this work provides quantitative design paradigm for optimizing γ (Ni3Al) precipitate architecture and compositional tuning in the Ni-based γ (Ni)/ γ (Ni3Al) superalloy.

1. Introduction

The γ (Ni)/ γ (Ni3Al) superalloy is a type of metal/intermetallic material, which consists of lamellar γ (Ni) and γ ( N i 3 A l ) phases. The presence of the γ phase significantly enhances the strength and the creep resistance of the superalloy at an elevated temperature [1,2]. The γ phase is embedded coherently in the matrix γ phase with a small lattice misfit (with (001) coherent phase interface) [3]. Owing to its outstanding characteristics—including corrosion resistance, oxidation resistance, and high strength—superalloys find extensive use in high-temperature and other demanding environments. Key applications encompass critical components such as aircraft engine turbine blades, disks and oil slinger drum shafts [4,5,6].
Significant effort has been made to study the effects of the relative content of the γ and γ phase on the deformation and fracture behaviors of the γ / γ superalloy [7]. According to Lapin et al. [8], alterations in microstructural characteristics—including lamellae volume fraction, dimensions, morphology, and distribution of γ phases—exerted a profound effect on tensile properties, specifically yield strength and elongation. Wu et al. [9] prepared an Ni3Al-based superalloy with low V γ , and further found that its creep resistance was poor. Pope et al. [10] studied the mechanical properties of the Ni3Al-based alloy with high V γ and found that the flow stress of the system had unusual temperature dependence. Kawagara et al. [11] reported that the volume fraction of the primary Ni3Al precipitate was an important factor affecting the hardness of two-phase intermetallic materials based on the first-principle calculation method. Wang et al. [12] calculated the elastic properties of the Ni-based superalloy with different contents of the Ni3Al phase; the results indicated that the elastic properties increased with the Ni3Al phase content.
In the field of superalloys theoretical investigation, the tensile behaviors of the γ / γ superalloy are often studied using the molecular dynamics (MD) simulation method. During tensile deformation, this method enables real-time visualization of atomic trajectories and the corresponding microstructure evolution [13,14,15]. Yashiroa et al. [16] investigated edge dislocation interactions with rectangular Ni3Al precipitates in Ni matrices, revealing dislocation pinning at γ phases and subsequent bowing-out within γ channels. Subsequent investigations [17,18] further examined the stabilization mechanisms of misfit dislocation networks across diverse γ / γ phase interfaces in Ni-based superalloys. Li et al. [19] and Chen et al. [20] analyzed shock-induced deformation mechanisms and microstructural evolution in γ / γ phase systems. Qin et al. [21] investigated the effects of loading conditions, temperature, and strain rate on the deformation and fracture behaviors of the γ / γ superalloy, and found that the service conditions obviously affected the tensile behaviors and properties.
Nevertheless, the influences of V γ on tensile responses, mechanical characteristics, and associated microscopic mechanisms in γ / γ superalloys require further elucidation, especially under high-temperature/high-strain-rate service conditions. This investigation utilizes the MD method to examine the effects of V γ on deformation characteristics, underlying mechanisms, and resultant mechanical properties in dual-phase γ / γ superalloys. We quantified the tensile strength and maximum uniform plastic strain of the dual-phase system, elucidating microscopic deformation mechanisms through analysis of microstructural evolution, dislocation configurations, strain localization, and local lattice misorientation. Our findings revealed the micromechanism of the tensile process of the γ / γ superalloy with various V γ values under high-temperature and high-strain-rate conditions. This insight provided a theoretical foundation for understanding the variances in mechanical properties among γ / γ superalloy with various V γ values and offered a basis for the compositional and microstructural design of these superalloys.

2. Materials and Methods

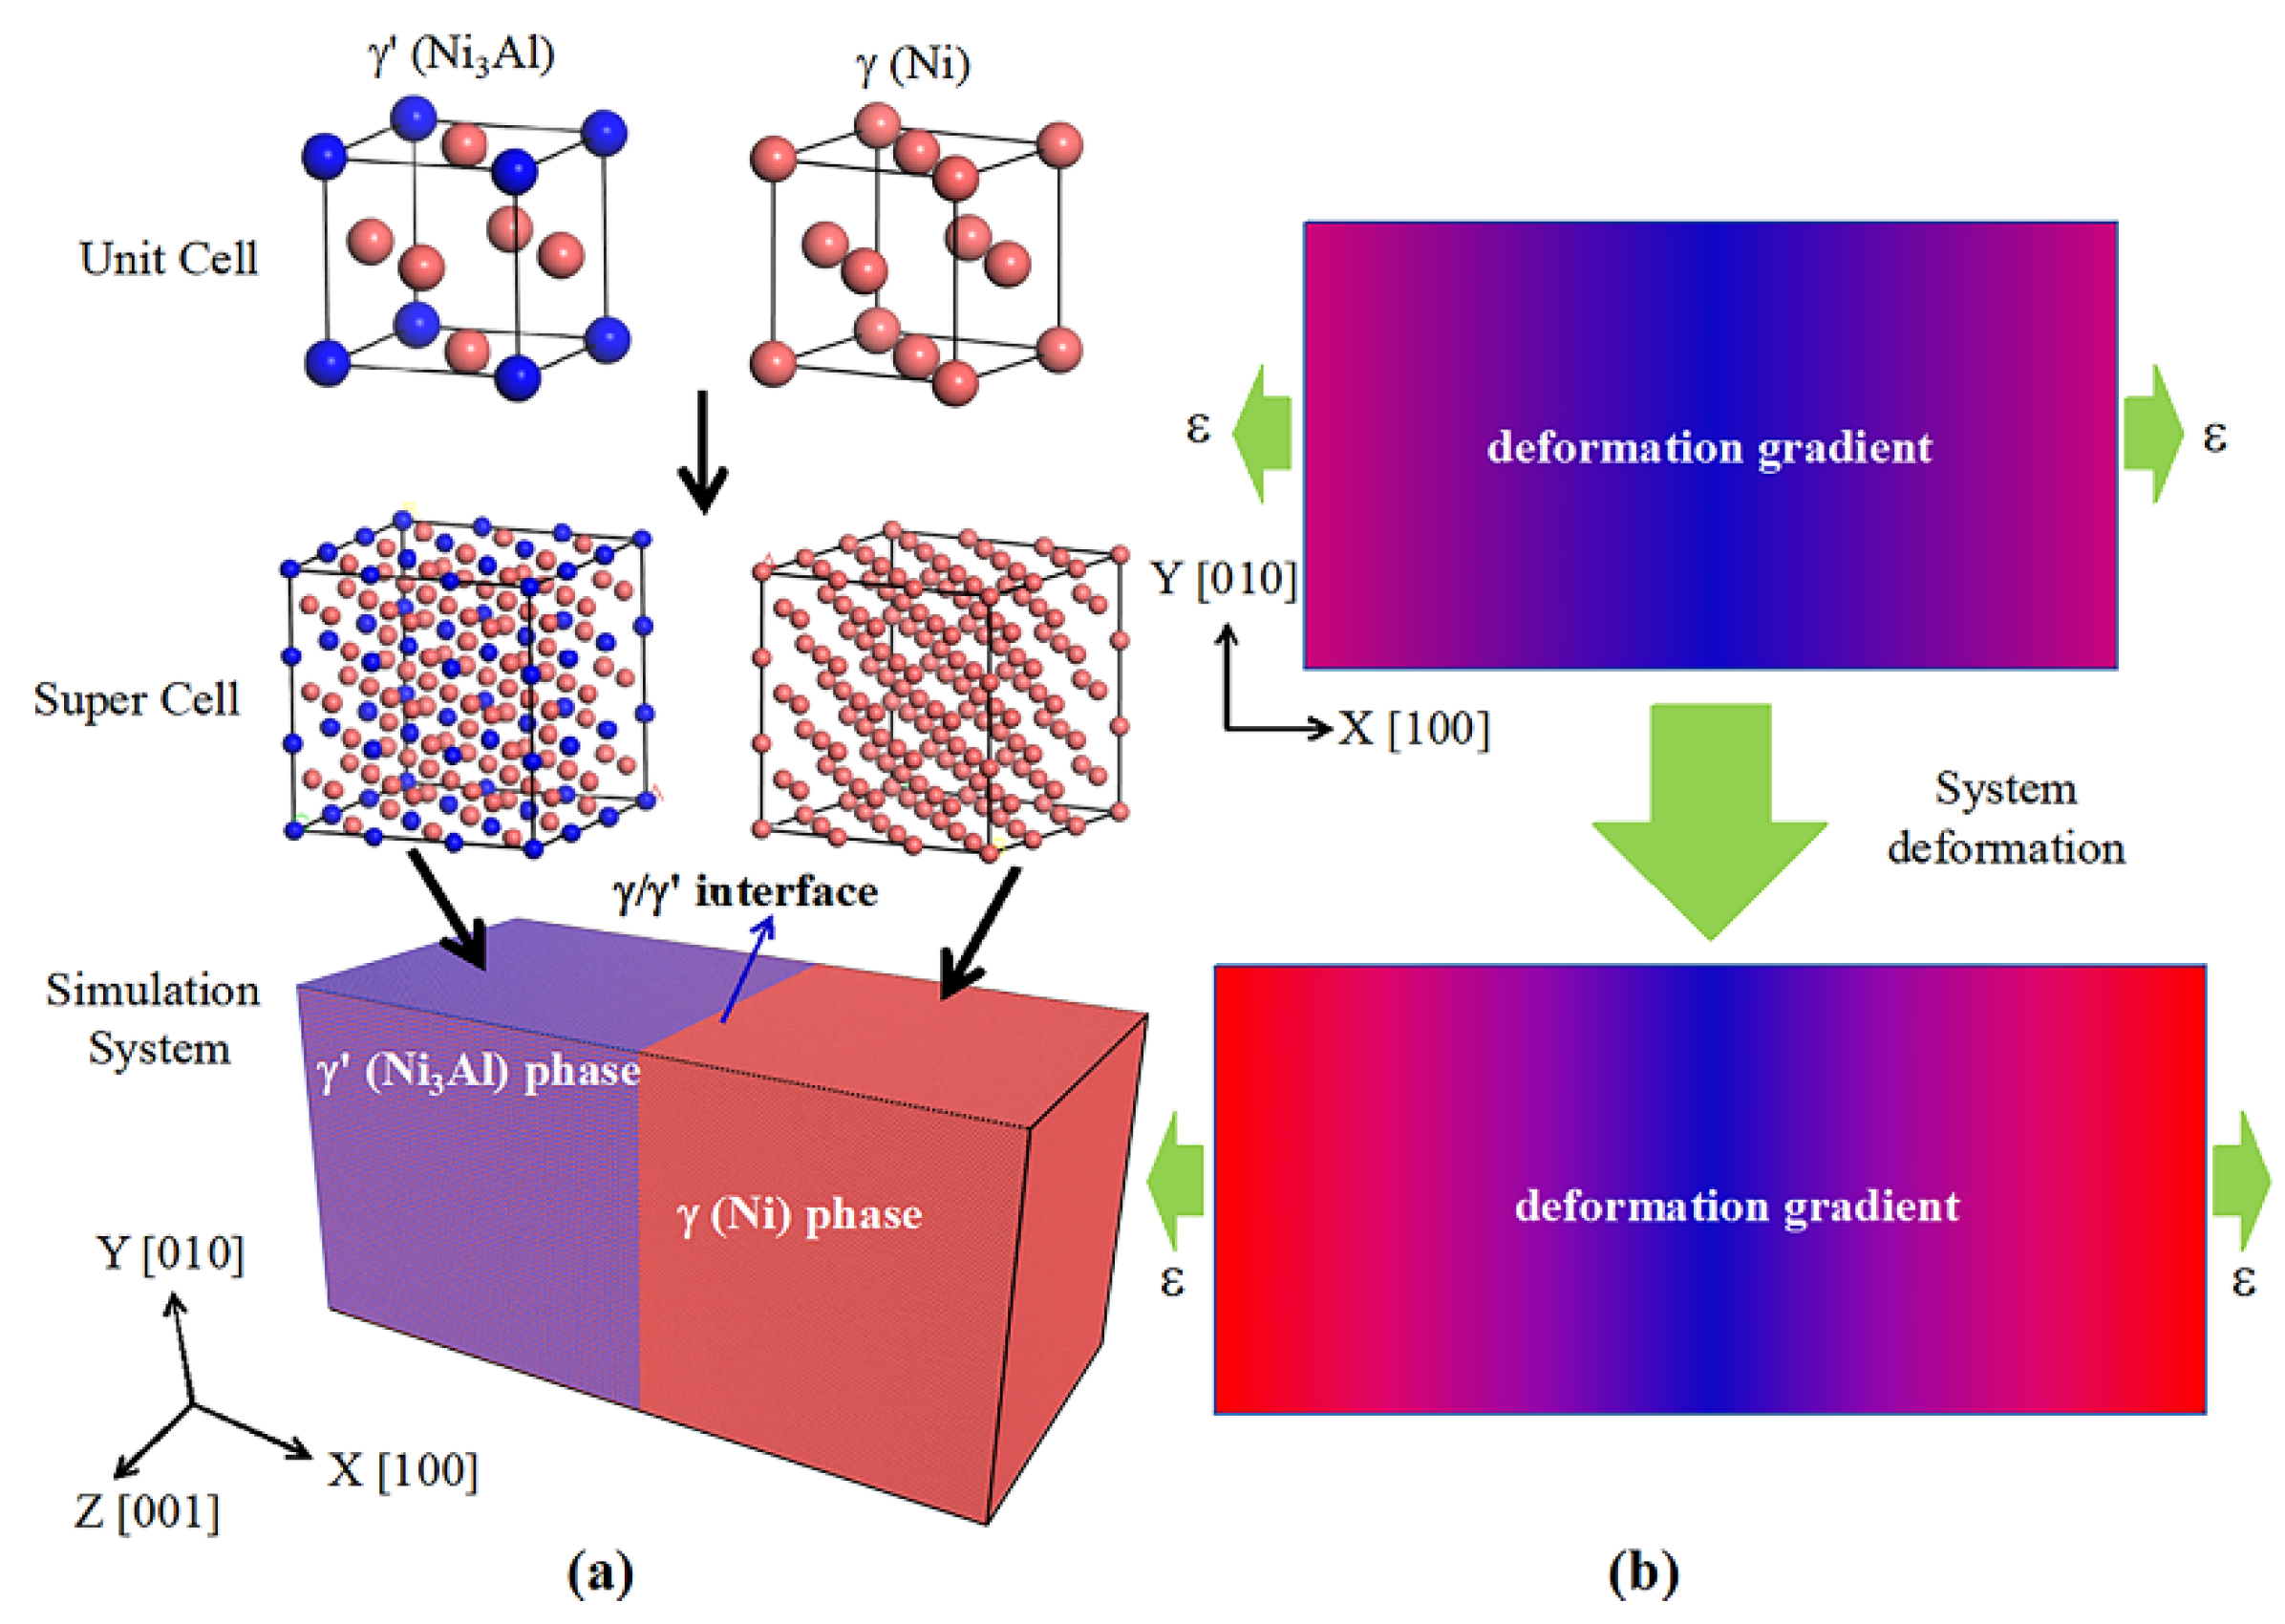
2.1. Materials and Models

The superalloy studied in this paper is composed of γ (Ni) and γ (Ni3Al) phases, with the volume fraction of the γ phase being 13.5, 26.9, 40.3, 53.7, and 67%, respectively. The corresponding atomic percentages and weight percentages of Ni and Al atoms are listed in Table 1. The lattice constant ( a γ and a γ ) of the γ and γ phase was 0.3524 nm and 0.3573 nm, respectively. The γ / γ interfaces were oriented on the (100) plane, with orthogonal axes X, Y, Z aligned along [100], [010], and [001] directions, respectively (Figure 1a). To reduce misfit stresses from γ / γ lattice mismatch, the model’s dimensions in Y/Z directions satisfied, where ( n + 1 ) a γ n a γ (n = 72).

2.2. Simulation Method

In this study, the Large-scale Atomic/Molecular Massively Parallel Simulator (LAMMPS_32Jun2022) [22] software was used to investigate the tensile behaviors and mechanical properties of the γ (Ni)/ γ (Ni3Al) superalloy. During tension, three-dimensional periodic boundary conditions were imposed on the system. The system underwent 100 ps relaxation using an NPT ensemble at 900 K and 0 bar. Uniaxial tensile loading was then applied along the X-direction (Figure 1b) at a strain rate of 1 × 10⁹ s−1 (equivalent to 0.01 ps−1) under the NVT ensemble. Triplicate simulations were performed for each configuration to ensure result reproducibility.

2.3. Atomic Interactions

This study employed the eam/fs [23] and eam/alloy [24] potentials to describe Ni-Ni and Ni-Al atomic interactions, respectively. These potentials have been extensively validated for modeling deformation mechanisms and mechanical properties in the γ (Ni)/ γ (Ni3Al) superalloy [20,25,26]. The general EAM formulation for both potentials is as follows:
E i = F α ( j i ρ β ( r i j ) ) + 1 2 · j i α β ( r i j ) ,
where E i : total system energy;
F α : embedding energy functional;
ρ β ( r i j ) : atomic electron density;
α β ( r i j ) : pair potential interactions;
α : the element types of atoms i and j.

2.4. Microstructure and Strain Distribution Analysis Method

To characterize system deformation responses, microstructural evolution was analyzed using polyhedral template matching (PTM) [27] and dislocation extraction algorithms (DXA) of the Open Visualization Tool (OVITO, 3.0.0-dev293) [28,29]. We also characterized the local lattice misorientation of the system at various strain conditions according to the PTM tool. Atomic-level strain tensors were computed for individual atoms based on neighbor displacement vectors using the atomic strain modifier [30,31]. This computational approach enables quantification of local atomic strain distributions, thereby establishing their direct correlation with system-wide mechanical responses during deformation.

3. Results and Analysis

3.1. The Stress–Strain Responses and Associated Mechanical Properties

Figure 2 exhibits the system’s stress–strain response and the relevant tensile properties. To characterize the superalloy’s uniform plastic deformation capacity, the maximum uniform plastic strain (hereafter referred to as ε m u p s ) was analyzed. And the ε m u p s is defined as the true strain corresponding to the intersection point of the strain-hardening rate curve and the true stress–strain curve. (Figure 2b).
From Figure 2a, it was evident that, for these superalloys with different V γ , there were notable differences in their tensile strength ( σ b ). During the deformation, the γ / γ superalloy experienced three distinct deformation stages: elastic deformation stage, plastic deformation stage (as illustrated by the differently colored shaded regions of Figure 2). Before the 1% tensile strain, the deformation system underwent only recoverable elastic deformation (the gray-shaded area). Then, the system subsequently transitioned to the plastic deformation stage. This stage was characterized by two distinct yielding processes. During the ensuing deformation process, the system’s tensile stress remained relatively constant, leading to a distinct yield platform (the blue-shaded region). As the V γ increased, we observed a notable reduction in the length of the yield plateau (indicated by the blue-shaded region). This decline persisted until the V γ exceeded 53.7%, at which point only a singular yield point was evident. The primary reason of this observation was the difference in the microstructure evolution for the deformation system with different V γ . Once the tensile stress reached its tensile strength ( σ b ), the local regions of the deformation system first formed nanopores or nanocracks. As the applied tensile deformation continued, nanopores or nanocracks gradually propagated, leading to a significant decrease in tensile stress until the deformation system ultimately fractured.
Figure 2b illustrates the true stress–strain curves (solid line) and strain-hardening rate–strain curves (short dot line) of these deformation systems. The shaded circular symbol represents the intersection point of the strain-hardening rate curve and the true stress–strain curve, which corresponds to the onset of plastic instability [32]. The true strain corresponding to this intersection point defines the maximum uniform plastic strain ( ε m u p s ) of the deformation system, whose magnitude directly characterizes the deformation system’s maximum uniform plastic deformation capability. Analysis reveals that for V γ of 13.5%, 26.9%, 40.3%, 53.7%, and 67%, the ε m u p s values are 20.78%, 19.23%, 17.48%, 15.01%, and 11.78%, respectively. As V γ increases, the maximum uniform plastic deformation capability of the system progressively diminishes.
Figure 2c shows maximum tensile stress (engineering stress and true stress) and maximum uniform plastic strain ( ε s t r ) of the γ / γ superalloys for various V γ . As the V γ increased, the maximum tensile stress (tensile strength) initially ascended, reached its peak at a V γ of 40.3%, and subsequently declined. Conversely, there was a monotonic decrease in the maximum uniform plastic strain ( ε m u p s ) of the γ / γ superalloys.

3.2. The Microstructure Evolution Analysis

Figure 3 illustrates the γ / γ superalloys’ microstructure evolution. At an elevated temperature, the volume fraction of the γ phase significantly influenced the initial microstructure of the γ / γ superalloys before tensile deformation. Compared with Figure 3(a1,b1,c1), we observed that the stacking faults, which resulted from the lattice mismatch of two phases (the γ and γ phase), predominantly formed in the γ phase, when the γ / γ superalloys displayed a lower V γ (13.5%). Conversely, for higher V γ (from 40.3 to 67%), we observed the stacking faults in the γ phase. During tension, the deformation process consisted of three main stages: elastic deformation, uniform plastic deformation, and non-uniform plastic deformation. When the engineering strain ( ε ) was less than 1%, only elastic deformation occurred in these systems. This resulted in a slight increase in the equilibrium distance between atoms without altering the system’s microstructure. When the engineering strain exceeded 1%, the system transitioned into the uniform plastic deformation stage, characterized primarily by the stacking faults evolution and the phase transformation of local atoms from a Face-Centered Cubic (FCC) structure to the Body-Centered Cubic (BCC) and the Hexagonal Close-Packed (HCP) structures. The deformation behaviors of the γ / γ superalloys were associated with the volume fraction of the γ phase. Once the engineering tensile stress reached its tensile strength ( σ b ), the deformation system entered the non-uniform plastic deformation stage.
For the γ / γ superalloy with a V γ of 13.5% (Figure 3(a1–a6)), during initial isothermal–isobaric relaxation (NPT ensemble relaxation) of the system before deformation, the γ phase was the primary phase responsible for coordination deformation despite it having a higher tensile strength and elastic modulus than the γ phase. Consequently, stacking faults occurred only in the γ phase of the γ / γ superalloy. In the uniform plastic deformation stage, the density of stacking faults in the γ phase decreased until it vanished entirely because of the gradual transformation of stacking faults. In addition, only the phase transformation from FCC → mixed BCC/HCP structure occurred in the γ phase of this system. When engineering tensile stress reached the system’s tensile strength ( σ b ), the significant difference in coordination deformation ability between the mixed BCC/HCP structure of the γ phase and γ phase led to a stress concentration at the γ / γ phase interface of the superalloy. This resulted in the formation of nanopores, as indicated by the magenta oval-shaded area in Figure 3(a5).
As the V γ increased to 40.3% (Figure 3(b1–b6)), the main phase responsible for the system’s coordination deformation shifted to the γ phase during isothermal–isobaric relaxation. Consequently, we observed stacking faults exclusively in the γ phase of the γ / γ superalloys (Figure 3(b1)). In the uniform plastic deformation process, the γ phase predominantly underwent plastic deformation, whereas the γ phase experienced only elastic deformation. The plastic deformation of γ phase was characterized by the phase transformation from FCC → mixed BCC/HCP structure and the slow decomposition of the stacking faults (Figure 3(b3)). Therefore, the stress concentrations rose at the intersected area between the γ / γ phase interface and stacking faults (Figure 3(b5)), which resulted in the nanopores formed in this area. When the V γ reached 67%, the deformation behavior of the system remained essentially consistent with γ / γ superalloys with V γ = 40.3% (Figure 3(c1–c6)).
Subsequently, the nanopores experienced continuous growth and coalescence with each other until the deformation system fractured fully (Figure 3(a6,b6,c6)), wherein the principal deformation mechanism entailed the transformation of the FCC → other structure (represented by white atoms).

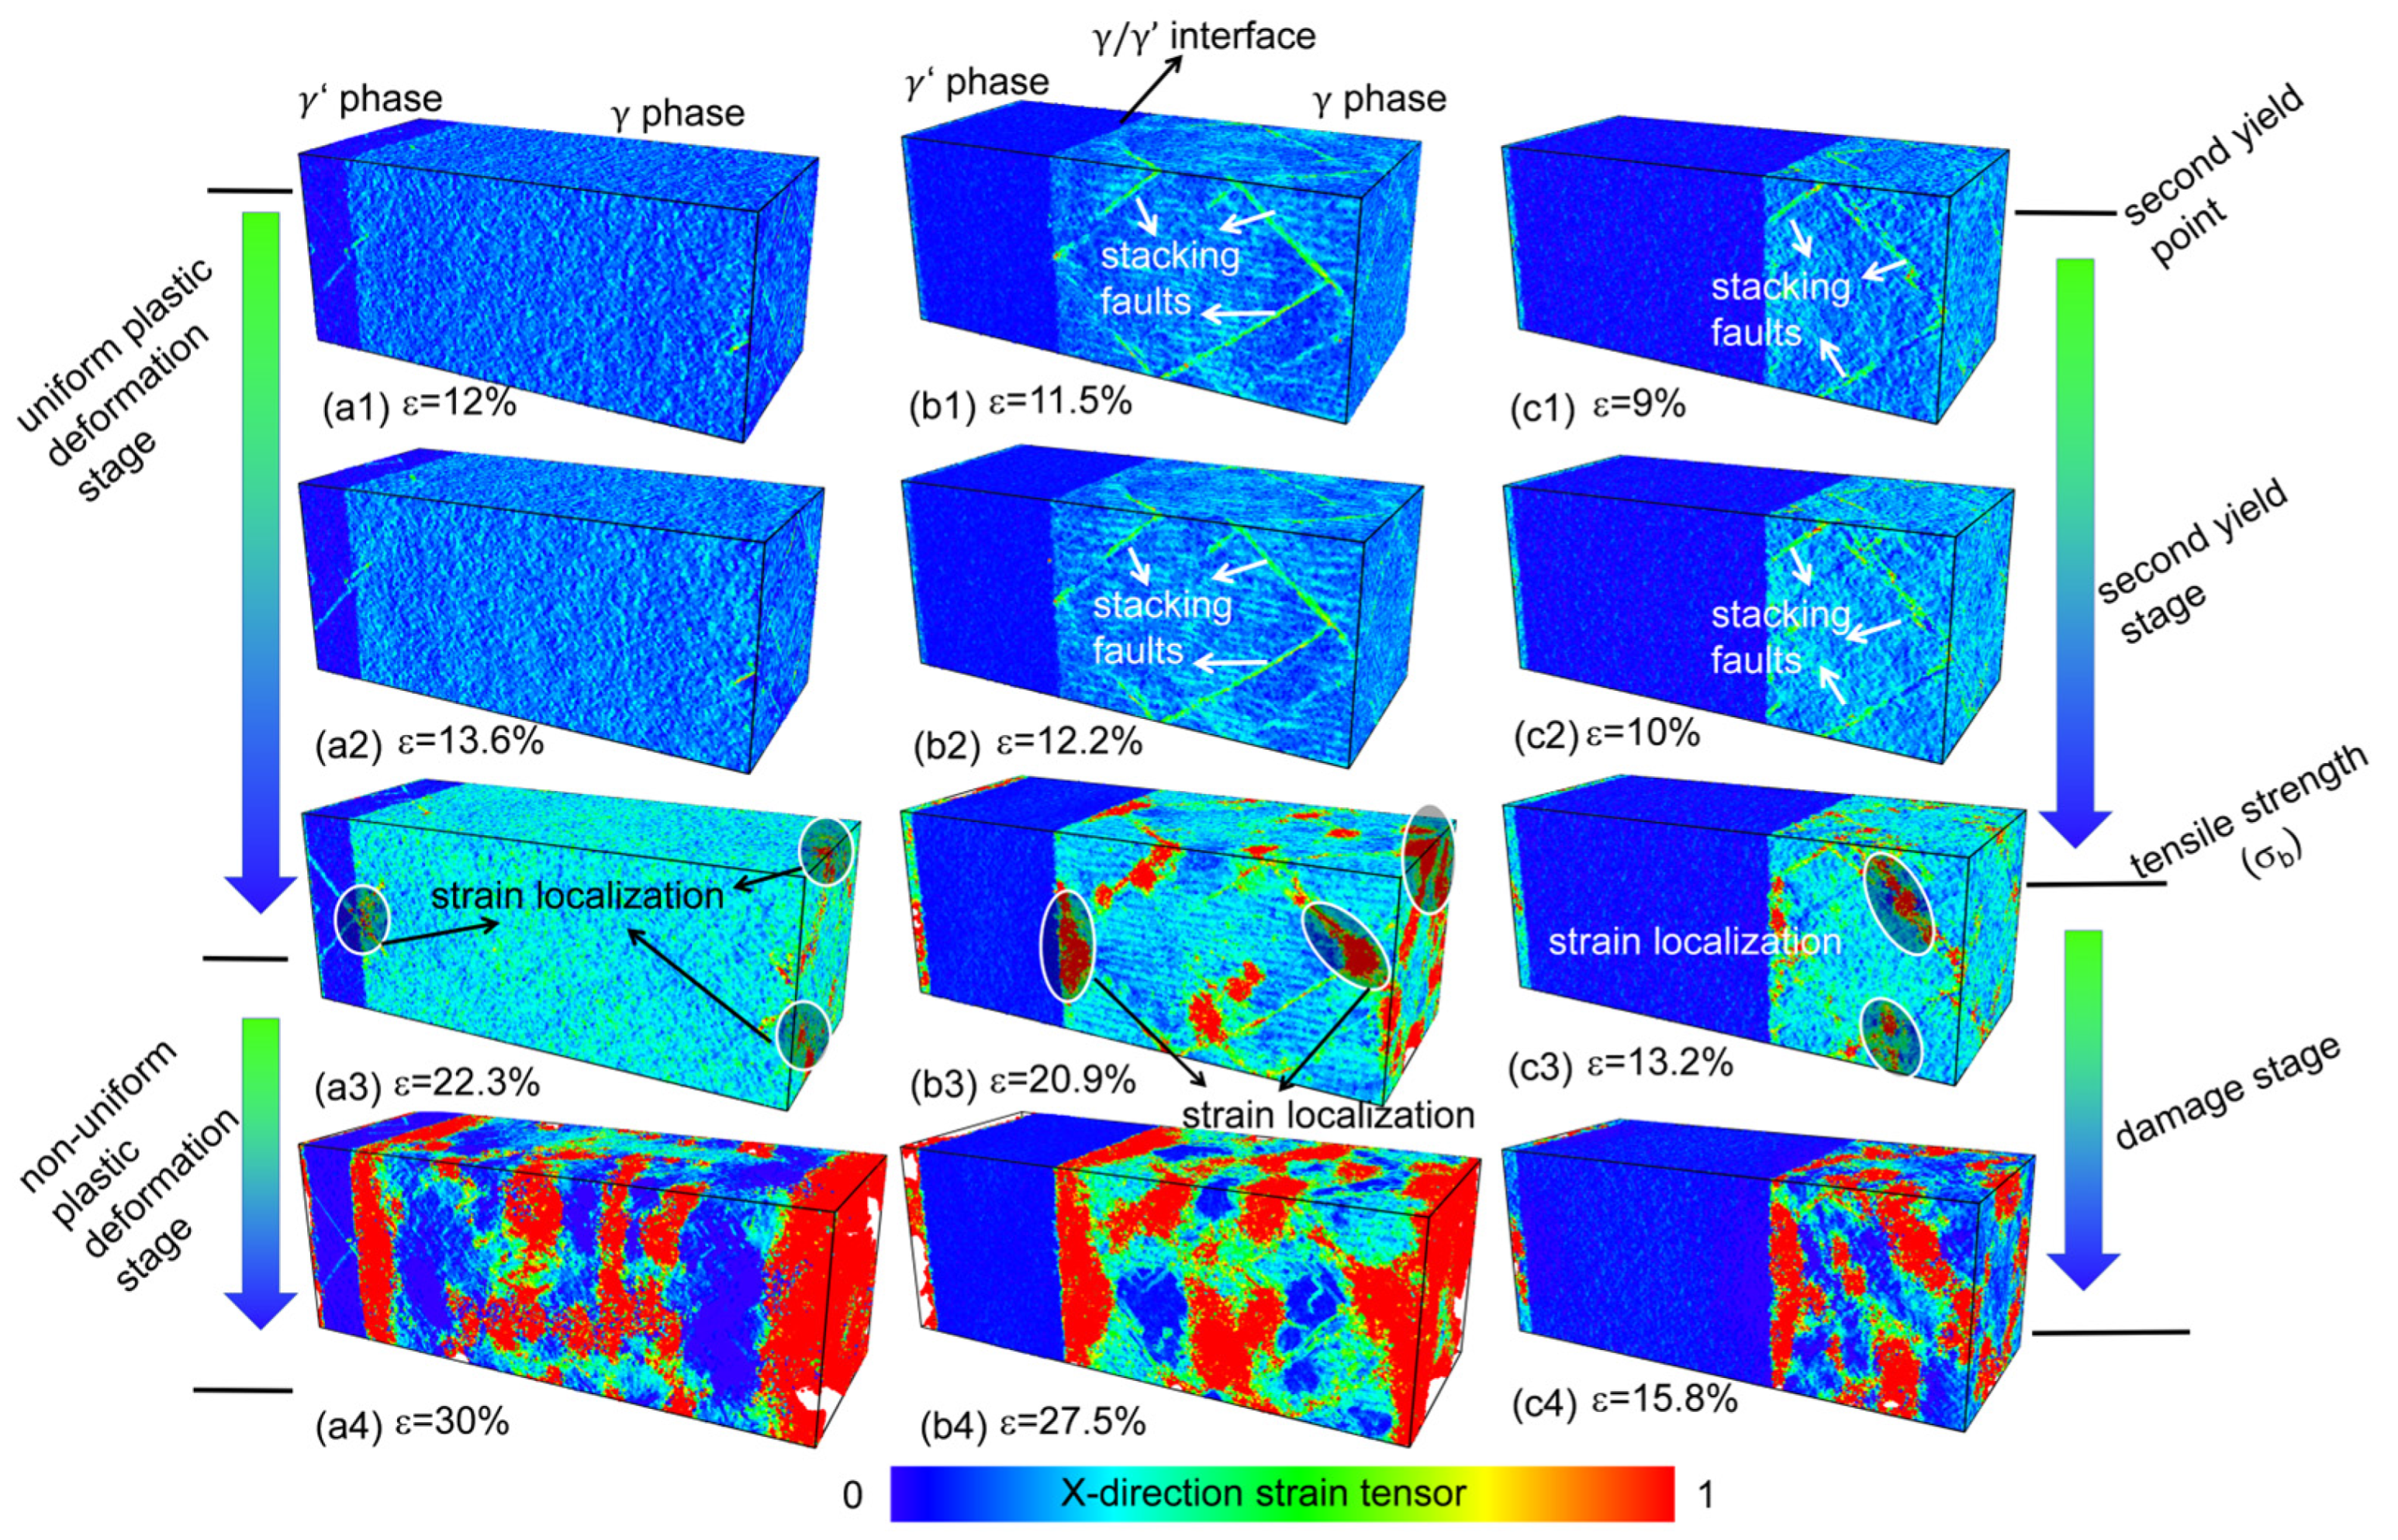
3.3. The Atomic Strain Distribution Analysis

Figure 4 shows the atomic strain distributions of the γ / γ superalloys with different V γ . During the uniform plastic deformation stage, for the γ / γ superalloy with a low V γ (Figure 4(a1–a4)), the atomic strain was almost uniformly distributed within the γ phase. In contrast, for the γ / γ superalloy with a high V γ (Figure 4(b1–b4,c1–c4)), the atomic strain was localized at the intersecting region between the stacking faults and phase transformation of the local atoms. Once the engineering tensile stress moved up to the tensile strength, the atomic strain was considerably localized at the local region of the γ phase (the white oval-shaded area in Figure 4(a3,b3,c3)).

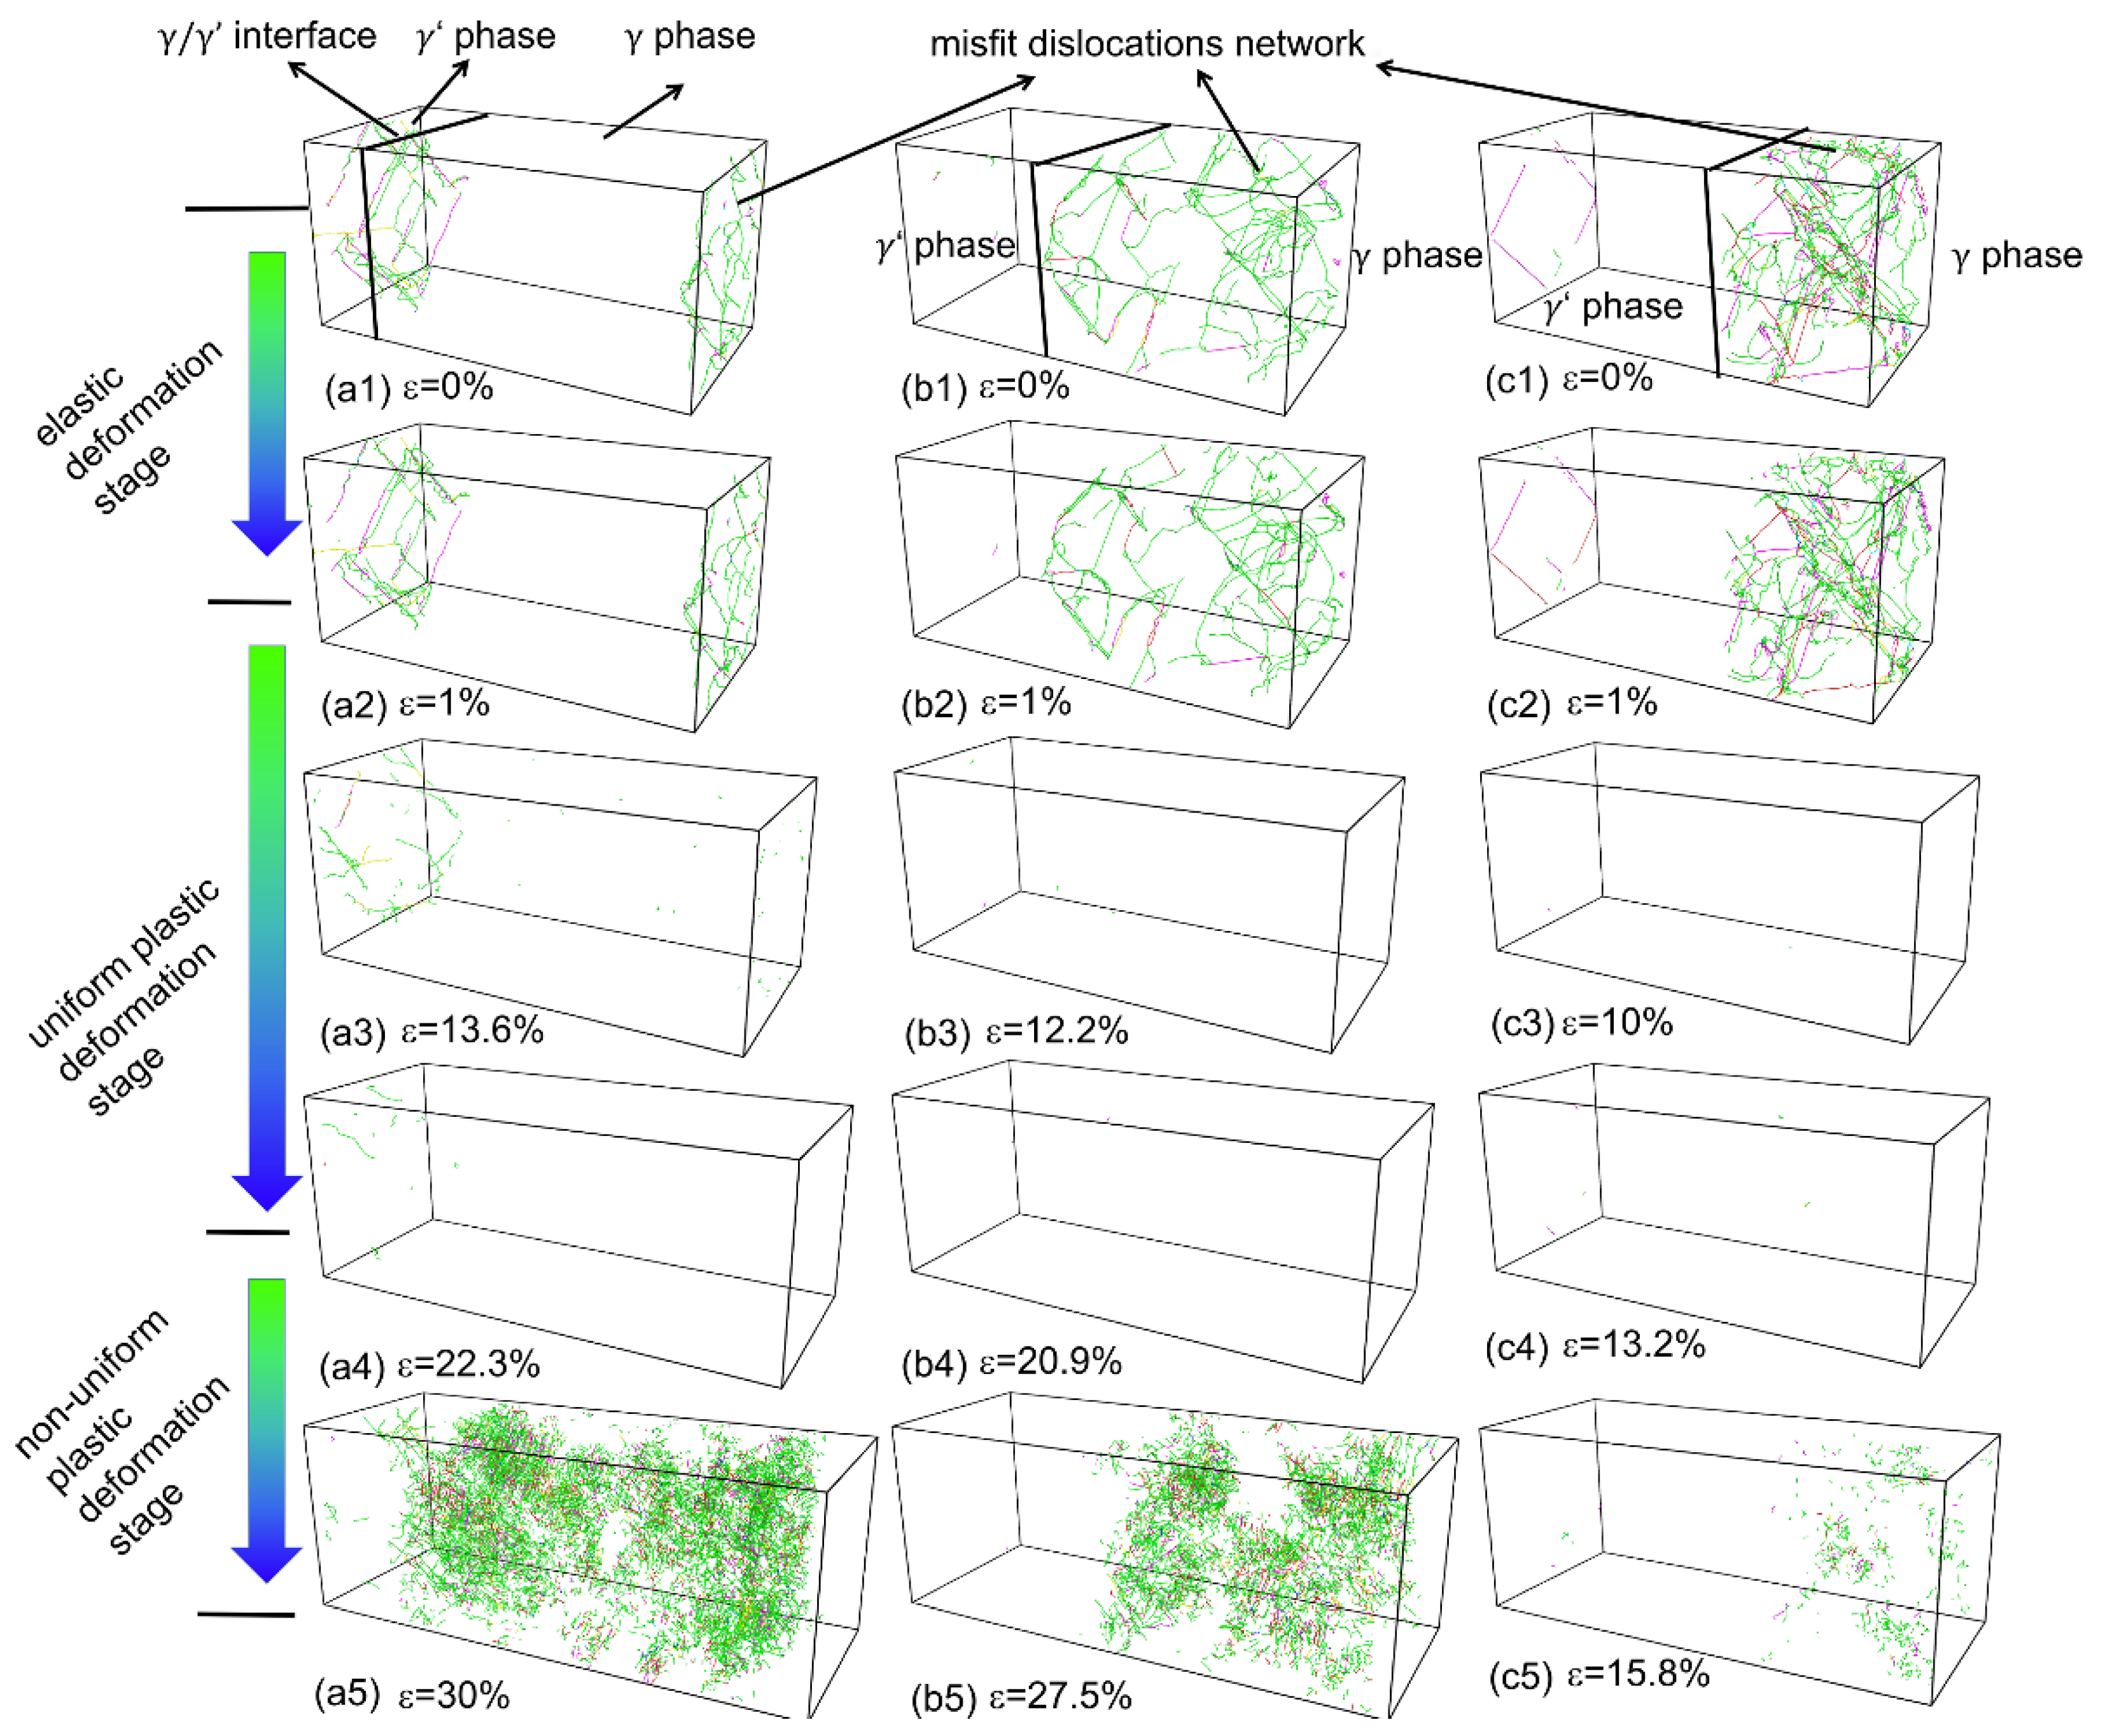
3.4. The Dislocation Configuration Evolution Analysis

Figure 5 shows the evolution of dislocation configuration of the γ / γ superalloy with varying V γ during deformation. Before deformation, the misfit dislocation networks were formed in the γ phase (for γ / γ superalloy with V γ = 13.5%) and the γ phase (for γ / γ superalloy with V γ > 13.5%) in the NPT relaxation process. The morphology of misfit dislocation networks remained virtually unchanged during the elastic deformation stage. Subsequently, as a result of local atoms from the FCC → BCC structural phase transformation at the uniform plastic deformation stage, the misfit dislocation networks gradually dissipated within the system. Once the system entered the non-uniform plastic deformation (damage) stage, we observed a notable dislocation proliferation behavior because of the formation and growth of nanopores emitting numerous dislocations.
Figure 6 depicts variations in dislocation density of the γ / γ superalloys with different V γ . With V γ increasing, the initial dislocation density of the tensile system gradually increased. Throughout the deformation process, the dislocation density first decreased gradually to 0 nm−2 and then remained constant until the completion of the uniform plastic deformation stage of the tensile system. When nanopores emerged in the system, there was a rapid increase in dislocation density. For systems with various V γ , the rates of dislocation annihilation and proliferation during deformation varied accordingly. Specifically, a higher V γ was associated with an accelerated rate of dislocation annihilation and a decelerated rate of proliferation.

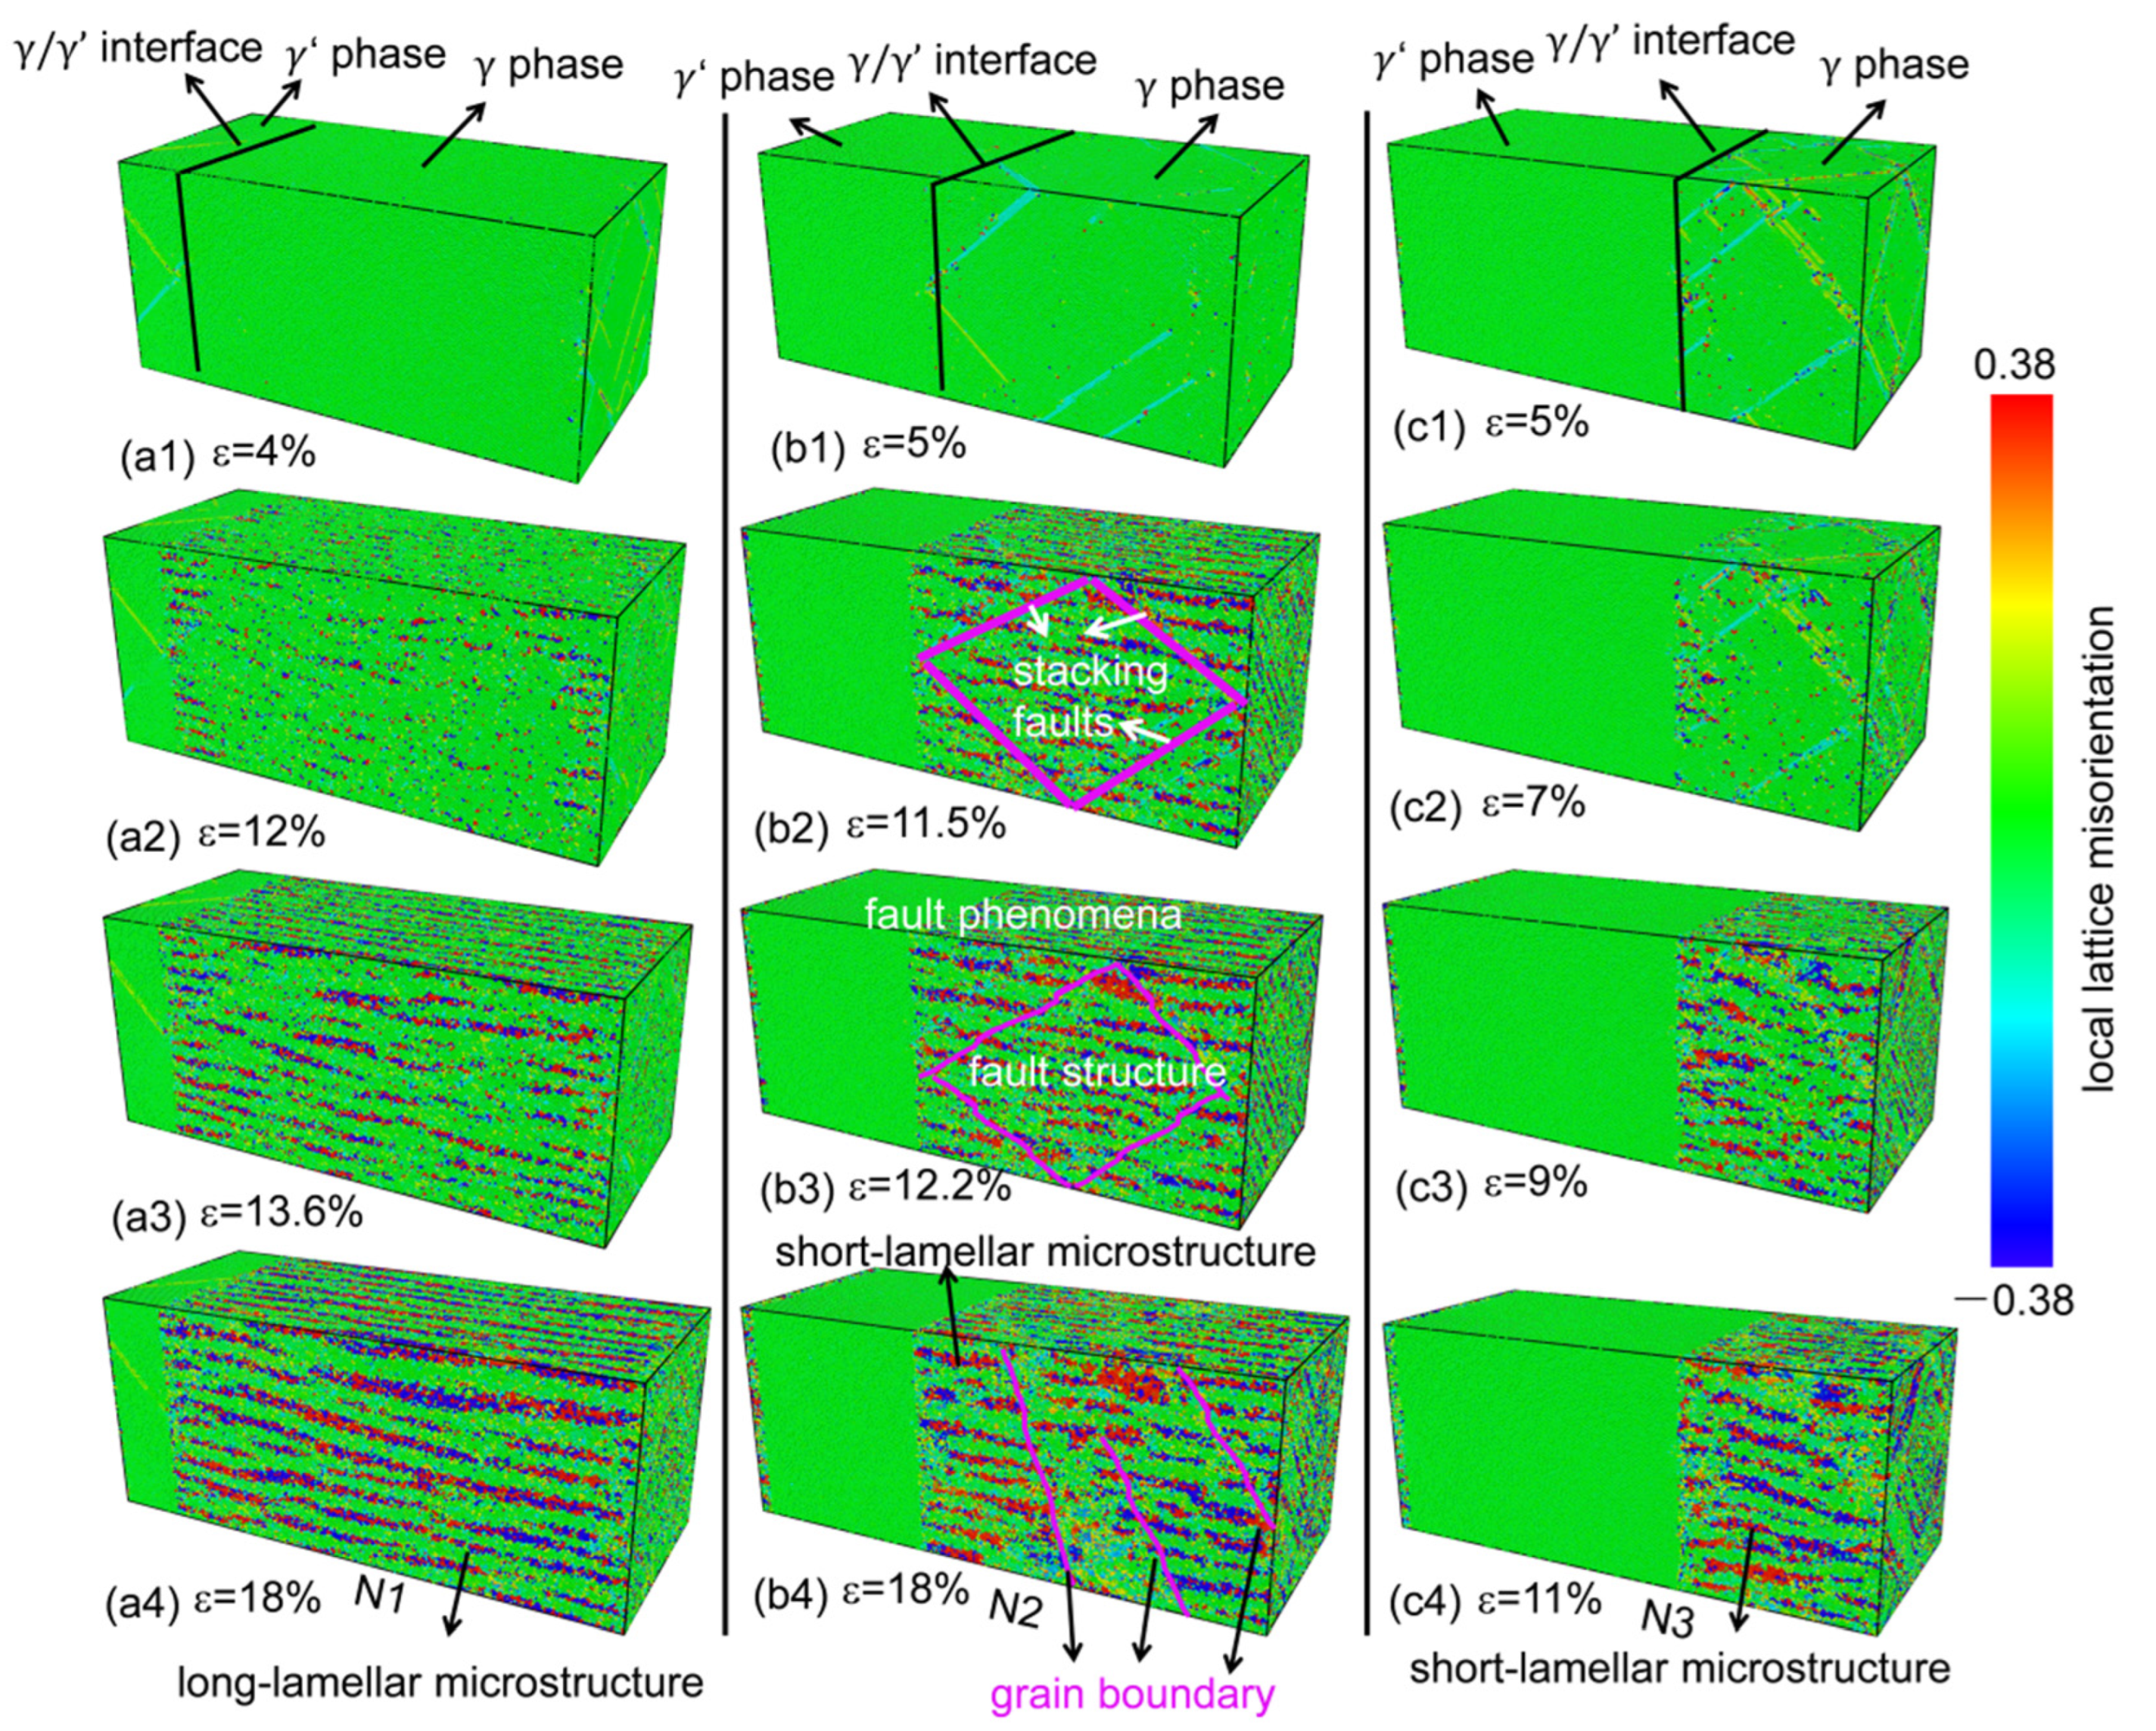
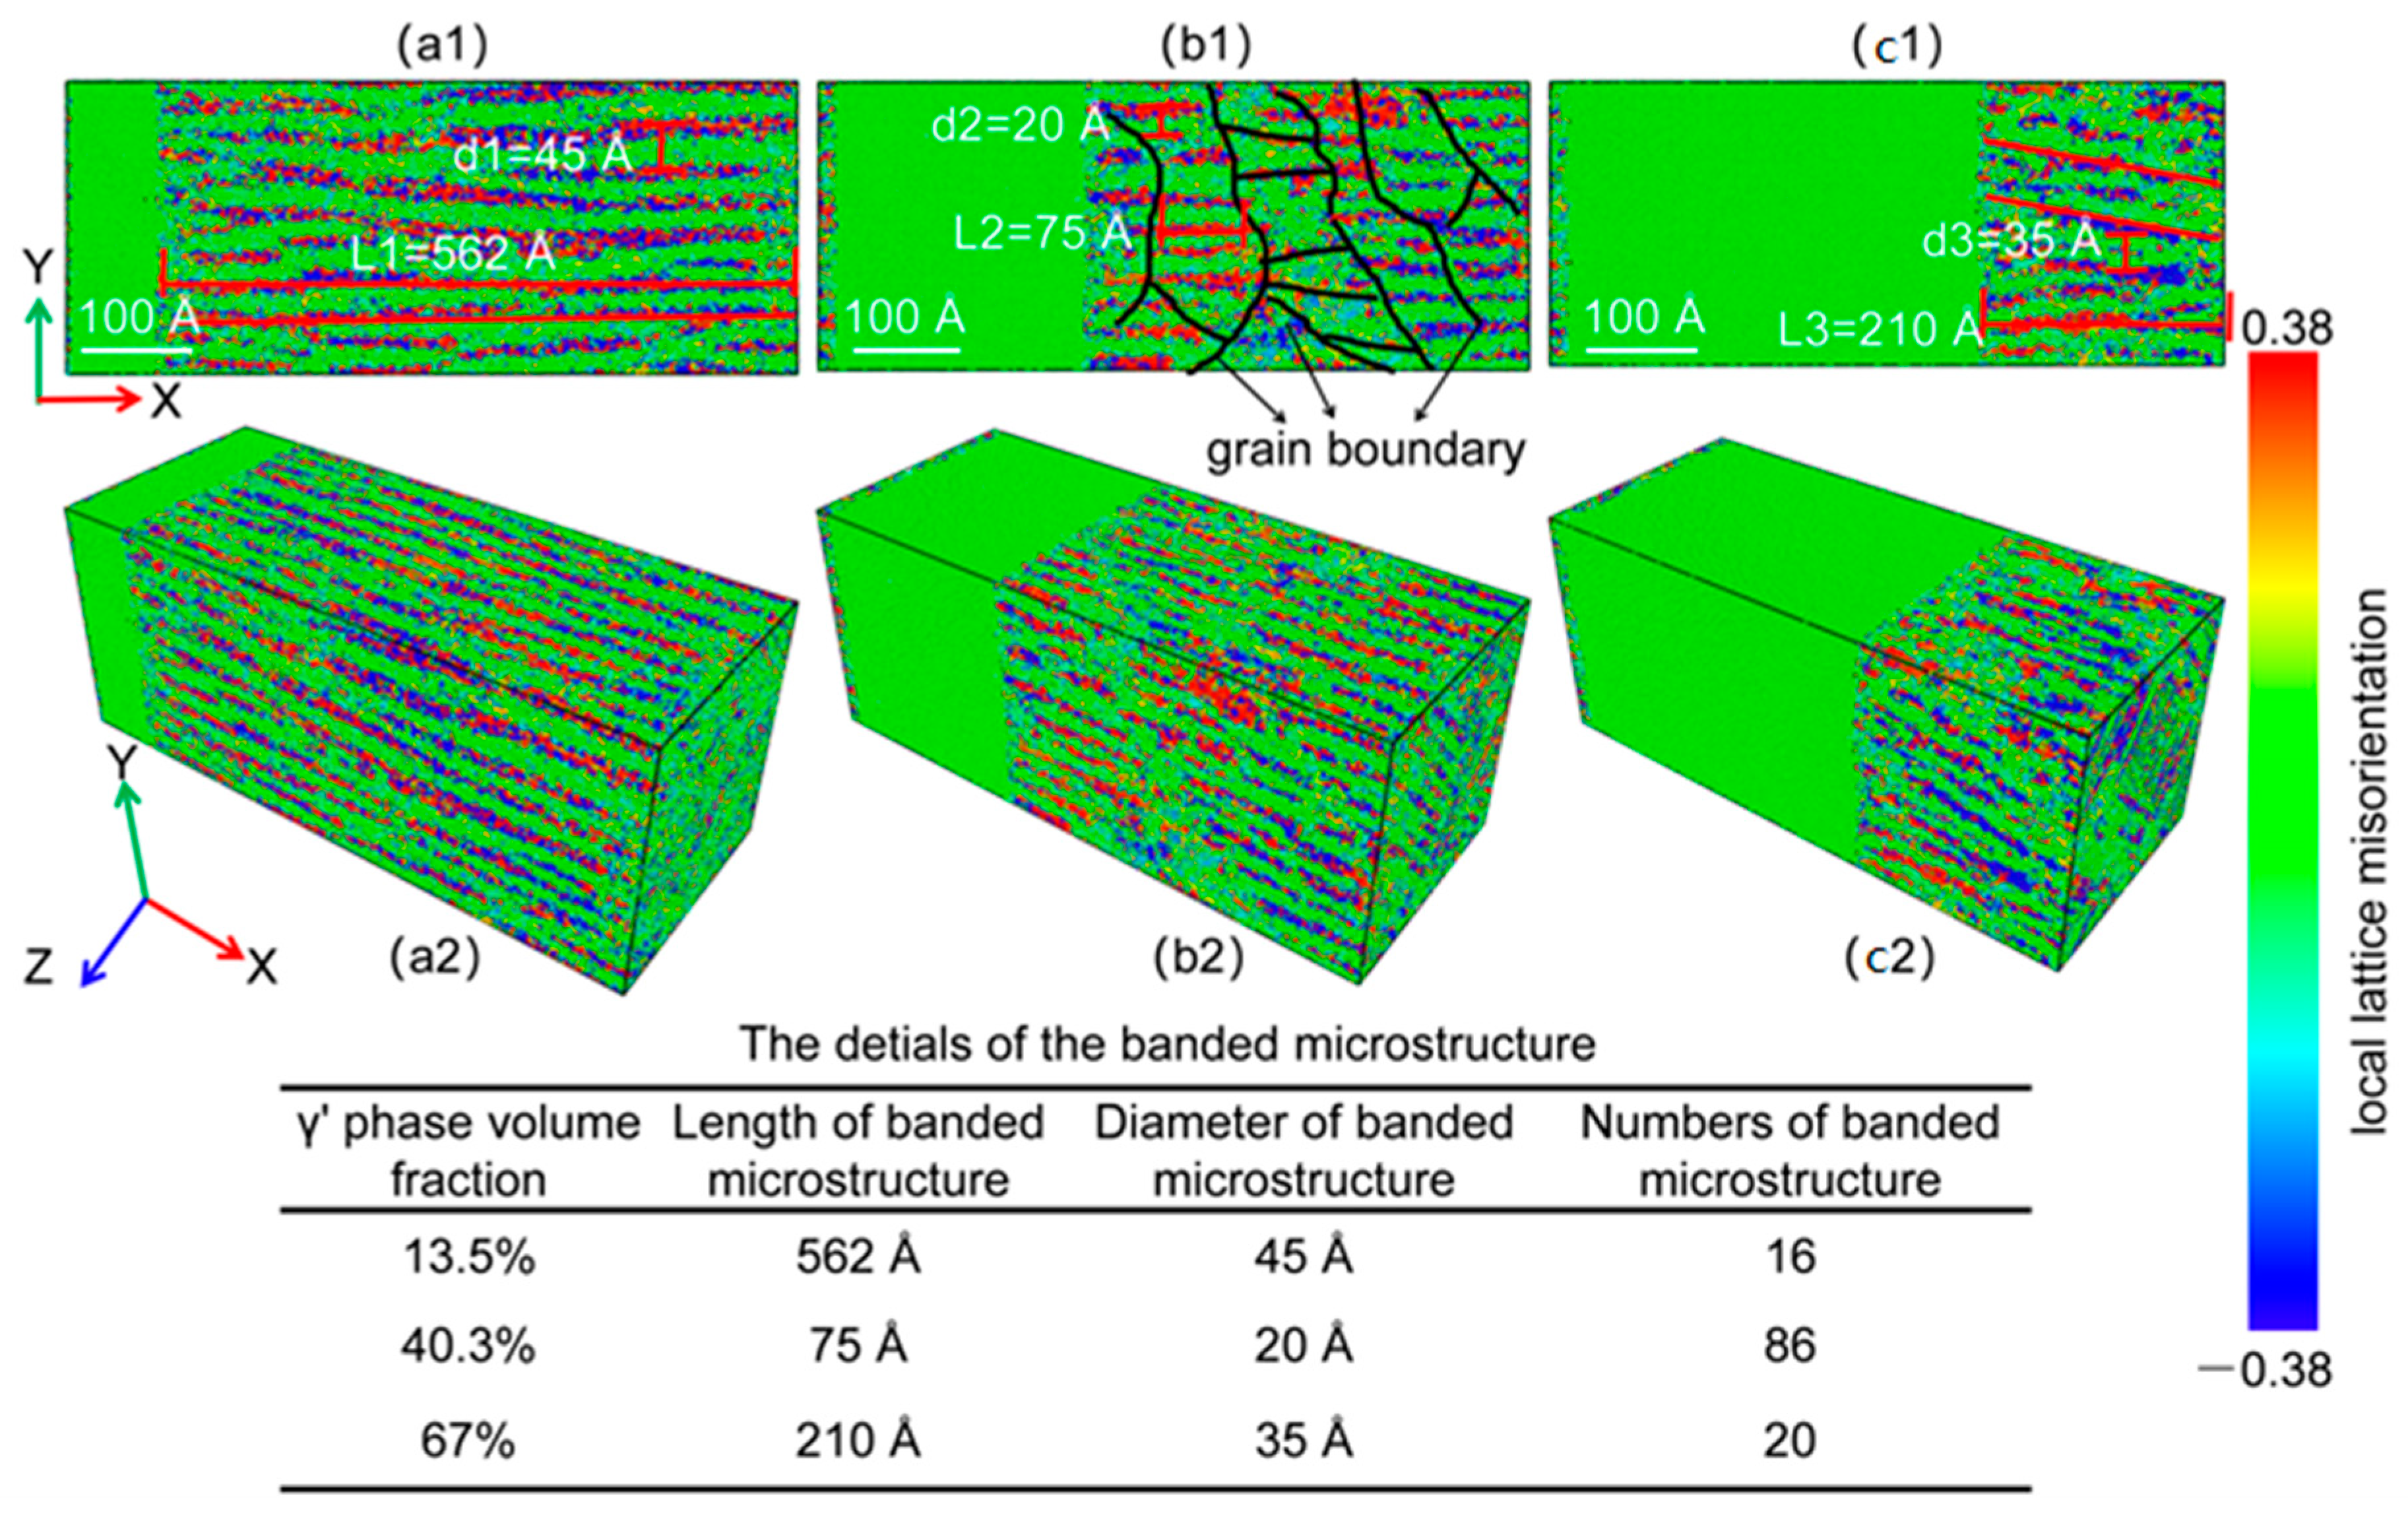
3.5. The Local Lattice Misorientation Analysis

Figure 7 illustrates the evolution of local crystal orientations of the γ / γ superalloys with varying V γ during deformation. The local crystal orientations refer to the spatial arrangement of atoms in specific microregions of a crystalline material, relative to a reference coordinate system [33,34]. These orientations describe how the lattice structure is oriented at the subgrain or nanoscale, influencing the material deformation behavior. A local crystallographic orientation analysis of the superalloy revealed that the homogeneous single γ phase transformed into lamellar structures with different local crystallographic orientations (Figure 7(a3,b3,c3)). When the V γ were 13.6 and 67%, the tensile system acquired long- and short-lamellar structures, respectively (Figure 7(a4,c4)). When the V γ = 40.3%, because of the interaction between the stacking faults and the mixed BCC/HCP structure (which resulted from the phase transformation), the fault phenomenon occurred in the lamellar microstructure of the γ phase, which resulted in the formation of the fault structure. Then the fault structure gradually evolved into grain boundaries (the magenta solid line in Figure 7(b4)), which caused a tear in the long-lamellar microstructure and thus created the short-lamellar microstructure (Figure 7(b4)).

4. Discussion

4.1. Deformation Behaviors

During the isothermal–isobaric relaxation (NPT ensemble), the V γ had a significant effect on the distributions of the stacking faults (or misfit dislocations network), which resulted from the lattice misfit of two phases ( γ and γ phase). When the V γ was low (13.5%), in the deformation process of this system, the decomposition of the stacking faults (or misfit dislocations network) only happened in the γ phase. However, the phase transformation from the atom FCC structure to a mixed BCC/HCP structure only occurred in the γ phase. There was no interaction between the decomposition process of the stacking faults (or misfit dislocation network) and the phase transformation process, so the long-lamellar microstructure was obtained. Nevertheless, for the γ / γ superalloy system with high V γ , both the process of decomposition of the stacking faults (or misfit dislocation network) and the phase transformation occurred in the γ phase of the system. The strong interaction between the stacking faults (or misfit dislocation network) and the mixed BCC/HCP structure from the phase transformation was presented in this system. This interaction led to the formation of the short-lamellar microstructure by the stacking faults tearing the long-lamellar microstructure.

4.2. Mechanical Properties

Figure 8 shows the mechanical properties of the tensile systems with various γ phase volume fractions. As the V γ increased, the tensile strength ( σ b ) of the deformation system first increased to a maximum value ( V γ = 40.3 % , σ b = 12.66   G P a ) and then decreased. The σ b V γ curve formed a parabolic shape. Using nonlinear fitting method, the functional relationship between the V γ and its tensile strength ( σ b ) in the γ / γ superalloy was obtained, as shown in Formula (2):
σ b = 10.42 + 140.09 50.15 × π / 2 × e x p ( 2 × ( V γ 41.69 50.15 ) 2 )
As the V γ increased, the maximum uniform plastic strain ( ε m u p s ) of the system linearly decreased. The functional relationship between the V γ and its maximum uniform plastic strain ( ε m u p s ) in the γ / γ superalloy is shown in Formula (3):
ε m u p s = 0.2328 0.00158 × V γ
According to a comprehensive analysis of Figure 8a,b, when the V γ was very low, the deformation system exhibited a large maximum uniform plastic strain but relatively low tensile strength. However, when the V γ in the system exceeded 50%, both the tensile strength and the maximum uniform plastic strain of the system were relatively small. When the V γ in the system was 40.3%, the system simultaneously possessed high tensile strength and maximum uniform plastic strain ( ε m u p s 0.18). This result indicated that the deformation system with this V γ had excellent comprehensive mechanical properties. This finding is in good agreement with the results reported by Ji-Un Park et al. [35], who fabricated a series of γ (Ni)/ γ (Ni3Al) superalloys with varying γ phase area fractions using electron beam powder bed fusion (EB-PBF) technology. They further demonstrated that when the γ phase area fraction reached 40%, the γ / γ two-phase lattice misfit significantly increased. This lattice distortion effect substantially elevated the critical resolved shear stress required for dislocations to shear through the γ strengthening phase, ultimately leading to a remarkable enhancement in superalloys’ strength.
Through the microstructure analysis of the tensile systems with different V γ , we found that the deformation primarily occurred within the softer γ phase, and the γ phase transformed from a single crystal into a series of lamellar microstructures with different crystallographic orientations. These lamellar microstructures were parallel to the X-direction, as shown in Figure 9. When V γ = 13.5%, the lamellar microstructure with large lengths and thickness were clearly defined and uniformly distributed within the γ phase. At V γ = 67%, the lamellar structures were relatively clear and appeared to form distinct stripes. For the deformation system with V γ = 40.3%, we clearly observed a significant number of grain boundaries (black curves in Figure 9b), which divided the γ phase into many short rod-like grains and noticeably refined the microstructure of the system. We further conducted a statistical analysis on the length, thickness, and number of lamellar grains of the systems with different V γ , as shown in the table accompanying Figure 9. The system with 40.3% V γ had the smallest length and thickness and the greatest number of lamellar grains. According to the grain refinement strengthening mechanism [36,37,38], the smaller the grain size, the higher the tensile strength of the system. This mechanism effectively explained our research results, leading to a deformation system with V γ = 40.3% that had excellent comprehensive mechanical properties.

5. Conclusions

This investigation employs molecular dynamics simulations to probe the influence of V γ on deformation mechanisms and mechanical characteristics in dual-phase γ (Ni)/ γ (Ni3Al) superalloys under elevated-temperature dynamic loading conditions. Key findings are summarized as follows.
  • For a system with low γ phase volume fraction, the deformation process involved the decomposition of stacking faults (misfit dislocation network) of the γ phase and the uniform phase transformation of the local atom structure of the γ phase. Thus, we obtained a lamellar microstructure of uniformly distributed mixed BCC/HCP microstructures in the γ phase. The atomic stress concentration (strain localization) occurred only at the γ / γ phase interface, leading to the initiation of nanopore at the phase interface.
  • For the system with a high γ phase volume fraction, the deformation process was mainly related to the decomposition of stacking faults and the phase transformation of the local atoms’ structure of the γ phase. Because of the interaction between the stacking faults and the mixed BCC/HCP microstructure, the long-lamellar microstructure of mixed BCC/HCP atoms was broken down into many short-lamellar microstructures, which could be regarded as fine grains. The atomic stress concentration (strain localization) emerged at the interaction region of the stacking faults and mixed BCC/HCP microstructure, resulting in the initiation of nanopore at this area.
  • As the γ phase volume fraction increased from 13.5 to 67%, the tensile strength ( σ b ) of the system first increased to its maximum value and then gradually decreased. The maximum uniform plastic strain ( ε m u p s ) decreased linearly and significantly with an increase in the γ phase volume fraction. Based on our calculation, we obtained the functional relationship between the tensile strength ( σ b ), maximum uniform plastic strain ( ε m u p s ) and the γ phase volume fraction of γ / γ superalloy under this severe service condition.
  • The deformation system with γ phase volume fractions ( V γ = 40.3 % ) had excellent comprehensive mechanical properties.
  • The results of this study offered a theoretical framework to explain the difference in the mechanical properties for the γ / γ superalloy with different γ phase volume fractions. It also provided a theoretical basis for the composition and microstructure design of γ / γ superalloys.

Author Contributions

Writing—original manuscript, X.Q.; Computational method and analysis, W.Y.; Review and editing manuscript, Y.L.; Visualization, F.L. All authors have read and agreed to the published version of the manuscript.

Funding

This work was funded by the Project of the Education Department of Guizhou Province (CN) (Grant NO. [2021]315); The 2024 Youth Guidance Project of Basic Research Program (Natural Science) (CN) (Grant NO. [2024]411); The Guizhou Provincial “Centennial Academy-Industry” Science & Technology Flagship Program (CN) (Grant NO. [2025] 010).

Data Availability Statement

All relevant data are within the paper.

Acknowledgments

We thank LetPub (www.letpub.com.cn, accessed on 1 August 2024) for its linguistic assistance during the preparation of this manuscript.

Conflicts of Interest

The authors declare no conflicts of interest.

References

  1. Wu, W.-P.; Guo, Y.-F.; Wang, Y.-S.; Mueller, R.; Gross, D. Molecular dynamics simulation of the structural evolution of misfit dislocation networks at γ/γ phase interfaces in Ni-based superalloys. Philos. Mag. 2011, 91, 357–372. [Google Scholar] [CrossRef]
  2. Yu, J.; Zhang, Q.; Liu, R.; Yue, Z.; Tang, M.; Li, X. Molecular dynamics simulation of crack propagation behaviors at the Ni/Ni3Al grain boundary. RSC Adv. 2014, 4, 32749. [Google Scholar] [CrossRef]
  3. Li, H.; Du, W.; Liu, Y. Molecular Dynamics Study of Tension Process of Ni-Based Superalloy. Acta Metall. Sin. (Engl. Lett.) 2020, 33, 741–750. [Google Scholar] [CrossRef]
  4. Pollock, T.M.; Tin, S. Nickel-Based Superalloys for Advanced Turbine Engines: Chemistry, Microstructure and Properties. J. Propuls. Power 2006, 22, 361–374. [Google Scholar] [CrossRef]
  5. Chamanfar, A.; Sarrat, L.; Jahazi, M.; Asadi, M.; Weck, A.; Koul, A.K. Microstructural characteristics of forged and heat treated Inconel-718 disks. Mater. Des. 2013, 52, 791–800. [Google Scholar] [CrossRef]
  6. McAllister, D.; Lv, D.; Peterson, B.; Deutchman, H.; Wang, Y.; Mills, M.J. Lower temperature deformation mechanisms in a γ″-strengthened Ni-base superalloy. Scr. Mater. 2016, 115, 108–112. [Google Scholar] [CrossRef]
  7. Zhou, J.; Yang, Y.; Yu, Y. Revealing mechanical property–strengthening micro-mechanism of Ni/Ni3Al-based alloys by molecular dynamics simulation. J. Mol. Model. 2022, 28, 371. [Google Scholar] [CrossRef]
  8. Lapin, J. Effect of ageing on the microstructure and mechanical behaviour of a directionally solidified Ni3Al-based alloy. Intermet. 1997, 5, 615–624. [Google Scholar] [CrossRef]
  9. Wu, J.; Li, C.; Liu, Y.; Xia, X.; Wu, Y.; Li, Y.; Wang, H. Formation and widening mechanisms of envelope structure and its effect on creep behavior of a multiphase Ni3Al-based intermetallic alloy. Mater. Sci. Eng. A 2019, 763, 138158. [Google Scholar] [CrossRef]
  10. Pope, D.P.; Ezz, S.S. Mechanical properties of Ni3AI and nickel-base alloys with high volume fraction of γ. Int. Met. Rev. 1984, 29, 136–167. [Google Scholar] [CrossRef]
  11. Kawahara, K.; Kaneno, Y.; Kakitsuji, A.; Takasugi, T. Microstructural factors affecting hardness property of dual two-phase intermetallic alloys based on Ni3Al–Ni3V pseudo-binary alloy system. Intermetallics 2009, 17, 938–944. [Google Scholar] [CrossRef]
  12. Yun-Jiang, W.; Chong-Yu, W. First-principles calculations for the elastic properties of Ni-base model superalloys: Ni_Ni3Al multilayers. Chin. Phys. B 2009, 18, 4339–4348. [Google Scholar] [CrossRef]
  13. Qin, X.; Liang, Y.; Gu, J.; Peng, G. The Effect of Interatomic Potentials on the Nature of Nanohole Propagation in Single-Crystal Nickel: A Molecular Dynamics Simulation Study. Crystals 2023, 13, 585. [Google Scholar] [CrossRef]
  14. Wang, Z.; Shi, X.; Yang, X.-S.; He, W.; Shi, S.-Q.; Ma, X. Atomistic simulation of martensitic transformations induced by deformation of α-Fe single crystal during the mode-I fracture. J. Mater. Sci. 2020, 56, 2275–2295. [Google Scholar] [CrossRef]
  15. Li, J.; Dong, L.; Zang, X.; Zhang, X.; Zhao, W.; Wang, F. Study on micro-crack propagation behavior of single-crystal α-Ti under shear stress based on molecular dynamics. Mater. Today Commun. 2020, 25, 101622. [Google Scholar] [CrossRef]
  16. Yashiroa, K.; Naitob, M.; Tomitac, Y. Molecular dynamics simulation of dislocation nucleation and motion at γ/γ interface in Ni-based superalloy. Int. J. Mech. Sci. 2002, 44, 1845–1860. [Google Scholar] [CrossRef]
  17. Li, N.-L.; Wu, W.-P.; Nie, K. Molecular dynamics study on the evolution of interfacial dislocation network and mechanical properties of Ni-based single crystal superalloys. Phys. Lett. A 2018, 382, 1361–1367. [Google Scholar] [CrossRef]
  18. Yang, H.; Zhu, L.; Zhang, R.; Zhou, J.; Sun, Z. Influence of high stacking-fault energy on the dissociation mechanisms of misfit dislocations at semi-coherent interfaces. Int. J. Plast. 2020, 126, 102610. [Google Scholar] [CrossRef]
  19. Li, B.; Dong, C.; Yu, J.; Zhang, Q.; Zhou, H.; Liu, R. Mechanical behaviour and microstructural evolution of Ni-based single crystal alloys under shock loading. RSC Adv. 2018, 8, 22127–22135. [Google Scholar] [CrossRef]
  20. Chen, B.; Wu, W.-P. Molecular dynamics simulations of dynamics mechanical behavior and interfacial microstructure evolution of Ni-based single crystal superalloys under shock loading. J. Mater. Res. Technol. 2021, 15, 6786–6796. [Google Scholar] [CrossRef]
  21. Qin, X.; Yan, W.; Liang, Y.; Li, F. Effects of the temperature, strain rate, and loading conditions on the deformation behaviors and mechanical properties of the Ni/Ni3Al superalloy. RSC Adv. 2024, 14, 21821–21831. [Google Scholar] [CrossRef]
  22. Thompson, A.P.; Aktulga, H.M.; Berger, R.; Bolintineanu, D.S.; Brown, W.M.; Crozier, P.S.; in’t Veld, P.J.; Kohlmeyer, A.; Moore, S.G.; Nguyen, T.D.; et al. LAMMPS—A flexible simulation tool for particle-based materials modeling at the atomic, meso, and continuum scales. Comput. Phys. Commun. 2022, 271, 108171. [Google Scholar] [CrossRef]
  23. Ackland, G.J.; Tichy, G.; Vitek, V.; Finnis, M.W. Simple N-body potentials for the noble metals and nickel. Philos. Mag. A 1987, 56, 735–756. [Google Scholar] [CrossRef]
  24. Purja Pun, G.P.; Mishin, Y. Development of an interatomic potential for the Ni-Al system. Philos. Mag. 2009, 89, 3245–3267. [Google Scholar] [CrossRef]
  25. Ben, L.; Shiming, Z.; Essa, F.A.; Chao, D.; Jingui, Y.; Qiaoxin, Z. Crack Propagation and Microstructural Evolution of Ni-based Single Crystal Alloy Under Shear Loads. Rare Metal. Mater. Eng. 2018, 47, 1370–1376. [Google Scholar] [CrossRef]
  26. Chen, B.; Wu, W.-P.; Chen, M.-X. Orientation-Dependent Morphology and Evolution of Interfacial Dislocation Networks in Ni-Based Single-Crystal Superalloys: A Molecular Dynamics Simulation. Acta Mech. Solida Sin. 2020, 34, 79–90. [Google Scholar] [CrossRef]
  27. Larsen, P.M.; Schmidt, S.; Schiøtz, J. Robust structural identification via polyhedral template matching. Model. Simul. Mater. Sci. Eng. 2016, 24, 055007. [Google Scholar] [CrossRef]
  28. Stukowski, A. Visualization and analysis of atomistic simulation data with OVITO–the Open Visualization Tool. Model. Simul. Mater. Sci. Eng. 2010, 18, 015012. [Google Scholar] [CrossRef]
  29. Stukowski, A.; Bulatov, V.V.; Arsenlis, A. Automated identification and indexing of dislocations in crystal interfaces. Model. Simul. Mater. Sci. Eng. 2012, 20, 085007. [Google Scholar] [CrossRef]
  30. Shimizu, F.; Ogata, S.; Li, J. Theory of Shear Banding in Metallic Glasses and Molecular Dynamics Calculations. Mater. Trans. 2007, 48, 2923–2927. [Google Scholar] [CrossRef]
  31. Falk, M.L.; Langer, J.S. Dynamics of viscoplastic deformation in amorphous solids. Phys. Rev. E 1998, 57, 7192–7205. [Google Scholar] [CrossRef]
  32. Park, M.H.; Shibata, A.; Harjo, S.; Tsuji, N. Grain refinement of dual phase steel maximizes deformation ability of martensite, leading to simultaneous enhancement of strength and ductility. Acta Mater. 2025, 292, 121061. [Google Scholar] [CrossRef]
  33. Cautaerts, N.; Crout, P.; Ånes, H.W.; Prestat, E.; Jeong, J.; Dehm, G.; Liebscher, C.H. Free, flexible and fast: Orientation mapping using the multi-core and GPU-accelerated template matching capabilities in the Python-based open source 4D-STEM analysis toolbox Pyxem. Ultramicroscopy 2022, 237, 113517. [Google Scholar] [CrossRef] [PubMed]
  34. Jariwala, S.; Sun, H.; Adhyaksa, G.W.; Lof, A.; Muscarella, L.A.; Ehrler, B.; Garnett, E.C.; Ginger, D.S. Local crystal misorientation influences non-radiative recombination in halide perovskites. Joule 2019, 3, 3048–3060. [Google Scholar] [CrossRef]
  35. Park, J.-U.; Jun, S.-Y.; Lee, B.H.; Jang, J.H.; Lee, B.-S.; Lee, H.-J.; Lee, J.-H.; Hong, H.-U. Alloy design of Ni-based superalloy with high γ volume fraction suitable for additive manufacturing and its deformation behavior. Addit. Manuf. 2022, 52, 102680. [Google Scholar] [CrossRef]
  36. Feng, L.; Gencang, Y.; Xuefeng, G. Research of grain refinement in undercooled DD3 single crystal superalloy. Mater. Sci. Eng. A 2001, 311, 54–63. [Google Scholar] [CrossRef]
  37. Liu, F.; Gencang, Y. Stress-induced recrystallization mechanism for grain refinement in highly undercooled superalloy. J. Cryst. Growth 2001, 231, 295–305. [Google Scholar] [CrossRef]
  38. Zhang, W.W.; Yang, Y.; Tan, Y.B.; Zeng, M.T.; Ma, M.; Xiang, S.; Zhao, F. Microstructure evolution and strengthening mechanisms of MP159 superalloy during room temperature rolling and cryorolling. J. Alloys Compd. 2022, 908, 164667. [Google Scholar] [CrossRef]
Figure 1. The MD simulation deformation model: (a) the structure of the γ (Ni)/ γ (Ni3Al) superalloys, and (b) the deformation process, the red and blue is denoting the maximum and minimum tensile strain, respectively.
Crystals 15 00706 g001
Figure 2. The stress–strain behaviors and relevant mechanical properties of the γ / γ superalloys with different γ phase volume fractions: (a) engineering stress–strain curve, (b) true stress–strain curve and strain-hardening rate–true strain curve, and the shaded circular symbol represents the intersection point of the strain-hardening rate curve and the true stress–strain curve, (c) the variation in tensile strength (true stress and engineering stress), and maximum uniform plastic strain ( ε m u p s ) with different γ phase volume fractions.
Crystals 15 00706 g002
Figure 3. The microstructure evolution of the tensile system with different V γ : (a1a6) 13.5%, (b1b6) 40.3%, and (c1c6) 67% (the atoms with FCC structure were deleted).
Crystals 15 00706 g003
Figure 4. The atomic strain distributions of the tensile system with different V γ : (a1a4) 13.5%, (b1b4) 40.3% and (c1c4) 67%.
Crystals 15 00706 g004
Figure 5. The evolution of dislocation configuration of the tensile system with different V γ : (a1a5) 13.5%, (b1b5) 40.3%, and (c1c5) 67%. The green and magenta solid line is denoting the Shockley partial dislocations and Stair-rod dislocation, respectively.
Crystals 15 00706 g005
Figure 6. The dislocations density of the tensile systems with different V γ .
Crystals 15 00706 g006
Figure 7. The local lattice misorientation analysis of the tensile system with different V γ : (a1a4) 13.5%, (b1b4) 40.3%, and (c1c4) 67%.
Crystals 15 00706 g007
Figure 8. The mechanical properties of the tensile system with various V γ : (a) tensile strength ( σ b ), and (b) maximum uniform plastic strain ( ε m u p s ). The solid line and dash line is denoting the calculated and fitted curve, respectively.
Crystals 15 00706 g008
Figure 9. The length and diameter analysis of the banded microstructure of the γ / γ superalloy with different γ phase volume fractions: (a) 13.5%, (b) 40.3%, and (c) 67%.
Crystals 15 00706 g009
Table 1. The size and chemical composition analysis of the simulation model with various γ phase volume fractions.
γ Phase Volume Fraction γ / γ Model Size (X-, Y-, and Z-Direction)/nmAtomic Percent (at%)Weight Percent (wt%)
NickelAluminumNickelAluminum
13.5%52.9 × 25.7 × 25.796.75%3.25%98.48%1.52%
26.9%53.0 × 25.7 × 25.793.47%6.53%96.83%3.17%
40.3%53.1 × 25.7 × 2.5790.17%9.83%95.05%4.95%
53.7%53.2 × 25.7 × 25.786.84%13.16%93.14%6.86%
67%53.3 × 25.7 × 25.783.49%16.51%91.10%8.90%
Disclaimer/Publisher’s Note: The statements, opinions and data contained in all publications are solely those of the individual author(s) and contributor(s) and not of MDPI and/or the editor(s). MDPI and/or the editor(s) disclaim responsibility for any injury to people or property resulting from any ideas, methods, instructions or products referred to in the content.

