Article

Enhancing Electrochemical Kinetics and Stability of Biodegradable Mg-Y-Zn Alloys with LPSO Phases via Strategic Micro-Alloying with Ca, Sr, Mn, and Zr

College of Municipal and Transportation Engineering, Anhui Water Conservancy Technical College, Hefei 231603, China
*
Author to whom correspondence should be addressed.
Crystals 2025, 15(7), 639; https://doi.org/10.3390/cryst15070639
Submission received: 16 June 2025 / Revised: 4 July 2025 / Accepted: 7 July 2025 / Published: 11 July 2025
(This article belongs to the Special Issue Advances in High-Performance Alloys)

Abstract

This study systematically investigated the effects of biologically relevant microalloying elements—calcium (Ca), strontium (Sr), manganese (Mn), and zirconium (Zr)—on the electrochemical behavior of Mg-Y-Zn alloys containing long-period stacking ordered (LPSO) phases. The alloys were prepared by casting and characterized using X-ray diffraction (XRD), optical microscopy (OM), and scanning electron microscopy with energy-dispersive spectroscopy (SEM/EDS). Electrochemical properties were assessed through potentiodynamic polarization in Hank’s solution, and corrosion rates were determined by hydrogen evolution and weight loss methods. Microalloying significantly enhanced the corrosion resistance of the base Mg-Y-Zn alloy, with corrosion rates decreasing from 2.67 mm/year (unalloyed) to 1.65 mm/year (Ca), 1.36 mm/year (Sr), 1.18 mm/year (Zr), and 1.02 mm/year (Mn). Ca and Sr additions introduced Mg2Ca and Mg17Sr2, while Mn and Zr refined the existing LPSO structure without new phases. Sr refined the LPSO phase and formed a uniformly distributed Mg17Sr2 network, promoting uniform corrosion and suppressing deep localized attacks. Ca-induced Mg2Ca acted as a temporary sacrificial phase, with corrosion eventually propagating along LPSO interfaces. The Mn-containing alloy exhibited the lowest corrosion rate; this is attributed to the suppression of both anodic and cathodic reaction kinetics and the formation of a stable protective surface film. Zr improved general corrosion resistance but increased susceptibility to localized attacks due to dislocation-rich zones. These findings elucidate the corrosion mechanisms in LPSO-containing Mg alloys and offer an effective strategy to enhance the electrochemical stability of biodegradable Mg-based implants.

1. Introduction

Magnesium-based alloys have emerged as promising candidates for next-generation biodegradable implant materials due to their excellent biocompatibility, favorable mechanical properties, and elastic modulus similar to that of human bone. Compared with traditional metallic biomaterials such as titanium and stainless steel, Mg alloys exhibit superior biodegradability, making them particularly attractive for orthopedic and cardiovascular applications [1,2,3,4,5,6,7,8,9].
Among the various Mg alloy systems, Mg-Y-Zn ternary alloys have garnered significant attention owing to their outstanding mechanical properties, which are mainly attributed to the presence of long-period stacking ordered (LPSO) phases embedded within the Mg matrix [10,11,12]. However, despite the favorable properties, Mg-Y-Zn alloys still suffer from rapid degradation in chloride-rich physiological environments, severely limiting their clinical applicability. The corrosion challenges are mainly attributed to the heterogeneous distribution of LPSO phases, galvanic coupling between the α-Mg matrix and intermetallic compounds, and the instability of protective surface films such as Mg(OH)2 [13,14]. These limitations highlight the urgent need for advanced alloying strategies capable of preserving the mechanical advantages of LPSO structures while improving corrosion performance in biomedical environments.
A promising route to address these issues involves microalloying with trace amounts of physiologically compatible elements. Microalloying not only offers the ability to tailor phase composition and distribution but also significantly affects grain refinement, texture evolution, and surface film stability. Elements such as calcium (Ca), strontium (Sr), manganese (Mn), and zirconium (Zr) have been identified as effective additives for enhancing the corrosion resistance of Mg-based alloys. Importantly, these elements are either essential to or well-tolerated by the human body, making them attractive for use in biodegradable implants. Calcium (Ca), a primary constituent of bone, not only plays vital physiological roles in signaling and metabolism but also enhances the corrosion resistance of Mg alloys by refining grain structure and modifying texture [15,16,17,18,19,20]. Moreover, recent studies have developed Mg-Ca lean alloys with exceptionally low corrosion rates (<0.1 mm·year−1 in a 3.5 wt% NaCl solution), significantly outperforming ultra-high-purity Mg [21]. Strontium (Sr) has recently gained attention due to its ability to promote osteoblast replication and inhibit bone resorption. The mechanical and corrosion properties of Mg-Sr alloys are highly dependent on Sr content [22]. Liu et al. found that minor Sr additions (0.5 wt. % and 1 wt.%) lead to enhanced corrosion resistance and better surface film quality, while higher additions (2 wt.%) increased corrosion rates, especially in chloride-rich environments [23]. Zirconium (Zr) is commonly used to refine grains and enhance the mechanical properties of Mg alloys. Binary Mg alloys with Zr addition have demonstrated increased strength, reduced corrosion rates, and good cell compatibility [14,24,25,26,27]. Manganese (Mn) improves the corrosion resistance of Mg alloys by removing iron and other harmful impurities during the casting process. Mn also activates various enzyme systems, such as kinases, transferases, decarboxylases, and mitochondrial respiratory enzymes, without inducing toxic effects [28,29,30].
While the individual effects of these elements have been extensively studied in binary Mg systems, their behavior in more complex Mg-Y-Zn alloys containing LPSO phases remains inadequately explored. Existing research has largely focused on isolated alloy systems, neglecting how these microalloying additions interact with LPSO structures and influence corrosion mechanisms in ternary or higher-order systems—this gap in understanding hampers the development of optimized Mg-based biomaterials with both mechanical integrity and corrosion resistance.
In this study, we present a systematic and comparative investigation of the effects of Ca, Sr, Mn, and Zr microalloying on the microstructural evolution, electrochemical kinetics, and corrosion behavior of LPSO-containing Mg-Y-Zn alloys. This work evaluates multiple microalloying elements under identical compositional and experimental conditions, thereby enabling direct comparison of their efficacy. This work provides a deeper understanding of how Ca, Sr, Mn, and Zr influence the corrosion mechanisms of Mg-Y-Zn-X alloys by correlating microstructure evolution with electrochemical kinetics, thereby offering a practical design strategy for next-generation biodegradable materials.

2. Materials and Methods

2.1. Material Preparation

Mg-Y-Zn-X (0, Ca, Sr, Mn, Zr) alloys, where X represents no addition (0), or the microalloying elements Ca, Sr, Mn, and Zr were designed for biomedical applications prepared by melting methods. The equipment included a SG2-310-type crucible resistance furnace (well-type), rated at 3 kW and 1100 °C, with a furnace chamber size of Φ150 × 300 mm. A 45# steel crucible with an internal diameter of 100 mm and depth of 220 mm was used in the melting process. Prior to melting, the crucible, steel mold, slag skimmer, and auxiliary tools were preheated in the furnace at 220 °C and then coated with a protective slurry composed of 30 wt.% ZnO, 10 wt.% sodium silicate, and 60 wt.% distilled water. The coated tools were dried in an oven at 220 °C to remove moisture and prevent bubble formation in the coating. The melting process was conducted under a protective atmosphere consisting of 2 vol.% SF6 and 98 vol.% CO2. Pure Mg, Mg-30Y master alloy, Mg-RE master alloy, and Zn were dried at 200 °C for 2–3 h before melting. The furnace was heated to 500 °C, and the preheated pure Mg was added into the crucible and heated until fully molten (690–730 °C). Then, the Mg-30Y master alloy was added and stirred for 3–5 min at 710–730 °C. Zn particles were subsequently added and stirred for 3–5 min, followed by addition of Mg-30%Sr, Mg-25%Ca, Mg-30%Mn, and Mg-30%Zr and stirring for 5–10 min. The melt was held at 730 °C for 15 min, with the slag removed before casting. Finally, the protective gas was introduced into the preheated mold, and the melt was poured into the mold under the continuous protection of the CO2–SF6 atmosphere. After solidification, the ingots were removed from the mold. The actual chemical compositions of the prepared alloys were measured using inductively coupled plasma atomic emission spectrometry (ICP-AES, X Series II), as summarized in Table 1.

2.2. Microstructure Characterization

The test coupons with dimensions of 10 mm × 10 mm × 2 mm were cut from the middle regions of the Mg-Y-Zn-X (X = 0, Ca, Sr, Mn, Zr) ingots. Phase identification was determined by a X-ray diffractometer (XRD, Smartlab 9 kw). The scan range is 10–85° and the scanning rate was 10°/min with a copper target.
The microstructures of the alloys were observed by optical microscopy (OM, Olympus BX51M, Bethlehem, PA, USA) and scanning electron microscopy (SEM, Sirion, Singapore), equipped with energy dispersive X-ray spectroscopy (EDS). Before the experiment, the specimens were mechanically ground with SiC papers gradually from 120 grit to 2000 grit, then polished with 1 μm diamond polishing, and etched with an alcohol solution containing 4% nitric acid (volume fraction) to show the grain structures.

2.3. Corrosion Test

Hydrogen evolution tests and an electrochemical analysis for parallel samples were conducted in Hank’s solution at 37 ± 0.5 °C to reveal the corrosion behavior of the Mg-Y-Zn-X alloys in the present work. Square specimens (10 mm × 10 mm × 2 mm) were prepared for corrosion testing. Only the 10 mm × 10 mm face was exposed to the solution, while the remaining surfaces were sealed. The exposed surface was ground using SiC abrasive papers (400–2000 grit) and polished with a 0.5 μm alumina suspension to achieve a mirror finish.
The composition of Hank’s solution was given in Table 2. The solution was renewed every 24 h. Corrosion rates were calculated using hydrogen evolution volume and weight loss measurements and were marked as PAH (mm year−1) and PW (mm year−1), respectively [28,29,30].
The corrosion rate PAH (mm year−1) obtained by average hydrogen evolution can be determined via Equation (1) [31,32,33,34,35]:
P AH = 2.006 Δ V A × t
The corrosion rate from weight loss PW (mm year−1) was get via Formula (2):
P W = 2.10 Δ W At
where  Δ V is the total volume of hydrogen evolved for the total immersion time, ΔW (mg) is the weight loss of the specimen during the immersion, A (cm2) is the exposed surface area, and t (day) is the immersion time.
Table 2. Composition of Hank’s solution in this study [18,34,35].
ComponentConcentration (g/L)
NaCl8.0
CaCl20.14
KCl0.4
NaHCO30.35
MgCl2 6 H2O0.1
Glucose1.0
NaHPO4 2 H2O0.06
KH2PO40.06
MgSO4 7 H2O0.06
Electrochemical measurements, including polarization curves, were conducted to determine the corrosion kinetics and protection mechanisms. These measurements were carried out on the typical three-electrode electrochemical workstation (CHI660C) with Pt as the counter electrode, SCE as the reference electrode, and the specimen as the working electrode. The specimens were measured three times to ensure reproducibility. The instantaneous corrosion rate, Pi (mm year−1), was determined from the corrosion current density, icorr (mA cm−2), by the following [36,37]:
P i = 22.85 i c o r r

3. Results and Discussion

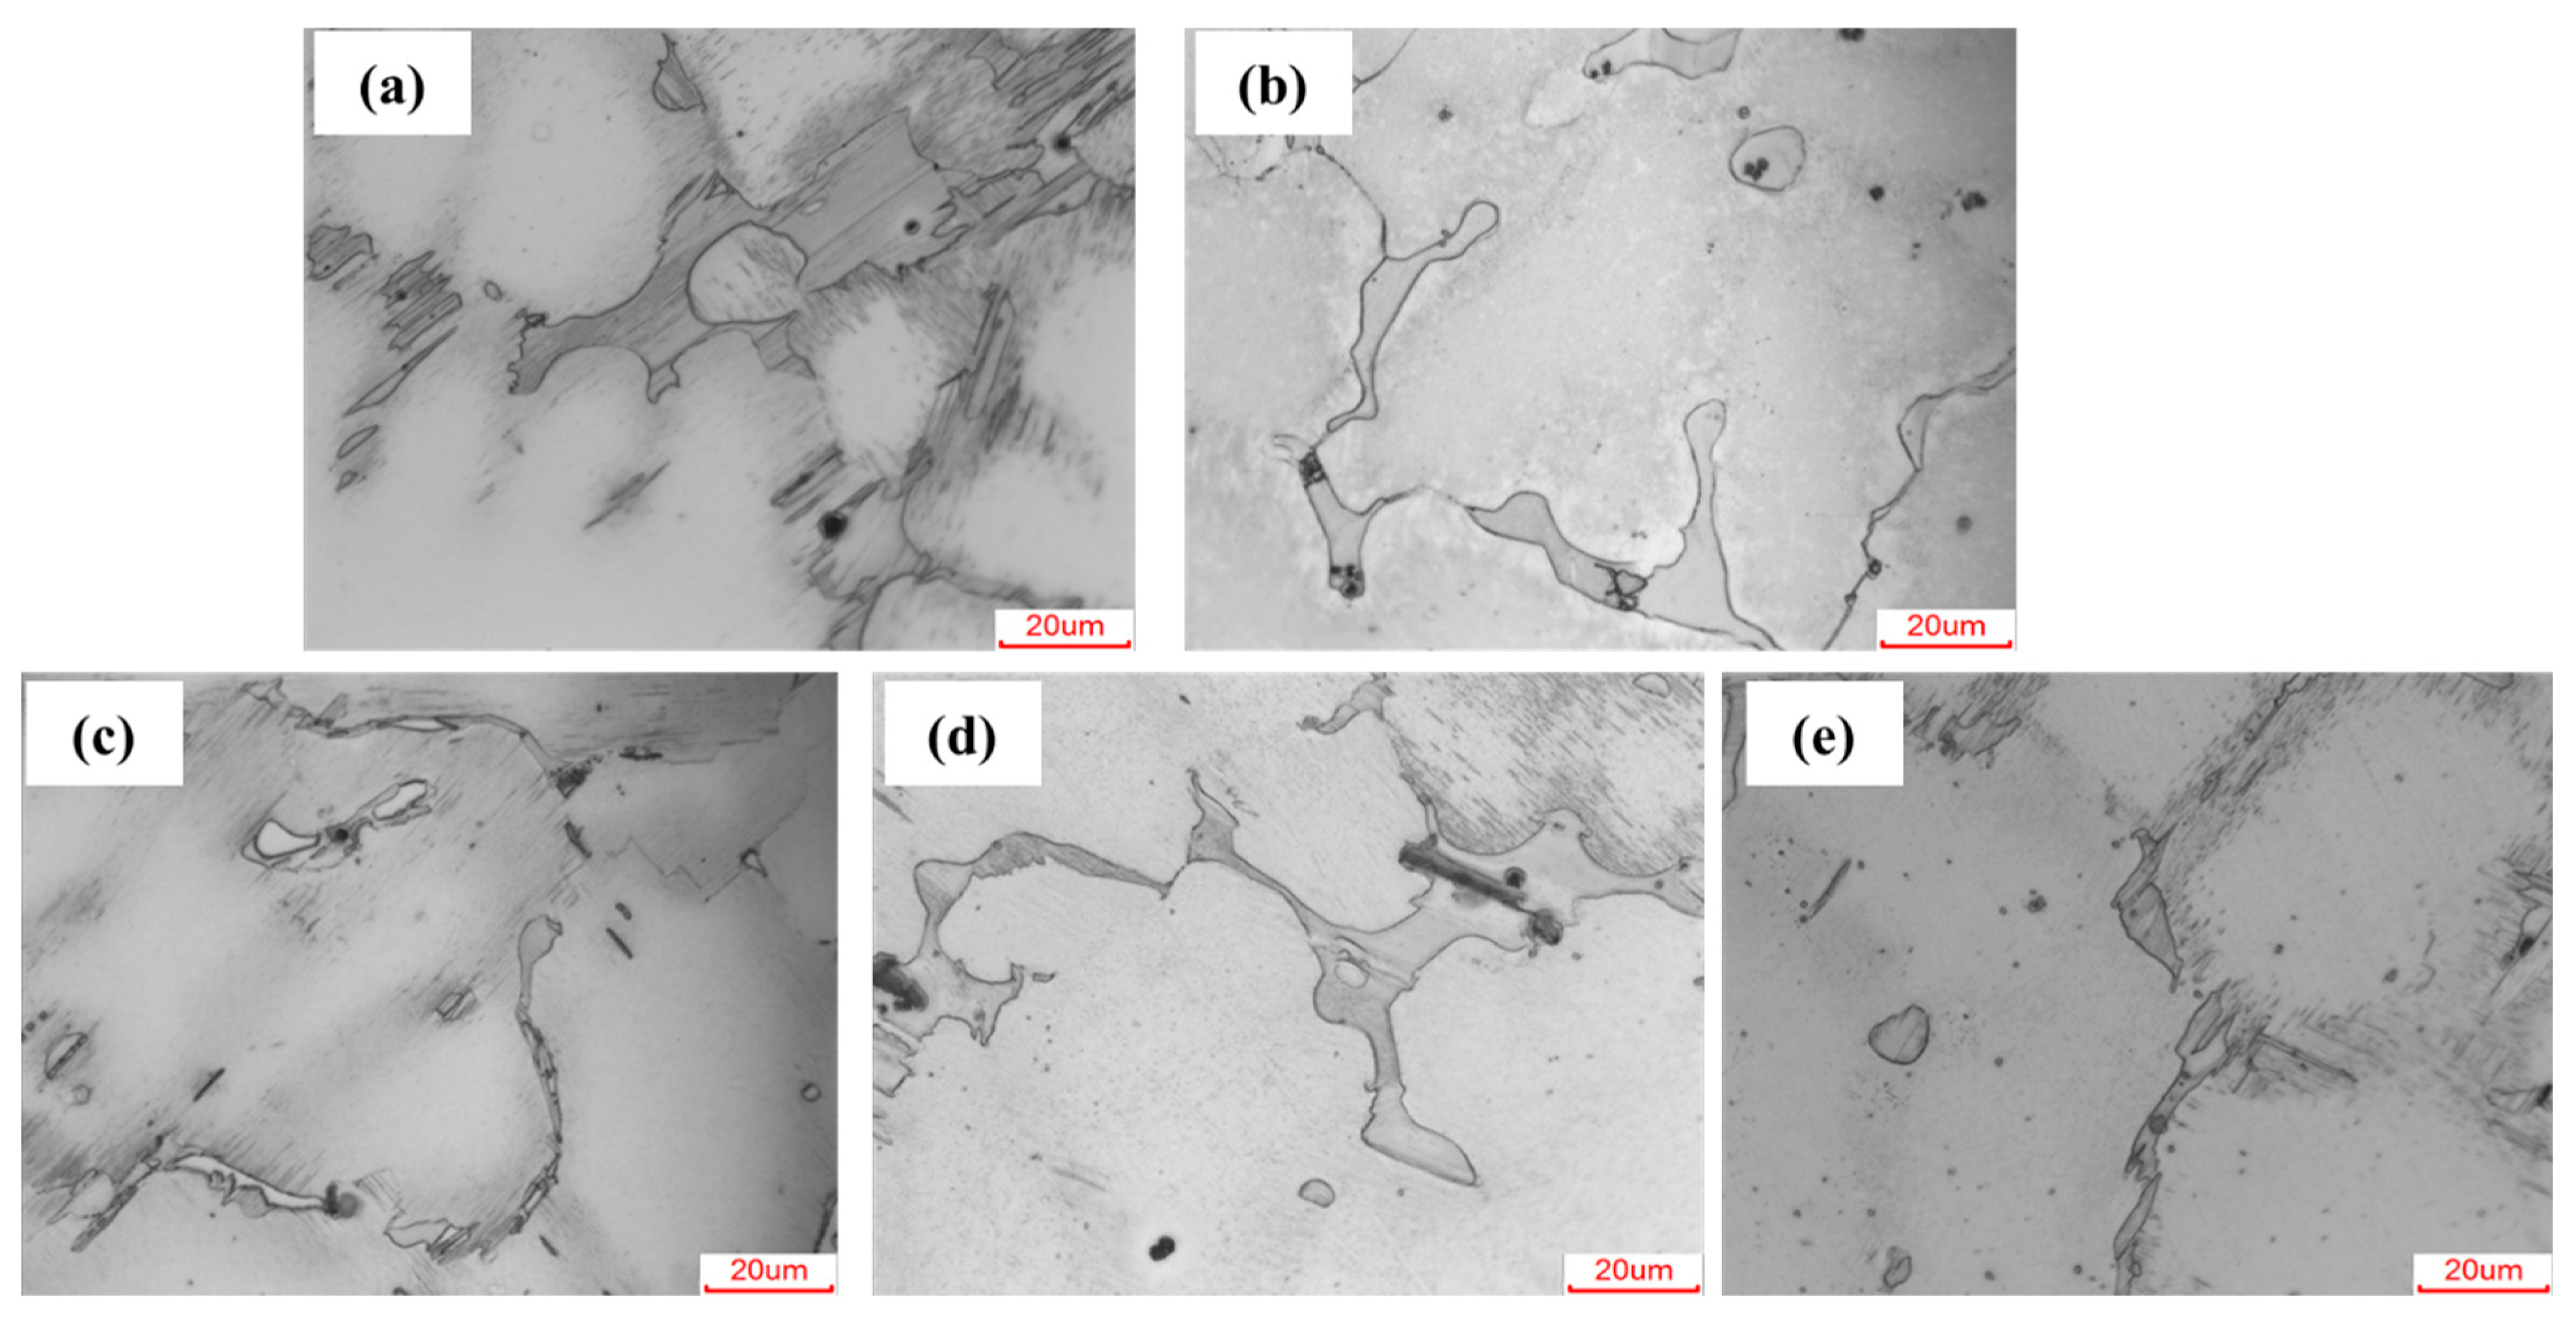
3.1. Microstructure Evolution

The X-ray diffractograms and the microstructure of Mg-Y-Zn-X (X = 0, Ca, Sr, Mn, Zr) alloys are shown in Figure 1 and Figure 2, respectively. The cast Mg-Y-Zn alloy is composed of α-Mg matrix and continuously distributed second phases with 18R LPSO-structured Mg12Yzn [38,39]. As shown in Figure 2a, bulk LPSO phases are predominantly aligned along the grain boundaries, which is consistent with previously reported observations in Mg-Y-Zn alloys [40]. The Ca and Sr additions formed additional second phases (Mg2Ca and Mg17Sr2), as confirmed by both the XRD and SEM-EDS results. These second phases were mainly distributed along the grain boundaries (Figure 2b,c), consistent with prior studies on Mg–Ca and Mg–Sr systems [15,16,17,18,19,23,24,41]. As shown in Figure 2b, the introduction of Ca resulted in a noticeable refinement of the second-phase morphology compared to the as-cast Mg-Y-Zn alloy. In Figure 2c, the Sr-containing alloy exhibits an even more refined and continuous network-like distribution of the second phases. This indicates that the addition of Ca and Sr effectively regulates the precipitation behavior and refinement of the LPSO phase. In contrast, Mn and Zr additions did not introduce new detectable phases but led to a refinement of the existing LPSO structure and a reduction in grain size (Figure 2d,e). This microstructural refinement can be attributed to the heterogeneous nucleation effects and solute drag phenomena induced by Mn and Zr, which have been reported to enhance both mechanical and corrosion properties in Mg alloys [11,26,42].

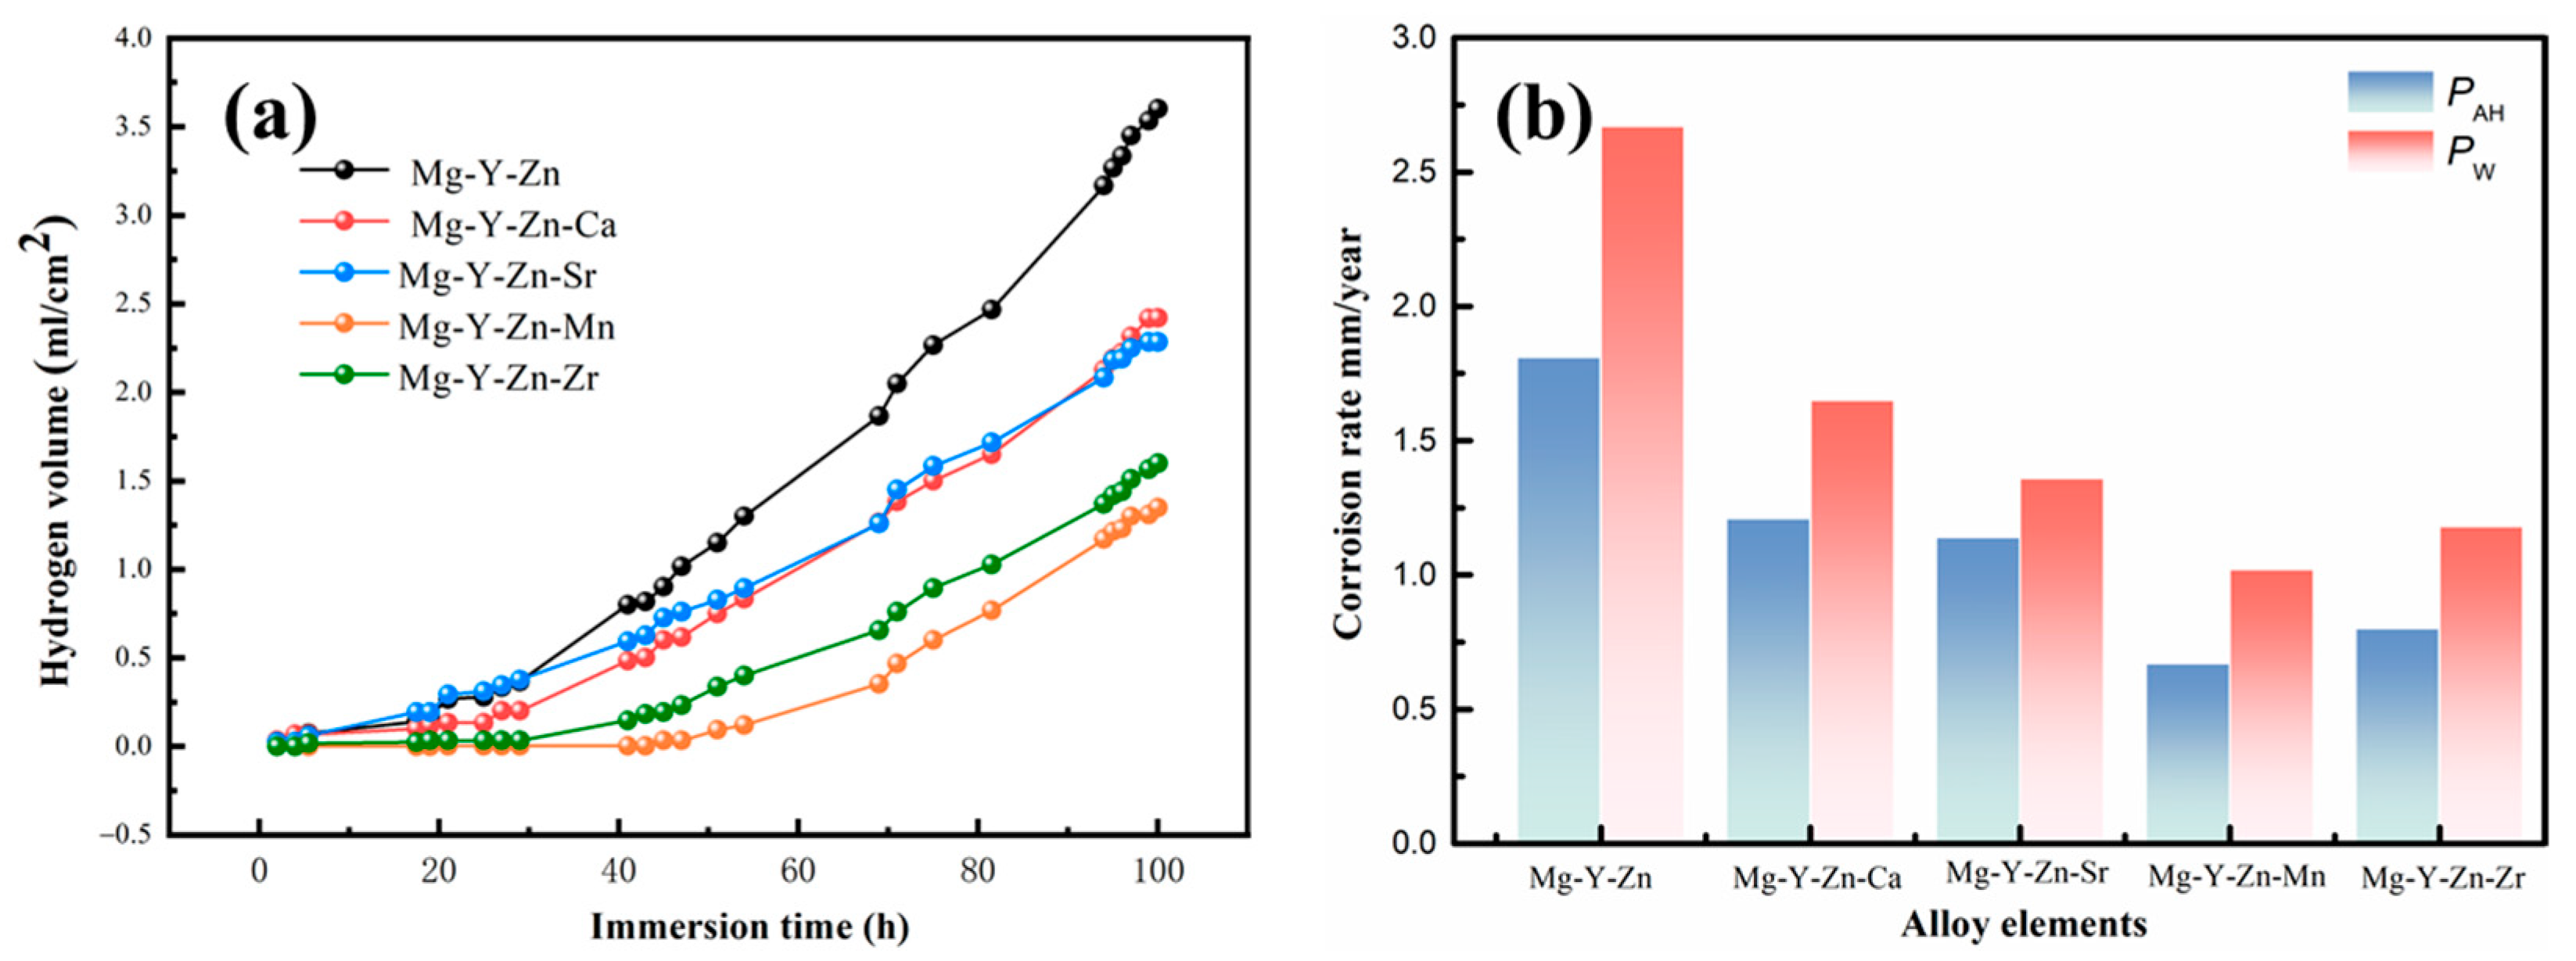
3.2. Corrosion Rates

Figure 3 displays the hydrogen evolution volume and the corrosion rate determined via hydrogen immersion and the weight loss test for Mg-Y-Zn-X alloys after being immersed in 37 °C Hank’s solution for 100 h. For all the samples, the evolved hydrogen volume increased slowly during the first 40 h of immersion.
Figure 3a shows the hydrogen evolution curves of five alloy samples soaked for 100 h. The curves can be grouped into three categories: The cast Mg-Y-Zn alloy exhibits the steepest slope and the highest hydrogen evolution per unit area, indicating the most severe corrosion and the poorest corrosion resistance. Mg-Y-Zn-Ca and Mg-Y-Zn-Sr alloys show similar curves with lower slopes compared to the original alloy, suggesting that the addition of Ca and Sr improves corrosion resistance. Mg-Y-Zn-Mn and Mg-Y-Zn-Zr alloys have the lowest hydrogen evolution rate and the highest corrosion resistance during the entire immersion process.
Figure 3b compares the corrosion rates of the five alloys measured by weight loss and hydrogen evolution methods. The addition of alloying elements significantly reduces corrosion rates compared to the original Mg-Y-Zn alloy, which has a corrosion rate of 2.67 mm/year. The corrosion rates of Mg-Y-Zn-Ca and Mg-Y-Zn-Sr alloys are 1.65 mm/year and 1.36 mm/year, reduced by 38% and 49%. The corrosion rates of Mg-Y-Zn-Mn and Mg-Y-Zn-Zr alloys are the lowest at 1.02 mm/year and 1.18 mm/year, representing reductions of 61.7% and 55.8%, respectively. These improvements in corrosion resistance are attributed to the influence of alloying elements on the microstructure, the surface state, and corrosion kinetics of the material [43,44]. By adding alloying elements, the grain size of the material, the type and distribution of the second phase have changed, thereby affecting the germination and expansion stages of micro galvanic corrosion at the solid–liquid interface and ultimately affecting the overall corrosion resistance of the material [4,10,15,45].

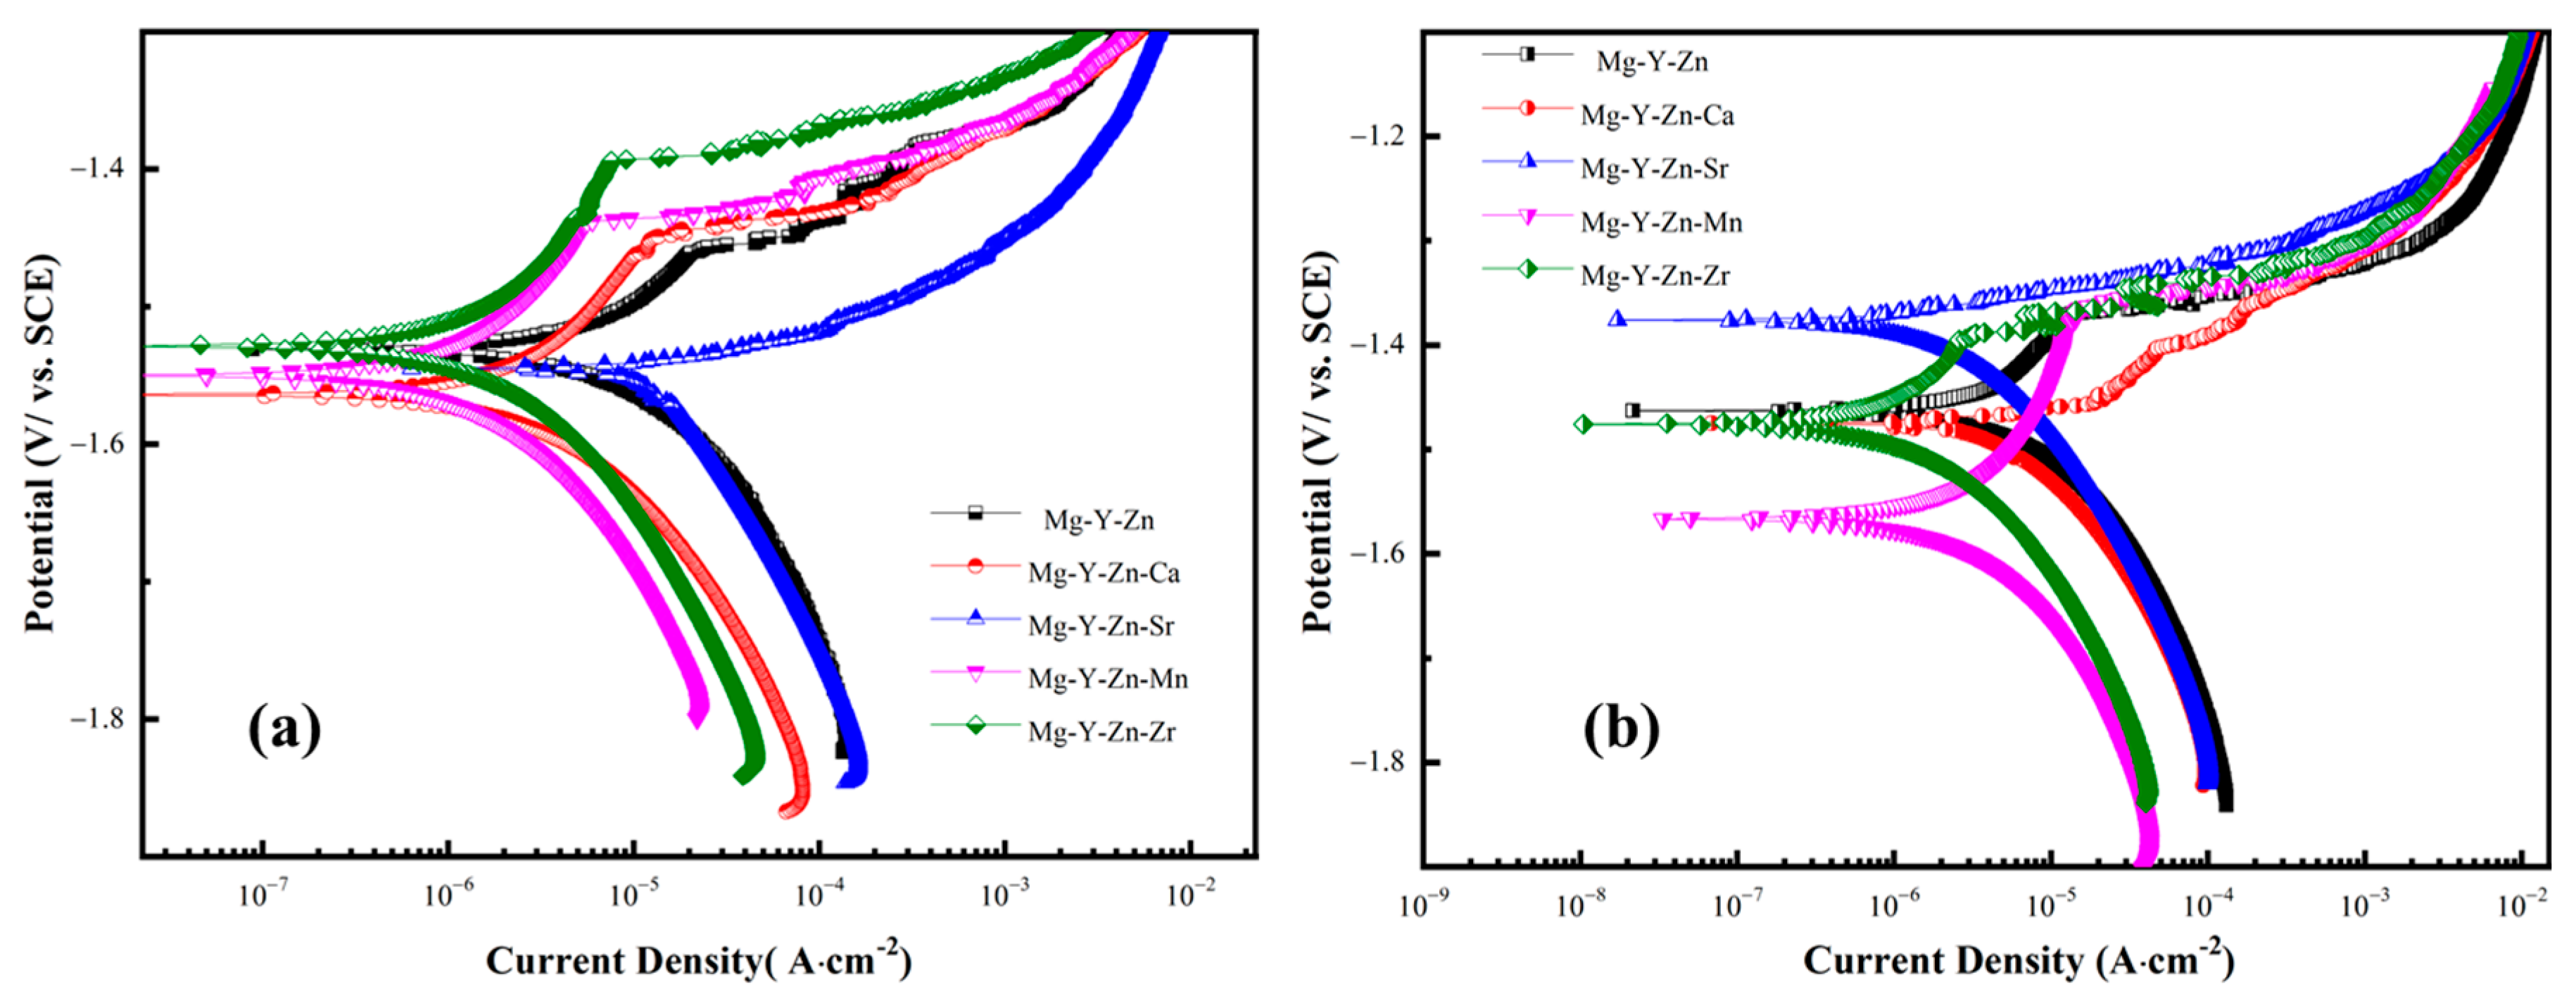
3.3. Electrochemical Responses as a Function of Processing

Figure 4a shows the polarization curve (PDP) of Mg-Y-Zn-X alloy at OCP through dynamic potential scanning. Table 3 summarizes the detailed electrochemical parameters calculated from the PDP curve. From the figure, it can be seen that the five alloys exhibit different PDP characteristics. The addition of alloying elements causes changes in the cathodic polarization curve and anodic polarization curve trends of Mg-Y-Zn alloy, indicating that micro-alloying affects the corrosion kinetics process during the initial immersion stage.
The cathodic polarization trend of Mg-Y-Zn-Sr alloy is very similar to that of Mg-Y-Zn alloy, but the corrosion potential of Mg-Y-Zn-Sr alloy is lower. Meanwhile, compared with the other three microalloyed samples, Mg-Y-Zn-Sr alloy has the highest corrosion current density, icorr of 18.9 μA·cm−2. The microalloying of Sr elements has an impact notably on the anodic polarization process, showing marked anodic active dissolution characteristics, with a downward shift in the polarization curve and no pitting potential [23]. The rapid increase in exchange current density with rising polarization potential is attributed to changes in the material’s surface microstructure [46]. An analysis of the second phase in the alloy reveals that the Mg-Y-Zn-Sr alloy forms a eutectic phase Mg17Sr2, alongside the 18R LPSO phase. The observed increase in corrosion current density suggests that the presence of the Mg17Sr2 phase enhances the hydrogen evolution process during the early immersion stage.
After microalloying with Ca, Mn, and Zr elements, both the cathodic polarization and anodic polarization curves of the materials exhibit significant changes. Compared to the Mg-Y-Zn alloy, the polarization current density of Ca, Mn, and Zr alloyed samples has greatly reduced. The order of corrosion current density for the four samples is icorr Mg-Y-Zn-Mn < icorr Mg-Y-Zn Zr < icorr Mg-Y-Zn-Ca < icorr Mg-Y-Zn, indicating that the alloying with these three elements effectively suppresses cathodic activity. From the anodic polarization curve, overall, the addition of Ca, Mn, and Zr alloy elements shift the anodic polarization curve to the left and increases the pitting potential Epit. The appearance of the pitting potential is associated with the formation of a protective surface film during the corrosion process. Generally, the protection performance of the corrosion product film on the material surface is related to the potential difference ΔE between the pitting potential Epit and the corrosion potential Ecorr. The higher ΔE = EpitEcorr, the better the protection performance of the surface film [47,48]. According to the data in Table 3, ΔEMg Y-Zn is 68 mV, ΔEMg Y-Zn-Ca is 114 mV, ΔEMg Y-Zn-Mn is 115 mV, and ΔEMg Y-Zn-Zr is 130 mV, indicating that the addition of Ca, Mn, and Zr elements enhances the formation of a stable and protective corrosion product film on the material surface during the polarization process.
To further investigate the corrosion kinetics of Mg-Y-Zn-X alloys, polarization tests were performed after 30 h of immersion, as shown in Figure 4b. The corresponding electrochemical parameters are summarized in Table 4.
The PDP curve of Mg-Y-Zn alloy after 30 h’ immersion shows no significant deviation from the initial curve, indicating a stable electrochemical state throughout the immersion period. The ΔE for Mg-Y-Zn is approximately 90 mV, suggesting that the oxide film formed on the alloy surface continues to provide a certain level of protection during the prolonged immersion. Notably, compared to the Mg-Y-Zn-Sr alloy, the Mg-Y-Zn-Ca alloy exhibits a marked reduction in both cathodic corrosion current density and anodic dissolution rate during the initial immersion period. This suggests that the small amount of Mg2Ca phase in the Mg-Y-Zn-Ca alloy inhibits the cathodic function of the 18R phase to some extent, which in turn lowers the initial hydrogen evolution rate and suppresses the anodic dissolution of the matrix. After 30 h, the PDP curve of Mg-Y-Zn-Ca alloy shifted notably to the right, indicating that the polarization reaction between the anode and cathode was activated and intensified with the prolonged corrosion process. The increase in corrosion current density after 30 h correlates with enhanced hydrogen evolution, as shown in the hydrogen evolution curve (Figure 3a). Additionally, the relatively fast anodic dissolution rate during the polarization process suggests significant consumption of the Mg matrix, leading to intensified corrosion in the later stages of immersion.
For Mg-Y-Zn-Sr alloy, the PDP curve remained consistent throughout the immersion period, indicating stable corrosion behavior driven by the microelectrochemical coupling between α-Mg and the second phase. Compared to Mg-Y-Zn alloy, the PDP curve of Mg-Y-Zn-Sr shifted to the left, with a marked increase in corrosion potential and a significant decrease in corrosion current density, demonstrating improved corrosion resistance. The effect of 30 h of immersion on the PDP curve of Mg-Y-Zn-Mn alloy is mainly manifested in increasing the pitting potential of the material. A ΔE of approximately 200 mV indicates enhanced protection by the surface oxide film, consistent with previous studies that suggest Mn addition helps suppress anodic reaction kinetics, thereby improving corrosion resistance. The PDP curve of Mg-Y-Zn-Zr alloy after 30 h showed similar trends to that of Mg-Y-Zn alloy, with an increase in corrosion potential and a decrease in corrosion current density. ΔEMg-Y-Zn-Zr is about 90 mV, and the decrease in ΔE suggests that the protective properties of the product film are somewhat compromised after extended immersion. The lower corrosion current density showed enhanced corrosion resistance compared with that of Mg-Y-Zn alloy in the same state.

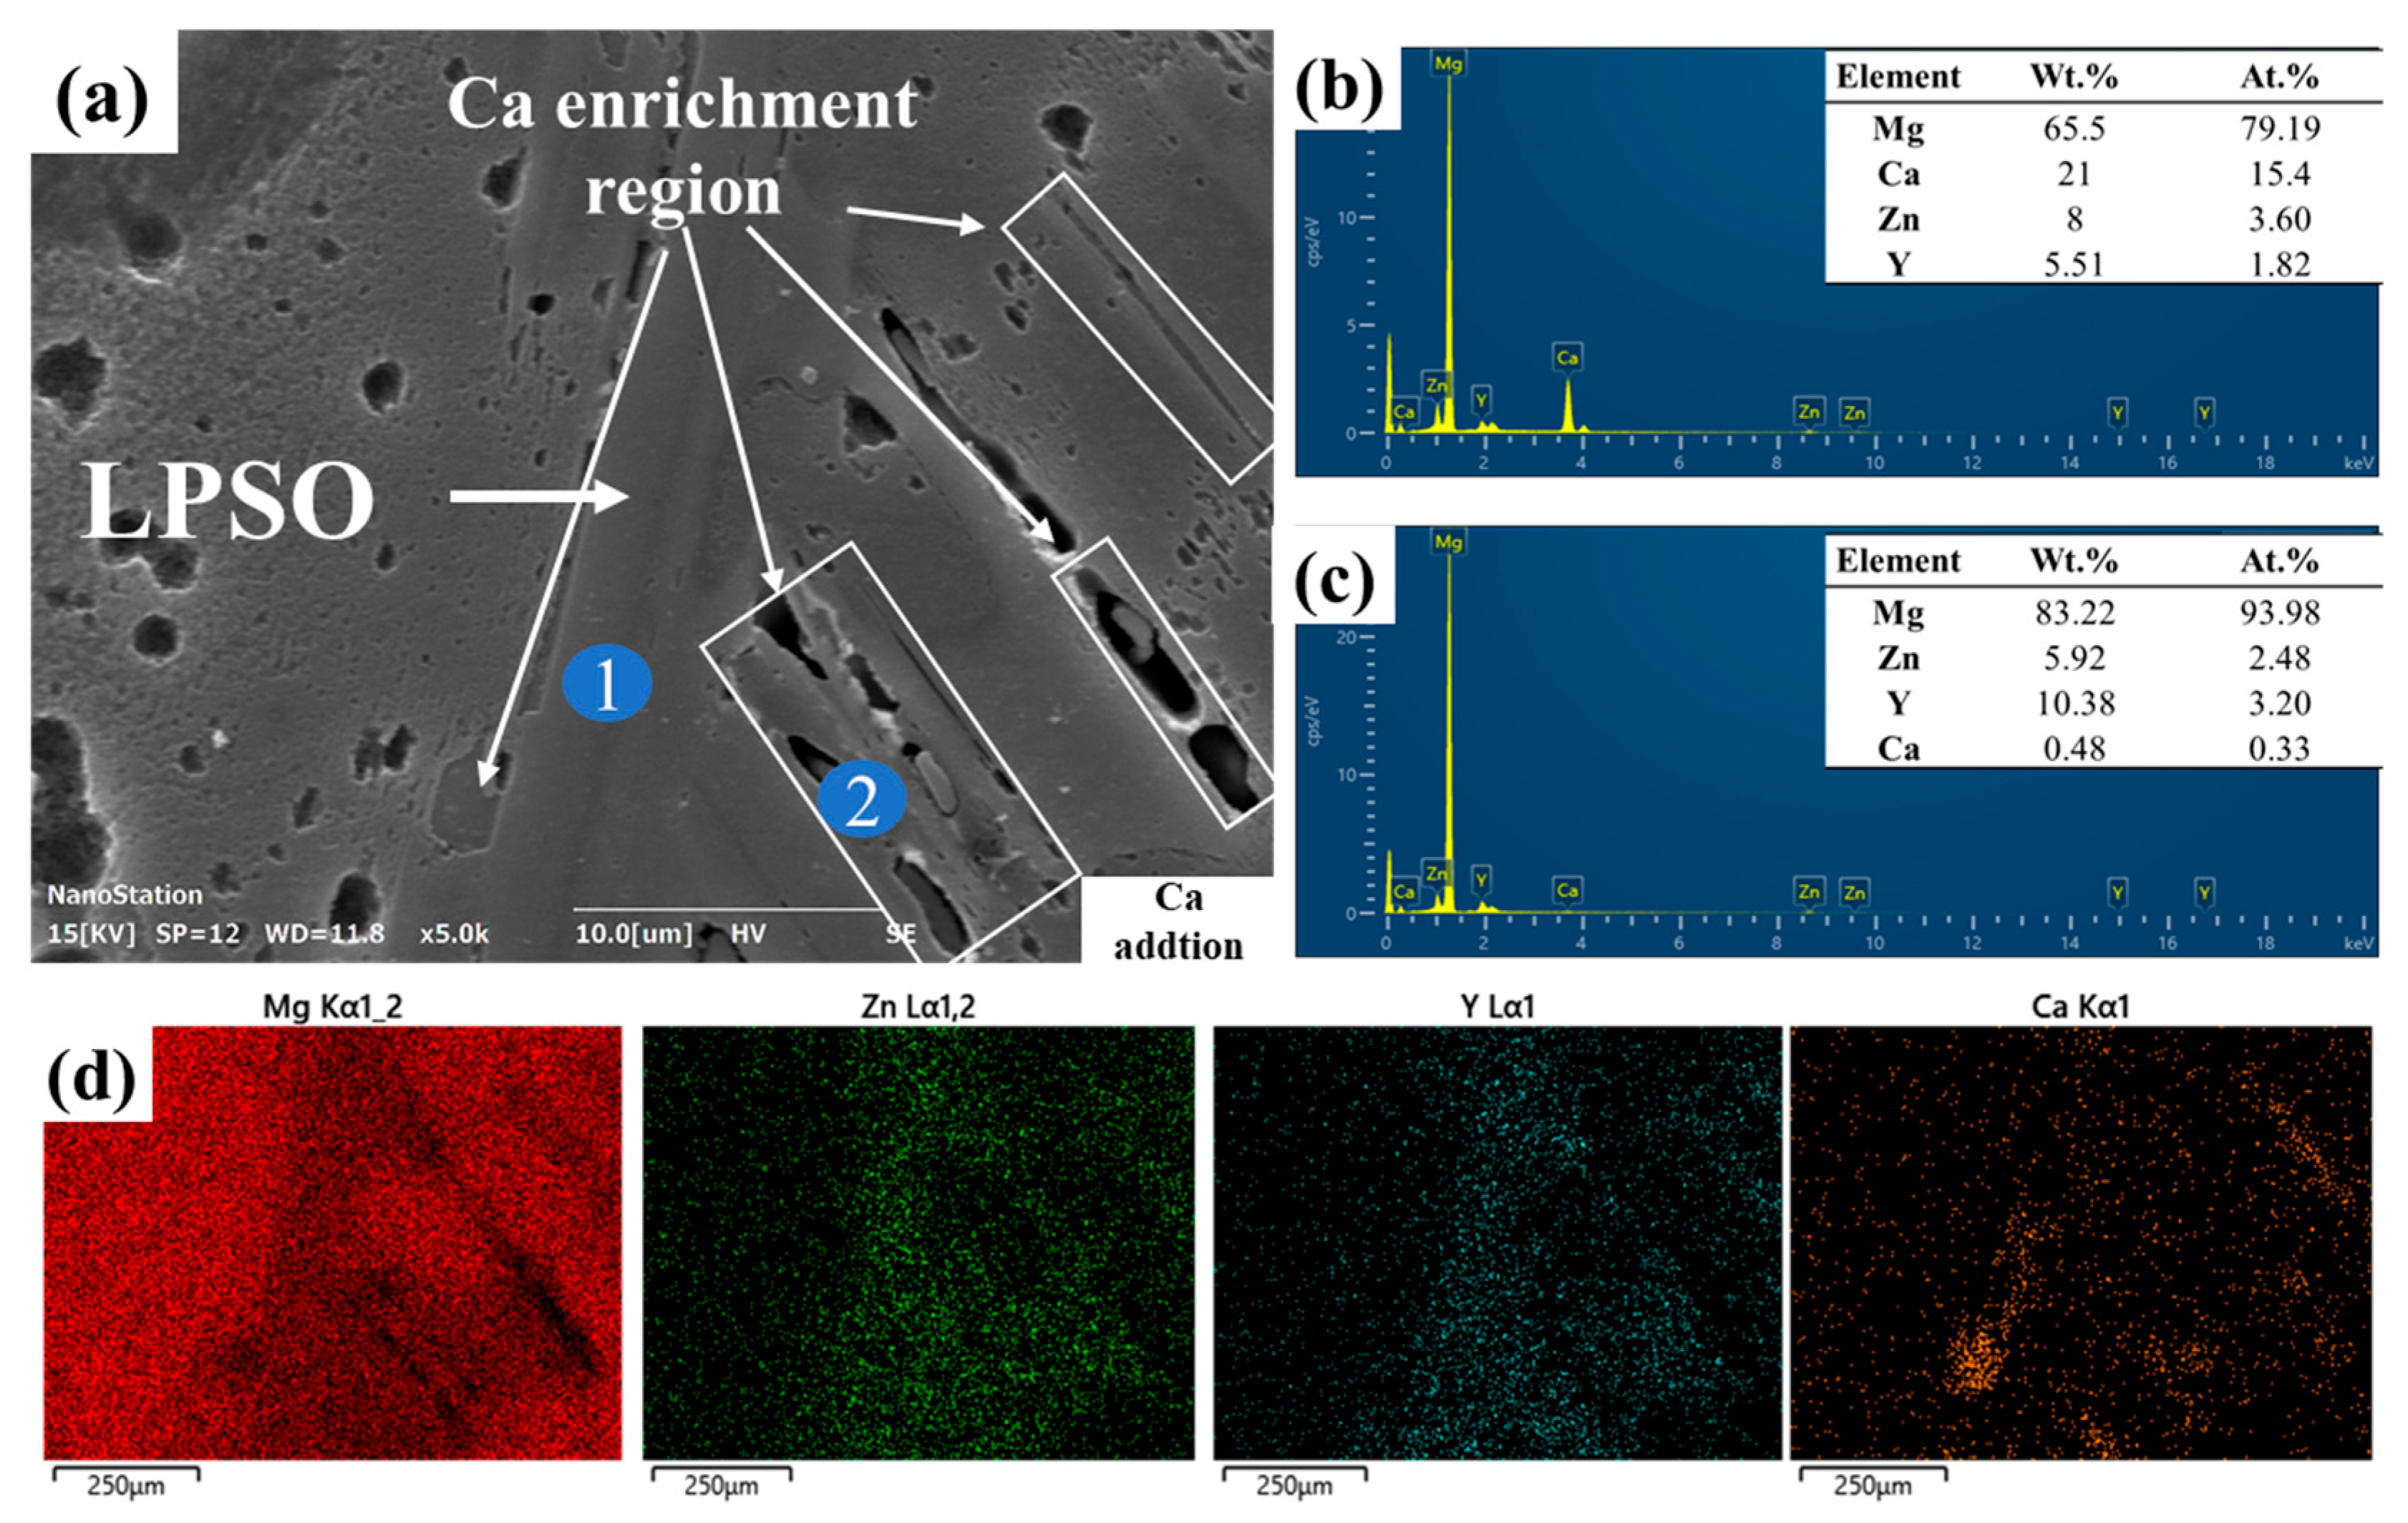
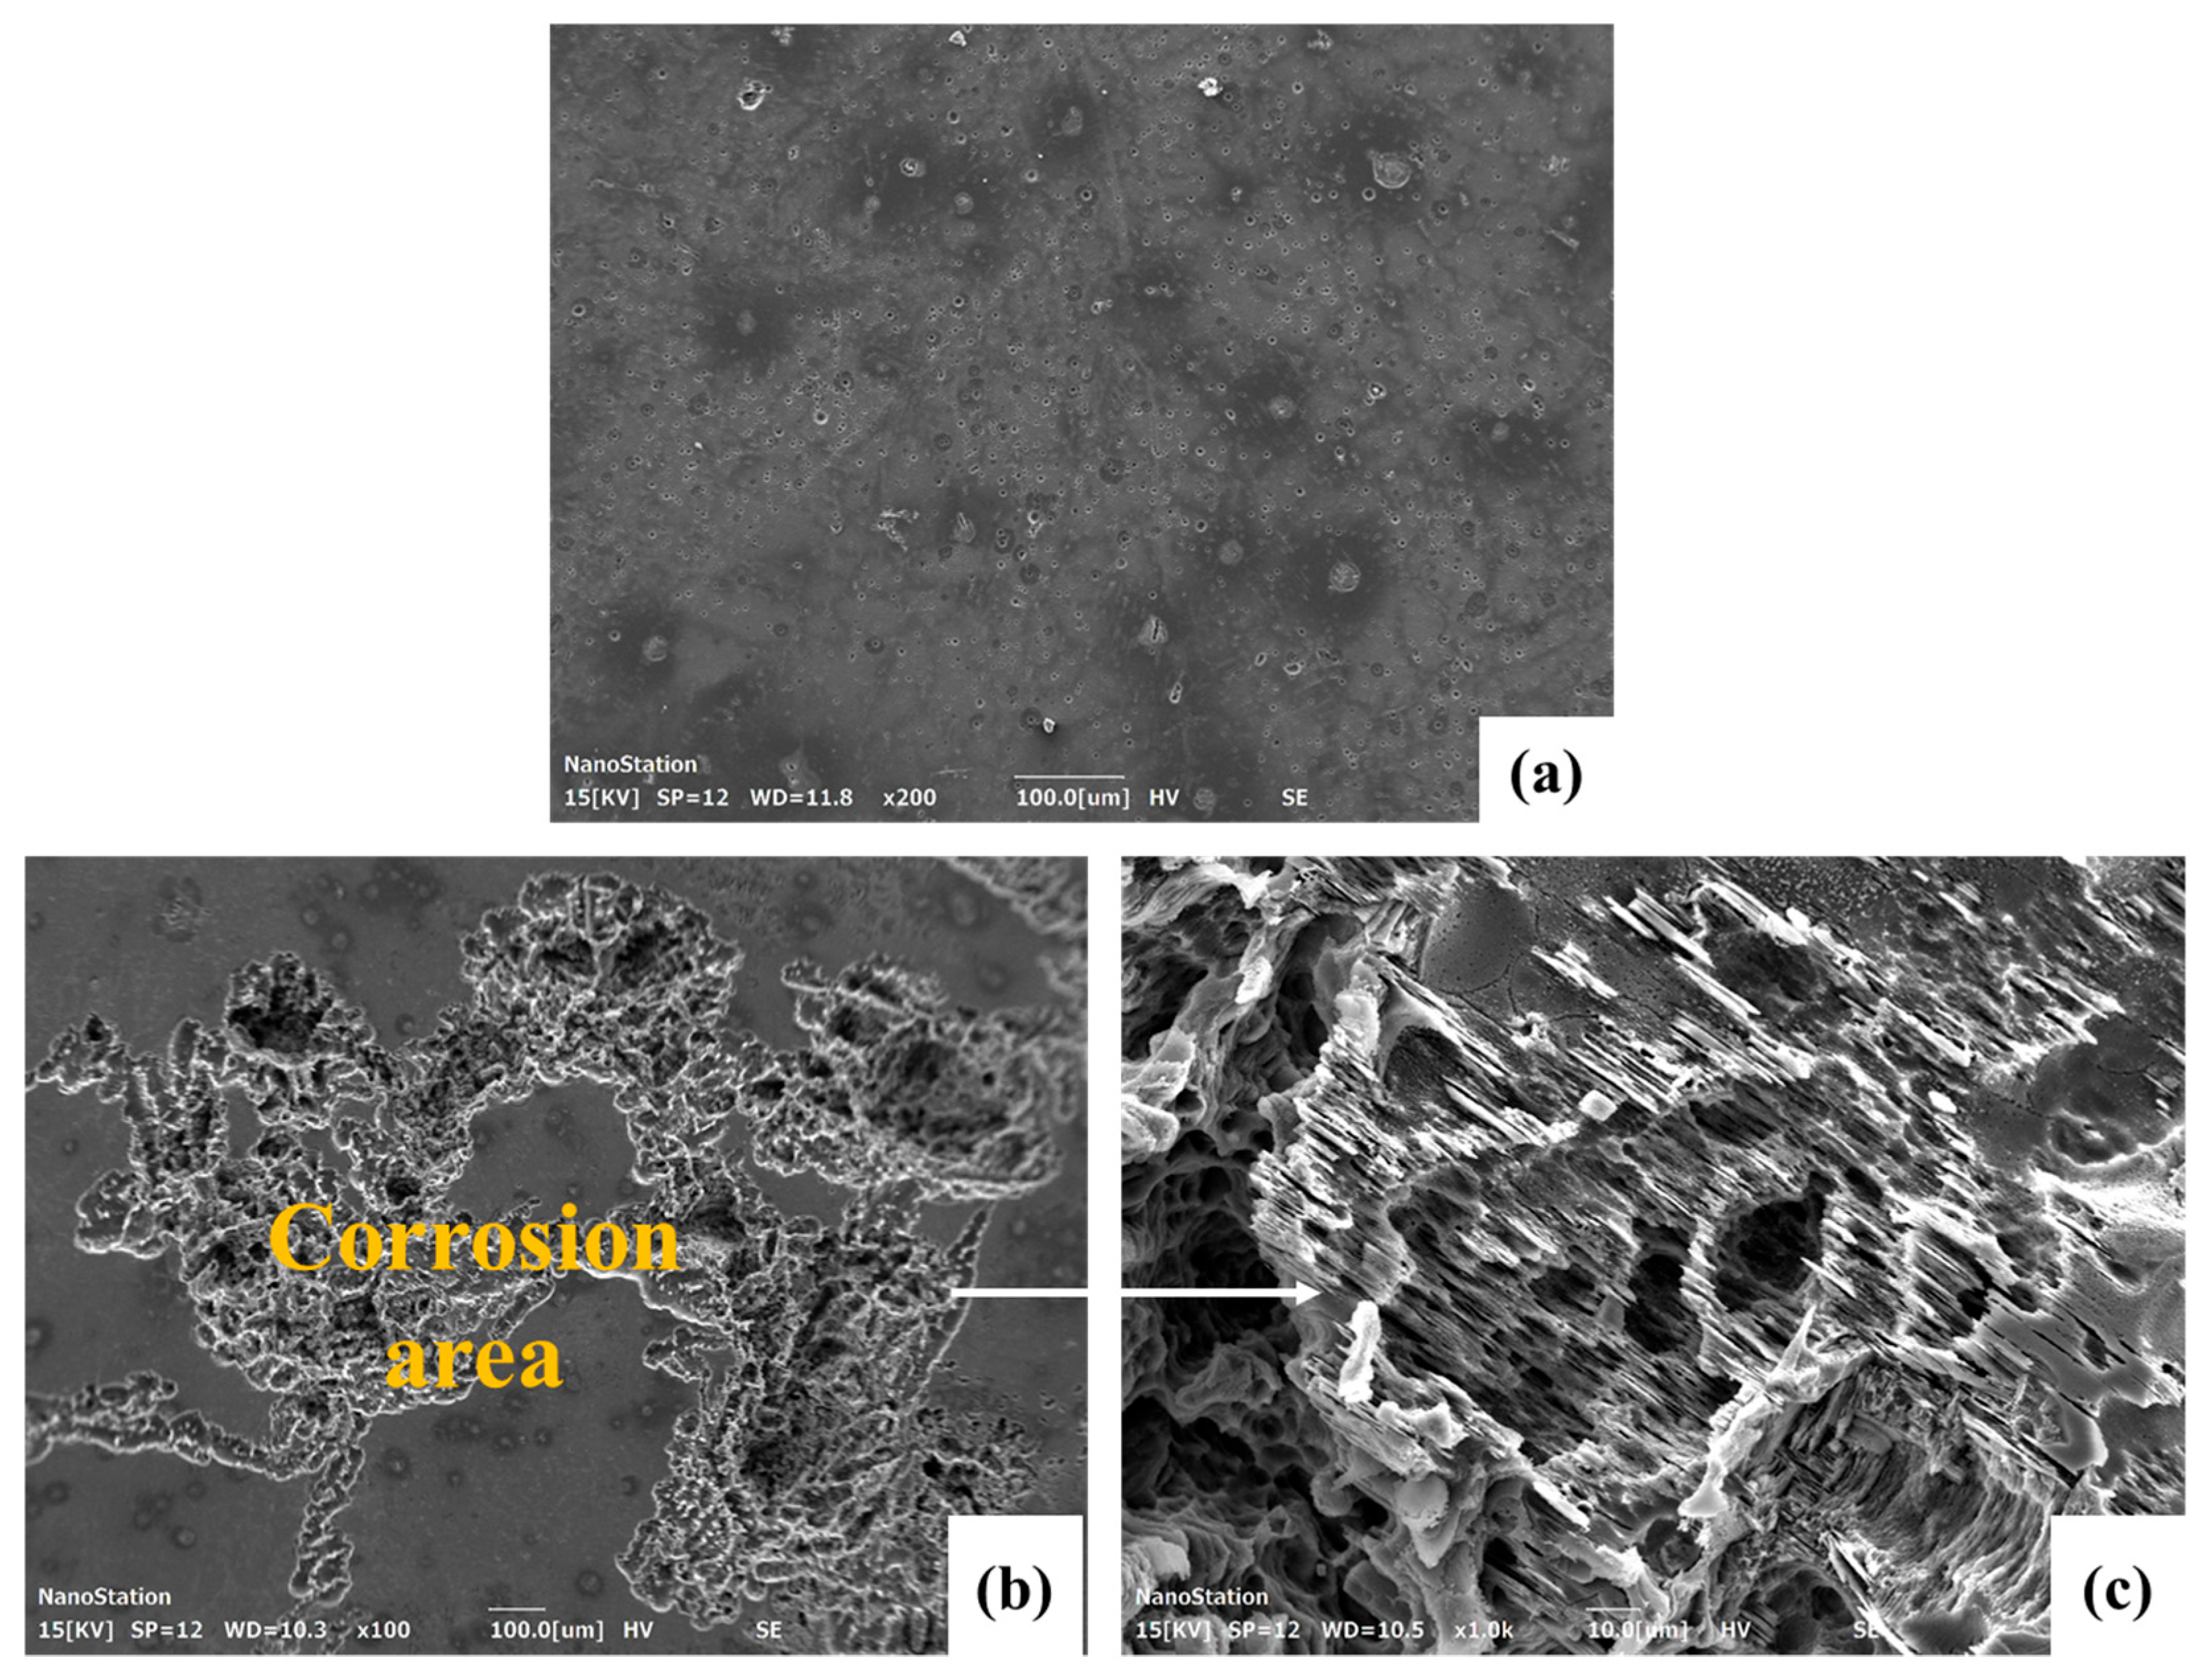
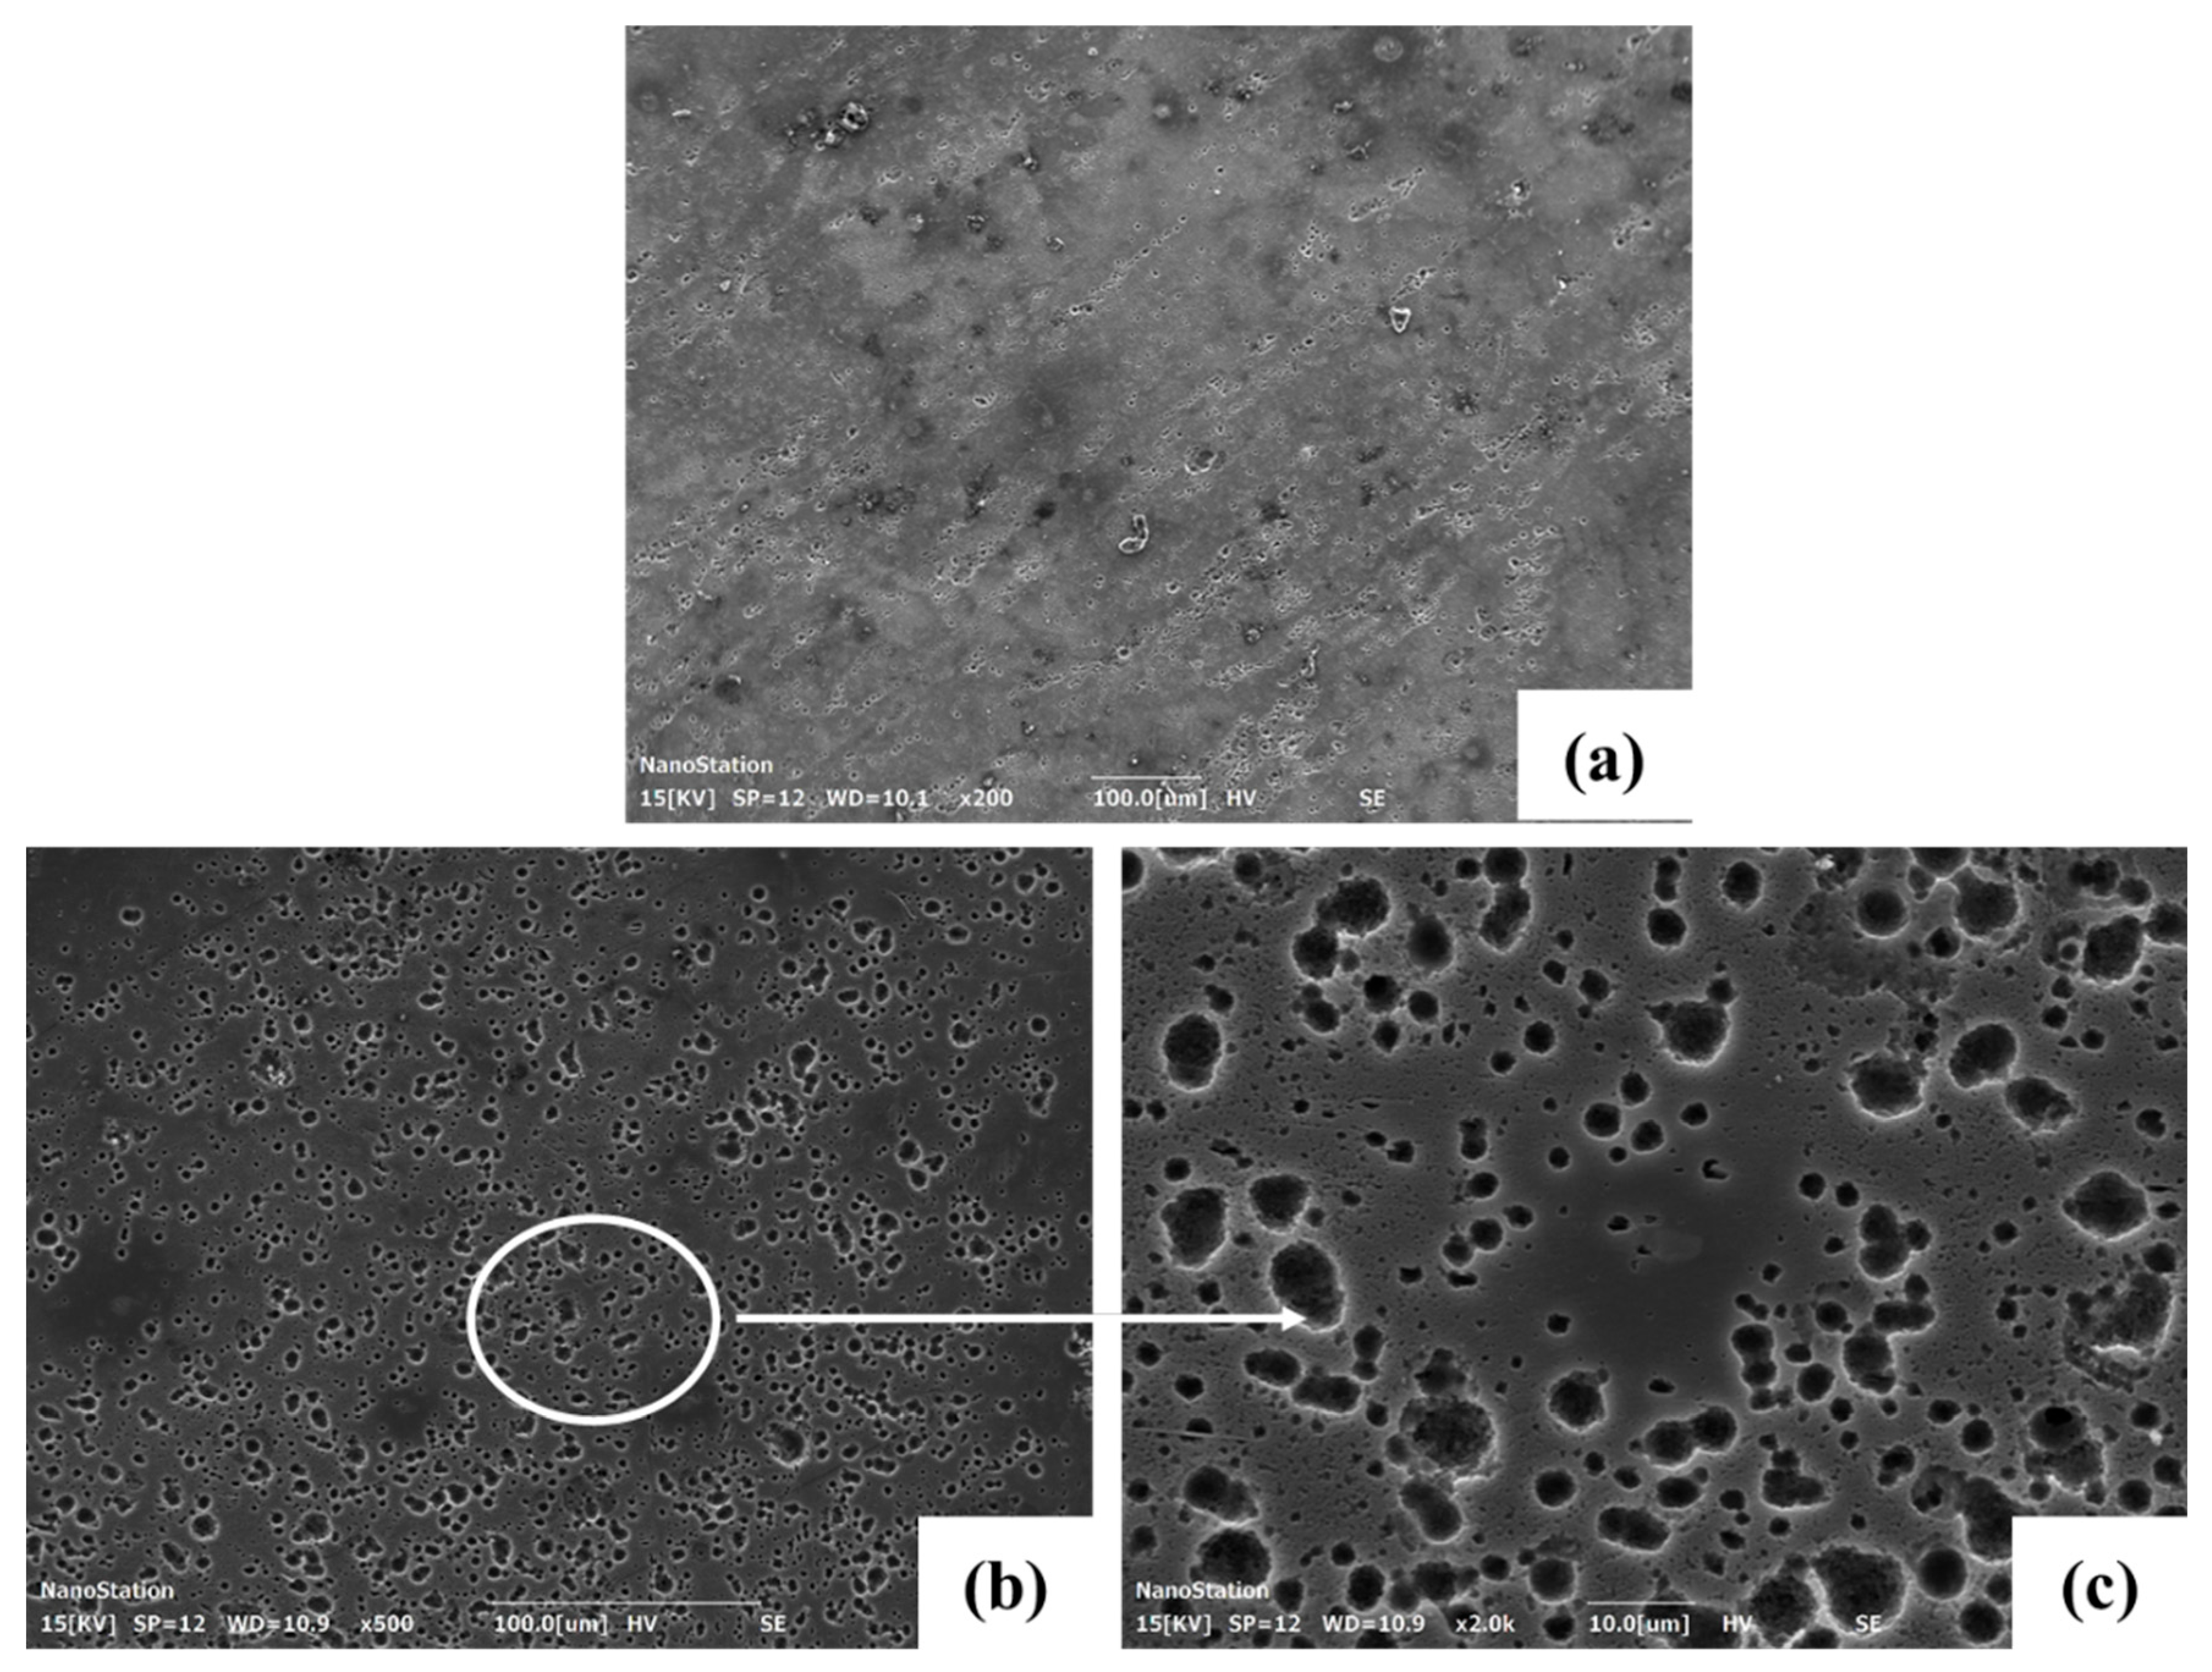
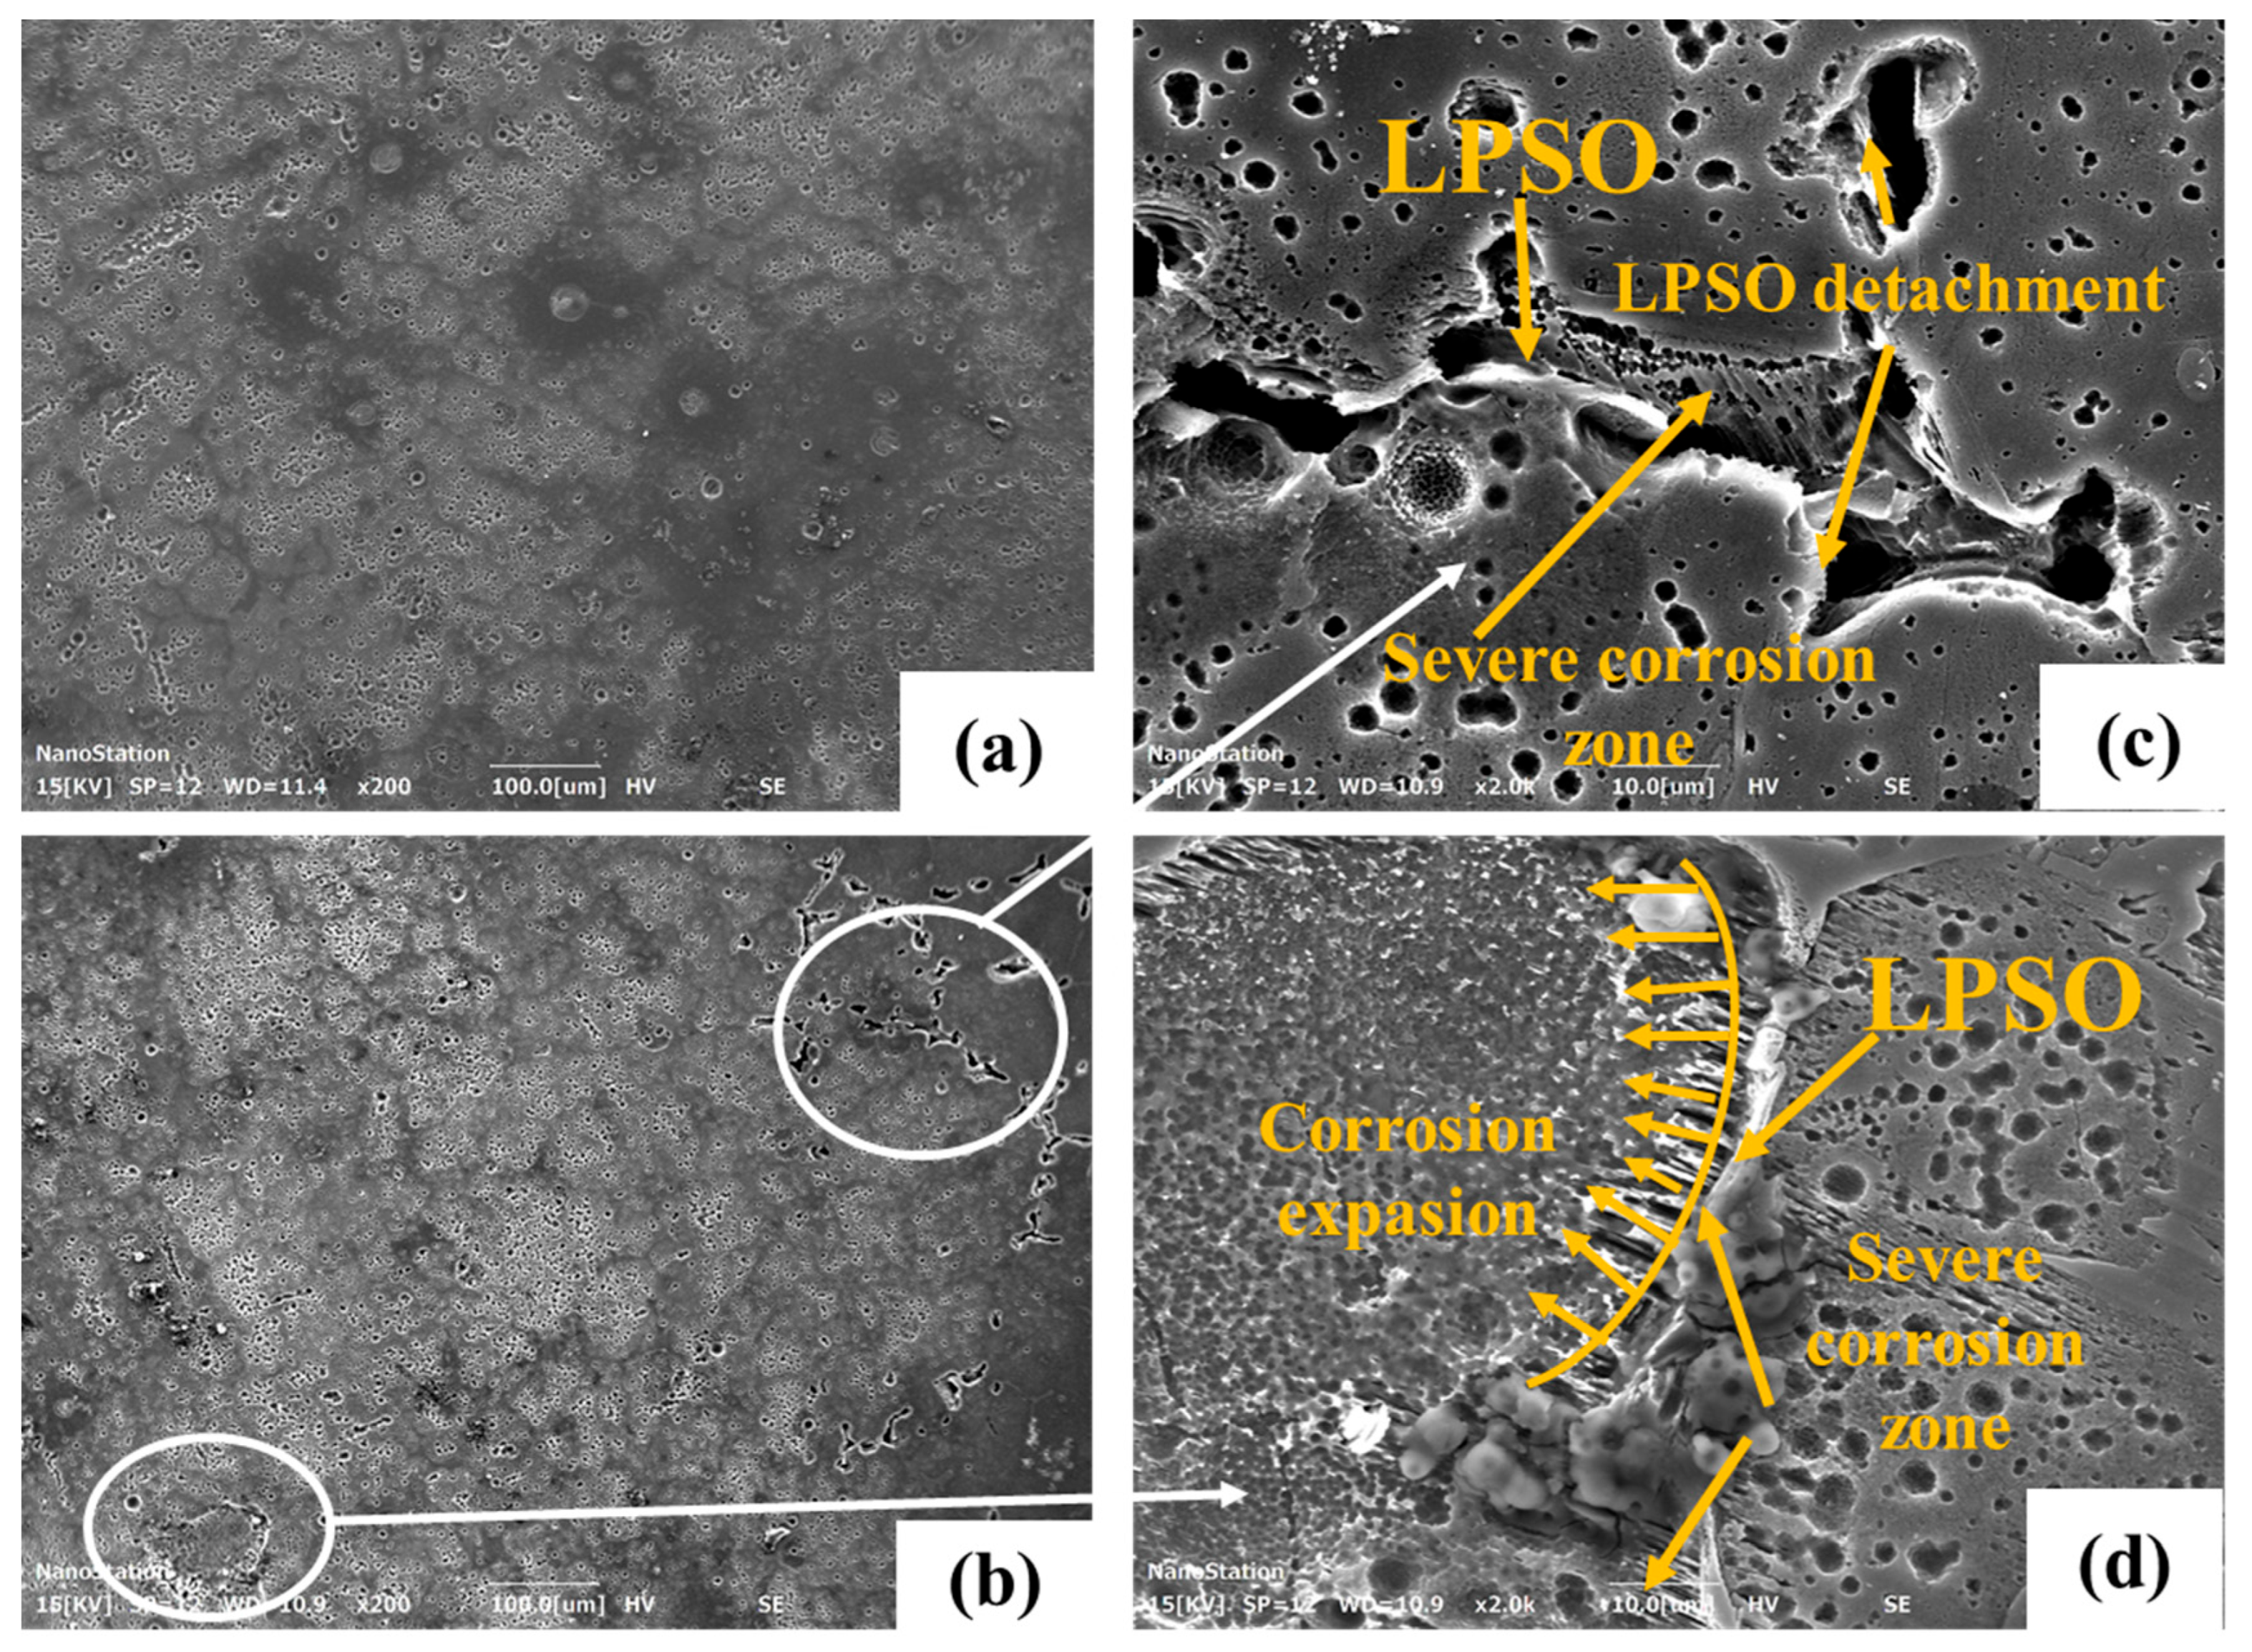
3.4. Corrosion Morphology

Figure 5a–c present the SEM image, EDS point analysis, and elemental mapping of Mg-Y-Zn alloys after immersion in Hank’s solution at 37 °C for 24 h, respectively. As shown in Figure 5a, the corrosion of the α-Mg phase is relatively severe, and a large number of corrosion pits appeared around the matrix. These pits begin to merge, developing into larger and deeper pits, signaling the onset of rapid corrosion. The EDS point analysis in Figure 5b confirms that the corroded regions are enriched in Y and Zn, indicating the presence of the LPSO phase. Furthermore, the elemental mapping shown in Figure 5c clearly reveals the spatial distribution of Mg, Zn, and Y, with Y and Zn concentrated along the 18R phase.The corrosion near the 18R phase is primarily characterized by the formation of corrosion pits, which extend downward along the 18R phase, accompanied by the dissolution of the α-Mg phase, resulting in exposure of the 18R LPSO structure.
Figure 6a shows the SEM image of the corroded surface of the Mg-Y-Zn-Ca alloy after immersion in Hank’s solution at 37 °C for 24 h, where localized corrosion features such as pitting can be observed. Compared with Figure 5, the Mg-Y-Zn-Ca alloy exhibits smaller corrosion pits overall. In addition to the corrosion pits on the α-Mg phase, elongated pits are observed in certain regions, accompanied by traces of second-phase detachment and residual second-phase particles within the pits. As shown in Figure 6b and 6c, EDS point analyses at positions 1 and 2 confirm that these areas are enriched in alloying elements. Elemental mapping results in Figure 6d further reveal that the elongated corrosion regions are rich in solute elements such as Mg, Y, Zn, and particularly Ca, with the second-phase particles inside the pits showing significant Ca enrichment. Compared to Mg-Y-Zn alloy, Mg-Y-Zn-Ca alloy has fewer corrosion pits near LPSO, with corrosion being more prevalent in some Ca-enriched areas. This suggests that the addition of the Ca element suppresses the micro-galvanic corrosion composed of α-Mg and LPSO phases to a certain extent. The driving force for corrosion, initially arising from the α-Mg/LPSO micro-galvanic couple, transforms in the presence of Ca, where Ca-rich second-phase particles are more likely to form micro-galvanic couples with the α-Mg matrix. This leads to a preferential oxidation–reduction reaction at the Ca-enriched regions, thereby accelerating the corrosion process. This analysis highlights the role of second-phase particle composition in the corrosion behavior of Mg alloys.
Figure 7a shows the corrosion morphology of the Mg-Y-Zn-Sr alloy after immersion in Hank’s solution at 37 °C for 24 h. Corroded regions are observed on the surface, with a large number of continuously distributed LPSO phases and gray second-phase particles enriched in Sr. As illustrated by the EDS point analyses in Figure 7b,c, the second-phase particle at position 1 corresponds to the LPSO phase, while the particle at position 2 is identified as the Mg17Sr2 phase. Elemental mapping in Figure 7d further reveals that Sr tends to accumulate near the LPSO phase, especially at localized corrosion sites. Based on the previous PDP curve shown in Figure 5, it can be inferred that substantial dissolution of α-Mg occurred during the 30 h immersion process. Compared with the Mg-Y-Zn and Mg-Y-Zn-Ca alloys, the Mg-Y-Zn-Sr alloy exhibits deeper surface corrosion, consistent with the hydrogen evolution trend observed in Figure 3a. The alloy containing Sr shows the highest hydrogen evolution after 24 h of immersion, indicating a more severe corrosion state. From the perspective of corrosion morphology, no obvious corrosion pits were found on the surface. The dissolution of the Mg matrix near the second-phase structure was evident. This suggests that the LPSO phase within the matrix and the Sr-containing eutectic phase (Mg17Sr2) acted as cathodes during the corrosion process. Based on the microstructure of Mg-Y-Zn-Sr alloy, it can be seen that the addition of Sr alters the type and distribution of the second phase in the material. The LPSO phase within the material becomes refined and assumes a linear distribution, while small Mg17Sr2 particles are uniformly dispersed on the surface. This extensive distribution of the second phase increases the cathodic sites during the initial immersion process, promoting hydrogen evolution at the LPSO/Mg and Mg17Sr2/Mg phase interfaces. The large number of hydrogen evolution sites accelerates the corrosion process during the early stages of corrosion. Furthermore, due to the unique morphology and spatial distribution of the second phases, corrosion preferentially propagated along the interfaces between the α-Mg matrix and the surrounding intermetallic structures. This behavior is attributed to numerous micro-galvanic cells formed between α-Mg and the more noble LPSO and Mg17Sr2 phase [32,49,50], which accelerate localized anodic dissolution and drive directional corrosion propagation, as shown in Figure 7.
Figure 8 and Figure 9 display the corrosion morphology of Mg-Y-Zn-Mn and Mg-Y-Zn-Zr alloys after being immersed for 24 h and removing the corrosion products. As shown in Figure 8a and Figure 9a, the corrosion morphologies of the two alloys are similar to that of the Mg-Y-Zn alloy, with corrosion pits of varying sizes distributed across the material surface. Compared to Figure 8a, the corrosion pits on the Mg-Y-Zn-Mn alloy’s surface are shallower, while the corrosion in the Mg-Y-Zn-Zr alloy (Figure 9a) is less pronounced, indicating a milder corrosion state in both alloys.Additionally, small and uniform corrosion pits are observed around the LPSO phase in both the Mg-Y-Zn-Mn and Mg-Y-Zn-Zr alloys, which also reflects the cathodic effect of LPSO structure corrosion in the magnesium matrix. EDS point analysis in Figure 8b and Figure 9b confirms the elemental composition of typical corroded regions. Specifically, point 1 in both figures corresponds to the LPSO phase. The elemental mapping in Figure 8c and Figure 9c further reveals the distribution of Mg, Zn, Y, and Mn or Zr. It is noteworthy that in Figure 8a and Figure 9a, heavily corroded areas appear on the α-Mg phase of the alloys, while the corrosion pits near the LPSO structure are smaller. The corrosion pits on the α-Mg substrate in Figure 8a begin to connect with each other to form larger diameter corrosion pits. In Figure 9a, the corrosion pits on the α-Mg matrix are deeper, indicating that corrosion has propagated on the surface. This may be attributed to the microstructural characteristics of the alloys. While the addition of trace amounts of Mn and Zr elements did not change the second-phase type in the Mg-Y-Zn alloy, these elements introduced significant crystallographic defects, such as dislocations, near the second-phase particles, as shown in Figure 2d,e. The presence of these dislocations near the LPSO phase likely promotes the corrosion of the magnesium matrix.

4. The Influence of Microalloying on the Corrosion Process

Figure 10 shows the corrosion morphology of the Mg-Y-Zn-Ca alloy at different corrosion periods after immersion for 30 and 72 h. It can be seen that, after 30 h of immersion, the overall surface remains relatively intact. Shallow corrosion pits can be detected on the surface at this stage. With a prolonged immersion time to 72 h, corrosion intensifies, with some areas developing deeper pits and forming a corrosion morphology characterized by spiraling patterns emanating from specific corrosion sites. From the magnified image of a localized corrosion area in Figure 10c, it can be inferred that the corrosion process in the Mg-Y-Zn-Ca alloy progresses downward along the network-like distribution of the second phase. The hydrogen evolution curve in Figure 3 shows that during the first 30 h of immersion, hydrogen evolution in the Mg-Y-Zn-Ca alloy remains relatively low. After 30 h, the hydrogen evolution rate increases significantly, which correlates with changes in the second-phase composition due to the addition of Ca. The presence of a small amount of Mg2+Ca on the surface initially acts as an anode during galvanic corrosion, protecting the magnesium matrix by dissolving the anodical particles [51,52]. However, as immersion time increases, the protective effect of Mg2Ca diminishes. At this stage, galvanic corrosion dominated by the α-Mg matrix and the 18R-type LPSO structure becomes the primary mechanism, accelerating localized corrosion. The corrosion process extends deeper along the network-distributed LPSO phase, resulting in the corrosion morphology observed in Figure 10b,c.
The microalloying of Sr affects the type and distribution of the second phase in Mg-Y-Zn alloys [45]. Due to the low solubility of Sr in magnesium, its solubility under equilibrium conditions is approximately 0.11%. As a result, the addition of small amounts of Sr readily leads to the formation of the Mg17Sr2 eutectic phase within the matrix. The introduction of Sr influences the formation of the LPSO phase within the matrix, as shown in Figure 2c and Figure 7. Liu et al. also reported that Sr alloying can inhibit the growth of the LPSO phase inside the matrix [53]. In this study, the addition of Sr refined the LPSO phase, causing it to connect in fine strip-like structures and become uniformly distributed in a network within the matrix. Due to the resulting microstructural changes, the Mg-Y-Zn-Sr alloy exhibits distinct corrosion morphology characteristics during immersion, as shown in Figure 11.
Figure 11a,b show the surface corrosion morphology of the Mg-Y-Zn-Sr alloy after immersion in Hank’s solution for 30 h and 72 h, respectively, while Figure 11c presents a magnified view of a corrosion region from Figure 11b. During the immersion process of Mg-Y-Zn-Sr alloy for 30 to 72 h, corrosion primarily occurs on the material’s surface, without significant penetration into the deeper layers of the matrix. Based on the polarization data shown in Figure 4 it can be concluded that the dissolution of Mg is the dominant reaction during this soaking process. As depicted in Figure 11a, the surface of the material undergoes erosion, leading to the dissolution of the α-Mg matrix, leaving behind numerous small, interconnected white second-phase particles. An analysis of the PDP data under various immersion conditions reveals that as the corrosion time increases, the kinetics of the cathodic reaction are suppressed, leading to a decrease in the polarization current density and a significant increase in the corrosion potential. This indicates that prolonged immersion effectively suppresses the corrosion expansion of the Mg-Y-Zn-Sr alloy, reducing the depth of corrosion pits and promoting more uniform corrosion. The addition of Sr to the alloy enhances its overall biological corrosion resistance throughout the immersion process. Further examination of the corroded area reveals a smooth transition between the corroded and uncorroded regions. The α-Mg matrix, which begins to peel off, is observed near the second-phase particles that are distributed in a network structure. Corrosion continues to corrode the α-Mg matrix along these second-phase particles, causing the corrosion area to gradually expand across the material surface.
The solubility of Mn in magnesium in equilibrium is relatively low at 0.95 at.%. According to the Mg-Mn phase diagram and thermodynamic calculations, no Mg-Mn intermediate phase is formed during the alloying process with Mn. Studies have shown that small amounts of Mn can inhibit the cathodic reaction kinetics of the electrochemical system [7,42]. Additionally, from the perspective of the corrosion product film on the magnesium alloy surface, the addition of Mn improves the properties and stability of the Mg(OH)2 film [43,54,55,56]. This enhancement increases the protective properties of the corrosion product film, thereby contributing to better corrosion resistance, which is consistent with the findings in this study.
Figure 12 presents the corrosion morphology of Mg-Y-Zn-Mn alloy after immersion for 30 h and 72 h. After 30 h of immersion, several small corrosion pits appeared on the sample surface, and the overall surface remained intact without any severe localized corrosion. With the extension of immersion time, there were no notable changes in the corrosion morphology. The corroded surface is still dominated by small pitting corrosion pits. According to the PDP data, the Mg-Y-Zn-Mn alloy shows similar corrosion kinetics under different immersion conditions. ΔEMg-Y-Zn-Mn increases with prolonged immersion time, indicating a formed stable corrosion product film on the surface, impeding further corrosion [43,57].
From the magnified image of the selected corrosion area in Figure 12c, it can be observed that even after 72 h of immersion, the corrosion depth remains shallow, and the corrosion pits have not merged. The surface is characterized by a dispersed distribution of small pitting corrosion. This suggests that the corrosion propagation of the Mg-Y-Zn-Mn alloy is slow during the soaking process. From the perspective of cathodic reaction kinetics, compared to the original Mg-Y-Zn alloy, the cathodic exchange current density of the Mg-Y-Zn-Mn alloy is significantly reduced, indicating that the microalloying with Mn inhibits the cathodic reaction kinetics. This slows down the overall hydrogen evolution process in the electrochemical system, thereby enhancing the alloy’s biocorrosion resistance.
Similarly, alloying of the Zr element did not change the type of second phase in Mg-Y-Zn alloy. The solubility of Zr in magnesium is about 0.73%, and there is no MgZr intermediate phase between Mg and Zr. Therefore, the addition of small amounts of Zr does not lead to changes in the electrochemical behavior caused by alterations in the second-phase constituents. Through an electrochemical kinetics analysis, the microalloying of Zr can suppress the kinetics of cathodic and anodic reactions in Mg-Y-Zn alloys, thereby improving the corrosion resistance of the matrix phase. This is evident from the polarization curves shown above, where the corrosion current density of Mg-Y-Zn-Zr alloy under various immersion conditions is consistently lower than that of Mg-Y-Zn. Furthermore, the anodic polarization half branch did not show obvious an anodic dissolution phenomenon, and under different immersion conditions, the anodic polarization characteristics still exhibited typical pitting corrosion behavior. It is worth noting that with prolonged immersion time, the ΔE of Mg-Y-Zn-Zr alloy slightly decreases, indicating that the protective performance of the corrosion product film on the material surface decreases with the deepening of the corrosion degree.
Figure 13 shows corrosion morphology images of Mg-Y-Zn-Zr alloy under different immersion states. Figure 13a,b display the macroscopic morphology after 30 h and 72 h of immersion, respectively. Figure 13c,d present magnified views of the corrosion regions selected from Figure 13b, with arrows indicating their corresponding source areas. After 30 h of immersion, the alloy surface exhibits small corrosion pits, indicative of pitting corrosion, which is consistent with the PDP curve results. After 72 h, larger corrosion pits appear due to particle detachment (Figure 13c). Figure 13c,d highlight areas of particle detachment and localized corrosion expansion. It can be seen that severe corrosion is observed near the LPSO phase. Intense corrosion regions are often located near areas with fine stripe structures. The corrosion products accumulate along the LPSO phase, extending into the magnesium matrix. Based on the OM and SEM results of Mg-Y-Zn-Zr alloy, it can be inferred that the dense stacking fault zone near the LPSO phase, which is formed due to the aggregation of solute atoms, accelerates the corrosion process. Meanwhile, the dissolution of Mg matrix and the accumulation of corrosion products disrupted the integrity of the LPSO structure, as shown in Figure 13d. The corroded LPSO structure begins to be damaged, accelerating the corrosion process. As the electrochemical reaction proceeds, corrosion extends deeper along the stacking fault zone, accompanied by the detachment of the corrosion product film. The LPSO phase begins to peel off the substrate, forming the corrosion morphology shown in Figure 13c, in which isolated LPSO structures can be clearly observed, surrounded by a dissolved and peeled matrix, which confirms the above inference. Due to the high electrochemical activity caused by the enrichment of the Zr element, a large number of dislocations occur, resulting in the most severe electrochemical corrosion near the LPSO structure. It has been reported that stacking faults and dislocation-dense zones in the vicinity of intermetallic phases can serve as preferential corrosion pathways, facilitating deeper localized attacks by accelerating the breakdown of the passive film and promoting matrix dissolution [58,59].

5. Conclusions

This study systematically investigated the effects of Ca, Sr, Mn, and Zr microalloying on the microstructure and corrosion resistance of Mg-Y-Zn alloys containing 18R-type LPSO phases. The main conclusions are as follows:
(1)
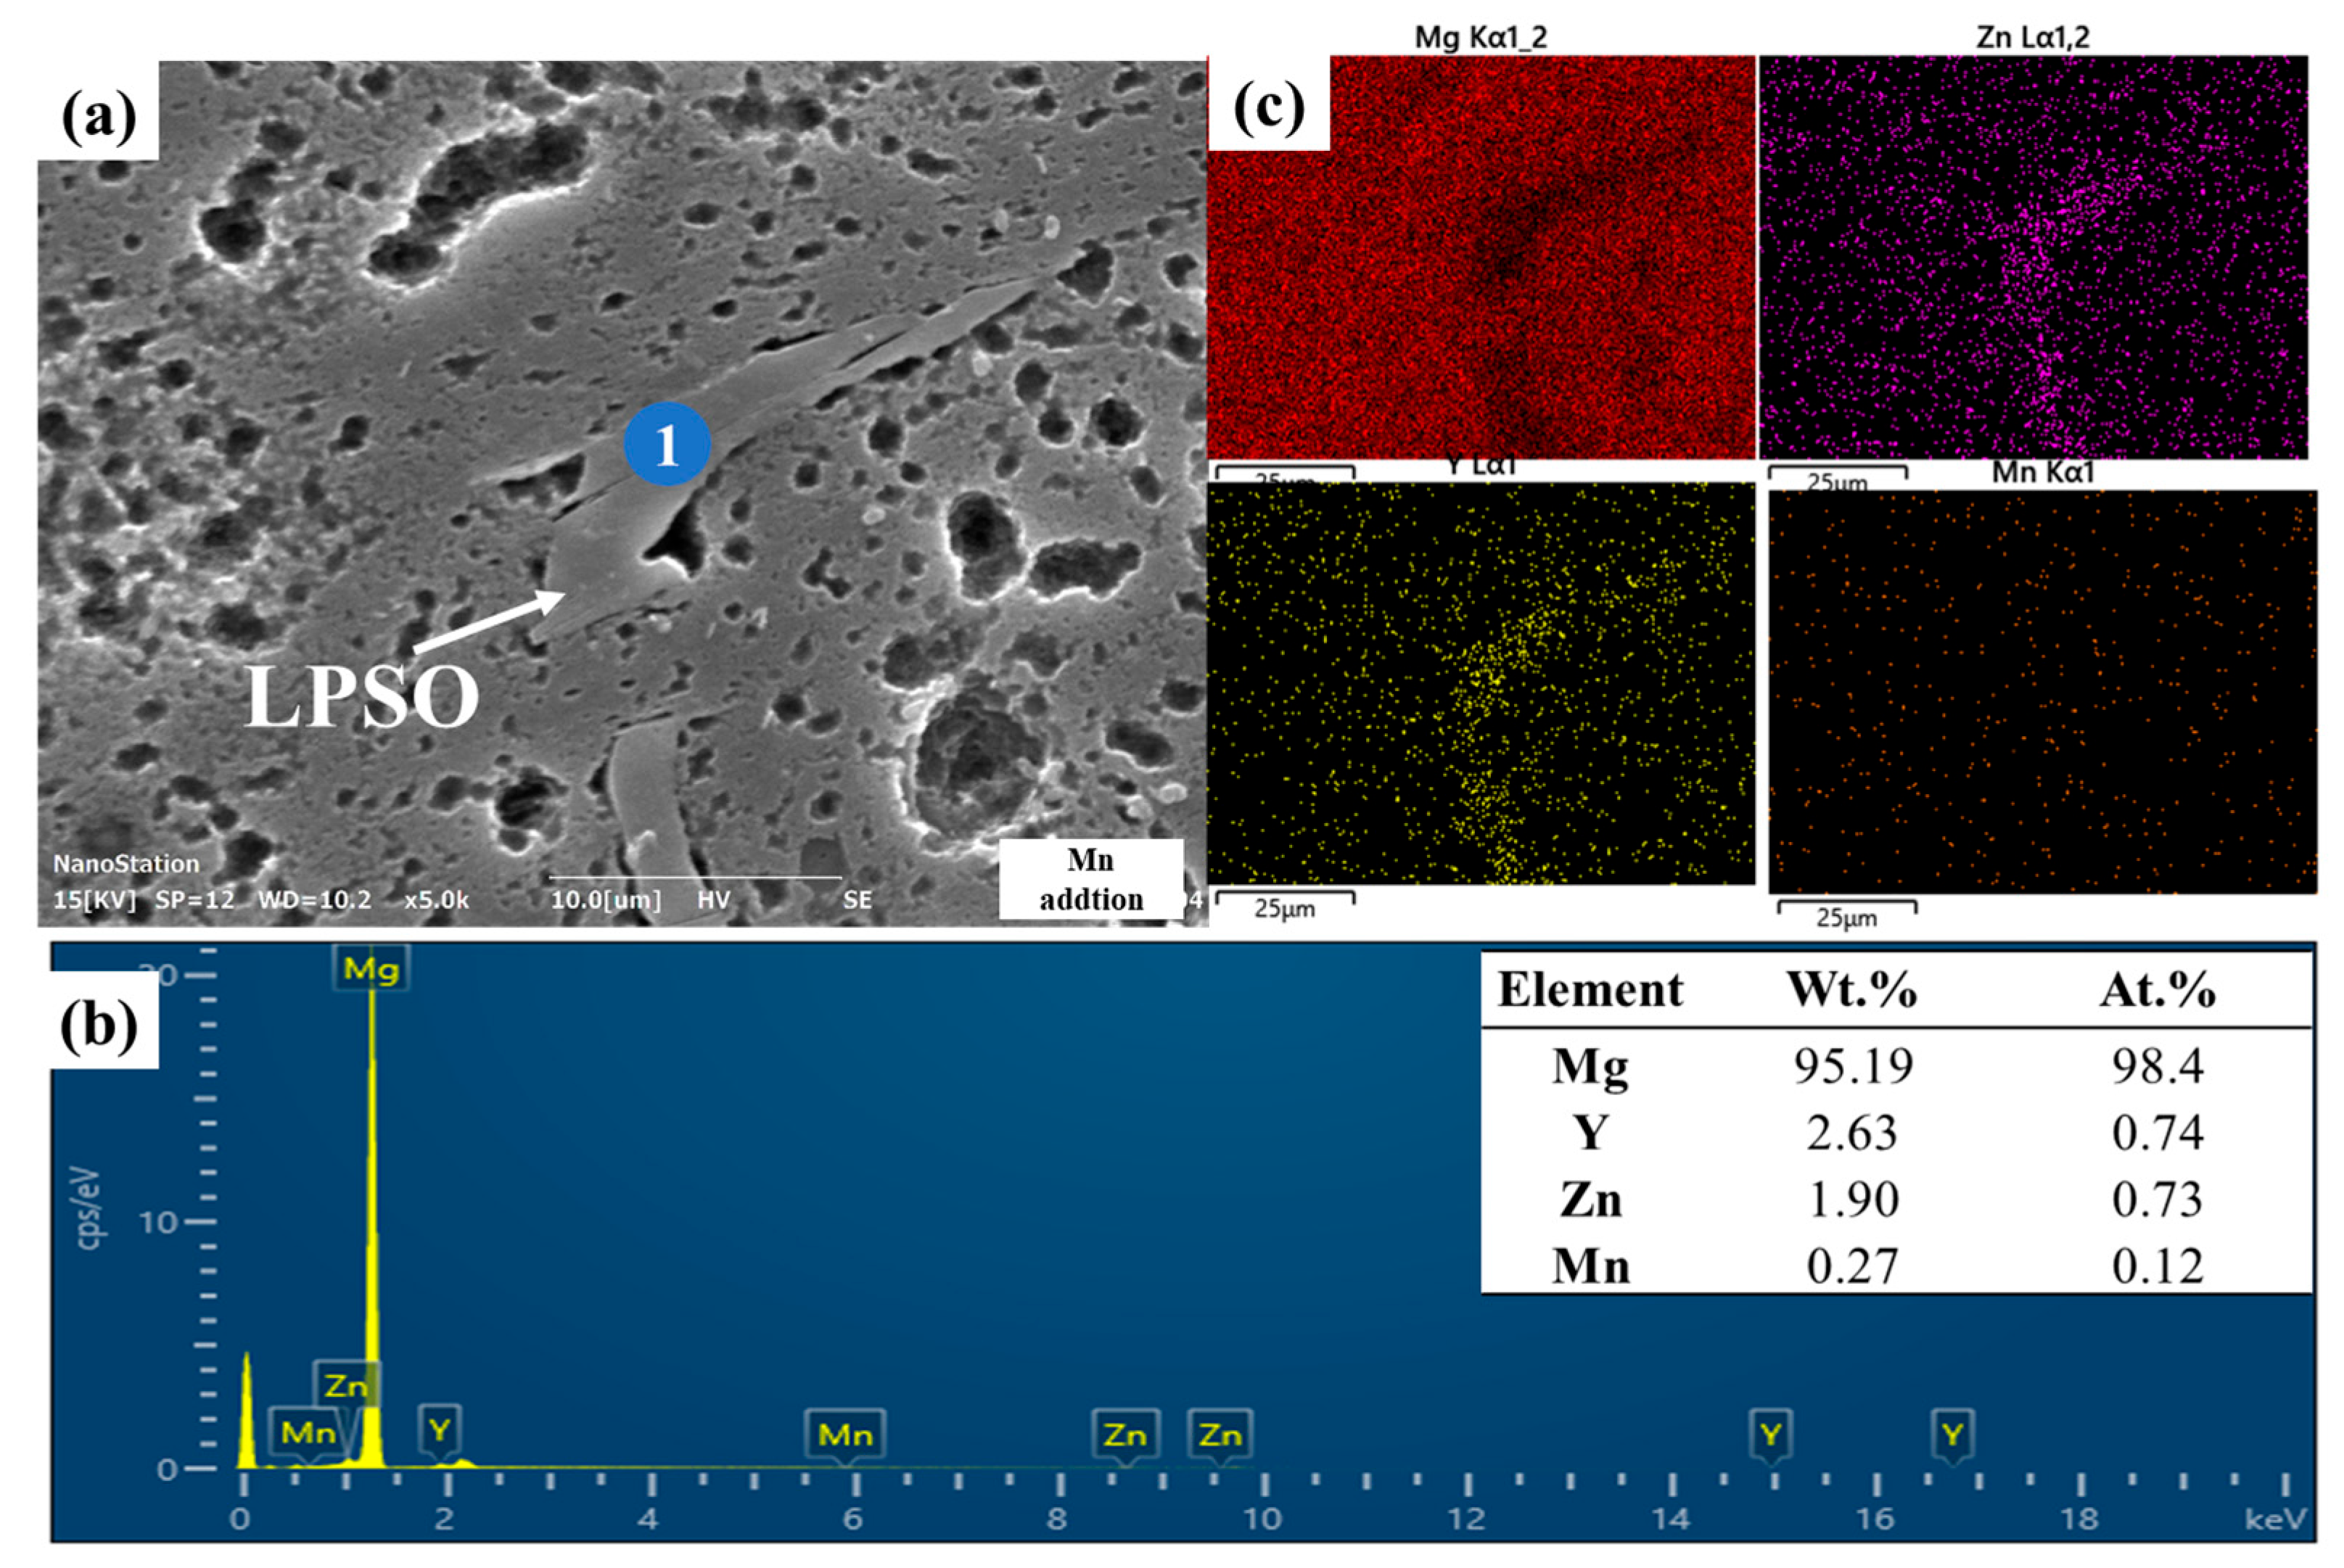
Microalloying modified the precipitation behavior of the second phase. Ca and Sr induced the formation of Mg2Ca and Mg17Sr2, while Mn and Zr refined the LPSO structure without generating new phases. All four elements promoted LPSO formation and distribution refinement.
(2)
Corrosion resistance was significantly enhanced by microalloying, with corrosion rates decreasing in the following order: Mg-Y-Zn > Mg-Y-Zn-Ca > Mg-Y-Zn-Sr > Mg-Y-Zn-Zr > Mg-Y-Zn-Mn.
(3)
In the Ca-containing alloy, Mg2Ca initially acts as a sacrificial anode, delaying corrosion. However, galvanic coupling between the α-Mg matrix and LPSO structure eventually dominates, accelerating localized attacks.
(4)
Sr addition leads to uniform Mg17Sr2 distribution and refined LPSO networks, facilitating uniform corrosion and suppressing deep penetration over time by inhibiting cathodic kinetics.
(5)
Mn microalloying yields the best corrosion resistance by suppressing both anodic and cathodic reactions, forming a stable protective film. Zr also improves general resistance but induces localized corrosion due to dislocation-related activity and LPSO phase disruption.

Author Contributions

L.W. (Lisha Wang) designed the research, carried out the experiments, analyzed the data, and drafted the manuscript. C.Z. and W.S. assisted with material preparation, electrochemical testing, and data analysis. H.W., Y.W. and L.W. (Lijuan Wang) contributed to the literature review and interpretation of results. X.K. supervised the project, critically reviewed the manuscript for important intellectual content, and provided guidance throughout the research. All authors have read and agreed to the published version of the manuscript.

Funding

This work was supported by the Natural Science Foundation of Anhui Province of China (Grant No. 2308085US12), Scientific Research Foundation of the Education Department of Anhui Province of China (grant No. KJ2021ZD0169, grant No. 2023AH053033, and grant No. 2023AH053030).

Data Availability Statement

The data presented in this study are available from the corresponding author on request. The data are not publicly available due to confidentiality agreements with institutional partners.

Conflicts of Interest

The authors declare that they have no conflicts of interest.

References

  1. Akbarzadeh, F.Z.; Sarraf, M.; Ghomi, E.R.; Kumar, V.V.; Salehi, M.; Ramakrishna, S.; Bae, S. A state-of-the-art review on recent advances in the fabrication and characteristics of magnesium-based alloys in biomedical applications. J. Magnes. Alloys 2024, 12, 2569–2594. [Google Scholar] [CrossRef]
  2. Yang, Y.; Xiong, X.; Chen, J.; Peng, X.; Chen, D.; Pan, F. Research advances of magnesium and magnesium alloys worldwide in 2022. J. Magnes. Alloys 2023, 11, 2611–2654. [Google Scholar] [CrossRef]
  3. Singh, N.; Batra, U.; Kumar, K.; Ahuja, N.; Mahapatro, A. Progress in bioactive surface coatings on biodegradable Mg alloys: A critical review towards clinical translation. Bioact. Mater. 2023, 19, 717–757. [Google Scholar] [CrossRef] [PubMed]
  4. He, M.; Chen, L.; Yin, M.; Xu, S.; Liang, Z. Review on magnesium and magnesium-based alloys as biomaterials for bone immobilization. J. Mater. Res. Technol. 2023, 23, 4396–4419. [Google Scholar] [CrossRef]
  5. Guo, Y.; Wang, Y.; Zhang, M.; Zhang, Y.; Fang, D.; Wei, Y.; Liu, B. Microstructure and mechanical behavior of Mg–Y–Zn alloys with respect to varying content of LPSO phase. Int. J. Mater. Res. 2018, 109, 944–950. [Google Scholar] [CrossRef]
  6. Lin, X.; Saijilafu; Wu, X.; Wu, K.; Chen, J.; Tan, L.; Witte, F.; Yang, H.; Mantovani, D.; Zhou, H.; et al. Biodegradable Mg-based alloys: Biological implications and restorative opportunities. Int. Mater. Rev. 2023, 68, 365–403. [Google Scholar] [CrossRef]
  7. Jiang, J.; Geng, X.; Zhang, X. Stress corrosion cracking of magnesium alloys: A review. J. Magnes. Alloys 2023, 11, 1906–1930. [Google Scholar] [CrossRef]
  8. Deng, Q.; Wu, Y.; Wu, Q.; Xue, Y.; Zhang, Y.; Peng, L.; Ding, W. Microstructure evolution and mechanical properties of a high-strength Mg-10Gd-3Y–1Zn-0.4Zr alloy fabricated by laser powder bed fusion. Addit. Manuf. 2022, 49, 102517. [Google Scholar] [CrossRef]
  9. Peng, P.; Zhang, K.; She, J.; Tang, A.; Zhang, J.; Song, K.; Yang, Q.; Pan, F. Role of second phases and grain boundaries on dynamic recrystallization behavior in ZK60 magnesium alloy. J. Alloys Compd. 2021, 861, 157958. [Google Scholar] [CrossRef]
  10. Zhang, R.; Zhou, X.; Li, M.; Lu, X.; Chen, X.; Pang, X.; Li, J.; Zhang, J. Effect of zn content and homogenization treatment on mechanical properties and corrosion behavior of mg-9y-xzn alloys. Met. Mater. Int. 2025, 31, 770–786. [Google Scholar] [CrossRef]
  11. Zhang, X.; Shi, Y.; Li, J.; Yue, H.; Li, C.; Guo, S.; Chen, Q. Improving strength-ductility of mg-8.5gd-4.5y-0.8zn-0.4zr magnesium alloy due to bimodal lpso and <c + a> dislocations. J. Rare Earths 2025, 43, 832–842. [Google Scholar]
  12. Wang, Z.; Shen, Z.; Liu, Y.; Zhao, Y.; Zhu, Q.; Chen, Y.; Wang, J.; Li, Y.; Lozano-Perez, S.; Zeng, X. The effect of lpso phase on the high-temperature oxidation of a stainless mg-y-al alloy. J. Magnes. Alloys 2024, 12, 4045–4052. [Google Scholar] [CrossRef]
  13. Kumar, A.; Choudhari, A.; Gupta, A.K.; Kumar, A. Rare-earth based magnesium alloys as a potential biomaterial for the future. J. Magnes. Alloys 2024, 12, 3841–3897. [Google Scholar] [CrossRef]
  14. Yang, J.; Zhang, Z.; Yao, W.; Wu, Y.; Gao, Y.; Yang, Y.; Wu, L.; Serdechnova, M.; Blawert, C.; Pan, F. Recent developments in coatings on biodegradable mg alloys: A review. J. Magnes. Alloys 2025, 13, 1405–1427. [Google Scholar] [CrossRef]
  15. Avey, T.; Cho, D.; Zhang, J.; Miao, J.; Dean, D.; Luo, A.A. Determining critical zn/ca atomic ratio and its role in mechanical and corrosion properties of biodegradable mg-ca-zn-mn alloys. Materialia 2024, 37, 102203. [Google Scholar] [CrossRef]
  16. Felten, M.; Chaineux, V.; Zhang, S.; Tehranchi, A.; Hickel, T.; Scheu, C.; Spille, J.; Lipińska-Chwałek, M.; Mayer, J.; Berkels, B.; et al. The effect of laves phases and nano-precipitates on the electrochemical corrosion resistance of mg-al-ca alloys under alkaline conditions. J. Magnes. Alloys 2024, 12, 2447–2461. [Google Scholar] [CrossRef]
  17. Gong, C.; He, X.; Yan, X. Corrosion behavior of mg–ca–zn alloys with high zn content. J. Phys. Chem. Solids 2021, 152, 109952. [Google Scholar] [CrossRef]
  18. Zander, D.; Zumdick, N.A. Influence of ca and zn on the microstructure and corrosion of biodegradable Mg-Ca-Zn alloys. Corros. Sci. 2015, 93, 222–233. [Google Scholar] [CrossRef]
  19. Akhmetshina, T.; Berger, L.; Basu, I.; Montibeller, S.; Rubin, W.; Rich, A.M.; Schäublin, R.E.; Löffler, J.F. High-performance ultra-lean biodegradable mg–ca alloys and guidelines for their processing. Acta Mater. 2024, 278, 120247. [Google Scholar] [CrossRef]
  20. Seong, J.W.; Kim, W.J. Mg-Ca binary alloy sheets with ca contents of ≤1wt.% with high corrosion resistance and high toughness. Corros. Sci. 2015, 98, 372–381. [Google Scholar] [CrossRef]
  21. Deng, M.; Wang, L.; Höche, D.; Lamaka, S.V.; Wang, C.; Snihirova, D.; Jin, Y.; Zhang, Y.; Zheludkevich, M.L. Approaching “stainless magnesium” by ca micro-alloying. Mater. Horiz. 2021, 8, 589–596. [Google Scholar] [CrossRef]
  22. Gu, X.N.; Xie, X.H.; Li, N.; Zheng, Y.F.; Qin, L. In vitro and in vivo studies on a mg–sr binary alloy system developed as a new kind of biodegradable metal. Acta Biomater. 2012, 8, 2360–2374. [Google Scholar] [CrossRef]
  23. Liu, T.; Chen, X.; Wang, F.; Venezuela, J.; Wang, Y.; Shi, Z.; Chen, W.; Dargusch, M. Contrasting the mechanisms of high corrosion resistance in ultra-high purity mg-sr alloys in hanks’ and nacl solutions. Electrochim. Acta 2025, 518, 145716. [Google Scholar] [CrossRef]
  24. Munir, K.; Lin, J.; Wen, C.; Wright, P.F.A.; Li, Y. Mechanical, corrosion, and biocompatibility properties of Mg-Zr-Sr-Sc alloys for biodegradable implant applications. Acta Biomater. 2020, 102, 493–507. [Google Scholar] [CrossRef]
  25. Li, Y.; Wen, C.; Mushahary, D.; Sravanthi, R.; Harishankar, N.; Pande, G.; Hodgson, P. Hodgson. Mg-Zr-Sr alloys as biodegradable implant materials. Acta Biomater. 2012, 8, 3177–3188. [Google Scholar] [CrossRef]
  26. Benzarti, Z.; Itani, S.; Castro, J.D.; Carvalho, S.; Ramos, A.S. Design multifunctional Mg–Zr coatings regulating mg alloy bioabsorption. J. Magnes. Alloys 2024, 12, 1461–1478. [Google Scholar] [CrossRef]
  27. Niu, R.; Yan, F.; Wang, Y.; Duan, D.; Yang, X. Effect of Zr content on damping property of Mg-Zr binary alloys. Mater. Sci. Eng. A 2018, 718, 418–426. [Google Scholar] [CrossRef]
  28. Zhao, H.; Cheng, J.; Zhao, C.; Wen, M.; Wang, R.; Wu, D.; Wu, Z.; Yang, F.; Sheng, L. The recent developments of thermomechanical processing for biomedical mg alloys and their clinical applications. Materials 2025, 18, 1718. [Google Scholar] [CrossRef]
  29. Rogachev, S.O.; Bazhenov, V.E.; Komissarov, A.A.; Li, A.V.; Ten, D.V.; Yushchuk, V.V.; Drobyshev, A.Y.; Shin, K.S. Effect of hot rolling on structure and mechanical properties of Mg-Y-Zn-Mn alloys. Metals 2023, 13, 223. [Google Scholar] [CrossRef]
  30. Bazhenov, V.E.; Li, A.V.; Rogachev, S.O.; Bazlov, A.I.; Statnik, E.S.; Tavolzhanskii, S.A.; Komissarov, A.A.; Redko, N.A.; Korsunsky, A.M.; Shin, K.S. Structure and mechanical properties of hot-extruded Mg-Y-Zn-Mn biodegradable alloys. Mater. Today Commun. 2024, 40, 110166. [Google Scholar] [CrossRef]
  31. Song, G.; Atrens, A. Recently deepened insights regarding mg corrosion and advanced engineering applications of mg alloys. J. Magnes. Alloys 2023, 11, 3948–3991. [Google Scholar] [CrossRef]
  32. Atrens, A.; Song, G.; Liu, M.; Shi, Z.; Cao, F.; Dargusch, M.S. Review of recent developments in the field of magnesium corrosion. Adv. Eng. Mater. 2015, 17, 400–453. [Google Scholar] [CrossRef]
  33. Atrens, A.; Song, G.; Cao, F.; Shi, Z.; Bowen, P.K. Advances in mg corrosion and research suggestions. J. Magnes. Alloys 2013, 1, 177–200. [Google Scholar] [CrossRef]
  34. Wang, L.; Jiang, J.; Saleh, B.; Xie, Q.; Xu, Q.; Liu, H.; Ma, A. Controlling corrosion resistance of a biodegradable mg–y–zn alloy with lpso phases via multi-pass ecap process. Acta Metall. Sin. (Engl. Lett.) 2020, 33, 1180–1190. [Google Scholar] [CrossRef]
  35. Wang, L.; Jiang, J.; Liu, H.; Saleh, B.; Ma, A. Microstructure characterization and corrosion behavior of mg–y–zn alloys with different long period stacking ordered structures. J. Magnes. Alloys 2020, 8, 1208–1220. [Google Scholar] [CrossRef]
  36. Song, D.; Li, C.; Liang, N.; Yang, F.; Jiang, J.; Sun, J.; Wu, G.; Ma, A.; Ma, X.S. Simultaneously improving corrosion resistance and mechanical properties of a magnesium alloy via equal-channel angular pressing and post water annealing. Mater. Des. 2019, 166, 107621. [Google Scholar] [CrossRef]
  37. Abdel-Gawad, S.A.; Shoeib, M.A. Corrosion studies and microstructure of mg−zn−ca alloys for biomedical applications. Surf. Interfaces 2019, 14, 108–116. [Google Scholar] [CrossRef]
  38. Wang, L.; Bing, L.; Xiuyuan, Z.; Ying, L.; Mei, Z.; Yang, L.; Fudong, W.; Lei, W.; Pengyu, M. Effects of lpso mg12yzn-phase on coefficient of thermal expansion and mechanical properties of mg–y–zn alloys. Phys. Met. Metallogr. 2024, 125, 1785–1790. [Google Scholar] [CrossRef]
  39. Rastegaev, I.A.; Khrustalev, A.K.; Merson, D.L.; Rastegaeva, I.I.; Eva, O.V.M.; Ev, V.V.M.; Vladykin, A.L. Influence of secondary phase on elastic and acoustic characteristics of magnesium alloys of the mg–zn–y–gd system. Russ. J. Non-Ferrous Metals 2024, 65, 185–198. [Google Scholar] [CrossRef]
  40. Chen, X.; Xiao, B.; Lin, Y.; Zhou, X. Experimental study of low–cycle fatigue behavior in a mg–y–zn alloy with initial lpso phase. Mater. Sci. Eng. A 2024, 899, 146414. [Google Scholar] [CrossRef]
  41. Zhao, J.; Feng, T.; Lu, G.J. Atomistic simulations on liquid mg–sr alloys assisted with deep learning potential. Mater. Sci. 2024, 59, 13558–13574. [Google Scholar] [CrossRef]
  42. Predko, P.; Rajnovic, D.; Grilli, M.L.; Postolnyi, B.O.; Zemcenkovs, V.; Rijkuris, G.; Pole, E.; Lisnanskis, M. Promising methods for corrosion protection of magnesium alloys in the case of mg-al, mg-mn-ce and mg-zn-zr: A recent progress review. Metals 2021, 11, 1133. [Google Scholar] [CrossRef]
  43. Bazhenov, V.E.; Li, A.V.; Bautin, V.A.; Plegunova, S.V.; Vadekhina, V.V.; Ten, D.V.; Komissarov, A.A.; Koltygin, A.V.; Drobyshev, A.Y.; Shin, K.S. Corrosion properties and cytotoxicity of hot-extruded mg-zn-y-mn biodegradable alloys. JOM 2025, 77, 4363–4373. [Google Scholar] [CrossRef]
  44. Cao, X.; Sun, B.; Zhong, F.; Wang, T.; Pi, L.; Zhang, J.; Cheng, X.; Liang, M.; Li, J. The influence of duplex-phase structure evolution and second phase on corrosion behavior of Mg-Li-Zn-Y alloys. Mater. Today Chem. 2025, 43, 102487. [Google Scholar] [CrossRef]
  45. Kiani, F.; Lin, J.; Munir, K.; Wen, C.; Li, Y. Improvements in mechanical, corrosion, and biocompatibility properties of mg–zr–sr–dy alloys via extrusion for biodegradable implant applications. J. Magnes. Alloys 2023, 11, 3840–3865. [Google Scholar] [CrossRef]
  46. Li, Y.; Yuan, Y.; Wang, J.; Wu, L.; Cao, F.; Zhang, L.; Pan, F. Controllable degradation behavior of mg-sr-y alloys for the bio-applications. npj Mater. Degrad. 2023, 7, 45. [Google Scholar] [CrossRef]
  47. Wang, B.; Liu, J.; Yin, M.; Xiao, Y.; Wang, X.H.; He, J.X. Comparison of corrosion behavior of al-mn and al-mg alloys in chloride aqueous solution. Mater. Corros. 2016, 67, 51–59. [Google Scholar] [CrossRef]
  48. Yang, L.; Zhang, H.R.; Zhang, S.; Shi, Z.L.; Wei, C.; Ma, M.Z.; Liu, R.P. Effect of cu content on the corrosion behavior of ti-based bulk amorphous alloys in hcl solution. Mater. Lett. 2023, 337, 133742. [Google Scholar] [CrossRef]
  49. Atrens, A.; Shi, Z.; Mehreen, S.U.; Johnston, S.; Song, G.; Chen, X.; Pan, F. Review of mg alloy corrosion rates. J. Magnes. Alloys 2020, 8, 989–998. [Google Scholar] [CrossRef]
  50. Song, G. and Xu, Z. Effect of microstructure evolution on corrosion of different crystal surfaces of AZ31 Mg alloy in a chloride containing solution. Corros. Sci. 2012, 54, 97–105. [Google Scholar] [CrossRef]
  51. Südholz, A.D.; Kirkland, N.T.; Buchheit, R.G.; Birbilis, N. Electrochemical properties of intermetallic phases and common impurity elements in magnesium alloys. Electrochem. Solid-State Lett. 2011, 14, C5. [Google Scholar] [CrossRef]
  52. Roh, H.; Park, J.; Lee, S.; Kim, D.; Lee, G.; Jeon, H.; Chae, M.; Lee, K.; Sun, J.; Lee, D.; et al. Optimization of the clinically approved mg-zn alloy system through the addition of ca. Biomater. Res. 2022, 26, 41. [Google Scholar] [CrossRef]
  53. Liu, S.; Diao, H.; Chai, L.; Song, B. On the microstructure and mechanical property of as-extruded mg-gd-y-zn alloy with sr addition. Mater. Sci. Eng. A 2017, 679, 183–192. [Google Scholar] [CrossRef]
  54. Wang, L.; Jiang, J.; Saleh, B.; Fathi, R.; Huang, H.; Liu, H.; Ma, A. Optimization of the experimental parameters affecting the corrosion behavior for mg–y–zn–mn alloy via response surface methodology. Met. Mater. Int. 2021, 27, 5095–5107. [Google Scholar] [CrossRef]
  55. Yuan, Y.; Ma, A.; Gao, Z.; Wu, H.; Gu, Y.; Wang, J.; Chen, J.; Ji, C.; Jiang, J. Improving microstructure and corrosion resistance of lpso-containing mg–y–zn–mn alloy through ecap integrated with prior solution treatment. J. Mater. Res. Technol. 2022, 19, 2275–2286. [Google Scholar] [CrossRef]
  56. Zhang, L.; Zhang, J.; Zhao, R.; Zhang, J.; Xu, C. Research of the microstructure, mechanical property and corrosion behaviours of mg–y–zn–mn(–mo) alloy with solution treatment. Corros. Eng. Sci. Technol. 2021, 56, 427–438. [Google Scholar] [CrossRef]
  57. Cao, F.; Xiao, B.; Wang, Z.; Ying, T.; Zheng, D.; Atrens, A.; Song, G. A Mg alloy with no hydrogen evolution during dissolution. J. Magnes. Alloys 2023, 11, 2084–2095. [Google Scholar] [CrossRef]
  58. Nie, Y.; Dai, J.; Li, X.; Zhang, X. Recent developments on corrosion behaviors of mg alloys with stacking fault or long period stacking ordered structures. J. Magnes. Alloys 2021, 9, 1123–1146. [Google Scholar] [CrossRef]
  59. Wang, L.; Jiang, J.; Yuan, T.; Xie, Q.; Liu, H.; Ma, A. Recent progress on corrosion behavior and mechanism of mg–re based alloys with long period stacking ordered structure. Met. Mater. Int. 2020, 26, 551–563. [Google Scholar] [CrossRef]
Figure 1. X-ray diffractograms of Mg-Y-Zn-X (X = 0, Ca, Sr, Mn, Zr) alloys.
Crystals 15 00639 g001
Figure 2. Microstructure of as-cast etched Mg-Y-Zn-X alloys as revealed by OM: (a) Mg-Y-Zn, (b) Mg-Y-Zn-Ca, (c) Mg-Y-Zn-Sr, (d) Mg-Y-Zn-Mn, and (e) Mg-Y-Zn-Zr.
Crystals 15 00639 g002
Figure 3. Hydrogen evolution volume and the corrosion rate of the Mg-Y-Zn-X alloys after being immersed in 37 °C Hank’s solution for 100 h: (a) hydrogen evolution volume; (b) corrosion rate.
Crystals 15 00639 g003
Figure 4. PDP curves of Mg-Y-Zn-X (0, Ca, Sr, Mn, Zr) alloys: (a) at OCP; (b) after immersion for 30 h.
Crystals 15 00639 g004
Figure 5. (a) SEM images of the corroded surface regions of Mg-Y-Zn alloys after immersion in Hank’s solution at 37 °C for 24 h; (b) corresponding EDS point analysis; and (c) EDS elemental mapping showing the distribution of Mg, Zn, and Y.
Crystals 15 00639 g005
Figure 6. (a) SEM image of the corroded region of the Mg-Y-Zn-Ca alloy after immersion in Hank’s solution at 37 °C for 24 h; (b,c) EDS point analysis at positions 1 and 2, respectively; (d) EDS elemental mapping showing the distribution of Mg, Zn, Y, and Ca.
Crystals 15 00639 g006
Figure 7. (a) SEM image of the corroded region of the Mg-Y-Zn-Sr alloy after immersion in Hank’s solution at 37 °C for 24 h; (b,c) EDS point analysis at positions 1 and 2, respectively; (d) EDS elemental mapping showing the distribution of Mg, Zn, Y, and Sr.
Crystals 15 00639 g007
Figure 8. (a) SEM images of the corroded surface regions of Mg-Y-Zn-Mn alloys after immersion in Hank’s solu-tion at 37 °C for 24 h; (b) corresponding EDS point 1 analysis; and (c) EDS elemental mapping showing the distribution of Mg, Zn, Y and Mn.
Crystals 15 00639 g008
Figure 9. (a) SEM images of the corroded surface regions of Mg-Y-Zn-Zr alloys after immersion in Hank’s solu-tion at 37 °C for 24 h; (b) corresponding EDS point 1 analysis; and (c) EDS elemental mapping showing the distribution of Mg, Zn, Y and Zr.
Crystals 15 00639 g009
Figure 10. SEM observation of selected corrosion regions for Mg-Y-Zn-Ca alloys after immersion in 37 °C Hank’s solution for 30 h and 72 h: (a) immersion for 30 h, (b) immersion for 72 h, and (c) enlarged view of the corrosion region in (b).
Crystals 15 00639 g010
Figure 11. SEM observation of selected corrosion regions for Mg-Y-Zn-Sr alloys after immersion in 37 °C Hank’s solution for 30 h and 72 h: (a) immersion for 30 h, (b) immersion for 72 h, and (c) magnified view of the corrosion region marked by a white circle in (b).
Crystals 15 00639 g011
Figure 12. SEM observation of selected corrosion regions for Mg-Y-Zn-Mn alloys after immersion in 37 °C Hank’s solution for 30 h and 72 h: (a) immersion for 30 h, (b) immersion for 72 h, and (c) enlarged view of the corrosion region in (b).
Crystals 15 00639 g012
Figure 13. SEM observation of selected corrosion regions for Mg-Y-Zn-Zr alloys after immersion in 37 °C Hank’s solution for 30 h and 72 h: (a) immersion for 30 h, (b) immersion for 72 h, where two typical corrosion areas are marked with white circles; (c,d) Magnified views of the corrosion regions marked in (b), with arrows indicating their corresponding source areas.
Crystals 15 00639 g013
Table 1. Chemical composition of Mg-Y-Zn-X (0, Ca, Sr, Mn, Zr) alloys.
Nominal AlloysMgY (wt.%)Zn (wt.%)Ca (wt.%)Sr (wt.%)Mn (wt.%)Zr (wt.%)
Mg-Y-ZnBal.2.8291.420
Mg-Y-Zn-CaBal.2.4071.3230.5
Mg-Y-Zn-SrBal.2.2191.463 0.5
Mg-Y-Zn-MnBal.2.2271.435 0.45
Mg-Y-Zn-ZrBal.2.1961.359 0.3
Table 3. Electrochemical parameters obtained from potentiodynamic polarization curves at OCP.
AlloysEcorr (VSCE)icorr
(μA·cm−2)
Epit
(VSCE)
Pi
(mm/Year)
PAH
(mm/Year)
PW
(mm/Year)
Mg-Y-Zn−1.52926.21.4610.531.812.67
Mg-Y-Zn-Ca−1.56410.06−1.450.311.211.65
Mg-Y-Zn-Sr−1.54418.9-0.191.141.36
Mg-Y-Zn-Mn−1.553.39−1.430.120.671.02
Mg-Y-Zn-Zr−1.533.88−1.390.10.81.18
Table 4. Electrochemical parameters obtained from potentiodynamic polarization curves after immersion for 30 h.
AlloysEcorr (VSCE)icorr (μA·cm−2)Epit (VSCE)
Mg-Y-Zn−1.4623.2−1.37
Mg-Y-Zn-Ca−1.4713.6-
Mg-Y-Zn-Sr−1.388.3-
Mg-Y-Zn-Mn−1.565.41−1.36
Mg-Y-Zn-Zr−1.474.52−1.38
Disclaimer/Publisher’s Note: The statements, opinions and data contained in all publications are solely those of the individual author(s) and contributor(s) and not of MDPI and/or the editor(s). MDPI and/or the editor(s) disclaim responsibility for any injury to people or property resulting from any ideas, methods, instructions or products referred to in the content.

