3.1. Structural Properties
The atomic radii, Pauling electronegativity, and VEC values of the constituent elements used in the synthesized HEAs are presented in
Table 5. Additionally, the calculated parameters for the HEAs including ΔH
mix, ΔS
mix, ΔS
conf, VEC, Ω, Δ
x, δ% and Tm are listed in
Table 6.
As shown in
Table 6, with the increasing W content, the values of ΔS
mix, ΔH
mix, ΔS
conf, Ω, and Δ
x increased, while VEC and δ% decreased. Notably, as the W content increased, the VEC values decreased from 7.20 to 7.00. Numerous studies in the literature have clearly stated that the W element stabilizes the BCC crystal structure [
25,
30,
38]. Tian et al. extensively investigated the correlation between experimental and thermodynamic data of nearly 200 different HEA systems and their corresponding crystal structures. Their findings revealed that when the VEC is in the range of 4.33 ≤ VEC ≤ 7.55, the resulting crystal structure is body-centered cubic (BCC), whereas for 7.80 ≤ VEC ≤ 9.50, a face-centered cubic (FCC) structure is favored. In addition, it was reported that in order to form a stable solid solution, the thermodynamic parameters should fall within the following ranges: −22 ≤ ΔH
mix ≤ 7 kJ/mol, 0 ≤ δ ≤ 8.5%, and 11 ≤ ΔS
mix ≤ 19.5 J/(K·mol). Moreover, it was emphasized that equimolar HEA systems exhibit the maximum possible ΔS
mix values [
36].
In another study on the AlCoCrFeNi
2W
x HEA system, it was reported that increasing W content led to an increase in ΔHmix and Ω values, while the VEC value decreased. This observation suggests that the addition of W may promote the formation of BCC phases [
38]. Similarly, in a study conducted on the AlCuCrFeMnW
x HEA system, it was found that as the W content increased, the thermodynamic parameters ΔHmix, ΔSmix, ΔSconf, and Ω increased, whereas VEC and δ values decreased. Notably, the increase in ΔSconf with higher W content was interpreted as an indication that W supports the successful formation of solid solutions and enhances the high-entropy effect. Additionally, the decrease in VEC was highlighted as a factor that promotes the formation of BCC crystal structures in the presence of W [
39]. Dong et al. reported that in the AlCoCrFeNiV
x HEA system, increasing V content led to a decrease in VEC and δ values, which in turn stabilized the BCC solid solution phase [
25]. Similarly, Jiang et al. observed that an increase in W content resulted in a decrease in the VEC value and a corresponding increase in the fraction of the BCC solid solution phase, thereby stabilizing the BCC structure [
30]. In light of these findings, the experimental results obtained for the AlCoCrFeNiW
x HEAs in this study are consistent with the literature in terms of solid solution phase formation.
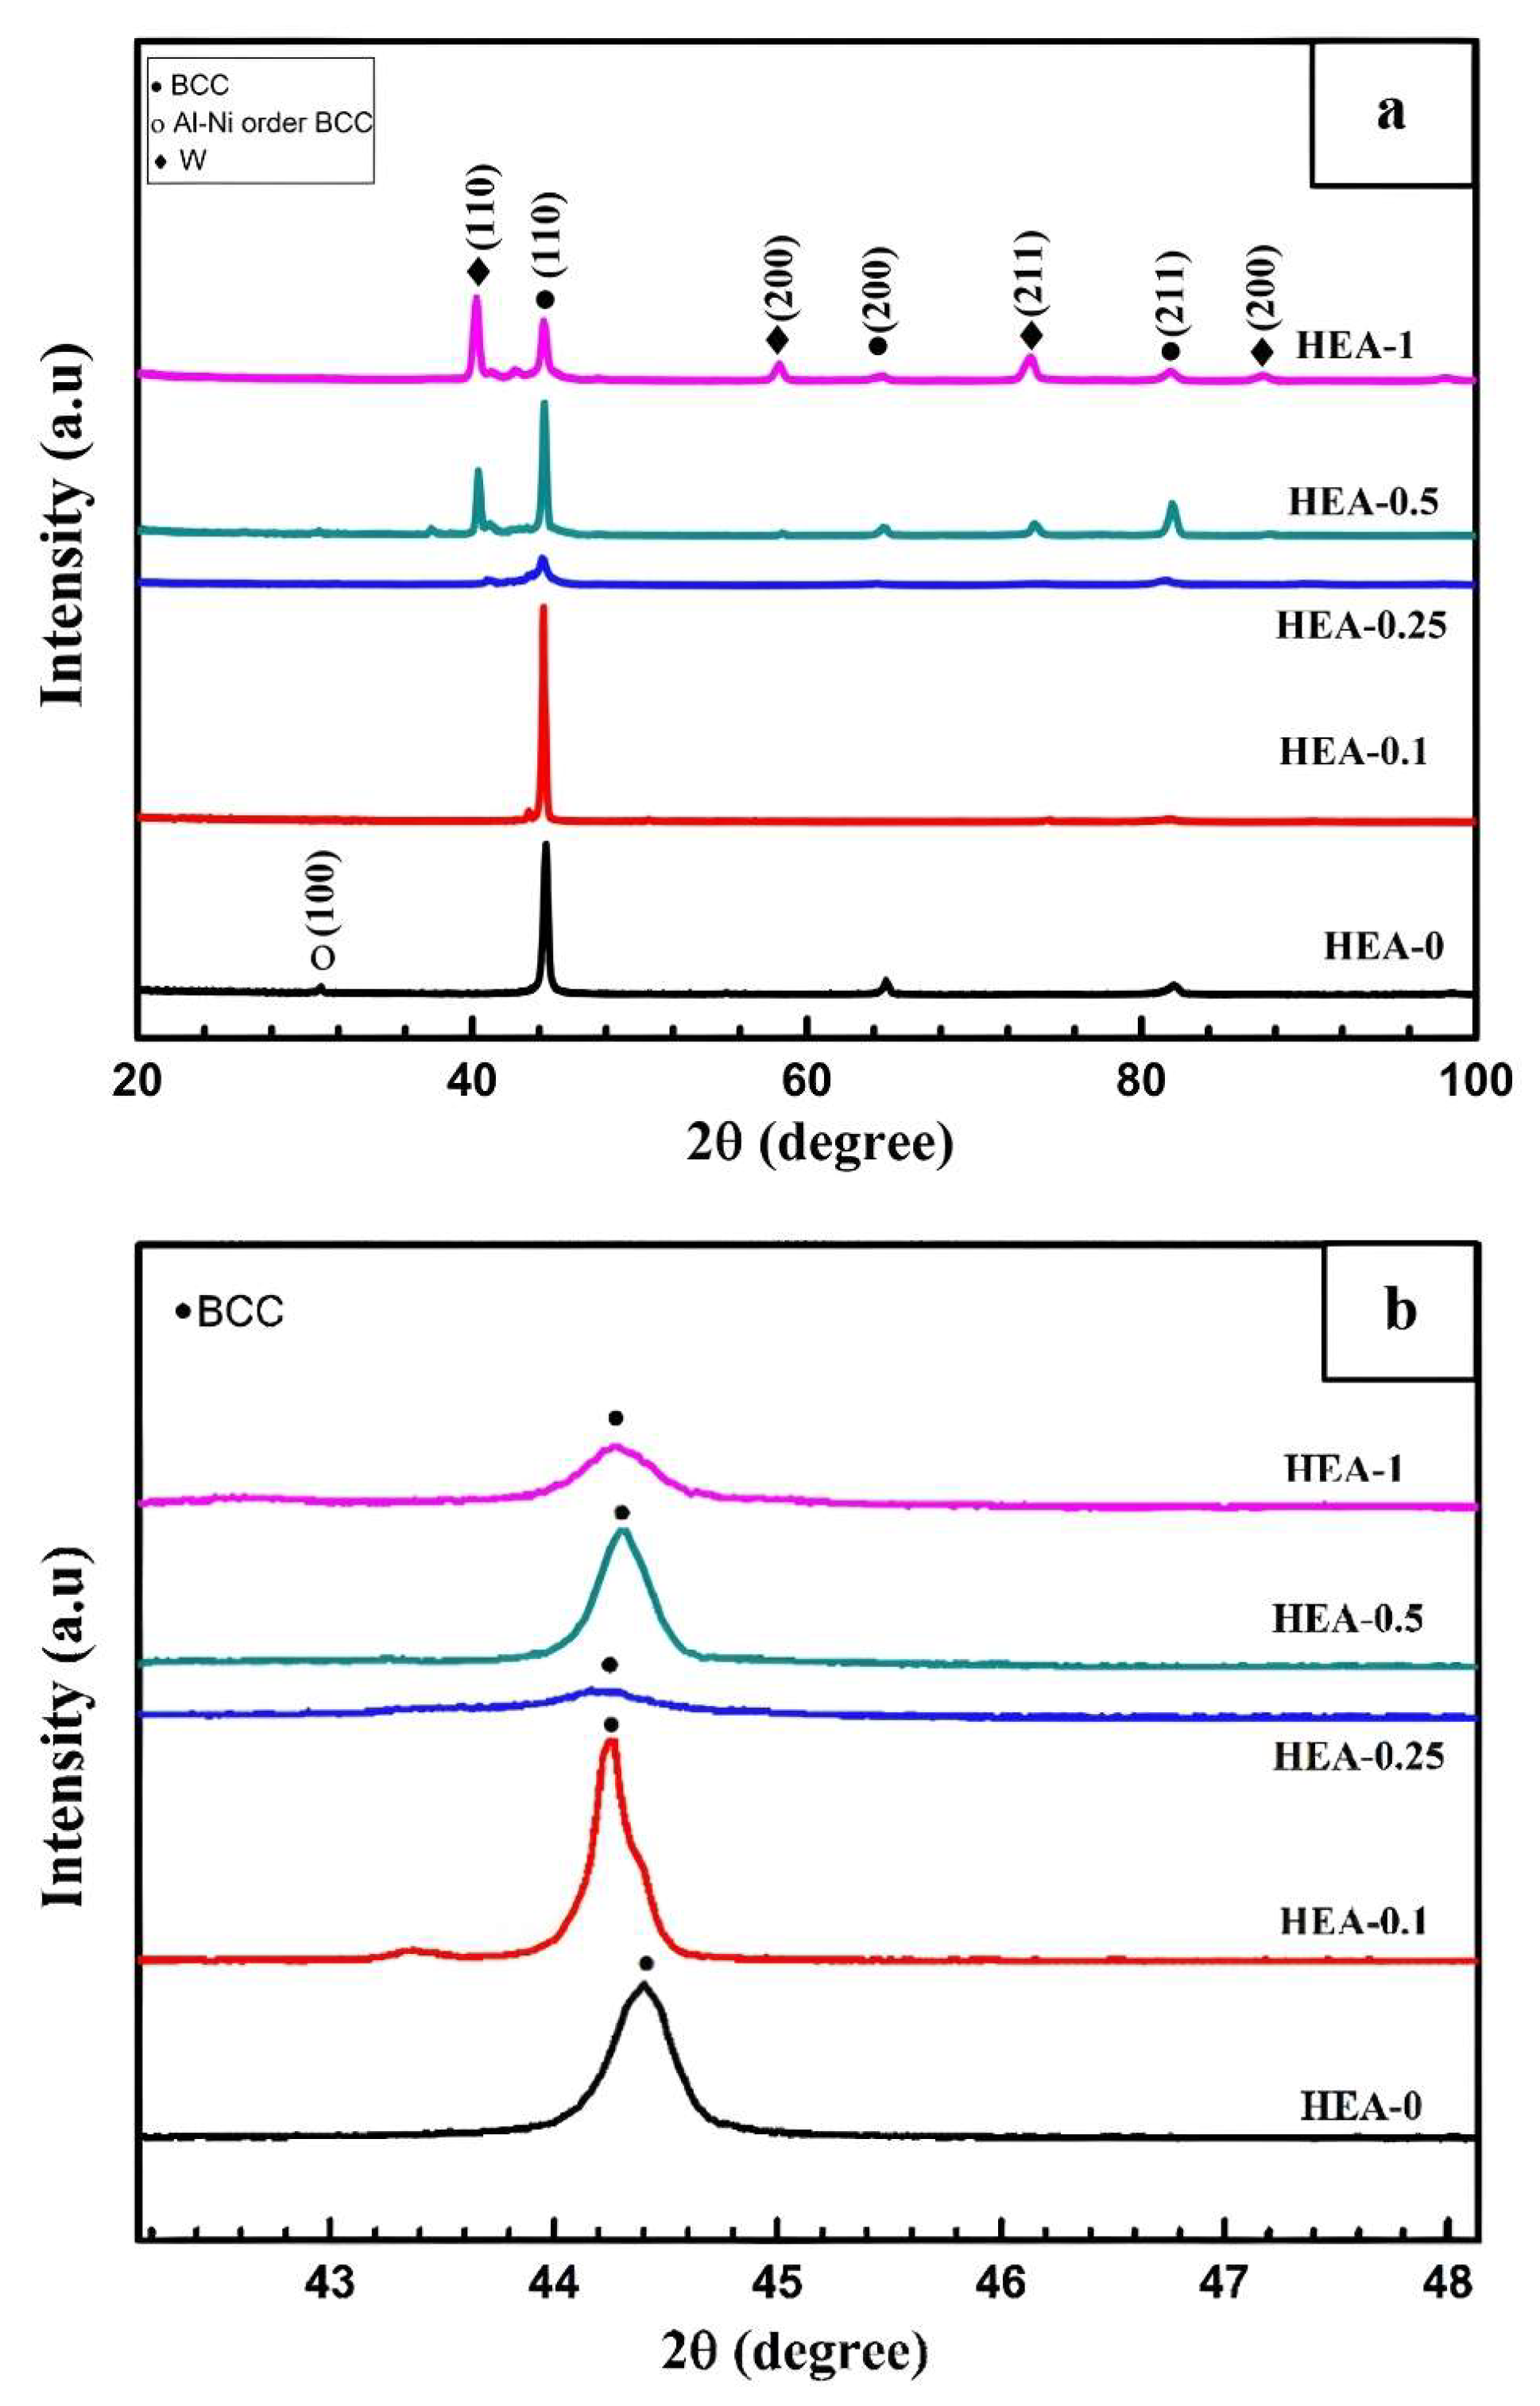
Figure 2 presents the XRD patterns of the synthesized AlCoCrFeNiW
x HEAs.
In the HEA-0 alloy, the formation of an ordered BCC-B2 phase at 2θ ≈ 31° (100), and BCC solid solution phases at 2θ ≈ 44° (110), 2θ ≈ 64° (200), and 2θ ≈ 81° (211) was observed. According to numerous studies in the literature, the peak at 2θ ≈ 31° (100) corresponding to the ordered BCC-B2 phase is clearly attributed to the Al-Ni phase [
20,
27,
40,
41]. In the HEA-0.1 alloy, an increase in the intensity of the 2θ ≈ 44° (110) peak was observed, while the intensities of the other peaks decreased. With the increase in W content, characteristic W-rich BCC phase peaks appeared at 2θ ≈ 40° (110), 2θ ≈ 58° (200), 2θ ≈ 73° (211), and 2θ ≈ 87° (200). Moreover, the intensities of these peaks increased with increasing W content, becoming more pronounced.
Figure 2b presents a magnified view of the main peak region corresponding to the 2θ ≈ 44° (110) BCC solid solution phase. With the addition of W, the peak position was observed to shift toward lower 2θ angles. This shift can be attributed to the relatively large atomic radius of W, which is the second largest among the alloying elements. Based on the evaluations carried out using HighScore Plus XRD analysis software (HighScore Plus 4.8 (V4.8.025518), Malvern Panalytical B.V. Almelo, The Netherlands), the lattice parameters, crystallite sizes, and dislocation densities of the 2θ ≈ 44° (110) BCC solid solution phase were calculated for the HEAs. The results of these calculations for the HEA-0, HEA-0.1, HEA-0.25, HEA-0.5, and HEA-1 alloys are presented in
Table 7.
As shown in
Table 7, when the W content increased from x = 0 to x = 0.1, the crystallite size increased and the dislocation density decreased. However, with further Increase In W content from x = 0.1 to x = 1, the crystallite sizes decreased while the dislocation densities increased. This behavior is attributed to anisotropic variations in residual stress caused by the increasing W content [
39]. The lattice constants of the 2θ ≈ 44° (110) BCC solid solution phase for AlCoCrFeNiW
x HEAs were calculated as 0.2882, 0.2893, 0.2893, 0.2884, and 0.2886 nm for x = 0, 0.1, 0.25, 0.5, and 1, respectively. These values were determined using the HighScore Plus software with reference patterns obtained from the Crystallography Open Database (COD); for instance, the lattice constant of HEA-0 corresponds to the COD database code: 9013475. The addition of W was found to increase the lattice constant of the BCC phase, suggesting that lattice distortion occurred due to the increased lattice parameter. The slight decrease in lattice constant observed for HEA-0.5 and HEA-1 may be attributed to the solubility limit of W being exceeded and to the reduced Al content in the BCC solid solution phase [
38]. It has been reported that increasing W content induces lattice distortion and increases the lattice constant. However, beyond a certain threshold, W contributes to the formation of a W-rich BCC phase, which limits lattice distortion and thus reduces the lattice constant [
30].
Figure 3 presents the SEM images of all HEAs. In
Figure 3a–c, the SEM micrographs of the HEA-0 alloy are shown. The HEA-0 alloy exhibits a single-phase BCC solid solution structure with equiaxed grain morphology. Color differences (gray or white) observed in the planar arrangement of grains are attributed to angular misorientations. EDS analysis revealed no significant differences in the chemical composition of the characterized grains.
As shown in
Figure 3c, the high-magnification SEM image of the HEA-0 alloy clearly reveals the presence of grain boundaries in its BCC crystal structure. In addition, the alloy exhibits distinct dark and bright regions within the BCC matrix, indicating spinodal decomposition. The chemical compositions of these regions, characterized by EDS, are presented in
Table 8. The grain boundary region is notably rich in Cr. Moreover, the dark region is enriched in Al and Ni compared to the bright region, whereas the bright region contains higher concentrations of Cr and Fe than the dark region. These findings confirm that the HEA-0 alloy possesses a single-phase BCC structure and that the formation of dark and bright regions is attributed to spinodal decomposition.
As shown in
Table 3, the binary mixing enthalpy values between the constituent elements of the HEA-0 alloy reveal that the Al-Ni atomic pair exhibits a significantly higher negative mixing enthalpy compared to other combinations. This suggests that Al and Ni atoms have a strong tendency to associate and segregate as atomic pairs. According to previous studies, the attraction of Al atoms towards Ni and Co promotes the formation of AlNiCo-enriched phases. Conversely, it has been reported that strong mutual interactions also exist between Fe and Cr atoms, leading to the development of regions enriched in these elements [
25,
42].
Wang et al. reported that the equiatomic AlCoCrFeNi alloy exhibits an equiaxed dendritic microstructure composed of a bright BCC-B2 phase and a dark BCC-A2 phase [
41]. In another study, the same alloy was observed to exhibit a microstructure consisting of BCC precipitates distributed within a BCC-B2 matrix. Additionally, it was found that the BCC + B2 microstructures were formed through the spinodal decomposition mechanism. The B2 matrix phase was found to be enriched in Al and Ni, while the BCC phase was enriched in Cr [
43]. In the literature, it has been clearly stated that the equiatomic AlCoCrFeNi HEA system consists of a single-phase BCC solid solution with an equiaxed grain structure and is consistent with the spinodal decomposition mechanism [
44,
45,
46,
47]. Furthermore, the formation of BCC and B2 phases has been emphasized to occur through the spinodal decomposition mechanism [
43,
44,
48]. In addition, it has been observed that the BCC phase contains bright regions enriched in Fe and Cr, while the B2 phase consists of dark regions enriched in Al and Ni, with both regions interconnected [
25,
26,
27,
42,
47,
49]. Based on the EDS data presented in
Table 8, the microstructural features of the HEA-0 alloy are consistent with the findings reported in the literature.
As observed from the microstructural images presented in
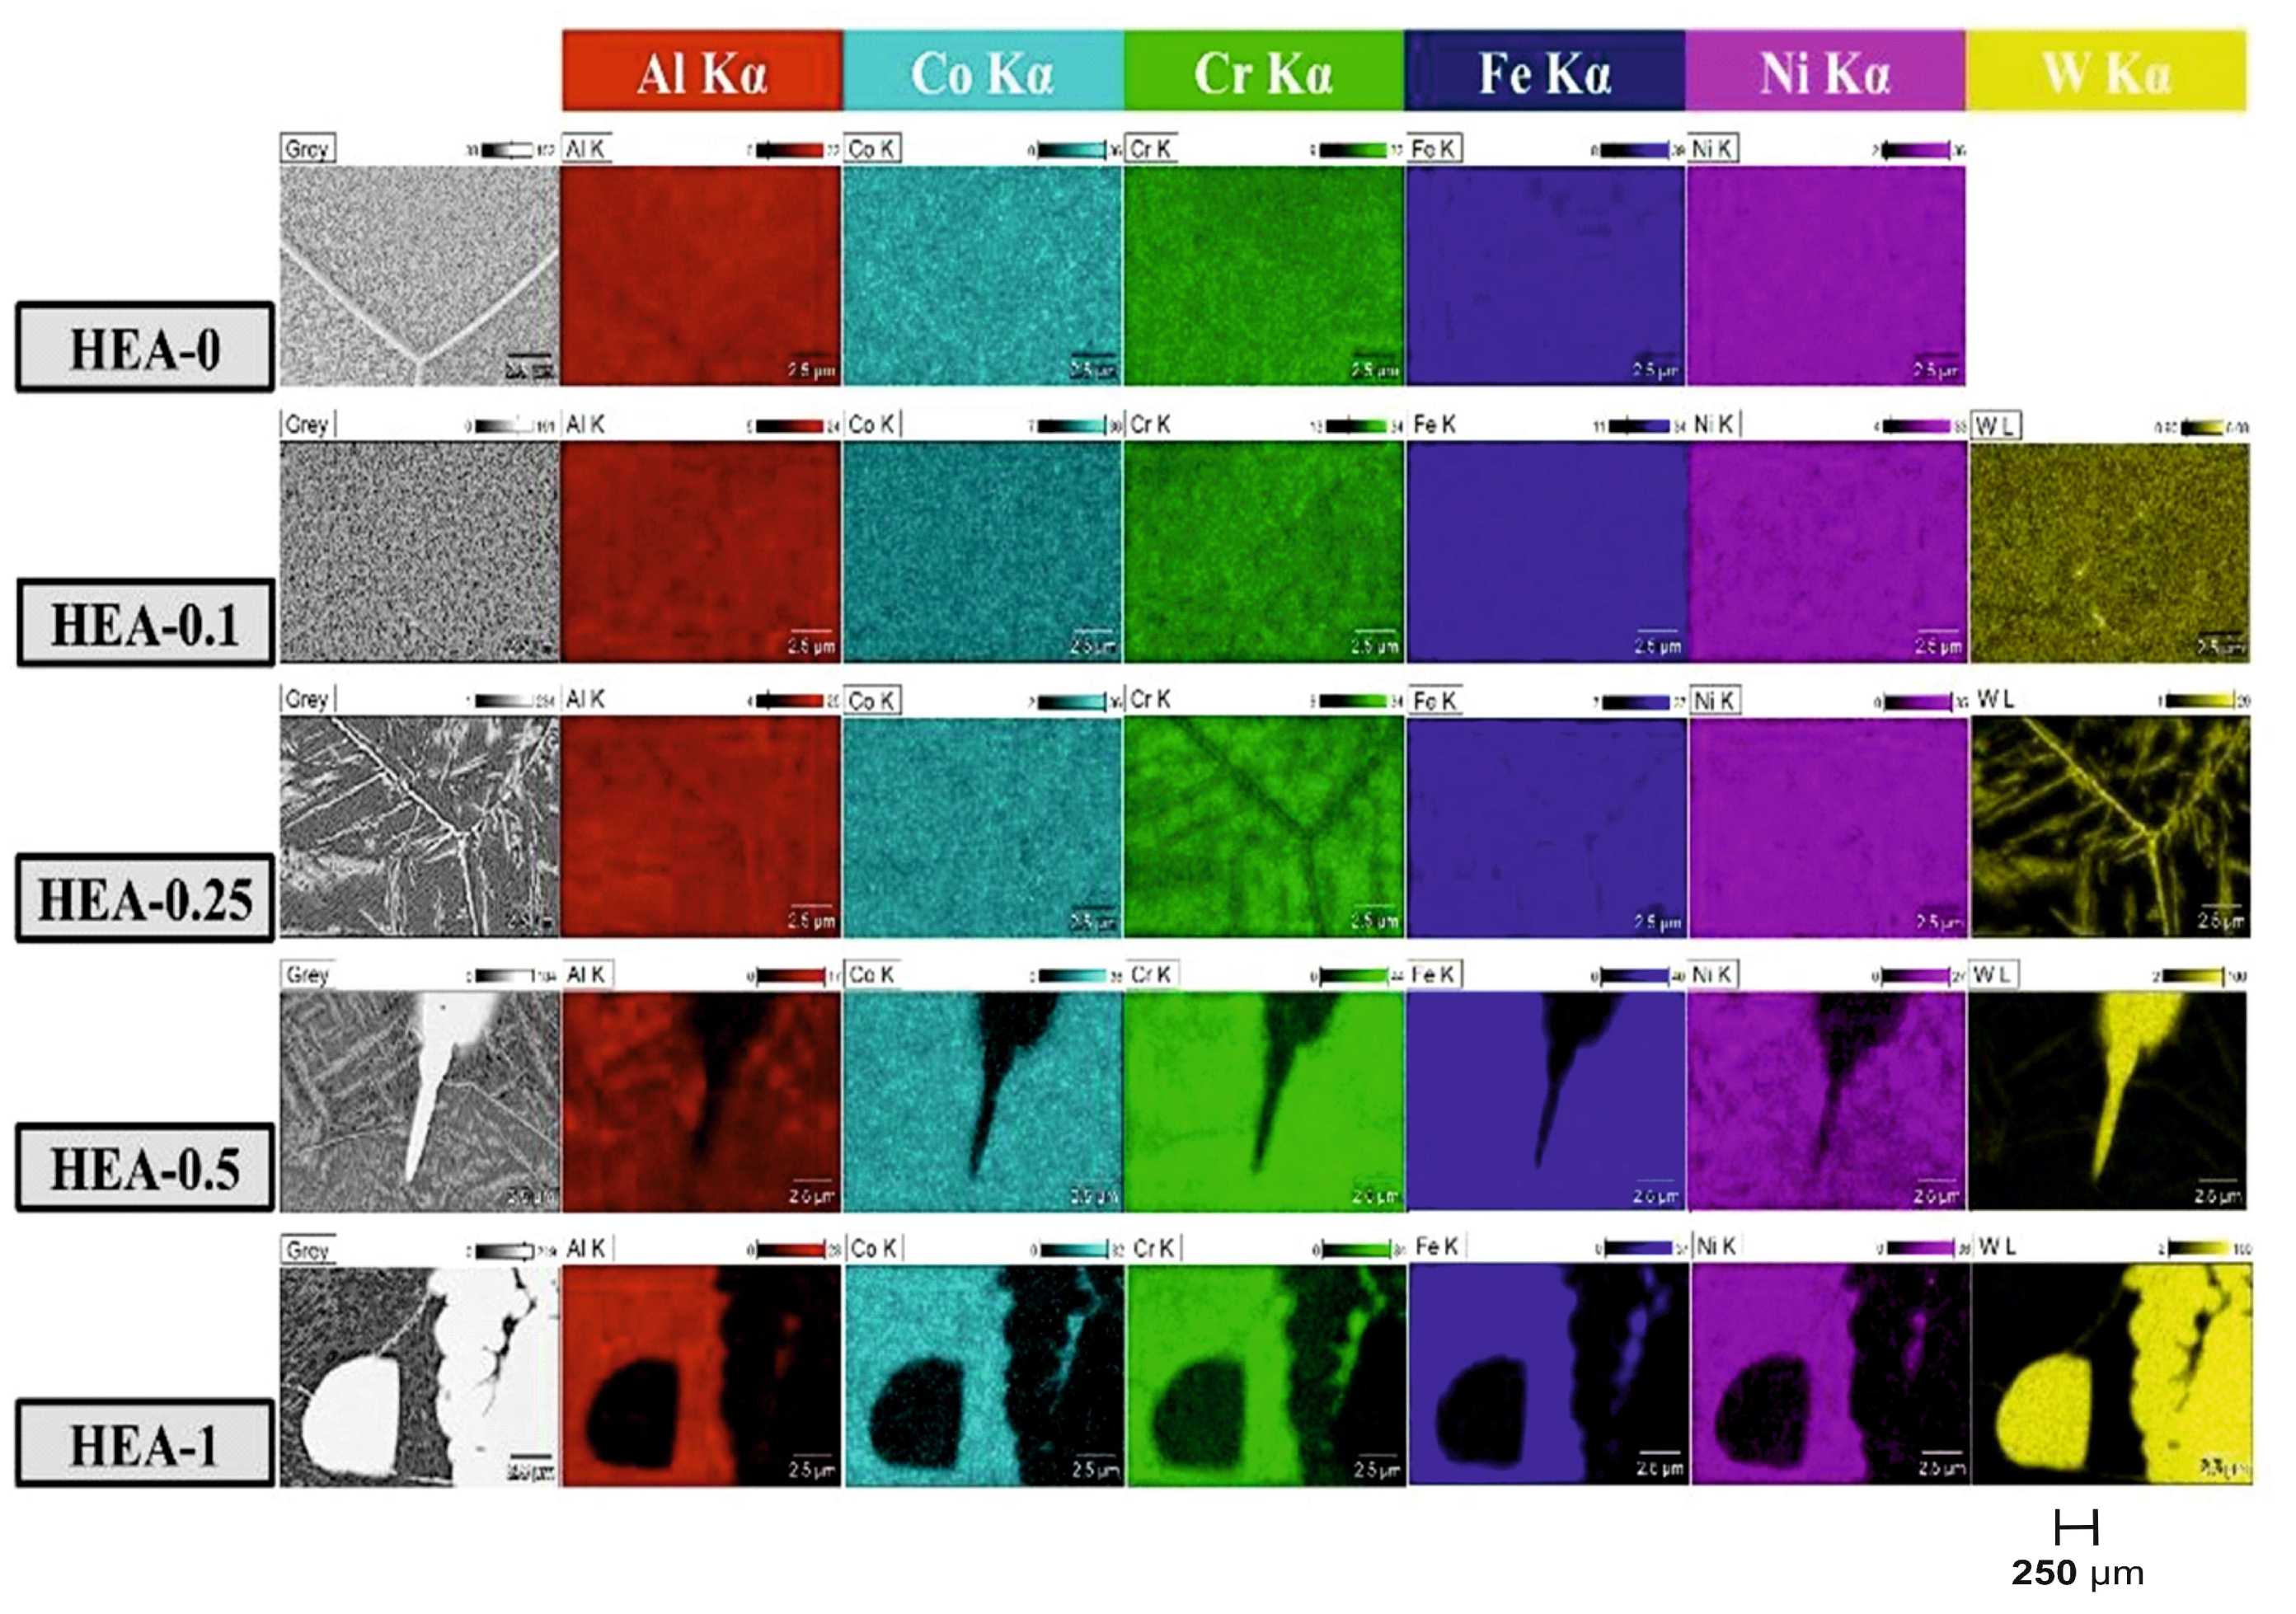
Figure 3, pores were formed in all the synthesized alloys. According to the EDS results listed in
Table 9 and the elemental mapping analysis shown in
Figure 4, these pores were found to contain a high amount of Al. It was determined that the Al content in these regions was lower than the nominal composition. This phenomenon can be attributed to the evaporation and/or oxidation of Al during the production process due to its low melting point [
20].
Figure 3d,g,j,m presents the SEM images of the W-alloyed HEAs. The observed microstructures are consistent with the XRD results, showing a notable reduction in grain boundary visibility with increasing W content.
The microstructure of the HEA-0.1 alloy is similar to that of HEA-0, and the presence of dark and bright regions within the BCC grains is also evident. It can be inferred that all of the W in the HEA-0.1 alloy is dissolved within the BCC solid solution. This is supported by both the XRD pattern shown in
Figure 2a and the elemental mapping analysis presented in
Figure 4. Moreover, EDS analysis confirms that the bright regions contain a higher amount of W compared to the dark regions. The SEM images of the HEA-0.25 alloy (
Figure 3g–i) indicate that the coexistence of dark and bright regions in the BCC matrix continues, as observed in the HEA-0 and HEA-1 alloys. In addition to this structure, the formation of a new bright phase enriched in W has also been observed. EDS and mapping analyses reveal that there is no significant chemical composition difference between the dark and bright regions within the matrix. As shown in
Figure 3 j–l, the microstructure of the HEA-0.5 alloy indicates that W has reached its solid solubility limit. While a portion of W is incorporated into the BCC solid solution, the excess W precipitates as plate-shaped W-rich phases due to the solubility limit being exceeded. The microstructure of the HEA-1 alloy is presented in
Figure 3m,n,o. In the HEA-0.5 alloy, white plate-shaped W phases are observed, whereas in the HEA-1 alloy, these transform into white irregular and/or suspended spherical forms. Similarly, Wu et al. reported that the microstructure of the AlCoCrFeNiW alloy contains white, suspended spherical or near-spherical W-enriched particles, which were identified as characteristic W phases [
20].
Figure 4 presents the elemental distribution (mapping) analyses of all HEAs. In the microstructures of the HEA-0 and HEA-0.1 alloys, all constituent elements were found to be homogeneously distributed. This observation supports that the W element is fully dissolved in the BCC solid solution phase in the HEA-0.1 alloy. In contrast, in the HEA-0.25, HEA-0.5, and HEA-1 alloys, while a portion of the W is dissolved in the BCC solid solution, another portion segregates along grain boundaries and within the bright phase regions, indicating W enrichment in these areas. Additionally, the dark regions corresponding to the BCC matrix contain only a limited amount of W compared to the nominal composition. This behavior can be attributed to the refractory nature of W, which tends to form secondary phases rather than fully dissolving into the matrix [
40]. With the addition of W, grain boundaries appear to become finer, and the number of Al-rich pores decreases. This phenomenon can be attributed to the reduction in Al content within the alloy as the W content increases. Furthermore, in the W-enriched regions—such as grain boundaries, bright zones, and areas containing W-rich phases—the concentrations of Co, Cr, and Fe are found to be relatively close to their nominal values, whereas Ni and especially Al are present at significantly lower levels. According to the literature, these elements tend to form W-rich μ phases. Accordingly, the observed bright regions are considered to correspond to μ-(FeCoCr)
7W
6 intermetallic compounds [
50]. It is also known that the solubility of Al in the μ phase is extremely limited [
51], which explains the very low Al content observed in the W-enriched regions.
3.3. Wear Tests of AlCoCrFeNiWx HEAs
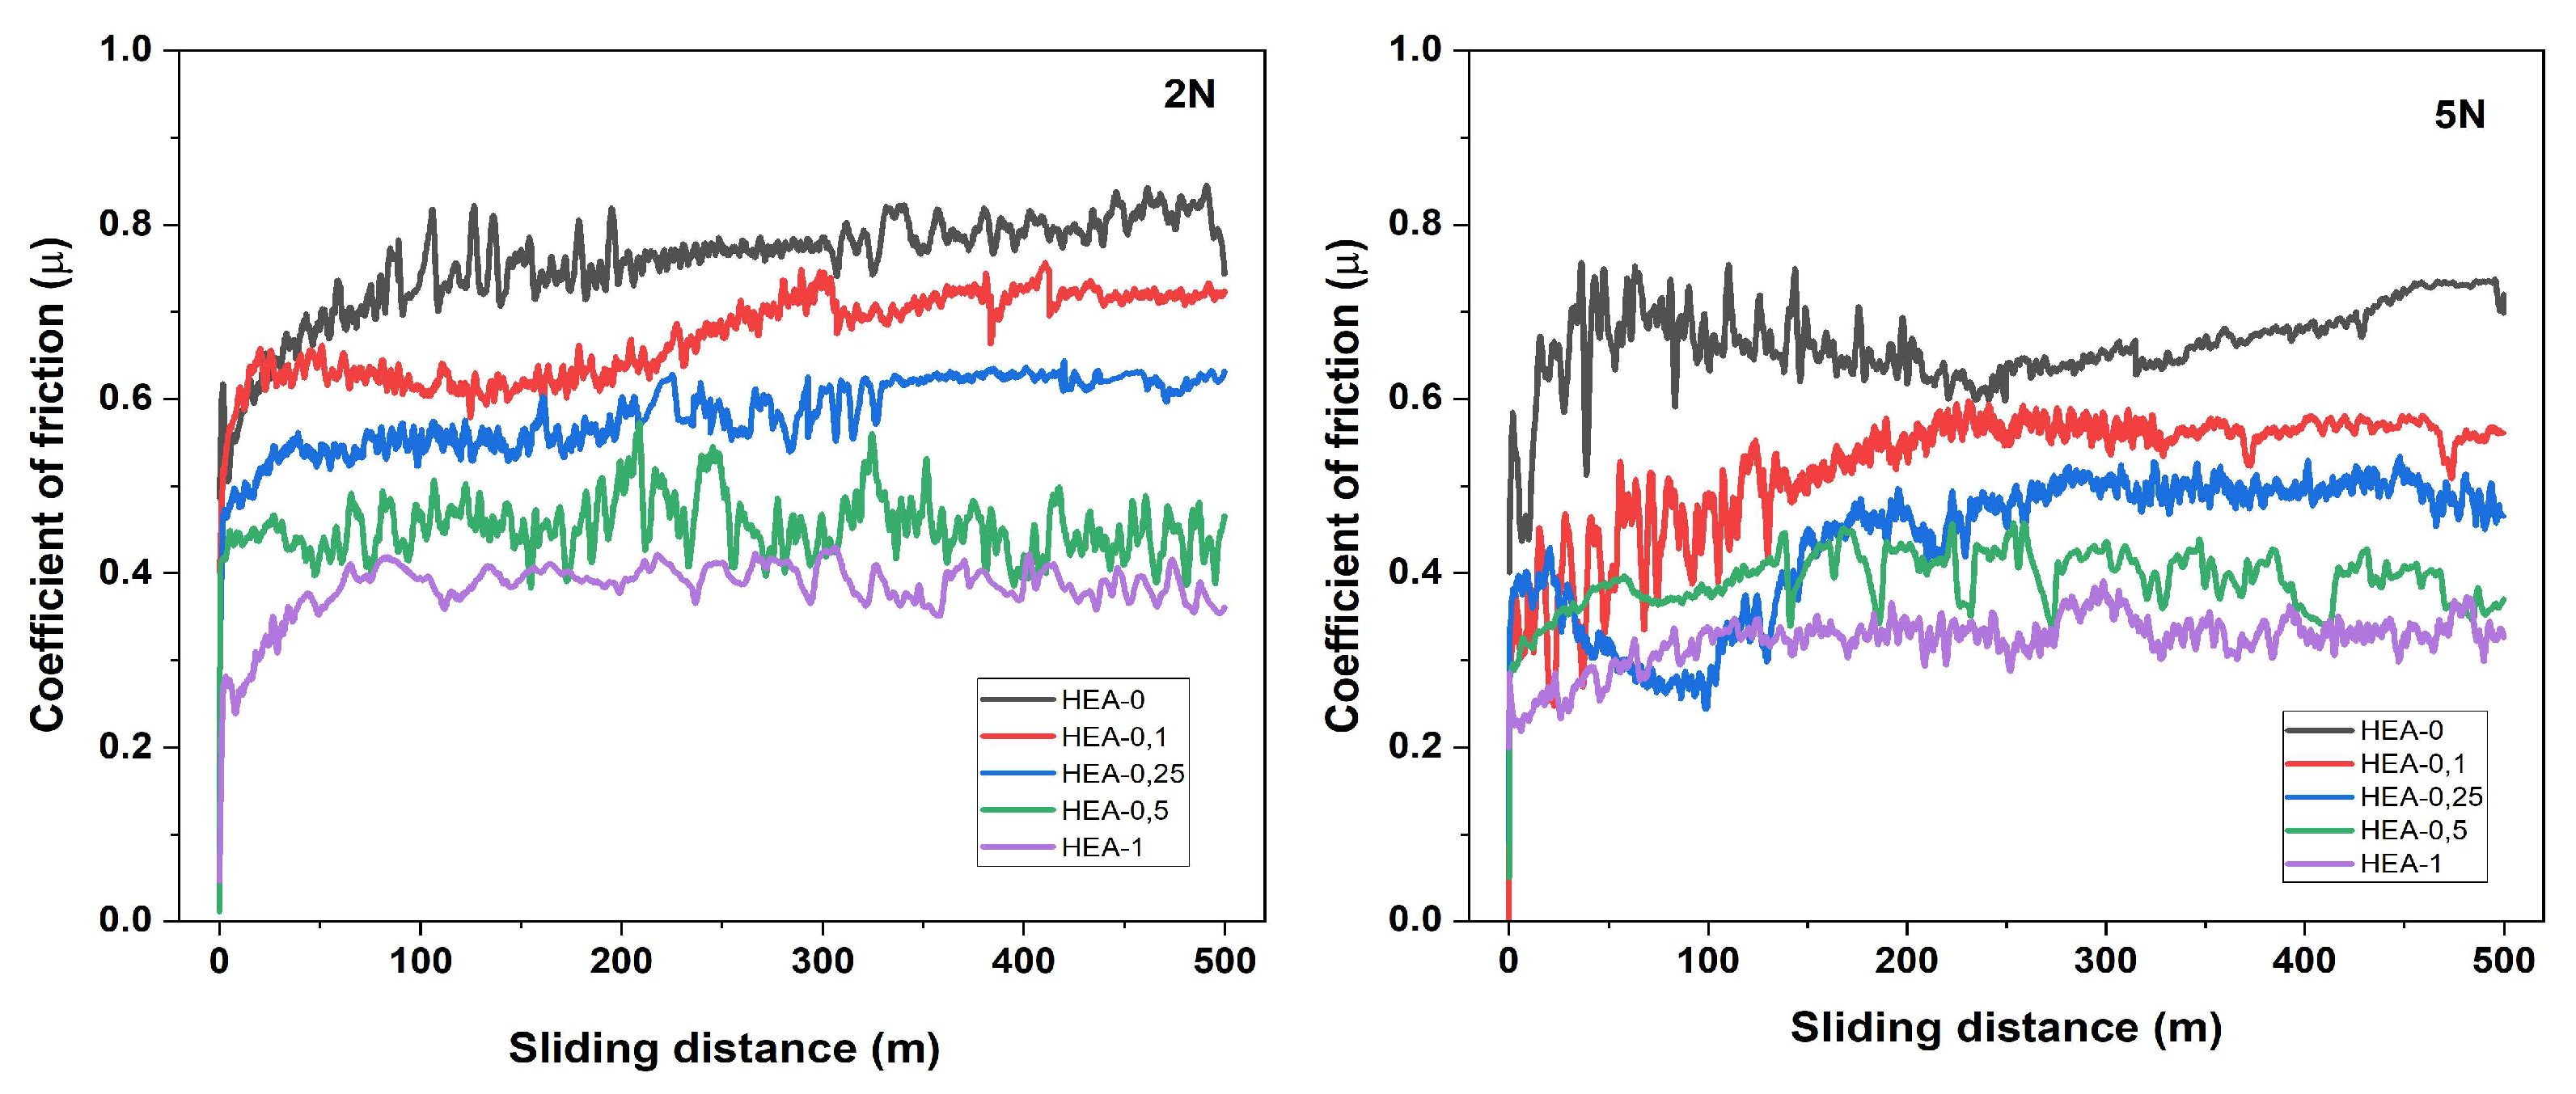
Figure 6 presents the friction coefficient (μ) versus sliding distance curves of AlCoCrFeNiW
x HEAs under applied loads of 2 N and 5 N. At the beginning of the tests, all HEAs exhibited a typical “running-in stage”, during which a sudden increase in the friction coefficient occurred within the first 50 m, followed by stabilization as the system reached equilibrium. A noticeable decrease in the friction coefficient was observed with the addition of W.
Under a 2 N load, the friction coefficient (μ) of the HEA-0 alloy was approximately 0.75 μ during the initial 50 m of sliding distance and gradually increased to around 0.82 μ as the test progressed. This alloy exhibited the highest friction coefficient among all compositions. Moreover, its friction curve displayed significant fluctuations, which are believed to be associated with strong adhesive interactions and/or severe plastic deformation on the contact surface. In comparison, the average friction coefficients of HEA-0.1 and HEA-0.25 alloys were ~0.65 μ and 0.55–0.60 μ, respectively, demonstrating more stable frictional behavior. These findings indicate that the minor addition of W moderately improved the tribological performance. The HEA-0.5 alloy showed a consistent and stable friction response with an average μ value ranging between 0.43 and 0.47, likely due to the presence of W-rich intermetallic phases such as (FeCoCr)
7W
6 in the microstructure. The HEA-1 alloy exhibited the lowest and most stable friction coefficient values, with an average in the range of 0.37–0.40 μ. The formation of (FeCoCr)
7W
6-phase promoted by the increased W content is thought to enhance surface hardness and suppress plastic deformation, thereby improving wear resistance [
31].
Under a 5 N load, the HEA-0 alloy exhibited the highest average friction coefficient, ranging from 0.78 to 0.82 μ throughout the test duration. Although the HEA-0.1 alloy demonstrated a slightly more stable friction behavior compared to HEA-0, its average friction coefficient remained between 0.65 and 0.68 μ, with irregular fluctuations still present. This indicates that the low W content contributed partially to the wear behavior but was insufficient to form an effective mechanical barrier. The HEA-0.25 alloy showed an average friction coefficient of approximately 0.58–0.60 μ and a more consistent friction behavior compared to HEA-0.1. This improvement is likely associated with the formation of fine intermetallic phases induced by W addition. The HEA-0.5 alloy demonstrated a stable friction curve with an average μ value of 0.44–0.46. HEA-1 exhibited the lowest average friction coefficient, remaining steady at approximately 0.38–0.40 μ, with an exceptionally smooth friction curve. It can be inferred that the presence of hard phases in the matrix limited plastic deformation, reduced surface damage, and consequently enhanced the stability of the contact surface.
The addition of W element functions as a solid lubricant within the HEA matrix, exhibiting a friction-reducing effect on the contact surface. The incorporation of W significantly improves the tribological performance of HEAs by reducing the coefficient of friction, enhancing hardness, and consequently increasing wear resistance. It is well known that alloying elements with high hardness, such as W and Cr, play an active role in tribological applications due to their wear-resistant properties. When introduced as reinforcing phases into the HEA structure, these elements effectively limit plastic deformation on the surface and improve the overall frictional behavior.
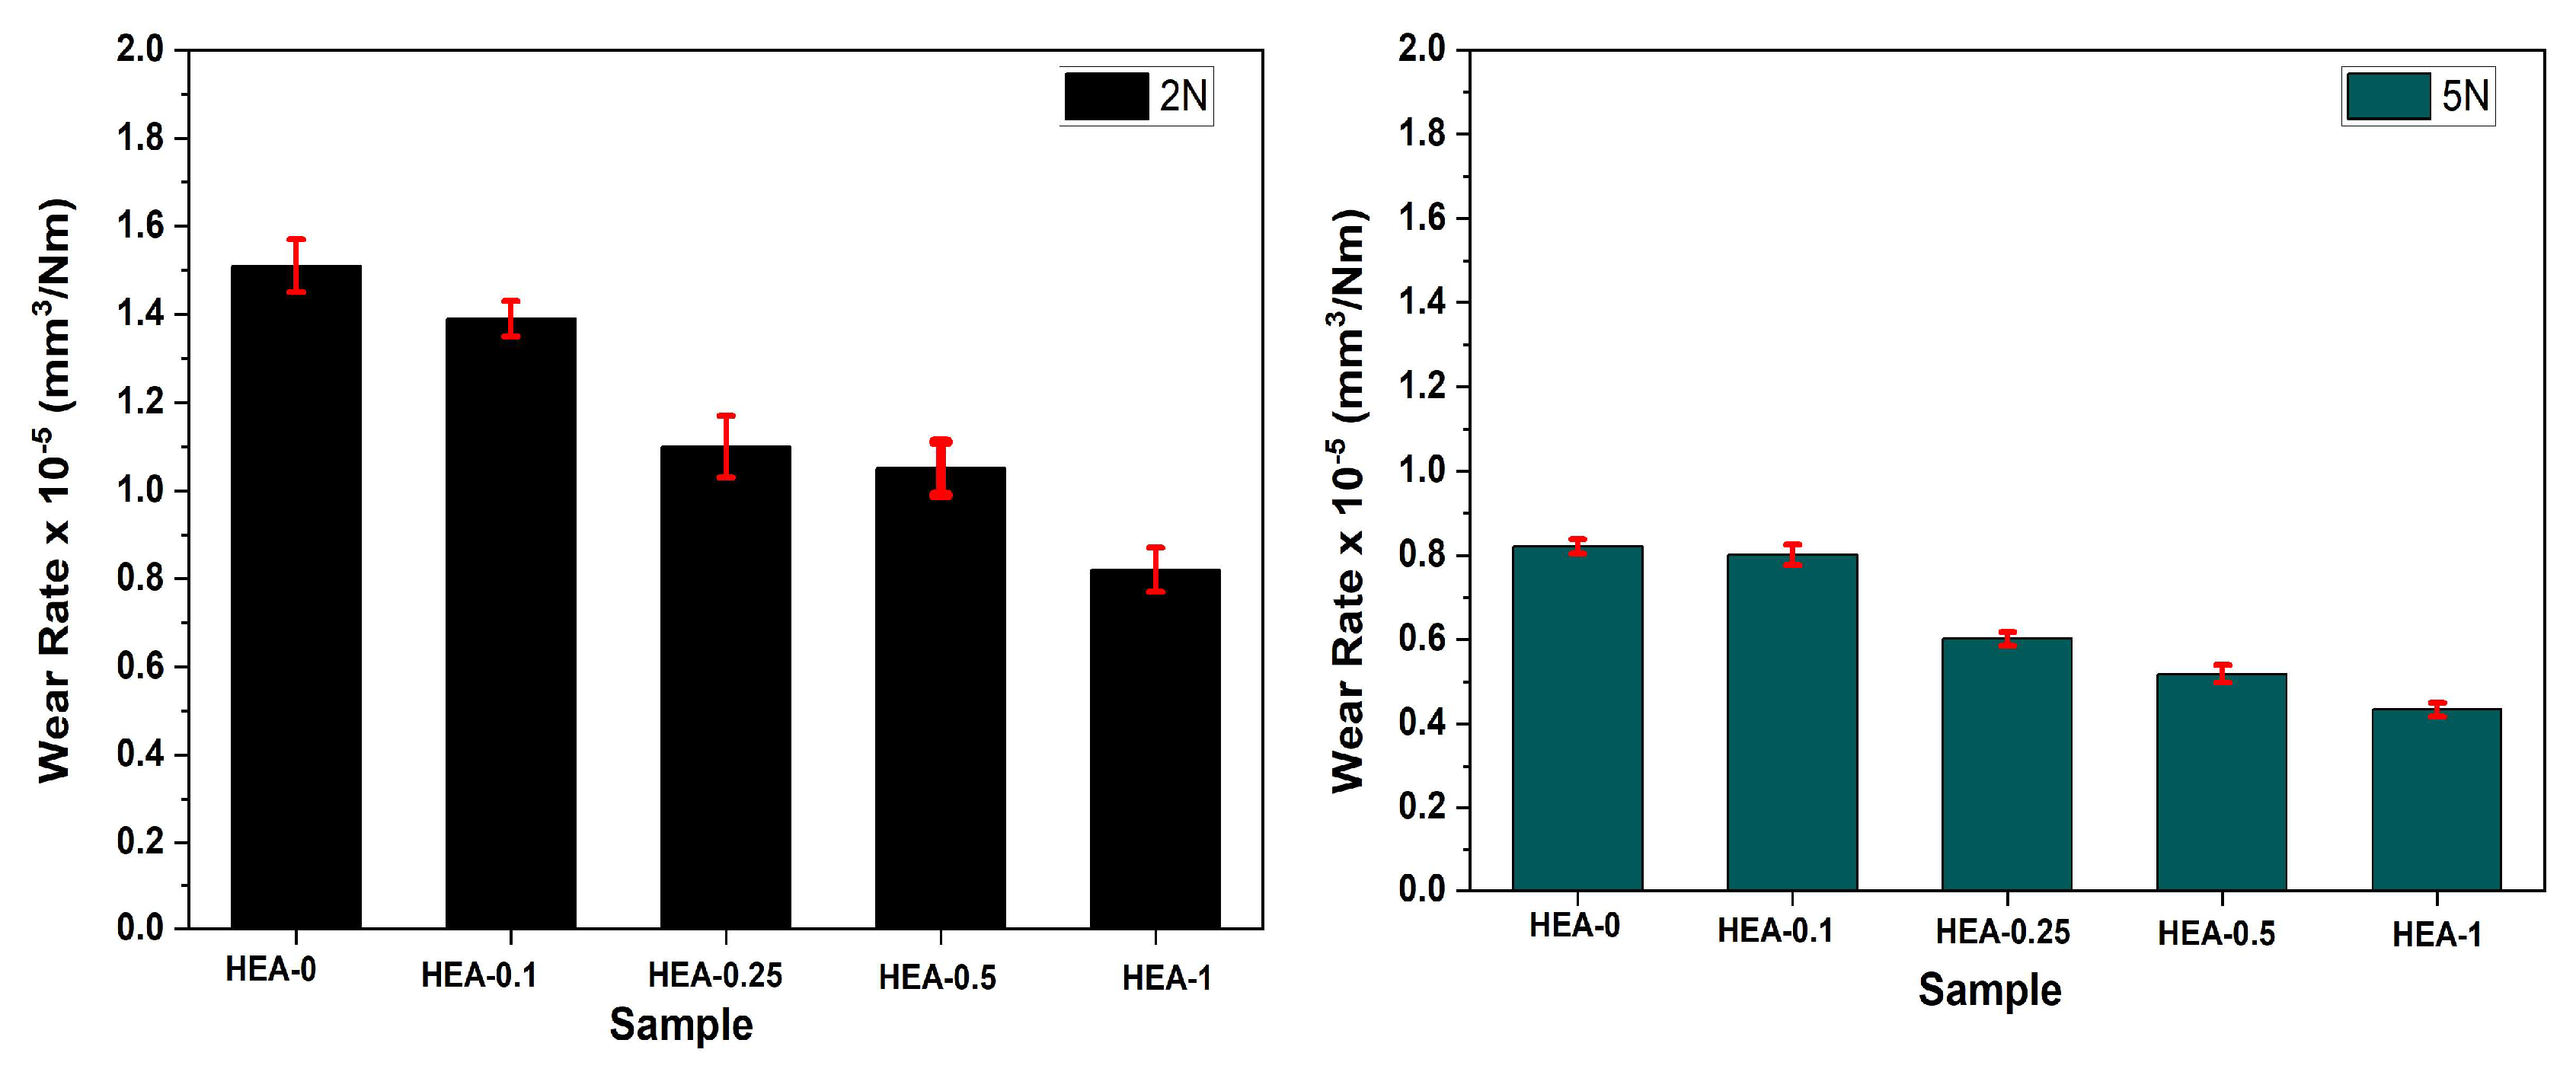
Following the wear tests, the worn surfaces were analyzed using elemental mapping, and the wear track widths as well as the distribution of alloying elements were evaluated. Wear rates were calculated using the tribometer software(V.7.2.6) based on the experimental data.
Figure 7 presents the wear rates of the fabricated HEAs under 2 N and 5 N applied loads. The increase in W content exhibited a significant influence on wear behavior under both loading conditions. In particular, the evident differences observed between the HEA-0 and HEA-1 alloys clearly demonstrate the contribution of W addition to the tribological performance. The HEA-0 alloy exhibited the highest wear rate among all the tested alloys under both 2 N and 5 N applied loads. Specifically, the wear rate was measured as 1.52 × 10
−5 mm
3/N·m at 2 N and 0.821 × 10
−5 mm
3/N·m at 5 N. These findings indicate that HEA-0 demonstrated inadequate tribological performance, which can be attributed to its low surface hardness, limited microstructural stability, and a higher tendency for plastic deformation. Additionally, the higher wear rate under the lower load (2 N) suggests an increased susceptibility to adhesive wear mechanisms. In contrast, the HEA-1 alloy showed the lowest wear rates among all compositions, with values of 0.82 × 10
−5 mm
3/N·m at 2 N and 0.433 × 10
−5 mm
3/N·m at 5 N. This corresponds to an approximately twofold improvement in wear resistance compared to HEA-0. The enhanced performance of HEA-1 is primarily associated with the formation of high-hardness intermetallic phases, such as (FeCoCr)
7W
6, induced by tungsten addition, which contributed to narrower wear tracks and reduced surface deformation. Moreover, the HEA-1 alloy exhibited a consistent and stable wear behavior under both loading conditions, suggesting that its surface hardness was effectively maintained regardless of the applied load, in agreement with experimental observations.
Figure 8 presents the SEM micrographs of the wear tracks of AlCoCrFeNiW
x HEAs obtained under applied loads of 2 N and 5 N. In addition, SEM line analyses were used to determine the wear track widths induced by the alumina ball on the HEAs. Under a 2 N load, the average wear track widths for the HEA-0, HEA-0.1, HEA-0.25, HEA-0.5, and HEA-1 alloys were measured as 755.62 μm, 695.81 μm, 525.13 μm, 520.35 μm, and 411.58 μm, respectively. Under a 5 N load, the wear track widths were measured as 1023.4 μm, 1002.4 μm, 762.36 μm, 648.22 μm, and 549.26 μm, respectively. The increase in applied load leads to a broader contact area at the wear interface, thereby resulting in more extensive surface interactions and enhanced frictional effects. In contrast, wear tracks formed under lower loads tend to be narrower, and the friction-wear relationship exhibits a more linear trend, particularly in matrix structures that are free from particle clusters or elemental segregations. However, features such as grain boundaries, W-rich hard phases, dendritic regions, and spherical morphological accumulations of alloying elements can significantly influence the frictional behavior. For instance, the hard phases present in the microstructure of the HEAs exert an abrasive effect on the contact surface of the counter ball, leading to a gradual transition from its spherical contact geometry to a flatter surface. In such cases, the worn ball material may become partially embedded into the HEA surface, potentially contributing to a reduction in the friction coefficient. This phenomenon may be associated with surface oxidation reactions. Particularly in the HEA-1 alloy, the narrow and shallow wear tracks observed indicate that wear occurs at a significantly low level, which is directly linked to both the microstructural stability and the wear resistance provided by the hard phases. As a result, it has been determined that increasing W content in the fabricated HEAs leads to a decrease in both the coefficient of friction and wear rate, thereby significantly enhancing the overall wear resistance.
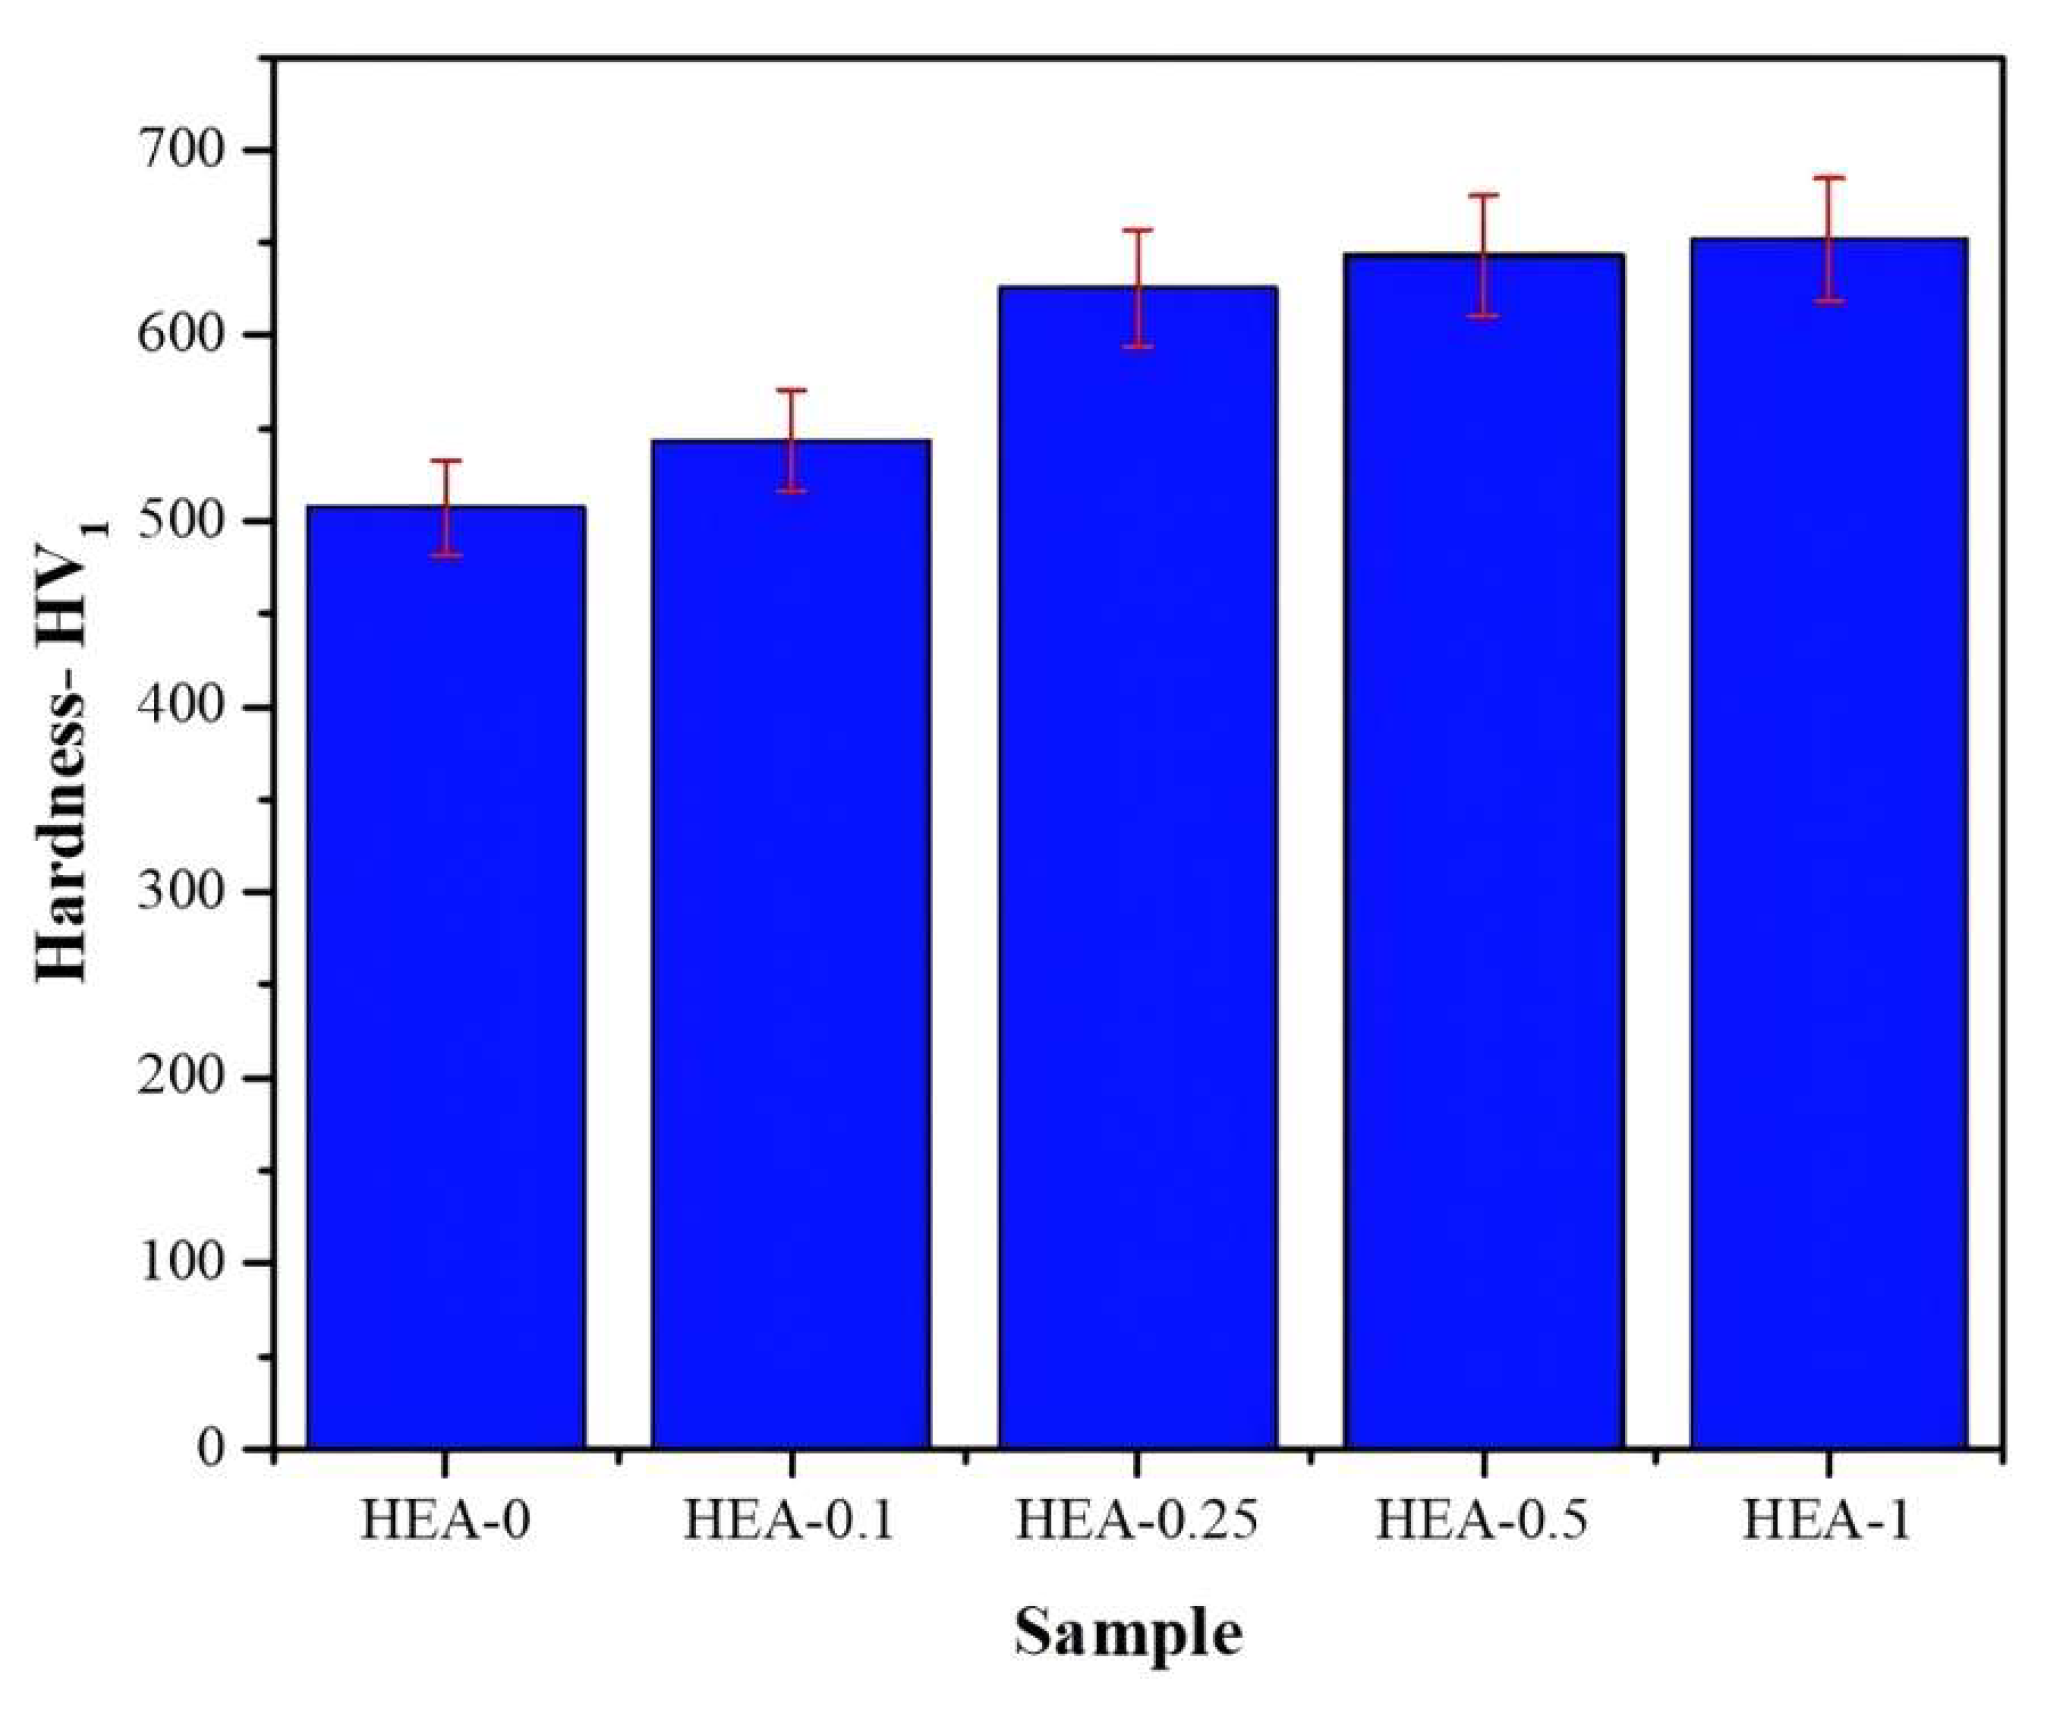
One of the key engineering approaches influencing wear rate is the formation of intermetallic phases or the development of an oxidative surface layer by alloying elements, which helps to reduce material loss. For example, the addition of 7 at.% W to the FeCoCrNi alloy enhances hardness due to lattice distortions caused by the large atomic radius of W in the solid solution phase. The additional hardness observed after heat treatment is attributed to the increased volume fraction of (Co–Fe)
7W
6-type intermetallic phases [
33]. In the present study, SEM analyses clearly revealed the formation of both W-rich dendritic structures and (Co–Fe)
7W
6 intermetallic phases, particularly in the HEA-0.5 and HEA-1 alloys.
Figure 9a,b present the mapping images of wear tracks formed under 2 N and 5 N loads, respectively. Additionally, the widths of the wear tracks were analyzed in detail. According to the mapping images shown in
Figure 9a, which correspond to the wear tracks formed under a 2 N load, branched W-rich intermetallics and agglomerated W-based phases were particularly observed within the grains. The HEA-0.5 alloy emerges as a critical threshold in this context, exhibiting granular W clusters that enhance both the microhardness and wear resistance of the alloy [
20]. However, dendritic structures were initially observed in the HEA-0.25 alloy, indicating this composition as the morphological threshold for dendritic formation. In the literature, it has been reported that the addition of 0.5 at.% W to the AlCoCrFeNiWx system results in minimum friction coefficient and wear loss. This improvement is attributed not only to the lattice distortion caused by W, but also to the formation of hard W-rich phases. In conclusion, the addition of W significantly enhances high-temperature friction and wear resistance. Moreover, unmolten W-rich particles further improve wear resistance by acting as hard reinforcing phases [
20]. In
Figure 9b, the mapping images of the HEAs under a 5 N load reveal that the wear tracks of the HEA-0.5 and HEA-1 alloys exhibit distinct nearly spherical W-rich clusters, with no apparent wear grooves or signs of delamination. In the “grey” image of the HEA-0.5 alloy, it is observed that the reciprocating motion of the spherical alumina ball causes oxidation and debris accumulation, particularly at the edges of the wear track. As observed in both
Figure 9a,b, the elements O, Al, Cr, Fe, Co, Ni, and W are clearly distributed throughout the wear track regions. These findings confirm the occurrence of oxidation induced by wear and illustrate the distribution of the constituent elements within the affected area.

