Article

Inclusions, Chemical Composition, and Spectral Characteristics of Pinkish-Purple to Purple Spinels from Mogok, Myanmar

1
School of Gemology, China University of Geosciences (Beijing), Beijing 100083, China
2
National Jewelry Testing Center (Guangdong) Co., Ltd., Guangzhou 511483, China
3
Rhein Main Gem Consulting, Forsterstraße 4, 55118 Mainz, Germany
*
Author to whom correspondence should be addressed.
Crystals 2025, 15(7), 659; https://doi.org/10.3390/cryst15070659 (registering DOI)
Submission received: 20 June 2025 / Revised: 15 July 2025 / Accepted: 17 July 2025 / Published: 19 July 2025
(This article belongs to the Collection Topic Collection: Mineralogical Crystallography)

Abstract

With the increasing market demand for spinels of various colors, purple spinel—long regarded as a symbol of nobility—has attracted growing attention. In this study, pinkish-purple to purple spinels from the Mogok region of Myanmar were systematically examined using conventional gemological, spectroscopic, and chemical analytical techniques. Raman analysis reveals that these spinels commonly contain octahedral inclusions composed of calcite, dolomite, magnesite, and graphite. Chemically, the samples are primarily magnesia-alumina spinels. Color variation is influenced by trace elements: increasing Cr and V contents enhance the red hue, while higher Fe concentrations intensify the purple tone. UV–Vis spectra show that Cr3+ and V3+ jointly contribute to absorptions at 388 nm and 548 nm, with Fe2+ and Fe3+ responsible for the bands at 371 nm and 457 nm, respectively, together controlling the pink-to-purple color variation. Most samples display four Cr3+-related peaks near 700 nm; however, these are absent in deeply purple spinels. In contrast, light pink spinels show weaker absorption at 371 nm and 457 nm, attributed to Fe2+ and Fe3+. Fluorescence spectra confirm characteristic Cr3+ emission bands at 673 nm, 684 nm, 696 nm, 706 nm, and 716 nm, indicating a strong crystal field environment. Raman spectra have peaks mainly around 312 cm−1, 406 cm−1, 665 cm−1, and 768 cm−1. The peaks of the infrared spectrum mainly appear around 840 cm−1, 729 cm−1, 587 cm−1, 545 cm−1, and 473 cm−1.

1. Introduction

In recent decades, spinel has become increasingly popular in the gemstone market due to its wide range of intense colors, high mechanical resistance, and high thermal and chemical stability [1]. The crystal structure of spinel is classified within the cubic system. The general formula of a “normal” spinel is AB2O4, where A represents divalent cations such as Mg2+, Fe2+, Zn2+, and Mn2+, and B represents trivalent cations such as Fe3+, Cr3+, and V3+. When A cations occupy one-eighth of the tetrahedral sites and B cations occupy one-half of the octahedral sites, the structure is defined as a normal spinel with the formula A[B2]O4. If A cations are distributed in octahedral sites while B cations are equally divided between tetrahedral and octahedral sites, the structure is classified as an inverse spinel, represented by the formula B[AB]O4 [1,2,3,4,5,6].
Gem-quality spinel occurs in a wide range of colors; however, pure spinel (MgAl2O4) is colorless. The presence of various trace transition metal elements—such as Cr3+, Fe2+, Fe3+, and Co2+—produces different hues. Cr3+ imparts a red color, V3+ leads to orange tones, and Co2+ results in blue coloration, while combinations of Fe2+ and Fe3+ contribute to shades ranging from light blue or violet to green and even black as iron concentration increases. Yellowish-green spinels are associated with elevated Mn content [3,7,8,9].
Myanmar’s Mogok region is renowned for producing high-quality spinel, most famously the vivid red “Jedi” spinels. In addition to red stones, pink, orange, purple, and metallic gray spinels from this region are also well regarded [6,10]. In recent years, extensive research and exploration of purple spinel deposits in Afghanistan and Vietnam [8,11] have drawn significant market interest to this variety, leading to increased attention to Mogok purple spinels. However, current research on Myanmar spinel has primarily focused on red and pink varieties [1,5,12,13,14,15], with limited studies addressing the characteristics of purple spinels [4,12]. Moreover, the differences in elemental composition and spectroscopic characteristics between pinkish-purple and purple spinels have not been thoroughly investigated. To address these gaps, this study selects a series of spinel samples ranging from pinkish-purple to intense purple for comprehensive analysis. The aim of this study is to analyze the gemological properties, internal inclusions, chemical composition, and spectroscopic characteristics of the samples; to clarify the relationship between inclusion types and geological origin; to explore the chromogenic mechanisms and luminescence properties of purplish spinels; and to compare chemical differences among spinels from various localities, thereby providing insights into the connections and distinctions between Myanmar red-purple and purple spinels.

2. Regional Geological Setting

Mogok, Myanmar, the principal source of gem-quality spinel, lies within the Mogok Metamorphic Belt (MMB) in Mandalay Province (Figure 1). The MMB stretches over 1450 km in length and 40 km in width, consisting mainly of regionally metamorphosed rocks, including kyanite, sillimanite schist, and granite [16]. Located along the western edge of the Shan Plateau, it extends northward into the eastern Himalayas and is a key tectonic unit of the eastern Himalayan orogenic system. Owing to the occurrence of rubies, sapphires, and other gemstones in this area, the northern section of the belt has historically been the focus of extensive exploration and research.
Ruby-bearing marbles in the northern MMB formed during the Precambrian, with some rocks also attributed to the Jurassic period. In contrast, the southern part of the belt hosts fewer ruby deposits, with some metamorphic rocks dated to the Jurassic period [17]. The mineral assemblage includes tourmaline, garnet, biotite, muscovite, phlogopite, diopside, spinel, tremolite marble, and calcium silicate rocks containing gem-quality rubies [17].
The genesis of spinel deposits in this region is closely related to Himalayan orogenic activity [16]. Spinel deposits are classified as primary or secondary types [18]. Primary deposits can be further subdivided into metamorphic and magmatic types. Metamorphic-type spinels form in contact zones where magma intrudes limestone or dolomite, typically accompanied by forsterite and diopside. Magmatic-type spinels occur in aluminum-rich mafic rocks, commonly associated with pyroxene, olivine, magnetite, chromite, and platinum-group minerals [18]. Secondary deposits, where spinel coexists with ruby and sapphire, also serve as an important source of gem-quality spinel.
Figure 1. Geological map of the Myanmar (modified from Google Earth and [19,20]).
Crystals 15 00659 g001

3. Materials and Methods

3.1. Materials

A total of 13 faceted spinel samples were examined in this study (Figure 2), including 11 from Mogok, Myanmar (M1–M11), one from Sri Lanka (S1), and one from Tajikistan (T1). All specimens measure 6.9 × 4.3 mm or smaller. The Myanmar samples were sourced from the same mine. None of the spinels have undergone any treatment other than cutting and polishing.

3.2. Methods

3.2.1. Conventional Gemological Features

Conventional gemological properties were determined at the Gemological Experimental Teaching Center at the School of Gemology, China University of Geosciences (Beijing). Refractive indices (RI) were measured using a Fable refractometer with sodium light (589 nm) as the illumination source and diiodomethane (CH2I2) saturated with sulfur (RI = 1.81) as the contact liquid. Specific gravity (SG) was determined using a hydrostatic balance constructed with a Mettler electronic balance. Ultraviolet fluorescence was examined under both long-wave (365 nm) and short-wave (254 nm) UV light sources.

3.2.2. Energy Dispersive X-Ray Fluorescence (EDXRF)

EDXRF analysis was performed at the Gemological Experimental Teaching Center, School of Gemology, China University of Geosciences (Beijing), using an EDX-7000 spectrometer manufactured by Shimadzu (Kyoto, Japan) for semi-quantitative, non-destructive elemental analysis (13Al-92U). Measurements were taken at four points on each sample under vacuum conditions, and their average was used for data analysis. Detection limits ranged from the ppm level for heavy elements to approximately 0.1 at% for light elements.

3.2.3. UV–Visible (UV–Vis) Spectrophotometry

UV–Vis spectra were recorded at the Guangzhou Laboratory of China National Jewelry Inspection Group using a GEM-3000 spectrophotometer manufactured by Biaoqi (Guangzhou, China) in reflectance mode under the following conditions: integration time of 150 ms, 30 averaging scans, a smoothing factor of 2, spectral resolution of 0.5 nm, and a wavelength range of 200–1000 nm.

3.2.4. Fourier Transform Infrared (FTIR) Spectroscopy

FTIR analysis was conducted using a Nicolet 6700 spectrometer (Thermo Fisher Scientific, Waltham, MA, USA) at the Guangzhou Laboratory of the China National Jewelry Inspection Group. Test conditions: reflected light, 8 background scans, resolution 4 cm−1; grating configured at 6 mm and 10 kHz; spectral range 400–1000 cm−1; 64 scans collected per sample.

3.2.5. Raman Spectroscopy

Raman spectroscopy was conducted at the Guangzhou Laboratory of China National Jewelry Inspection Group using a Renishaw inVia micro-laser Raman spectrometer (Renishaw, Gloucestershire, UK). with a 532 nm excitation laser. Surface measurements of spinel were performed in the 200–1000 cm−1 range using point scanning mode with 10 accumulations per point. Depth profiling of internal inclusions was carried out over the 200–2000 cm−1 range, with 100 acquisition points at 2 μm intervals. The laser power was set to 100 mW, with a spot size of 20 μm and a spectral resolution of 4 cm−1.

3.2.6. Fluorescence Spectroscopy

Fluorescence spectroscopy was carried out at China University of Geosciences (Beijing) using a QSpec GEM-3000 spectrophotometer (BiaoQi, Guangzhou, China). The measurement conditions were as follows: integration time of 150 ms, 10 scans averaged, smoothing width of 1 nm, spectral range of 600–750 nm, under room temperature conditions.

4. Results and Discussion

4.1. Gemological Characteristics

Several experienced gem traders from Thailand and China classified the spinel samples based on their color appearance under unaided (naked-eye) observation. The results showed a high degree of consistency, allowing the samples to be grouped into two categories: pinkish-purple spinels, characterized by an observable pink tint, and purple spinels, which exhibit no obvious pink hue. The purple spinel group exhibits slightly higher refractive indices and specific gravity values compared to the pinkish-purple group. Under short-wave ultraviolet (SWUV) light, both groups generally show no observable fluorescence; however, the pinkish-purple samples show stronger fluorescence intensity under long-wave ultraviolet (LWUV) light than the purple group (Table 1).

4.2. Inclusions

Spinel deposits in Myanmar are classified as carbonate-hosted types [21,22]. Consequently, carbonate mineral inclusions such as calcite, magnesite, and dolomite are among the most commonly observed [2]. In addition, a variety of other mineral inclusions have been reported in Mogok spinels, including anhydrite, apatite, elemental sulfur, graphite, iron oxides or hydroxides, phlogopite, zircon, amphibole (presumably pargasite), anatase, baddeleyite, boehmite, brucite, chlorite, clinohumite, clinopyroxene, diaspore, geikielite, goethite, halite, marcasite, molybdenite, periclase, pyrrhotite, among others [14,23,24,25,26,27,28,29].
Observations under a gemological microscope revealed various types of inclusions in the Mogok spinel samples. The most common are colorless, transparent, octahedral inclusions with well-developed crystal forms, typically ranging from 20 to 50 μm in diameter. These octahedral inclusions exhibit bright reflections under certain orientations, indicating their solid nature. Some inclusions are scattered individually throughout the host crystal (Figure 3a,d), while others are arranged in fingerprint-like patterns (Figure 3e). Additionally, some samples contain dark mineral inclusions on the surface (Figure 3c) or fractures within the crystal (Figure 3b).
Raman spectroscopy revealed that the fingerprint-like inclusions in sample M8 exhibit characteristic peaks at 279 cm−1, 707 cm−1, and 1089 cm−1 corresponding to calcite, and at 303 cm−1 and 1094 cm−1 attributable to dolomite [2,4,30], indicating that these crystalline inclusions consist of both calcite and dolomite. Two octahedral inclusions from sample M9 (Figure 3c,d) were also analyzed by Raman spectroscopy (Figure 4b,c). The black mineral particles attached to the colorless octahedral inclusions in M9 display a distinct Raman peak at 1576 cm−1, characteristic of graphite. Previous studies have shown that graphite inclusions are typically associated with calcite rather than apatite [4,14], and their presence indicates that these spinels formed under highly reducing conditions [4,14]. Another octahedral inclusion near the pavilion of M9 displays peaks at 330 cm−1, 713 cm−1, and 1094 cm−1, consistent with dolomite [2,4,30]. The columnar inclusions in sample M10 exhibit Raman peaks at 269 cm−1 corresponding to calcite and at 322 cm−1, 726 cm−1, and 1089 cm−1 corresponding to magnesite [4,30], suggesting that these inclusions may be a mixture of calcite and magnesite.
The variation in inclusions among spinels from different localities reflects differences in their geological formation environments. The main internal features of spinels from various origins are summarized in Table 2. Spinels from Myanmar, Sri Lanka, Vietnam, and Tanzania are typically hosted in marble deposits [4,22,31,32,33,34,35], where carbonate minerals are the most common inclusions. Notably, amphibole has only been reported in spinels from Kyauksin, Mogok [14]. In addition, inclusions such as anatase, baddeleyite, brucite, and chlorite have been observed in trace amounts in Myanmar spinels [12,14], potentially serving as indicators of their provenance. Talc is a characteristic inclusion in Vietnamese spinels, while dolomite predominates in Tanzanian spinels [4]. In contrast, spinel deposits in Tajikistan are associated with magnesian skarn within enstatite-forsterite rocks [12,20], resulting in a scarcity of carbonate inclusions. Instead, rutile, zircon, and talc are the most common inclusions in Tajikistan spinels [12,14], distinctly differentiating them from those of Myanmar origin.

4.3. Chemical Composition

The chemical compositions of all investigated specimens, determined by EDXRF, are summarized in Table 3. The concentrations of each element are reported as their respective oxides.
As shown in Table 3, the main chemical components of the spinel samples from Mogok, Myanmar, are MgO (0.535–28.402 wt%) and Al2O3 (66.578–80.046 wt%), confirming that the samples are predominantly Mg–Al spinels. In addition to these major oxides, trace amounts of Cr (0.041–0.435 wt%), V (0.002–1.725 wt%), Fe (0.276–14.723 wt%), Zn (0.085–7.564 wt%), and Si (0.000–4.096 wt%) are also present. The Fe2O3 content represents the total iron concentration, regardless of its oxidation state.
Trace elements typically associated with gemstone coloration, including Cr, V, Fe, Ti, Mn, and Ni, were identified in the spinel samples. However, due to the relatively low concentrations of Ti and Ni, their influence on color development is considered negligible. Therefore, Cr, V, Fe, and Mn were selected for detailed analysis to evaluate their contributions to the color differences between pinkish-purple and purple spinels.
To improve data interpretation, exploration, and visualization, principal component analysis (PCA)—a widely adopted method in multivariate statistical analysis [36,37]—was performed using OriginPro 2024 (Figure 5). The PCA results show that the first principal component (PC1) accounts for 55.4% of the total variance, while the second principal component (PC2) explains 34.1%, with a cumulative variance contribution of 89.5%. These results suggest that the two principal components effectively capture the overall color profile of the samples.
In the PCA plot, the ellipses corresponding to pinkish-purple and purple spinels show partial overlap, indicating a similar distribution of chromophoric element concentrations. This suggests that these two color types are not entirely separate groups but rather exhibit a continuous or transitional variation in their chromogenic compositions. Nonetheless, the ellipses are elongated along different directions—horizontally for one group and vertically for the other—implying that distinguishable differences in key coloring elements exist, which may allow for further classification. The blue arrows in the PCA plot represent the element loadings. V2O5 and Fe2O3 have the longest loading vectors, nearly parallel to the PC1 axis, while the Cr2O3 loading vector forms the smallest angle with the PC2 axis and is the longest along that direction. In contrast, the MnO loading vector is of moderate length and points between PC1 and PC2, indicating its relatively minor role in explaining variance and the weakest contribution to color differences. Therefore, it can be concluded that Cr2O3, Fe2O3, and V2O5 are the primary elements influencing the observed color variations among the spinel samples.
Figure 6 clearly shows that Fe content has a strong influence on the bluish-purple coloration of spinel, whereas Cr content plays a crucial role in enhancing the pinkish hues. Relative to Fe and Cr, V exhibits a relatively minor effect on the coloration of pinkish-purple and purple spinels; however, a general trend indicates that increasing V content tends to shift the hue towards a more reddish-pink tone. For example, M10 and M11—samples with the most intense purple hues and the highest Fe concentrations—show minimal differences in Cr2O3 content (approximately 0.05% for M10 and 0.045% for M11). However, the V2O5 content in M10 is significantly higher (1.725%) than in M11 (0.138%), which corresponds to a more pronounced red hue in M10. This suggests that V contributes appreciably to the reddish-orange tone in spinels.
Furthermore, as shown in Figure 6d, the intensity of the purple hue increases with higher Fe content, while the red hue becomes more prominent with increasing Cr content. When the Fe content exceeds eight times that of Cr, the spinel predominantly exhibits a purple hue. Conversely, as this ratio decreases, the red component gradually intensifies and eventually becomes the dominant hue. In summary, Fe is primarily responsible for the bluish-purple coloration of spinel, whereas Cr, either alone or in combination with V, contributes to the development of reddish-pink hues.
In addition, although Zn is not a transition metal element directly responsible for coloration, it may still influence the color of spinel to some extent. As shown in Figure 7, a general trend of lighter body color and weakened purple hue is observed with increasing Zn content. One possible explanation for this phenomenon is Zn-induced spinel inversion, wherein Zn2+ ions preferentially occupy octahedral sites within the spinel structure. This substitution increases cationic disorder and promotes the migration of polyvalent impurity cations, such as Fe2+ and Fe3+ ions, into tetrahedral positions [38,39]. When Fe ions are incorporated into tetrahedral coordination, the crystal field strength is reduced, which decreases the intensity of d-d electronic transitions and results in a diminished purple hue or a shift toward a more grayish tone in spinel.
To investigate the differences in chemical composition between red-purple spinels from Mogok, Myanmar, and those from other localities, comparative data were selected from previously published studies on spinels from Kuh-i-Lal, Tajikistan [7]; Elahera, Sri Lanka [2]; Ipanko, Tanzania [31]; and Lục Yên, Vietnam [1,31]. As most existing research on spinels from these regions has predominantly focused on pink varieties rather than purple ones, only the compositional data of pink spinels reported in these studies were included for comparison in the present work.
Fe, Cr, and V are the principal chromogenic elements in spinel, while Zn enrichment is a distinctive feature of spinels from Mogok, Myanmar [23]. Therefore, the concentrations of these four elements were compared using a ternary diagram (Figure 8). Trace element analysis reveals that spinels from different localities occupy distinct compositional fields, with Myanmar samples showing a unique distribution pattern among global occurrences.
Notable regional differences in elemental concentrations are evident. Spinels from Myanmar generally exhibit low Cr and V contents, while Fe concentrations show considerable variability, possibly due to the wide range of color intensities from light to dark among the samples. Consequently, the compositional field of Myanmar spinels extends across a broad region. In contrast, spinels from Tajikistan display relatively consistent Cr concentrations. Tanzanian spinels exhibit a wide range of Zn contents, whereas Vietnamese spinels are characterized by substantial variability in V concentrations. The compositional field of Myanmar spinels partially overlaps with that of Sri Lankan spinels; however, the limited available data for Sri Lankan samples is insufficient to clearly define the geochemical characteristics of this origin.

4.4. Spectra Analysis

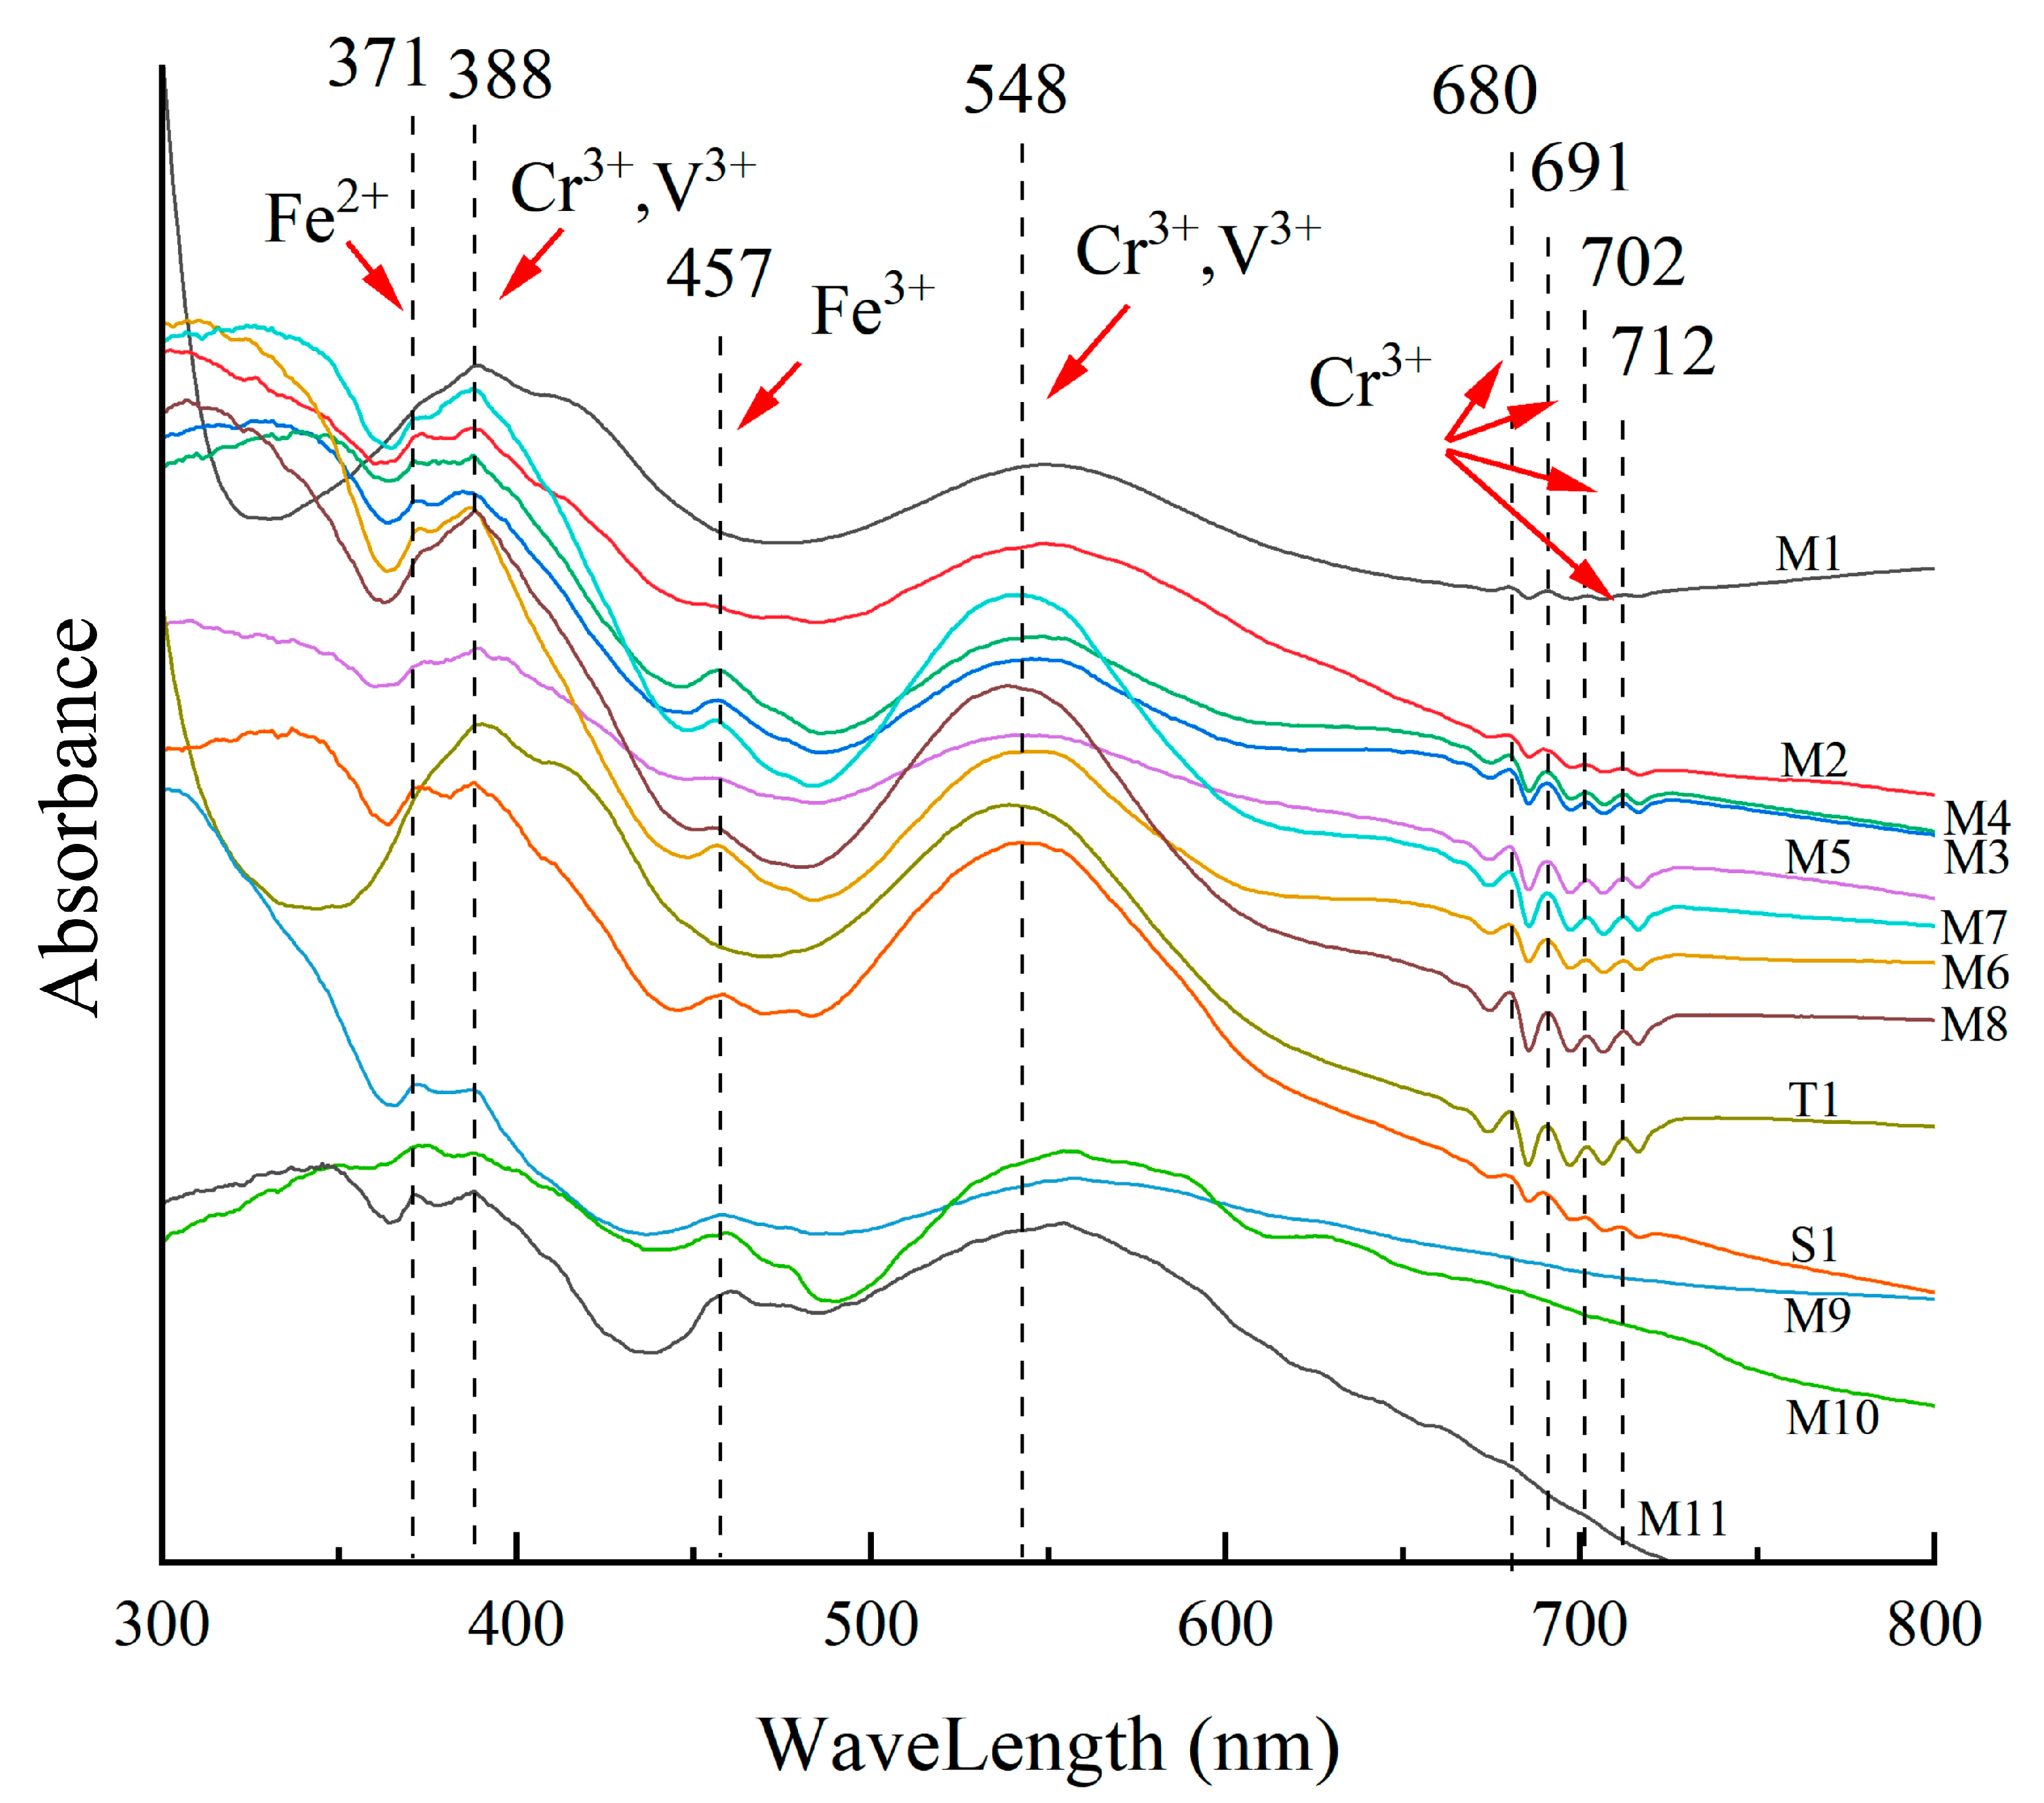
4.4.1. UV–Vis Spectra

As shown in the UV–Vis spectra (Figure 9), spinels from Myanmar exhibit prominent absorption features at approximately 371 nm, 388 nm, 457 nm, and a broad band centered around 548 nm. Most samples also display four distinct peaks at approximately 700 nm. The UV–Vis spectra of pinkish-purple and purple spinels are generally similar in the 300–600 nm range; however, notable differences are observed near 700 nm. Specifically, samples M9, M10, and M11 do not exhibit absorption peaks in this region.
V3+ typically exhibits absorption bands at 392 nm and 541 nm, resulting from spin-allowed d-d transitions 3T1g(F) → 3T1g(P) and 3T1(F) → 3T2(F) in the octahedral M site [2,7,40]. Cr3+, on the other hand, shows two strong and broad absorption bands at 388 nm and 532 nm, which are attributed to the spin-allowed electron d-d transitions 4A2g4T1g(F) and 4A2g4T2g(F) at the M sites [7,40]. The absorption features of Cr3+ and V3+ often overlap, collectively forming absorption bands around 400 nm and 550 nm [40,41,42]. A peak at 371 nm, corresponding to Fe2+, is also observed in the spectrum [42]. Broad bands at 457 nm may be assigned principally to spin-forbidden 6A1g4A1g, 4Eg transitions of isolated MFe3+ ions, possibly intensified by ECP interactions and by spin-forbidden transitions of TFe2+ [4,43]. The peaks near 700 nm are characteristic of Cr3+ absorption [4,5].
Eight absorption peaks with relatively fixed positions are observed in the 300–800 nm range, suggesting that the spin-allowed transitions of Cr3+ and V3+ primarily contribute to the red-purple and purple colors of the spinels. M1 and T1 samples do not exhibit Fe peaks at 371 nm and 457 nm due to their very low Fe content. Similarly, M9, M10, and M11 samples lack the four absorption bands near 700 nm because of the low Cr content and instead display only a broad absorption band around 550 nm. The primary absorption bands of the samples are located at 400 nm and 550 nm. The 400 nm absorption band corresponds to the purple and part of the blue regions of the visible spectrum, while the 550 nm absorption band spans the yellow to green and blue regions. As a result, when light passes through red-purple and purple spinels, they selectively absorb blue-violet and yellow-green light, producing a complementary color effect consisting of a mixture of red and a slight blue hue.

4.4.2. Fluorescence Spectra

According to previous studies [4,44,45], the characteristic fluorescence emission peak of purple and pinkish-purple spinels is located at approximately 683 nm. Therefore, excitation spectra were recorded by scanning the excitation wavelengths capable of inducing this 683 nm emission. Most of the analyzed samples exhibited two prominent excitation bands centered at 393 nm and 532 nm, as shown in Figure 10. Notably, a distinct excitation band at 299 nm is observed in sample M10 with increased iron content, which may be attributed to the spin-forbidden 6A14T1(4P) transition of Fe3+ ions [46].
The fluorescence spectra of the spinel samples were recorded under excitations at 393 nm and 532 nm, respectively, yielding nearly identical emission profiles (Figure 11). The samples were tested and found to have multiple fluorescence peaks at 673 nm, 684 nm, 696 nm, 706 nm, 716 nm, and 721nm, concentrated in the range of 650–750 nm. All these emission peaks are attributed to electronic transitions of Cr3+ ions between the 2E and 4A2 energy levels [7]. Both spectra exhibit a strong zero phonon line at approximately 684 nm, along with vibronic sidebands and additional features attributable to Cr3+ pairs. The sharp and well-resolved chromium-related emission peaks indicate that the spinels are of natural origin and have not been subjected to heat treatment, as thermal enhancement typically leads to peak broadening and positional shifts [47,48,49].

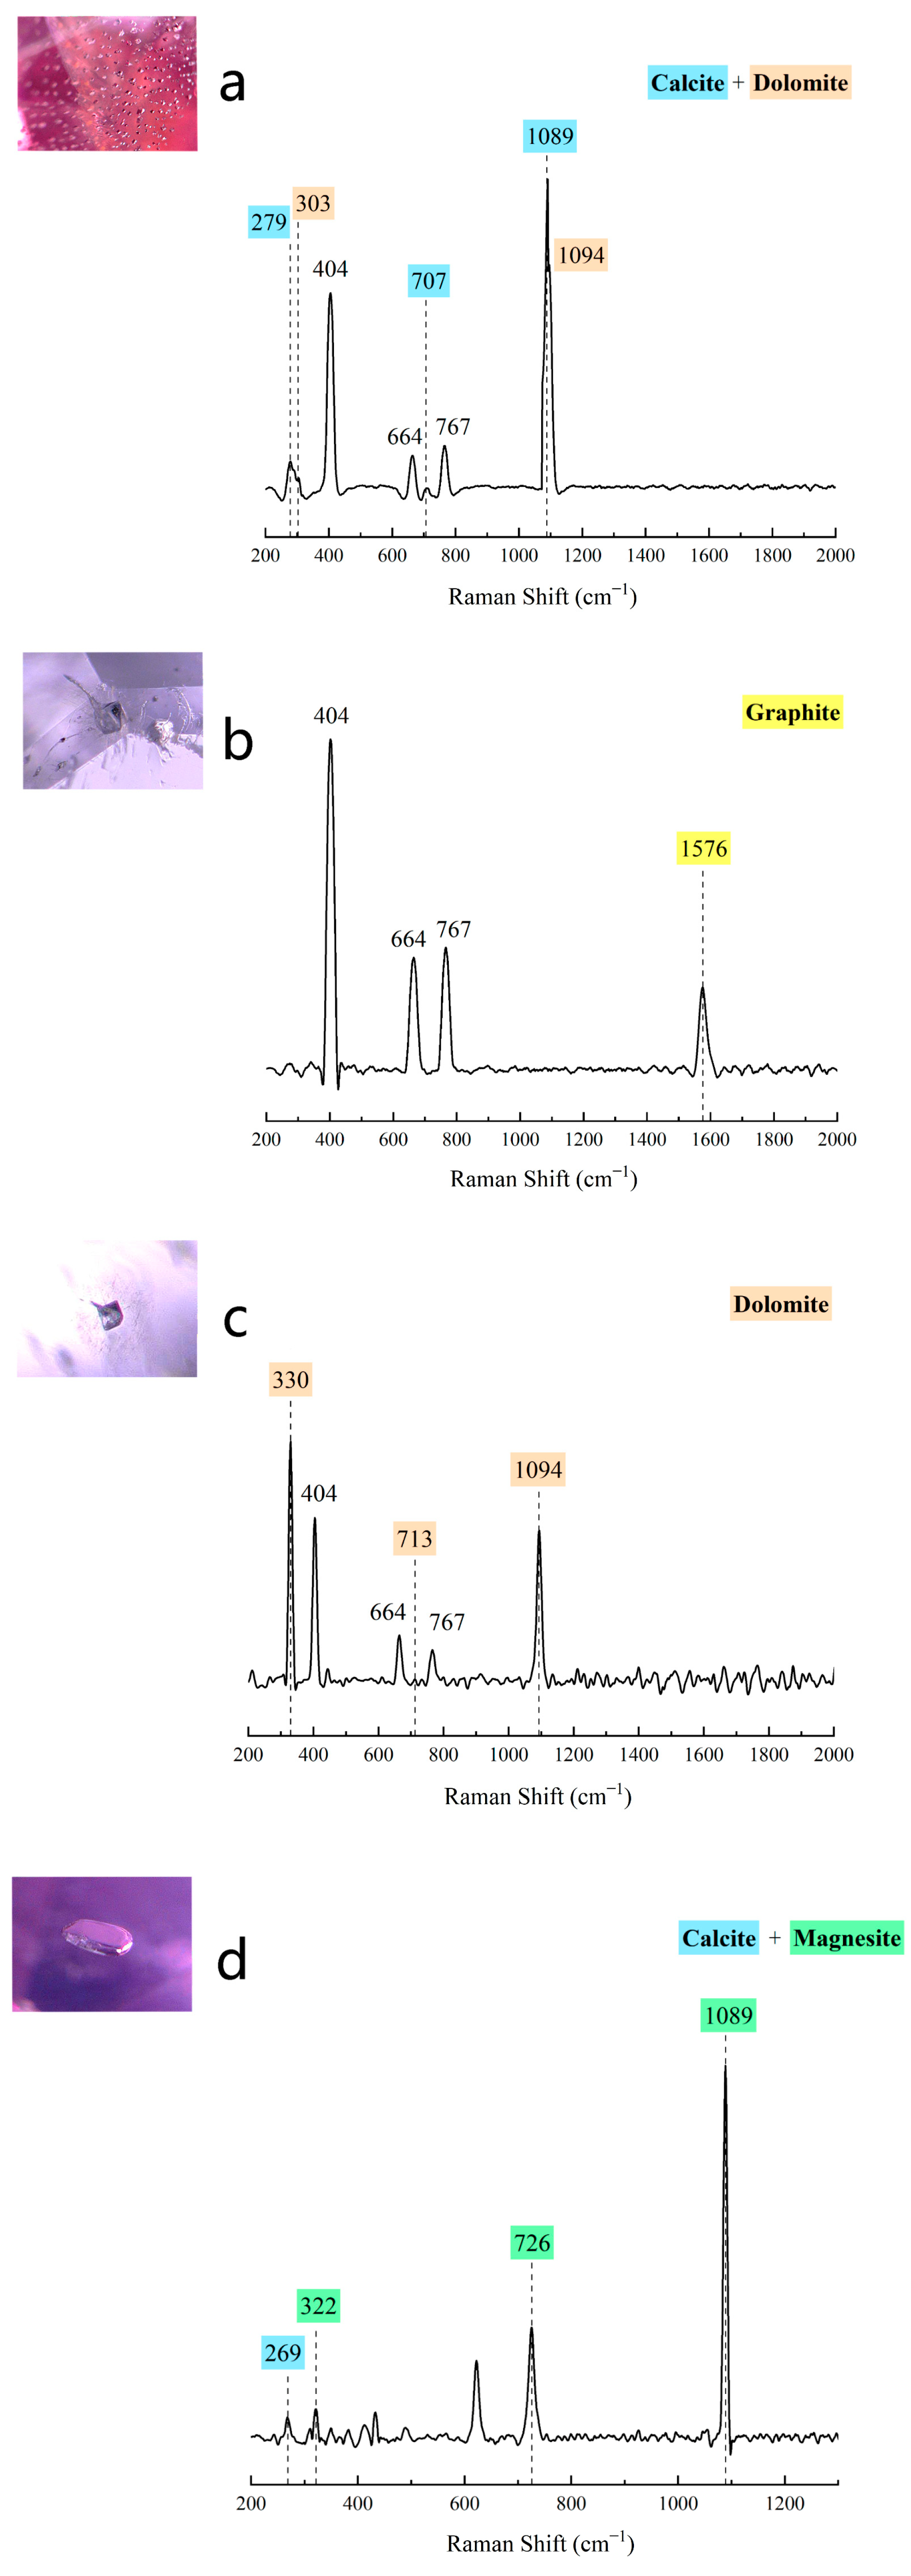
4.4.3. Raman Spectra
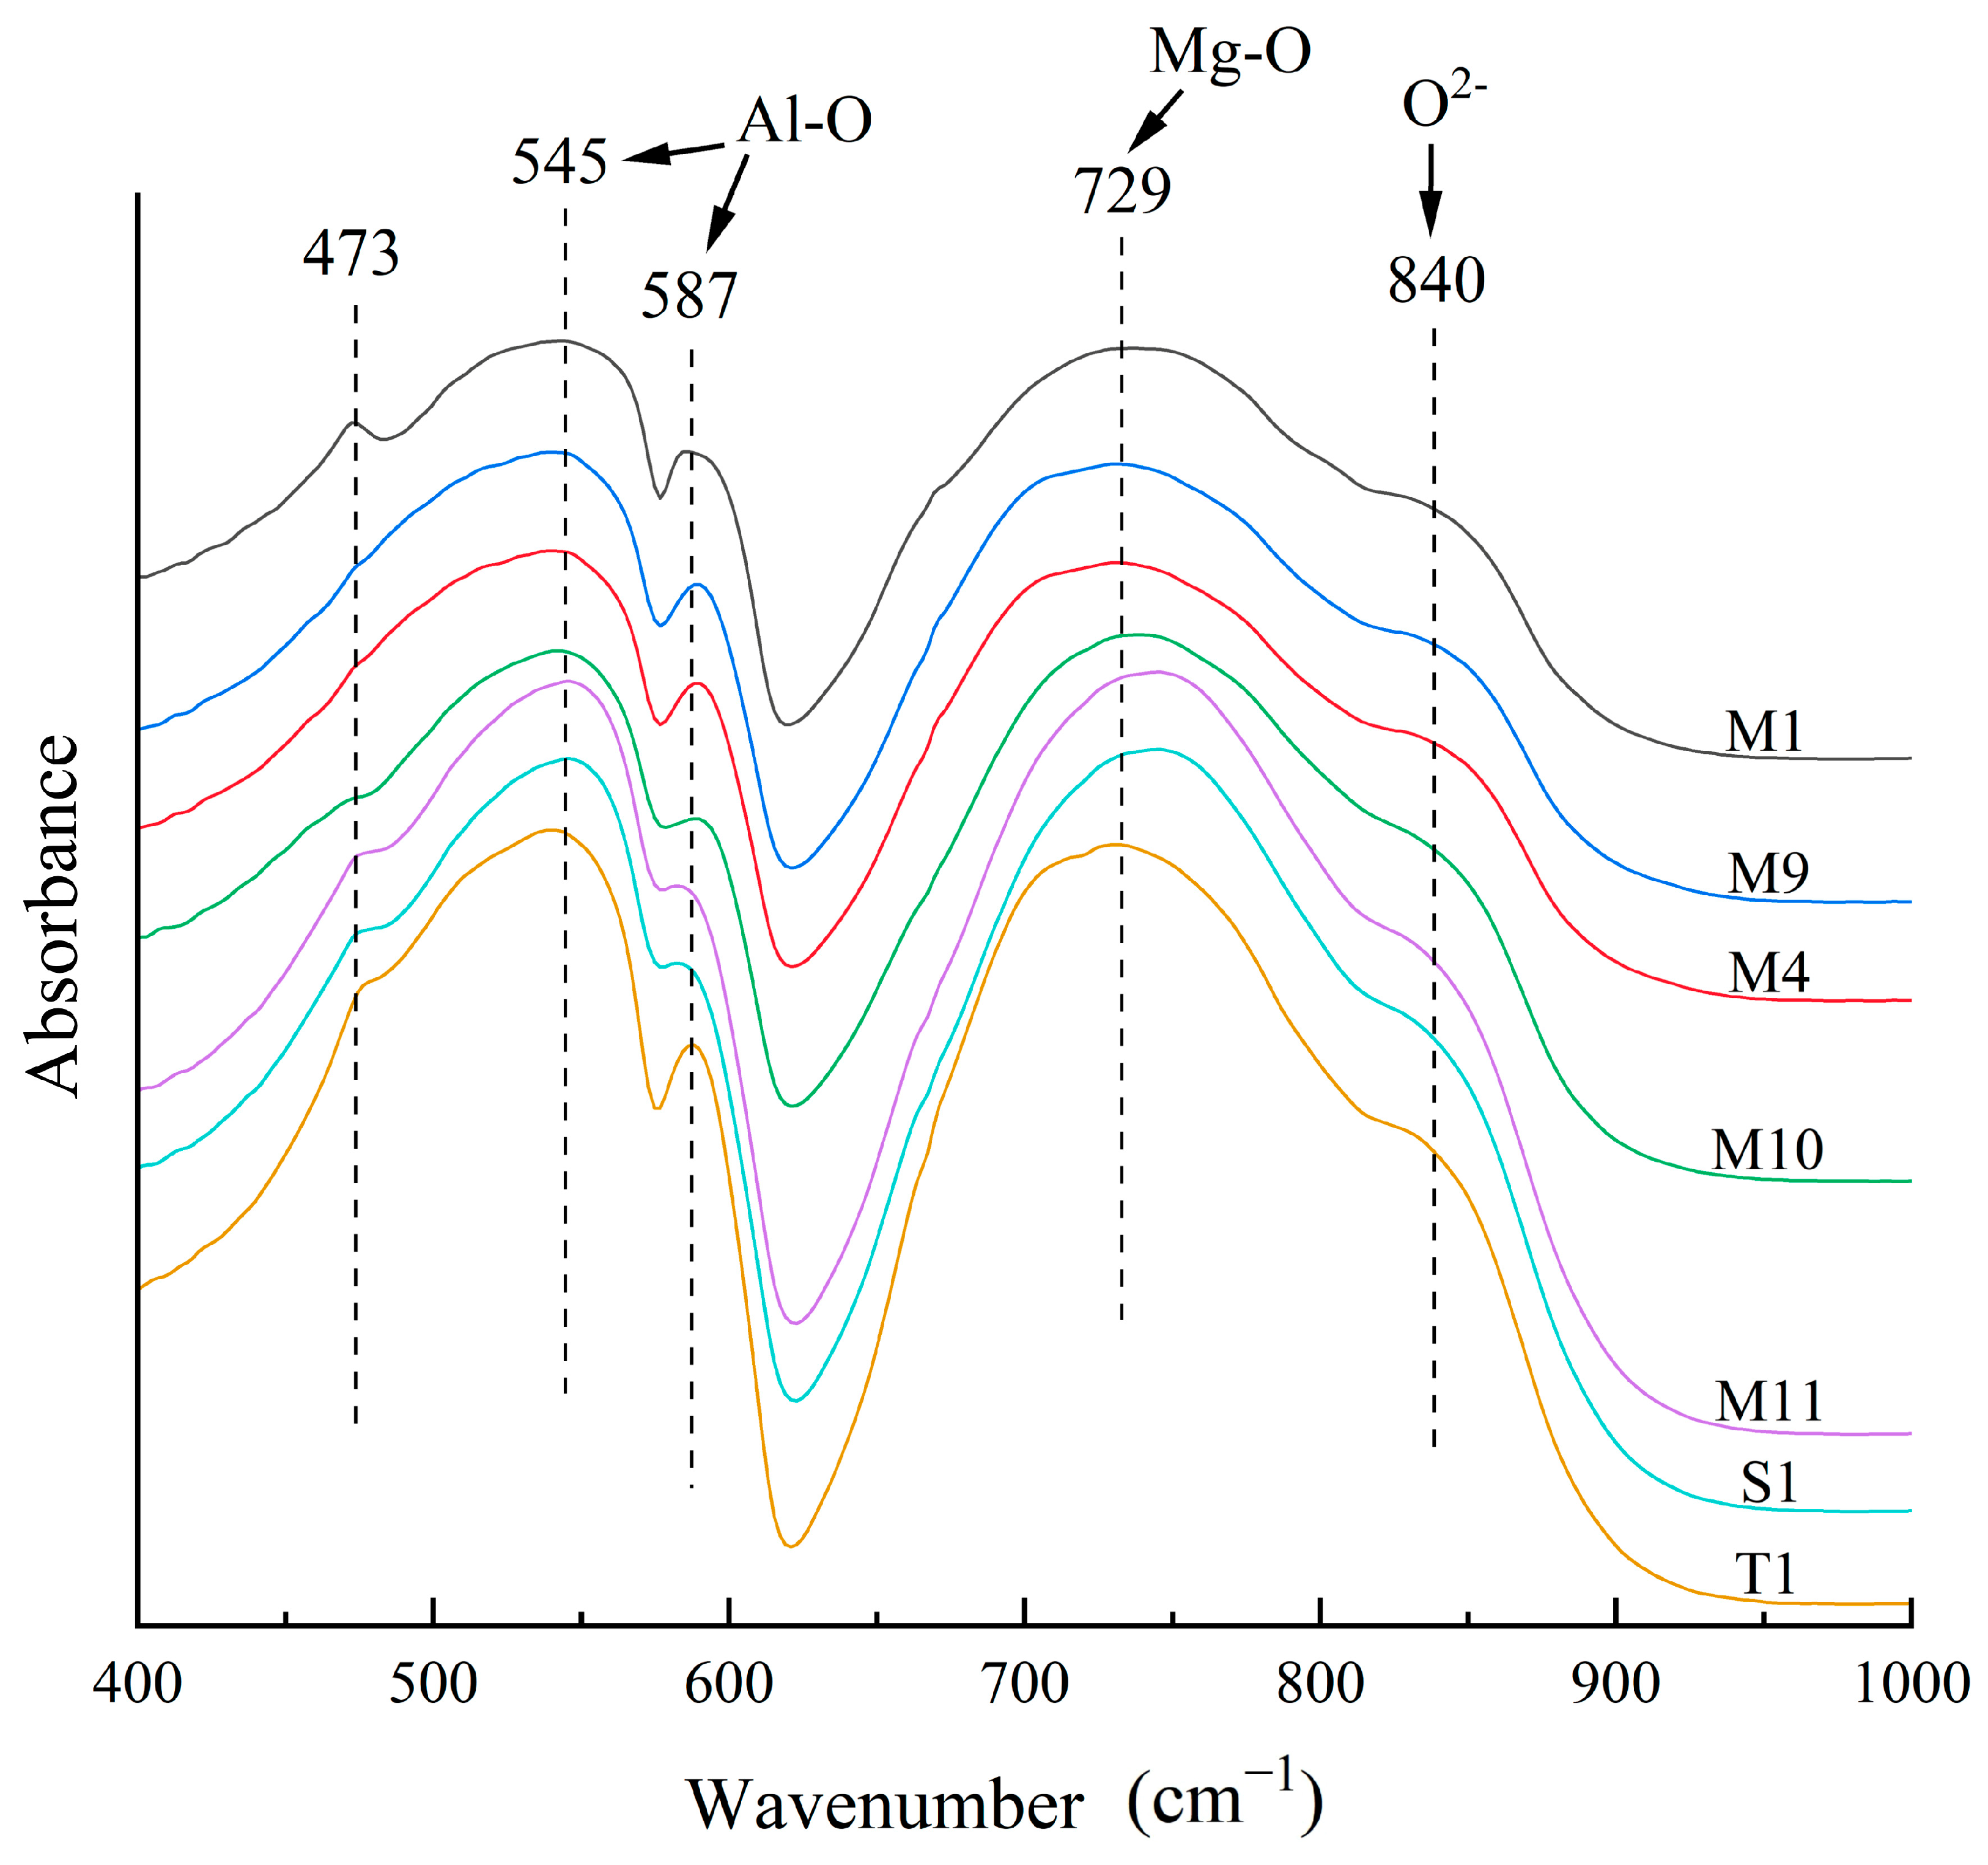
Figure 12 illustrates the Raman spectral characteristics of the samples. In the spectrum, four distinct peaks are observed at 312 cm−1, 407 cm−1, 666 cm−1 and 767 cm−1 in the range of 200–1000 cm−1. The most significant peak is located at 407 cm−1, which is generated by the Mg symmetric bending vibration (Eg vibration mode) [2,6,10]. The peak of 312 cm−1 is generated by the transition of Mg in the tetrahedral position (F2g vibration mode) [5,6]. The peak of 666 cm−1 is generated by internal vibrations of the AlO6 octahedron and/or the A2+O4 tetrahedron (F2g vibration mode) [5,6]. The symmetric stretching vibration of Mg-O generates the peak of 767 cm−1 (A1g vibration mode) [5,6].

4.4.4. FTIR Spectra

Fluorescence spectroscopy (Figure 11) confirmed that all the samples are natural spinels. A selection of samples with specific colors or origins was then chosen for IR spectroscopy. The infrared spectra of the spinels in the 400–1000 cm−1 range show similar absorption patterns. Broad absorption bands were clearly observed around 729 cm−1, 545 cm−1, and 840 cm−1, with two distinct absorption peaks at 587 cm−1 and 473 cm−1 (Figure 13). The absorption peak at 729 cm−1 is attributed to Mg-O stretching vibrations, while the peaks at 587 cm−1 and 545 cm−1 correspond to Al-O stretching vibrations [2,10]. The high-wavenumber absorption band centered at 840 cm−1 is due to oxygen ion vibrations [2,10].
In the AB2O4 structure, the absorption peak positions shift when homologous substitution of the analog occurs [50], resulting in deviations in the peak positions of individual samples. The origin of the 473 cm−1 absorption peak, previously reported in the literature [51], remains uncertain and warrants further investigation. In some cases, this peak may be associated with the movement of metal cations [52].

5. Conclusions

In this study, we systematically investigated the inclusions, chemical composition, and spectral characteristics of pinkish-purple to purple spinels from Mogok, Myanmar. Raman spectroscopy revealed that the dominant inclusions are calcite, dolomite, magnetite, and graphite, consistent with the assemblage typical of carbonate-hosted spinels. These inclusions also indicate that the samples originated from a metamorphic rock-type deposit in Myanmar, which is known as the primary source of gem-quality spinel. Chemical analyses demonstrated that Fe is primarily responsible for the bluish-purple coloration of spinel, while Cr, either individually or in combination with V, contributes to reddish-pink hues. In addition, higher Zn concentrations appear to enhance the overall brightness and weaken the purple hue of the spinels. The fluorescence spectrum shows a series of Cr3+ excitation peaks in the range of 650–750 nm. The Raman and infrared spectra of both pinkish-purple and purple spinels were generally consistent, with the main structural formula being MgAl2O4.

Author Contributions

Writing—original draft preparation, D.G.; visualization, D.G.; driting—review and editing, G.L.; methodology, G.L.; data curation, L.W.; validation, L.W.; resources, M.Z.; software, M.Z.; conceptualization, F.D.S.; investigation, F.D.S. All authors have read and agreed to the published version of the manuscript.

Funding

This research received no external funding.

Data Availability Statement

The original contributions presented in the study are included in the article material, further inquiries can be directed to the corresponding author.

Acknowledgments

The authors are grateful to the Gemological Institute, China University of Geosciences (Beijing) for their help with the preparation of data in this paper.

Conflicts of Interest

Author Fabian Schmitz was employed by the company Rhein Main Gem Consulting. The remaining authors declare that the research was conducted in the absence of any commercial or financial relationships that could be construed as a potential conflict of interest.

References

  1. Malíčková, I.; Bačík, P.; Fridrichová, J.; Hanus, R.; Illášová, Ľ.; Štubňa, J.; Furka, D.; Furka, S.; Škoda, R. Optical and Luminescence Spectroscopy of Varicolored Gem Spinel from Mogok, Myanmar and Lục Yên, Vietnam. Minerals 2021, 11, 169. [Google Scholar] [CrossRef]
  2. Xu, Q.; Xu, B.; Gao, Y.; Li, S. Characterization of Red, Pink, Orange, and Purple Gem-Quality Spinel from Four Important Areas. Crystals 2024, 14, 50. [Google Scholar] [CrossRef]
  3. Zhang, L.; He, K.; Guo, Q.-F. Spectroscopic Characteristics and Coloring Mechanisms of Different Colored Spinels from Myanmar. Crystals 2023, 13, 575. [Google Scholar] [CrossRef]
  4. Wu, J.; Sun, X.; Ma, H.; Ning, P.; Tang, N.; Ding, T.; Li, H.; Zhang, T.; Ma, Y. Purple-Violet Gem Spinel from Tanzania and Myanmar: Inclusion, Spectroscopy, Chemistry, and Color. Minerals 2023, 13, 226. [Google Scholar] [CrossRef]
  5. Zhao, L.-P.; Li, G.; Weng, L.-Q. Gemological and Spectroscopic Characteristics of “Jedi” Spinel from Man Sin, Myanmar. Minerals 2022, 12, 1359. [Google Scholar] [CrossRef]
  6. Wang, M.-W.; Wang, M.-Y.; Qi, Y.-H.; Xue, Y.; Shi, G.-H. Chemical Composition and Spectral Characteristics of Different Colored Spinel Varieties from Myanmar. Minerals 2024, 14, 1124. [Google Scholar] [CrossRef]
  7. Liu, Y.-C.; Qi, L.-J.; Schwarz, D.; Zhou, Z.-Y. Color Mechanism and Spectroscopic Thermal Variation of Pink Spinel Reportedly from Kuh-i-Lal, Tajikistan. Gems Gemol. 2022, 58, 338–352. [Google Scholar] [CrossRef]
  8. Belley, P.-M.; Palke, A.-C. Purple Gem Spinel from Vietnam and Afghanistan: Comparison of Trace Element Chemistry, Cause of Color, and Inclusions. Gems Gemol. 2021, 57, 228–237. [Google Scholar] [CrossRef]
  9. Du, Y.; Guo, Y. Study on the Chromogenic Mechanism of Violet-Red to Orange-Red Spinel. Crystals 2023, 13, 339. [Google Scholar] [CrossRef]
  10. Zhao, Y.; Xu, B.; Zhao, Z.-Y.; Xu, Q.; Li, Z.-Y. Gemological and Chemical Characterization of Varicolored Gem-Grade Spinel from Mogok, Myanmar. Crystals 2023, 13, 447. [Google Scholar] [CrossRef]
  11. Hänsel, S.; Lhuaamporn, T.; Suphan, C. Gem Notes: Update on Purple Spinel from Afghanistan. J. Gemmol. 2021, 37, 678–680. [Google Scholar] [CrossRef]
  12. Zhang, Y.; Zhu, J.-R.; Yu, X.-Y. A Comparative Study of the Gemological Characteristics and Inclusions in Spinels from Myanmar and Tajikistan. Crystals 2022, 12, 617. [Google Scholar] [CrossRef]
  13. Renfro, N.; Laurs, B.M. Spinel from Bawma, Myanmar. Gems Gemol. 2010, 46, 154. [Google Scholar]
  14. Phyo, M.M.; Bieler, E.; Franz, L.; Balmer, W.; Krzemnicki, M.S. Spinel from Mogok, Myanmar—A Detailed Inclusion Study by Raman Microspectroscopy and Scanning Electron Microscopy. J. Gemmol. 2019, 36, 418–435. [Google Scholar] [CrossRef]
  15. Pardieu, V. Hunting for “Jedi” Spinels in Mogok. Gems Gemol. 2014, 50, 46–57. [Google Scholar] [CrossRef]
  16. Mitchell, A.; Htay, M.-T.; Htun, K.-M.; Win, M.N.; Oo, T.; Hlaing, T. Rock relationships in the Mogok metamorphic belt, Tatkon to Mandalay, central Myanmar. J. Asian Earth Sci. 2007, 29, 891–910. [Google Scholar] [CrossRef]
  17. Searle, M.-P.; Noble, S.-R.; Cottle, J.-M.; Waters, D.J.; Mitchell, A.H.G.; Hlaing, T.; Horstwood, M.S.A. Tectonic evolution of the Mogok metamorphic belt, Burma (Myanmar) constrained by U-Th-Pb dating of metamorphic and magmatic rocks. Tectonics 2007, 26, 1–24. [Google Scholar] [CrossRef]
  18. Garnier, V.; Maluski, H.; Giuliani, G.; Ohnenstetter, D.; Schwarz, D. Ar–Ar and U–Pb ages of marble-hosted ruby deposits from central and southeast Asia. Can. J. Earth Sci. 2006, 43, 509–532. [Google Scholar] [CrossRef]
  19. Zaw, K.; Swe, W.; Barber, A.J.; Crow, M.J.; Nwe, Y.Y. Chapter 1: Introduction to the geology of Myanmar. Geol. Soc. Lond. Mem. 2017, 48, 1–17. [Google Scholar] [CrossRef]
  20. Zaw, K. Chapter 24: Overview of mineralization styles and tectonic–metallogenic setting in Myanmar. Geol. Soc. Lond. Mem. 2017, 48, 400–531. [Google Scholar] [CrossRef]
  21. Garnier, V.; Giuliani, G.; Ohnenstetter, D.; Fallick, A.E.; Dubessy, J.; Banks, D.; Vinh, H.Q.; Lhomme, T.; Maluski, H.; Pêcher, A.; et al. Marble-Hosted Ruby Deposits from Central and Southeast Asia: Towards a New Genetic Model. Ore Geol. Rev. 2008, 34, 169–191. [Google Scholar] [CrossRef]
  22. Gorghinian, A.; Mottana, A.; Rossi, A.; Oltean, F.M.; Esposito, A.; Marcelli, A. Investigating the color of Spinel: 1. Red Gem-Quality Spinels (“Balas”) from Ratnapura (Sri Lanka). Rend. Lincei 2013, 24, 127–140. [Google Scholar] [CrossRef]
  23. Malsy, A.; Klemm, L. Distinction of Gem Spinels from the Himalayan Mountain Belt. Mineralogy 2010, 64, 741–746. [Google Scholar] [CrossRef] [PubMed]
  24. Gubelin, E.J.; Koivula, J.I. Photoatlas of Inclusions in Gemstones; Gemological Inst of Amer: Carlsbad, CA, USA, 1986. [Google Scholar]
  25. Rankin, A.H.; Gubelin, E.J.; Koivula, J.I. Photoatlas of Inclusions in Gemstones. In Mineralogical Magazine; Opinio Publishers: Basel, Switzerland, 2005; Volume 2, p. 829. ISBN 3-03999029-2. [Google Scholar]
  26. Themelis, T. Gems and Mines of Mogok; A&T Publishers: Bangkok, Thailand, 2008. [Google Scholar]
  27. Pardieu, V.; Sangsawong, S.; Vertriest, W.; Raynaud, V. “Star of David” spinel twin crystal with multiphase inclusions from Mogok. Gems Gemmol. 2016, 52, 100–101. [Google Scholar]
  28. Peretti, A.; Mullis, J.; Franz, L.; de Capitani, C. Spinel formation by sulphur-rich saline brines from Mansin (Mogok area, Myanmar). In Proceedings of the 15th Swiss Geoscience Meeting, Davos, Switzerland, 17–18 November 2017. [Google Scholar]
  29. Zhu, J.; Yu, X. Inclusions of spinel from Burma. J. Gems Gemmol. 2018, 20, 18–23. [Google Scholar]
  30. Gunasekaran, S.; Anbalagan, G. Spectroscopic Characterization of Natural Calcite Minerals. Spectrochim. Acta Part A Mol. Biomol. Spectrosc. 2007, 68, 656–664. [Google Scholar] [CrossRef] [PubMed]
  31. Giuliani, G.; Fallick, A.E.; Boyce, A.J.; Pardieu, V.; Pham, V.L. Pink and Red Spinels in Marble: Trace Elements, Oxygen Isotopes, and Sources. Can. Mineral. 2017, 55, 743–761. [Google Scholar] [CrossRef]
  32. Pardieu, V.; Hughes, R.W. Spinel: Resurrection of a Classic. InColor 2008, 2, 10–18. [Google Scholar]
  33. Sun, X.; Gao, Y.; Zhao, H. Interesting Inclusions in a Purple Spinel from Tanzania. J. Gemmol. 2022, 38, 315–317. [Google Scholar] [CrossRef]
  34. Fernando, G.W.A.R.; Pitawala, A.; Amaraweera, T.H.N.G. Emplacement and Evolution History of Pegmatites and Hydrothermal Deposits, Matale District, Sri Lanka. Int. J. Geosci. 2011, 02, 348–362. [Google Scholar] [CrossRef]
  35. Long, P.V.; Pardieu, V.; Giuliani, G. Update on Gemstone Mining in Luc Yen, Vietnam. Gems Gemmol. 2013, 49, 233–245. [Google Scholar] [CrossRef]
  36. Alonso-Perez, R.; Day, J.M.D.; Pearson, D.G.; Luo, Y.; Palacios, M.A.; Sudhakar, R.; Palke, A. Exploring Emerald Global Geochemical Provenance through Fingerprinting and Machine Learning Methods. Artif. Intell. Geosci. 2024, 5, 100085. [Google Scholar] [CrossRef]
  37. Guillong, M.; Günther, D. Quasi ‘non-destructive’ laser ablation-inductively coupled plasma-mass spectrometry fingerprinting of sapphires. Spectrochim. Acta Part B At. Spectrosc. 2001, 56, 1219–1231. [Google Scholar] [CrossRef]
  38. Dutta, R.; Mandal, N. Effects of Fe2+ and Zn2+ substitution on the structure and high-pressure stability of MgAl2O4 spinel from DFT calculations. J. Phys. Chem. Solids 2012, 73, 1099–1105. [Google Scholar] [CrossRef]
  39. Carta, D.; Marras, C.; Loche, D.; Mountjoy, G.; Ahmed, S.I.; Corrias, A. An X-ray absorption spectroscopy study of the inversion degree in zinc ferrite nanocrystals dispersed on a highly porous silica aerogel matrix. J. Chem. Phys. 2013, 138, 054702. [Google Scholar] [CrossRef] [PubMed]
  40. Andreozzi, G.B.; D’Ippolito, V.; Skogby, H.; Hålenius, U.; Bosi, F. Color mechanisms in spinel: A multi-analytical investigation of natural crystals with a wide range of coloration. Phys. Chem. Min. 2019, 46, 343–360. [Google Scholar] [CrossRef]
  41. Kleišmantas, A.; Daukšytė, A. The Influence of Vietnam and Sri Lanka Spinel Mineral Chemical Elements on color. Chemija 2016, 27, 45–51. [Google Scholar] [CrossRef]
  42. Chankhantha, C.; Amphon, R.; Rehman, H.U.; Shen, A.H. Characterisation of Pink-to-Red Spinel from Four Important Localities. J. Gemmol. 2020, 37, 393–403. [Google Scholar] [CrossRef]
  43. D’Ippolito, V.; Andreozzi, G.B.; Hålenius, U.; Skogby, H.; Hametner, K.; Günther, D. Color mechanisms in spinel: Cobalt and iron interplay for the blue color. Phys. Chem. Min. 2015, 42, 431–439. [Google Scholar] [CrossRef]
  44. Tang, J.; Guo, Y.; Zhang, J. Colorimetry characteristics and color contribution of fluorescence in natural Cr-containing spinel. Sci. Rep. 2023, 13, 2426. [Google Scholar] [CrossRef] [PubMed]
  45. Pluthametwisute, T.; Wanthanachaisaeng, B.; Saiyasombat, C.; Sutthirat, C. Minor Elements and Color Causing Role in Spinel: Multi-Analytical Approaches. Minerals 2022, 12, 928. [Google Scholar] [CrossRef]
  46. Kiryakov, A.N.; Zatsepin, A.F.; Osipov, V.V. Optical properties of polyvalent iron ions and anti-site defects in transparent MgAl2O4 ceramics. J. Lumin. 2021, 239, 118390. [Google Scholar] [CrossRef]
  47. Saeseaw, S.; Wang, W.; Scarratt, K.; Emmett, J.; Douthit, T. Distinguishing Heated Spinels from Unheated Natural Spinels and from Synthetic Spinels—A short review of on-going research. GIA Res. News 2009, 13. Available online: https://www.gia.edu/doc/Heated-spinel-Identification-at-April-02-2009.pdf (accessed on 10 July 2025).
  48. Wang, C.; Shen, A.H.; Liu, Y. Characterization of order-disorder transition in MgAl2O4: Cr3+ spinel using photoluminescence. J. Lumin. 2020, 227, 117552. [Google Scholar] [CrossRef]
  49. Hainschwang, T.; Karampelas, S.; Fritsch, E.; Notari, F. Luminescence spectroscopy and microscopy applied to study gem materials: A case study of C centre containing diamonds. Mineral. Petrol. 2013, 107, 393–413. [Google Scholar] [CrossRef]
  50. Preudhomme, J.; Tarte, P. Infrared studies of spinels—III: The normal II–III spinels. Spectrochim. Acta Part A Mol. Spectrosc. 1971, 27, 1817–1835. [Google Scholar] [CrossRef]
  51. Boguslavska, N.N.; Venger, E.F.; Vernidub, N.M.; Pasechnik, Y.A.; Shportko, K.V. Reststrahlen Spectroscopy of MgAl2O4 Spinel. Semicond. Phys. Quantum Electron. Optoelectron. 2002, 5, 95–100. [Google Scholar] [CrossRef]
  52. White, W.B.; DeAngelis, B.A. Interpretation of the Vibrational Spectra of Spinels. Spectrochim. Acta Part Mol. Spectrosc. 1967, 23, 985–995. [Google Scholar] [CrossRef]
Figure 2. Spinel samples from Myanmar (M1–M11), Tajikistan (T1), and Sri Lanka (S1), photographed in a lightbox under a 4800 K color temperature light source.
Crystals 15 00659 g002
Figure 3. Inclusion scenes in the Mogok spinel samples: (a) Octahedral crystal inclusions of varying sizes in sample M2; (b) Octahedral inclusions with associated cracks in sample M7; (c) Octahedral inclusions containing black particulate matter in sample M9; (d) Isolated octahedral inclusions in sample M9; (e) Fingerprint-like distributed octahedral inclusions in sample M8; (f) Columnar inclusions in sample M10.
Crystals 15 00659 g003
Figure 4. Raman spectra of inclusions in the spinel samples: (a) octahedral inclusions with a fingerprint-like distribution in sample M8; (b) Raman spectrum of the black mineral attached to a colorless crystal inclusion in sample M9; (c) Raman spectrum of the octahedral inclusion near the pavilion facet of sample M9; (d) Raman spectrum of the columnar inclusion in sample M10. The peaks of the host spinel are shown in black without background shading, while those of the inclusions and their corresponding minerals are highlighted in different colors.
Crystals 15 00659 g004
Figure 5. PCA plot of V2O5, Fe2O3, Cr2O3, and MnO concentrations in pinkish-purple to purple spinels from Mogok.
Crystals 15 00659 g005
Figure 6. Relationship diagrams of Fe2O3, Cr2O3, and V2O5 contents in pinkish-purple to purple spinels from Mogok, Myanmar: (a) Ternary diagram of Fe2O3, Cr2O3, and V2O5 contents; (b) Binary diagram of Cr2O3-V2O5 contents; (c) Binary diagram of Fe2O3-V2O5 contents; (d) Binary diagram of Fe2O3-Cr2O3 contents.
Crystals 15 00659 g006
Figure 7. Spinel Cr2O3+V2O5-Fe2O3-ZnO (wt%) ternary phase diagram.
Crystals 15 00659 g007
Figure 8. Chemical discrimination diagrams used to distinguish reddish-purple spinels from different localities, including Myanmar, Tajikistan, Tanzania, Vietnam, and Sri Lanka: (a) Fe2O3-Cr2O3-V2O5 ternary diagram; (b) ZnO-Cr2O3-V2O5 ternary diagram; (c) Fe2O3-V2O5-ZnO ternary diagram.
Crystals 15 00659 g008
Figure 9. UV–Vis spectral characteristics of samples.
Crystals 15 00659 g009
Figure 10. Excitation spectra of samples.
Crystals 15 00659 g010
Figure 11. Emission spectra of the spinel samples under specific excitation wavelengths: (a) emission spectra obtained with excitation at approximately 393 nm; (b) emission spectra obtained with excitation at approximately 532 nm.
Crystals 15 00659 g011
Figure 12. Raman spectral characteristics of selected samples.
Crystals 15 00659 g012
Figure 13. Infrared spectral characteristics of samples.
Crystals 15 00659 g013
Table 1. Gemological characteristics of the samples.
SampleColorSGRILWUVSWUV
Pinkish-purple spinels
M1very light pinkish-purple3.5491.711red, mediumred, weak
M5light pinkish-purple3.5271.718red, mediuminert
M6light pinkish-purple3.5921.716red, weakinert
T1light pinkish-purple3.5861.713red, stronginert
M7deep pinkish-purple3.5791.714red, mediuminert
M8deep pinkish-purple3.5721.713red, stronginert
Purple spinels
M9very light purple3.5221.714inertinert
M2light grayish-purple3.5421.713red, weakinert
M3light grayish-purple3.5831.715red, weakinert
M4light grayish-purple3.5601.717red, weakinert
S1purple3.5791.714inertinert
M10deep purple3.6191.721inertinert
M11deep purple3.5901.715inertinert
Table 2. Characteristic inclusions in spinels from different localities.
LocalityDistinctive Inclusions
Mogok, MyanmarAmphibole, anatase, anhydrite, apatite, baddeleyite, boehmite, brucite, calcite, chlorite, chondrodite, clinopyroxene, dolomite, geikielite, graphite, ilmenite, magnesite, phlogopite, rutile, sulfur, zircon
TajikistanApatite, rutile, talc, zircon
Sri LankaApatite, boehmite, calcite, dolomite, graphite, zircon
VietnamApatite, calcite, dolomite, graphite, magnesite, talc
TanzaniaApatite, dolomite, ilmenite, magnesite, phlogopite, rutile
MadagascarApatite, clinopyroxene, rutile
Table 3. EDXRF data of Myanmar pinkish-purple and purple spinels (wt%).
SampleAl2O3MgOSiO2Cr2O3V2O5Fe2O3ZnOTiO2MnOGa2O3K2OCaONiO
M168.53728.1701.7650.0780.2880.2760.5430.007-0.0700.0050.0250.003
M267.19428.4021.8300.1390.4221.9030.0850.0070.0010.0360.0120.0460.006
M368.04925.8831.9360.1750.0061.6912.133-0.0080.094-0.015-
M466.65627.5331.7430.2150.0561.9461.5180.0260.0540.1780.0070.014-
M566.57825.1551.6400.1910.1271.3325.2050.0050.0190.2080.0100.017-
M668.62821.984-0.0660.0091.3517.564-0.0030.2260.0110.034-
M768.46627.1891.1610.3830.0021.9951.0890.0080.0860.109-0.017-
M868.44927.0172.0290.4350.0561.4340.6500.0150.0560.0790.022--
M968.53527.5661.6330.0410.0841.3701.0690.0940.0040.060-0.0140.002
M1080.0460.5350.9980.0501.72514.7231.765-0.1260.084-0.025-
M1173.81317.1574.0960.0450.1384.0560.3170.1180.0690.147---
S169.46524.6941.7850.3670.0483.0110.3930.1000.0880.1180.7740.014-
T171.11724.7411.2210.2890.6181.1940.4690.0850.2150.1520.1590.039-
“-”: below detection limit.
Disclaimer/Publisher’s Note: The statements, opinions and data contained in all publications are solely those of the individual author(s) and contributor(s) and not of MDPI and/or the editor(s). MDPI and/or the editor(s) disclaim responsibility for any injury to people or property resulting from any ideas, methods, instructions or products referred to in the content.

