Article

Axinite, a Borosilicate with Extensive Fe-Mn Substitutions at the Scale of Monocrystal Revealed by Micro-XRF Imaging and In Situ Analysis: An Example from the Type Locality at Oisans (France)

by
Michel Cathelineau
1,*,
Olivier Gerbeaud
2 and
Chantal Peiffert
1
1
Université de Lorraine, CNRS, GeoRessources, 54500 Nancy, France
2
Independent Researcher, 73230 Les Déserts, France
*
Author to whom correspondence should be addressed.
Crystals 2025, 15(5), 402; https://doi.org/10.3390/cryst15050402
Submission received: 23 March 2025 / Revised: 17 April 2025 / Accepted: 19 April 2025 / Published: 25 April 2025
(This article belongs to the Collection Topic Collection: Mineralogical Crystallography)

Abstract

:
Axinite crystals from the type locality (Oisans, French Alps) are considered among the more remarkable specimens known for their quality (lustre, colour, size, and purity) and crystalline forms. However, they have been the subject of only a few in-depth studies. This lack of knowledge provided the opportunity for a systematic survey of axinites from Saint-Christophe-en-Oisans, where crystals appear to cover an extensive range of Fe-Mn substitution from an Fe-rich (axinite-Fe) to a Mn-rich field (axinite-Mn) in a same crystal, with compositional variations much more significant than initially described. An in-depth characterisation of the chemical zonation of the crystals using EPMA, Raman spectroscopy, X-ray micro-fluorescence, and LA-ICP-MS was carried out on the crystals showing the most significant variability. The micro-XRF method appeared extremely useful for describing spatial variations in chemical composition at the centimetre scale and preparing other in situ methods. Fe(Mg)-Mn substitution covers a large range but the Mn-enriched growth zones are relatively thin and localised at the periphery of crystals. In addition, chemical zonations highlighted in this study also reveal contrasted incorporation of trace elements as a function of the Fe/Mn ratio (in particular, Be, HREE, Sc, Ga, In, and Co), indicating changes in fluid chemistry during the crystal growth.

1. Introduction

Despite their presence in a wide range of environments—and their significant variability in composition and crystallisation that is sensitive to physical–chemical conditions—axinite crystals have been the subject of only a few in-depth studies, with the exception of worldwide data from Andreozzi et al. [1,2]. In addition, there have been relatively few detailed mineralogical studies of axinites from the type locality in Oisans’ old province of Dauphiné, French Alps, despite their remarkable quality (lustre, colour, size, and purity) and crystalline forms. In the literature, two primary studies [1,2] provided crystal-chemical data on Oisans’ axinites in comparison with axinites from 60 other localities based on EMPA, SIMS, and Mössbauer analyses but with little information on the crystal chemistry variability and exact sampling location in Oisans. Data in the literature are very dispersed in terms of the axinite provenance as published XRD patterns concern Mn-axinite from Graham county (AZ, USA) and Sri Lanka in [3], and XRD patterns and Raman spectra on Fe-axinites from California and Butte (Montana) in [4]. Cell parameter and crystal-chemistry data are available on Mn-axinites from Malkhan pegmatite but neither Raman nor XRD patterns are available [5].
Axinite was initially named “Species of Schorl” by Johann Gottfried Schreiber in 1781, a German-born but naturalised French mining engineer who became the director of the Challanches mine near Bourg d’Oisans. He discovered axinite near Bourg d’Oisans. After several denominations by Romé de L’Isle, J.-C. de la Métherie, and A.G. Werner, this mineral was definitively named “axinite” in 1797 by R.J. Haüy [6] from the Greek “axina” for “axe”, in allusion to the typical shape of its crystals. P.J. Haüy divided the schorls into around fifteen species by attaching them to their respective families and defining axinite characteristics.
The simplified formula for axinite is as follows:
(Ca, Mn)4(Mn, Fe, Mg)2(Al, Fe)4 B2Si8O30(OH)2
Four extreme poles have been defined: manganaxinite—now axinite-Mn; ferroaxinite—axinite-Fe; and magnesioaxinite—axinite-Mg. In 2007, the IMA renamed the pure poles of axinite-X with the suffix X (X = Fe, Mn, or Mg) according to the predominance of the main cation, such subdivision being relatively arbitrary since it is a solid solution with no apparent gaps apart for the magnesium pole. On the other hand, pure poles are rarely found in nature. The fourth pole is tinzenite, with the formula Ca2Mn2Al4[B2Si8O30](OH)2. It has a calcium deficiency (2 < Ca < 4) that is compensated for by an excess of Mn, which is ordered in the smaller of the two sites occupied by Ca [7]. Tinzenite occurs in veinlets intersecting stratiform manganese deposits or metamorphosed cherts.
Physical and optical properties: The colour is generally “clove” brown, and more rarely a violet tinge, or even “wine lees” as has been used to describe the axinite from Armentier near Bourg d’Oisans. The finest historical specimens are the beautifully developed transparent glassy crystals found with albite, prehnite, and quartz in the amphibolite and chlorite schist layers near Bourg d’Oisans in the Dauphiné. Shades of cinnamon brown, blue, and green pleochroism are also common. The density is 3.3 g/cm3. The hardness of 6.1 to 7, combined with the colour and transparency, makes axinite suitable for a gemstone, with Dauphiné crystals sometimes being cut for this purpose.
Crystal structure: The crystal structure can be described as a sequence of tetrahedrally and octahedrally coordinated cations [8,9]. Two [Si2O7] disilicate groups are connected by two BO4 tetrahedra to form a six-membered ring. Two other disilicate groups share their corners with the BO4 tetrahedra, forming a planar [B2Si8O30] assemblage. Slightly deformed octahedra—four filled with Al and two with Mn-Fe-Mg—share edges to create a finite six-membered chain. These chains are connected by highly deformed CaO6 and (Ca, Mn)O5(OH) octahedra. This infinite octahedral site contains the [B2Si8O30] groups.
Several authors [10,11] proposed a general formula and nomenclature for axinite, which has been then revised by [1,2]. For compositions in which Ca is close to 4 atoms per formula unit (apfu), the end members are the three defined above: Fe, Mg, and Mn. There is still some discussion about charge equilibria [12]. The characterisation of axinite compositions is complicated by the need to determine the Fe3+/Fe2+ ratio [1] and to quantify B and H, which cannot be obtained by conventional electron microscopy or electron microprobe analyses. However, Mössbauer spectroscopy has shown that most of the Fe in axinite is Fe2+ [13]. The light elements (B, H, etc.) must be analysed by secondary ion mass spectrometry (SIMS) or LA-ICP-MS (B, Be, in our present case), and this must be supplemented by spectroscopic studies (Raman or Infra-Red) to determine the presence rather than quantifying the OH abundance.
Axinite from Oisans was commonly considered as Fe-axinite. Recent discoveries indicate that some crystals may exhibit much larger Fe/Mn ranges at the scale of single crystals up to Mn (Fe)-axinite. This mineralogical and crystal-chemical study of the Saint-Christophe-en-Oisans axinites has been carried out to provide new information using a multi-analytical approach.

2. Materials and Methods

2.1. Materials: Brief Geological Context of Axinite Deposits in Oisans

Axinite samples from Saint-Christophe-en-Oisans were analysed in this study; their purity and well-developed crystals characterise specimens up to a few centimetres. Most axinite deposits are found in mafic rock formations, often called “amphibolites” or “amphibolitic gneisses”. This formation is an ancient oceanic crust (Palaeozoic) that was deformed and metamorphosed at very high temperatures during the Hercynian phase, up to partial melting. This later process resulted in the formation of migmatitic gneiss, consisting of a molten part or “leucosome”, made up mainly of feldspars (light part), and a remaining part or “melanosome” made up of the most refractory minerals (dark part). After their exhumation at the end of the Palaeozoic, these amphibole-rich magmas were buried under Triassic and Lias sediments before undergoing a new episode of deformation during the Alpine orogeny but this time under conditions of lower-temperature metamorphism. Alpine deformation then takes the form of (1) the formation of mylonitic shear zones at the height of burial, and (2) the opening of tension cracks (“Alpine cracks”) when the chain is exhumed.
Such shear zones of Alpine age were brought to light in the Oisans fairly recently [14,15], and there seems to be a reasonably apparent coincidence between the occurrence of mylonitic corridors and Alpine cleft deposits, of which the axinite deposits in the Oisans are no exception. A Pb-Th age of 17.6 ± 0.3 Ma on monazite [16] was determined at Plan du Lac, which occurs close to Saint-Christophe-en-Oisans and may indicate the period of tectonic activity in the region. Shear zones are active around 16 Ma and later [15].

2.2. Analytical Methods

Petrography and scanning electron microscopy (SEM): polished sections and isolated crystals were prepared and mapped with a Keyence VHX macroscope before micro-XRF mapping, and SEM investigations were carried out using a JEOL FEG7600 (JEOL, Tokyo, Japan) apparatus 7600F (hot cathode) using the same procedure that described in [17].
Micro-X-Ray microfluorescence (XRF) mapping was carried out using a Bruker-Nano M4 Tornado instrument (SCMEM, GeoRessources laboratory, Nancy, France). This system has a Rh X-ray tube with a Be side window and polycapillary optics, giving an X-ray beam with a 25–30 μm diameter on the sample. The M4 Tornado (Bruker) enables semi-quantitative and quantitative analyses (calibration required) as well as large-scale 2D chemical mapping (up to 550 cm2). This non-destructive approach allows for the detection of elements ranging from sodium to uranium. Elements are detected from a few percent for the lightest elements (sodium) to less than ten ppm for the elements most sensitive to this technique (e.g., zirconium). The spatial resolution is 20 μm. Multi-centimetre samples can be mapped rapidly without prior preparation (flat sample but without polishing or metallisation). The area to be analysed was scanned at an adjustable speed, generally from 10 μs/mm to 30 μs/mm. A distance between pixels of 30 microns was chosen for the present study. The X-ray tube operated at 50 kV and 200 μA. A 30 mm2 xflash® SDD (Bruker, Berlin, Germany) detected X-rays with an energy resolution of <135 eV at 250,000 cps. All analyses were carried out in a 2 kPa vacuum. Main elements, such as Ti, Mg, Mn, Fe, Y, Zr, and Nb, were mapped, and composite chemical images were generated. The micro-XRF mapping made choosing the most representative crystals for SEM and LA-ICP-MS investigations easier.
Raman spectroscopy: The axinite crystals were examined with an HR Horiba Jobin-Yvon Raman system (GeoRessources laboratory, Nancy, France) using a 514.5 nm Ar+ laser emission line at a resolution of 2 cm−1 in the 100–4000 cm−1 range. Repeated acquisition using the highest magnification was accumulated to improve the signal-to-noise ratio. Raman spectra were obtained after generally five acquisitions of 10 to 20 s each, both in low- (200–1200 cm−1) and high-frequency ranges (3550–3800 cm−1).
X-ray diffractometry: XRD patterns on disoriented micron-sized powder were obtained using a D2 Bruker diffractometer with CuKα radiation. The data were recorded in a step scan mode within the 3–70° 2θ range with a one-degree 2θ/s speed.
Crystal chemistry: quantitative analysis of major elements was performed with a CAMECA SX100 EPMA equipped with five WDS spectrometers using an accelerating voltage of 15 kV and a probe current of 12 nA following the procedure described in [16].
LA-ICP-MS (GeoRessources laboratory) was used to determine the trace element concentrations. Laser ablation utilised an ESI New Wave Research UC 193 nm excimer laser at a frequency of 10 Hz. The ablated material was carried by helium gas (0.65 L·min−1), which was mixed with argon (0.9 L·min−1) before entering the ICP torch and analysed with an Agilent 7900 ICP-MS (Agilent, Santa Clara, California, USA). External calibration was carried out using the NIST 610 and 612 glass standards, which were analysed after around 20 analyses. Si was used as an internal standard to calculate absolute concentrations. The analysed isotopes were as follows: 7Li, 9Be, 11B, 24Mg, 27 Al, 43Ca,45Sc, 49Ti, 51V, 52Cr, 55Mn, 56Fe, 59Co,66Zn, 71Ga, 72Ge, 88Sr, 89Y, 93Nb, 114IN, 118Sn, 182W, and the REE. Data reduction was carried out using Iolite software (version 4) [18] following the standard methods from [19].
Fluid inclusion data: fluid inclusions were studied by microthermometry and Raman spectroscopy following the procedure described in [20].

3. Results

3.1. Petrography and Crystal Chemistry

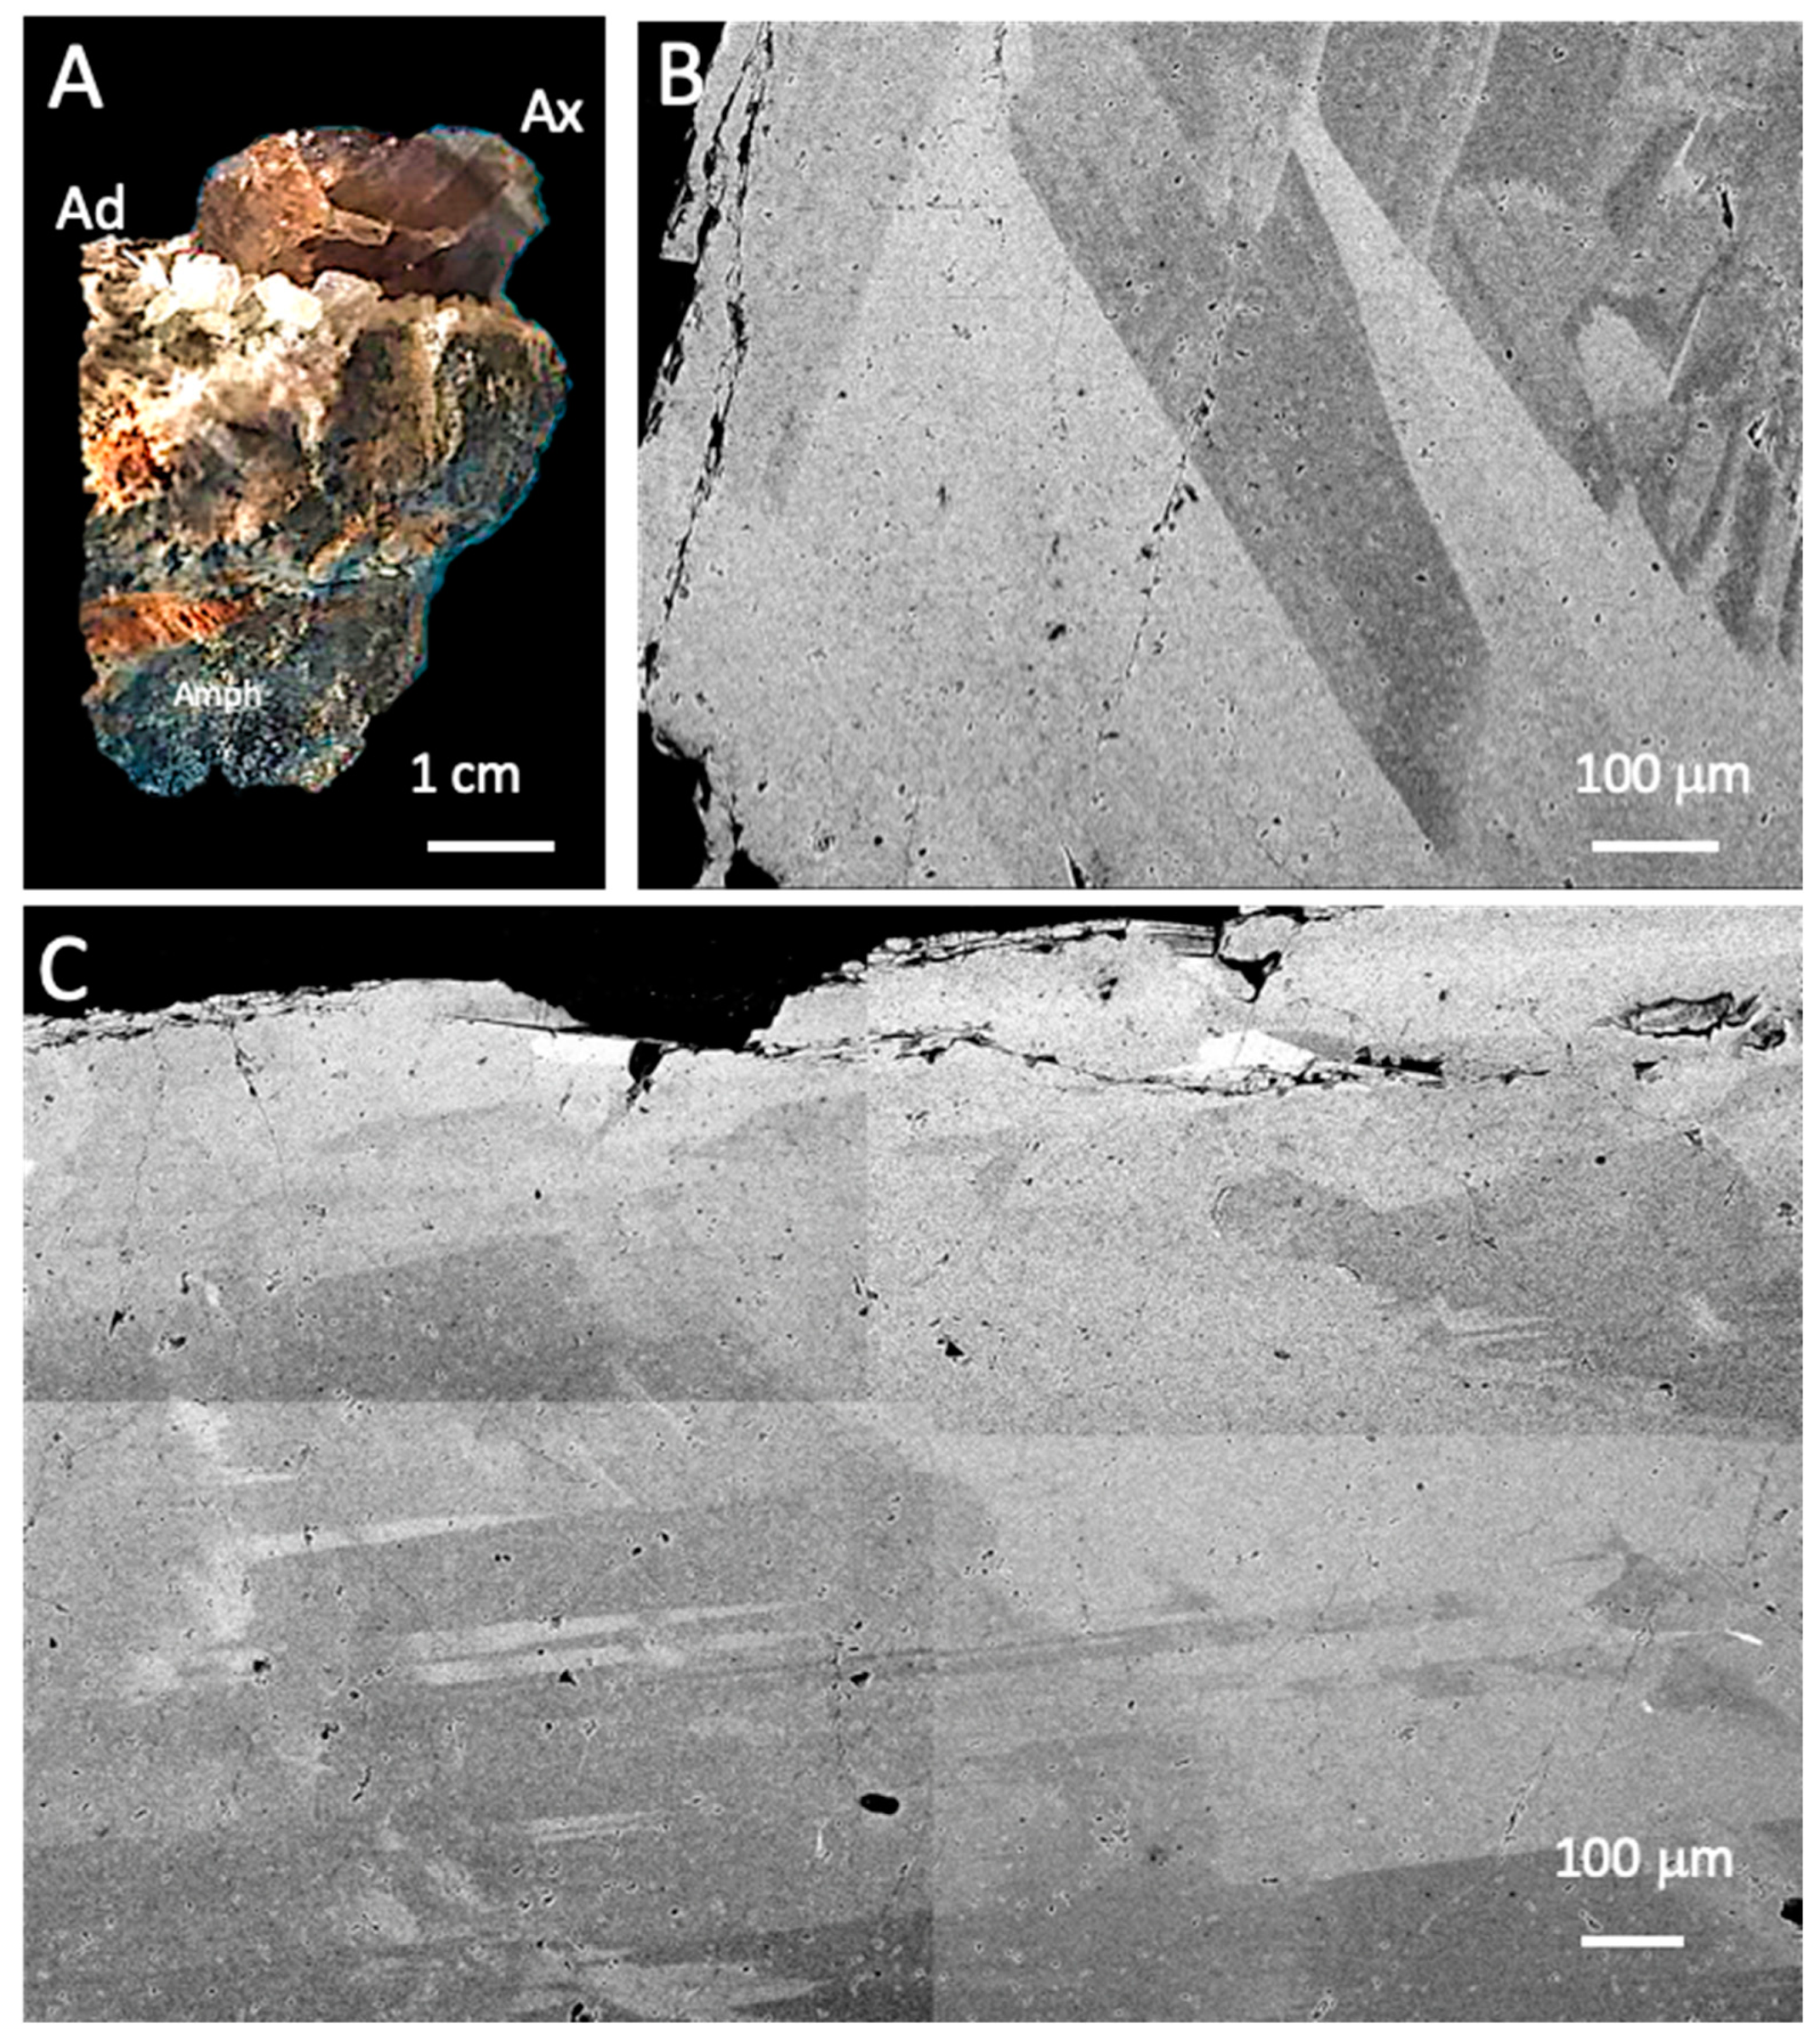
3.1.1. Petrographic Observations

Axinite occurs in low-dipping horizontal open fractures, which are alpine tension gashes. Adularia and actinolite, sometimes epidote, crystallised directly onto the amphibolite (Figure 1A). Adularia develops as overgrowth onto K-feldspars and actinolite onto amphiboles. These minerals are generally found embedded within the first growth bands of axinite, which develop as euhedral crystals sub-perpendicular to the fracture wall.
Axinite crystals show sectorial and oscillatory zoning as shown by the SEM backscattered images (Figure 1B,C), the location of which is indicated in Figure 2A. Some irregularities in the crystal surface could suggest the presence of overgrowth. The SEM images show, however, that there is a perfect continuity in the growth bands and that no corrosion or inclusions of other mineral phases underline the proximity of these external crystal micro-faces. The crystal seems, therefore, to have grown continuously without a significant break.

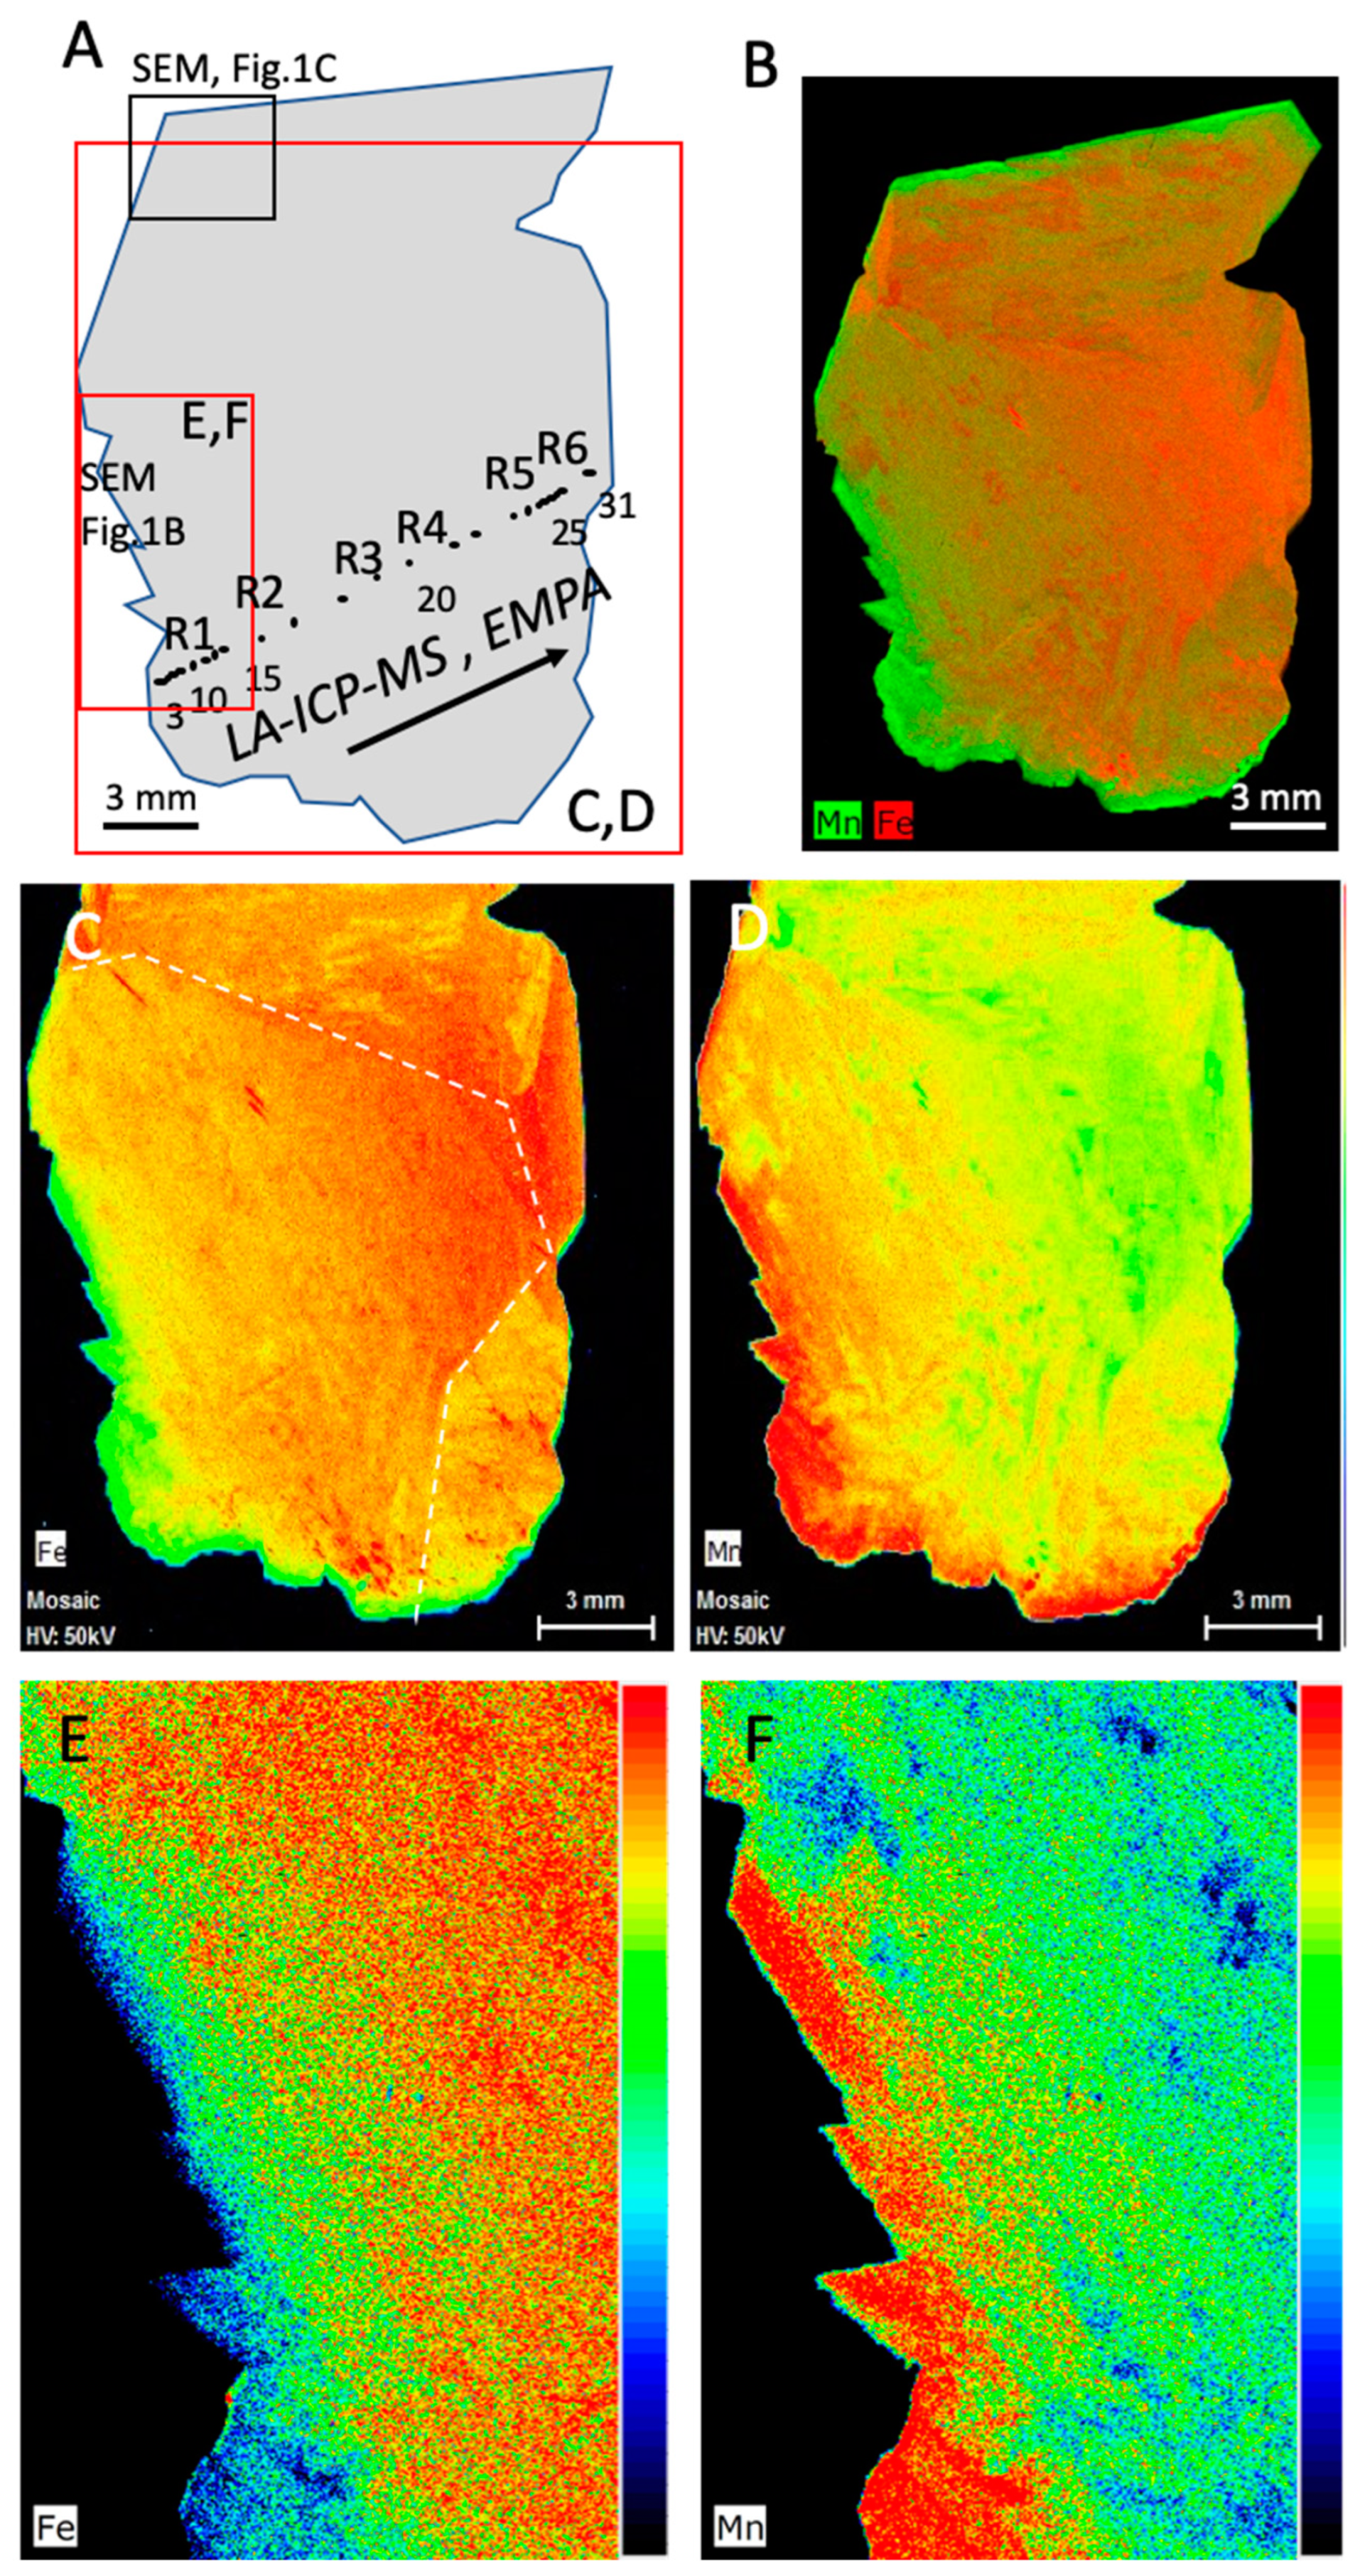
3.1.2. Micro-XRF Chemical Mapping

Figure 2 shows images of an axinite crystal approximately 3 cm long from Saint-Christophe-en-Oisans. This crystal shows significant zonation, with an iron-rich core, a transition zone, and a zone enriched in manganese.
The crystal growth is from right to left, and the external euhedral shape is represented only by the left-hand side and the upper surface as the crystal develops onto the fracture wall on the right-hand side. The arrow in white in Figure 2B indicates the sense of growth. On the periphery of the crystal, the outer zone is characterised by the highest concentrations of manganese, particularly in the automorphic terminations.
The chemical maps of Fe and Mn confirm at the crystal scale the existence of both sectorial and oscillatory zoning. Therefore, most of the analyses were performed along the profile from the Fe-rich core towards the Mn-rich external growth band within the central sector indicated by the dashed line in Figure 2C.
Details of the chemical zoning close to the euhedral irregular surface of the crystals are provided in Figure 2E,F. This zone is characterised by oscillatory zoning and a final growth band particularly enriched in manganese.

3.1.3. Crystal Chemistry—EMPA Analyses

Table 1 and Figure 3a,b show representative axinite analyses of the monocrystal profile. The Saint-Christophe-en-Oisans axinites’ composition covers an extensive range from Fe-(Mn) rich axinite similar to other axinites—from the Fe-end member represented by axinites from the Swiss Alps in the compilation in [1] to the Mn-rich axinites from Dalnegorsk (Russia). They are also similar in composition to those found in Silesia (Striegau granite and pegmatite) but do not reach the extreme Mn-end member found in Japan (Obira skarn).
The Ca site is filled almost up to 3.9 over 4. By correlating Fe + Mg with Mn, a slight excess appears in these divalent cations, indicating that either Mg or Mn, most probably Mn, could fill the gap in the Ca site. When plotting Mn corrected from the deficit in the Ca site, all data points plot along the 1:1 line with an almost perfect replacement of Fe2+ + Mg2+ by Mn2+. This good correlation between divalent cations suggests a negligible amount of Fe3+, as already suggested by [13].

3.2. XRD Patterns

XRD powder patterns for axinite are presented in Figure 4 with an enlargement of the 20–40° 2θ range. All peaks representative of axinite were found with similar reflection intensities to those from the literature [3,21]. Fe-axinite and Mn-axinite show little differences in their XRD powder patterns except for the reflection intensities corresponding to the 022 and 200 reflections [16]. It has not been possible to obtain XRD powder patterns on zones enriched in Mn as they are too tiny to be separated; the pattern reflects the mean contribution of the two end-members but no deviations were observed from what is expected for axinites. The intensities are, however, close to Fe-axinites. In particular, the reflection 101 at d = 5.1 Å—which must be intense in Mn-axinite—is very weak. Similarly, the 200 reflection is typically the most intense, as in the Fe-axinite end-member. Therefore, the XRD powder patterns of the whole crystal are a mean contribution of all growth bands and are much closer to that of Fe-axinite.

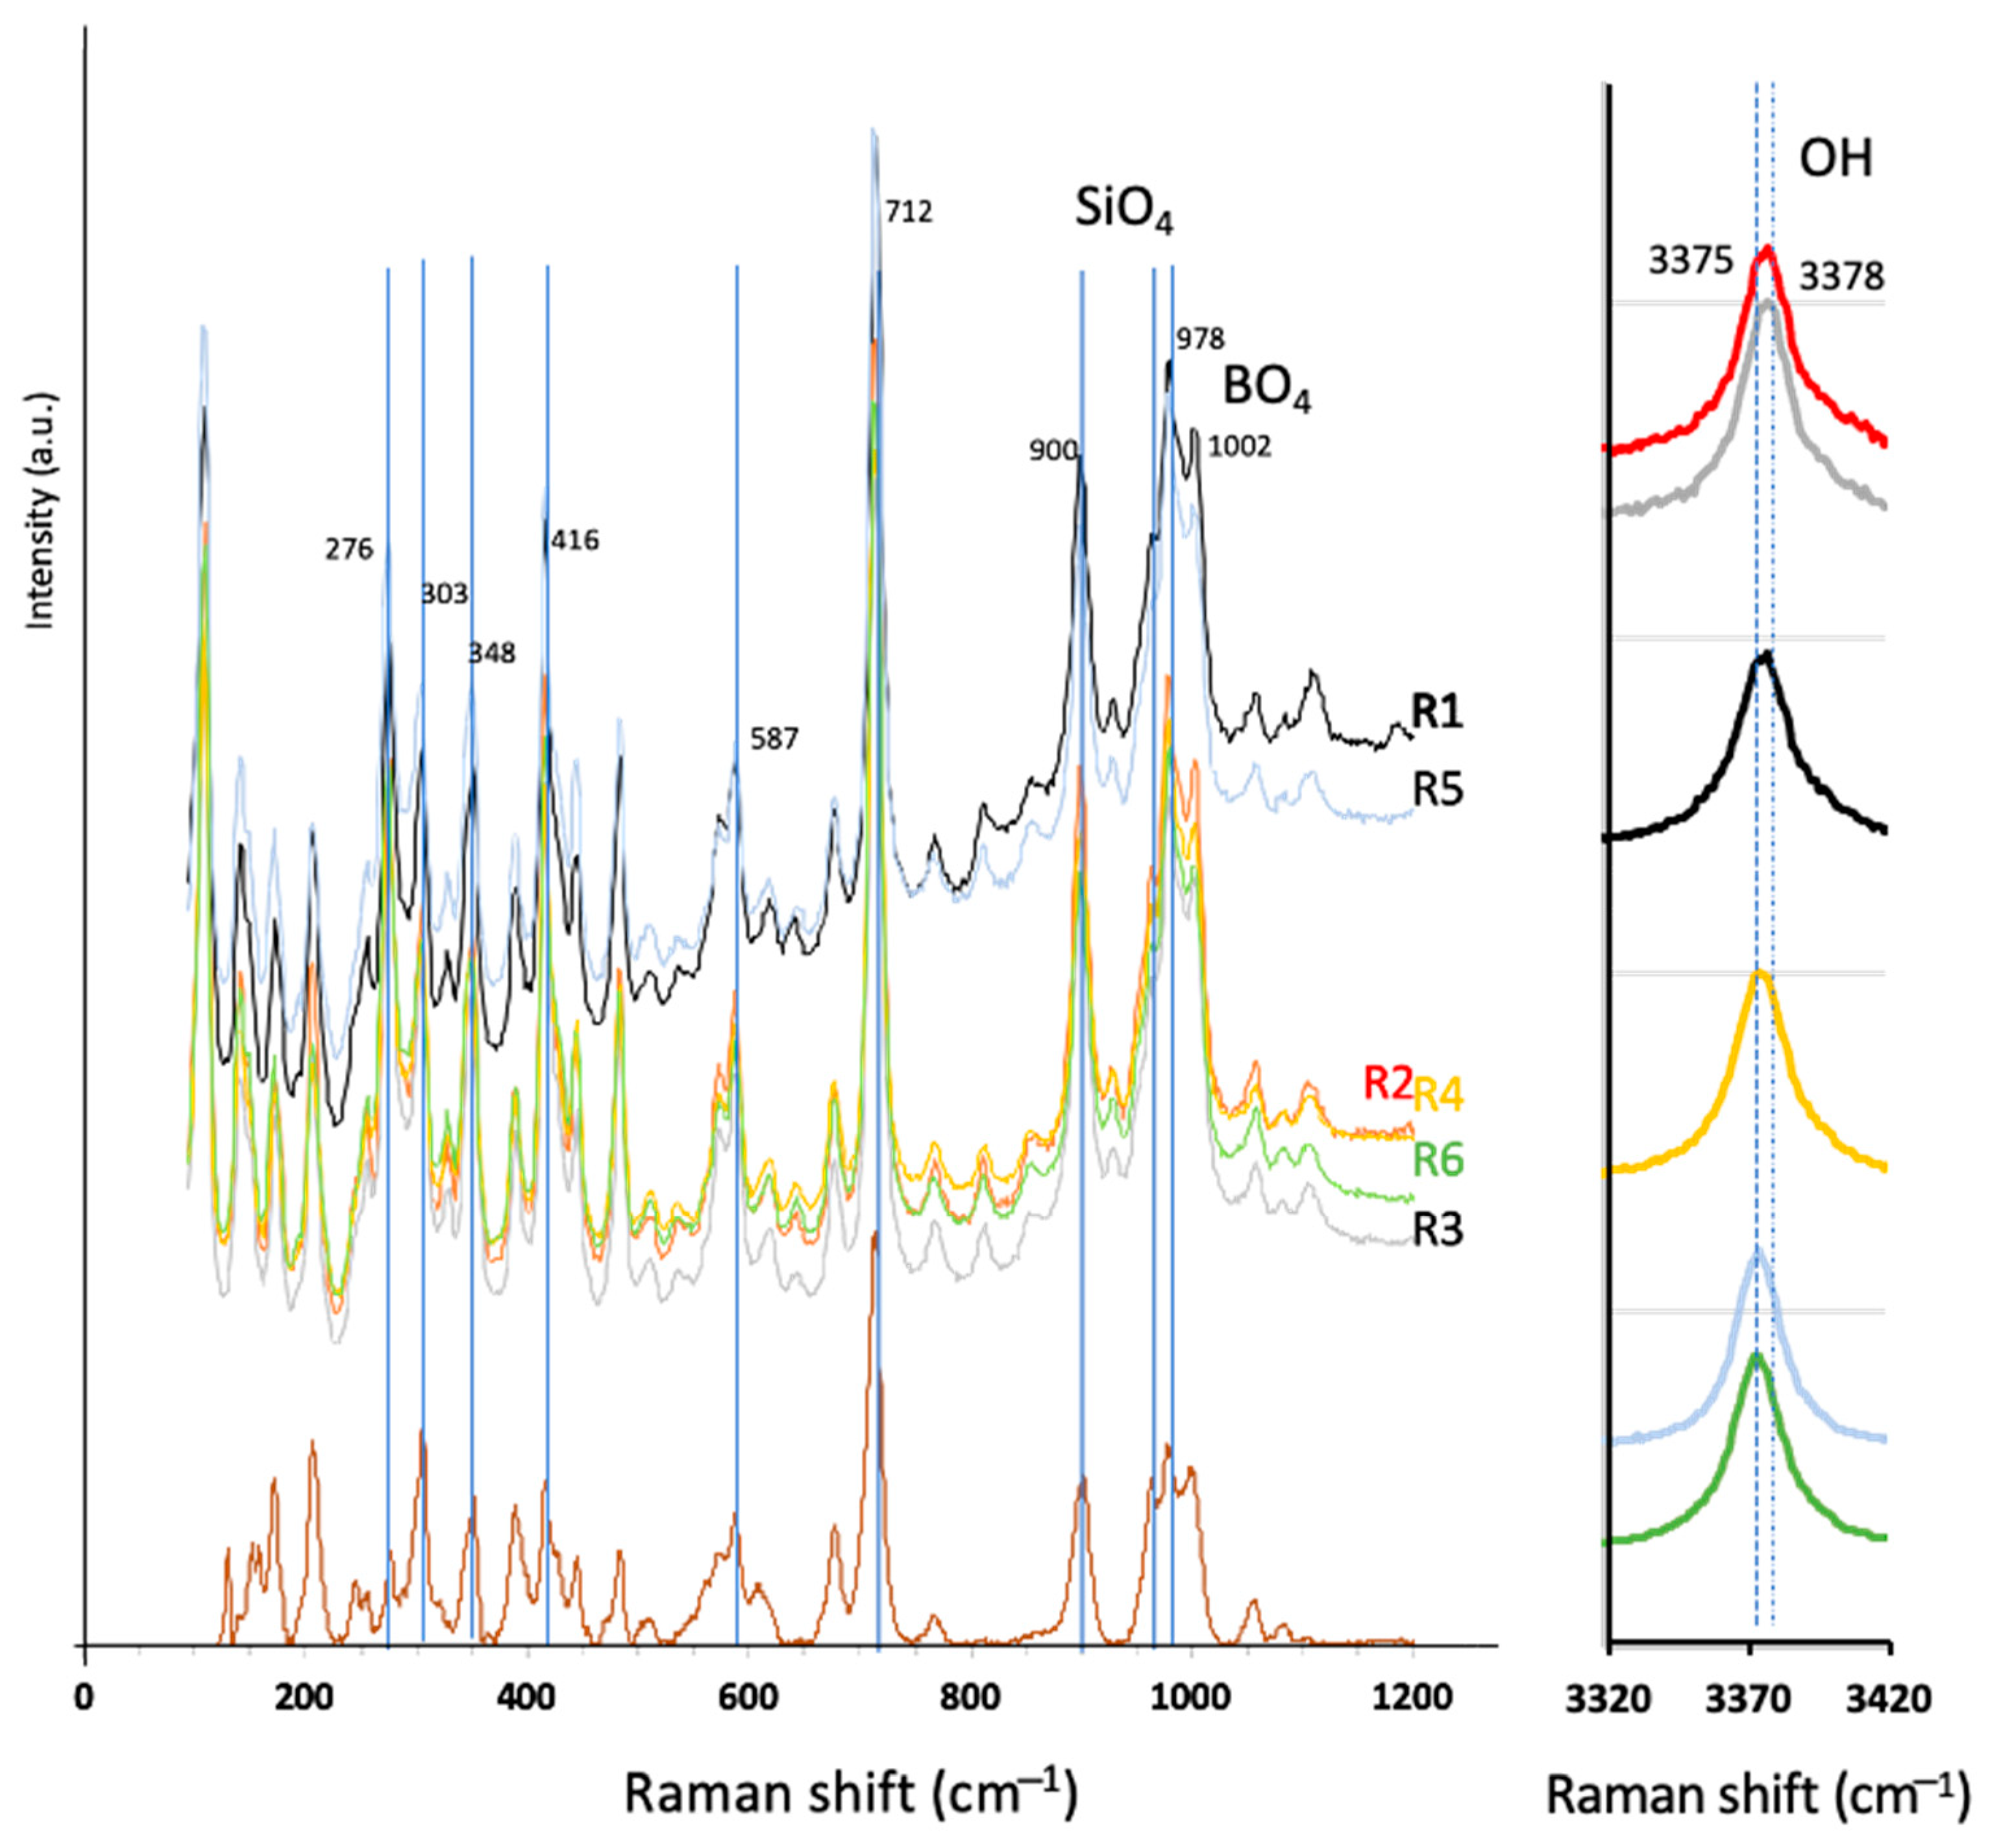
3.3. Raman Spectroscopy

The 100–1200 cm−1 range is presented in Figure 5. The spectra are very similar to those available in the literature on Ruff data compilation and Frost data [4]. Almost all bands show similar intensities to the reference spectra, except for the band around 276 cm−1, which is by far more intense in the Fe-rich zone (as in the reference Fe-axinite in Ruff [21]), and the bands around 303 and 348 cm−1, which are slightly less intense. The 587 cm−1 band is also less intense in Mn-axinite, partially confirmed by the spectra from the Mn late growth band R1 relative to the band at 712 cm−1. The 587 cm−1 band is attributed to the ν4 bending modes as proposed by [4]. The differences remain, however, very moderate.
Two bands in the OH stretching region are around 3372 and 3378 cm−1. These values are within the range recorded by [4] for ferroaxinites from California and Montana, for which two bands were identified at 3368 and 3373 cm−1.

3.4. LA-ICP-MS Data

The axinite monocrystal has been analysed using LA-ICP-MS along the profile shown in Figure 2A. Representative analyses are provided in Table 2, and the concentration profiles are shown in Figure 6 and Figure 7. The general trends dominated by the Fe(Mg)-Mn substitution are superimposed localised fluctuations linked to oscillatory zoning. Thus, bands enriched in iron at the same level as in the core are found even in the areas that show the prominent enrichment in Mn at the periphery.
The core enriched in Fe is also enriched in Be (up to 1700 ppm for 600 ppm at the periphery), Zn (up to 200 ppm for 70 ppm in the rim), Ti (up to 500ppm for 50–100 ppm in the rim), and shows a minor enrichment in Co at the ppm level. On the contrary, concentrations of Y and HREE (Tm, Yb, Lu, and Y), Cr, and Ge are only detected in the Mn-rich rim. Li is very low (a few ppm) but also more abundant in the Mn-rich rim. As a trace at the ppm level, Sc is less abundant in the Fe-rich parts of the crystal.
When considering concentrations as a function of the Fe/Mn ratio (Figure 7), rough correlations between Be, Zn, Co, and the Fe/Mn ratio are observed. Gallium and boron are independent of the Fe/Mn ratio. There is a rough but negative correlation between scandium and the Fe/Mn ratio (Figure 6). Y and HREE, such as Lu and Tm, have been detected only in the Mn-rich part of the crystal and decreased below the detection limit in the iron-rich part (Figure 6).

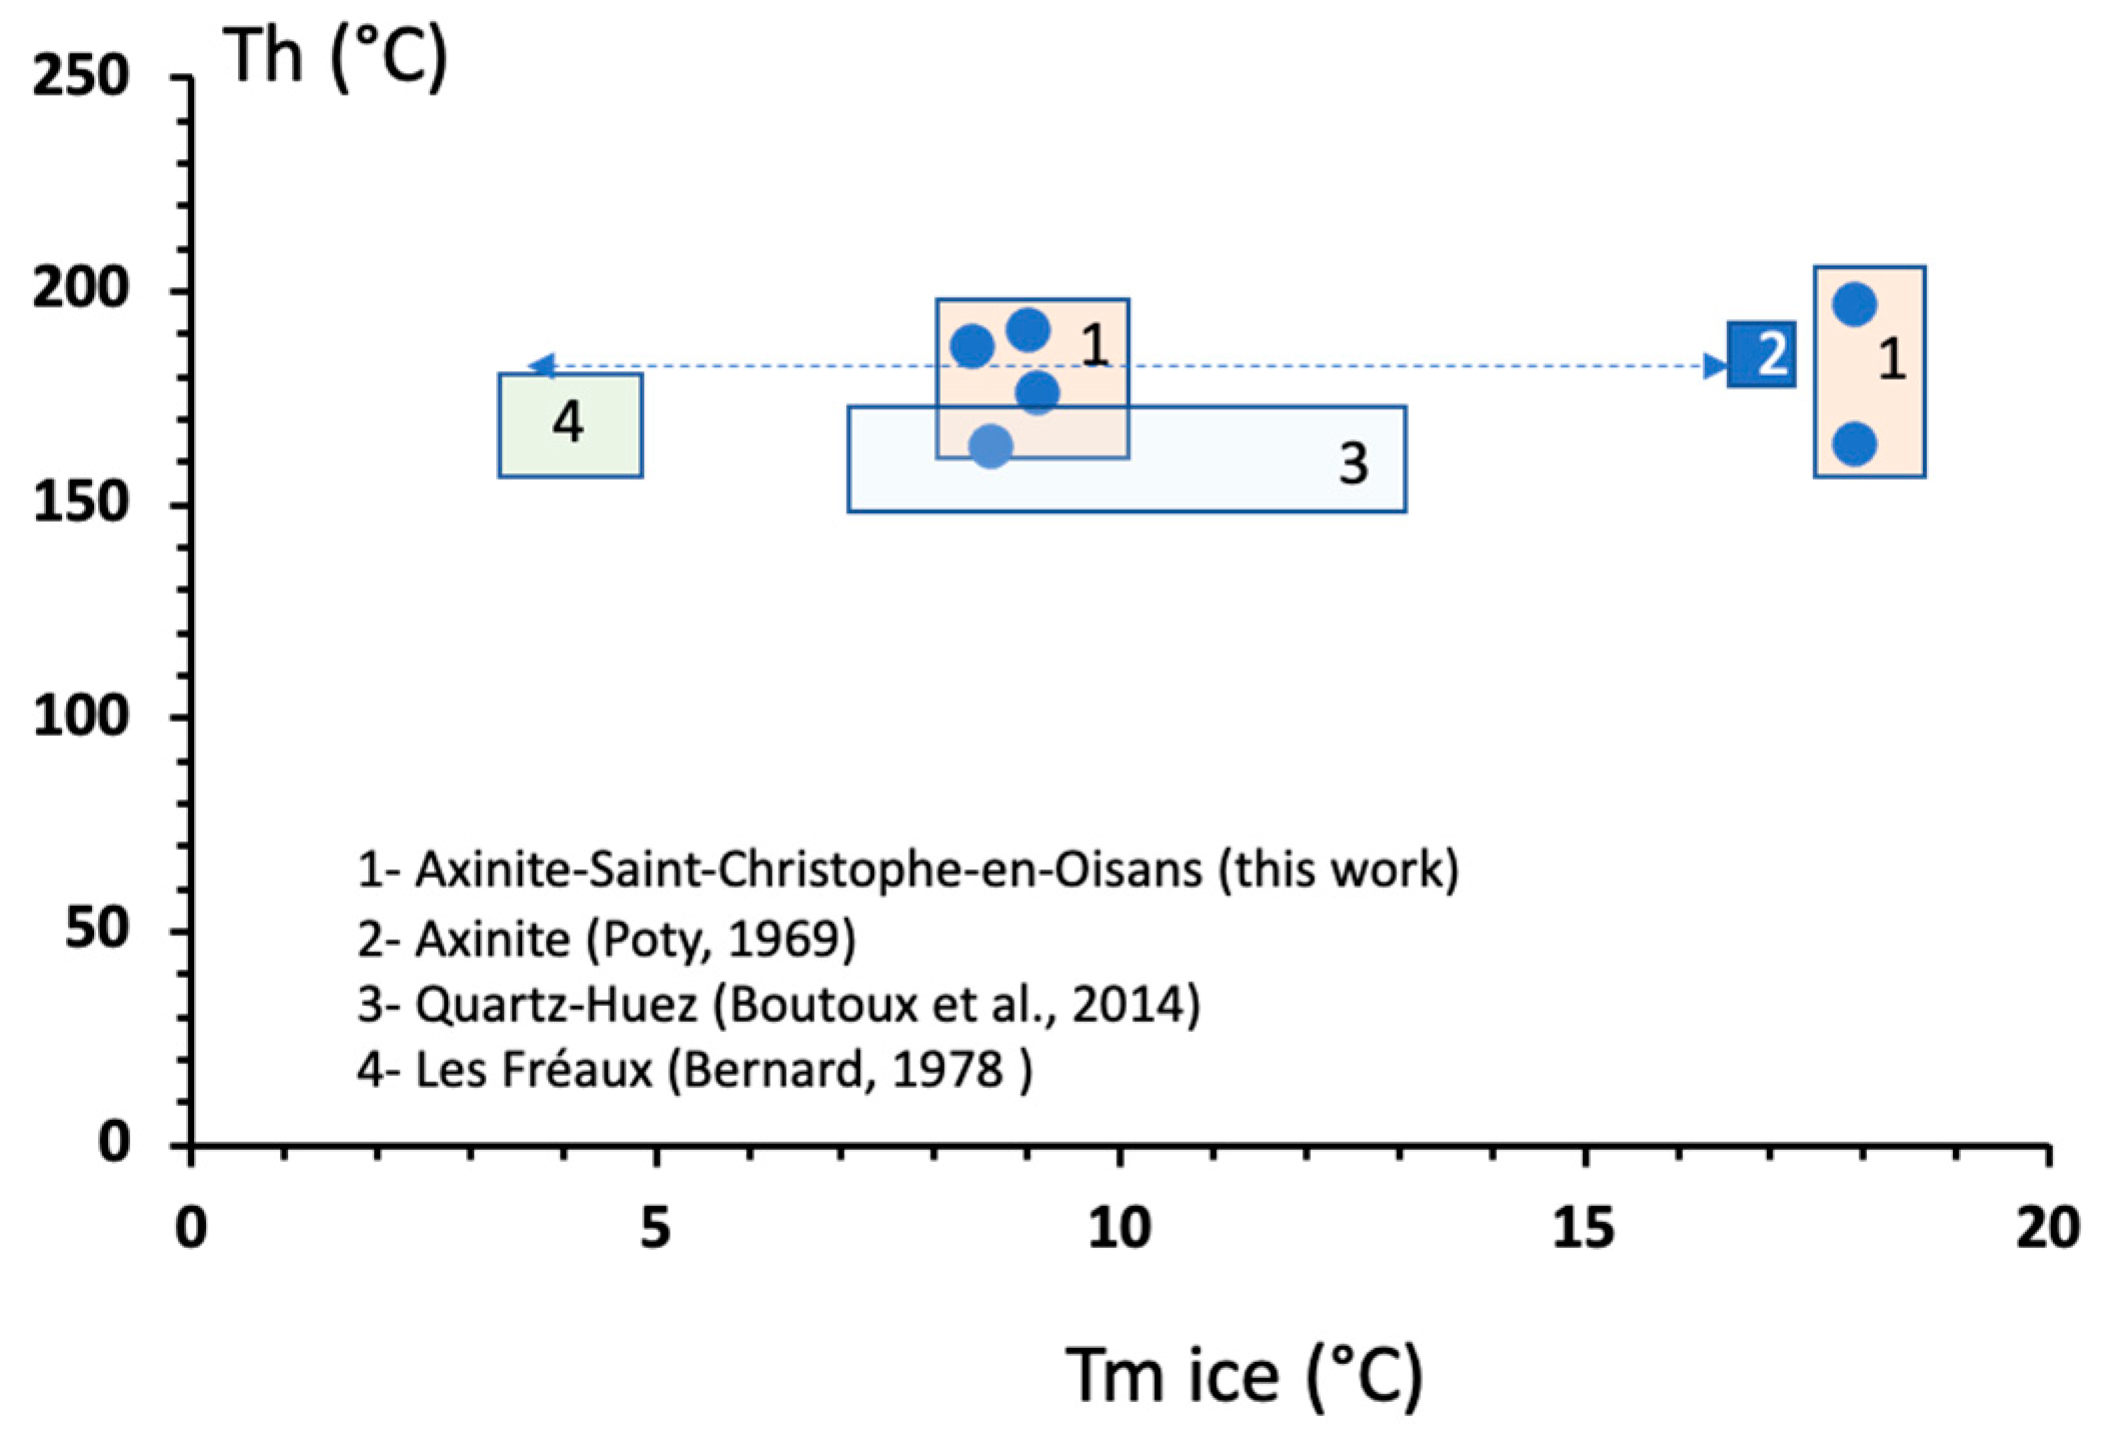
3.5. Fluid Inclusion Data

Fluid inclusions in axinite from Saint-Christophe-en-Oisans are primary and distributed along growth bands but only a few inclusions are large enough for microthermometric investigations. Data are presented in Figure 8. Salinities are around 8.5 and 18 eq. NaCl. No evidence of hydrate or clathrate melting was found, and this was confirmed by the lack of detectable gases using Raman spectroscopy. Bulk Th ranges were from 160 to 190 °C. The plot of the Th–salinity pair in Figure 8 shows that data obtained on Saint-Christophe-en-Oisans are similar to data obtained on axinite and quartz from the same region around Bourg d’Oisans by pioneer works [22,23,24,25]. All data are distributed along a trend of variable salinities between two end-members having similar Th.

4. Discussion

4.1. Extensive Range of Composition at the Scale of Single Crystal

SEM and micro-XRF chemical mapping demonstrated that the zoning in axinite reflects distinct variations in elemental distribution across the crystal. Sectorial zoning, with a central iron-rich core and manganese-enriched peripheral bands, indicates complex crystal growth processes driven by fluctuating environmental conditions during the mineralisation. These chemical trends are further substantiated by the detailed electron microprobe (EMPA) analyses, which show a wide compositional range from iron-dominant axinites to late-growth bands enriched in manganese, covering compositions found in axinites from other regions like the Swiss Alps for the Fe-(Mg)-axinite and to the Mn-axinites from Dalnegorsk (Russia) or Japan (Obira), as shown by the compilation from Andreozzi.
X-ray diffraction (XRD) and Raman spectroscopy results further refine our understanding of the crystal’s structural composition. While the XRD patterns of both iron- and manganese-rich zones are consistent with known axinite structures, minor shifts in reflection intensities underscore the subtle differences between the two end-member compositions. Though exhibiting moderate differences, Raman spectra support the chemical zoning observed through other methods, confirming the existence of compositional gradients within the same crystal.

4.2. Insights of Crystallisation Conditions

Axinite crystals form in low-dipping horizontal fractures, indicative of alpine tension gashes, with mineralisation occurring in stages on the surrounding amphibolite walls. These findings are consistent with the typical geologic settings in which axinites are observed. They support the view that fracture-filling mineralisation from hydrothermal/metamorphic fluids is a key mechanism in their growth. Homogenisation temperatures of fluid inclusions are similar to those from the literature. However, the fluid inclusion data partially constrain the P-T conditions. There are a few constraints about the trapping temperatures, apart from the stable isotope data from [24] on quartz from the same region and the Na/K ratio on fluid inclusions in axinite from [23]. Both authors propose a trapping temperature around 350 °C yielding pressure around 200 MPa using isochores corresponding to studied fluid inclusions.
Moreover, the LA-ICP-MS data offer a closer look at the trace element distributions within the crystal. The increasing concentration of manganese from the core to the rim, coupled with fluctuations in magnesium, beryllium, and boron, suggests that the crystal growth occurred in a dynamic geochemical environment dominated by fluid mixing. The observed correlations between iron, magnesium, and trace elements like zinc and cobalt reinforce the idea that variations influenced crystal growth in the local fluid chemistry, potentially driven by tectonic or hydrothermal processes.
Axinite occurs mainly in low- to medium-grade metamorphic environments [26]. They are often the only borosilicates in metamorphic rocks. The absence of tourmaline formation can be explained by a host lithology that is too low in aluminium but high in calcium [27]. Boron is an essential constituent in the structural formula of axinite. However, it is generally in short supply in basic rocks. It is reasonable to envisage two primary sources of boron: (i) Magmatic origin—boron is enriched in magma from the melting of metasediments and in the most differentiated facies and fluids from the fractional crystallisation of magma. Tourmaline is common in aplites and pegmatites, and fluids from these magmas contaminate nearby metamorphic host rocks (tourmalinisation of micaschists near intrusions). (ii) A sedimentary origin—boron enriched in the products of seawater evaporation (salt marshes or natural sebkhras) and found in significant concentrations in evaporite layers.
Several formations of the volcano-sedimentary complex, including intrusive granites occurring in Oisans, contain tourmaline [28]. Hydrothermal tourmaline is also reported in the area, close to mica-rich granitic gneisses. Axinite is thus likely formed after a multiphase cycle of boron expression involving sedimentary series that include evaporites, such as the Triassic series occurring above the Hercynian basement. Extraction of boron by alpine metamorphic fluid has been favoured by tectonic deformation, and the penetration of such fluids in the amphibolite series yields specific reactions with plagioclase-(K-feldspar) and amphibole to form the adularia–epidote–actinolite–axinite association.
The situation is far different from that of the Dalnegorsk deposit in Russia, located in Primorye, close to the Pacific coast [29]. This boron deposit was formed through reactions between a basic intrusion (gabbros and basalts) and Triassic limestones (the Triassic contains layers of evaporites worldwide), which are then transformed into tourmaline skarns. The limestone skarnification zone (with wollastonite, hedenbergite, and andradite) is 3.5 km long and 500 m thick. Boron in the form of datolite–danburite (and accessory axinite) is derived from the alteration in tourmalines and corresponds to a transfer of boron by fluid phases from the altering tourmalines to a more apical part. The most probably primary source of boron is the Triassic, and the boron cycle is complex, with an initial tourmaline phase, followed by calcic boron silicates (axinite, danburite, and datolite) linked to fluid–rock interactions. In the case of retrograde conditions affecting the Malkhan pegmatites [5], there are interesting similarities in the temperature range and mineral assemblages. In particular, the feldspar stability indicates the lack of fluid acidity, and pH shifts towards neutral or heightened alkalinity, which favours the formation of adularia and axinite stability [5]. The tourmaline and H3BO3 instability in mineral-forming fluids could also suggest a contribution of boron through the tourmaline destabilisation in the surrounding lithologies, as it occurs at Malkhan and Dalnegorsk.
The physical–chemical conditions of alpine vein formation in Oisans are around 350 °C, 200 MPa, from more or less salty aqueous fluids [22,23,24]. These conditions are consistent with those of a syn- to late-orogenic regime, as in the Polar Urals or other alpine cracks such as those in Switzerland or the Himalayas (Pakistan). However, the manganese-bearing poles, such as those at Saint-Christophe-en-Oisans, bring these axinites closer to those formed in skarn-type gites, such as those in Japan or Dalnegorsk. The similarities stop at the chemical composition as none of the Oisans sites are of the “skarn” type because there is no magmatic intrusion in the Alps during alpine deformation and, therefore, no skarn formation in limestones.
Apart from Oisans, axinite was also typically found in mountain ranges, in late-orogenic conditions in alpine-type fissures, sometimes with remarkable crystal sizes, in the Swiss Alps as at Piz Vallatscha near Dissentis (Switzerland, [30] or Catogne, Valais, [31]), in the Pyrenees (Pic d’Espade, Bagnères-de-Bigorre, Hautes-Pyrénées), Urals and the Himalayas.

5. Conclusions

The axinites from the Saint-Christophe-en-Oisans locality are characterised by compositions ranging from Fe-(Mg) terms to an Mn-dominated pole. The present study provides one of the rare complete characterisations of a single crystal from the exact provenance using in situ chemical analysis (EMPA and LA-ICP-MS), structure characterisation using XRD and Raman spectroscopy, chemical imaging at the scale of the crystal using micro-XRF completed by BSE SEM imaging. The crystal chemistry and crystallography of axinite reveal significant insights into its formation and zoning characteristics. The combined analytical techniques provide a comprehensive view of the crystal’s formation history and compositional evolution. The observed zoning and element correlations expand our understanding of axinite crystal chemistry and offer a framework for interpreting the geochemical conditions under which these minerals crystallised.
Although all of these techniques could only be applied to a single crystal from Saint-Christophe-en-Oisans, micro-XRF, SEM, and Raman data show that crystals from the same locality possess the same characteristics. While the conclusions concerning this locality have been established, the variability in axinite characteristics on a regional scale remains to be determined for the Oisans region, which is a work in progress.
The host lithologies of mineralised fissures are almost always amphibole-rich gneisses. The source of calcium is plagioclase in the inherited molten parts of amphibolite gneiss, and the source of iron and manganese is amphibole—these two minerals being the main ones in amphibolite gneiss. Therefore, the host lithology can control the availability of iron, manganese, and calcium depending on the initial abundance of amphibole and the presence or absence of other competing minerals, such as epidote, frequently present and crystallised before axinite. In the case of the Oisans, the boron’s origin is most likely found in the Triassic series (evaporites), which cover the Hercynian basement. Still, the instability of tourmalines from the volcano-sedimentary series cannot be precluded. The low availability of aluminium may explain the formation of axinites to the detriment of other boron silicates, such as tourmaline, as well as the neutral-to-alkaline pH of the percolating fluids. The formation conditions are typical of early fluid circulation along shear zones, and tension gashes at the beginning of the exhumation of alpine terranes at the end of alpine orogeny. Fluids indicate fluid mixing between brines, probably from Triassic and more regional fluids from the basement, under temperatures around 350 °C.

Author Contributions

Conceptualisation, M.C. and O.G.; methodology: M.C. and C.P.; software, C.P.; investigation, M.C.; data curation, M.C.; writing—original draft preparation, M.C.; writing—review and editing, M.C. and O.G.; funding acquisition, M.C. All authors have read and agreed to the published version of the manuscript.

Funding

This research received no direct external funding. The research benefits from the analytical platforms (SCMEM, LA-ICP-MS) at GeoRessources in Nancy, which are funded by the Labex Ressources 21 (ANR-10-LABX-21-RESSOURCES21), the Région Lorraine, and the European Community through the FEDER program.

Data Availability Statement

Data are available upon request from the authors.

Acknowledgments

The author would like to thank G. Saussus for providing part of the studied material, A. Lecomte for the SEM images, and M.-C. Caumon for her help in Raman spectroscopy. L. Khouya is thanked for his contribution to fluid inclusion microthermometry.

Conflicts of Interest

The authors declare no conflicts of interest.

References

  1. Andreozzi, G.B.; Lucchesi, S.; Graziani, G.; Russo, U. Site distribution of Fe2+ and Fe3+ in the axinite mineral group: New crystal-chemical formula. Am. Mineral. 2004, 89, 1763–1771. [Google Scholar] [CrossRef]
  2. Andreozzi, G.B.; Ottolini, L.; Lucchesi, S.; Graziani, G.; Russo, U. Crystal chemistry of the axinite-group minerals: A multi-analytical approach. Am. Mineral. 2000, 85, 698–706. [Google Scholar] [CrossRef]
  3. Salviulo, G.; Andreozzi, G.B.; Graziani, G. X-ray characterization of Mg, Fe, and Mn natural end-members of the axinite group. Powder Diffr. 2000, 15, 180–188. [Google Scholar] [CrossRef]
  4. Frost, R.; Bouzaid, J.; Martens, W.; Bayyareddy, J. Raman Spectroscopy of the borosilicate mineral Ferroaxinite. J. Raman Spectrosc. 2007, 38, 135–141. [Google Scholar] [CrossRef]
  5. Zagorsky, V.Y.; Peretyazhko, I.S.; Dmitrieva, A.S. Axinite-(Mn) from miarolitic granitic pegmatites of the Malkhan gem-tourmaline deposit (Transbaikalia, Russia): Composition, paragenesis and conditions of formation. Eur. J. Min. 2016, 28, 811–824. [Google Scholar] [CrossRef]
  6. Hauy, R.J. Extrait du Traité de Minéralogie que le Cen Haüy s’occupe de rédiger. J. Des Mines 1797, 5, 239–334. [Google Scholar]
  7. Basso, R.; Della Giusta, A.; Vlaic, G. La structura della tinzenite. Per. Mineral. 1973, 42, 369–379. [Google Scholar]
  8. Takeuchi, Y.; Ozawa, T.; Ito, T.; Araki, T.; Zoltai, T.; Finney, J.J. The B2Si8O30 groups of tetrahedra in axinite and comments on the deformation of Si tetrahedra in silicates. Z. Kristallogr. 1974, 140, 289–312. [Google Scholar] [CrossRef]
  9. Gatta, G.D.; Redhammer, G.J.; Guastoni, A.; Guastella, G.; Meven, M.; Pavese, A. H-bonding scheme and cation partitioning in axinite: A single-crystal neutron diffraction and Mössbauer spectroscopic study. Phys. Chem. Miner. 2016, 43, 341–352. [Google Scholar] [CrossRef]
  10. Sanero, E.; Gottardi, G. Nomenclature and crystal-chemistry of axinite. Am. Mineral. 1968, 53, 1407–1411. [Google Scholar]
  11. Filip, J.; Kolitsch, U.; Novák, M.; Schneeweiss, O. The crystal structure of near-end-member ferroaxinite from an iron-contaminated pegmatite at Malesov, Czech Republic. Can. Min. 2006, 44, 1159–1170. [Google Scholar] [CrossRef]
  12. Lumpkin, G.R.; Ribbe, P.H. Chemistry and physical properties of axinites. Am. Mineral. 1979, 64, 635–645. [Google Scholar]
  13. Pieczka, A.; Kraczka, J. Crystal chemistry of Fe2+—Axinite from Strzegom. Mineral. Polonica 1994, 25, 43–49. [Google Scholar]
  14. Bellahsen, N.; Jolivet, L.; Lacombe, O.; Bellanger, M.; Boutoux, A.; Garcia, S.; Mouthereau, F.; Le Pourhiet, L.; Gumiaux, C. Mechanisms of margin inversion in the external Western Alps: Implications for crustal rheology. Tectonophysics 2012, 560–561, 62–83. [Google Scholar] [CrossRef]
  15. Bellanger, M.; Augier, R.; Bellahsen, N.; Jolivet, L.; Moniè, P.; Baudin, T.; Beyssac, O. Shortening of the European Dauphinois margin (Oisans Massif, Western Alps): New insights from RSCM maximum temperature estimates and 40Ar/39Ar in situ dating. J. Geodyn. 2015, 83, 37–64. [Google Scholar] [CrossRef]
  16. Gasquet, D.; Bertrand, J.-M.; Paquette, J.-L.; Lehmann, J.; Ratzov, G.; Guedes, R.D.A.; Tiepolo, M.; Boullier, A.-M.; Scaillet, S.; Nomade, S. Miocene to Messinian deformation and hydrothermal activity in a pre-Alpine basement massif of the French western Alps: New U-Th-Pb and argon ages from the Lauzière massif. Bull. Soc. Geol. Fr. 2010, 181, 227–241. [Google Scholar] [CrossRef]
  17. Cathelineau, M.; Boiron, M.-C.; Lecomte, A.; Martins, O.; Dias da Silva, I. Mateus A. Lithium, Phosphorus, Fluorine-Rich Intrusions and the Phosphate Sequence at Segura (Portugal): A Comparison with other Hyper-Differentiated Magmas. Minerals 2024, 14, 287. [Google Scholar] [CrossRef]
  18. Patton, C.; Hellstrom, J.; Paul, B.; Woodhead, J.; Hergt, J. Iolite: Freeware for the visualisation and processing of mass spectrometric data. J. Anal. At. Spectrom. 2011, 26, 2508–2518. [Google Scholar] [CrossRef]
  19. Longerich, H.P.; Jackson, S.E.; Günther, D. Inter-laboratory note. Laser ablation inductively coupled plasma mass spectrometric transient signal data acquisition and analyte concentration calculation. J. Anal. At. Spectrom. 1996, 11, 899–904. [Google Scholar] [CrossRef]
  20. Cathelineau, M.; Boiron, M.-C.; Marignac, C.; Dour, M.; Dejean, M.; Carocci, E.; Truche, L.; Pinto, F. High pressure and temperatures during the early stages of tungsten deposition at Panasqueira revealed by fluid inclusions in topaz. Ore Geol. Rev. 2020, 126, 103741. [Google Scholar] [CrossRef]
  21. Ruff. Fe and Mn. Available online: https://rruff.info/Axinite (accessed on 15 February 2025).
  22. Poty, B. La Croissance des Cristaux de Quartz sur L’exemple du Filon de La Gardette (Bourg d’Oisans) et des Filons du Massif du Mont-Blanc. Ph.D. Thesis, Nancy-Université, Nancy, France, 1967. NNT: 1967NAFS0052. [Google Scholar]
  23. Poty, B.P.; Stalder, H.-A.; Weisbrod, A.M. Fluid inclusion studies in quartz from fissures of western and central Alps. Schweiz. Mineral. Petrogr. Mitt. 1974, 54, 717–752. [Google Scholar]
  24. Boutoux, A.; Verlaguet, A.; Bellahsen, N.; Lacombe, O.; Villemant, B.; Caron, B.; Martin, E.; Assayag, N.; Cartigny, P. Fluid systems above basement shear zones during inversion of pre-orogenic sedimentary basins (External Crystalline Massifs, Western Alps). Lithos 2014, 206–207, 435–453. [Google Scholar] [CrossRef]
  25. Bernard, D. Microthermométrie des inclusions fluides de cristaux syncinématiques. Application à la couverture sédimentaire du Nord Pelvoux. Ph.D. Thesis, Grenoble University, Grenoble, France, 1978. [Google Scholar]
  26. Grew, E.S. Borosilicates (exclusive of tourmaline) and boron in rock-forming minerals in metamorphic environments. In Mineralogical Society of America. Rev. Mineral. 1996, 33, 387–502. [Google Scholar]
  27. Pringle, I.J.; Kawachi, Y. Axinite mineral group in low-grade regionally metamorphosed rocks in southern New Zealand. Am. Mineral. 1980, 65, 1119–1129. [Google Scholar]
  28. Lacombe, J.-C. Etude pétrographique de la partie orientale du massif des Ecrins-Pelvoux- Le complexe volcano-sédimentaire—Alpes Françaises. Ph.D. Thesis, University Grenoble, Grenoble, France, 1970; 123p. [Google Scholar]
  29. Dubinina, E.O.; Baskina, V.A.; Avdeenko, A.S. Nature of ore-forming fluids of the Dal’negorsk deposit: Isotopic and geochemical parameters of the altered host rocks. Geol. Ore Depos. 2011, 53, 58–73. [Google Scholar] [CrossRef]
  30. Weibel, M.; Graeser, S.; Oberholzer, W.F.; Stalder, H.-A.; Gabriel, W. Die Mineralien der Schweiz, 5th ed.; Birkhäuser: Basel, Switzerland, 1990. [Google Scholar] [CrossRef]
  31. Meisser, N.; Brugger, J.; May, R.; Cheseaux, D. Der Axinit vom Catogne (VS). Schweiz. Strahler 1996, 10, 325–337, (In German and French). [Google Scholar]
Figure 1. (A) Axinite (Ax) growing on the wall of an alpine clift developed in amphibolite (amph.) and accompanied by adularia as white crystals (Ad); backscattered electron image of two areas of the monocrystal, shown in Figure 2A; (B) banding with small heterogeneities in Fe-Mn distributions; (C) composite BSE image showing oscillatory banding near the edge of the crystal. No break-in growth occurred (no inclusions or evidence of dissolution).
Crystals 15 00402 g001
Figure 2. Micro-XRF imaging of the axinite monocrystal from Saint-Christope-en-Oisans: (A) location of analyses in the crystal (SEM, LA-ICP-MS, and EPMA profile) and an indication of the area mapped in figures (CF); (B) composite chemical image with Mn and Fe; (C,D) chemical image treated in relative intensity for Fe and Mn, the dashed line shows a possible boundary of one sector of zoning; (E,F) detail of the late external band on the left-hand side of the crystal. Indication R1 to R6 corresponds to the location of Raman spectra.
Crystals 15 00402 g002
Figure 3. (a) Fe-Mg-Mn triangular diagram indicating the fields from Mg-, Mn-, and Fe-axinites, applied to several crystals from Saint-Christophe-en-Oisans. Worldwide reference axinites (data from [2], displayed as open circles) are reported for comparison; (b) Fe-Mn diagram applied to the monocrystal from Figure 2A (in blue) and reference axinites from [1,2] in open circles. The dashed line slope is the boundary of the shift due to increasing Mg content which is correlated to the iron content. The blue line divides the two domains of Fe-axinite and Mn-axinite.
Crystals 15 00402 g003
Figure 4. The XRD pattern of Saint-Christophe-en-Oisans axinite compared to reference patterns from [4]: (a) Fe-axinite from Butte (MT, USA); (b) Mn-axinite from unknown provenance). XRD patterns of Saint-Christophe-en-Oisans axinite are presented in (c), corresponding to the enlargement of the part located in the square from pattern (d) obtained within the 5–70° 2θ range (d from 14 to 1.35 Å) with an indication of the main reflections (indexed and indicated as blue lines).
Crystals 15 00402 g004
Figure 5. Raman spectra of the main monocrystal were carried out along the profile from the Mn-rich rim to the Fe-rich core (R1 to R6, regularly spaced) for the low-frequency range between 140 and 1200 cm−1 and the high-frequency range between 3320 and 3420 cm−1. The spectrum below corresponds to the Mn-axinite from the Ruff data bank for the low-frequency range. Prominent bands are indexed. The colours of the right-hand side spectra correspond to the same colours as spectra obtained at the exact location of R1 to R6.
Crystals 15 00402 g005
Figure 6. Concentrations on major and trace elements (in ppm) measured by LA-ICP-MS along the profile in Figure 2A from the rim to the core, e.g., at decreasing Mn and increasing Fe and Mg; values indicated in the x-axis correspond to the analysis number (33 analytical points along the traverse in the crystal from Mn-rich axinite (rim) to Fe-rich axinite (core).
Crystals 15 00402 g006
Figure 7. Concentrations of Mg, Be, Zn, Ga, Co, and Sc (in ppm) vs. Fe/Mn ratio (at). All elements, including Fe and Mn, were measured by LA-ICP-MS analyses along the profile from Figure 2A. Correlations coefficients between Fe/Mn and Mg, Zn, and Co are 0.75, 0.76, and 0.83.
Crystals 15 00402 g007
Figure 8. Fluid inclusion data on axinite from Saint-Christophe-en-Oisans (1, as blue circles) compared to the literature data on the Bourg d’Oisans area (2: [22,23]; 3: [24]; 4: [25]). Arrow indicates a possible trend of mixing between saline and lower salinity end-members.
Crystals 15 00402 g008
Table 1. EMPA data and structural formulae of selected representative data points from the analytical line shown in Figure 2A. The structural formulae were calculated based on 31 oxygens (equivalent to a full analysis based on 32 oxygens and 2 (OH)). OH and B are arbitrarily fixed at 2 (*), and B2O3 calculated accordingly.
Rim Core
31015202531
SiO240.741.7642.0642.2442.1542
TiO20.040.0400.0400.02
Al2O317.8317.8618.0617.9117.8617.7
FeO3.744.454.544.834.814.95
MnO8.376.256.25.895.695.48
MgO0.510.951.131.151.161.22
CaO19.619.3719.5619.4119.719.3
Na2O0.0200.0100.030.02
K2O0.040.010.010.040.010.01
BaO0.000.000.000.000.000.00
B2O3 *6.006.066.116.116.116.07
H2O *1.551.571.581.581.581.57
Total98.4098.3199.2799.2199.1098.34
O=F. Cl *1.601.690.730.790.901.66
B *2.002.002.002.002.002.00
Si7.867.997.978.008.008.02
Al total4.064.034.034.003.993.98
Ti0.010.010.000.010.000.00
Fe0.600.710.720.770.760.79
Mn1.371.011.000.950.910.89
Mg0.150.270.320.320.330.35
Ca4.063.973.973.944.003.95
Na0.010.000.000.000.010.01
K0.010.000.000.010.000.00
Ba0.000.000.000.000.000.00
(OH. F. Cl) *2.002.002.002.002.002.00
Total22.1221.9922.0222.0022.0121.99
Table 2. LA-ICP-MS analyses of trace elements in axinite from Saint-Christophe-en-Oisans made along the profile in Figure 2A from the Mn-rich part of the crystal (numbers close to 1) to the Mn-depleted and enriched in Mg and Fe (up to number 33).
ppmLiBeScTiVCrCoZnGaGeSrInSnTbDyHoErTmYbLuY
12.11002.075.951.2100.7111.61.272.213.35.611.61.3 0.613.68.961.513.4119.718.9315.8
23.41021.413.565.937.517.11.294.79.06.112.91.1 0.38.55.534.06.446.26.0210.9
3 1073.73.5124.423.33.21.3101.810.313.711.71.0 0.48.85.333.26.746.95.9222.2
45.2928.74.473.723.95.31.3100.07.94.813.90.6 0.03.92.818.94.028.53.7114.0
57.0612.38.667.266.28.51.6114.010.74.910.80.6 0.13.62.111.71.911.21.477.7
66.4742.38.580.467.55.81.5111.99.05.412.50.7 0.03.72.111.51.912.01.582.0
78.7683.85.560.065.54.21.6118.47.1 14.70.6 0.02.21.37.21.38.20.948.6
83.8732.90.9533.864.6 2.7145.813.73.514.10.0 0.00.00.20.90.20.00.07.6
99.1704.22.467.183.5 1.5133.26.93.013.70.6 0.02.21.16.31.17.20.845.1
104.3359.01.6101.499.7 1.9139.510.15.010.00.3 0.02.21.05.80.95.10.643.1
113.7289.62.579.865.9 1.9130.44.3 23.80.5 0.00.00.01.90.43.30.510.0
124.2482.32.399.8111.4 2.0147.27.94.711.70.52.30.01.00.74.20.85.80.728.3
132.4449.21.4272.688.53.22.1121.78.56.88.60.013.2 0.00.00.00.01.3
143.2512.61.0205.091.83.52.3133.38.74.99.20.06.2 0.00.00.00.01.0
152.51501.71.1296.897.5 2.5151.49.0 11.80.03.0 0.00.01.00.02.7
164.0509.61.1378.5123.6 2.0161.311.84.711.50.34.2 1.60.02.60.09.5
17 687.51.353.861.7 1.7111.610.03.312.3 1.50.43.00.49.0
182.31629.22.7161.7111.0 2.3133.67.1 12.70.05.1 1.20.43.60.56.6
191.81433.03.4138.4108.7 2.2133.96.5 12.80.55.3 1.80.54.90.78.7
20 1397.43.3136.4101.0 2.2134.46.1 13.50.65.1 1.70.55.10.87.8
213.41572.90.7284.981.3 2.6157.78.4 12.40.02.3 0.00.00.00.01.4
221.8830.41.8221.2111.8 2.0118.28.85.210.80.510.3 2.00.54.10.611.8
233.01474.01.2182.680.2 2.6142.76.6 12.5 3.0 0.00.01.20.02.3
242.21575.12.6165.599.0 2.4137.96.72.011.70.45.3 1.10.33.40.56.3
253.1568.91.0116.163.5 2.3158.85.3 17.20.1 0.00.00.00.02.5
261.7415.80.7144.762.6 2.4177.46.2 14.00.01.7 0.00.00.00.00.9
271.7162.01.285.443.4 2.5185.63.2 19.30.1 0.00.00.00.01.2
283.51454.51.2265.057.51.42.8181.96.0 11.90.02.1 0.00.00.00.00.6
293.51773.20.5487.863.2 3.0206.15.7 12.10.01.7 0.00.00.00.00.4
304.91002.02.0305.554.73.63.3196.74.6 12.90.02.1 0.00.00.00.00.6
311.51577.12.8235.882.2 2.4186.16.0 12.20.06.2 0.00.01.60.01.5
323.0595.90.8250.675.4 2.5169.57.22.89.50.04.8 0.00.00.00.00.3
332.5773.51.0229.982.02.32.5164.27.22.510.0 5.2 0.00.00.00.01.1
Disclaimer/Publisher’s Note: The statements, opinions and data contained in all publications are solely those of the individual author(s) and contributor(s) and not of MDPI and/or the editor(s). MDPI and/or the editor(s) disclaim responsibility for any injury to people or property resulting from any ideas, methods, instructions or products referred to in the content.

