Abstract
Hip implant optimization is increasingly receiving attention due to the development of manufacturing technology and artificial intelligence interaction in the current research. This study investigates the development of hip implant stem design with the application of lattice structures, and the utilization of the MATLAB regression learner app in finding the best predictive regression model to calculate the mechanical behavior of the implant’s stem based on some of the design parameters. Many cases of latticed hip implants (using 3D lattice infill type) were designed in the ANSYS software, and then 3D printed to undergo simulations and lab experiments. A surrogate model of the implant was used in the finite element analysis (FEA) instead of the geometrically latticed model to save computation time. The model was then generalized and used to calculate the mechanical behavior of new variables of hip implant stem and a database was generated for surgeon so they can choose the lattice parameters for desirable mechanical behavior. This study shows that neural networks algorithms showed the highest accuracy with predicting the mechanical behavior reaching a percentage above 90%. Patients’ weight and shell thickness were proven to be the most affecting factors on the implant’s mechanical behavior.
1. Introduction
In the field of orthopedic implants, new technologies are utilized with applying the lattice structure materials to the implant for the purpose of obtaining optimized biological and mechanical properties closer to those of the human bone [1].
Hip implants, specifically, encounter some difficulties because of their long lifespan, which creates the need for implant optimization. The application of lattice structures and the ability to control the biomechanical reaction of these structures helped enhance the hip implant performance [2]. Moreover, lattice structures are considered to be a helpful feature to bone growth because it can enhance the implant fixture inside the hosting bone [3]. They can also help decrease the mismatch between the bone tissue’s stiffness and the solid implant which can help reduce the stress-shielding effect that usually causes the bone to weaken [4]. Beaupré et al. confirmed that setting the porosity of these lattice structures to a certain range can also help enhance the bone remodeling [5,6].
Manufacturing the lattice structures is a challenging task due to their complexity in shape [7]. Yet, due to the advancement in the additive manufacturing (AM) technology, complex latticed structures can now be manufactured [8]. Many AM techniques are used with the lattice structures manufacturing like power bed fusion (PBF), selective laser melting (SLM), electron beam melting (EBM), and direct metal laser sintering (DMLS) [9]. DMLS is a common AM technique with Yb (ytterbium)-fiber laser, which is famous for use with the titanium alloys [10,11,12].
For the purpose of determining the hip implant’s mechanical properties, compression tests can be performed. Yunus et al. [13] used laboratory compression tests and finite element analysis according to the ISO 7206-4:2010 to analyze lattice hip implant. The test was performed on a latticed implant and 3D printed using DMLS technique after applying semispherical pores to improve its osseointegration. This research confirmed that, to a certain, extent hip implants show more flexibility with growing pore sizes. Acosta et al. [14] investigated hip implants under compression and performed finite element analysis for several femur types and stated that latticed implants had better load distribution through the total structure.
Due to the complexity of the lattice structures in form and shape, deciding on their parameters is considered a challenging task, and to ensure a good structure, the suitable pattern and density should be chosen carefully. This difficulty comes from the fact that lattices are structures composed of hundreds and, sometimes, thousands of tiny surfaces and struts. Therefore, the CAD modeling for such structures will be a time-consuming operation, and the finite element analysis for such structures will also require high computing power and take a long time. Thus, the try-and-error method will not be as useful with these kind of structures [15]. The options to build a lattice structure in the current software are wide in range, which adds complexity to the selection process for the designers [16].
Researchers tried to avoid the try-and-error method by utilizing finite element analysis as a simulation method to test the mechanical behavior of implants by measuring stress, safety factor, and deformation under compression, yet it is still a lengthy process when it comes to complicated configurations of lattices [17,18,19,20,21]. Studies also aimed at setting a designing scope for the lattice structure parameters for the surgeons and designers to be able to choose from, as a trial to avoid the lengthy process of trying sets of design parameters [22].
All these reasons suggested the need for assistance from machine learning models to help predict the mechanical behavior for such complicated lattices. Poom et al. [23] used a novel artificial intelligence machine learning model to help predict the mechanical properties of many lattice structures. This research investigated eleven lattice structure types and showed how efficient it is to use machine learning alongside the finite element method to reduce material usage, processing time and production costs. In our previous research [24], the linear regression algorithm was used to help predict the latticed implant’s porosity, in order for designers to easily decide the lattice parameters to achieve a certain porosity percentage. This research studied the main two parameters of lattice structures: strut length and thickness.
Dario et al. [19] developed an algorithm that can optimize the hip replacement operation exploiting the machine learning algorithms along with the help of finite element analysis. They were able to enhance the implants’ performance and improve their strength. Francis et al. [25] used AI-optimized lattice structures to optimize the implant functionality. They created lattice structures that approximate the mechanical properties of the human bone and improved their biocompatibility.
In this study, the latticed hip implant stem design was developed with the application of finite element analysis and machine learning models. A regression learner application was utilized in order to help choose the best regression model that generates the best accuracy for the prediction of the mechanical properties for each type of lattice structure. Finite element analysis was used to generate the mechanical properties of lattice structures under compression. Laboratory compression tests were also performed on 3D printed latticed implants to validate the FE results. A database of latticed implants and their mechanical properties was generated with the chosen models for each mechanical property which allows surgeons to easily choose lattices parameters that generate the desired behavior for an implant.
2. Materials
Due to its good features, titanium alloy Ti6Al4V is always the favorite candidate for lattice structure manufacturing because it is a lightweight material due to its good specific mechanical properties and the high corrosion resistance [26]. It can reduce the implant’s stiffness and align with the properties of natural bone. Enhancing the osseointegration also gives it priority over the rest of the additive materials [27,28]. In this study, Ti64 (Ti6Al4V) of grade 23 (EOS GmbH, Krailling, Germany) was used which is a grade of the titanium alloy Ti6Al4V with a maximum particle size of 63 µm [29]. The Ti64 powder used to 3D print the implant is imported from EOS GmbH, Germany. The EOS titanium Ti64 is intended for processing on EOS DMLS machines and is subject to the titanium alloy classification according to ASTM B348 [30].
For objective results and a better match between finite element analysis and lab experiments, the exact Young’s modulus was measured in our previous research [31] using numerical simulative compression tests and validated using lab compression tests. Since the lattice structures shapes are defined via the length and thickness of their struts, the mechanical properties were calculated for the 0.6 mm length and 0.4 mm strut thickness in our research [32]. The type of lattice structure chosen for the latticing is 3D lattice infill used in the ANSYS Software 2020 R2. This type of lattice was chosen due to the fact that it succeeded in reducing the effective Young’s modulus of the used titanium alloy to a range close to the hosting bone in the area where the implant is to be inserted (proximal femur and femur area), as proved in [31]. Another main reason for the selection of this lattice type is that it is more flexible to edit and simulate in the finite element software, where it allows for many orientations of the cells and makes it easier and faster to test numerically.
However, in this research, the effective Young’s modulus for the resin material was calculated via compression test. The test was performed using Instron 8874 testing machine (Instron, Norwood, MA, USA). Three cylindrical specimens were made with the same resin mixture to be used in the implant test. The compression test was executed within the elastic region of the samples, and the average Young’s modulus was calculated and used. Compression test setup is shown in Figure 1. Static loading speed of 2 mm/min was used during compression. The test was performed at room temperature.
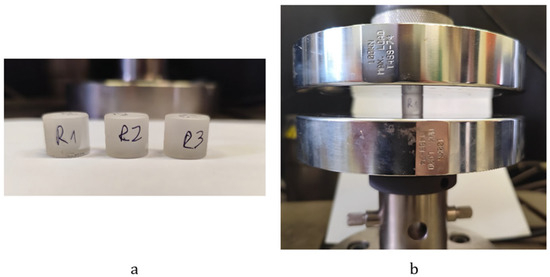
Figure 1.
(a) Resin samples, (b) compression test setup.
The samples were designed with a 15 mm diameter and a 13 mm height.
The total materials for all the hip implant parts can be shown in Table 1, the parts can be seen in Figure 2.

Table 1.
Material’s properties [31,32,33].
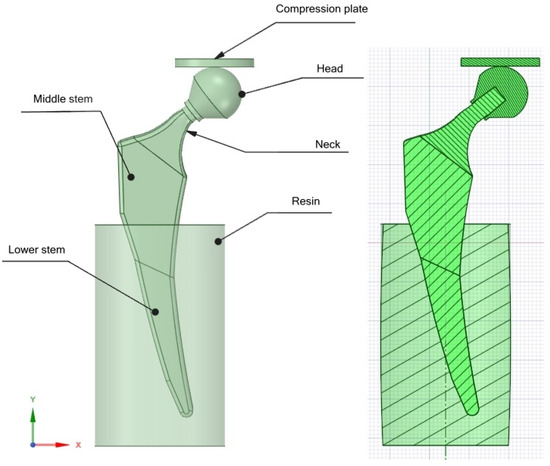
Figure 2.
Hip implant [32].
The compression test will be performed on this design of the hip implant both numerically and in the laboratory. The results will be compared to show the deviation between the two cases.
3. Verification of the Finite Element Model for the Compression Test of the Lattice-Structured Hip Implant
This research uses the same CAD design of our previous research [32] as shown in Figure 2.
The CAD latticed design used was the same as in our previous research [32] where a lattice structure with 0.6 mm length and 0.4 mm thickness was applied to the middle shell part of the stem with three variations in the lattice shell S thickness of 1, 2, and 3 mm. Figure 3 shows the three variations in latticed implants stems.
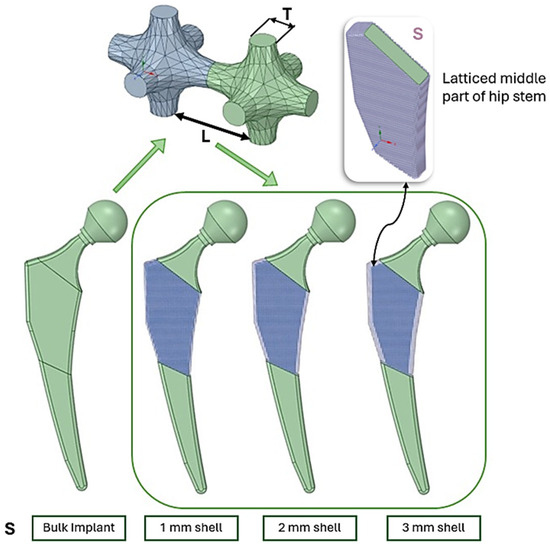
Figure 3.
Three-dimensional lattice infill applied to the hip implant.
3.1. Finite Element Model of the Compression Test by Surrogating Shell Layer
The finite element analysis is to be performed on the hip implant based on the ISO 7206-04:2010 standard [34] for hip implant compression testing. Figure 4 shows the positioning of the implant inside the resin base according to the mentioned standard. A force value of 2300 N was applied to the compression plate, and only the vertical deformation of this plate was measured since its vertical movement is also the measurable variable in the lab compression machine. For that purpose, a remote displacement allowing movement only in the vertical direction was applied. The connection between the compression plate and the implant head was set to a frictionless, adjust-to-touch type so that it can slide on the head compressing it along the vertical axis. A bonded connection was set between the implant stem and the resin base. Bonded connection was also used between the implant stem and the head. Three mesh elements were tried 2, 1.5, 1, and 0.5 mm in order to reach an acceptable convergence percentage based on the total vertical deformation results.
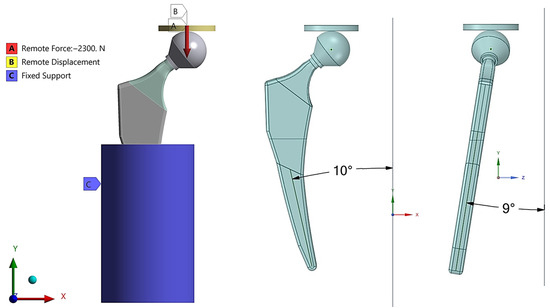
Figure 4.
Finite element analysis setup.
A mesh convergence study was performed to ensure accurate results on the deformation for the 1 mm shell implant stem. The results converged on a mesh element size of 0.5 mm. The number of nodes were 241,912 and the elements 893,845. Figure 5 shows the mesh convergence study relative to the vertical deformation.
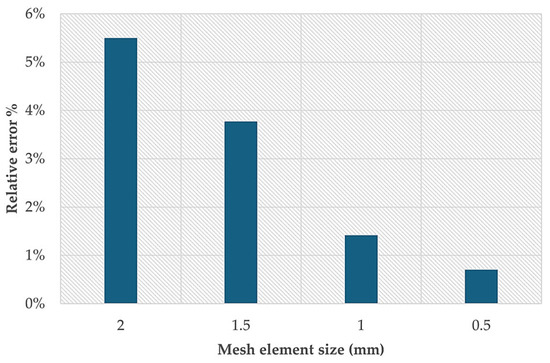
Figure 5.
Mesh convergence study.
The FE analysis was applied on the 1 mm lattice shelled implant. The same setting of surrogate model in [32] was applied, the difference here being that the resin material’s properties are different. The cross section of all the implant variations is shown in Figure 6. The surrogate model is a model with solid thickness but simulated with the latticed model properties, so the software considers the simulation as if the model is geometrically latticed but with a full shape in order to facilitate the simulation process.
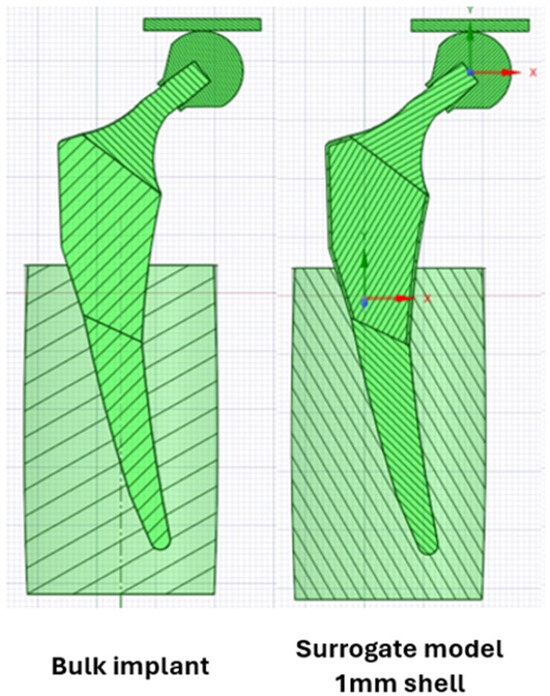
Figure 6.
Cross section exhibition of surrogate modeled implant [32].
Numerical simulations via FE and lab compression tests were performed on the 1 mm-shell thickness latticed hip implant. Figure 7 shows the FE results for the total deformation in the total implant stem and the vertical deformation of the compression plate. A value of 0.424 mm for the total deformation was noticed.
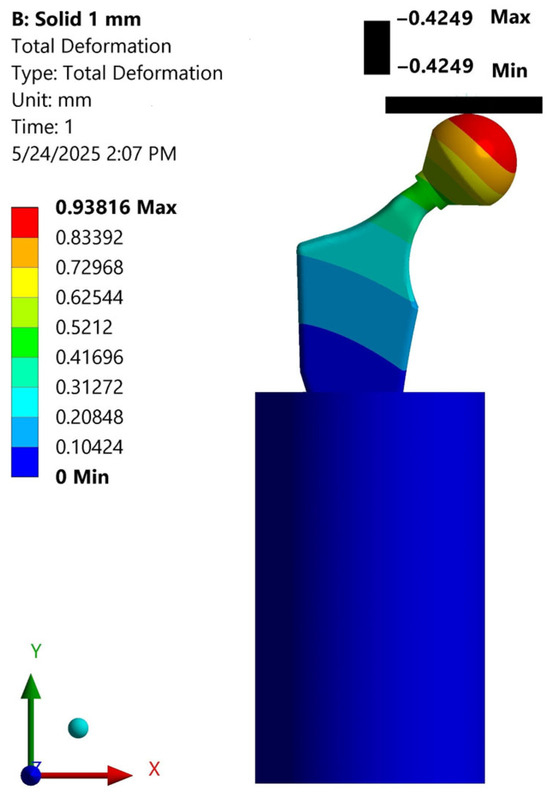
Figure 7.
Vertical and total deformation for 1 mm-shell thickness hip implant.
3.2. Laboratory Compression Test of Shell Hip Implant Using Lattice Structures and Comparison with the Numerical Results
In order to validate the initial finite element surrogate model, a hip implant with a shell thickness of 1 mm was manufactured by additive manufacturing and then tested under compressive loading. The manufacturing process was executed via EOS M 290 3D printer (Electro Optical Systems, Munich, Germany), which uses a selective laser melting (SLM) technique. Three identical specimens of the 1 mm shell-thickness implant were produced, and the average mechanical response was used for a comparison with the simulation results. The maximum long-term operating temperature of 350 °C, as stated in the Ti6Al4V (Ti64) material data sheet [29], was considered to preserve processing compatibility.
The experimental setup followed the ISO 7206-4:2010 standard which regulates the protocol for determining the mechanical behavior of hip femoral components under compression. The implants were compressed with a compressive force of 2300 N at a loading rate of 2 mm/min, replicating the boundary conditions used in the FE simulations of the surrogate model. During the test, the implant was embedded in a custom-designed resin base to hold its position and align it. A special fixture with a ball joint clamp was also used to stabilize the implant while the resin was fully cured. Figure 8 shows the 3D printed implant with its placement and fixation in the resin base.
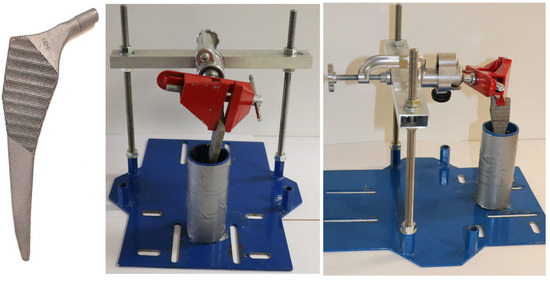
Figure 8.
Implant positioning system.
The total compression test setup is shown in Figure 9.
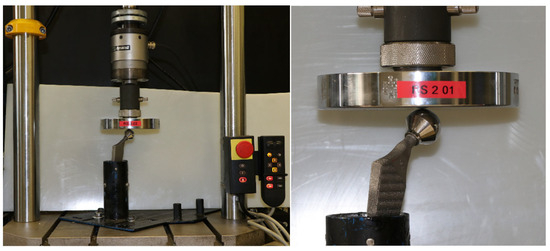
Figure 9.
Hip implant compression test setup.
The results for the lab compression tests are shown in Table 2 where the average of the three implants was calculated and compared to the FEM results. A deviation of 4% was scored which is considered acceptable.

Table 2.
Vertical deformation Lab vs. FEM results.
4. Finite Element Modeling of the Stumbling Case
In Bergmann’s study [35], and to simulate real life loading conditions, the hip joint contact force was derived from in vivo measurements carried out via telemeterized hip endoprosthesis. The implants were implanted in four patients diagnosed with coxarthrosis. Each patient was equipped with strain gauge to record the three-dimensional force components during everyday activities. The force components were measured during standard motions like walking, stair ascent/descent, standing, sitting, and stumbling. A femur-based coordinate system was used to define the directions of the force components.
In our study, the stumbling caseloads from Bergmann’s study were considered since this case generated the highest value of loads that acted on the hip implant during everyday life activities. However, after confirming an acceptable deviation between laboratory and numerical tests, finite element analysis will be performed for stumbling caseloads on the hip implant for several cases and a dataset for validation and testing will be collected. For the stumbling case, Bergmann’s standard [35] was followed for real life load simulations. The details for loads on the hip implant according to Bergmann are shown in Figure 10. The total force value shown in the figure is for a patient weighing 60 kg.
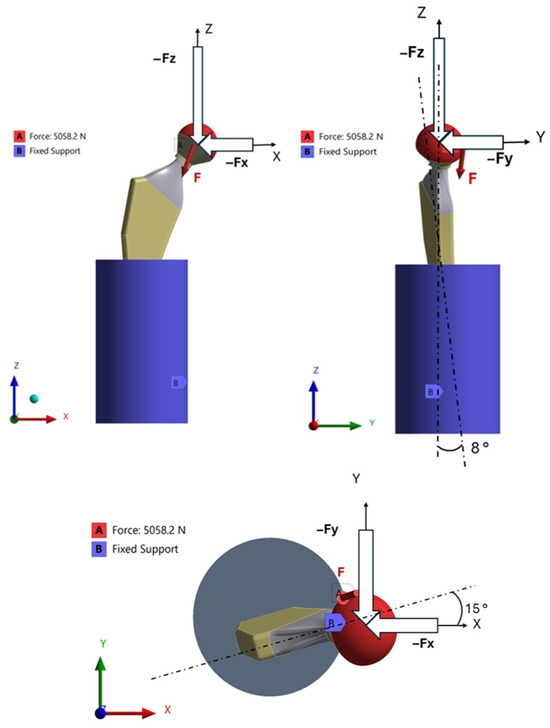
Figure 10.
Forces acting on the hip implant.
Forces calculations are shown in Table 3. These values are applied in the finite element analysis using mechanical Workbench, ANSYS software R2 version 2020.

Table 3.
Forces based on patients’ weight.
5. Patient-Specific Dataset Generation Using Machine Learning
5.1. Preparation of the Training and Testing Dataset
A 3D lattice infill type was applied to the 1,2 and 3 mm shell thicknesses of the middle part of the implant stem. Six cases of Young’s modulus resulting from six pairs of lattice strut lengths and thicknesses were investigated via finite element analysis using the load conditions shown in Figure 10. These six cases of lengths and thicknesses are applied to many shell thicknesses and patient’s weights which resulted in 81 cases using the following ranges for each variable:
where these are the design parameters that control the whole setup as follows: strut length L, strut thickness T, shell thickness S, and patient’s weight. On the other hand, the output parameters to be calculated are the vertical deformation umax and von Mises stress σmax and the strain energy U.
L (mm) ∈ (0.4,0.6,0.8), T (mm) ∈ (0.2,0.4,0.6), S (mm) ∈ (1,2,3), W (kg) ∈ (60,90,120),
5.2. Training the Machine Learning Models to Surrogate the Different Lattices-Structured Implant Performance
The input and output parameters were organized and imported into MATLAB R2024b (MathWorks, Massachusetts, MA, USA) and then regression learner application analysis was performed on the dataset. Training and testing points are shown in Table A1. A separate regression learner model was executed for each of the outputs, and that is due to the complexity and nonlinearity among the results. A total 80% of the data was used as a training (validation) set, and 20% was used as a testing set. A cross validation scheme of 10 folds was also applied to avoid overfitting. Root Mean Squared Error (RMSE), and R-squared values were also calculated to evaluate the model’s accuracy. Table A1 shows the output results for all the learning and testing points. The values are to be organized and fed into the MATLAB.
The regression learner application analyzed the data using all regression models and gave the RMSE and R-squared values for each model. Neural networks algorithms have shown the most accurate results as shown in Table 4, Table 5, and Table 6, respectively. However, different models of neural networks were practical for each set of data. In order to visualize the prediction accuracy for each model.

Table 4.
Deformation prediction model.

Table 5.
Von Mises stress prediction model.

Table 6.
Strain energy prediction model.
As can be seen from Table 4, the wide neural network has shown the lowest prediction error in both training and testing which indicates high accuracy and excellent generalization. It also achieved the highest R-squared value which means it can explain the largest proportion of variance in the deformation data.
As can be seen from Table 5, the GPR model yields the lowest error rates and a great R-squared value, especially in testing, making it the best reliable for new unseen data.
Table 6 shows that trilayered neural network had a much lower training RMSE value and a high overall R-squared in both training and testing, outperforming all other models. This indicated better learning and consistency across the dataset with very high explanatory power.
Figure 11 shows the true vs. predicted response for the models’ training and testing sets.
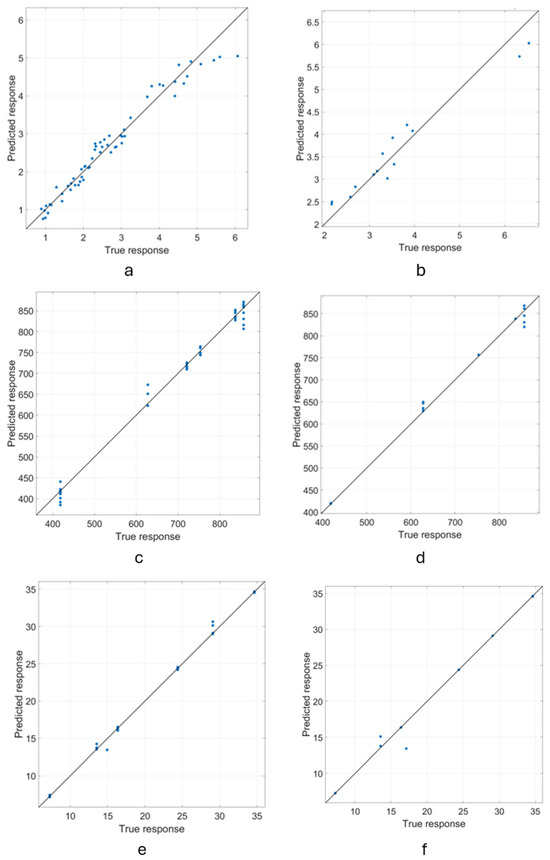
Figure 11.
True vs. predicted response graph of the regression models: (a) Deformation training, (b) Deformation testing, (c) von Mises stress training, (d) von Mises stress testing, (e) Strain energy training, (f) Strain energy testing.
Once the best regression model is chosen, it will be exported into MATLAB workspace to generalize it and use it to calculate bigger ranges of variables that cover most of the latticing cases. The variables’ ranges will be as follows:
L (mm) ∈ (0.4,0.45,0.5,…,0.8) T (mm) ∈ (0.2,0.25,0.3,…,0.6), S (mm) ∈ (1,1.5,2,2.5,3), W (kg) ∈ (60,70,80,…,120)
5.3. Finite Element-Based Validation of the Developed Procedure
The models are giving acceptable results; however, with extreme cases, models struggle to keep high accuracy. In order to verify the results, finite element analysis was performed for a patient weighing 80 kg where the forces and moments were calculated accordingly. A 2 mm shell thickness was chosen with a lattice strut length of 0.4 mm and a strut thickness of 0.2 mm. The three output values deformation, stress, and energy were calculated using FE. Figure 12 shows the FE results for the chosen case.
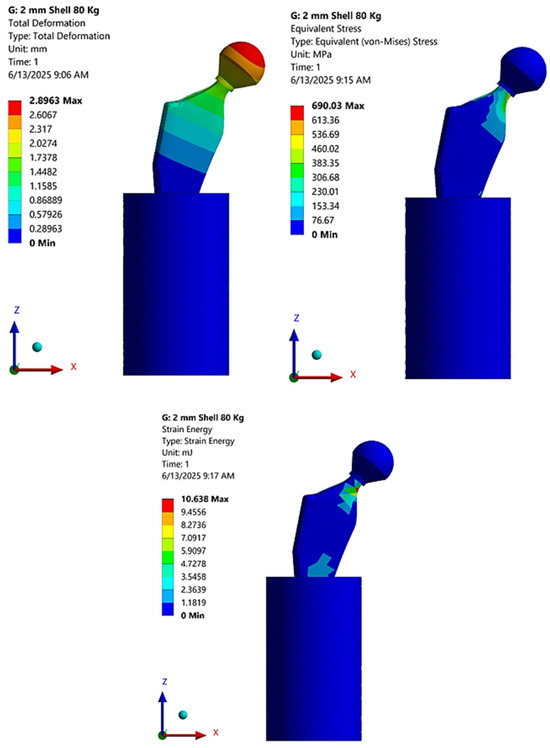
Figure 12.
FE results for 2 mm shell, 80 kg, lattice length 0.4 mm, and lattice thickness 0.2 mm.
The results were then compared to the values calculated by the trained models. Table 7 shows the deviation between the two results. As can be seen, the model generalized well with accuracy over 90% where the results deviated up to 9% compared to the FE analysis.

Table 7.
FE calculated cases vs. trained model results.
The trained models were then exported into MATLAB and used to generate a database for all possible cases of lattice variables to be applied to implant stems. This database can be considered a reference for the surgeons to choose a suitable case for each patient. The mechanical behavior of the latticed implant can now be predicted against real life conditions without the need to perform simulations or laboratory testing. Table A2 shows the database for the latticed hip implant.
6. Discussion
The experimental and numerical results, as well as the various regression models’ performance, suggest that using FE and data-driven approaches for pre-clinical evaluation and orthopedic implants optimization is feasible. The small deviation 4% between FE results indicates that FE simulations are reliable enough to reflect the mechanical behavior of the latticed implants. This means an efficient and cost-effective alternative to physical testing is achieved, especially in the early design stages.
The results showed that the more the load and the latticed shell thickness increase in value, the higher the predictable deformation and stress will be. As an example, at 120 kg with lattice length of 0.8 mm and a shell thickness of 0.2 mm, the deformation value reached its highest value and went beyond the compressive strength of the titanium alloy. This warns the surgeon to control the variables and choose a suitable set for the patient.
A key observation from the regression models is that neural networks showed clear superiority in the prediction of the mechanical behavior outcomes, especially in the case of complex and nonlinear behaviors such as deformation and strain energy. In the deformation case, the wide neural network outperformed all the models with an RMSE of 0.26 for training and 0.31 for testing, along with an R-squared value of 0.96 in both cases. This high level of accuracy confirms that the model is able to spot the nonlinear dependence between input parameters and the output deformation response which is an important feature for implant design and optimization.
On the other hand, the von Mises stress prediction showed a different pattern. GPR models—especially the squared exponential kernel—gave the most reliable results with a low RMSE of 14.55 for training and 15.36 for testing and high R-squared values 0.99 and 0.98 for training and testing, respectively. Despite the fact that trilayered neural networks also had a good performance, they were a little less stable during testing, which suggests that GPR is more robust for stress prediction, which might be because of its inherent ability to model uncertainty in high-variance data.
With the strain energy prediction, the trilayered neural network proved, again, the most effective for training with an RMSE of 0.34 and an R-squared of 0.99, although the fine decision tree model interestingly performed better on the testing set (RMSE: 0.88, R-squared: 0.98). This suggests that while deep learning models may perform well with learning complex internal structures within data, traditional methods like decision trees can still give competitive performance for certain validation scenarios, particularly in cases that have less variability in the output range.
7. Conclusions
A comprehensive database was developed for additively manufactured Ti6Al4V femoral stems featuring lattice structures, tailored through various cell parameters and geometric designs. This database was created with the intent of providing a partially patient-specific solution, taking into account individual factors such as the patient’s body weight. By simulating the implant’s environment using finite element (FE) analysis, the mechanical response of the implants—such as deformation, stress distribution, and strain energy—was systematically studied. The resulting tool empowers surgeons during pre-operative planning by enabling the selection of implant configurations that are more suited to the mechanical needs of individual patients, enhancing clinical outcomes.
This research demonstrates a successful integration of finite element simulations, experimental mechanical validation, and machine learning techniques in predicting and analyzing the behavior of lattice-structured femoral stems. Initial validation through compressive testing in the lab yielded results that closely matched FE simulations, establishing confidence in the virtual modeling approach. Using these simulations, an extensive dataset was generated across a wide spectrum of design configurations, capturing diverse mechanical responses. These data points were then utilized to train and test several regression models, with artificial neural networks consistently providing accurate predictions for all considered outputs.
This study also assessed the influence of each design parameter, revealing that patient weight and shell thickness are among the most impactful variables affecting mechanical performance. Thanks to the high predictive accuracy of the trained models, the system can now reliably simulate implant behavior, assisting clinicians and biomedical engineers in making informed design decisions. To further enhance usability, the trained models were used to populate a comprehensive database containing the predicted mechanical responses for all possible combinations of lattice design parameters. This enables fast, accurate estimations of implant performance without the need for repeated simulations.
Importantly, this work illustrates how the fusion of machine learning with biomechanical simulation opens up new possibilities for personalized, data-driven orthopedic care. Nonetheless, the current study is limited to a single standard femoral stem size. It is worth mentioning that the research results helped create a model to predict the mechanical behavior of the implant stem, but since the static testing standards were chosen, the results do not count for long-term behavior of the implant, it rather counts for a methodology of choosing a suitable stem for further fatigue testing.
In future research, the focus should be directed at including multiple implant stem sizes and geometries to further enhance the generalizability and clinical relevance of the framework. This is important to accommodate the anatomical variability among patients and to ensure the predictions are accurate across a wider population. Moreover, the future investigation should include comprehensive fatigue testing and analysis to carefully evaluate the long-term mechanical behavior and the reliability of the implant stems under cyclic loading conditions. Addressing these points will be essential for advancing the durability and safety of patient-specific implant designs that can better suit real-life clinical applications.
Author Contributions
Conceptualization, R.A. and T.M.; methodology, T.M.; software, R.A.; validation, D.H., S.M. and T.M.; formal analysis, T.M.; investigation, S.M.; resources, T.M.; data curation, R.A.; writing—original draft preparation, R.A.; writing—review and editing, T.M.; visualization, R.A.; supervision, T.M. and D.H. All authors have read and agreed to the published version of the manuscript.
Funding
The research project was supported by the Hungarian Scientific Research Fund (ID: OTKA PD 135124).
Data Availability Statement
Data is unavailable due to privacy regarding future publication.
Acknowledgments
The publication was implemented with the support of the National Research, Development and Innovation Fund (NKFIH) within the framework of the Bilateral Scientific and Technological (TÉT) Cooperation Application No. 2023-1.2.4-TÉT-2023-00114. This research was supported by the OMAA 117öu9—Experimentelle und numerische Untersuchung maßgeschneiderter, zellulärer Implantate, hergestellt mit AM-Technologie Project.
Conflicts of Interest
The authors declare no conflicts of interest.
Appendix A

Table A1.
Output calculation results using FE for stumbling case.
Table A1.
Output calculation results using FE for stumbling case.
| Input | Output | Output | Output | |||
|---|---|---|---|---|---|---|
| L (mm) 0.4–0.8 | T (mm) 0.2–0.6 | S (mm) | W (kg) | umax (mm) | σmax (MPa) | U (Nmm) |
| 0.4 | 0.2 | 1 | 60 | 1.067 | 418.488 | 7.269 |
| 0.6 | 0.2 | 1 | 60 | 1.151 | 418.490 | 7.269 |
| 0.8 | 0.2 | 1 | 60 | 1.245 | 418.492 | 7.269 |
| 0.4 | 0.4 | 1 | 60 | 0.936 | 418.484 | 7.269 |
| 0.6 | 0.4 | 1 | 60 | 1.000 | 418.486 | 7.269 |
| 0.8 | 0.4 | 1 | 60 | 1.116 | 418.489 | 7.269 |
| 0.4 | 0.6 | 1 | 60 | 0.891 | 418.483 | 7.269 |
| 0.6 | 0.6 | 1 | 60 | 0.979 | 418.485 | 7.269 |
| 0.8 | 0.6 | 1 | 60 | 1.017 | 418.486 | 7.269 |
| 0.4 | 0.2 | 1 | 90 | 2.835 | 753.338 | 24.388 |
| 0.6 | 0.2 | 1 | 90 | 3.086 | 753.335 | 24.390 |
| 0.8 | 0.2 | 1 | 90 | 3.364 | 753.333 | 24.392 |
| 0.4 | 0.4 | 1 | 90 | 2.445 | 753.343 | 24.384 |
| 0.6 | 0.4 | 1 | 90 | 2.637 | 753.340 | 24.386 |
| 0.8 | 0.4 | 1 | 90 | 2.981 | 753.336 | 24.389 |
| 0.4 | 0.6 | 1 | 90 | 2.309 | 753.345 | 24.382 |
| 0.6 | 0.6 | 1 | 90 | 2.573 | 753.341 | 24.385 |
| 0.8 | 0.6 | 1 | 90 | 2.686 | 753.340 | 24.386 |
| 0.4 | 0.2 | 1 | 120 | 2.134 | 836.975 | 29.077 |
| 0.6 | 0.2 | 1 | 120 | 2.302 | 836.980 | 29.078 |
| 0.8 | 0.2 | 1 | 120 | 2.490 | 836.984 | 29.078 |
| 0.4 | 0.4 | 1 | 120 | 1.872 | 836.968 | 29.075 |
| 0.6 | 0.4 | 1 | 120 | 2.001 | 836.971 | 29.076 |
| 0.8 | 0.4 | 1 | 120 | 2.232 | 836.978 | 29.077 |
| 0.4 | 0.6 | 1 | 120 | 1.781 | 836.965 | 29.074 |
| 0.6 | 0.6 | 1 | 120 | 1.958 | 836.970 | 29.076 |
| 0.8 | 0.6 | 1 | 120 | 2.034 | 836.972 | 29.076 |
| 0.4 | 0.2 | 3 | 60 | 2.554 | 418.500 | 7.273 |
| 0.6 | 0.2 | 3 | 60 | 3.396 | 418.504 | 7.274 |
| 0.8 | 0.2 | 3 | 60 | 4.712 | 529.230 | 11.209 |
| 0.4 | 0.4 | 3 | 60 | 1.663 | 418.494 | 7.271 |
| 0.6 | 0.4 | 3 | 60 | 2.049 | 418.497 | 7.272 |
| 0.8 | 0.4 | 3 | 60 | 3.011 | 418.503 | 7.274 |
| 0.4 | 0.6 | 3 | 60 | 1.439 | 418.493 | 7.270 |
| 0.6 | 0.6 | 3 | 60 | 1.911 | 418.496 | 7.272 |
| 0.8 | 0.6 | 3 | 60 | 2.162 | 418.498 | 7.273 |
| 0.4 | 0.2 | 3 | 90 | 3.831 | 627.751 | 16.365 |
| 0.6 | 0.2 | 3 | 90 | 5.095 | 627.756 | 16.367 |
| 0.8 | 0.2 | 3 | 90 | 7.068 | 793.845 | 25.220 |
| 0.4 | 0.4 | 3 | 90 | 2.494 | 627.742 | 16.360 |
| 0.6 | 0.4 | 3 | 90 | 3.073 | 627.746 | 16.363 |
| 0.8 | 0.4 | 3 | 90 | 4.517 | 627.754 | 16.366 |
| 0.4 | 0.6 | 3 | 90 | 2.158 | 627.739 | 16.358 |
| 0.6 | 0.6 | 3 | 90 | 2.866 | 627.744 | 16.362 |
| 0.8 | 0.6 | 3 | 90 | 3.243 | 627.747 | 16.363 |
| 0.4 | 0.2 | 3 | 120 | 4.736 | 856.799 | 34.638 |
| 0.6 | 0.2 | 3 | 120 | 6.328 | 856.811 | 34.640 |
| 0.8 | 0.2 | 3 | 120 | 8.881 | 972.743 | 41.797 |
| 0.4 | 0.4 | 3 | 120 | 3.091 | 856.785 | 34.633 |
| 0.6 | 0.4 | 3 | 120 | 3.799 | 856.792 | 34.636 |
| 0.8 | 0.4 | 3 | 120 | 5.595 | 856.806 | 34.639 |
| 0.4 | 0.6 | 3 | 120 | 2.683 | 856.782 | 34.630 |
| 0.6 | 0.6 | 3 | 120 | 3.546 | 856.790 | 34.635 |
| 0.8 | 0.6 | 3 | 120 | 4.008 | 856.794 | 34.636 |
| 0.4 | 0.2 | 2 | 60 | 1.949 | 418.506 | 7.274 |
| 0.6 | 0.2 | 2 | 60 | 2.328 | 418.510 | 7.275 |
| 0.8 | 0.2 | 2 | 60 | 2.791 | 418.514 | 9.222 |
| 0.4 | 0.4 | 2 | 60 | 1.440 | 418.498 | 7.273 |
| 0.6 | 0.4 | 2 | 60 | 1.677 | 418.502 | 7.274 |
| 0.8 | 0.4 | 2 | 60 | 2.164 | 418.508 | 7.275 |
| 0.4 | 0.6 | 2 | 60 | 1.290 | 418.496 | 7.272 |
| 0.6 | 0.6 | 2 | 60 | 1.596 | 418.501 | 7.273 |
| 0.8 | 0.6 | 2 | 60 | 1.742 | 418.503 | 7.274 |
| 0.4 | 0.2 | 2 | 90 | 3.215 | 721.024 | 13.546 |
| 0.6 | 0.2 | 2 | 90 | 3.949 | 721.057 | 17.106 |
| 0.8 | 0.2 | 2 | 90 | 5.021 | 829.867 | 23.008 |
| 0.4 | 0.4 | 2 | 90 | 2.363 | 720.993 | 13.543 |
| 0.6 | 0.4 | 2 | 90 | 2.745 | 721.005 | 13.544 |
| 0.8 | 0.4 | 2 | 90 | 3.620 | 721.042 | 14.943 |
| 0.4 | 0.6 | 2 | 90 | 2.131 | 720.988 | 13.541 |
| 0.6 | 0.6 | 2 | 90 | 2.611 | 721.000 | 13.544 |
| 0.8 | 0.6 | 2 | 90 | 2.853 | 721.009 | 13.545 |
| 0.4 | 0.2 | 2 | 120 | 3.685 | 856.822 | 34.639 |
| 0.6 | 0.2 | 2 | 120 | 4.417 | 856.834 | 34.641 |
| 0.8 | 0.2 | 2 | 120 | 5.330 | 856.846 | 34.954 |
| 0.4 | 0.4 | 2 | 120 | 2.725 | 856.802 | 34.634 |
| 0.6 | 0.4 | 2 | 120 | 3.169 | 856.812 | 34.637 |
| 0.8 | 0.4 | 2 | 120 | 4.099 | 856.829 | 34.640 |
| 0.4 | 0.6 | 2 | 120 | 2.444 | 856.795 | 34.632 |
| 0.6 | 0.6 | 2 | 120 | 3.016 | 856.809 | 34.636 |
| 0.8 | 0.6 | 2 | 120 | 3.291 | 856.814 | 34.637 |

Table A2.
Latticed hip implant database.
Table A2.
Latticed hip implant database.
| Input | Output | Output | Output | |||
|---|---|---|---|---|---|---|
| L (mm) 0.4–0.8 | T (mm) 0.2–0.6 | S (mm) 1–3 | W (kg) 60–120 | umax (mm) | σmax (MPa) | U (Nmm) |
| 0.4 | 0.2 | 1 | 60 | 1.067 | 418.828 | 7.269 |
| 0.4 | 0.2 | 1 | 70 | 1.919 | 549.275 | 10.951 |
| 0.4 | 0.2 | 1 | 80 | 2.576 | 663.058 | 18.215 |
| 0.4 | 0.2 | 1 | 90 | 2.836 | 752.574 | 24.388 |
| 0.4 | 0.2 | 1 | 100 | 2.775 | 812.570 | 25.862 |
| 0.4 | 0.2 | 1 | 110 | 2.482 | 840.652 | 27.090 |
| 0.4 | 0.2 | 1 | 120 | 2.134 | 837.419 | 29.113 |
| 0.4 | 0.2 | 1.5 | 60 | 1.505 | 418.465 | 7.250 |
| 0.4 | 0.2 | 1.5 | 70 | 2.878 | 542.881 | 9.014 |
| 0.4 | 0.2 | 1.5 | 80 | 3.945 | 653.648 | 15.591 |
| 0.4 | 0.25 | 1 | 60 | 2.383 | 418.311 | 7.482 |
| 0.4 | 0.25 | 1 | 70 | 3.635 | 512.266 | 8.282 |
| 0.4 | 0.25 | 1 | 80 | 4.519 | 604.180 | 10.658 |
| 0.4 | 0.25 | 1 | 90 | 4.914 | 688.855 | 11.898 |
| . | . | . | . | . | . | . |
| . | . | . | . | . | . | . |
| . | . | . | . | . | . | . |
| 0.8 | 0.55 | 3 | 90 | 3.511 | 628.111 | 16.366 |
| 0.8 | 0.55 | 3 | 100 | 3.774 | 699.915 | 22.400 |
| 0.8 | 0.55 | 3 | 110 | 4.143 | 766.507 | 28.480 |
| 0.8 | 0.55 | 3 | 120 | 4.344 | 824.528 | 34.617 |
| 0.8 | 0.6 | 2.5 | 100 | 4.457 | 749.252 | 17.827 |
| 0.8 | 0.6 | 2.5 | 110 | 4.460 | 803.909 | 26.825 |
| 0.8 | 0.6 | 2.5 | 120 | 4.054 | 841.521 | 35.755 |
| 0.8 | 0.6 | 3 | 60 | 2.160 | 418.594 | 7.272 |
| 0.8 | 0.6 | 3 | 70 | 2.777 | 484.190 | 7.646 |
| 0.8 | 0.6 | 3 | 80 | 3.008 | 555.031 | 10.614 |
| 0.8 | 0.6 | 3 | 90 | 3.243 | 627.665 | 16.363 |
| 0.8 | 0.6 | 3 | 100 | 3.553 | 698.392 | 22.396 |
| 0.8 | 0.6 | 3 | 110 | 3.930 | 763.578 | 28.476 |
| 0.8 | 0.6 | 3 | 120 | 4.008 | 819.963 | 34.636 |
References
- Abate, K.M.; Nazir, A.; Jeng, J.-Y. Design, optimization, and selective laser melting of vin tiles cellular structure-based hip implant. Int. J. Adv. Manuf. Technol. 2021, 112, 2037–2050. [Google Scholar] [CrossRef]
- Thomas, J.; Alsaleh, N.A.; Ahmadein, M.; Elfar, A.A.; Farouk, H.A.; Essa, K. Graded cellular structures for enhanced performance of additively manufactured orthopaedic implants. Int. J. Adv. Manuf. Technol. 2024, 130, 1887–1900. [Google Scholar] [CrossRef]
- Nazir, A.; Abate, K.M.; Kumar, A.; Jeng, J.-Y. A state-of-the-art review on types, design, optimization, and additive manufacturing of cellular structures. Int. J. Adv. Manuf. Technol. 2019, 104, 3489–3510. [Google Scholar] [CrossRef]
- Gibson, L.J. Biomechanics of cellular solids. J. Biomech. 2005, 38, 377–399. [Google Scholar] [CrossRef] [PubMed]
- Beaupré, G.S.; Orr, T.E.; Carter, D.R. An approach for time-dependent bone modeling and remodeling—Theoretical development. J. Orthop. Res. 1990, 8, 651–661. [Google Scholar] [CrossRef]
- Coelho, P.G.; Fernandes, P.R.; Rodrigues, H.C.; Cardoso, J.B.; Guedes, J.M. Numerical modeling of bone tissue adaptation—A hierarchical approach for bone apparent density and trabecular structure. J. Biomech. 2009, 42, 830–837. [Google Scholar] [CrossRef]
- Seharing, A.; Azman, A.H.; Abdullah, S. A review on integration of lightweight gradient lattice structures in additive manufacturing parts. Adv. Mech. Eng. 2020, 12, 1687814020916951. [Google Scholar] [CrossRef]
- Wu, N.; Li, S.; Liu, Y.; Zhang, A.; Chen, B.; Han, Q.; Wang, J. Novel exploration of 3D printed personalized total elbow arthroplasty to solve the severe bone defect after internal fixation failure of comminuted distal humerus fracture: A case report. Medicine 2020, 99, e21481. [Google Scholar] [CrossRef]
- Tan, J.H.; Wong, W.L.E.; Dalgarno, K.W. An overview of powder granulometry on feedstock and part performance in the selective laser melting process. Addit. Manuf. 2017, 18, 228–255. [Google Scholar] [CrossRef]
- Khaing, M.W.; Fuh, J.Y.H.; Lu, L. Direct metal laser sintering for rapid tooling: Processing and characterisation of EOS parts. J. Mater. Process. Technol. 2001, 113, 269–272. [Google Scholar] [CrossRef]
- Spierings, A.B.; Schneider, M.; Eggenberger, R. Comparison of density measurement techniques for additive manufactured metallic parts. Rapid Prototyp. J. 2011, 17, 380–386. [Google Scholar] [CrossRef]
- Murr, L.; Quinones, S.; Gaytan, S.; Lopez, M.; Rodela, A.; Martinez, E.; Hernandez, D.; Medina, F.; Wicker, R. Microstructure and mechanical behavior of Ti-6Al-4V produced by rapid-layer manufacturing, for biomedical applications. J. Mech. Behav. Biomed. Mater. 2009, 2, 20–32. [Google Scholar] [CrossRef] [PubMed]
- Delikanli, Y.E.; Kayacan, M.C. Design, manufacture, and fatigue analysis of lightweight hip implants. J. Appl. Biomater. Funct. Mater. 2019, 17, 2280800019836830. [Google Scholar] [CrossRef]
- Arredondo, A.I.B.; Zúñiga-Aguilar, E.S.; Moya-Bencomo, M.D.; Acosta-Sánchez, L.A. Porous Lattice Structure of Femoral Stem for Total Hip Arthroplasty. Rev. Mex. Ing. Biomed. 2020, 41, 69–79. [Google Scholar] [CrossRef]
- Azman, A.H.; Vignat, F.; Villeneuve, F. CAD tools and file format performance evaluation in designing lattice structures for additive manufacturing. J. Teknol. (Sci. Eng.) 2018, 80, 87–95. [Google Scholar] [CrossRef]
- Rias, A.; Bouchard, C.; Segonds, F.; Vayre, B.; Abed, S. Design for Additive Manufacturing: Supporting Intrinsic-Motivated Creativity. In Emotional Engineering; Fukuda, S., Ed.; Springer International Publishing: Cham, Switzerland, 2017; Volume 5, pp. 99–116. [Google Scholar] [CrossRef]
- Chethan, K.N.; Ogulcan, G.; Zuber, M.; Shenoy, S. Wear estimation of trapezoidal and circular shaped hip implants along with varying taper trunnion radiuses using finite element method. Comput. Methods Programs Biomed. 2020, 196, 105597. [Google Scholar] [CrossRef]
- Milone, D.; Fiorillo, L.; Alberti, F.; Cervino, G.; Filardi, V.; Pistone, A.; Cicciù, M.; Risitano, G. Stress distribution and failure analysis comparison between Zirconia and Titanium dental implants. Procedia Struct. Integr. 2022, 41, 680–691. [Google Scholar] [CrossRef]
- Milone, D.; D’Andrea, D.; Santonocito, D. Smart Design of Hip Replacement Prostheses Using Additive Manufacturing and Machine Learning Techniques. Prosthesis 2024, 6, 24–40. [Google Scholar] [CrossRef]
- Villamor, E.; Monserrat, C.; Del Río, L.; Romero-Martín, J.A.; Rupérez, M.J. Prediction of osteoporotic hip fracture in postmenopausal women through patient-specific FE analyses and machine learning. Comput. Methods Programs Biomed. 2020, 193, 105484. [Google Scholar] [CrossRef]
- Müller, A. Generic mobility of rigid body mechanisms. Mech. Mach. Theory 2009, 44, 1240–1255. [Google Scholar] [CrossRef]
- Cheah, Y.K.; Azman, A.H.; Bajuri, M.Y. Finite-element Analysis of Load-bearing Hip Implant Design for Additive Manufacturing. J. Fail. Anal. Prev. 2022, 22, 356–367. [Google Scholar] [CrossRef]
- Narongdej, P.; Yuhasz, B.; Kong, T.; Rojas, D.; Peng, Q.; Barjasteh, E. Machine learning-aided lattice optimization for ultra-lightweight 3D-printed aligners. Mater. Des. 2025, 254, 114139. [Google Scholar] [CrossRef]
- Rashwan, A.; Mankovits, T. Optimization of Additively Manufactured and Lattice-Structured Hip Implants Using the Linear Regression Algorithm from the Scikit-Learn Library. Crystals 2023, 13, 1513. [Google Scholar] [CrossRef]
- Omigbodun, F.T.; Oladapo, B.I. AI-Optimized Lattice Structures for Biomechanics Scaffold Design. Biomimetics 2025, 10, 88. [Google Scholar] [CrossRef] [PubMed]
- Bartolomeu, F.; Gasik, M.; Silva, F.S.; Miranda, G. Mechanical Properties of Ti6Al4V Fabricated by Laser Powder Bed Fusion: A Review Focused on the Processing and Microstructural Parameters Influence on the Final Properties. Metals 2022, 12, 986. [Google Scholar] [CrossRef]
- Bittredge, O.; Hassanin, H.; El-Sayed, M.A.; Eldessouky, H.M.; Alsaleh, N.A.; Alrasheedi, N.H.; Essa, K.; Ahmadein, M. Fabrication and Optimisation of Ti-6Al-4V Lattice-Structured Total Shoulder Implants Using Laser Additive Manufacturing. Materials 2022, 15, 3095. [Google Scholar] [CrossRef] [PubMed]
- Corona-Castuera, J.; Rodriguez-Delgado, D.; Henao, J.; Castro-Sandoval, J.C.; Poblano-Salas, C.A. Design and Fabrication of a Customized Partial Hip Prosthesis Employing CT-Scan Data and Lattice Porous Structures. ACS Omega 2021, 6, 6902–6913. [Google Scholar] [CrossRef]
- EOS Titanium Ti64 M290, Material Data Sheet. Available online: https://tinyurl.com/yux3w24v (accessed on 27 June 2025).
- Standard Specification for Titanium and Titanium Alloy Bars and Billets. 2019. Available online: https://store.astm.org/standards/b348 (accessed on 23 March 2025).
- Rashwan, A.; File, M.; Mankovits, T. Investigation of the Performance of Ti6Al4V Lattice Structures Designed for Biomedical Implants Using the Finite Element Method. Materials 2022, 15, 6335. [Google Scholar] [CrossRef]
- Rashwan, A.; Mankovits, T. Development of Surrogate Model for Patient-Specific Lattice-Structured Hip Implant Design via Finite Element Analysis. Appl. Sci. 2025, 15, 3522. [Google Scholar] [CrossRef]
- Rashwan, A.; File, M.; Mankovits, T. Use of compression test to determine the Young’s modulus of the titanium alloy Ti6Al4V manufactured via direct metal laser sintering. Int. Rev. Appl. Sci. Eng. 2023, 14, 256–262. [Google Scholar]
- ISO 7206-4:2010; Implants for Surgery. ISO: Geneva, Switzerland, 2010. Available online: https://www.iso.org/standard/42769.html (accessed on 12 February 2025).
- Bergmann, G.; Graichen, F.; Rohlmann, A.; Bender, A.; Heinlein, B.; Duda, G.; Heller, M.; Morlock, M. Realistic loads for testing hip implants. Biomed. Mater. Eng. 2010, 20, 65–75. [Google Scholar] [CrossRef] [PubMed]
Disclaimer/Publisher’s Note: The statements, opinions and data contained in all publications are solely those of the individual author(s) and contributor(s) and not of MDPI and/or the editor(s). MDPI and/or the editor(s) disclaim responsibility for any injury to people or property resulting from any ideas, methods, instructions or products referred to in the content. |
© 2025 by the authors. Licensee MDPI, Basel, Switzerland. This article is an open access article distributed under the terms and conditions of the Creative Commons Attribution (CC BY) license (https://creativecommons.org/licenses/by/4.0/).