Abstract
This study systematically investigates the impact of hydrolytic degradation on the crystallization kinetics and morphology of poly(butylene succinate-co-adipate) (PBSA). Gel Permeation Chromatography (GPC) confirmed extensive chain scission, significantly reducing the polymer’s weight-average molecular weight (Mw from ~103,000 to ~16,000 g/mol) and broadening its polydispersity index (PDI from ~2 to 7 after 64 days). Differential scanning calorimetry (DSC) analysis revealed that hydrolytic degradation dramatically accelerated crystallization rates, reducing crystallization time roughly 10-fold (e.g., from ~3000 s to ~300 s), and crystallinity increased from 34% to 63%. Multiple melting peaks suggested the presence of lamellae with varying thicknesses, consistent with the Gibbs–Thomson equation. Isothermal crystallization kinetics were evaluated using the Avrami equation (with n ≈ 3), reciprocal half-time of crystallization, and a novel inflection point slope method, all confirming accelerated crystallization; for instance, the slope increased from 0.00517 to 0.05203. Polarized optical microscopy (POM) revealed evolving spherulite morphologies, including hexagonal and flower-like dendritic spherulites with diamond-shape ends, while wide-angle X-ray diffraction (WAXD) showed a crystallization range shift to higher temperatures (e.g., from 72–61 °C to 82–71 °C) and a 14% increase in crystallite diameter, aligning with increased melting point and lamellar thickness and overall increased crystallinity.
1. Introduction
Aliphatic polyesters have attracted considerable attention in recent years due to their biodegradability and potential for sustainable material applications [1,2,3]. Although PBSA is classified as a biodegradable polymer [2,4,5], its practical application in sustainable technologies—such as compostable packaging—requires a detailed understanding of its structural and mechanical evolution during environmental degradation. Crystallization kinetics play a crucial role in determining not only the material’s mechanical strength and flexibility, but also its processability and biodegradability at various stages of its lifecycle. Therefore, linking hydrolytic degradation with crystallization behavior is essential for designing PBSA materials with predictable performance in sustainable applications. The biodegradability of PBSA primarily arises from the presence of ester bonds in its polymer backbone, which are susceptible to hydrolysis under environmental conditions [6].
Compared to other biodegradable plastics, such as polylactic acid (PLA) and poly(hydroxybutyrate-co-3-hydroxyvalerate) (PHBV), PBSA exhibits a notably lower melting point, which can be advantageous in specific processing and degradation scenarios [6]. While previous studies have examined PBSA in the context of biodegradable polymer composites (BPCs) [7,8,9] and blends [10,11,12,13], a critical gap remains in understanding its hydrolytic degradation behavior under accelerated environmental conditions and its subsequent impact on crystalline structure. Zeng et al. [14] successfully synthesized poly(butylene succinate-co-diethylene glycol succinate) (P(BS-co-DEGS)) and reported its complete hydrolytic degradation at 40 °C in phosphate-buffered solution. However, this rapid degradation was primarily attributed to the incorporation of diethylene glycol succinate (DEGS) units, which increased the hydrophilicity and reduced the crystallinity of the copolymer, thus enhancing water penetration and ester bond accessibility. In contrast, our study focuses on the hydrolytic degradation of PBSA—a structurally different aliphatic polyester—at elevated temperatures (70 °C), representing conditions closer to industrial composting or accelerated environmental aging. The importance of crystalline morphology in hydrolytic degradation was highlighted by Cho et al. [15], who demonstrated that poly(butylene succinate) (PBS) samples with different internal spherulitic structures exhibited markedly different degradation rates, despite having similar overall crystallinity. Specifically, isothermally crystallized samples degraded more rapidly than melt-quenched ones due to their coarser and more loosely packed lamellar structures. In our present study, a similar trend was observed in the current PBSA study, where isothermal crystallization and elevated degradation temperatures (70 °C) significantly accelerated hydrolysis compared to lower temperatures. This observation supports the idea that, in addition to molecular weight and crystallinity, the internal spherulitic architecture of PBSA plays a key role in determining its susceptibility to hydrolytic attack under these experimental conditions.
Despite numerous reviews [16,17,18,19,20] discussing the general degradation mechanisms of biodegradable plastics and their influencing factors, the specific impact of hydrolytic degradation on the crystallization behavior of PBSA was not investigated in detail. While extensive research has been conducted on PBSA crystallization—including the influence of processing conditions, molecular architecture, and additives—the effect of chain scission and molecular weight reduction due to hydrolysis on crystallization kinetics, morphology, and crystalline structure has not been comprehensively evaluated.
It has been observed that hydrolytic degradation may lead to increased crystallinity in PBSA, likely due to the loss of amorphous regions and enhanced molecular mobility [15]. Multiple melting peaks detected in degraded samples suggest the coexistence of lamellae with varying thicknesses, which aligns with the Gibbs–Thomson theory. Although isothermal crystallization behavior has been widely characterized using models such as the Avrami and Hoffman–Lauritzen theories, studies incorporating the effects of hydrolysis-induced degradation on these crystallization models remain limited.
In this study, we systematically investigate the influence of hydrolytic degradation on the crystallization kinetics and morphology of PBSA. PBSA samples were subjected to controlled hydrolysis at 70 °C, and the evolution of molecular structure and thermal behavior was monitored. Gel Permeation Chromatography (GPC) was employed to assess molecular weight changes and polydispersity. Differential scanning calorimetry (DSC) provided insights into crystallization kinetics and melting behavior, while polarized optical microscopy (POM) and wide-angle X-ray diffraction (WAXD) were used to evaluate spherulitic morphology and crystalline structure, respectively. The main objective is to correlate hydrolytic degradation with changes in crystallization behavior and to apply the Hoffman–Lauritzen theory to elucidate chain-folded crystallization in degraded PBSA. By integrating molecular degradation with thermal and structural analysis, this research contributes to the fundamental understanding of PBSA’s performance during environmental degradation, with implications for its application in sustainable technologies.
2. Materials and Methods
2.1. Materials
For this investigation, a sample of poly(butylene succinate-co-adipate) (PBSA), marketed as Bionolle 3001 MD, was employed. This polymer, provided by Showa Denko, located in Tokyo, Japan, exhibited an initial molecular weight (Mw) of 1.08 × 10⁵ g/mol and a melt flow index (MFI) of 3 g/10 min. According to the manufacturer’s specifications, its characteristics include an elongation at break of 780%, a tensile stress at break of 40 MPa, a Young’s modulus of 320 MPa, and a density of 1.23 g/cm3. Further properties reported are a heat of combustion of 23.9 kJ/g, a glass transition temperature of −45 °C, a melting point of 94 °C, a heat distortion temperature (HDT) of 69 °C at 0.45 MPa, and a degree of crystallinity ranging from 20% to 35%.
All chemical reagents utilized for the hydrolysis tests conducted in phosphate buffered saline were sourced from Merck KGaA, situated in Darmstadt, Germany.
Scheme 1 illustrates the molecular arrangement of poly(butylene succinate-co-adipate) and its constituent components.

Scheme 1.
Chemical structure of 1,4-butanediol, succinic acid, adipic acid, and poly(butylene succinate-co-butylene adipate) copolymer (PBSA).
2.2. Compression Molding
Compression molding was conducted to yield test sheets with a thickness of 0.2 mm. A 4 cm×4 cm stainless-steel frame was utilized to hold the polymeric material. Polymer pellets underwent an initial heating phase at 120 °C for 3 min under minimal contact pressure. Subsequently, the material was subjected to compression molding at 10 MPa for 2 min using a hydraulic press, maintaining a molding temperature of 120 °C. The resultant sheets were then rapidly cooled under pressure in a different colder press, achieving an approximate cooling rate of 25 °C min−1.
2.3. Hydrolysis in Phosphate Buffered Saline
Phosphate buffered saline was formulated as follows: 800 mL of distilled water was first placed into an appropriate vessel. To this, 8 g of NaCl, 200 mg of KCl, 1.44 g of Na2HPO4, and 240 mg of KH2PO4 were successively introduced. The solution’s pH was then calibrated to 7.2, and finally, distilled water was then added to obtain a total volume of 1 L.
Hydrolysis at Elevated Temperature
Hydrolysis testing was performed at selected temperatures in Memmert UFE 400 (Memmert, Schwabach, Germany) oven with very small temperature variation being ±1 °C. Contents of the flask were moved every day during the whole test. The samples were taken at intervals 4, 8, 16, 32, and 64 day, and measured for dissolved organic carbon by Shimadzu TOC 5000 A Analyzer (Shimadzu, Kyoto, Japan). The hydrolyzed polymer percentage at each time point was determined by comparing the amount of carbon that had dissolved to the material’s initial carbon content.
Polymer sheets were cut into 5 × 5 mm pieces. For each test, 200 mg of the polymer was accurately weighed into a 250 mL flask, followed by the addition of 200 mL of a pH 7.2 phosphate buffer. To prevent microbial degradation, a growth-inhibiting substance, sodium azide (NaN3), was incorporated into the buffer solution.
2.4. Gel Permeation Chromatography (GPC)
GPC was used to determine the weight-average molecular weight (Mw) and molecular weight distribution of the polymer samples both before and after hydrolysis. An Agilent Technologies HT-GPC 220 system (Santa Clara, CA, USA) was utilized, featuring a dual detection system comprising both viscosity (VIS) and refractive index (RI) detectors.
2.5. Differential Scanning Calorimetry (DSC)
A Mettler Toledo DSC1 differential scanning calorimeter (Columbus, OH, USA) was employed to determine the characteristic thermal peaks of the samples. Approximately 7 mg of each sample was placed into an aluminum pan, and the heat flow was recorded under a nitrogen atmosphere with a flow rate of 200 mL/min.
For evaluation, the temperature was ramped from −85 °C to +35 °C. In the case of isothermal crystallization experiments, the process began at 25 °C, with the temperature increasing to 140 °C at a heating rate of 20 °C/min. Next step was 3 min isothermal annealing at 140 °C to remove the previous heating history. Subsequently, the samples were cooled from 140 °C to various crystallization temperatures (e.g., 64 °C) at cooling rate 50 °C/min. The duration of isothermal crystallization varied depending on sample and temperature (it was in range 300–3000 s). Each measurement was performed in triplicate, with the reported values representing the average of these three measurements; the standard deviation was consistently less than 2%.
We determined crystallinity from DSC data using METTLER STARe software (version 18.00b). The software calculated this as a percentage: the measured sample’s heat of fusion divided by the theoretical heat of fusion for a 100% crystalline polymer, then multiplied by 100. We sourced the 100% crystalline heat of fusion value (110.3 J/g) from literature [21]. For robust results, we always analyzed three samples and reported their average crystallinity.
2.6. Polarized Optical Microscopy (POM)
For assessing spherulitic isothermal crystallization kinetics at various constant temperatures, an Olympus BX41 polarized optical microscope (Olympus, Tokyo, Japan) was employed in conjunction with a Linkam TP 94 hot stage (Linkam Scientific Instruments, Salfords, UK).
2.7. Wide-Angle X-Ray Diffraction (WAXD)
We gathered crystallinity data using wide-angle X-ray diffraction (WAXD). Diffraction patterns were captured on an Anton Paar XRDynamic 500 diffractometer (Graz, Austria), set up in a reflection, Bragg–Brentano configuration. The X-ray source was nickel-filtered copper Kα radiation (λ = 0.154 nm), and we scanned the diffraction angle (2θ) from 10 to 30°.
To determine WAXD crystallinity, we employed Anton Paar’s XRDanalysis software (version 1.2.0.3511). The software calculated crystallinity as a percentage: the ratio of the integrated intensities from the crystalline regions to the total integrated intensities, multiplied by 100. We consistently analyzed three samples per measurement and reported their average values. For experiments involving stepwise cooling, an Anton Paar TCU 110 Temperature Control Unit was used.
3. Results and Discussion
3.1. Hydrolysis and Molecular Weight Changes
To simulate conditions relevant for biodegradation and composting, hydrolysis of PBSA was previously performed at 37 °C, 58 °C, and 70 °C in phosphate-buffered saline (PBS, pH ≈ 7.2), as detailed in our earlier study [22]. The weight loss values after 128 days at these temperatures were about 9, 54, and 72 wt. %, respectively. Corresponding shifts in crystallization temperature Tc were about 2, 12, and 25 °C, respectively. Hydrolysis at 70 °C led to the most pronounced changes in crystallization behavior and weight loss, which guided our decision to focus on samples hydrolyzed at 70 °C for 4, 8, 16, 32, and 64 days in the present work. The crystallization behavior of these degraded samples is analyzed in detail below.
Molecular weight degradation during hydrolysis was monitored by GPC and showed a progressive decrease in both Mn and Mw with increasing time, accompanied by an increase in polydispersity index (PDI). After 64 days of hydrolysis at 70 °C, the polymer underwent significant changes in its molecular and crystalline structure. Its molecular weight (Mw) dropped sharply from approximately 103,000 to 16,000 g/mol, while its polydispersity index (PDI) increased noticeably from 2 to 7. Elevated temperatures can induce chemical hydrolytic cleavage of ester bonds, independent of enzymatic activity [23]. These trends are consistent with Tsuji and Okumura’s [24] reports on hydrolytic degradation of aliphatic polyesters.
Baidurah et al. [25] mentioned that Bionolle contains a small amount (approximately 0.5%) of hexamethyl diisocynate units which was introduced into the PBSA in order to elongate the polymer chains.
Table 1 lists the progress of hydrolysis of poly(butylene succinate-co-adipate) (PBSA) as a function of time at various temperatures of.

Table 1.
Degree of hydrolysis of PBSA during hydrolysis at various temperatures (37, 58, and 70 °C).
The change of molecular weight during hydrolysis is listed in Table 2.

Table 2.
Molecular weight of PBSA during hydrolysis at 70 °C after various hydrolysis times.
The observed decrease in molecular weight (Mw and Mn) and the corresponding increase in polydispersity index (PDI) are known to significantly affect crystallization behavior. Shorter chains resulting from hydrolysis exhibit higher mobility and can crystallize more rapidly, leading to an increase in crystallization rate. However, a broader molecular weight distribution may result in less uniform crystal growth and heterogeneous spherulitic morphologies. These structural changes can, in turn, influence the thermal stability and mechanical properties of the material [26,27,28].
3.2. DSC Analysis
Figure 1 illustrates the influence of temperature on the isothermal crystallization traces monitored by DSC. Figure 1a presents data for the unhydrolyzed PBSA sample, with isothermal temperatures ranging from 64 to 74 °C. At the highest temperature (74 °C), it took more than 3000 s to complete the experiment. The most rapid crystallization occurred at 64 °C, with kinetics progressively slowing as the temperature increased. Concurrently, the peak height systematically decreased with increasing crystallization temperature. We chose temperatures within the 64–74 °C range for practical reasons. Below this range, the polymer began to crystallize even during rapid cooling at 50 °C/min. Conversely, at temperatures above 74 °C, crystallization became impractically long, extending over several hours.
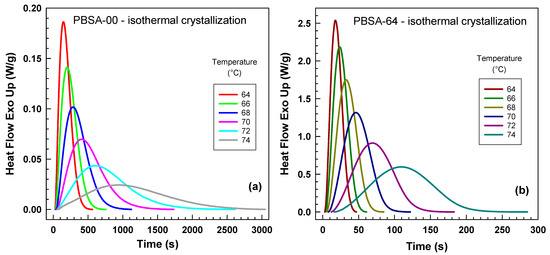
Figure 1.
Influence of isothermal crystallization temperature on normalized heat flow curves from differential scanning calorimetry (DSC) for (a) PBSA-00 sample (0 days of hydrolysis) and (b) PBSA-64 sample (64 days of hydrolysis). Each curve corresponds to the crystallization temperatures of 64 °C, 66 °C, 68 °C, 70 °C, 72 °C, 74 °C indicated in the legend.
Figure 1b displays data for the sample hydrolyzed for 64 days, examined within the same temperature range. Notably, the experimental duration for this sample was significantly shorter, completing within approximately 300 s. Despite this difference in kinetics, the overall trends observed in Figure 1b closely mirror those of the unhydrolyzed PBSA sample.
Our findings align with those reported by Yang and Qiu [29], who investigated the crystallization behavior of biodegradable poly(hexamethylene succinate-co-3 mol % ethylene succinate). Their study, conducted within the temperature range of 30–37.5 °C, revealed an inverse relationship between crystallization kinetics and temperature. Furthermore, they observed that the polymer with a lower molecular weight (Mw = 1.2 × 10⁴ g/mol) exhibited a faster crystallization rate compared to its higher molecular weight counterpart (Mw = 5.8 × 10⁴ g/mol).
Figure 2 presents the evolution of relative crystallinity, often referred to as S-curves, over time during isothermal crystallization. These curves, ranging from 0 to 1, were derived by integrating the heat flow curves presented in Figure 1. Figure 2a displays the curves for the unhydrolyzed sample, while Figure 2b illustrates those for the sample subjected to 64 days of hydrolysis. Following hydrolysis, the crystallization experiments were significantly accelerated, completing within approximately 300 s compared to 3000 s for the unhydrolyzed sample. These relative crystallinity curves were subsequently used for evaluating crystallization kinetics, employing methods such as the Avrami equation (see Figure 2c), reciprocal half-time of crystallization (see Figure 2a), and the slope at the inflection point (see Figure 2b).
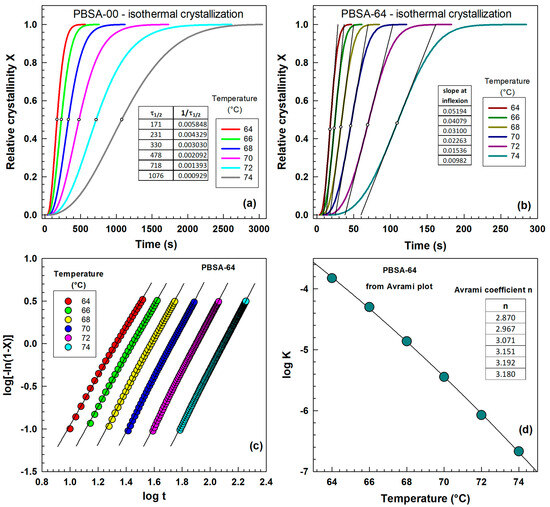
Figure 2.
Influence of isothermal crystallization temperature on relative crystallinity curves from differential scanning calorimetry (DSC) for (a) PBSA-00 sample (0 days of hydrolysis), (b) PBSA-64 sample (64 days of hydrolysis at 70 °C), (c) PBSA-64 sample (Avrami plot), and (d) PBSA-64 sample (Avrami rate constant K and exponent n).
Figure 2c illustrates the influence of crystallization temperature on the vs. plot. The experimental points exhibit a gradual linear dependence and shift towards higher values with increasing crystallization temperature. This shift is reflected in the intercept, represented by . The kinetic parameter is plotted as a function of temperature in Figure 2d; it gradually decreases with increasing temperature. In Figure 2c, the slopes of the lines were evaluated, representing the Avrami parameter . The values of Avrami parameter are listed in Figure 2d. They are very close to 3, indicating three-dimensional growth.
Our findings are consistent with the crystallization kinetics study of biodegradable poly(ethylene adipate) conducted by Yang et al. [30]. They investigated two samples with differing molecular weights: Mw = 10,000 g/mol and Mw = 1000 g/mol. For the higher molecular weight sample, they observed an increase in the half-time of crystallization with increasing temperature (e.g., 0.74 min at 20 °C and 17.48 min at 38 °C). In contrast, the lower molecular weight sample exhibited a significantly shorter half-time of crystallization under similar conditions (e.g., 0.43 min at 20 °C and 9.63 min at 38 °C). Additionally, they reported Avrami parameters of 3.08 for the higher molecular weight sample and 2.93 for the lower molecular weight sample, both measured at 35 °C.
Equations (1)–(5) provide the details of the Avrami analysis presented in Figure 2c,d. Crystallinity, or the degree to which a material has a structured, crystal-like arrangement, generally increases over time. To analyze this time-dependent change, scientists often use the Avrami equation, which is presented as follows:
represents the relative crystallinity at a given time . is the Avrami rate constant (strongly depends on temperature), which combines factors related to how new crystals form (nucleation) and how they grow. The Avrami exponent , ideally an integer between 1 and 4, depends on how crystals nucleate and the shape they take as they grow. Each value (1, 2, 3, or 4) directly reflects the growth morphology and represents the dimensionality of crystal growth (one-, two-, or three-dimensional, respectively). is the crystallization time.
To make it easier to analyze, the Avrami equation can be transformed into a double logarithmic form:
Figure 3 presents the original heat flow traces obtained from the DSC. Figure 3a illustrates the curves at the lower temperature (64 °C), while Figure 3b depicts those at the higher temperature (74 °C). Notably, at the lower temperature, the crystallization experiments completed more rapidly (e.g., within 600 s) compared to the higher temperature (e.g., 3000 s). This analysis focuses on the influence of hydrolysis time on crystallization kinetics. The unhydrolyzed sample exhibited the slowest crystallization kinetics, or the longest experimental duration. As the hydrolysis time increased, the crystallization kinetics consistently accelerated.
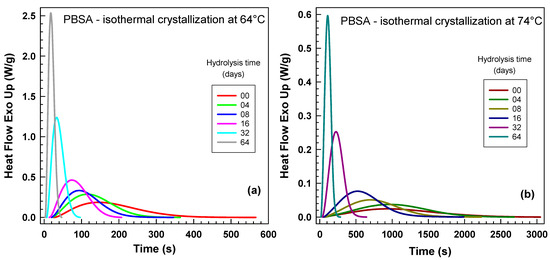
Figure 3.
Influence of hydrolysis time at 70 °C on normalized heat flow curves from differential scanning calorimetry (DSC) for isothermal crystallization temperatures. (a) 64 °C. (b) 74 °C. Each curve corresponds to the hydrolysis time indicated in the legend.
Our results align well with the findings of Wang and Mano [31], who investigated the impact of crystallization temperature and molecular weight on spherulite crystallization in poly(L-lactic acid). They utilized two samples: PLLA1 with Mw = 151,000 g/mol and PLLA2 with Mw = 301,000 g/mol. At 135 °C, PLLA1 exhibited a growth rate of approximately 4.1 μm/min, while PLLA2 crystallized at a considerably lower rate of 3 μm/min. At 145 °C, these values decreased to about 2.7 μm/min for PLLA1 and 1.8 μm/min for PLLA2.
Figure 4 illustrates the evolution of relative crystallinity during isothermal crystallization as a function of time. These data were derived by integrating the heat flow curves presented in Figure 3. Figure 4a demonstrates the influence of hydrolysis time on crystallization at 64 °C, whereas Figure 4b depicts the crystallization at 74 °C. It is evident that crystallization proceeds more rapidly at 64 °C than at 74 °C. At 74 °C, the curves for the unhydrolyzed sample (0 days) and the 4-day hydrolyzed sample show very small differences. These relative crystallinity curves were subsequently utilized for the quantitative evaluation of hydrolysis’s influence on crystallization kinetics (see Figure 4c), employing two methods: (1) slope at inflection point and (2) reciprocal half-time of crystallization . Only very small differences were observed in the crystallization kinetics obtained by these two methods. The experimental data points were fitted using a third-order polynomial. The slope method yielded a coefficient of determination of R2 = 0.999985, and had R2 = 0.999993. The result of this analysis was a steady increase in crystallization kinetics with progressing hydrolysis time.
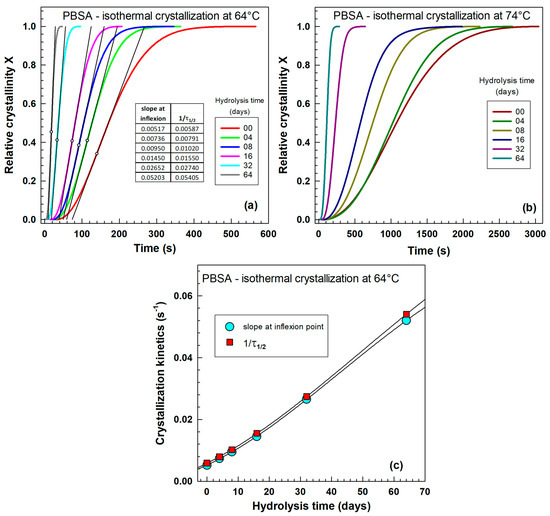
Figure 4.
Influence of hydrolysis time at 70 °C on relative crystallinity from differential scanning calorimetry (DSC) for isothermal crystallization temperatures. (a) 64 °C. (b) 74 °C. (c) Crystallization kinetics at 64 °C.
The foundational understanding of how polymer chain length influences crystallization rate traces back to Hoffman’s pioneer work in 1982 [32]. He theorized that accelerated crystallization in shorter polymer chains arises from a mechanism involving the reptation of individual molecules toward the emerging lamellar growth front. Hoffman proposed that shorter molecules incorporate into the growing crystal lattice at a more rapid rate than their longer counterparts. This concept was further substantiated in 1988 by Hoffman and Miller [33], who, through studies on polyethylene samples, demonstrated a direct correlation between decreasing molecular weight and increasing crystallization rate. They suggested that the resistance experienced by a polymer chain as it is drawn onto the crystal surface is fundamentally proportional to its length, thus explaining the kinetic advantage of shorter chains.
Since these initial elucidations, a substantial body of research has consistently supported this principle across a diverse range of polymeric systems. Numerous investigations have empirically confirmed an enhanced crystallization rate with diminishing molecular weight in various polymers. This effect has been documented by many researchers for various materials, such as by Avella et al. for polypropylene [34], Skoglund and Fransson for polycaprolactone [35], Alizadeh et al. for polycarbonate [36], Chae et al. for poly(butylene adipate) [37], Chen et al. for poly(trimethylene terephthalate) [38], He et al. for poly(L-lactide) [39], Papageorgiou et al. for poly(ethylene succinate) [40], and Yang et al. for poly(ethylene adipate) [30]. The recurrent observation of this inverse relationship underscores its broad applicability in polymer science, where reduced chain entanglement and increased mobility of shorter chains facilitate more efficient molecular packing and crystalline growth.
Figure 5 illustrates the influence of isothermal crystallization temperature on the melting behavior of samples after 4 days of hydrolysis (Figure 5a) and after 32 days of hydrolysis (Figure 5b). In both cases, as the crystallization temperature increases, the melting peak systematically shifts towards higher temperatures. For the sample hydrolyzed for 4 days, only two melting peaks are observed. In contrast, the sample hydrolyzed for 32 days, when crystallized at 69 °C and 72 °C, exhibits three distinct melting peaks. The observation of multiple melting peaks indicates the presence of several lamellar thicknesses, which provides crucial insights into the supramolecular structure of the polymer. The Gibbs–Thomson equation accurately describes how the melting point of a material changes with its lamella thickness.
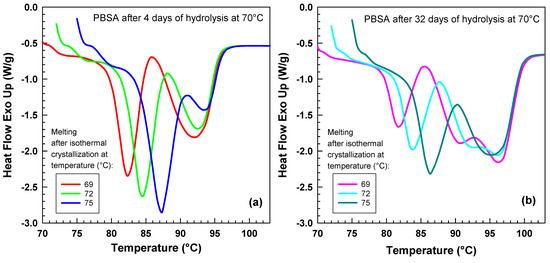
Figure 5.
Heat flow curves during the heating experiment at rate 20 °C/min after isothermal crystallization at various temperatures. (a) PBSA after 4 days of hydrolysis at 70 °C. (b) PBSA after 32 days of hydrolysis at 70 °C. Each curve represents data obtained at crystallization temperatures of 69 °C to 75 °C indicated in the legend.
Our results agree with Wang et al. [41] who also observed multiple melting behavior of poly(butylene succinate-adipate).
Figure 6a illustrates heat flow curves of samples crystallized at various temperatures . There are two melting peaks for all crystallization temperatures. The left peak systematically shifts to higher temperatures, and this peak was used for the Hoffman–Weeks [42] plot shown in Figure 6b. The equilibrium melting point, , was determined as the intersection of the extrapolated line through the data points with the line [43] yielding a value of 135.42 °C. This equilibrium melting point, , was subsequently used in the Hoffman–Lauritzen analysis presented below.
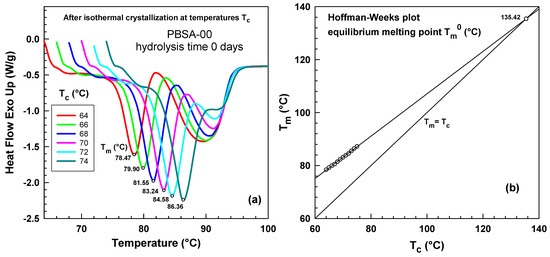
Figure 6.
Heat flow curves during the heating experiment at rate 20 °C/min after isothermal crystallization at various temperatures. (a) PBSA hydrolysis time 0 days. Crystallization temperatures (64–74 °C) corresponding to each curve are listed in the legend. (b) Hoffman–Weeks plot for PBSA hydrolysis time 0 days, circle represents equilibrium melting point .
Our results align well with those by Zhao et al. [44] for poly(butylene succinate-co-adipate) blends and by Wang et al. [41] who studied multiple melting behavior of poly(butylene succinate-adipate).
We explored how polymers crystallize by applying the Hoffman–Lauritzen theory [45], which describes the relationship between chain-folded crystal growth rates and undercooling . This theory is represented by a key equation:
where
- is the crystals growth rate;
- is a constant (1500 cal mol−1) representing the activation energy required for chains to move repeatedly;
- is the gas constant 8.314 J K−1 mol−1;
- is the crystallization temperature in Kelvin;
- is defined as − 30 K, where is the glass transition temperature (for PBSA, ), ;
- is the undercooling, calculated as ;
- is the equilibrium melting temperature of an infinitely thick crystal, for PBSA ;
- is the nucleation constant;
- is a correction factor, equal to ;
- is a pre-exponential factor.
For the evaluation of DSC results, we have replaced by . Equation (7) was used to draw lines in Figure 7a. The intercept was used to draw Figure 7b. parameter was calculated as a slope of lines in Figure 7a:
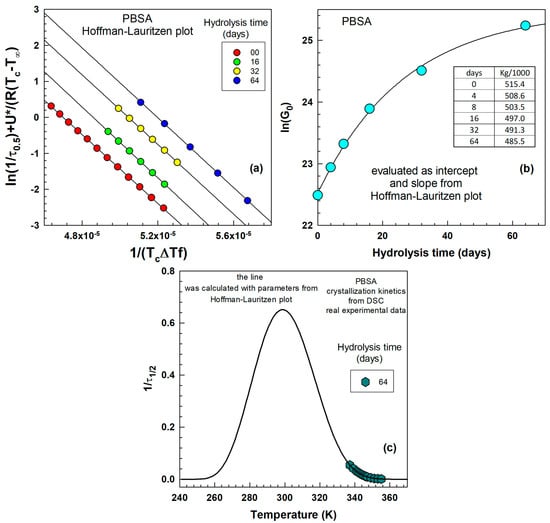
Figure 7.
(a) Hoffman–Lauritzen plot for PBSA after 00, 16, 32, 64 days of hydrolysis, (b) pre-exponential factor as a function of hydrolysis time, (c) reciprocal half-time of crystallization as a function of temperature in K.
Figure 7a illustrates four lines fitted through the experimental points for 0, 16, 32, and 64 days of hydrolysis. Within narrow temperature ranges, the relationship is almost perfectly linear, allowing for the determination of the slope and intercept for various hydrolysis times. Figure 7b depicts the pre-exponential factor , which increases with increasing hydrolysis time. This factor was fitted using an “exponential rise to maximum” curve. Figure 7c shows reciprocal half-time of crystallization as a function of temperature in K. Hoffman–Lauritzen theory describes the crystallization in range of the - 30 K till . The peak has a maximum in the middle of this range.
Our results agree well with Si and Luo [46], who studied crystallization behavior of poly (butylene succinate-co-butylene adipate)/thiodiphenol complexes and also with Qiu and Qiu [47], who studied crystallization kinetics of poly(ethylene suberate).
Figure 8 illustrates the crystallization kinetics as a function of temperature for various hydrolysis times. Figure 8a shows the kinetics for hydrolysis times of 0, 4, and 8 days, while Figure 8b depicts the kinetics for hydrolysis times of 16, 32, and 64 days. The reason for dividing the data into two separate figures is, first, the different temperature ranges, and second, the range of . The crystallization kinetics increase with decreasing temperature. The data correspond to the right side of the peak illustrated in Figure 7c. The data come from a DSC experiment, and kinetics are expressed as . The experimental points are represented by various colors, and the lines going through these points were calculated using the Hoffman–Lauritzen equation. The details of the mathematical treatment are shown below in Equations (8)–(11). Nonlinear regression was performed using the temperature axis in Kelvin, and the results were later transformed into °C for the benefit of the readers.
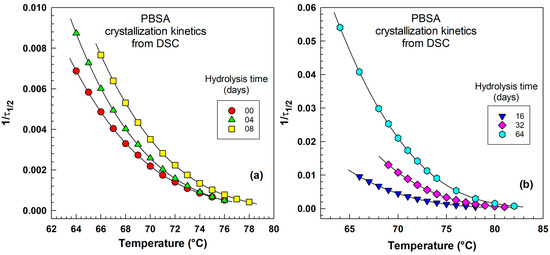
Figure 8.
Crystallization kinetics as a function of temperature derived from DSC expressed as for various times of hydrolysis. (a) Hydrolysis time 00, 04, 08 days, (b) hydrolysis time 16, 32, 64 days. Each curve is associated with a specific hydrolysis duration, as indicated in the legend.
To conduct nonlinear regression, the equation needed to be translated into a computer-readable format. This simplification process is illustrated in Equations (8) through (11), with Equation (11) providing an example specifically for pure PBSA where and :
Our results agree well with the differential scanning calorimetry (DSC) analysis conducted by He et al. [39] on the isothermal melt-crystallization of poly(L-lactide) (PLLA) samples with varying number-average molecular weights Mn. They studied three PLLA samples: PLLA1 (Mn = 7.45 × 10⁴ g/mol), PLLA2 (Mn = 5.56 × 10⁴ g/mol), and PLLA3 (Mn = 2.57 × 10⁴ g/mol). Their findings for the half-time of crystallization at temperatures ranging from 105 °C to 130 °C were as follows:
PLLA1: 12.9 min (130 °C), 7.1 min (125 °C), 4.0 min (120 °C), 3.0 min (115 °C),
1.9 min (110 °C), and 1.7 min (105 °C).
PLLA2: 8.1 min (130 °C), 5.8 min (125 °C), 3.7 min (120 °C), 2.7 min (115 °C),
1.3 min (110 °C), and 1.1 min (105 °C).
PLLA3: 6.2 min (130 °C), 5.3 min (125 °C), 3.5 min (120 °C), 2.5 min (115 °C),
1.2 min (110 °C), and 0.9 min (105 °C).
Figure 9 shows the melting behavior obtained by DSC experiment after isothermal crystallization at 75 °C for various hydrolysis times. The left melting peak changes only very little (see Figure 9a), while the right peak changes tremendously (see Figure 9b). After 64 days of hydrolysis, the right peak appears to be composed of two peaks, possibly indicating the presence of two lamellar thicknesses according to the Gibbs–Thomson equation [48]:
where
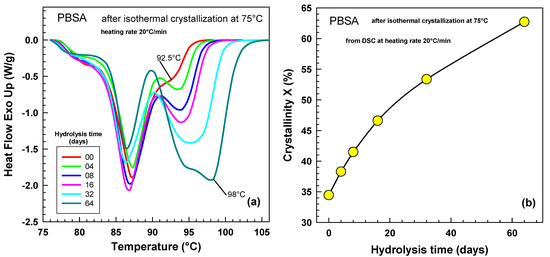
Figure 9.
Heat flow curves during the heating experiment at rate 20 °C/min after various times of hydrolysis. PBSA after isothermal crystallization at 75 °C. (a) Original heat flow traces where hydrolysis times for each curve are shown in the legend. (b) Crystallinity as a function of hydrolysis time.
- is melting temperature of lamellar crystal;
- is the equilibrium melting temperature;
- is the surface free energy;
- is the end surface free energy;
- is the heat of fusion;
- is a lateral size of lamellae;
- is a lateral size of lamellae;
- is thickness of lamellar.
Typically, the parameters and are considerably larger than for a lamellar crystal. Consequently, Equation (12) can be accurately approximated by [43]:
For a given material, the change in lamellar thickness can be estimated from the change in melting point using the following relation [43]:
The value was determined from the Hoffman–Weeks plot presented in Figure 6b. This allowed us to estimate the apparent increase in lamellar thickness after 64 days of hydrolysis, as per Equation (14):
Figure 9b illustrates the crystallinity as a function of hydrolysis time. A quite significant increase of crystallinity was observed from 34 to 63%. The longer the hydrolysis time, the higher the crystallinity obtained.
The observed increase in crystallinity with extended hydrolysis time, as depicted in Figure 9b, aligns closely with the findings of Bikiaris et al. [23]. Their research on the biodegradability of various poly(alkylene succinates) suggested that degradation primarily targets the amorphous regions of the polymer. This selective degradation can influence the overall crystallinity. Bikiaris et al. [23] noted that prolonged hydrolysis led to a slight increase in melting temperature and a more significant rise in the associated heats of fusion. For instance, after 60 days of hydrolysis, poly(ethylene succinate) (PESu) and poly(butylene succinate) (PBSu) exhibited heats of fusion approximately 5 J/g higher than their original, undegraded forms. Poly(propylene succinate) (PPSu), which showed the greatest weight loss, experienced an even more substantial increase of 9 J/g in its heat of fusion. This rise in heat of fusion is most likely due to the preferential removal of amorphous material via hydrolysis, rather than an actual increase in the proportion of crystalline material.
Furthermore, a subtle upward shift in the polymer’s glass transition temperature (Tg) was also reported. This observation supports the hypothesis that hydrolysis preferentially degrades the more mobile, amorphous fractions. This leaves behind a more constrained, less mobile amorphous phase situated between the remaining crystallites, leading to an apparent increase in Tg.
3.3. Polarized Optical Microscopy (POM) Analysis
Figure 10 shows the growth of spherulites over time during crystallization at 70 °C for a sample hydrolyzed for 64 days, with images taken at regular time intervals. The pink color represents the amorphous phase; the blue, yellow, and green circles represent the spherulites. Spherulites have various sizes, and some of them become visible after longer periods. This observation can be connected with the nucleation being non-uniform throughout the sample. Three spherulites were measured for each temperature and each hydrolysis time, and the average value was reported. With increasing time, the radius of the spherulites increases, and this was plotted in Figure 11a.
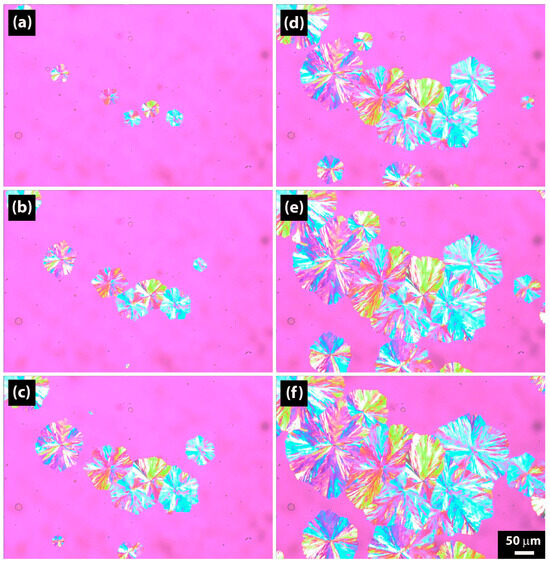
Figure 10.
Polarized optical microscopy (POM) pictures of PBSA after 64 days of hydrolysis crystallized isothermally at 70 °C. (a) 20 s. (b) 40 s. (c) 60 s. (d) 80 s. (e) 100 s. (f) 120 s.
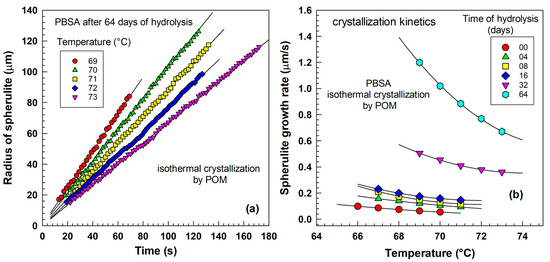
Figure 11.
Crystallization kinetics evaluated by polarized optical microscopy (POM). (a) Radius of spherulite vs. time for PBSA after 64 days of hydrolysis. (b) Growth rate of spherulites vs. temperature for various times of hydrolysis.
Our observations indicate that samples subjected to shorter hydrolysis durations predominantly retained their characteristic spherical morphology. In contrast, prolonged hydrolysis led to the development of distinct dendritic structures. This shift in crystalline morphology is consistent with findings in related copolyester systems, such as the observations reported by Nie et al. [49] for random poly(p-dioxanone-co-butylene-co-succinate) copolyesters.
The array of spherulitic morphologies identified in our hydrolyzed PBSA samples can be further contextualized by comparing them with those documented in the crystallization studies of other copolyesters. Similar complex morphological features and their dependence on crystallization conditions have been extensively reported in literature for various polymeric systems, including studies by Qiu et al. [50], Xue and Qiu [51], Liu et al. [52], Yang and Qiu [53], and Papageorgiou and Bikiaris [54]. These comparisons underscore that molecular modifications, such as those induced by hydrolysis, can profoundly influence the growth patterns and final architecture of crystalline domains within the polymer matrix.
Figure 11a illustrates the radius of spherulites as a function of time for various crystallization temperatures. The experimental points show a linear relationship with time. With increasing crystallization temperature, the slope of the line decreases. The slope represents the crystallization kinetics in . Figure 11b summarizes the results of optical microscopy observations for various hydrolysis times, measured at various temperatures. With increasing hydrolysis times, the curves shift towards a higher growth rate. For 0, 4, 8, and 16 days, the rates are rather similar; however, for 32 and 64 days, there is a distinct shift in crystallization kinetics. The trends obtained by POM are similar to trends obtained by DSC, as shown in Figure 8. In a DSC experiment, one observes the kinetics of many spherulites growing in bulk (3D—three-dimensional growth), while POM focuses on a thin sample where spherulites grow planarly (2D—two-dimensional growth). Therefore, the results slightly differ.
Figure 12 shows the growth of spherulites over time during crystallization at 71 °C for a sample hydrolyzed for 64 days, with images taken at regular time intervals. Spherulites grow a little bit slower over time than at 70 °C in Figure 10. The reason for showing Figure 12 is the mixture of traditional circular spherulites with hexagonal dendritic spherulite shapes. The pink regions indicate the amorphous phase, while spherulites are depicted as blue, yellow, and green circles. Additionally, the black lines in Figure 12b outline the spherulite shapes, drawn by the authors for illustrative purposes.
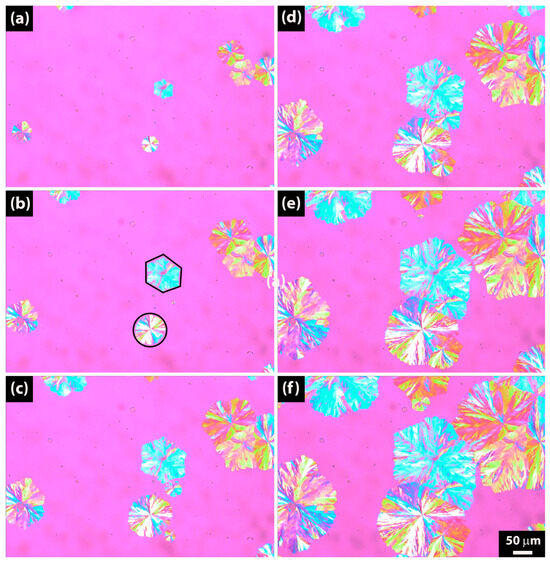
Figure 12.
Polarized optical microscopy (POM) pictures of PBSA after 64 days of hydrolysis crystallized isothermally at 71 °C. (a) 20 s. (b) 40 s. (c) 60 s. (d) 80 s. (e) 100 s. (f) 120 s.
Our observations agree with, e.g., Li et al. [55], who studied dendritic crystals in poly(butylene succinate) by SAXS and WAXD; with Woo et al. [56], who studied dendritic polymer spherulites; and with Siti et al. [57], who did research on dendritic spherulites of poly(L-lactic acid) crystallized with poly(p-vinyl phenol).
Figure 13 illustrates the growth of spherulites during crystallization at 73 °C for a sample hydrolyzed for 64 days, based on images acquired at regular intervals. Notably, the spherulite growth rate is observed to be slower compared to that at 70 °C and 71 °C, as depicted in Figure 10 and Figure 12, respectively. The inclusion of Figure 13 is specifically to highlight the distinct flower-like dendritic structures with diamond-shaped ends of the spherulites, emphasized by the black lines in Figure 13d.
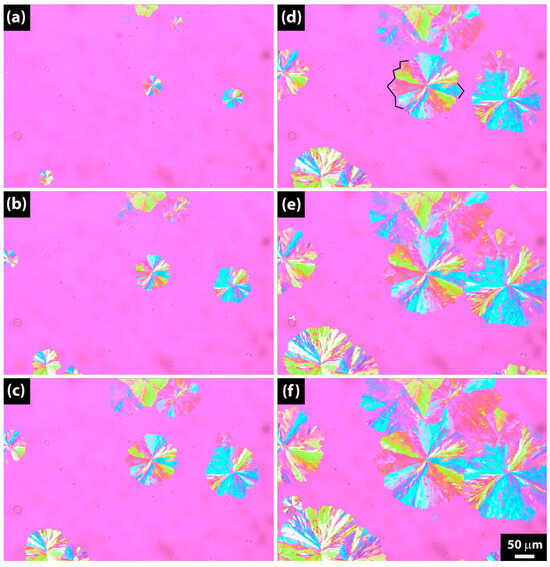
Figure 13.
Polarized optical microscopy (POM) pictures of PBSA after 64 days of hydrolysis crystallized isothermally at 73 °C. (a) 30 s. (b) 60 s. (c) 90 s. (d) 120 s. (e) 150 s. (f) 180 s.
Our observations are very close to those by Nie et al. [49], who observed dendritic crystallization of random poly(p-dioxanone-co-butylene-co-succinate) copolyesters.
3.4. Wide-Angle X-Ray Diffraction (WAXD) Analysis
Table 3, Table 4 and Table 5 and Figure 14 present a detailed analysis of the WAXD results. The evaluation of these results was performed using Bragg’s diffraction law:

Table 3.
WAXD analysis of original unhydrolyzed PBSA during stepwise cooling experiment for peak 1. Key parameters: d-spacing (calculated using Bragg’s equation), crystallite size (determined by the Scherrer equation), and FWHM (full width at half-maximum of the diffraction peaks).

Table 4.
WAXD analysis of original unhydrolyzed PBSA during stepwise cooling experiment provided key parameters: d-spacing (calculated using Bragg’s equation), crystallite size (determined by the Scherrer equation), and FWHM (full width at half-maximum of the diffraction peaks). Results for peak 2.

Table 5.
WAXD analysis of original unhydrolyzed PBSA during stepwise cooling experiment provided key parameters: d-spacing (calculated using Bragg’s equation), crystallite size (determined by the Scherrer equation), and FWHM (full width at half-maximum of the diffraction peaks). Results for peak 3.
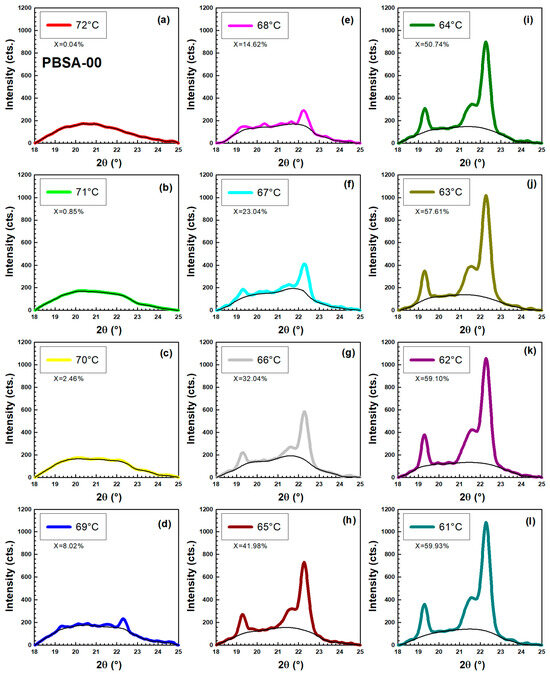
Figure 14.
Crystallization of original unhydrolyzed PBSA measured by WAXD in temperature range (a) 72 °C. (b) 71 °C. (c) 70 °C. (d) 69 °C. (e) 68 °C. (f) 67 °C. (g) 66 °C. (h) 65 °C. (i) 64 °C. (j) 63 °C. (k) 62 °C. (l) 61 °C.
This fundamental equation indicates that for a known X-ray wavelength , measuring the angle provides information about the spacing between crystallographic planes within the crystal’s scattering centers; is diffraction order.
The crystallite size of each plane can be calculated from the WAXD diffraction peaks using the Scherrer equation [58]:
where
- is the crystallite diameter ;
- is X-ray wavelength;
- is the crystallite shape factor;
- is the Bragg angle;
- is the full width at half-maximum intensity of the diffraction line, measured in radians.
Figure 14 shows the crystallization of original unhydrolyzed PBSA measured by WAXD. The experiment was done in a stepwise cooling experiment on a hot stage. It started at 72 °C and ended at 61 °C. At the beginning of the experiment, the sample was completely amorphous. Gradually three crystallization peaks emerge, and their parameters are listed in Table 3, Table 4 and Table 5. Table 3, Table 4 and Table 5 were constructed to facilitate the calculation of d-spacing values using Bragg’s law and to determine the crystallite diameter through the application of the Scherrer equation. The WAXD patterns in Figure 14f–l clearly show PBSA’s characteristic diffraction peaks at = 19.45°, 21.73°, and 22.46°. These angles precisely indicate the presence of the (020), (021), and (110) crystallographic planes within the PBSA structure [59]. The color curves in Figure 14 represent the whole scattering pattern that contains the crystalline and amorphous phase. The black line represents only the amorphous phase. Using Equation (17), sample crystallinity was calculated based on the ratio of the fitted areas corresponding to the crystalline and amorphous phases:
Our results are comparable, e.g., with Moitzi and Skalicky [60], who studied shear-induced crystallization of polypropylene, and with Baldrian et al. [61], who performed time-resolved SAXS/WAXS study of phase behavior and crystallization in polymer blends.
Figure 15 presents the WAXD results for unhydrolyzed PBSA during a stepwise cooling experiment from 72 °C to 61 °C. Figure 15a offers a 3D visualization of intensity as a function of both angle and temperature, while Figure 15b plots the crystallinity (calculated using Equation (17)) against temperature. Figure 15c illustrates the intensity as a function of angle at various temperatures, clearly demonstrating that as the temperature decreases, the peak height gradually increases and the amorphous halo gradually decreases as three distinct crystalline peaks become more prominent.
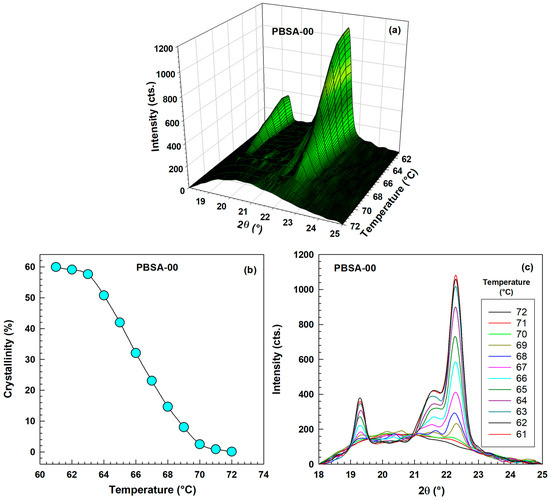
Figure 15.
WAXD results for original unhydrolyzed PBSA during stepwise cooling experiment in temperature range 72–61 °C. (a) 3D graph-intensity as a function of angle and temperature. (b) Crystallinity as a function of temperature. (c) Intensity as a function of angle for various temperatures.
Our results align well with those of Cho et al. [62], who investigated a time-resolved wide- and small-angle X-ray scattering study of crystallization of poly(L-lactide-lactide) random copolymers and Pérez et al. [63], who researched poly(heptamethylene-bibenzoate) by time-resolved synchrotron WAXS and DSC.
In Table 3, Table 4 and Table 5, as the temperature decreased, both the area and height of the diffraction peaks gradually increased. At 61 °C, the d-spacing for peaks 1–3, calculated using Bragg’s law, was 4.5946 Å, 4.1124 Å, and 3.9845 Å, respectively. The corresponding crystallite diameters , determined through the Scherrer equation, were 23.02 nm, 14.95 nm, and 17.26 nm for peaks 1–3.
Our results are comparable to those performed, e.g., by Chen et al. [64], who did in situ characterization of strain-induced crystallization by synchrotron radiation wide-angle X-ray diffraction; Conceicao et al. [65], who studied extruded films based on poly(butylene succinate) blends with a partially degraded poly (butylene adipate-co-terephthalate); Rungswang et al. [66], who studied copolymers time-resolved SAXS/WAXD; and Saengbunkoet et al. [67], who studied oriented poly(butylene succinate-co-adipate) films.
Figure 16 and Figure 17 details the WAXD analysis of PBSA after 32 days of hydrolysis, focusing on its behavior during a stepwise cooling experiment from 82 °C to 71 °C. The temperature range was 10 °C higher compared to unhydrolyzed PBSA. The observed trends are very similar to those seen for the unhydrolyzed PBSA in Figure 14 and Figure 15. Figure 17a offers a 3D representation of diffraction intensity as a function of both angle and temperature, while Figure 17b plots the calculated crystallinity (derived using Equation (17)) against temperature. Figure 17c displays the intensity as a function of angle at various temperatures, clearly showing that as the temperature decreases, the height of the crystalline peaks progressively increases, and also the amorphous halo concurrently diminishes as the three characteristic peaks become more pronounced.
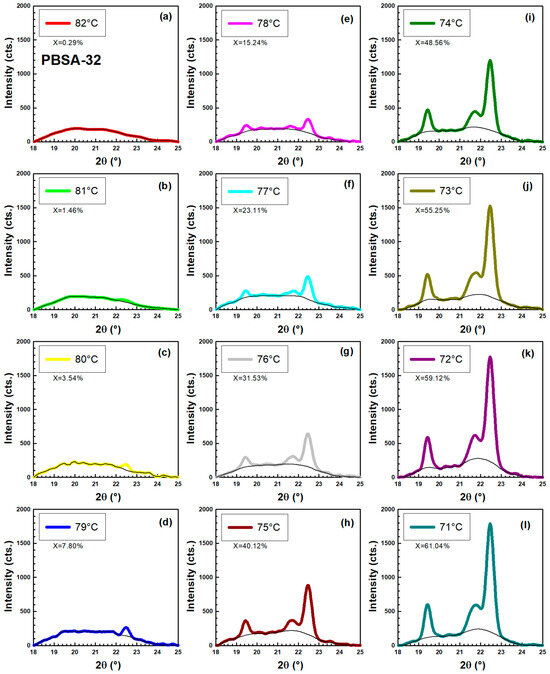
Figure 16.
Crystallization of PBSA after 32 days of hydrolysis measured by WAXD in temperature range. (a) 82 °C. (b) 81 °C. (c) 80 °C. (d) 79 °C. (e) 78 °C. (f) 77 °C. (g) 76 °C. (h) 75 °C. (i) 74 °C. (j) 73 °C. (k) 72 °C. (l) 71 °C.
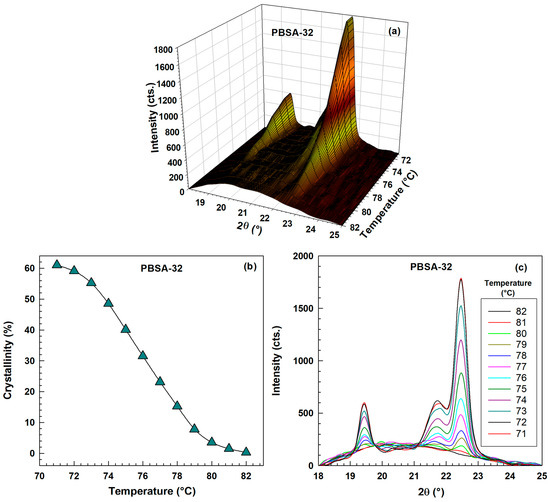
Figure 17.
WAXD results for PBSA after 32 days of hydrolysis during stepwise cooling experiment in temperature range 82–71 °C. (a) 3D graph-intensity as a function of angle and temperature. (b) Crystallinity as a function of temperature. (c) Intensity as a function of angle for various temperatures.
Our results agree well with those performed by Chen et al. [68], who performed an in situ synchrotron X-ray scattering study on isotactic polypropylene crystallization under the coexistence of shear flow and carbon nanotubes; Cai et al. [69], who did a study on melting and crystallization of short-linear chains from debranched waxy starches by synchrotron wide-angle X-ray diffraction; Sato et al. [70], who performed simultaneous synchrotron SAXS/WAXD study of biodegradable polymer blends of cellulose acetate butyrate and poly(3-hydroxybutyrate); and Dong et al. [71], who did in situ synchrotron wide-angle X-ray diffraction as a rapid method for cocrystal/salt screening.
In Table 6, Table 7 and Table 8, we observed that as the temperature decreased, both the area and height of the diffraction peaks gradually increased. At 71 °C, the d-spacing values for peaks 1–3, calculated using Bragg’s law, were 4.5642 Å, 4.0785 Å, and 3.9526 Å, respectively. The corresponding crystallite diameters , determined via the Scherrer equation, were 23.16 nm, 13.59 nm, and 19.69 nm for peaks 1–3. The influence of hydrolysis on both d-spacing and crystallite diameters was almost negligible for peaks 1 and 2. However, for the largest peak, the crystallite diameter significantly increased from 17.26 nm to 19.69 nm, representing a 14% increase. This observation aligns well with the previously noted increase in melting point and the corresponding increase in lamellar thickness, as described by the Gibbs–Thomson equation for PBSA after 64 days of hydrolysis.

Table 6.
WAXD analysis of PBSA after 32 days of hydrolysis during stepwise cooling experiment. Key parameters: d-spacing (calculated using Bragg’s equation), crystallite size (determined by the Scherrer equation), and FWHM (full width at half-maximum of the diffraction peaks). Results for peak 1.

Table 7.
WAXD analysis of PBSA after 32 days of hydrolysis during stepwise cooling experiment provided key parameters: d-spacing (calculated using Bragg’s equation), crystallite size (determined by the Scherrer equation), and FWHM (full width at half-maximum of the diffraction peaks). Results for peak 2.

Table 8.
WAXD analysis of PBSA after 32 days of hydrolysis during stepwise cooling experiment provided key parameters: d-spacing (calculated using Bragg’s equation), crystallite size (determined by the Scherrer equation), and FWHM (full width at half-maximum of the diffraction peaks). Results for peak 3.
Our WAXD analysis revealed an intriguing increase in PBSA crystallite size from 17.26 nm (unhydrolyzed) to 19.69 nm after 32 days of hydrolysis. This observation is characteristic of semi-crystalline polymer degradation, primarily driven by the preferential hydrolysis of amorphous regions. Water molecules effectively cleave ester bonds in these more accessible, disordered areas. This removal of shorter, less ordered chains “cleans up” the material surrounding existing crystallites, leading to an apparent increase in their average size as coherent domains remain. Consequently, this process results in a higher overall crystallinity for the hydrolyzed PBSA.
Our results are comparable to Slusarczyk [72] who studied crystallization and melting behavior using time-resolved SAXS/WAXS; by Wang and Cao [73], who studied phase transition and melt-recrystallization of poly(butylene adipate) by WAXD and DSC; by Wasanasuk and Tashiro [74], who researched crystallization of poly(L-lactic acid by time-resolved FTIR and WAXD; and also by Yousfi et al. [75], who researched poly(butylene succinate-co-adipate).
Table 9 lists the evolution of the melting point Tm in PBSA samples as they undergo hydrolysis. A noticeable shift in the melting peak from approximately 90 °C to 97 °C was observed as hydrolysis progressed. This increase in melting temperature after hydrolysis strongly indicates a change in the copolymer’s composition. Research by Lindstrom et al. [76] on the hydrolysis products of poly(butylene adipate) and poly(butylene succinate) found a higher concentration of adipic acid compared to succinic acid under similar hydrolysis conditions, implying a greater susceptibility of adipic acid-containing segments to hydrolysis.

Table 9.
Thermal properties of PBSA after various hydrolysis times measured by DSC.
This aligns with earlier work on PBSA copolymers. Ahn et al. [77], in 2001, reported Tm values of 114 °C for pure poly(butylene succinate) and 92 °C for PBSA with 21% adipic acid content, as determined by NMR. Perez-Camargo et al. [78] observed a similar trend, where higher adipic acid content correlated with lower melting temperatures. Furthermore, Baidurah et al. [25,79] directly demonstrated a reduction in adipic acid content in PBSA following thermally assisted hydrolysis. Our findings of an increased Tm after hydrolysis are consistent with these previous reports, suggesting that the degradation process preferentially cleaves the adipate units, leading to a polymer richer in the higher-melting succinate units. This is further supported by studies like Marten et al. [80], who found significant enzymatic hydrolysis in polyesters containing adipic units, while those with succinic units remained stable under their tested conditions. Therefore, the observed rise in Tm is a strong indicator of both the decrease in molecular weight and a shift in copolymer composition towards a lower adipic acid content.
In addition, Table 9 lists the evolution of the glass transition temperature Tg in PBSA samples as they undergo hydrolysis.
Our observed Tg values for the hydrolyzed PBSA samples ranged from −43.38 °C initially, progressively shifting to −38.66 °C. This trend aligns with reported data for PBSA copolymers; for instance, Ahn et al. [77] documented Tg values of −44 °C for an 79/21 (succinic acid/adipic acid) composition, rising to −33 °C for pure poly(butylene succinate) (100/0). Similarly, Perez-Camargo et al. [78] reported Tg values of −43.7 °C for an 80/20 composition and −35.2 °C for the 100/0 variant. The upward shift in Tg with increasing hydrolysis time, as depicted in Table 9, strongly suggests a change in the copolymer’s constituent ratio. This phenomenon is consistent with the understanding that hydrolysis might preferentially cleave certain ester linkages. Such compositional shifts during biodegradation have been previously noted. For example, Baidurah et al. (2012) [79] demonstrated a change in PBSA composition during soil biodegradation, where the butylene adipate (BA) content decreased from 17.8 mol % to 14.5 mol % (or equivalently, butylene succinate (BS) content increased from 82.2 mol % to 85.5 mol) after 28 days.
This observed compositional alteration can also influence crystallinity and degradation rates. Baidurah et al. (2013) [25] found that heat treatment lowered the crystallinity of PBSA from 46.1% to 42.4%, which in turn significantly impacted its weight loss during biodegradation (decreasing from 85.6 wt. % for the less crystalline sample to 31.9 wt. % for the original).
Considering the documented relationships between copolymer composition and Tg by Ahn et al. [77] and Tserki et al. [81,82], our data for the Tg shift from −43.38 °C to −38.66 °C provides compelling evidence of a compositional change. A rough estimation, based on comparative Tg values, suggests that the hydrolysis process in our samples likely led to a shift in the succinic acid/adipic acid ratio from approximately 80/20 to a higher succinic acid content, possibly around 90/10. This indicates a preferential removal of the more flexible adipate units, leaving behind a polymer richer in the stiffer succinate units, which would consequently raise the Tg.
4. Conclusions
In summary, the polymer’s hydrolysis over 64 days at 70 °C profoundly altered its molecular and crystalline characteristics. We observed a significant decrease in molecular weight (Mw) from roughly 103,000 to 16,000 g/mol, accompanied by a notable increase in the polydispersity index (PDI) from 2 to 7. These shifts in molecular structure had a direct and substantial impact on how the material crystallized.
The most striking effect, as revealed by differential scanning calorimetry (DSC), was the dramatic acceleration of isothermal crystallization. At 74 °C, the time required for crystallization plummeted from approximately 3000 s to just 300 s, indicating a 10-fold increase in crystallization speed. This accelerated kinetic behavior was consistently supported by various analytical methods, including the Avrami equation and measurements of reciprocal half-time of crystallization and the slope at the inflection point. For instance, at 64 °C, the inflection point slope rose from 0.00517 to 0.05203, and the reciprocal half-time of crystallization jumped from 0.00587 to 0.05405 s−1 after the 64-day hydrolysis period. Avrami analysis consistently showed a three-dimensional growth mechanism (n ≈ 3). DSC also revealed multiple melting peaks, suggesting the presence of lamellae with various thicknesses, a finding consistent with the Gibbs–Thomson equation. We determined the equilibrium melting temperature using the Hoffman–Weeks plot, and employed the Hoffman–Lauritzen equation to estimate crystallization parameters Kg and ln(G0) through both linearized and non-linear regression. Notably, after isothermal crystallization at 75 °C, the crystallinity derived from melting peaks increased significantly from 34% to 63% following 64 days of hydrolysis.
Microscopic examination using polarized optical microscopy (POM) corroborated the DSC results, showing various spherulitic morphologies, including circular, hexagonal, and flower-like dendritic structures with diamond-shaped ends, which varied depending on crystallization temperature and hydrolysis time.
Wide-angle X-ray diffraction (WAXD) analysis during stepwise cooling provided further insights. The crystallization temperature range shifted to higher temperatures for the hydrolyzed sample (82–71 °C) compared to the unhydrolyzed original sample (72–61 °C). During crystallization, we monitored the d-spacing values using Bragg’s law and determined the crystallite diameter via the Scherrer equation. The crystallite diameter from the largest peak increased from 17.26 nm to 19.69 nm, representing a 14% increase. This observation aligns perfectly with the previously noted increase in melting point and the corresponding increase in lamellar thickness, as described by the Gibbs–Thomson equation. Additionally, a clear increase in overall crystallinity was observed after hydrolysis.
These findings emphasize that hydrolytic degradation significantly alters the crystallization behavior of PBSA, which directly influences key material properties such as mechanical performance, thermal stability, and biodegradability. A deeper understanding of these interrelated changes is crucial for the design of biodegradable polymers with predictable end-of-life behavior. While PBSA is inherently biodegradable, its sustainable application, for instance in compostable packaging or single-use items, requires precise control over its performance throughout its lifecycle. By linking molecular degradation with crystallization kinetics, this study provides a foundation for optimizing PBSA materials for sustainable technologies where controlled degradability, structural integrity, and processability must be balanced.
In addition to compostable packaging, the results of this study may be relevant for other application areas where controlled biodegradability and thermal behavior are critical [83,84,85]. Furthermore, PBSA has potential for biomedical uses, or food-contact disposable items could benefit from insights into its structural and morphological evolution during hydrolysis. The observed changes in crystallinity and molecular weight distribution may also be exploited in the design of biodegradable matrices for controlled release systems. For example, agricultural mulch films made from PBSA offer an eco-friendly alternative to conventional PE mulch [86,87]. PBSA has demonstrated effective soil degradation by Aspergillus isolates and good mechanical properties suitable for field use [88]. Biodegradable mulch films alleviate environmental issues associated with residual plastics and enhance soil health [84].
Additionally, PBSA may be applied in biodegradable matrices for controlled-release systems, such as agrochemical delivery, where the degradation-dependent changes in crystallinity and morphology can modulate release rates—an approach proven effective with other polyesters [89]. Overall, this work supports the broader use of PBSA in environmentally responsive materials where precise control over degradation and mechanical performance is required.
Author Contributions
Writing—original draft, A.S. and P.S.; Supervision, P.S. All authors have read and agreed to the published version of the manuscript.
Funding
This research was funded by Department of Polymer Engineering, Faculty of Technology, Tomas Bata University in Zlin, grant number IGA/FT/2024/008.
Data Availability Statement
The original contributions presented in this study are included in the article. Further inquiries can be directed to the corresponding author.
Conflicts of Interest
The authors declare no conflicts of interest.
References
- Yu, P.J.; Lin, Y.C.; Chen, W.C. Review of bioderived and biodegradable polymers/block-copolymers and their biomedical and electronic applications. Polym. J. 2025, 57, 233–247. [Google Scholar] [CrossRef]
- Malz, F.; Arndt, J.H.; Balko, J.; Barton, B.; Büsse, T.; Imhof, D.; Pfaendner, R.; Rode, K.; Brüll, R. Analysis of the molecular heterogeneity of poly(lactic acid)/poly(butylene succinate-co-adipate) blends by hyphenating size exclusion chromatography with nuclear magnetic resonance and infrared spectroscopy. J. Chromatogr. A 2021, 1638, 461819. [Google Scholar] [CrossRef] [PubMed]
- Zhang, C.H.; Chen, C.; Ouyang, C.P.; Zeng, X.B.; Guo, Z.L.; Lai, F.H.; Li, J.J. Analysis of oligomers in poly (butylene succinate) and poly (butylene adipate-co-terephthalate). Polym. Bull. 2023, 80, 4487–4502. [Google Scholar] [CrossRef]
- Cicogna, F.; Passaglia, E.; Telleschi, A.; Oberhauser, W.; Coltelli, M.B.; Panariello, L.; Gigante, V.; Coiai, S. New Functional Bionanocomposites by Combining Hybrid Host-Guest Systems with a Fully Biobased Poly(lactic acid)/Poly(butylene succinate-co-adipate) (PLA/PBSA) Binary Blend. J. Funct. Biomater. 2023, 14, 549. [Google Scholar] [CrossRef]
- Sabalina, A.; Platnieks, O.; Gaidukova, G.; Aunins, A.; Eiduks, T.V.; Gaidukovs, S. Thermomechanical and mechanical analysis of polylactic acid/polyhydroxyalkanoate/poly(butylene succinate-adipate) binary and ternary blends. RSC Adv. 2025, 15, 501–512. [Google Scholar] [CrossRef]
- Nath, D.; Misra, M.; Al-Daoud, F.; Mohanty, A.K. Studies on poly(butylene succinate) and poly(butylene succinate-adipate)-based biodegradable plastics for sustainable flexible packaging and agricultural applications: A comprehensive review. RSC Sustain. 2025, 3, 1267–1302. [Google Scholar] [CrossRef]
- Sabet, M. Exploring biodegradable polymer composites for sustainable packaging: A review on properties, manufacturing techniques, and environmental impacts. Iran. Polym. J. 2025, 34, 123–142. [Google Scholar] [CrossRef]
- Olivieri, F.; Capuano, R.; Pirozzi, A.; Castaldo, R.; Avolio, R.; Errico, M.E.; Licini, C.; Garzoli, S.; Spigno, G.; Donsì, F.; et al. Poly(butylene succinate-adipate)/Croatina Grape Skin Biocomposites with Antioxidant Properties and Enhanced Biodegradation Rate. ACS Sustain. Chem. Eng. 2025, 13, 5121–5130. [Google Scholar] [CrossRef]
- Wang, J.M.; Wang, H.; Chen, E.C.; Chen, Y.J.; Wu, T.M. Role of Organically-Modified Zn-Ti Layered Double Hydroxides in Poly(Butylene Succinate-Co-Adipate) Composites: Enhanced Material Properties and Photodegradation Protection. Polymers 2021, 13, 2181. [Google Scholar] [CrossRef] [PubMed]
- Coiai, S.; Di Lorenzo, M.L.; Cinelli, P.; Righetti, M.C.; Passaglia, E. Binary Green Blends of Poly(lactic acid) with Poly(butylene adipate-butylene terephthalate) and Poly(butylene succinate-butylene adipate) and Their Nanocomposites. Polymers 2021, 13, 2489. [Google Scholar] [CrossRef]
- Aliotta, L.; Vannozzi, A.; Cinelli, P.; Coltelli, M.B.; Lazzeri, A. Essential Work of Fracture and Evaluation of the Interfacial Adhesion of Plasticized PLA/PBSA Blends with the Addition of Wheat Bran By-Product. Polymers 2022, 14, 615. [Google Scholar] [CrossRef] [PubMed]
- Le Delliou, B.; Vitrac, O.; Castro, M.; Bruzaud, S.; Domenek, S. Characterization of a new bio-based and biodegradable blends of poly(3-hydroxybutyrate-co-3-hydroxyvalerate) and poly(butylene-co-succinate-co-adipate). J. Appl. Polym. Sci. 2022, 139, 52124. [Google Scholar] [CrossRef]
- Genovesi, A.; Aversa, C.; Barletta, M.; Cappiello, G.; Lignola, C. Role of wood flour on processability of marine biodegradable poly (3-hydroxybutyrate-co-3-hydroxyhexanoate) (PHBH)/poly(butylene succinate-co-butylene adipate) (PBSA) blends in cast extrusion and thermoforming of take-away food containers. J. Appl. Polym. Sci. 2023, 140, e54346. [Google Scholar] [CrossRef]
- Zeng, J.-B.; Huang, C.-L.; Jiao, L.; Lu, X.; Wang, Y.-Z.; Wang, X.-L. Synthesis and Properties of Biodegradable Poly(butylene succinate-co-diethylene glycol succinate) Copolymers. Ind. Eng. Chem. Res. 2012, 51, 12258–12265. [Google Scholar] [CrossRef]
- Cho, K.; Lee, J.; Kwon, K. Hydrolytic degradation behavior of poly(butylene succinate)s with different crystalline morphologies. J. Appl. Polym. Sci. 2001, 79, 1025–1033. [Google Scholar] [CrossRef]
- Ye, H.B.; Li, Q.Y.; Li, J.; Li, D.D.; Ao, Z.M. Review on the abiotic degradation of biodegradable plastic poly(butylene adipate-terephthalate): Mechanisms and main factors of the degradation. Chin. Chem. Lett. 2025, 36, 109861. [Google Scholar] [CrossRef]
- Yao, X.; Yang, X.; Lu, Y.S.; Qiu, Y.Y.; Zeng, Q.D. Review of the Synthesis and Degradation Mechanisms of Some Biodegradable Polymers in Natural Environments. Polymers 2025, 17, 66. [Google Scholar] [CrossRef]
- Vargas-Estrada, L.; García-Depraect, O.; Zimmer, J.; Muñoz, R. Analysis of biological treatment technologies, their present infrastructures and suitability for biodegradable food packaging—A review. J. Environ. Manag. 2025, 376, 124395. [Google Scholar] [CrossRef] [PubMed]
- Tang, K.H.D.; Zhou, J. Ecotoxicity of Biodegradable Microplastics and Bio-based Microplastics: A Review of in vitro and in vivo Studies. Environ. Manag. 2025, 75, 663–679. [Google Scholar] [CrossRef]
- Mahpuz, A.S.A.; Sanusi, N.A.S.M.; Jusoh, A.N.C.; Amin, N.J.M.; Musa, N.F.; Sarabo, Z.; Othman, N.Z. Manifesting sustainable food packaging from biodegradable materials: A review. Environ. Qual. Manag. 2022, 32, 379–396. [Google Scholar] [CrossRef]
- Muthuraj, R.; Misra, M.; Mohanty, A.K. Hydrolytic degradation of biodegradable polyesters under simulated environmental conditions. J. Appl. Polym. Sci. 2015, 132, 42189. [Google Scholar] [CrossRef]
- Svarcova, A.; Dvorackova, M.; Svoboda, P. Influence of Hydrolysis on Non-Isothermal Crystallization of Poly(Butylene Succinate-Co-Adipate) (PBSA). Molecules 2025, 30, 2252. [Google Scholar] [CrossRef]
- Bikiaris, D.N.; Papageorgiou, G.Z.; Achilias, D.S. Synthesis and comparative biodegradability studies of three poly(alkylene succinate)s. Polym. Degrad. Stabil. 2006, 91, 31–43. [Google Scholar] [CrossRef]
- Tsuji, H.; Okumura, A. Crystallization and hydrolytic/thermal degradation of a novel stereocomplexationable blend of poly(L-2-hydroxybutyrate) and poly(D-2-hydroxybutyrate). Polym. J. 2011, 43, 317–324. [Google Scholar] [CrossRef]
- Baidurah, S.; Takada, S.; Shimizu, K.; Ishida, Y.; Yamane, T.; Ohtani, H. Evaluation of biodegradation behavior of poly(butylene succinate-co-butylene adipate) with lowered crystallinity by thermally assisted hydrolysis and methylation-gas chromatography. J. Anal. Appl. Pyrol. 2013, 103, 73–77. [Google Scholar] [CrossRef]
- Jenkins, M.J.; Harrison, K.L. The effect of molecular weight on the crystallization kinetics of polycaprolactone. Polym. Advan. Technol. 2006, 17, 474–478. [Google Scholar] [CrossRef]
- Mochizuki, M.; Hirami, M. Structural Effects on the Biodegradation of Aliphatic Polyesters. Polym. Advan. Technol. 1997, 8, 203–209. [Google Scholar] [CrossRef]
- Tsuji, H.; Miyauchi, S. Poly(l-lactide): VI Effects of crystallinity on enzymatic hydrolysis of poly(l-lactide) without free amorphous region. Polym. Degrad. Stabil. 2001, 71, 415–424. [Google Scholar] [CrossRef]
- Yang, H.Y.; Qiu, Z.B. Crystallization Kinetics and Morphology of Novel Biodegradable Poly(hexamethylene succinate-co-3 mol % ethylene succinate) with Low and High Molecular Weights. Ind. Eng. Chem. Res. 2013, 52, 3537–3542. [Google Scholar] [CrossRef]
- Yang, J.J.; Pan, P.J.; Dong, T.; Inoue, Y. Crystallization kinetics and crystalline structure of biodegradable Poly(ethylene adipate). Polymer 2010, 51, 807–815. [Google Scholar] [CrossRef]
- Wang, Y.M.; Mano, J.F. Banded spherulites in poly(L-lactic acid): Effects of the crystallization temperature and molecular weight. J. Appl. Polym. Sci. 2007, 105, 3500–3504. [Google Scholar] [CrossRef]
- Hoffman, J.D. Role of Reptation in the Rate of Crystallization of Polyethylene Fractions from the Melt. Polymer 1982, 23, 656–670. [Google Scholar] [CrossRef]
- Hoffman, J.D.; Miller, R.L. Test of the Reptation Concept—Crystal-Growth Rate as a Function of Molecular-Weight in Polyethylene Crystallized from the Melt. Macromolecules 1988, 21, 3038–3051. [Google Scholar] [CrossRef]
- Avella, M.; Dellerba, R.; Martuscelli, E. Fiber reinforced polypropylene: Influence of IPP molecular weight on morphology, crystallization, and thermal and mechanical properties. Polym. Compos. 1996, 17, 288–299. [Google Scholar] [CrossRef]
- Skoglund, P.; Fransson, A. Continuous cooling and isothermal crystallization of polycaprolactone. J. Appl. Polym. Sci. 1996, 61, 2455–2465. [Google Scholar] [CrossRef]
- Alizadeh, A.; Sohn, S.; Quinn, J.; Marand, H.; Shank, L.C.; Iler, H.D. Influence of structural and topological constraints on the crystallization and melting behavior of polymers: 3. Bisphenol A polycarbonate. Macromolecules 2001, 34, 4066–4078. [Google Scholar] [CrossRef]
- Chae, H.G.; Kim, B.C.; Im, S.S.; Han, Y.K. Effect of molecular weight and branch structure on the crystallization and rheological properties of poly(butylene adipate). Polym. Eng. Sci. 2001, 41, 1133–1139. [Google Scholar] [CrossRef]
- Chen, X.D.; Hou, G.; Chen, Y.J.; Yang, K.; Dong, Y.P.; Zhou, H. Effect of molecular weight on crystallization, melting behavior and morphology of poly(trimethylene terephalate). Polym. Test. 2007, 26, 144–153. [Google Scholar] [CrossRef]
- He, Y.; Fan, Z.Y.; Hu, Y.F.; Wu, T.; Wei, J.; Li, S.M. DSC analysis of isothermal melt-crystallization, glass transition and melting behavior of poly(L-lactide) with different molecular weights. Eur. Polym. J. 2007, 43, 4431–4439. [Google Scholar] [CrossRef]
- Papageorgiou, G.Z.; Bikiaris, D.N.; Achilias, D.S. Effect of molecular weight on the cold-crystallization of biodegradable poly(ethylene succinate). Thermochim. Acta 2007, 457, 41–54. [Google Scholar] [CrossRef]
- Wang, Y.M.; Bhattacharya, M.; Mano, J.F. Thermal analysis of the multiple melting behavior of poly(butylene succinate-adipate). J. Polym. Sci. Pol. Phys. 2005, 43, 3077–3082. [Google Scholar] [CrossRef]
- Hoffman, J.D.; Weeks, J.J. X-Ray Study of Isothermal Thickening of Lamellae in Bulk Polyethylene at Crystallization Temperature. J. Chem. Phys. 1965, 42, 4301–4302. [Google Scholar] [CrossRef]
- Svoboda, P.; Trivedi, K.; Stoklasa, K.; Svobodova, D.; Ougizawa, T. Study of crystallization behaviour of electron beam irradiated polypropylene and high-density polyethylene. R. Soc. Open. Sci. 2021, 8, 202250. [Google Scholar] [CrossRef]
- Zhao, L.F.; Tian, X.J.; Liu, X.; He, H.F.; Zhang, J.; Zhang, R.L. Miscibility and Isothermal Crystallization Behavior of Poly (Butylene Succinate-co-Adipate) (PBSA)/Poly (Trimethylene Carbonate) (PTMC) Blends. J. Macromol. Sci. B 2016, 55, 591–604. [Google Scholar] [CrossRef]
- Hoffman, J.D.; Frolen, L.J.; Ross, G.S.; Lauritzen, J.I. On the growth rate of spherulites and axialites from the melt in polyethylene fractions: Regime I and regime II crystallization. J. Res. Natl. Bur. Stand. Sect. A Phys. Chem. 1975, 79, 671–699. [Google Scholar] [CrossRef]
- Si, P.F.; Luo, F.L. Hydrogen bonding interaction and crystallization behavior of poly (butylene succinate-co-butylene adipate)/thiodiphenol complexes. Polym. Advan. Technol. 2016, 27, 1413–1421. [Google Scholar] [CrossRef]
- Qiu, S.T.; Qiu, Z.B. Crystallization kinetics and morphology of poly(ethylene suberate). J. Appl. Polym. Sci. 2016, 133, 43086. [Google Scholar] [CrossRef]
- Yamada, K.; Hikosaka, M.; Toda, A.; Yamazaki, S.; Tagashira, K. Equilibrium melting temperature of isotactic polypropylene with high tacticity: 1. Determination by differential scanning calorimetry. Macromolecules 2003, 36, 4790–4801. [Google Scholar] [CrossRef]
- Nie, W.C.; Xiao, Q.; Wu, J.M.; Song, F.; Wang, X.L.; Wang, Y.Z. Dendritic crystallization and morphology control of random poly(p-dioxanone-co-butylene-co-succinate) copolyesters. Eur. Polym. J. 2018, 108, 76–84. [Google Scholar] [CrossRef]
- Qiu, S.T.; Su, Z.Q.; Qiu, Z.B. Crystallization Kinetics, Morphology, and Mechanical Properties of Novel Biodegradable Poly(ethylene succinate-co-ethylene suberate) Copolyesters. Ind. Eng. Chem. Res. 2016, 55, 10286–10293. [Google Scholar] [CrossRef]
- Xue, P.; Qiu, Z.B. Synthesis, thermal properties, and crystallization kinetics of novel biodegradable poly(ethylene succinate-co-diethylene glycol succinate) copolyesters. Thermochim. Acta 2015, 606, 45–52. [Google Scholar] [CrossRef]
- Liu, G.C.; Zeng, J.B.; Huang, C.L.; Jiao, L.; Wang, X.L.; Wang, Y.Z. Crystallization Kinetics and Spherulitic Morphologies of Biodegradable Poly(butylene succinate-co-diethylene glycol succinate) Copolymers. Ind. Eng. Chem. Res. 2013, 52, 1591–1599. [Google Scholar] [CrossRef]
- Yang, Y.; Qiu, Z.B. Crystallization kinetics and morphology of biodegradable poly(butylene succinate-co-ethylene succinate) copolyesters: Effects of comonomer composition and crystallization temperature. Crystengcomm 2011, 13, 2408–2417. [Google Scholar] [CrossRef]
- Papageorgiou, G.Z.; Bikiaris, D.N. Synthesis, cocrystallization, and enzymatic degradation of novel poly(butylene-co-propylene succinate) copolymers. Biomacromolecules 2007, 8, 2437–2449. [Google Scholar] [CrossRef]
- Li, H.H.; Nagarajan, S.; Chuang, W.T.; Tsai, Y.W.; Woo, E.M. Microscopic and Small-/Wide-Angle Microbeam X-ray Analyses on Dendritic Crystals in Poly(butylene succinate). Macromolecules 2023, 56, 1471–1480. [Google Scholar] [CrossRef]
- Woo, E.M.; Lugito, G.; Nagarajan, S. Dendritic polymer spherulites: Birefringence correlating with lamellae assembly and origins of superimposed ring bands. J. Polym. Res. 2019, 27, 7. [Google Scholar] [CrossRef]
- Siti, N.; Woo, E.M.; Yeh, Y.T.; Luo, F.L.; Katiyar, V. Lamellae Assembly in Dendritic Spherulites of Poly(L-lactic Acid) Crystallized with Poly(p-Vinyl Phenol). Polymers 2018, 10, 545. [Google Scholar] [CrossRef]
- Liu, X.H.; Dai, K.; Hao, X.Q.; Zheng, G.Q.; Liu, C.T.; Schubert, D.W.; Shen, C.Y. Crystalline Structure of Injection Molded β-Isotactic Polypropylene: Analysis of the Oriented Shear Zone. Ind. Eng. Chem. Res. 2013, 52, 11996–12002. [Google Scholar] [CrossRef]
- Chen, Y.A.; Tsai, G.S.; Chen, E.C.; Wu, T.M. Crystallization behaviors and microstructures of poly(butylene succinate-co-adipate)/modified layered double hydroxide nanocomposites. J. Mater. Sci. 2016, 51, 4021–4030. [Google Scholar] [CrossRef]
- Moitzi, J.; Skalicky, P. Shear-Induced Crystallization of Isotactic Polypropylene Melts—Isothermal Waxs Experiments with Synchrotron-Radiation. Polymer 1993, 34, 3168–3172. [Google Scholar] [CrossRef]
- Baldrian, J.; Steinhart, M.; Vlcek, P.; Horky, M.; Laggner, P.; Amenitsch, H.; Bernstorff, S. Time-resolved SAXS/WAXS study of phase behavior and crystallization in polymer blends. J. Macromol. Sci. Phys. 2002, 41, 1023–1032. [Google Scholar] [CrossRef]
- Cho, J.D.; Baratian, S.; Kim, J.; Yeh, F.J.; Hsiao, B.S.; Runt, J. Crystallization and structure formation of poly(L-lactide-lactide) random copolymers: A time-resolved wide- and small-angle X-ray scattering study. Polymer 2003, 44, 711–717. [Google Scholar] [CrossRef]
- Pérez, E.; Todorova, G.; Krasteva, M.; Pereña, J.M.; Bello, A.; Marugán, M.M.; Shlouf, M. Structure and phase transitions of poly(heptamethylene-bibenzoate):: Time-resolved synchrotron WAXS and DSC studies. Macromol. Chem. Phys. 2003, 204, 1791–1799. [Google Scholar] [CrossRef]
- Chen, P.Z.; Zhao, J.Y.; Lin, Y.F.; Chang, J.R.; Meng, L.P.; Wang, D.L.; Chen, W.; Chen, L.; Li, L.B. In-situ characterization of strain-induced crystallization of natural rubber by synchrotron radiation wide-angle X-ray diffraction: Construction of a crystal network at low temperatures. Soft Matter 2019, 15, 734–743. [Google Scholar] [CrossRef]
- Conceiçao, P.C.G.; Lemos, P.V.F.; Santana, J.S.; Correia, P.R.C.; Cardoso, L.G.; Assis, D.D.; da Rocha, L.P.G.; Marcelino, H.R.; Ferreira, E.D.; da Silva, J.B.A.; et al. Characterization of extruded films based on poly (butylene succinate) blends to utilize a partially degraded poly (butylene adipate-co-terephthalate). J. Appl. Polym. Sci. 2024, 141, e55289. [Google Scholar] [CrossRef]
- Rungswang, W.; Jarumaneeroj, C.; Jirasukho, P.; Juabrum, S.; Pakawanit, P.; Soontaranon, S.; Rugmai, S. Time-Resolved SAXS/WAXD under Tensile Deformation: Role of Segmental Ethylene-Propylene Copolymers in Impact-Resistant Polypropylene Copolymers. ACS Appl. Polym. Mater. 2021, 3, 6394–6406. [Google Scholar] [CrossRef]
- Saengbunkoet, S.; Kerddonfag, N.; Puekpoonpoal, N.; Kumsang, P.; Yoksan, R.; Jariyasakoolroj, P. Structural evolution and related physical properties of machine direction oriented poly(butylene succinate-co-adipate) films. Polymer 2022, 249, 124859. [Google Scholar] [CrossRef]
- Chen, Y.H.; Zhong, G.J.; Lei, J.; Li, Z.M.; Hsiao, B.S. In Situ Synchrotron X-ray Scattering Study on Isotactic Polypropylene Crystallization under the Coexistence of Shear Flow and Carbon Nanotubes. Macromolecules 2011, 44, 8080–8092. [Google Scholar] [CrossRef]
- Cai, L.M.; Bai, Y.J.; Shi, Y.C. Study on melting and crystallization of short-linear chains from debranched waxy starches by synchrotron wide-angle X-ray diffraction. J. Cereal Sci. 2012, 55, 373–379. [Google Scholar] [CrossRef]
- Sato, H.; Suttiwijitpukdee, N.; Hashimoto, T.; Ozaki, Y. Simultaneous Synchrotron SAXS/WAXD Study of Composition Fluctuations, Cold-Crystallization, and Melting in Biodegradable Polymer Blends of Cellulose Acetate Butyrate and Poly(3-hydroxybutyrate). Macromolecules 2012, 45, 2783–2795. [Google Scholar] [CrossRef]
- Dong, P.; Lin, L.; Li, Y.C.; Huang, Z.W.; Lang, T.Q.; Wu, C.B.; Lu, M. In-situ synchrotron wide-angle X-ray diffraction as a rapid method for cocrystal/salt screening. Int. J. Pharmaceut. 2015, 496, 107–116. [Google Scholar] [CrossRef]
- Slusarczyk, C. Crystallization and melting behavior of poly(ethylene oxide) and its blend with styrene-based ionomer using time-resolved SAXS/WAXS experiments. Radiat. Phys. Chem. 2011, 80, 1078–1083. [Google Scholar] [CrossRef]
- Wang, M.F.; Cao, W.Y. Phase Transition and Melt-Recrystallization Behavior of Poly(Butylene Adipate) Investigated by Simultaneous Measurements of Wide-Angle X-Ray Diffraction (WAXD) and Differential Scanning Calorimetry (DSC). Polymers 2020, 12, 75. [Google Scholar] [CrossRef] [PubMed]
- Wasanasuk, K.; Tashiro, K. Structural Regularization in the Crystallization Process from the Glass or Melt of Poly(L-lactic Acid) Viewed from the Temperature-Dependent and Time-Resolved Measurements of FTIR and Wide-Angle/Small-Angle X-ray Scatterings. Macromolecules 2011, 44, 9650–9660. [Google Scholar] [CrossRef]
- Yousfi, M.; Soulestin, J.; Marcille, S.; Lacrampe, M.F. In-situ nano-fibrillation of poly(butylene succinate-co-adipate) in isosorbide-based polycarbonate matrix. Relationship between rheological parameters and induced morphological and mechanical properties. Polymer 2021, 217, 123445. [Google Scholar] [CrossRef]
- Lindstrom, A.; Albertsson, A.C.; Hakkarainen, M. Development of a solid-phase extraction method for simultaneous extraction of adipic acid, succinic acid and 1,4-butanediol formed during hydrolysis of poly(butylene adipate) and poly(butylene succinate). J. Chromatogr. A 2004, 1022, 171–177. [Google Scholar] [CrossRef]
- Ahn, B.D.; Kim, S.H.; Kim, Y.H.; Yang, J.S. Synthesis and characterization of the biodegradable copolymers from succinic acid and adipic acid with 1,4-butanediol. J. Appl. Polym. Sci. 2001, 82, 2808–2826. [Google Scholar] [CrossRef]
- Perez-Camargo, R.K.; Fernandez-d’Arlas, B.; Cavallo, D.; Debuissy, T.; Pollet, E.; Averous, L.; Muller, A.J. Tailoring the Structure, Morphology, and Crystallization of Isodimorphic Poly(butylene succinate-ran-butylene adipate) Random Copolymers by Changing Composition and Thermal History. Macromolecules 2017, 50, 597–608. [Google Scholar] [CrossRef]
- Baidurah, S.; Takada, S.; Shimizu, K.; Yasue, K.; Arimoto, S.; Ishida, Y.; Yamane, T.; Ohtani, H. Evaluation of Biodegradability of Poly(Butylene Succinate-Butylene Adipate) on the Basis of Copolymer Composition Determined by Thermally Assisted Hydrolysis and Methylation-Gas Chromatography. Int. J. Polym. Anal. Charact. 2012, 17, 29–37. [Google Scholar] [CrossRef]
- Marten, E.; Müller, R.J.; Deckwer, W.D. Studies on the enzymatic hydrolysis of polyesters I.: Low molecular mass model esters and aliphatic polyesters. Polym. Degrad. Stabil. 2003, 80, 485–501. [Google Scholar] [CrossRef]
- Tserki, V.; Matzinos, P.; Pavlidou, E.; Panayiotou, C. Biodegradable aliphatic polyesters.: Part II.: Synthesis and characterization of chain extended poly(butylene succinate-butylene adipate). Polym. Degrad. Stabil. 2006, 91, 377–384. [Google Scholar] [CrossRef]
- Tserki, V.; Matzinos, P.; Pavlidou, E.; Vachliotis, D.; Panayiotou, C. Biodegradable aliphatic polyesters. Part I. Properties and biodegradation of poly(butylene succinate-co-butylene adipate). Polym. Degrad. Stabil. 2006, 91, 367–376. [Google Scholar] [CrossRef]
- Zhang, H.; Shu, D.; Zhang, J.; Liu, X.; Wang, K.; Jiang, R. Biodegradable film mulching increases soil microbial network complexity and decreases nitrogen-cycling gene abundance. Sci. Total. Environ. 2024, 933, 172874. [Google Scholar] [CrossRef]
- Song, Z.; Zhao, L.; Bi, J.; Tang, Q.; Wang, G.; Li, Y. Classification of Degradable Mulch Films and Their Promotional Effects and Limitations on Agricultural Production. Agriculture 2024, 14, 1235. [Google Scholar] [CrossRef]
- Bandopadhyay, S.; Sintim, H.; DeBruyn, J. Effects of biodegradable plastic film mulching on soil microbial communities in two agroecosystems. PeerJ 2020, 8, e9015. [Google Scholar] [CrossRef]
- Liu, X.; Wen, Z.; Zhou, W.; Dong, W.; Ren, H.; Liang, G.; Gong, W. Effect of Multiyear Biodegradable Plastic Mulch on Soil Microbial Community, Assembly, and Functioning. Microorganisms 2025, 13, 259. [Google Scholar] [CrossRef]
- Romano, I.; Ventorino, V.; Schettino, M.; Magaraci, G.; Pepe, O. Changes in Soil Microbial Communities Induced by Biodegradable and Polyethylene Mulch Residues Under Three Different Temperatures. Microb. Ecol. 2024, 87, 101. [Google Scholar] [CrossRef] [PubMed]
- Chien, H.L.; Tsai, Y.T.; Tseng, W.S.; Wu, J.A.; Kuo, S.L.; Chang, S.L.; Huang, S.J.; Liu, C.T. Biodegradation of PBSA Films by Elite Isolates and Farmland Soil. Polymers 2022, 14, 1320. [Google Scholar] [CrossRef]
- Kamaly, N.; Yameen, B.; Wu, J.; Farokhzad, O.C. Degradable Controlled-Release Polymers and Polymeric Nanoparticles: Mechanisms of Controlling Drug Release. Chem. Rev. 2016, 116, 2602–2663. [Google Scholar] [CrossRef]
Disclaimer/Publisher’s Note: The statements, opinions and data contained in all publications are solely those of the individual author(s) and contributor(s) and not of MDPI and/or the editor(s). MDPI and/or the editor(s) disclaim responsibility for any injury to people or property resulting from any ideas, methods, instructions or products referred to in the content. |
© 2025 by the authors. Licensee MDPI, Basel, Switzerland. This article is an open access article distributed under the terms and conditions of the Creative Commons Attribution (CC BY) license (https://creativecommons.org/licenses/by/4.0/).