Article

Low-Cycle Fatigue Behavior of Nuclear-Grade Austenitic Stainless Steel Fabricated by Additive Manufacturing

1
Yangjiang Nuclear Power Co., Ltd., Yangjiang 529599, China
2
Suzhou Nuclear Power Research Institute, Suzhou 215004, China
3
National Engineering Research Center for Nuclear Power Plant Safety & Reliability, Suzhou 215004, China
4
Beijing Advanced Innovation Center for Materials Genome Engineering, Institute of Advanced Materials and Technology, University of Science and Technology Beijing, Beijing 100083, China
*
Author to whom correspondence should be addressed.
Crystals 2025, 15(7), 644; https://doi.org/10.3390/cryst15070644
Submission received: 17 June 2025 / Revised: 8 July 2025 / Accepted: 9 July 2025 / Published: 13 July 2025

Abstract

The application of additive manufacturing technology in the field of nuclear power is becoming increasingly promising. The low-cycle fatigue behavior of Z2CN19-10 controlled-nitrogen-content stainless steel (SS) was investigated by fatigue equipment, scanning electron microscopy (SEM), electron backscatter diffraction (EBSD), and transmission electron microscopy (TEM), including additive manufactured (AM) and forged materials. The results showed that the microstructure of the AM material exhibited anisotropy for the X, Y, and Z directions. The tensile and impact properties of the X, Y, and Z directions in AM material were similar. The fatigue life (Nf) of X- and Y-direction specimens was better than that of Z-direction specimens. The tensile, impact, and fatigue properties of all AM materials were lower than those of the forged specimens. The Z direction specimens of AM material showed the best plastic strain by the highest transition fatigue life (NT) during the fatigue strain amplitude at 0.3% to 0.6%. The forged specimens showed the best fatigue properties under the plastic strain amplitude control mode. Fatigue fracture surfaces of AM and forged materials exhibited multi- and single-fatigue crack initiation sites, respectively. This could be attributed to the presence of incompletely melted particles and manufacturing defects inside the AM specimens. The dislocation morphology of AM and forged fatigue specimens was observed to study the low-cycle fatigue behaviors in depth.

1. Introduction

Austenitic stainless steel (SS) exhibits high strength, excellent corrosion resistance, and neutron irradiation resistance. It is extensively applied in nuclear reactor systems exposed to extreme service conditions [1,2,3]. As a representative example, Z2CN19-10 controlled-nitrogen-content SS is widely used in critical components, such as system pipelines, valve assemblies, connection fasteners, and so on. The application of conventional manufacturing processes to fabricate metallic components faces multifaceted challenges compared to additive manufacturing (AM), such as difficulties in forming complex geometric structures, excessively high mold development costs, and prolonged production cycles. These issues collectively render the material inadequate to meet future differentiated service requirements of nuclear power equipment under multiple demands.
AM provides innovative solutions for the application of metallic materials. Leveraging its high design flexibility and layer-by-layer fabrication characteristics, AM technology overcomes the geometric limitations of conventional manufacturing techniques. This approach significantly reduces stress concentrations and leakage risks associated with assembly processes during the fabrication of critical components of pipeline systems [4]. It is particularly noteworthy that Wire Arc Additive Manufacturing (WAAM) technology has great potential for application in the field of nuclear power due to its rapid response advantages, especially for large-scale components [5]. This makes it particularly suited for emergency component replacements during nuclear power plant overhauls and the production of small-batch complex structural parts. This capability effectively shortens reactor downtime and reduces operational and maintenance costs.
Under long-term cyclic loading conditions of nuclear power equipment components, fatigue performance is a critical factor in ensuring their safe and reliable operation [6]. Due to non-uniform temperature field distributions and the cooling rate variations inherent to additive manufacturing processes, metallic components exhibit intrinsic defects such as anisotropy, heterogeneous microstructures, residual stress concentrations, and internal porosity [7]. These defects not only significantly degrade the material’s fatigue performance but also substantially increase the technical complexity of its performance evaluation.
Extensive research on the fatigue performance of AM material has been conducted [8,9,10], including studies on fatigue life prediction, fatigue crack propagation rates, the influence of residual stress, differences from forged materials, etc. Gordon et al. [11] analyzed the fatigue crack growth rate in horizontal and vertical directions of 304L SS fabricated using WAAM. The vertical orientations showed the greatest crack growth resistance. Li et al. [12] analyzed the fatigue properties of WAAM 308L SS and compared them with those of hot-rolled materials. Three different, critical, plane-based fatigue life prediction criteria were applied to assess all fatigue data and determine the optimal model. Muhammad et al. [13] demonstrated that stress relief treatment effectively enhanced the fatigue resistance of laser powder-bed fusion (LPBF) Inconel 718 alloy. Ali Alhajeri et al. [14] developed a fatigue performance prediction methodology for LPBF steel by integrating modeling and experiments. V. Ajay et al. [15] revealed that WAAM 316L SS exhibited comparable fatigue crack growth rates in the build and transverse directions, while it showed higher crack growth resistance in the diagonal direction. Researchers have revealed a series of important results through a variety of preparation processes and testing methods [16,17,18]. Nevertheless, there is still a lack of comprehensive and in-depth systematic research regarding the fatigue behavior of AM austenitic SS. The evaluation of its service performance lacks conclusive consensus, and the fatigue fracture mechanisms urgently require explicit elucidation.
In this study, a systematic investigation was conducted on the fatigue behavior of AM Z2CN19-10 controlled-nitrogen-content SS, and related forged materials were studied accordingly. The fatigue fracture mechanisms of both materials were clarified and the cyclic stress–strain response curves, stress–strain relationships, and strain–life relationships were explored. Moreover, fatigue fractures and dislocation densities were analyzed.

2. Materials and Methods

2.1. Materials

The raw material of WAAM used for the target material Z2CN19-10 controlled-nitrogen-content SS was nuclear-grade ER308L wire with a diameter of 1.2 mm. The electric arc was used as the heat source. AM materials were prone to forming severe incomplete fusion defects, which are affected by the synergistic effect of process parameters. Through systematic non-destructive testing and physicochemical analysis, this study determined the optimal process parameters. The control working current and voltage were 160 A and 20 V, respectively. During the printing process, the walking speed was 400 to 600 mm/s, and the wire feeding speed was 5.5 to 7.2 m/min. The shielding gas mixture was 97.5% Ar and 2.5% CO2 with a flow rate of 20 L/min. The interlayer surface grinding treatment was implemented. An orthogonal scanning strategy was adopted for cross-stacking. The size of the final component was approximately 200 × 135 × 70 mm. The long, short and vertical sides were defined as the X, Y, and Z directions, respectively (Figure 1). The conventional material was processed via forging, with a blank size of 300 × 300 × 30 mm and a forging temperature of 1050 °C. The solid solution treatment condition was holding at 1050 °C for 120 min. The chemical compositions of the AM and forged materials were analyzed using a PMI—MASTER Smart spark direct—reading spectrometer, as shown in Table 1. Both chemical compositions met the requirement of the RCC-M standard [19].

2.2. Methods

The tensile tests were performed at room temperature using a Shimadzu AG-IS 30 kN electronic universal testing machine (it is produced by Shimadzu Corporation in Kyoto, Japan). The tests were conducted under strain rate controlled mode in accordance with the national standard GB/T 228.1-2021 [20]. For the impact tests, the instrument Zwick RKP 450 pendulum impact testing machine (it is produced by ZwickRoell Corporation in Neuenhauser, Germany) was employed in accordance with GB/T 229-2020 [21]. The V-notch specimens were used, and the impact energy was 450 J. The standard fatigue specimens were used for testing both AM and forged materials, as shown in Figure 2. The fatigue test was carried out on a 500 kN MTS Landmark 370 electro-hydraulic servo fatigue testing machine (it is produced by MTS Corporation in Eden Prairie, MN, USA) at room temperature. Low-cycle fatigue tests were conducted in strain controlled mode [22].
In this study, both the specimen preparation and testing methods complied with the ASTM E606 standard [23]. Fatigue tests were performed with duplicate specimens at five strain amplitudes. Specifically, 10 tests were applied in forged materials and each direction (X, Y, Z) of AM materials. The loading waveform and strain rate were set to triangular wave and 0.5%/s. The surface finish of the specimens was maintained below 0.2 μm. This ensured that premature fatigue cracks would not initiate prematurely from surface defects. Based on the symmetric tensile–compression cyclic loading pattern common in low-cycle fatigue testing, the loading ratio was selected as −1. The fatigue life was defined as the cycle when the fatigue loading decreased 30% compared to its maximum value during the test. During initial loading cycles, the loading did not reach the preset value instantaneously. Typically, five loading cycles were required to accurately attain the preset strain.
A ZEISS Sigma300 field emission scanning electron microscope (SEM) equipped with an Oxford EBSD detector (it is produced by Carl Zeiss AG in Oberkochen, Germany) was employed to characterize the microstructure, electron backscatter diffraction (EBSD) and fatigue fracture morphology. Samples for SEM and EBSD analysis were extracted from the central regions of AM materials to avoid boundary effects. Before metallographic observation, the samples underwent mechanical grinding and polishing, and aqua regia was utilized as the etchant. For EBSD samples, they were ground with sandpaper, followed by electrolytic polishing using a 10% perchloric acid solution as the electrolyte. The scanning step size was set to 1 μm. A JEM-F200 field emission transmission electron microscope (TEM) was employed to analyze the dislocations in the fatigue crack propagation zone. The TEM lamella samples were prepared with Helios 600 Nanolab double-beam focus ion beam systems (it is produced by FEI Company in Hillsboro, USA) using the lift-out method.

3. Results and Discussion

3.1. Microstructure and Mechanical Properties

3.1.1. Microstructure

Figure 3 shows the microstructure of Z2CN19-10 controlled-nitrogen-content SS of forged and AM materials. In Figure 3a, the microstructure of the forged material consisted of austenite and lath ferrite phases, and the ferrite was uniformly distributed. In Figure 3b–d, the microstructure of AM material was also composed of austenite matrix with ferrite phase. The ferrite phase was distributed as dispersed particles in the austenitic matrix. Columnar crystals preferentially grew along the Z direction due to the higher cooling rate perpendicular to the fusion line [24].
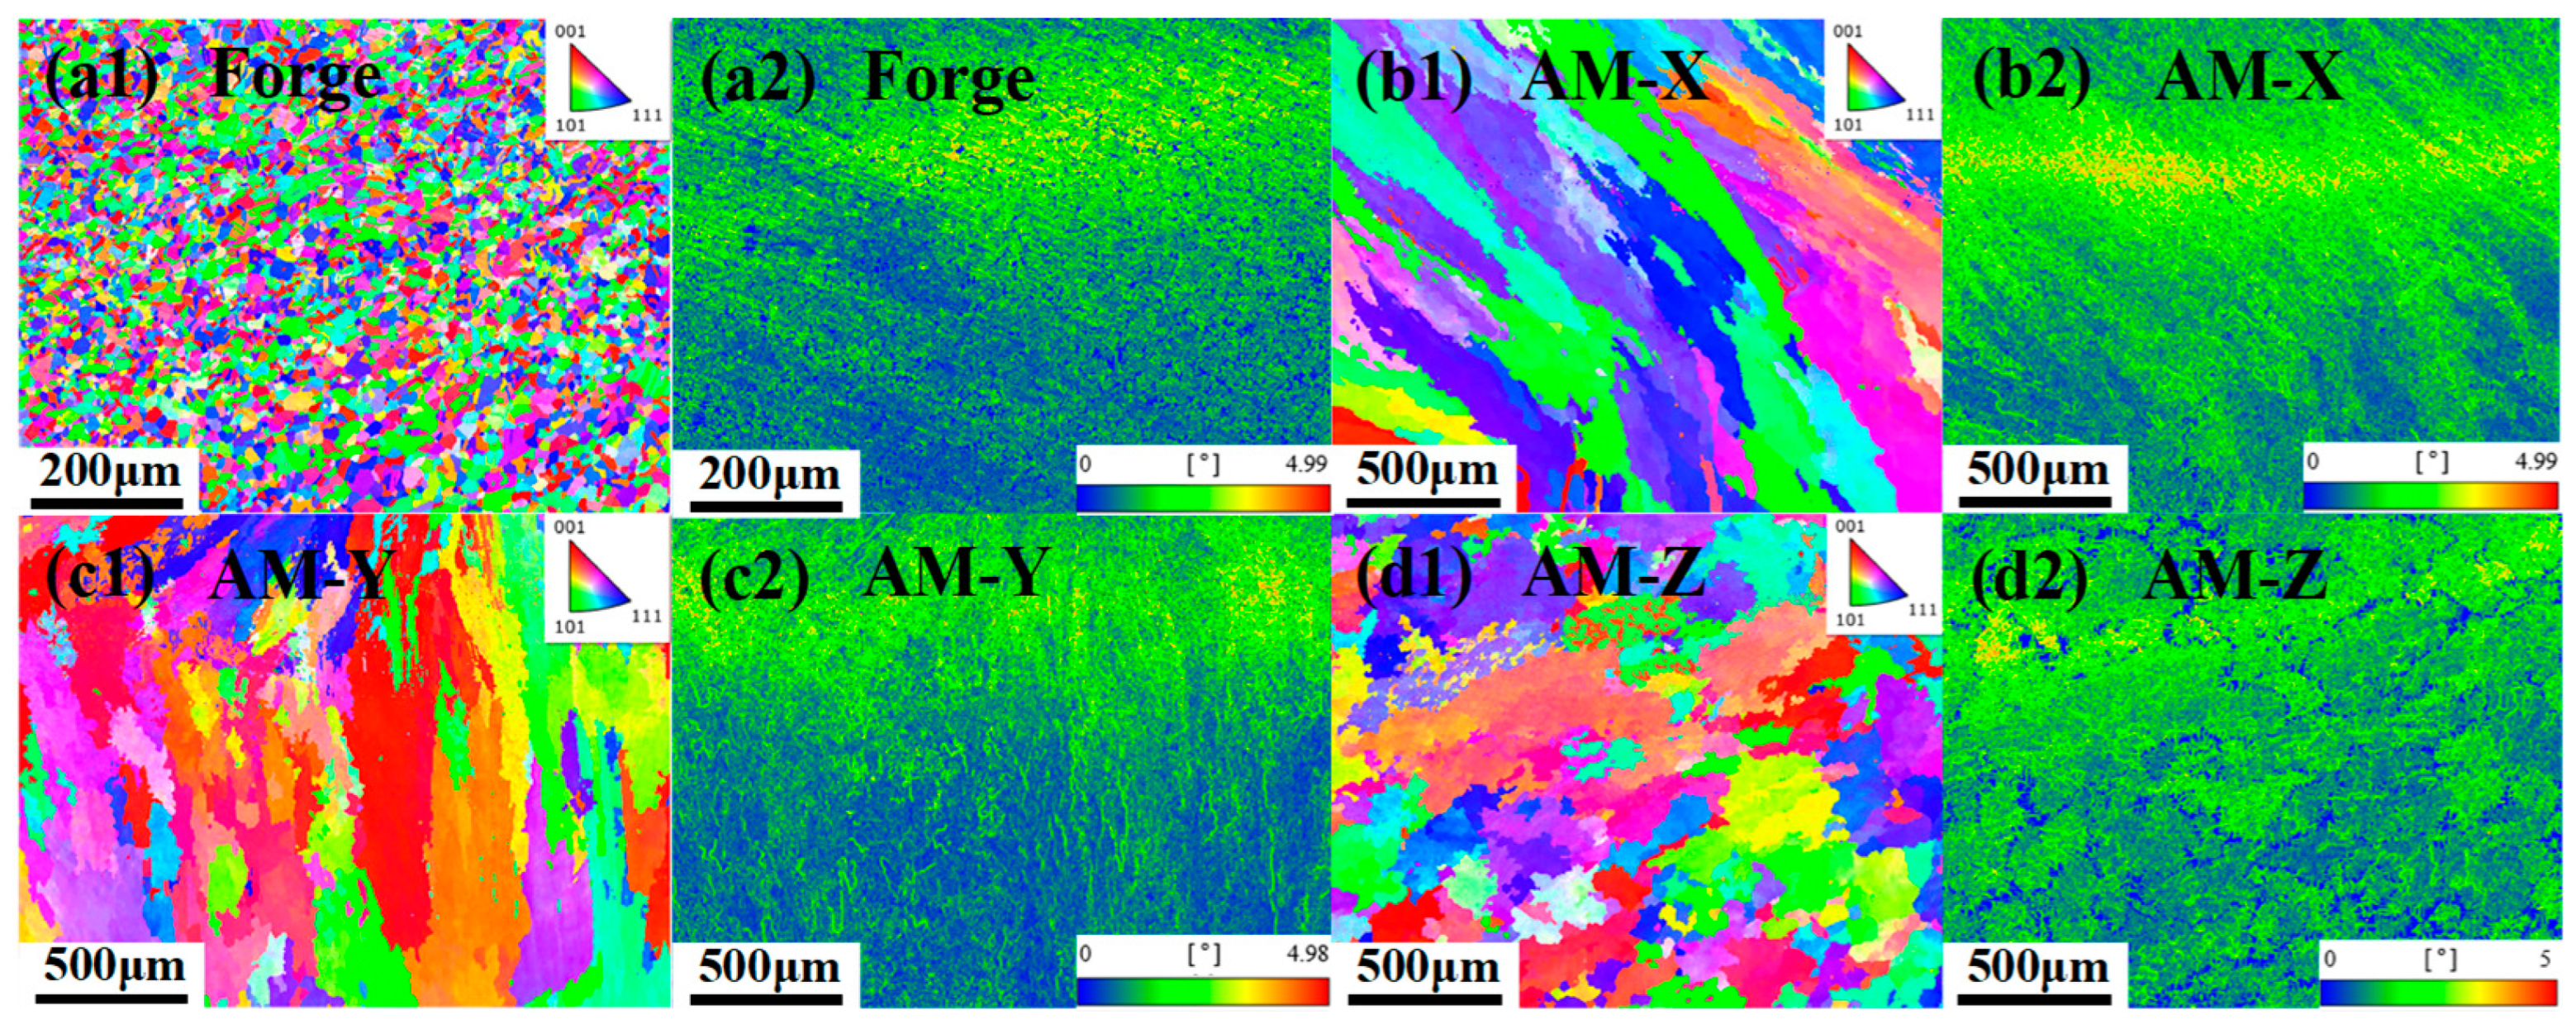
As shown in Figure 4, EBSD analysis of Z2CN19-10 controlled-nitrogen-content SS revealed distinct microstructural characteristics. Figure 4a1–d1 present the inverse pole figure (IPF) maps, while Figure 4a2–d2 show the kernel average misorientation (KAM) maps. The forged material was predominantly equiaxial with an average grain size of about 10.5 μm. The AM material was predominantly columnar in the X, Y, and Z directions, with average grain sizes of 152.0, 129.2 and 127.2 μm, respectively. It showed larger grains with more pronounced residual strain. This is attributed to the rapid cooling rate driving the material into a non-equilibrium state during AM processing.

3.1.2. Mechanical Properties

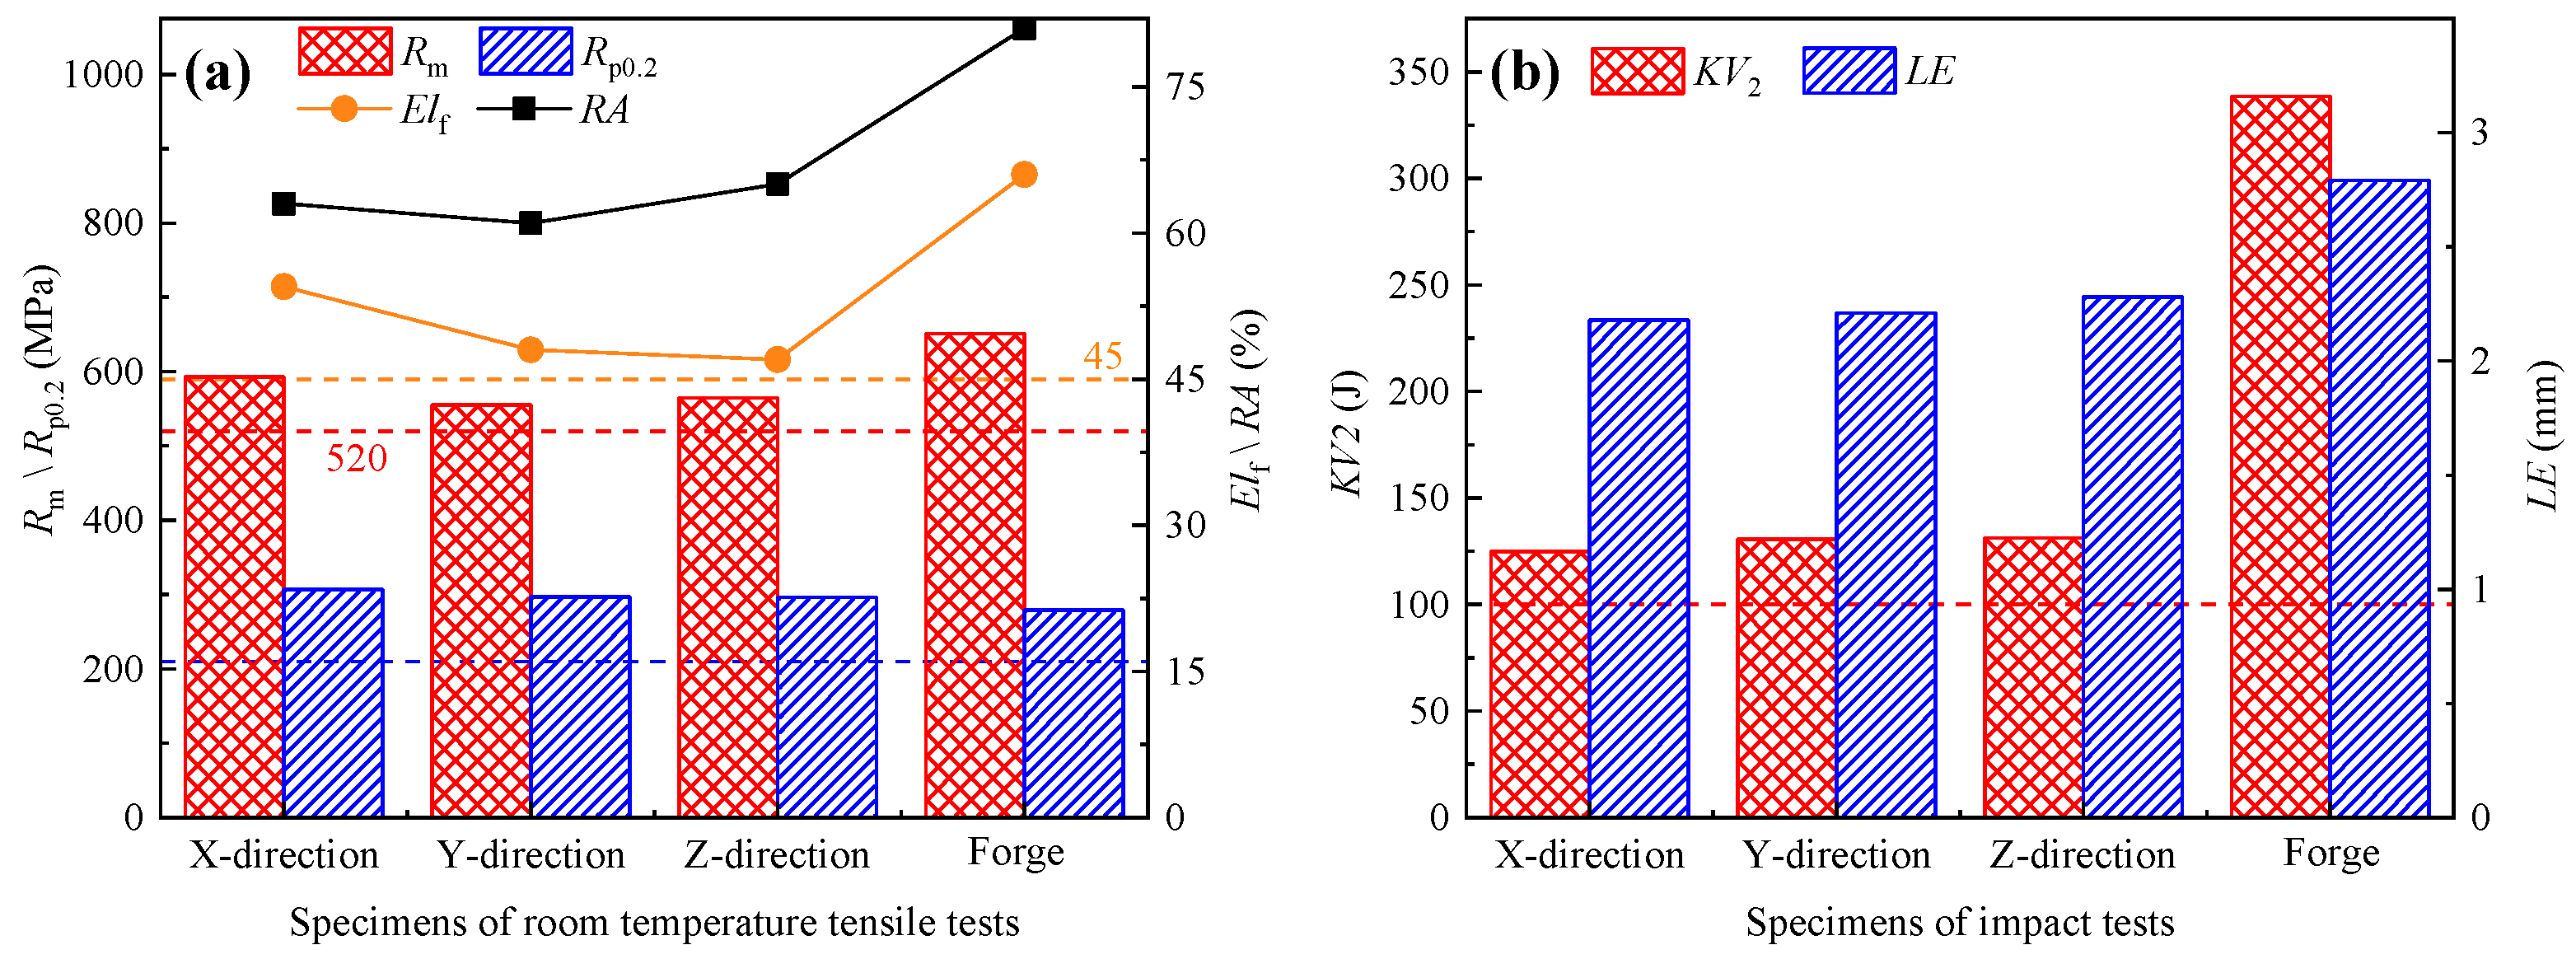
As shown in Figure 5, tensile and impact test data of forged and AM specimens under room temperature conditions are comparatively presented. The materials prepared by the two manufacturing processes met the RCC-M standard requirements [19]. According to the tensile property test data shown in Figure 5a, AM specimens in the X, Y and Z directions exhibited comparable tensile properties. The Z direction specimen exhibited the lowest tensile strength (Rm) of 565 MPa. The Rm of AM specimens was reduced by more than 51 MPa compared with that of 616 MPa for the forged specimens. The yield strength (Rp0.2) of AM specimens demonstrated good consistency among the three orthogonal directions, while the Rp0.2 of the Z direction specimen remained slightly lower than other directions. The lower elongation after fracture (Elf) and the reduction in area (RA) of forged materials were 66% and 81%, respectively (Figure 5b). The Elf of AM specimens decreased by 17.4–28.0%, and the RA was lower by 20.0–24.6% compared to forged specimens. This indicated that AM materials had insufficient plastic deformation capacity. The impact test results are shown in Figure 5b. It revealed no significant difference in impact energy (KV2) among the three directions of AM specimens. The forged specimens exhibited the KV2 of 338.5 J and the LE of 2.79 mm. It demonstrated that KV2 was 3.57 to 3.71 times higher than those of AM specimens. And the LE exceeded it by about 20%. These differences are attributed to the coarse grain size and more manufacturing defects of the AM materials.

3.2. Fatigue Behaviors

3.2.1. Cyclic Stress Response Curve

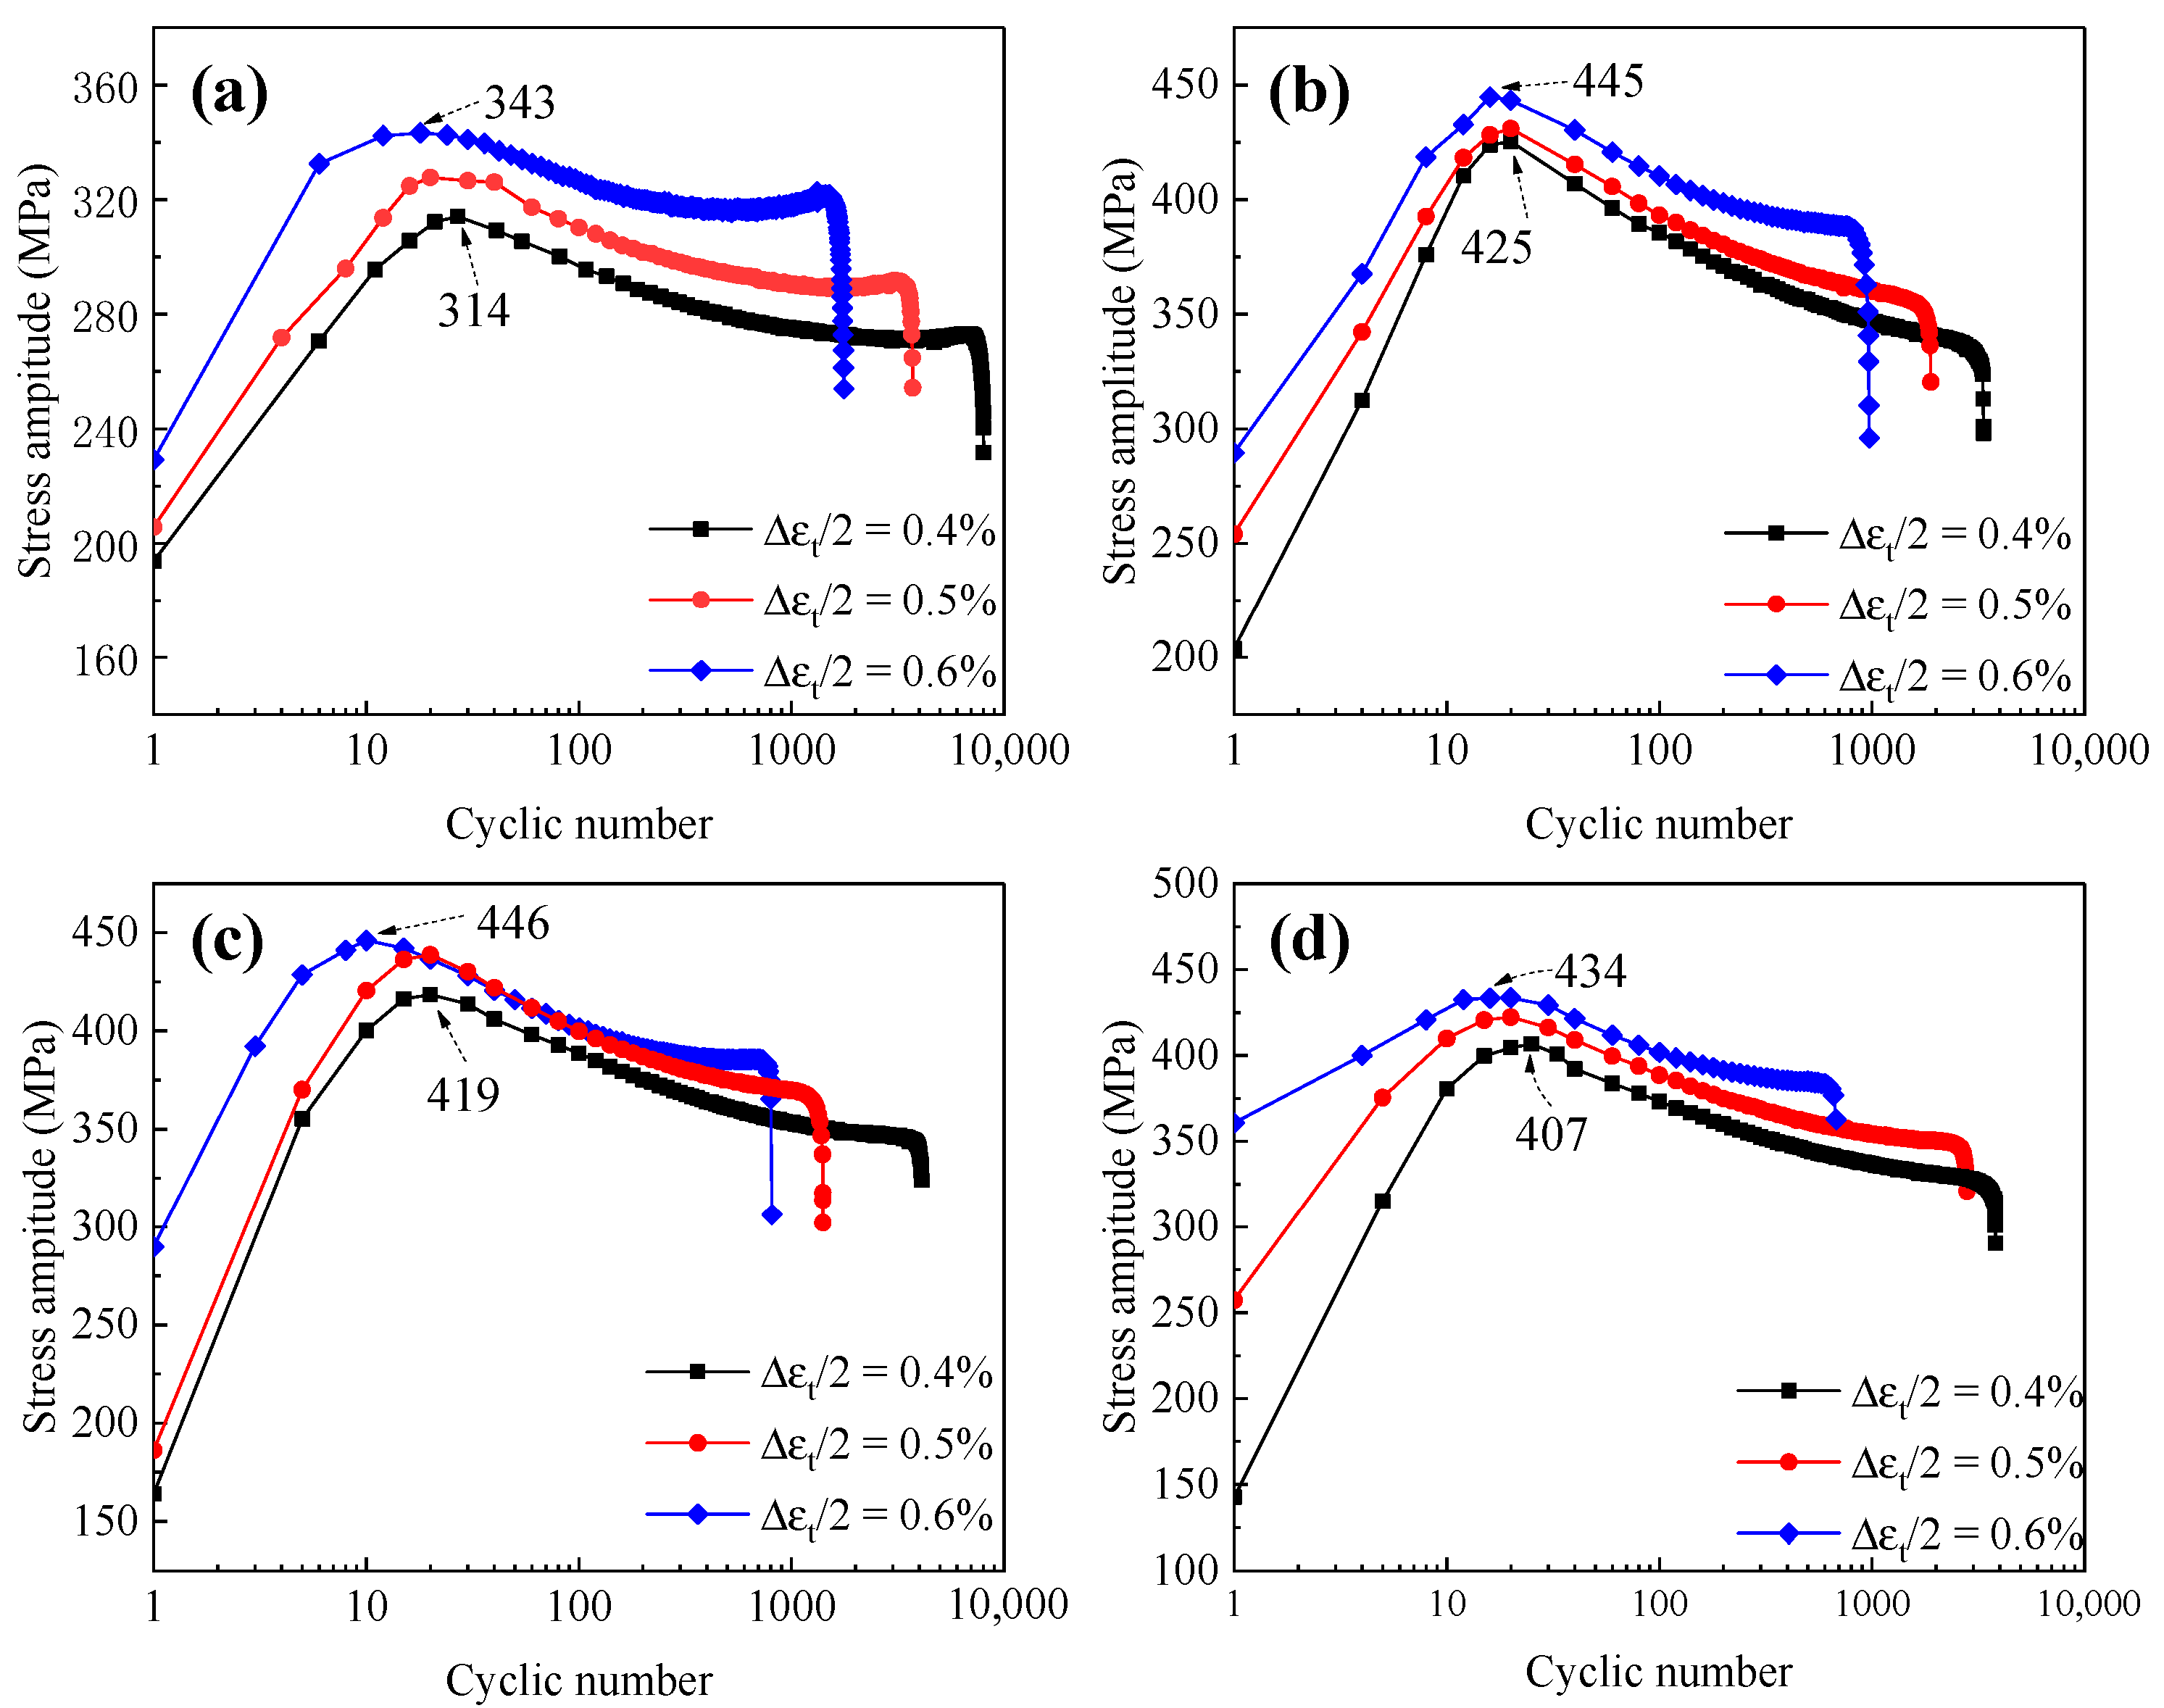
Figure 6 shows the cyclic stress response curves of forged and AM specimens under strain amplitudes ranging from 0.4% to 0.6%. The cyclic stress response curves of all specimens demonstrated a consistent trend. The cycle life decreased and the peak stress amplitude increased with the strain amplitude increasing. The Z-direction specimen exhibited the lowest fatigue life among all tested specimens, while the forged specimen exhibited superior fatigue performance. Specifically, within the strain amplitude range of 0.4% to 0.6%, the fatigue life (Nf) of forged specimens decreased significantly from 8022 cycles to 1766 cycles. In contrast, Nf of AM specimens in the X, Y, and Z directions decreased from 3354 to 973 cycles, 4108 to 816 cycles, and 3802 to 693 cycles, respectively. These findings correlated well with the Rm. This further confirms the positive correlation between Rm and Nf in metallic materials [25].
The material exhibited a two-stage evolution during cyclic loading: cyclic hardening and cyclic softening [26]. Crystal dislocations were gradually activated during initial cycling. Dislocation multiplication and pile-up occurred during cyclic response due to the low dislocation density. A large number of slip bands were generated inside the specimens. This manifested as increasing stress with cycling. This stage was the cyclic hardening stage. At a strain amplitude of 0.6%, the peak stress amplitude of forged specimens was 343 MPa, while the AM specimens of X, Y, and Z directions were 445, 446 and 434 MPa, respectively. The higher stress amplitude implied greater plastic strain energy (stress–strain hysteresis loop area) per cycle. It indicated that more energy was dissipated through plastic deformation or heat generation. Thus, the material fatigue damage was accelerated [27]. Subsequently, the tested specimens entered the cyclic softening stage and their resistance to deformation decreased. Stress decreased with increased cycles due to accumulated plastic deformation and dislocation annihilation. Fatigue cracks initiated and propagated with continued cycling. Eventually, specimen fatigue fracture occurred.

3.2.2. Strain–Fatigue Life Relationship

The low-cycle fatigue strain–life relationship of Z2CN19-10 controlled-nitrogen-content SS was analyzed using the Basquin–Coffin–Manson relationship formula [28], as follows:
Δ ε t 2 = Δ ε e 2 + Δ ε p 2 = σ f E ( 2 N f ) b + σ f ( 2 N f ) c
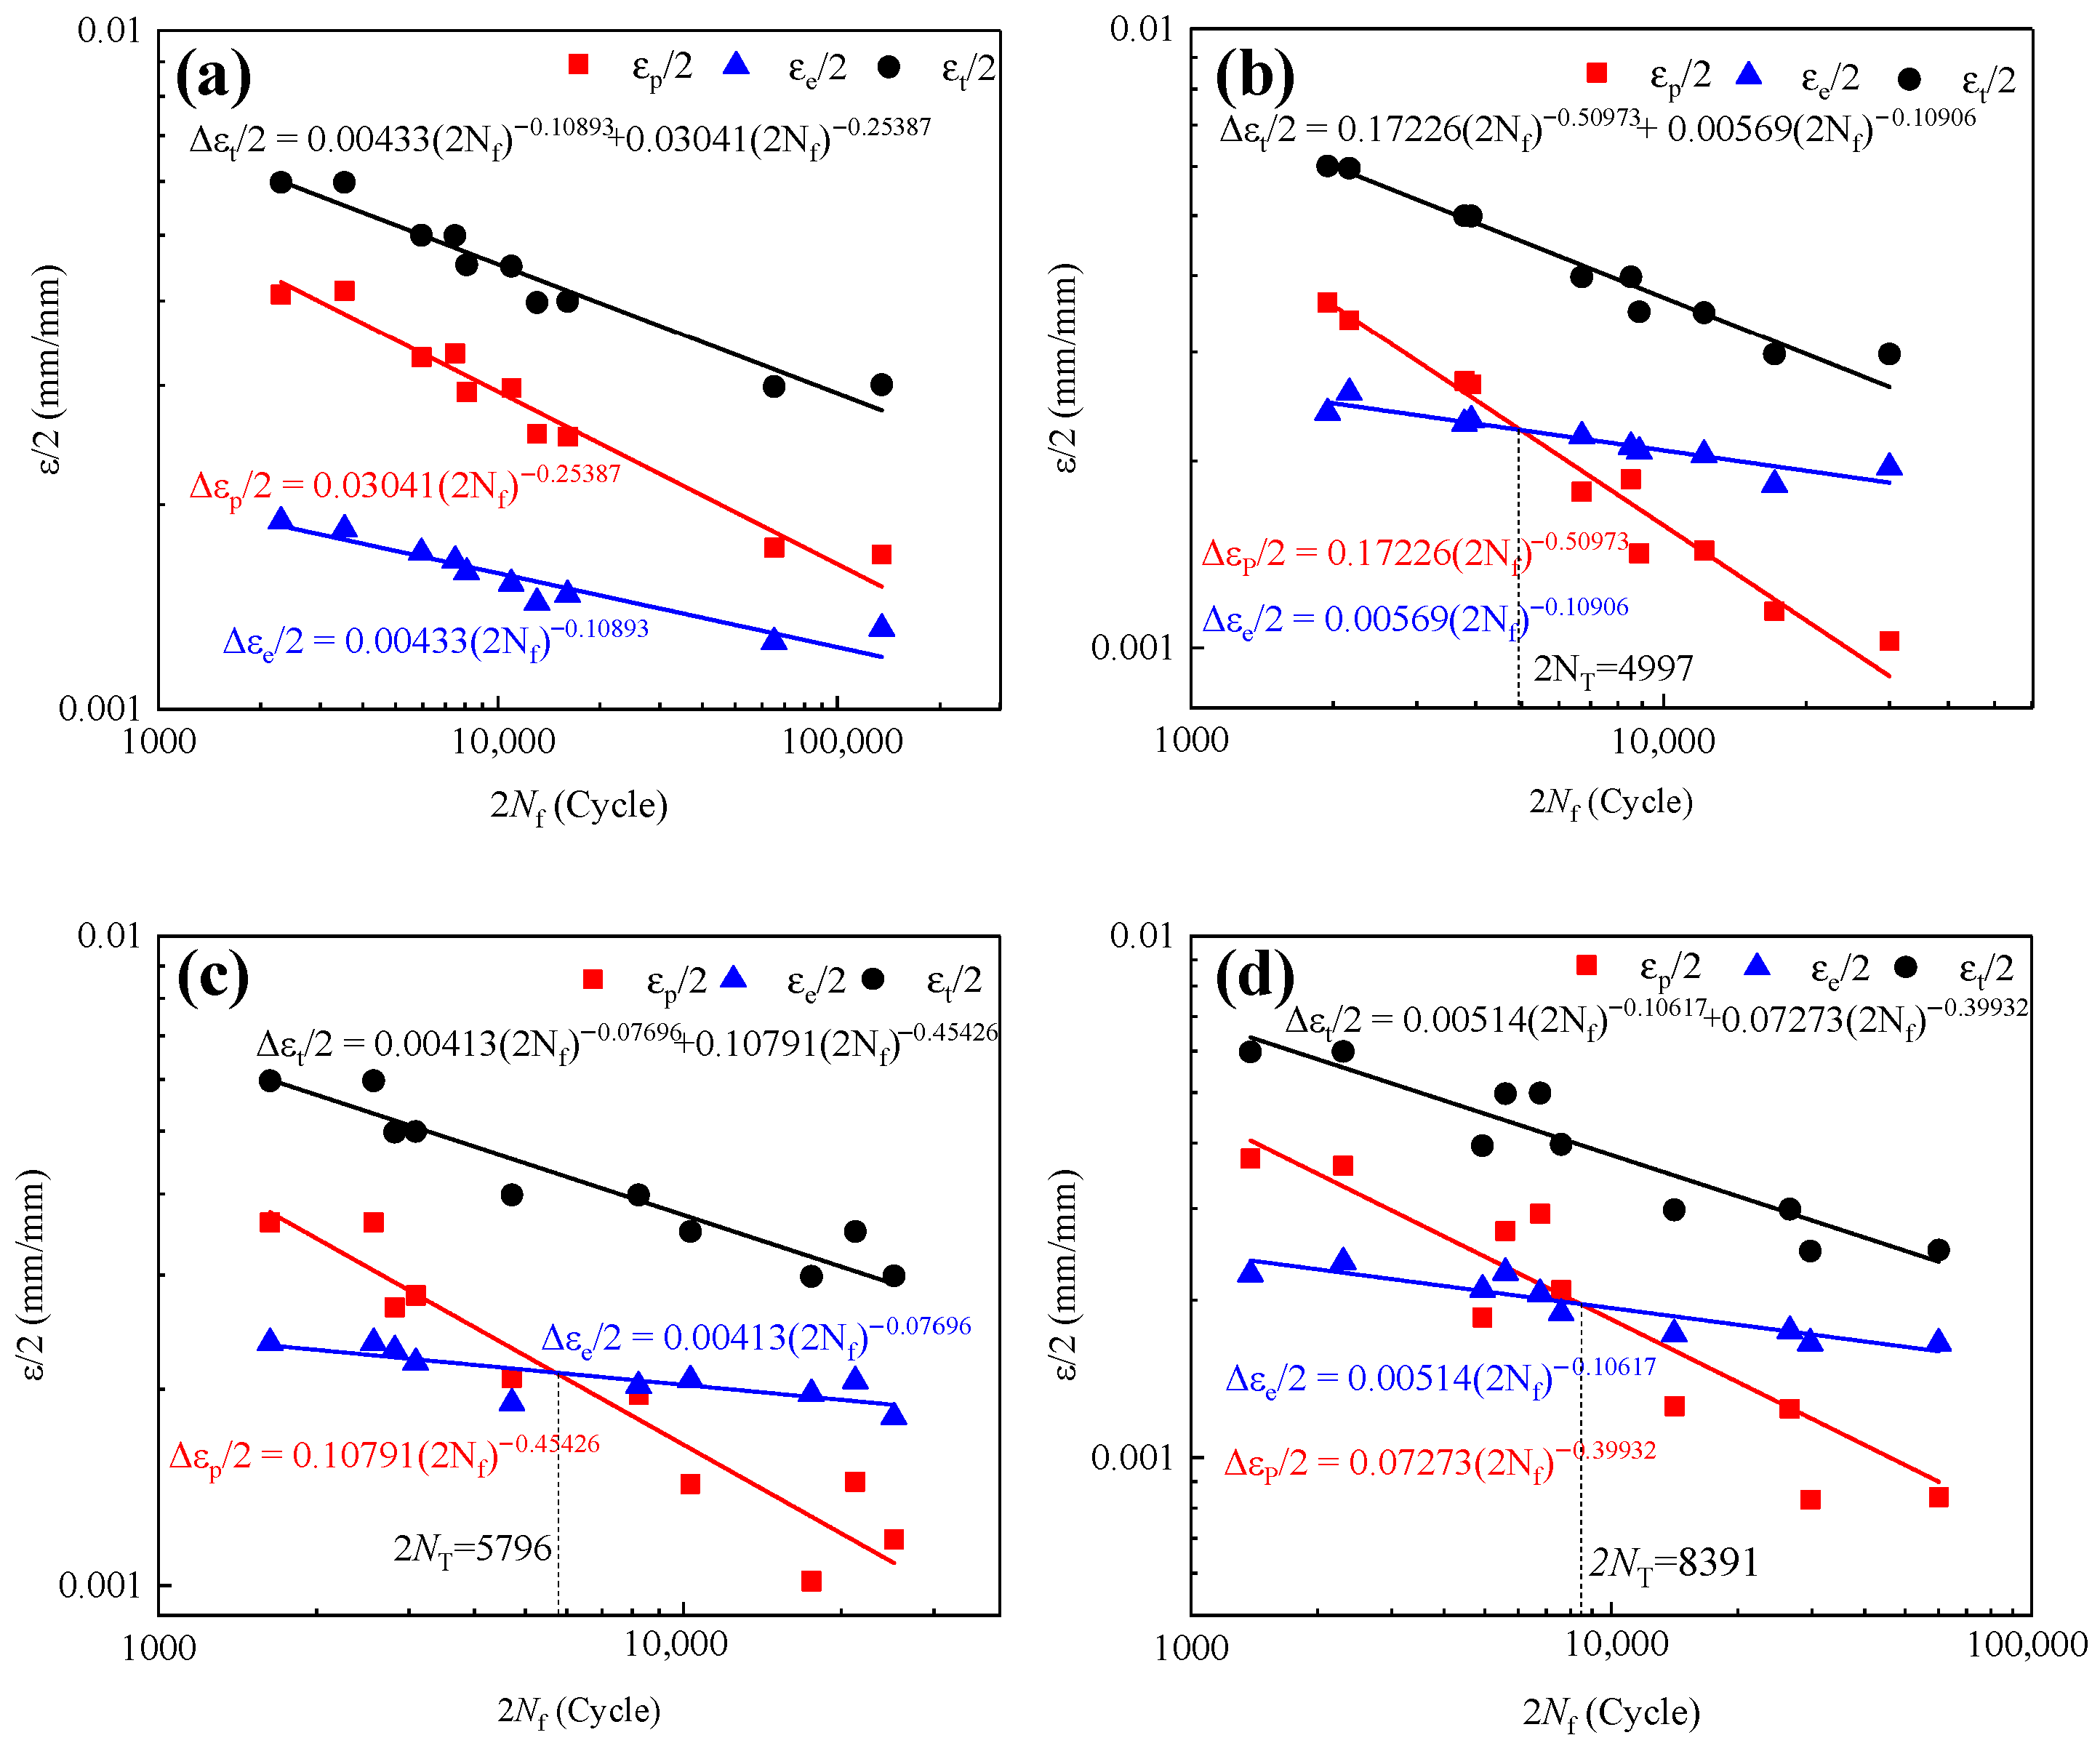
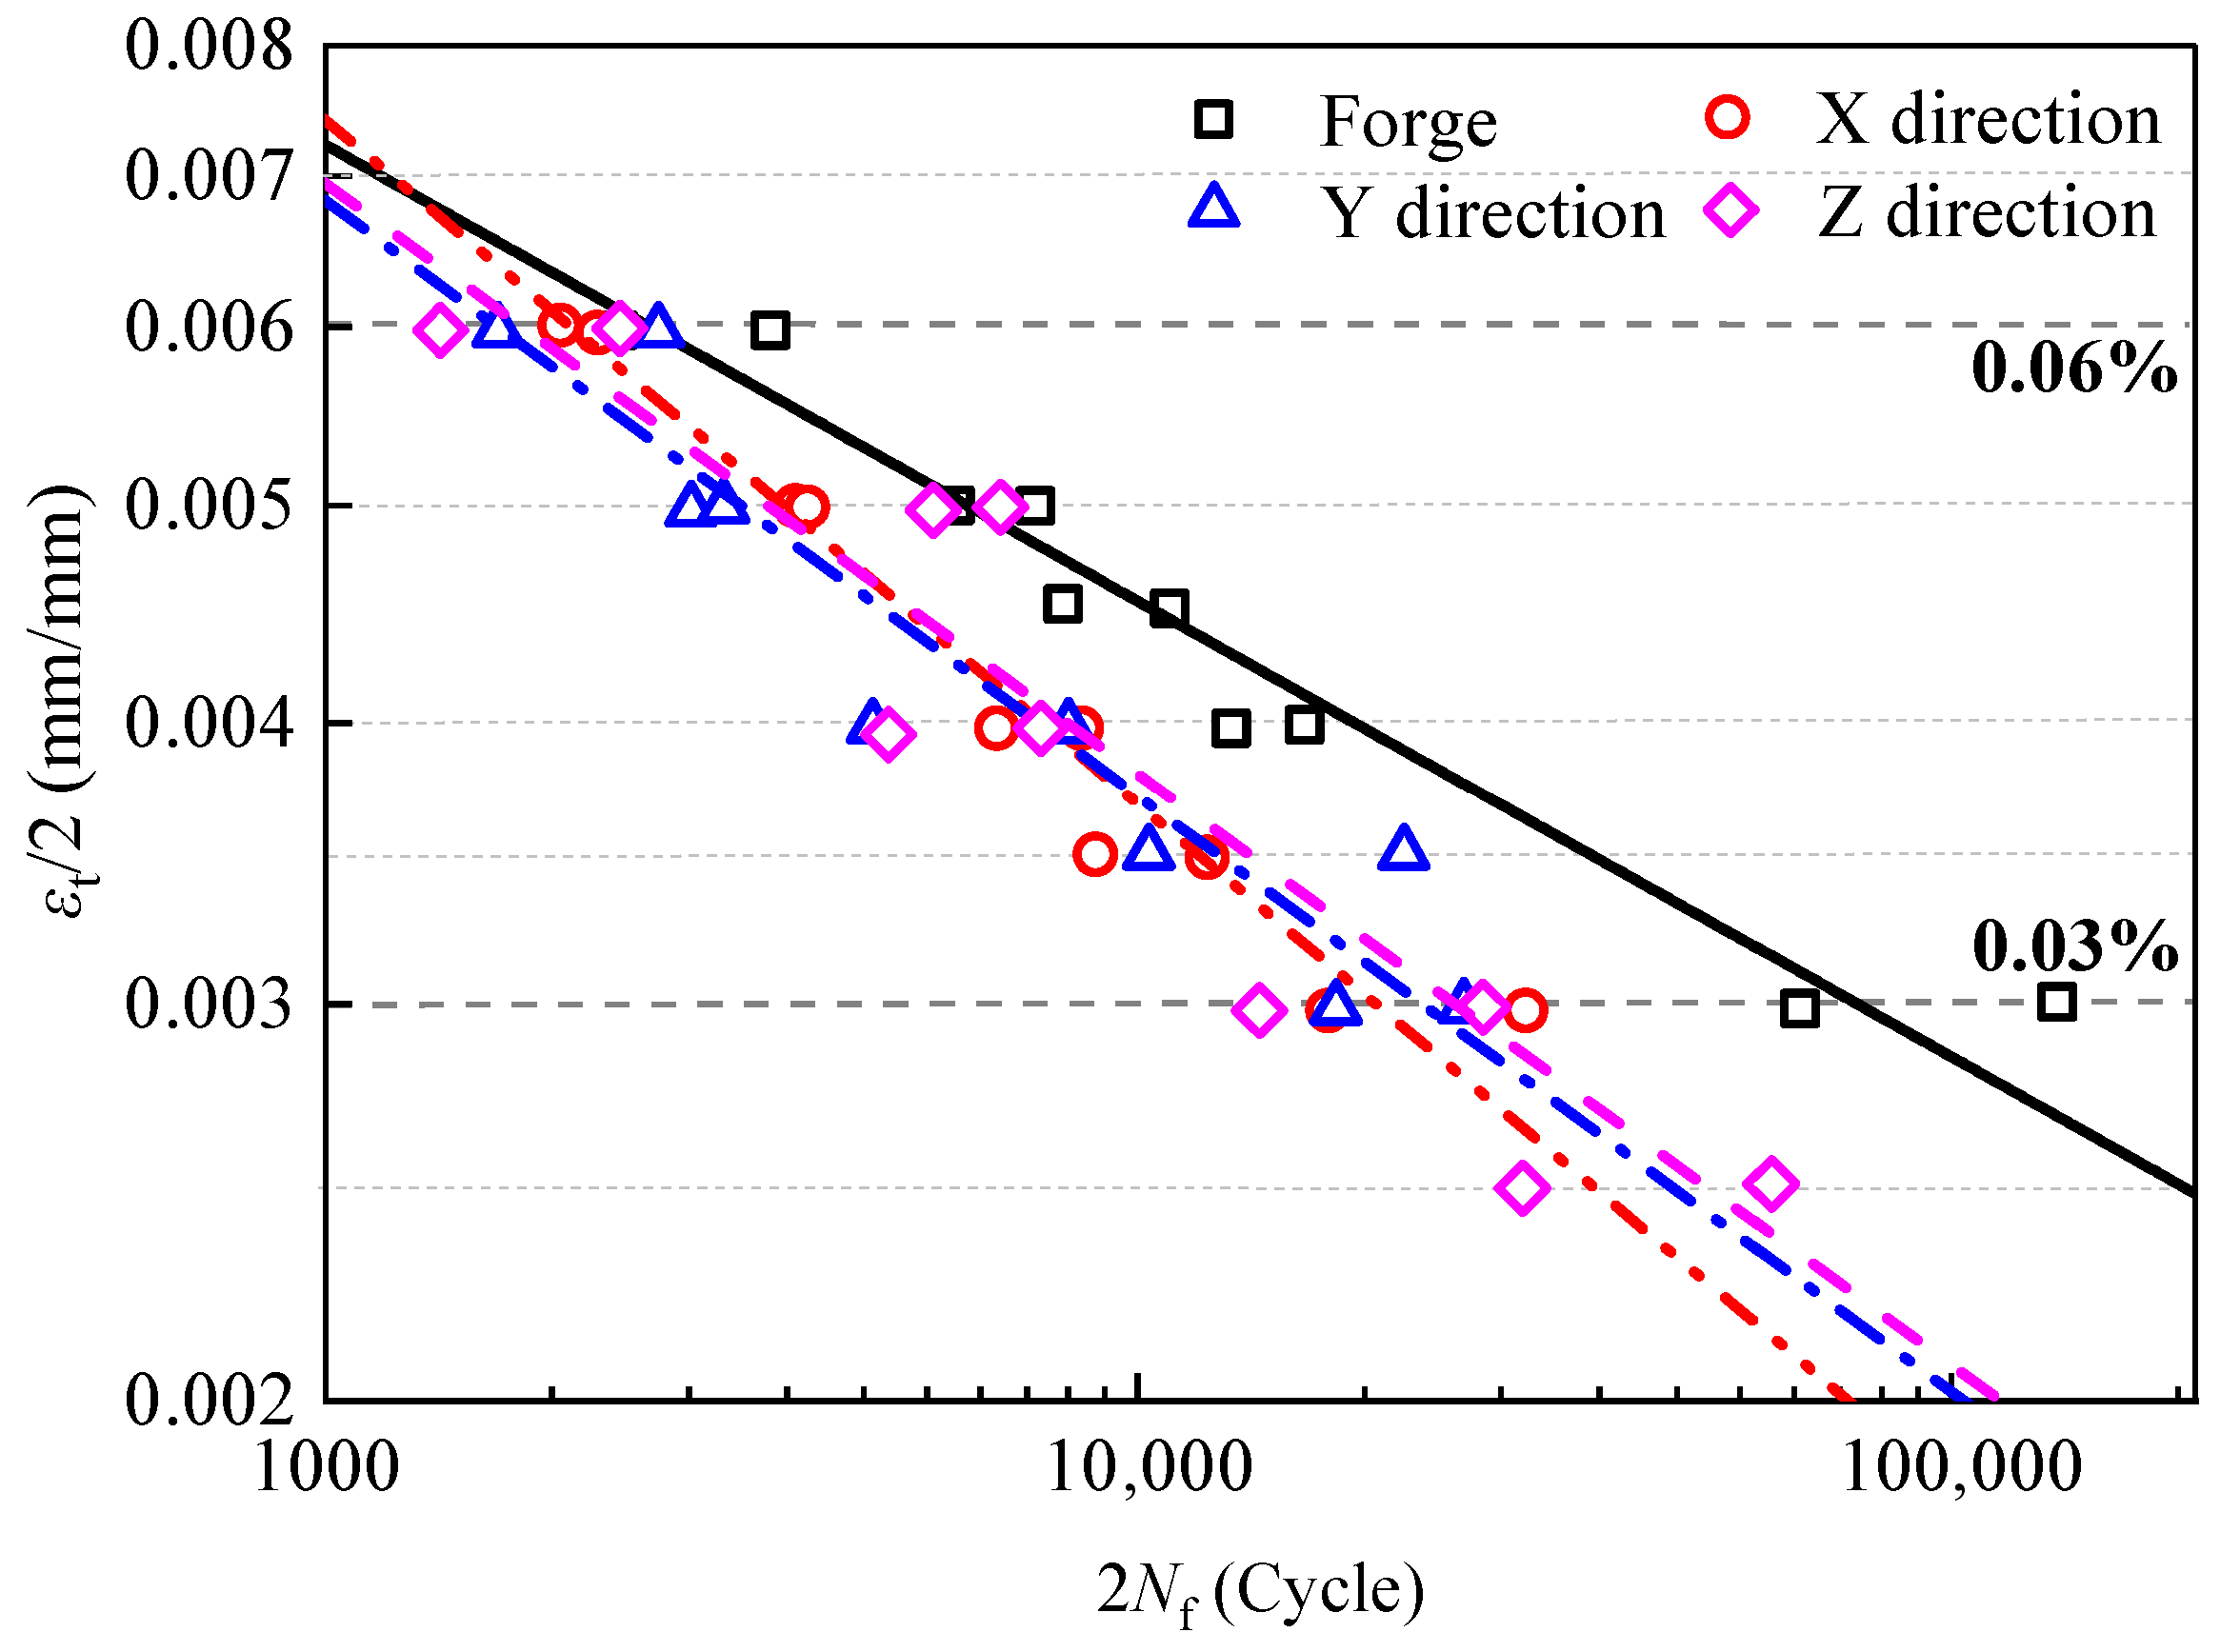
In the equation, Δεt/2, Δεe/2 and Δεp/2 are total strain amplitude, elastic strain amplitude, and plastic strain amplitude, respectively; σ f is the fatigue strength coefficient; b is the fatigue strength exponent; ε f is the fatigue ductility coefficient; c is the fatigue ductility exponent; E is the elastic modulus. Strain–life curve fitting analysis was performed using Equation (1). As shown in Figure 7, the bilogarithmic curves of elastic strain amplitude versus plastic strain amplitude for AM specimens exhibited characteristic intersection points. This intersection corresponded to the transition fatigue life (NT). The NT values for X-, Y-, and Z direction specimens were 2498 cycles, 2898 cycles, and 4192 cycles, respectively. When the Nf exceeded the NT, the elastic strain amplitude dominated over the plastic strain. Conversely, when Nf fell below NT, the plastic strain amplitude became the decisive factor influencing Nf. The Z-direction specimen exhibited the highest NT compared to X- and Y-direction specimens. This indicated superior plastic strain contribution in fatigue. This could be attributed to the Z-direction specimen having the lower elasticity and the highest dislocation slip gradient [29]. Plastic deformation is destructive to the material matrix, whereas elastic deformation is recoverable.
Experimental results showed the forged specimen exhibited predominant plastic-dominated behavior within the strain amplitude range of 0.3 to 0.6%. The plastic strain amplitude consistently exceeded the elastic strain amplitude. This finding aligns with the superior plastic deformation capacity of forged materials. Forged materials are less prone to stress concentration under cyclic loading due to their excellent plastic deformation ability. Crack initiation is decreased and the rate of crack propagation is reduced by plastic deformation at the crack tip. This significantly increases the Nf [30,31].
Comparative analysis of strain–life curves is shown in Figure 8. It was revealed that AM materials exhibited high consistency in fatigue life curves across three orthogonal directions, while forged materials demonstrated superior fatigue performance. This disparity is primarily attributed to process-induced characteristics in AM materials, including residual strain, microstructural inhomogeneity, and lack-of-fusion defects. These factors collectively degrade the fatigue damage resistance [32]. Notably, the Z-direction specimens displayed heightened data scattering in fatigue life. This reflected a marked decline in fatigue stability for this direction. This also indicated a certain degree of anisotropy present in the AM materials.

3.2.3. Cyclic Stress–Strain Relationship

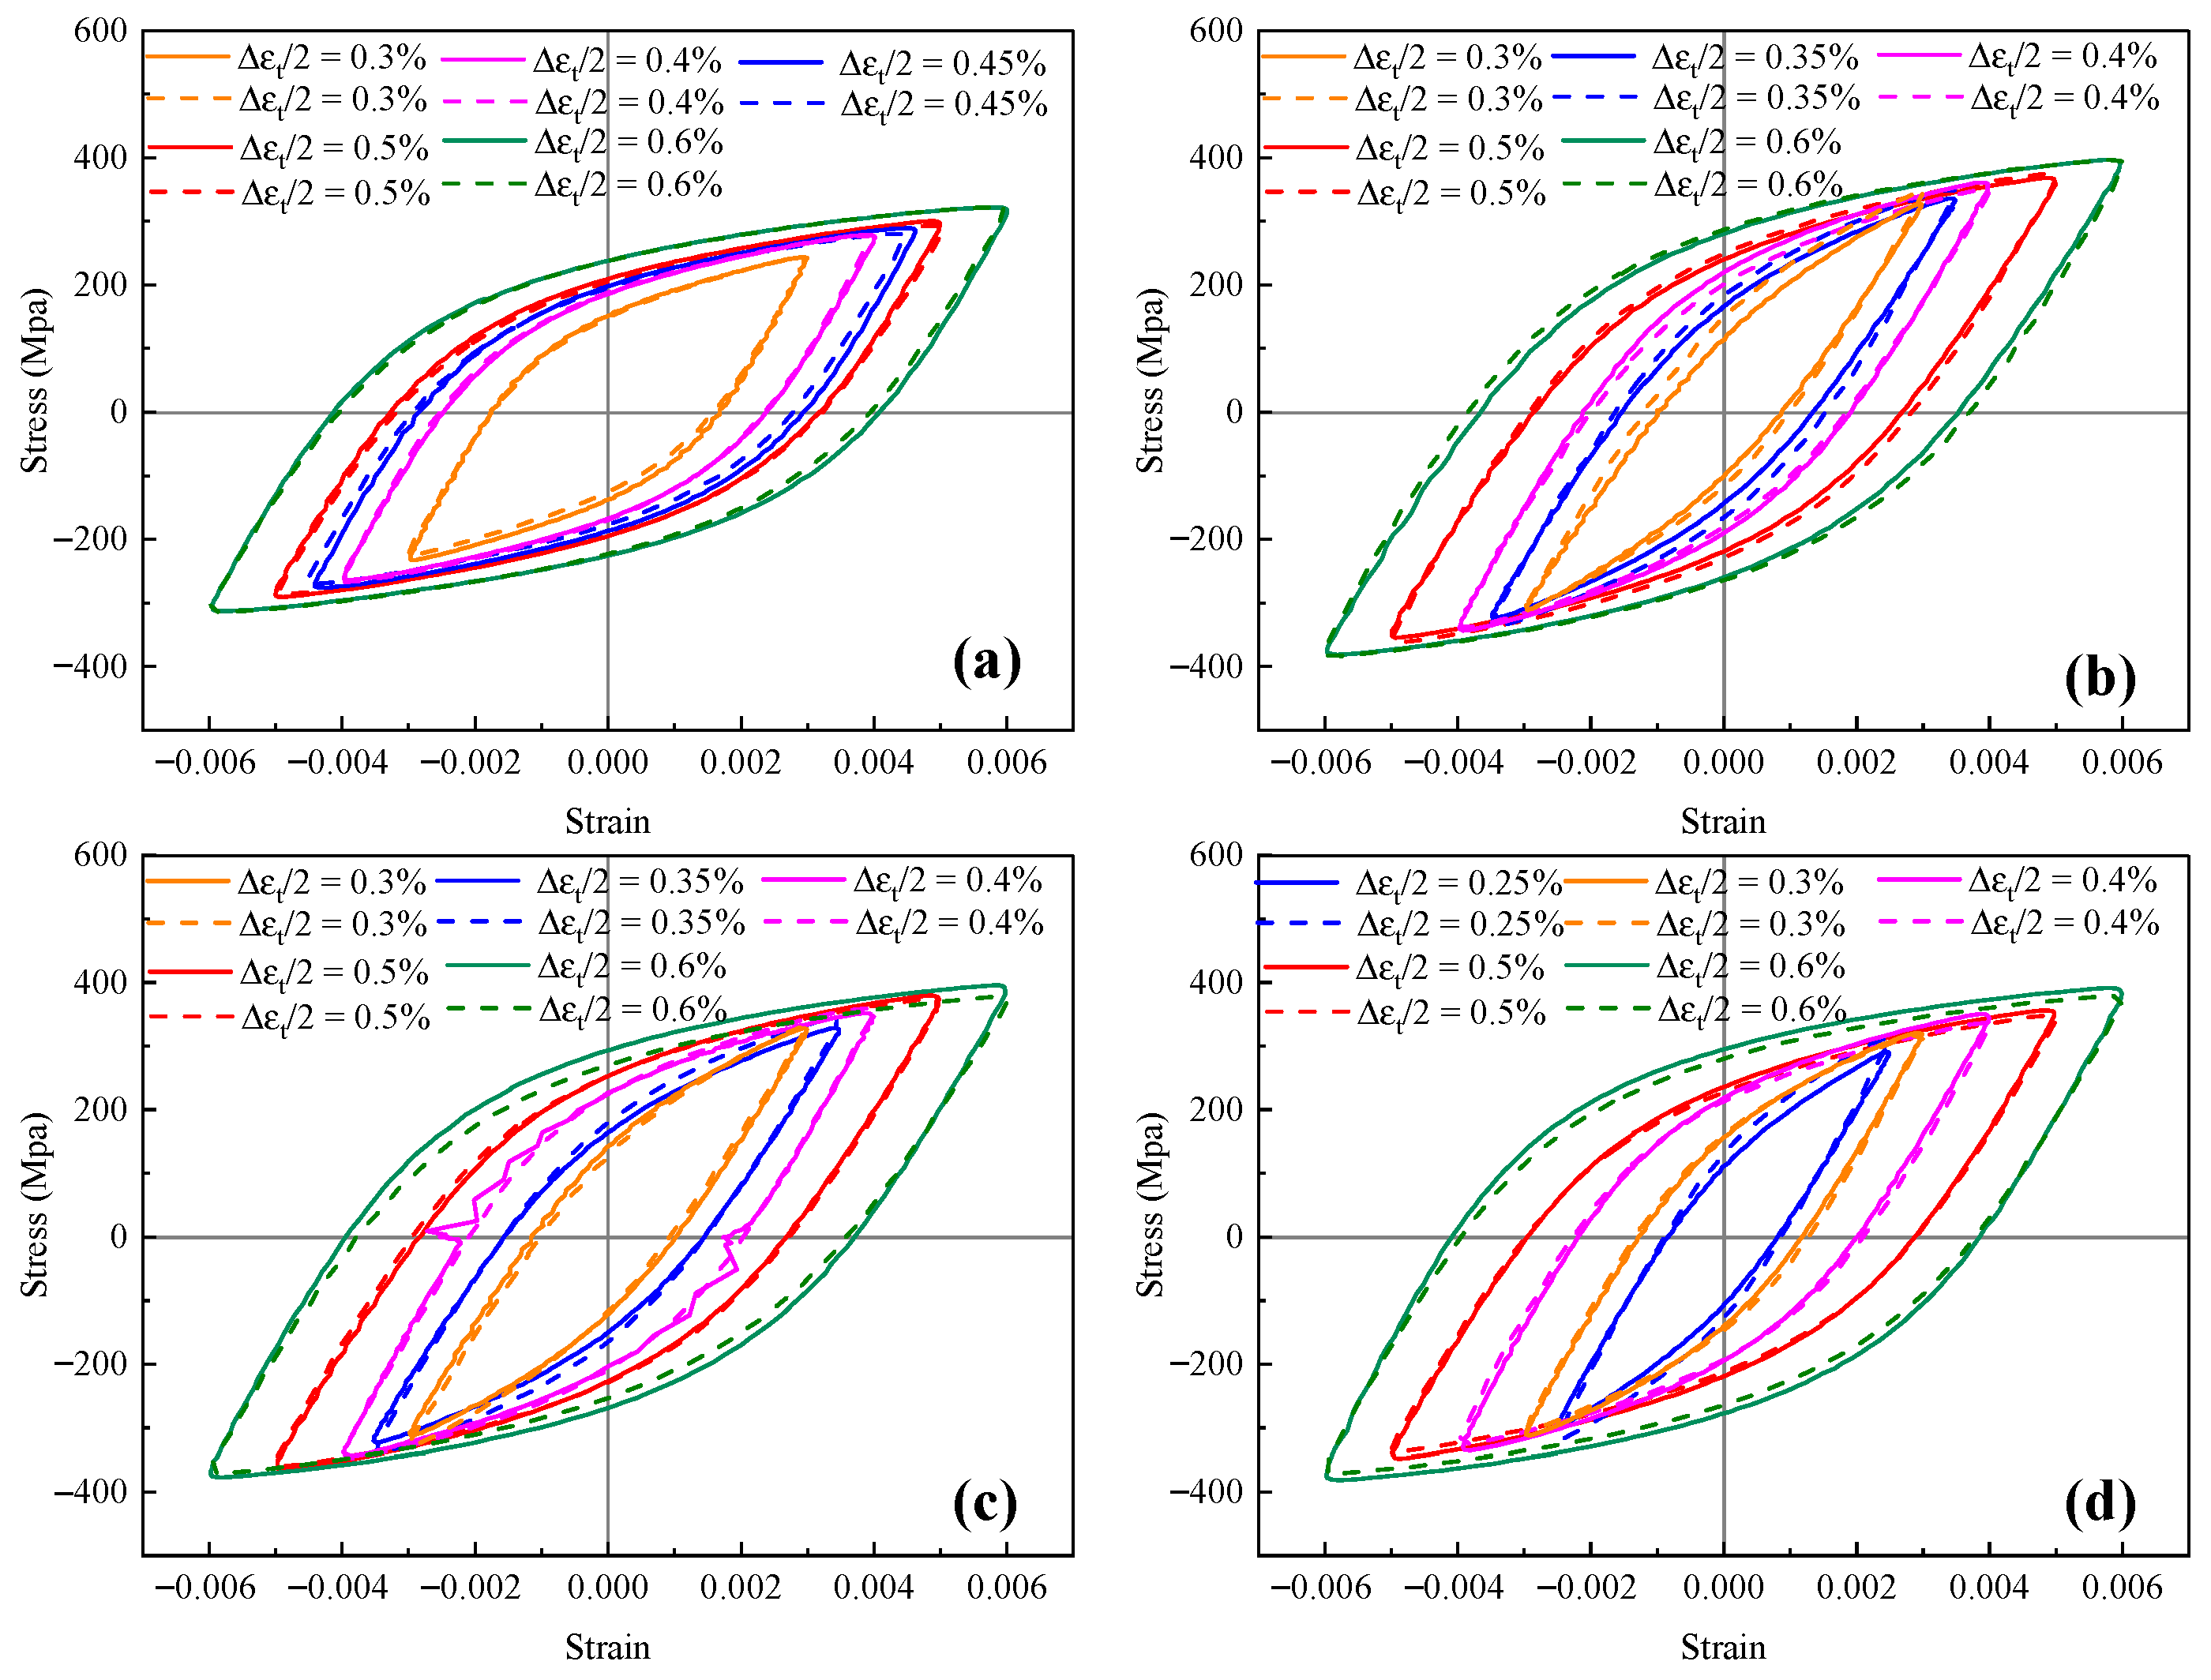
To further analyze the fatigue performance characteristics, stress–strain hysteresis loops at mid-life were employed to characterize the fatigue behavior. The hysteresis loops reflect the relationship between total stress–strain relationship within a specific range. The area enclosed by a hysteresis loop represents the plastic strain energy dissipated during a single cycle. Figure 9 shows the stress–strain hysteresis curves during the stable cycling stage of forged and AM specimens. With strain amplitude increasing from 0.3% to 0.6%, the hysteresis loop area of AM specimens exhibited an increase from 0.82–1.13 to 4.43–4.71, while the forged specimens increased from 1.20 to 4.07. This indicated that the energy absorbed by the material gradually increased as the strain amplitude increased. The energy was consumed through plastic deformation and cracking damage, leading to a gradual reduction in the fatigue life of the test materials. This was consistent with the Nf results [33].
The width of the hysteresis loop corresponds to the plastic strain range (Δεp). As the strain amplitude increased from 0.3% to 0.6%, the widths of the hysteresis loops for both the forged and the AM specimens increased accordingly. This indicated that the contribution of plastic strain to the Nf became more pronounced. The width of the hysteresis loops for forged material specimens increased from 0.00171 to 0.00417. For AM specimens in X, Y, and Z directions, the hysteresis loop widths increased from 0.00108 to 0.00373, 0.00110 to 0.00382, and 0.00125 to 0.00397, respectively. This indicated that the material underwent more plastic deformation during cyclic loading as the strain amplitude increased. Such behavior led to intensified dislocation movement and accelerated damage accumulation [34].
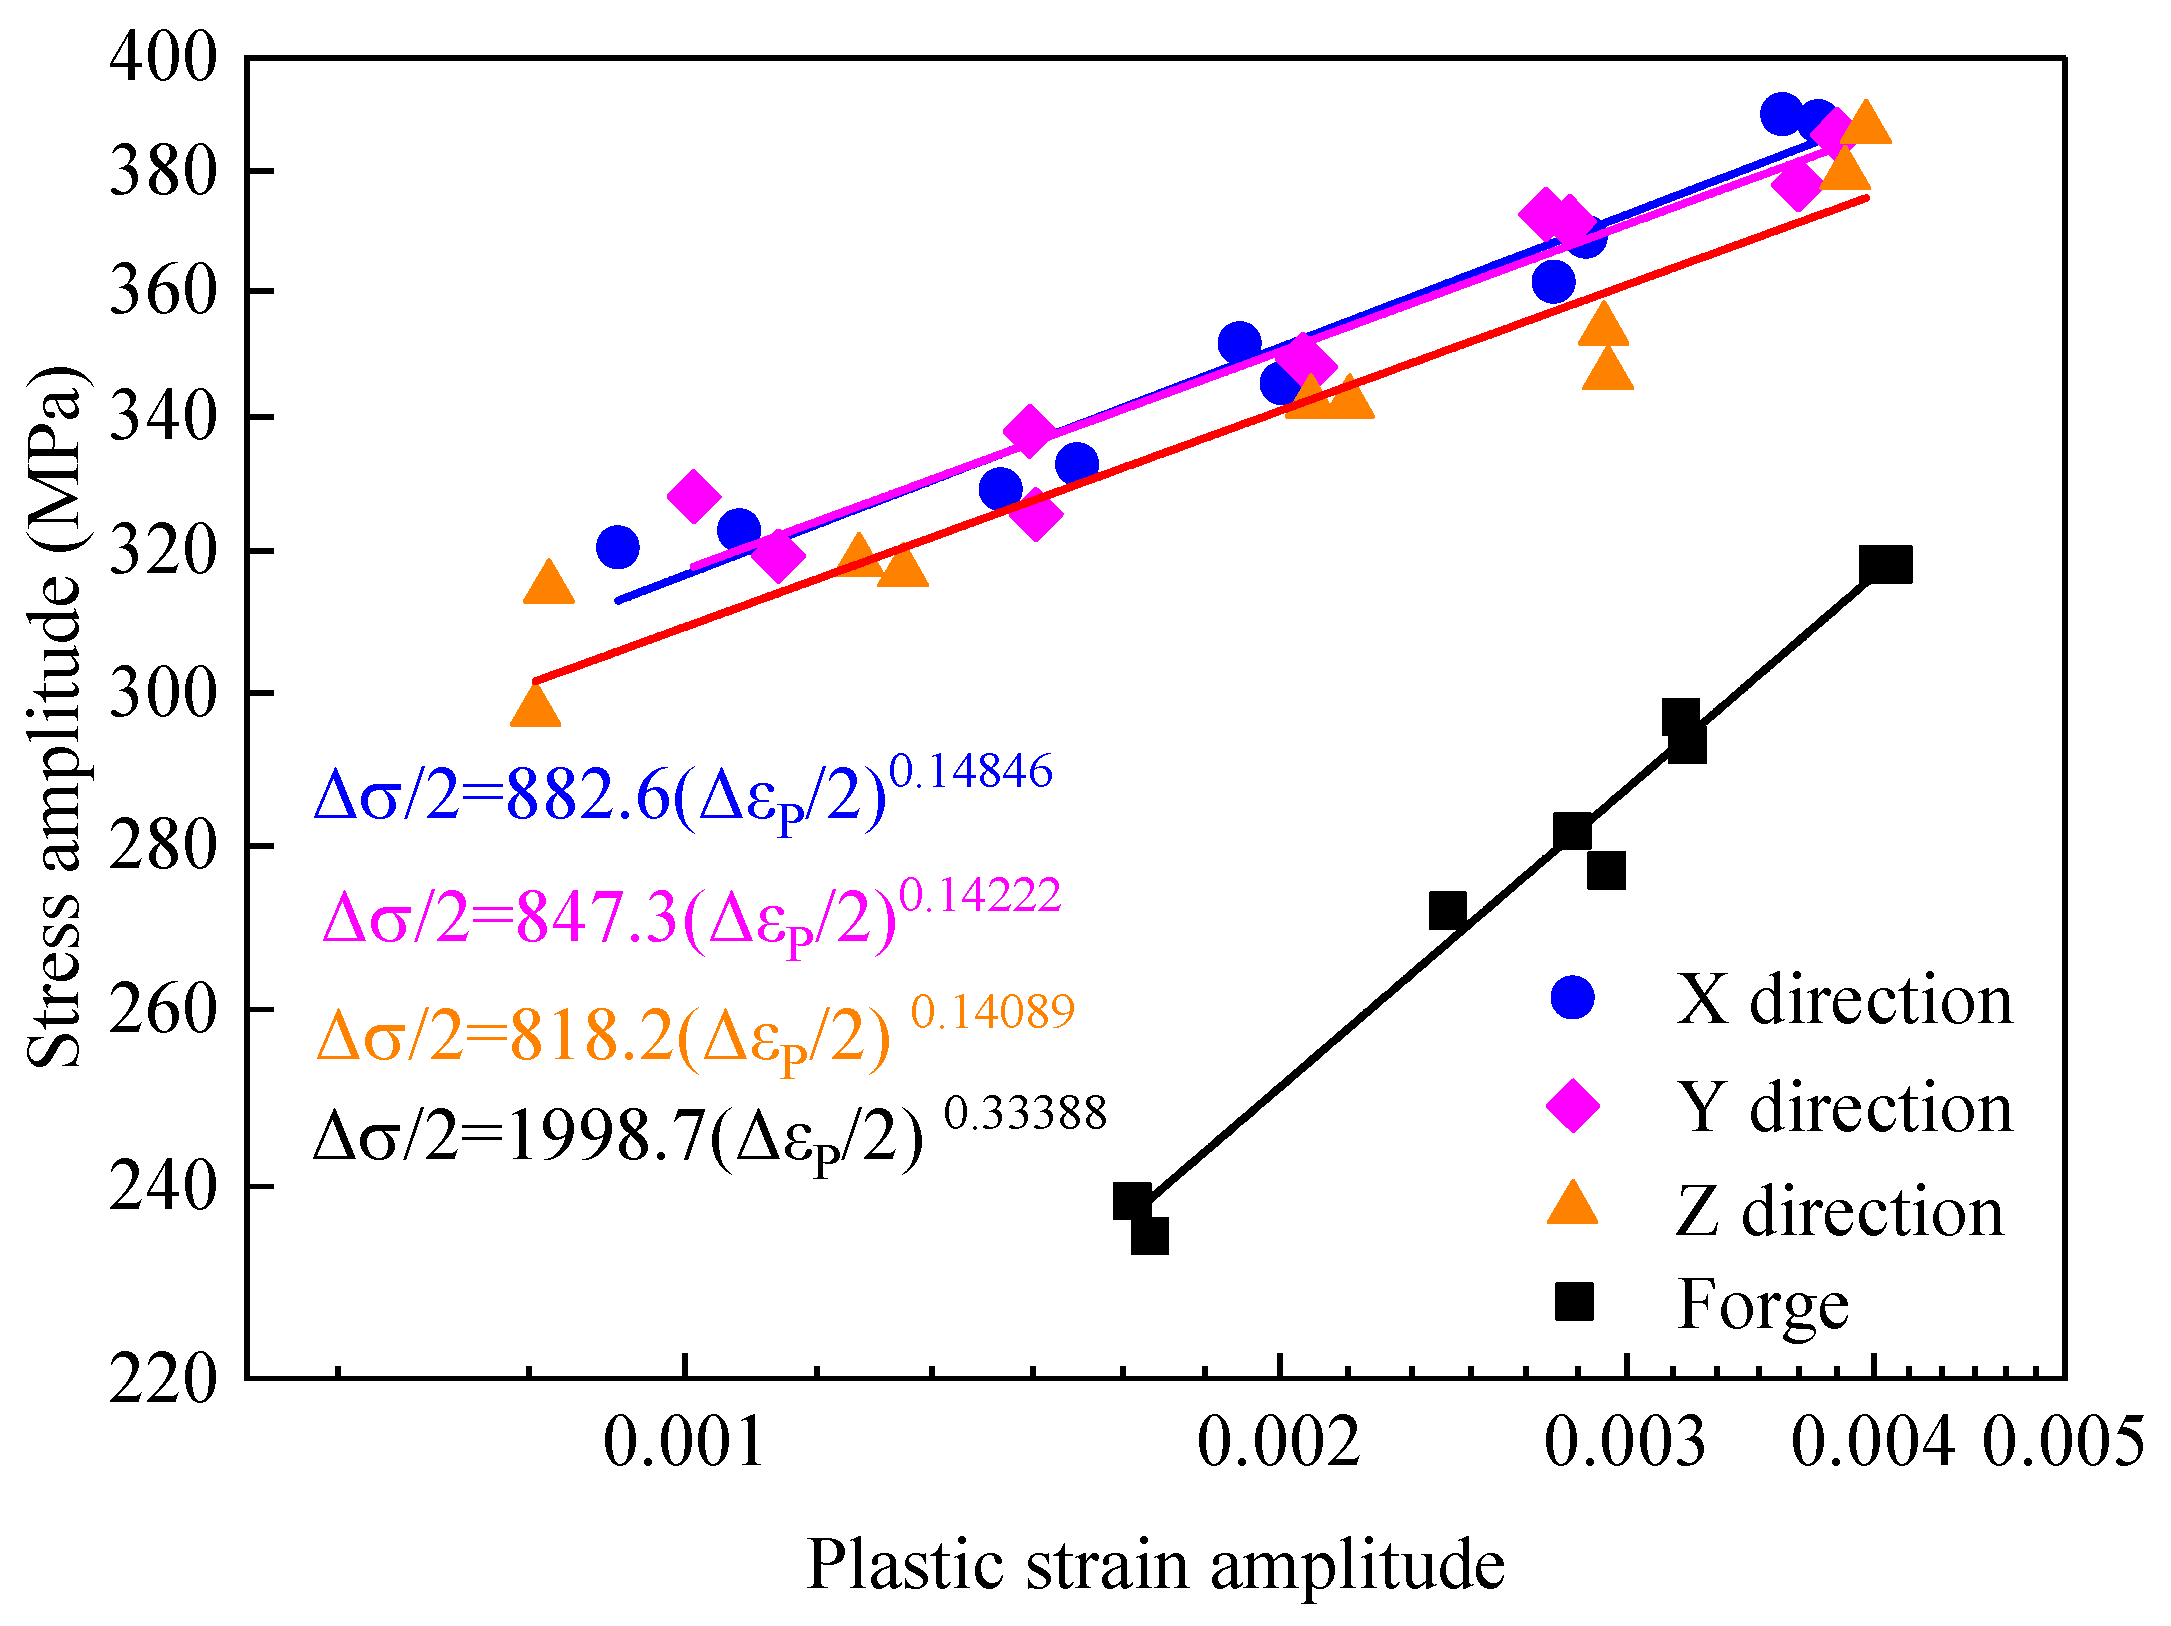
The relationship between the stress amplitude and plastic strain amplitude of the material can be described by the Ramberg–Osgood equation [35], as shown in the following equation:
Δ σ 2 = K ( Δ ε p 2 ) n
In the equation, Δσ/2 and Δεp/2 are the cyclic stress amplitude and the plastic strain amplitude, respectively. K’ and n’ are the cyclic strength coefficient and the cyclic strain hardening exponent, respectively. Based on the hysteresis loops at half-life, the fitting of Equation (2) was performed using logarithmic coordinate. The result is shown in Figure 10. K’ and n’ for forged material were determined as 1988.7 and 0.33388, respectively. For AM specimens in three orientations, K’ values ranged from 818.2 to 882.6, and n’ values fell between 0.140 and 0.148. Notably, K’ and n’ values for X and Y directions were comparatively close, whereas the parameters of Z direction specimens were both the smallest.
As combined by Equation (2), AM materials exhibited higher stress amplitudes compared to forged material under identical plastic strain conditions. This behavior can be attributed to the combined effects of residual strains, microstructural inhomogeneities, and fusion defects (e.g., unmelted particles) generated during the fabrication process. First, the increase in residual strain has a significant impact on the microstructure. such as enhancing dislocation interactions, hindering their movement, and changing stress states [36]. The mechanical response of the material changes during fatigue. Secondly, there are structures, including melt pool boundaries, columnar crystals, and anisotropic grains, in the AM manufacturing process. This leads to non-uniform microscopic strain, and increases the localized plastic deformation susceptibility [37]. Third, defects such as unmelted particles act as stress concentration sites. These combined factors constrain the plastic deformation capability of the material. Therefore, higher stress amplitudes are required to achieve equivalent plastic strain levels. The stress amplitudes of X- and Y-directions specimens were comparable under identical plastic strain conditions, while Z-direction specimens exhibited the lowest stress amplitudes. As mentioned above, this could be related to the fact that the AM material had the highest dislocation slip gradient in the Z direction [29].

3.3. Fatigue Fracture Morphology and Microstructure

3.3.1. Fatigue Fracture Morphology

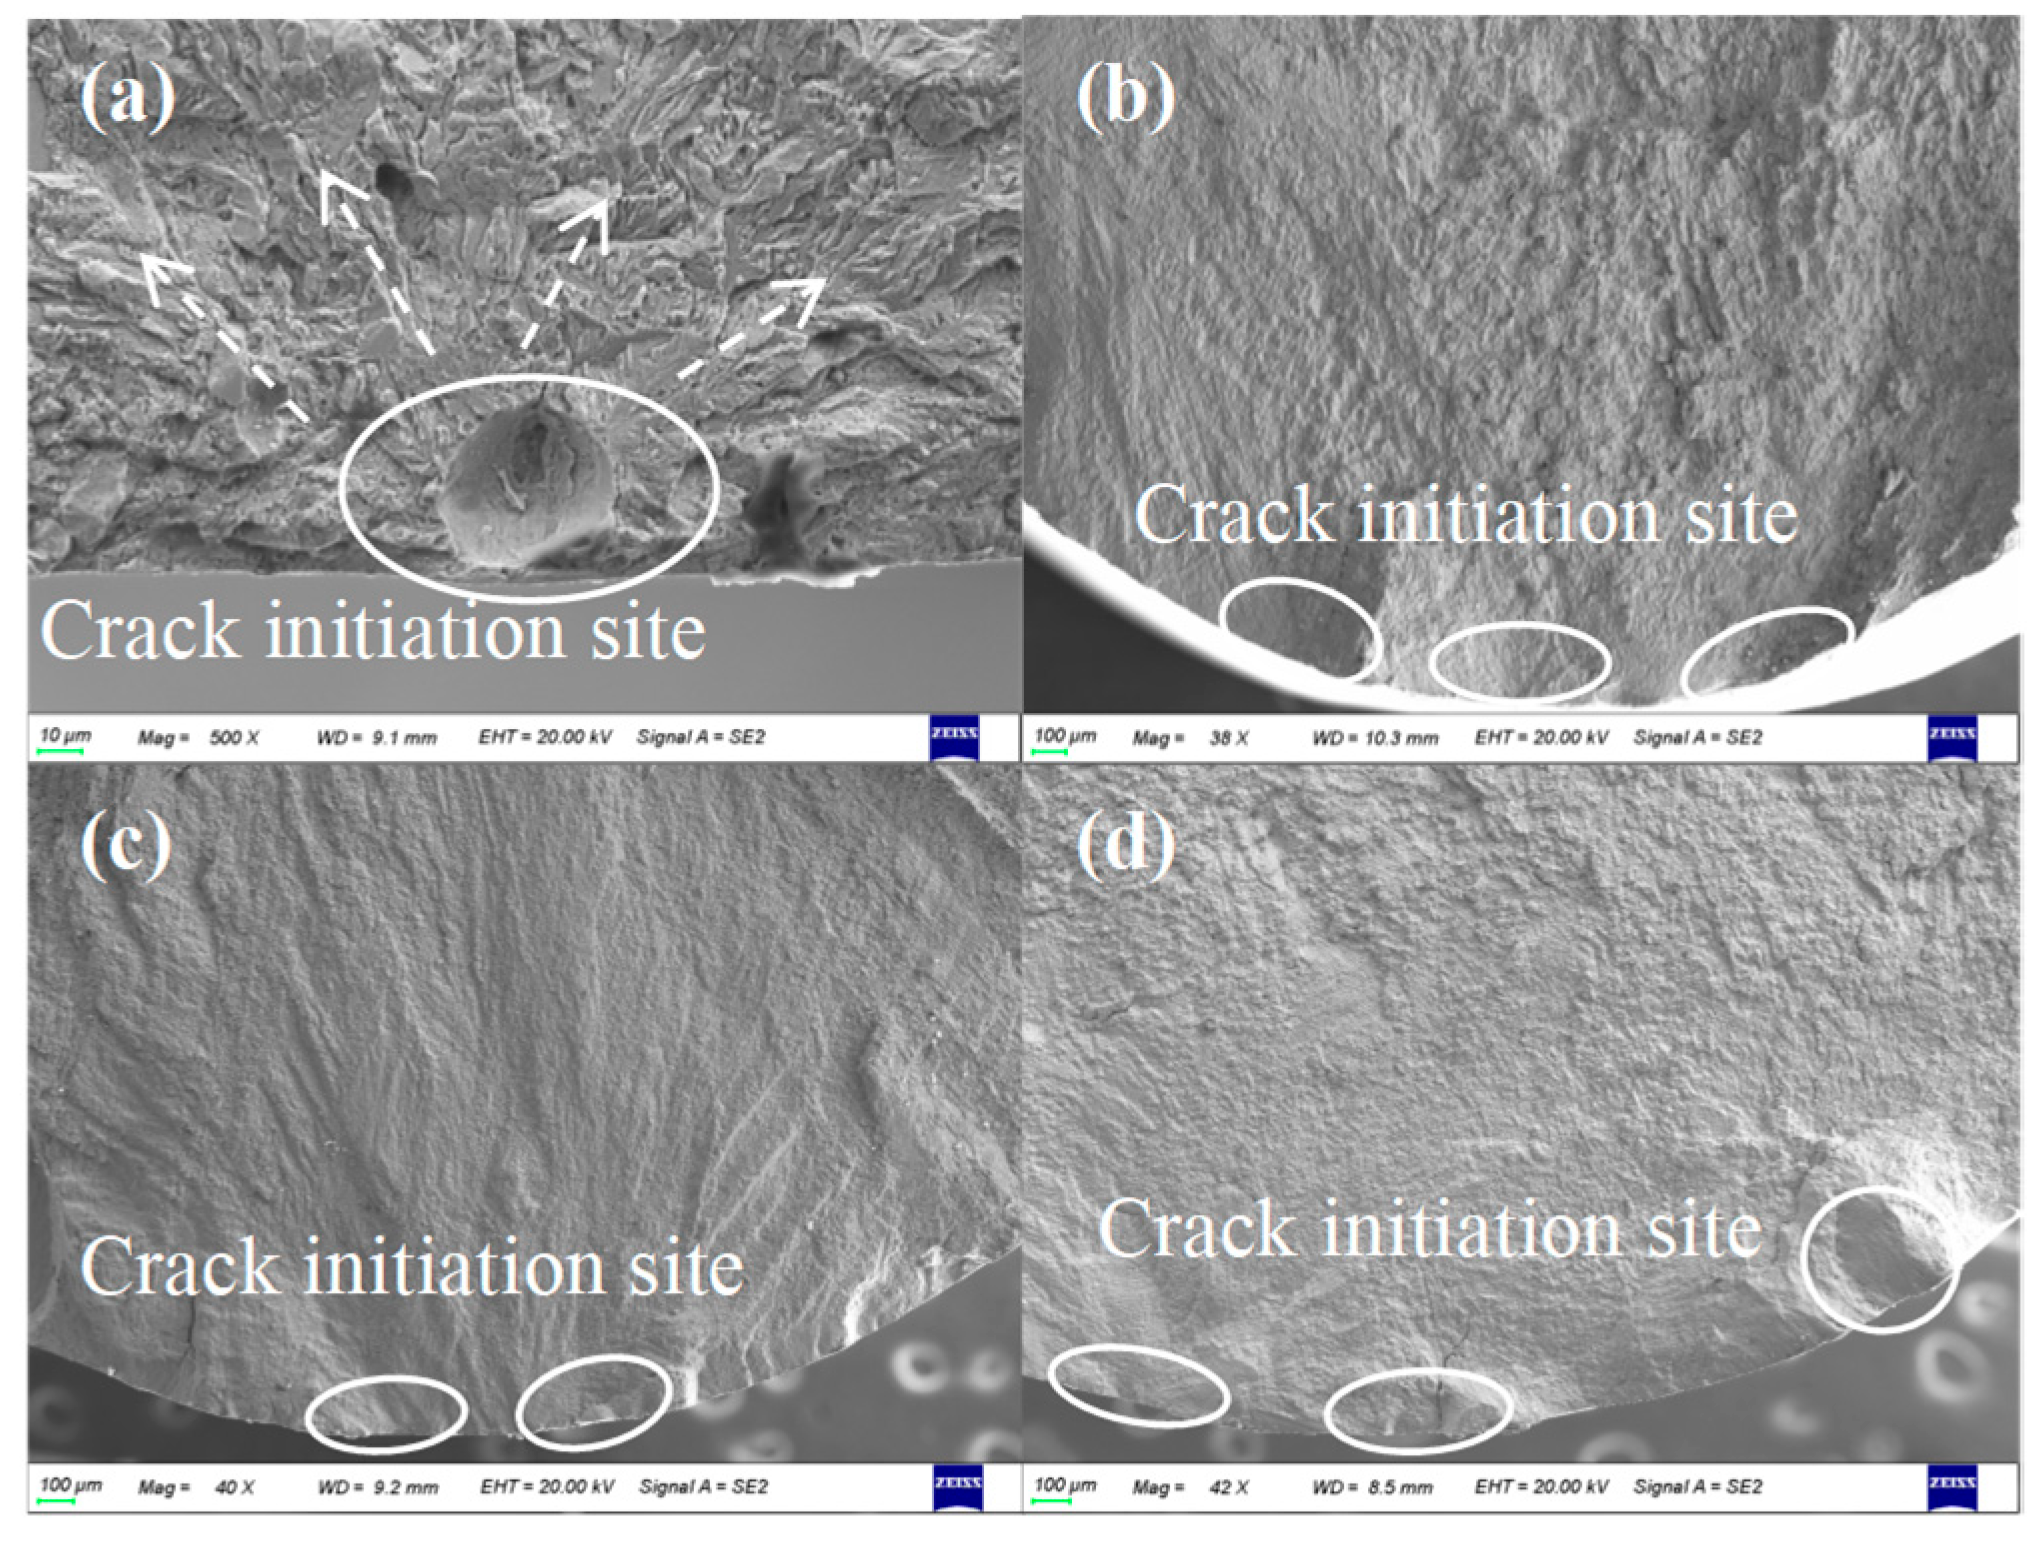
The fatigue fracture surface is typically divided into three characteristic zones: the crack initiation zone, the crack propagation zone, and the final fracture zone. The crack initiation area is the region where fatigue cracks first initiate and start to propagate. Figure 11 shows the morphological features of the crack initiation zone in forged and AM specimens under 0.6% strain amplitude. Distinct surface roughening phenomena were observed. It exhibited a radial flow pattern characterized by multiple grooves and tear ridges. As shown in Figure 11a, spherical pits were detected on the surface of the forged specimen. This is mainly attributed to defects such as mechanical processing defects and inclusions. These defect structures can induce pronounced localized plastic deformation and generate stress concentration effects within the material. Thus, they become preferred locations for fatigue crack nucleation and accelerate the crack initiation and propagation process.
At 0.6% strain amplitude condition, forged and AM specimens exhibited single and multiple crack initiation sites, respectively. This phenomenon in AM specimens is closely associated with inherent process-induced defects and microstructural inhomogeneities. Crack initiation sites are distributed either on the specimen surface or in near-surface regions. These typically occur at locations such as lack-of-fusion defects, spherical particle aggregation zones, and residual stress concentration areas. Additionally, localized weak points caused by fluctuations in energy input during arc melting or poor interlayer bonding also contribute to this behavior. These defect sites simultaneously function as stress concentration zones, promoting premature crack initiation and subsequent competitive propagation behavior during cyclic loading. Consequently, a multi-origin fatigue fracture pattern formed by this mechanism was ultimately formed on the fracture surface [38].
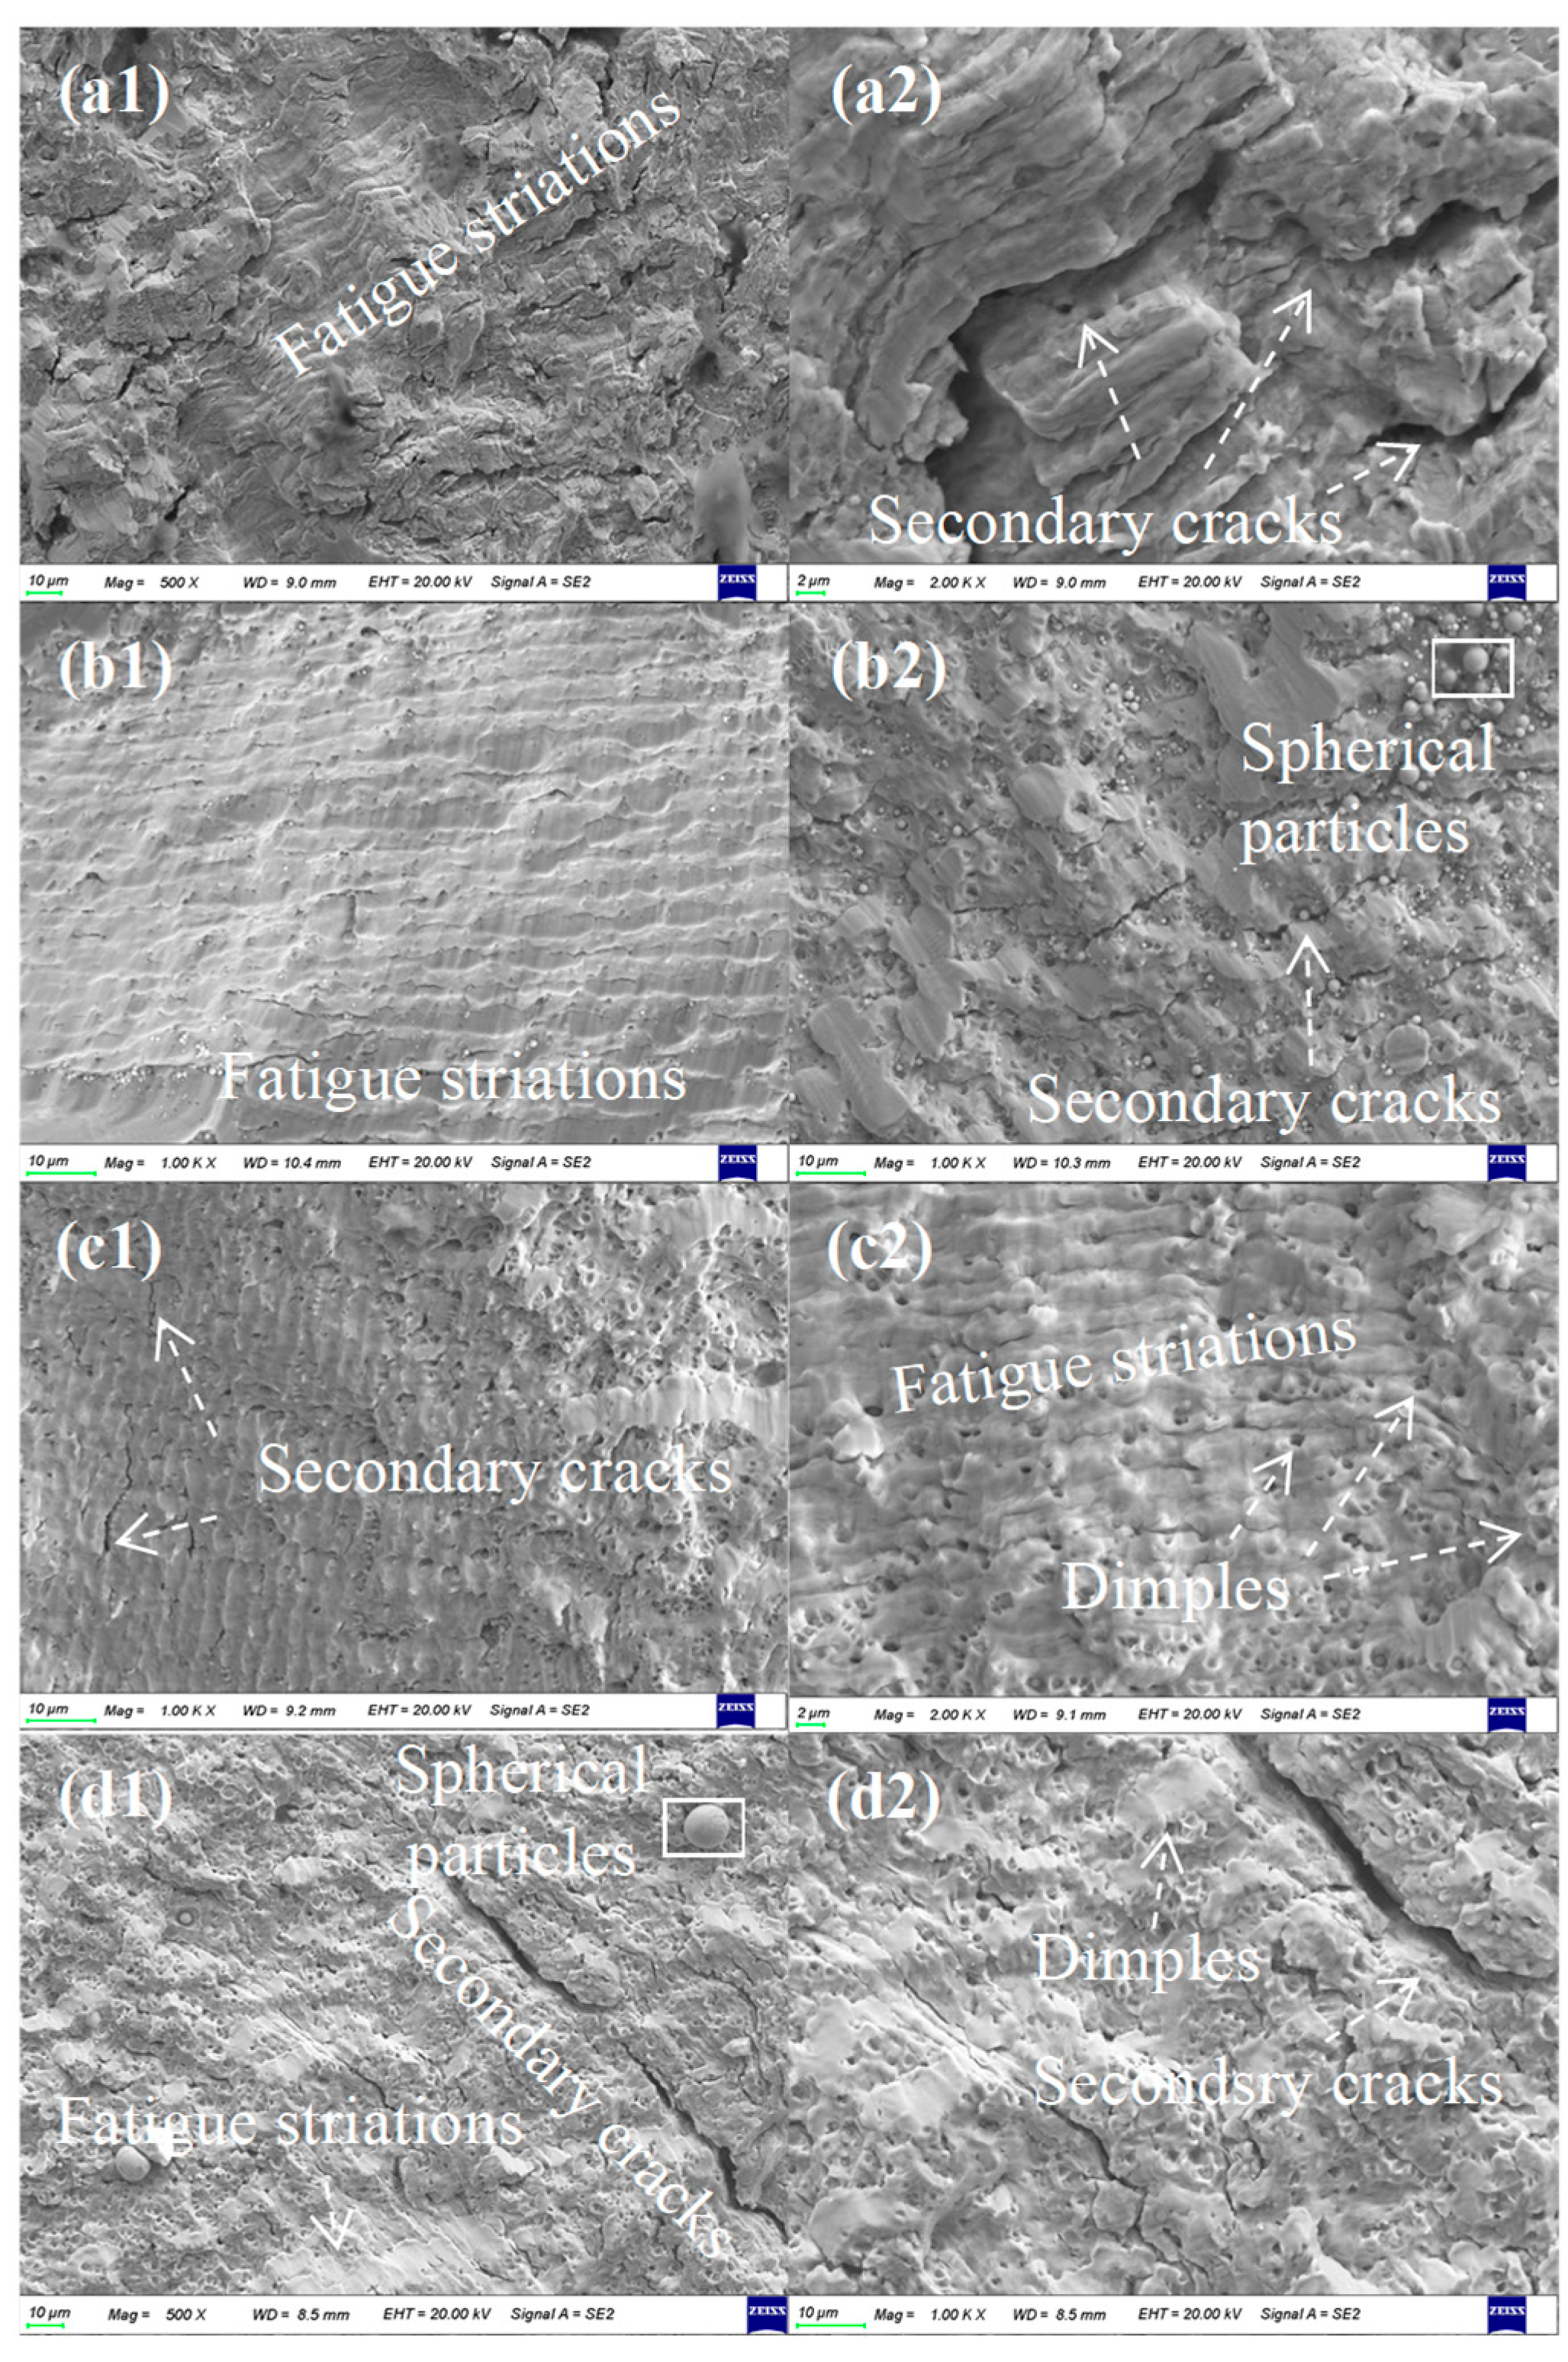
Figure 12 presents the crack propagation regions of both forged and AM specimens. The propagation zones exhibited distinct fatigue striations. Each striation corresponded to an individual stress cycle. The striation spacing served as a quantitative measure of crack growth per cycle. Forged specimens showed an average striation spacing of 2.0 μm, while the X-, Y-, and Z- direction specimens exhibited striation spacings of 2.5, 2.3 and 2.6 μm, respectively. Notably, AM specimens consistently showed larger striation spacings across all directions compared to forged specimens. The Z direction specimen showed the most pronounced spacing. This directional dependence of striation spacing correlated well with the experimentally determined shorter Nf of AM specimens.
The forged specimens in some areas exhibited secondary cracks. These secondary cracks relieved the stress concentration of the primary crack and promoted the passivation of the crack tip. So the crack propagation of the specimen could be delayed. Spherical particles were found in the AM specimens. These particles were incompletely melted particles that were caught in the melt pool and solidified inside the material. They acted as stress concentration points to promote the generation and propagation of cracks [39]. This constitutes one of the main reasons for the inferior fatigue properties of AM materials compared to their forged counterparts.
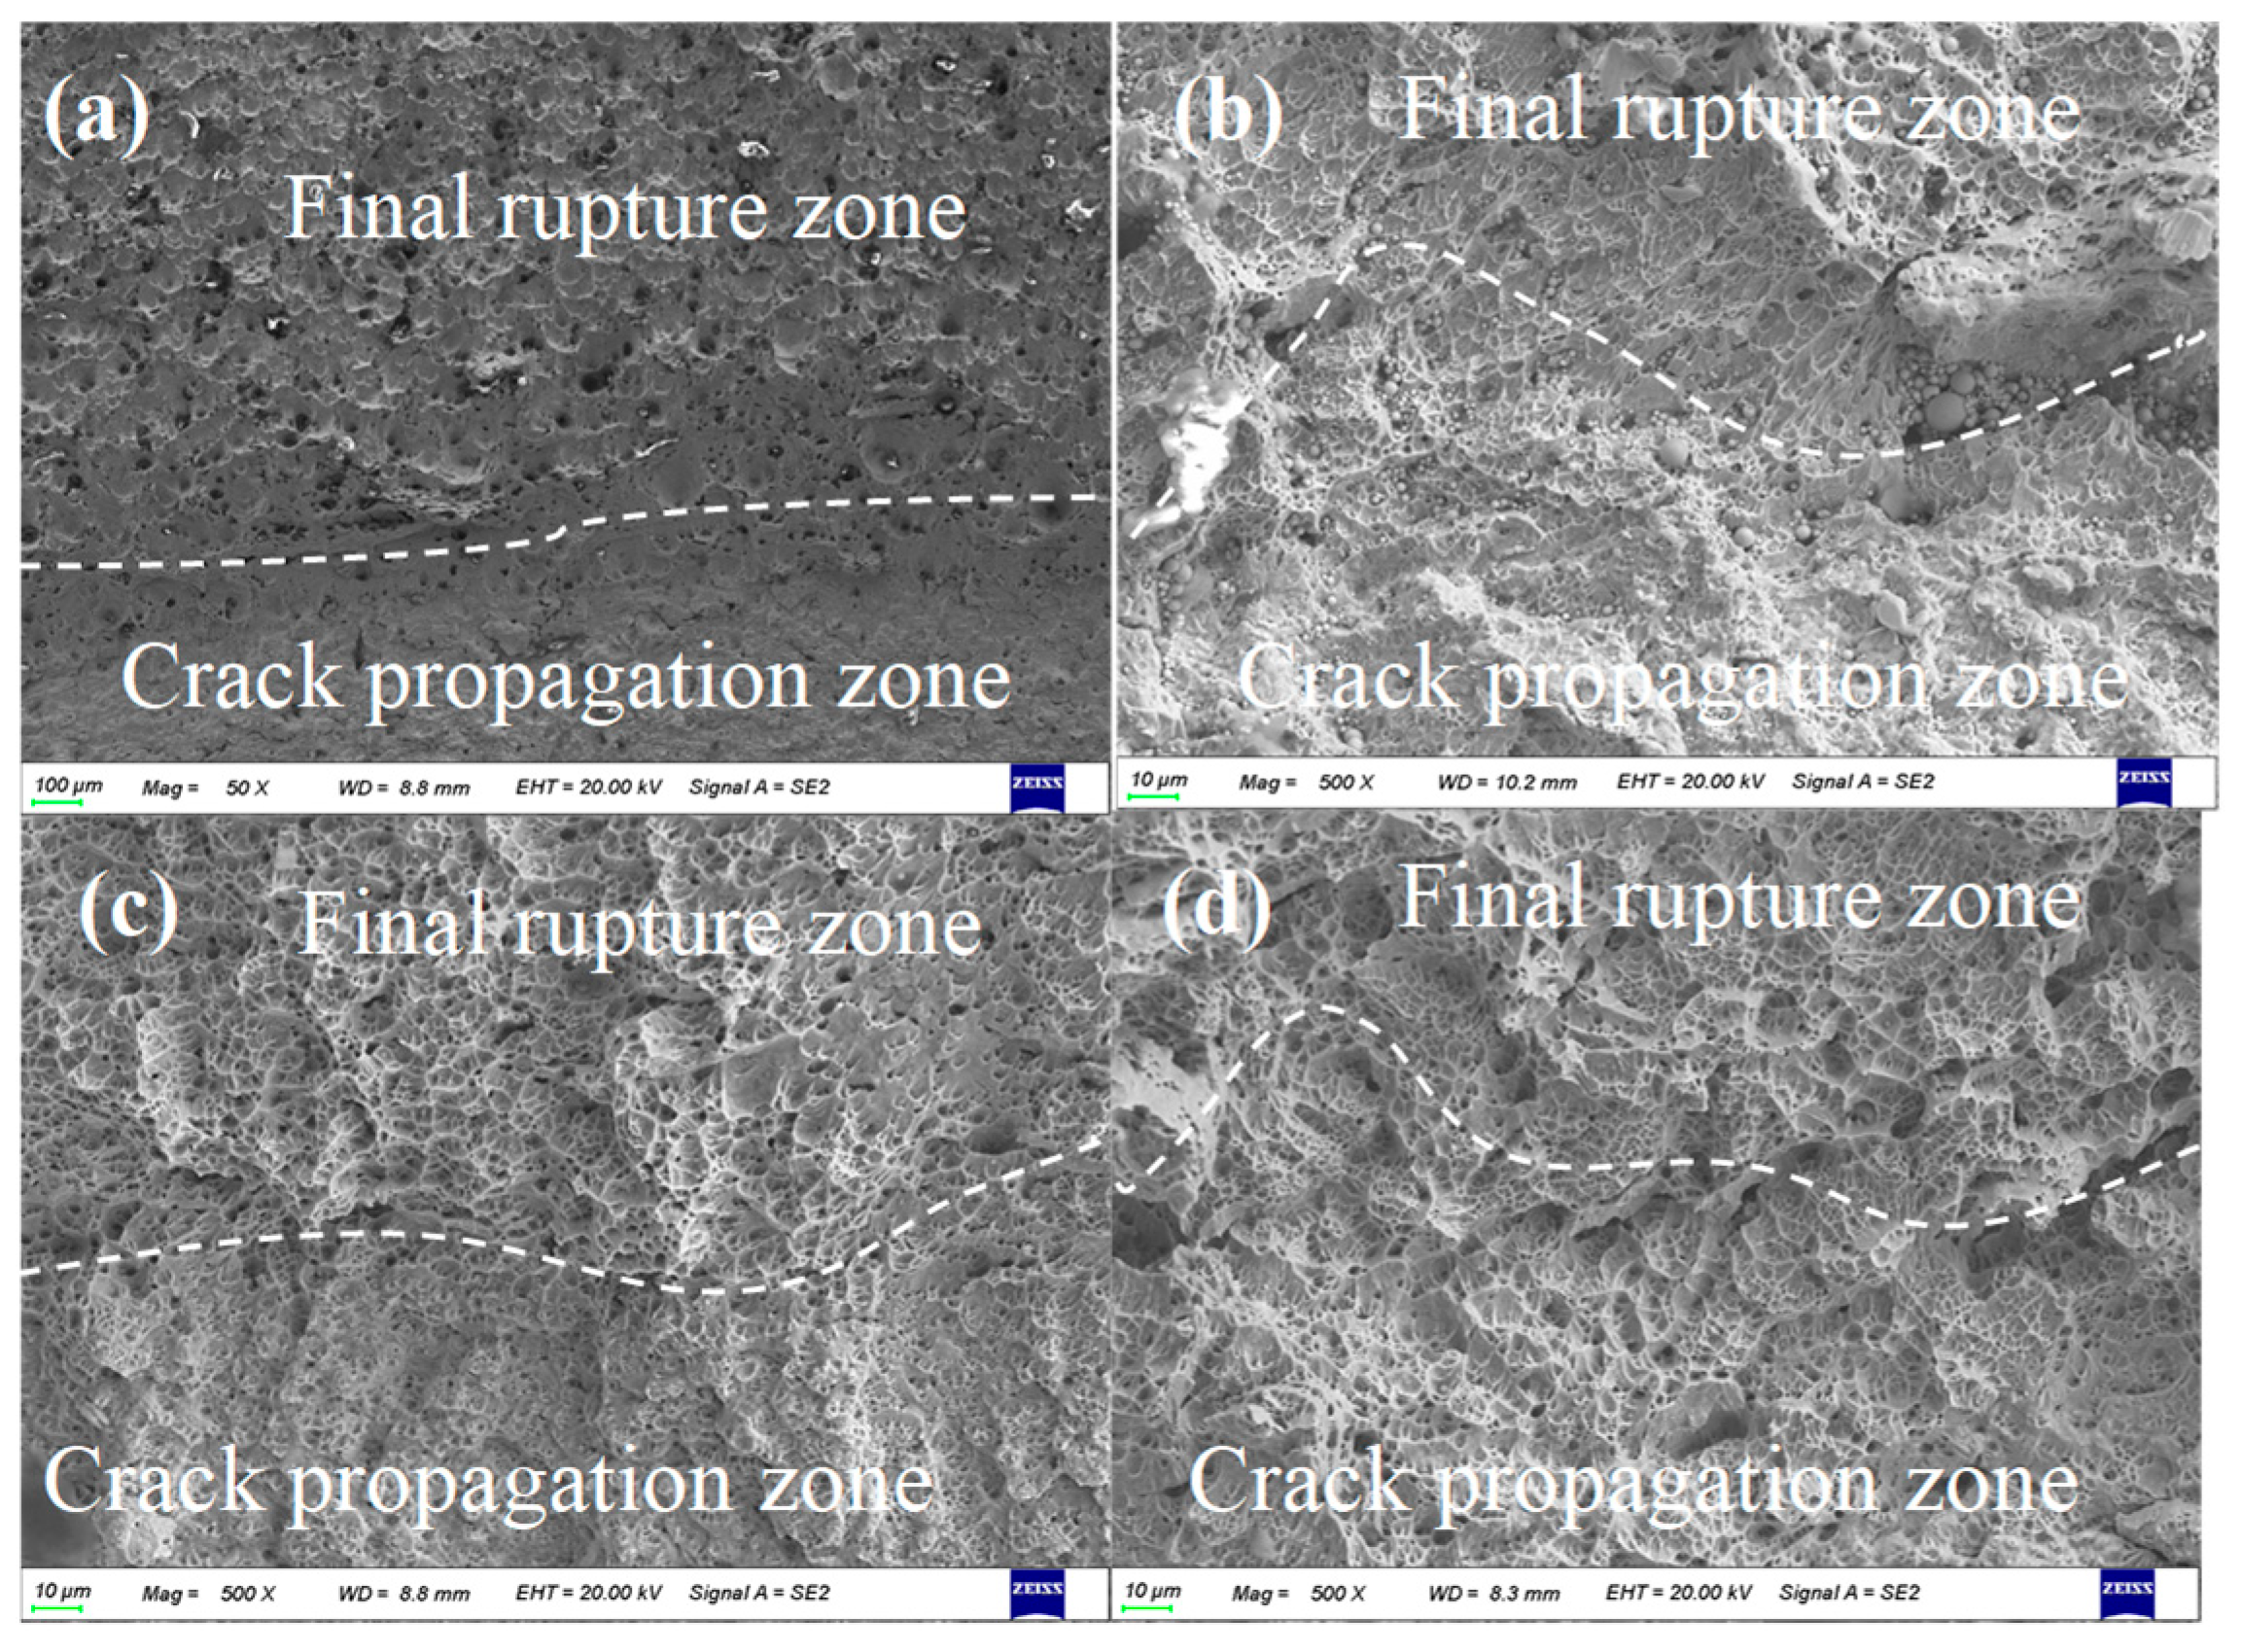
Figure 13 shows the transition zone between crack propagation area and final fracture area. It could be seen that numerous dimples were identified in both forged and AM specimens. These were typical characteristics of ductile fracture. The transition zone of forged materials was smoother because the microstructure of the material matrix was more uniform.

3.3.2. Fatigue Fracture Microstructure

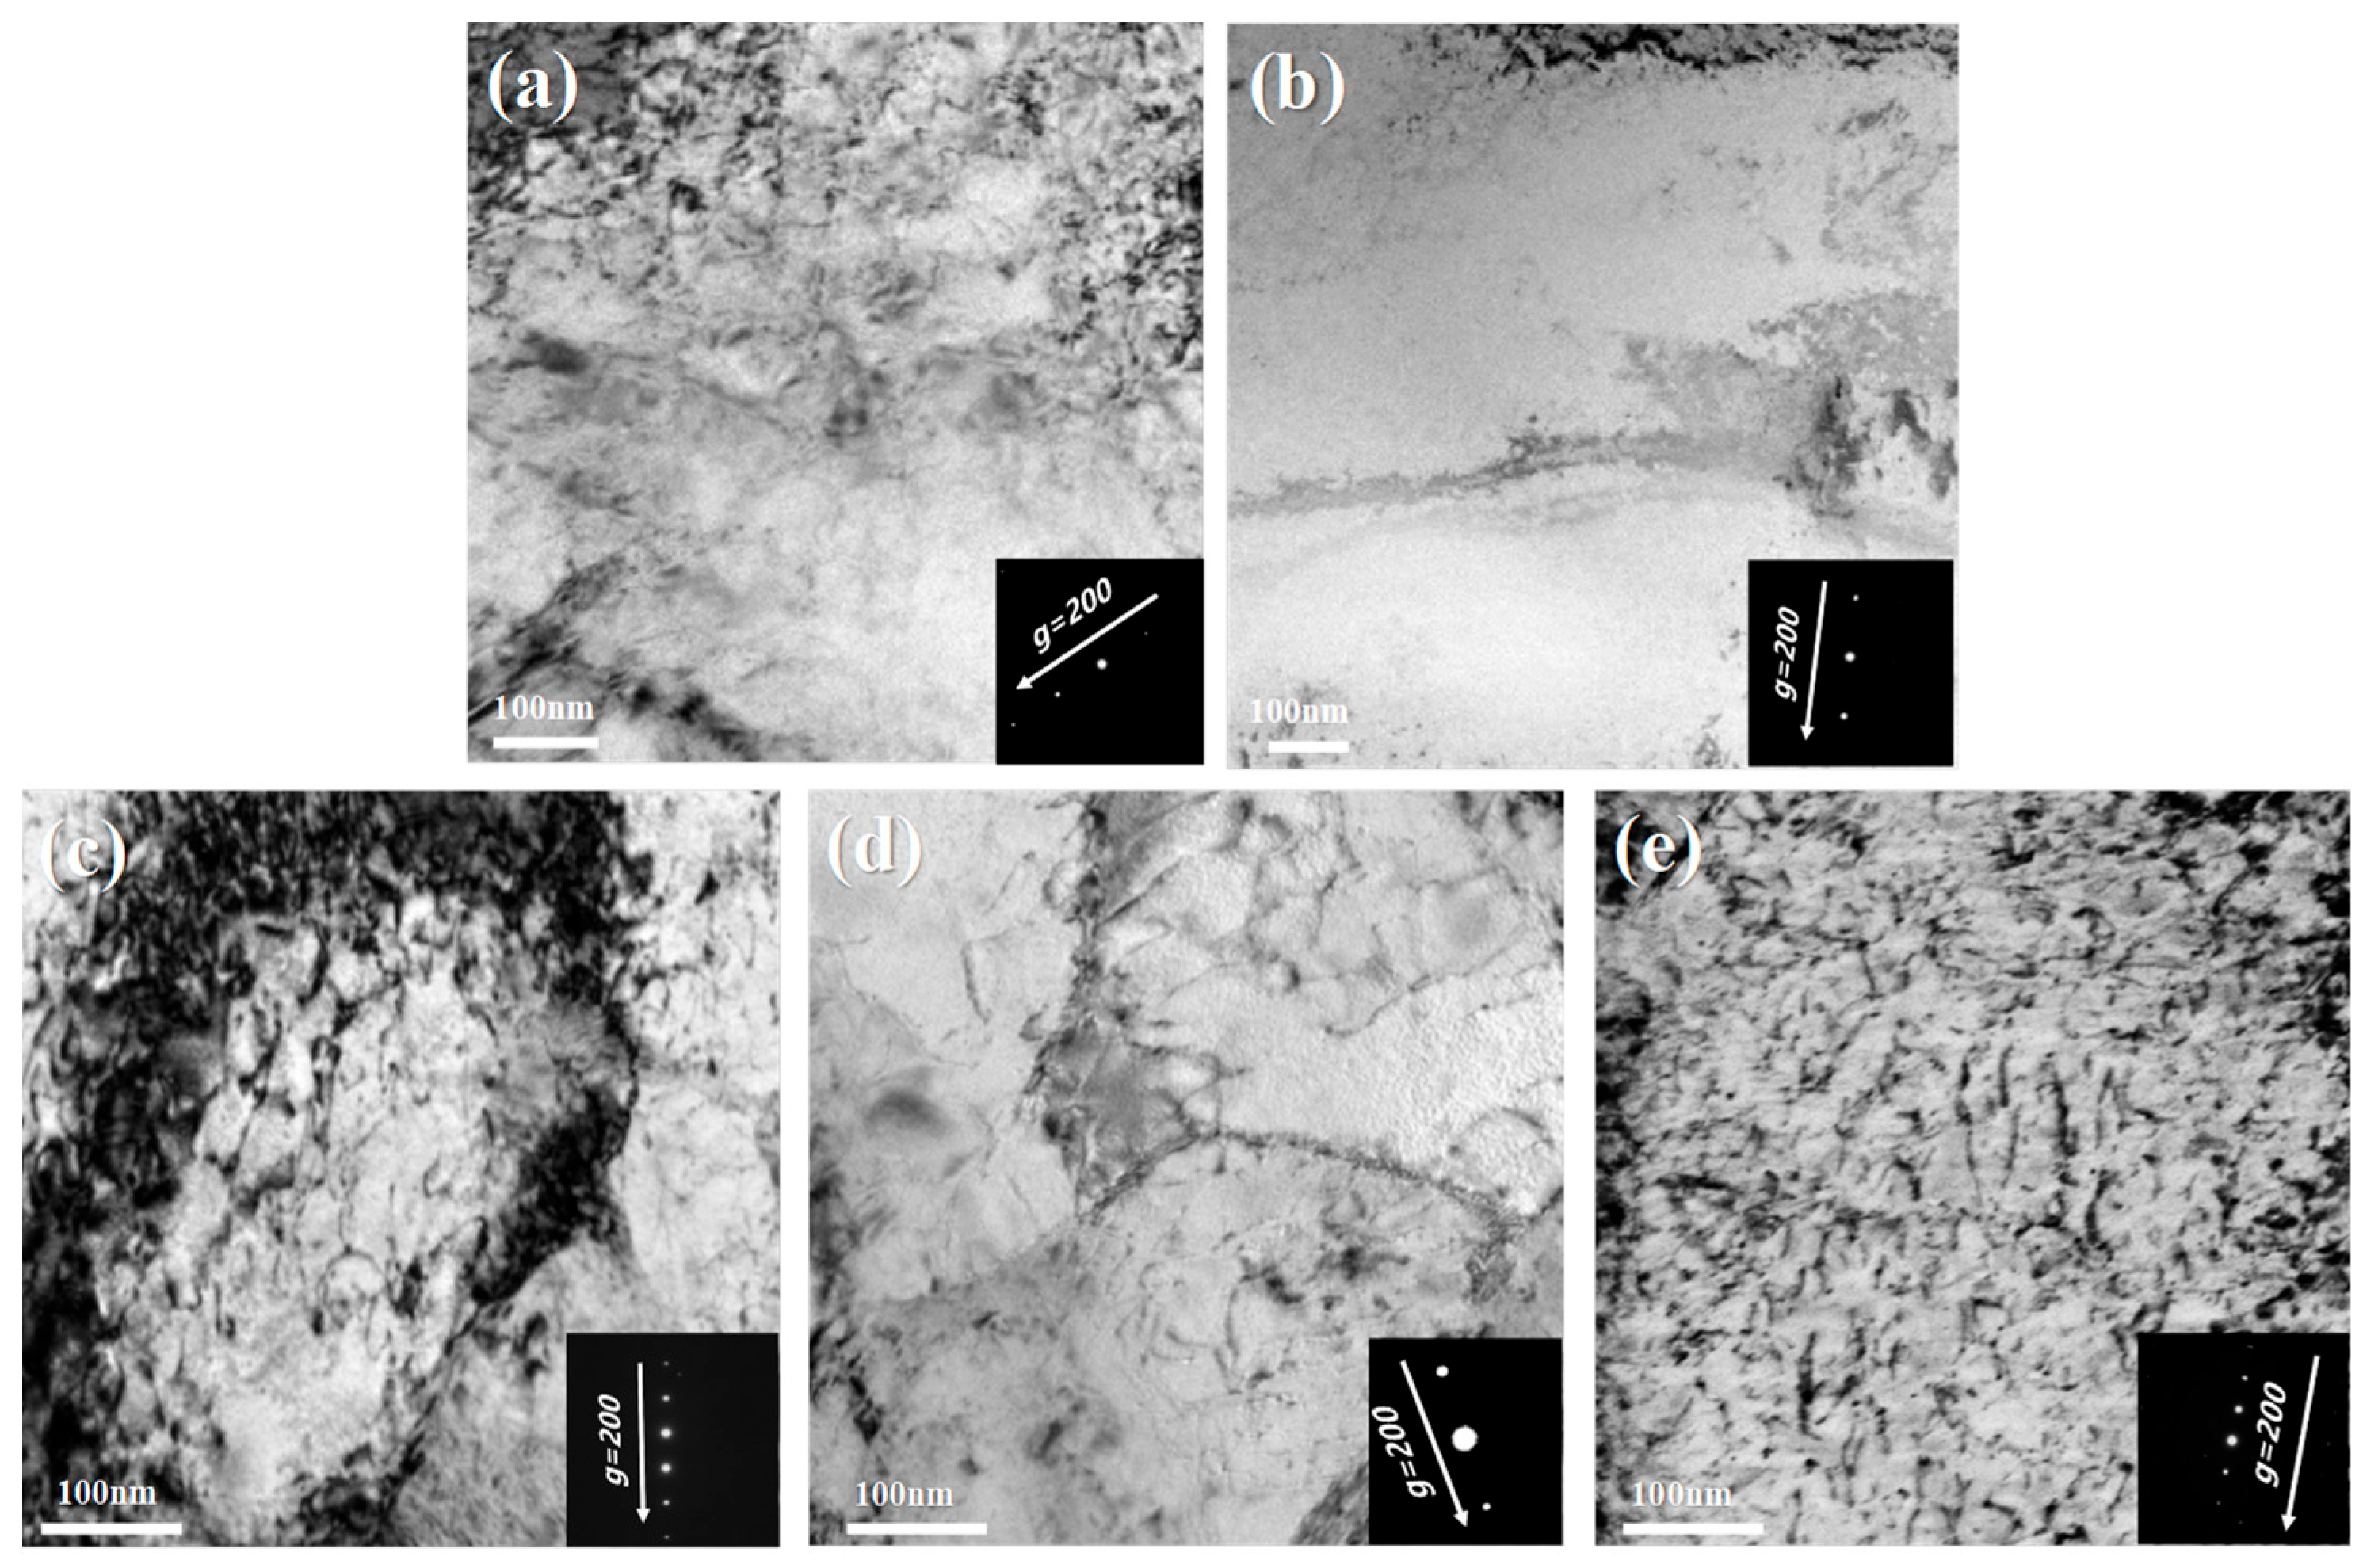
The internal microstructure of the crack propagation zone was characterized under TEM observation. Double beam conditions were employed (diffraction vector g = (200)). As shown in Figure 14, a large number of dislocation lines distributed inside the grains were found [40]. From the fundamental physical properties of dislocations, the plastic deformability of the material is directly affected by the dislocation density. Dislocation slip serves as the primary microscopic carrier of plastic deformation when the material undergoes cyclic loading [41].
As shown in Figure 14a,b, bright field images of different specimens were compared at 0.3% strain amplitude.
Forged specimen showed slightly higher dislocation density than AM Z-direction specimens. This reflected fewer mobile dislocations and more restricted activation of slip system in AM materials. The microscopic path of plastic deformation was thus reduced. During fatigue cycling, plastic deformation served as a crucial energy dissipation mechanism. Lower dislocation density meant that limited energy was absorbed by plastic deformation. The material was more inclined to release stress concentrations through brittle fracture paths. It was manifested as reduced fracture toughness values. In contrast, the forged specimen exhibited higher dislocation density. More slip systems provided the possibility for plastic deformation. The material underwent more significant plastic deformation before fracture. Macroscopically, this manifested as ductile fracture characteristics. The plastic strain amplitude was 0.171% for the forged material, compared to 0.125% for Z-direction specimen of AM material. This further confirms the above conclusion.
When the strain amplitude was raised to 0.6%, new features were found in the dislocation morphology and distribution. As shown in Figure 14c–e, the dislocation density was overall elevated in all specimens compared to that at 0.3% strain amplitude. The promotion of dislocation proliferation and slip by higher strain amplitude was confirmed. Among them, the forged specimen showed remarkable features. The dislocation density was significantly higher than that of the other specimens. Large-sized dislocation loops were simultaneously present. The formation of such dislocation loops was associated with dislocation interactions [42]. For instance, the presence of dislocation loops increased the resistance to dislocation motion and potentially inhibited long-range dislocation slip [43]. In the Z-direction specimen (Figure 14e), although dislocation lines and loops were present, their number density and geometric size were smaller than those in forged material. The dislocation interaction strength was relatively weak. Notably, the X-direction specimen (Figure 14d) exhibited further reduced number density of dislocation lines. The distribution of dislocation lines was flat and independent of each other. This configuration suggested that inter-dislocation interactions were effectively suppressed. The dislocation slip resistance was reduced, and smoother dislocation motion was realized in cyclic loading. Therefore, superior fatigue fracture resistance was demonstrated. In the fatigue test, the Nf of the X-direction specimen was 973 cycles; it exceeded the 693 cycles observed for the Z-direction specimen. This further validates the close correlation between dislocation distribution and material fatigue properties.
In summary, dislocation multiplication primarily occurred through single slip systems under low strain amplitude conditions, and the growth rate of dislocation density was relatively slow. Multiple slip systems were activated when high strain amplitude was imposed; dislocation interlacing and proliferation were promoted. This led to significantly increased dislocation density. The formation and evolution of dislocation loops were closely related to the stress state induced by strain amplitude. Dislocation cross-slip was more likely to occur in high-strain-amplitude conditions, and the interaction of dislocations with the second phase was enhanced. This eventually led to the formation of dislocation loops. These microstructural features modulated the fracture modes and mechanical properties of materials in specific ways. For example, the mean free range of dislocation motion was altered, the stress concentration factor was changed and the energy dissipation efficiency was modulated.

4. Conclusions

In the present study, the low-cycle fatigue behaviors of Z2CN19-10 controlled-nitrogen-content SS fabricated by AM and forged were investigated. Based on the experimental results, the main conclusions are as follows:
(1)
The microstructure of the AM materials showed anisotropy in the X, Y, and Z directions. The residual strain for AM materials was more obvious than forged material. The tensile and impact properties of the X, Y, and Z directions in AM materials were similar, while lower than forged materials.
(2)
The fatigue stresses of AM specimens were obviously higher than forged specimens at the same strain amplitude. The fatigue lifes of most Z-direction specimens were lower than X- and Y-directions, and all directions specimens lower than forged specimens.
(3)
During the fatigue strain amplitude range of 0.3% to 0.6%, the Z-direction specimens of AM materials showed the best plastic strain by the highest NT, while the Nf of the Z direction was obviously dispersed compared to the X and Y directions. The forged specimens showed the best fatigue properties under the plastic strain amplitude control mode.
(4)
Fatigue fracture surfaces of AM and forged materials exhibited multiple and single fatigue crack initiation sites, respectively, which was attributed to the presence of incompletely melted particles and manufacturing defects inside the AM specimens. The dislocation density of the forged fatigue specimens was the highest in the Z- and X-direction specimens of AM specimens, consistent with the fatigue life trend.

Author Contributions

Conceptualization, J.S., H.L. and Z.L.; methodology, H.W. and H.L.; investigation, H.D., X.M. and M.Y.; data curation, H.L., R.W. H.D., X.M. and M.Y.; writing—original draft preparation, J.S., H.L., Z.L. and R.W.; writing—review and editing, H.W.; project administration, J.S. and Z.L.; funding acquisition, H.W. J.S. and Z.L. All authors have read and agreed to the published version of the manuscript.

Funding

This research was funded by the National Natural Science Foundation of China (Grant No. 52101066).

Data Availability Statement

Data are contained within the article.

Conflicts of Interest

Authors Jianhui Shi and Zhengping Liu were employed by the company Yangjiang Nuclear Power Co., Ltd. The remaining authors declare that the research was conducted in the absence of any commercial or financial relationships that could be construed as a potential conflict of interest.

Abbreviations

The following abbreviations are used in this manuscript:
AMAdditive manufactured
WAAMWire Arc Additive Manufacturing
SSstainless steel
SEMScanning electron microscopy
TEMTransmission electron microscopy
EBSDElectron backscatter diffraction
RmTensile strength
Rp0.2Yield strength
ElfThe lower elongation after fracture
RAThe reduction of area
KV2Impact absorption energy
LELateral expansion
NfThe fatigue life
NTTransitional fatigue life
ΔεpPlastic strain amplitude
Δεe/2Elastic strain amplitude
Δεt/2Total strain amplitude

References

  1. Luo, Q.; Chen, Y.; Liu, S. The studies on the corrosion behaviors of 316NG and 304NG nitrogen-containing stainless steels made in China. Procedia Eng. 2012, 27, 1560–1567. [Google Scholar] [CrossRef]
  2. Şahin, S.; Übeyli, M. A Review on the Potential Use of Austenitic Stainless Steels in Nuclear Fusion Reactors. J. Fusion Energy 2008, 27, 271–277. [Google Scholar] [CrossRef]
  3. Wang, Y.; Chen, C.; Ren, R.; Xue, Z.; Wang, H.; Zhang, Y.; Wang, J.; Wang, J.; Chen, L.; Mu, W. Ferrite formation and decomposition in 316H austenitic stainless steel electro slag remelting ingot for nuclear power applications. Mater. Charact. 2024, 218, 114581. [Google Scholar] [CrossRef]
  4. Chen, Y.; Jing, S.; Liang, C.; Wang, Z.; Bin, F.; Bu, X.; Zhang, J.; Ling, Z.; Wang, X.; Zhang, R.; et al. Additive manufacturing of continuous fiber composite curved thin-walled structures with conformal honeycomb-stiffeners based on topology optimization. Mater. Des. 2025, 254, 114000. [Google Scholar] [CrossRef]
  5. Wu, B.; Pan, Z.; Ding, D.; Cuiuri, D.; Li, H.; Xu, J.; Norrish, J. A review of the wire arc additive manufacturing of metals: Properties, defects and quality improvement. J. Manuf. Process. 2018, 35, 127–139. [Google Scholar] [CrossRef]
  6. Zheng, J.; Hu, J.; Jiang, Y.; Wang, Q.; Yang, K. High temperature effects on fatigue performance and crack initiation mechanisms of 316LN stainless steel for nuclear power pipelines. J. Mater. Res. Technol. 2025, 35, 3281–3292. [Google Scholar] [CrossRef]
  7. Xiao, J.; Guo, W.; Zhang, H.; Dai, W.; Zhu, Y.; Cong, B.; Qi, Z.; Zhu, H.; Ren, X.; Li, M. Microstructure and mechanical properties of wire and arc additive manufactured 2319 aluminum alloy treated by laser shock peening. Mater. Charact. 2024, 217, 114354. [Google Scholar] [CrossRef]
  8. Braun, M.; Chen, T.; Shen, J.; Fassmer, H.; Klusemann, B.; Sheikhi, S.; Ehlers, S.; Müller, E.; Sarmast, A.; Schubnell, J. Fatigue crack initiation and propagation in plain and notched PBF-LB/M, WAAM, and wrought 316L stainless steel specimens. Mater. Des. 2024, 244, 113122. [Google Scholar] [CrossRef]
  9. Mendez-Morales, M.; Jesus, J.S.; Branco, R.; Tankova, T.; Rebelo, C. Fatigue crack growth of untreated and heat-treated WAAM ER70S-6 carbon steel. Int. J. Fatigue 2025, 198, 109008. [Google Scholar] [CrossRef]
  10. Ayan, Y.; Kahraman, N. Bending fatigue properties of structural steel fabricated through wire arc additive manufacturing (WAAM). Eng. Sci. Technol. Int. J. 2022, 35, 101247. [Google Scholar] [CrossRef]
  11. Gordon, J.V.; Haden, C.V.; Nied, H.F.; Vinci, R.P.; Harlow, D.G. Fatigue crack growth anisotropy, texture and residual stress in austenitic steel made by wire and arc additive manufacturing. Mater. Sci. Eng. A 2018, 724, 431–438. [Google Scholar] [CrossRef]
  12. Li, Y.; Zhang, S.; Yu, W.; Li, B.; Xuan, F.; Chen, X. Multiaxial low cycle fatigue behavior and life prediction of wire arc additive manufactured 308L stainless steel. Int. J. Fatigue 2024, 183, 108241. [Google Scholar] [CrossRef]
  13. Muhammad, M.; Lee, S.; Frye, P.; Simsiriwong, J.; Shao, S.; Shamsaei, N. High cycle and very high cycle fatigue behavior of additively manufactured Inconel 718: Effects of stress-relieving, surface texture, part orientation, and test frequency. Eng. Fail. Anal. 2025, 169, 109227. [Google Scholar] [CrossRef]
  14. Alhajeri, A.; Aremu, O.; Almutahhar, M.; Yousif, M.; Albinmousa, J.; Ali, U. On the effect of loading and printing parameters that influence the fatigue behavior of laser powder-bed fusion additively manufactured steels. Heliyon 2024, 10, e29229. [Google Scholar] [CrossRef] [PubMed]
  15. Ajay, V.; Nakrani, J.; Mishra, N.K.; Shrivastava, A. Anisotropic fatigue crack propagation in wire arc additively manufactured 316L stainless steel. Int. J. Fatigue 2023, 177, 107976. [Google Scholar] [CrossRef]
  16. Hong, X.; Liu, T.; Zhang, J.; Ding, D.; Yuan, L. A review of strategies to control process-induced cracks in metal additive manufacturing and remanufacturing. Mater. Today Commun. 2025, 43, 111801. [Google Scholar] [CrossRef]
  17. Hu, Y.; Chen, Z.; Xi, J.; Jiang, J.; Berto, F.; Nikbin, K. Defect characteristics-based low-cycle fatigue life prediction model for additive manufactured Ti-6Al-4 V alloys. Theor. Appl. Fract. Mech. 2024, 134, 104737. [Google Scholar] [CrossRef]
  18. Zhang, W.; Li, R.; Peng, Y.; Xu, H. A static and high-cycle fatigue characterization framework of metallic lattice structures additive manufactured via fused deposition modeling based method. Mater. Des. 2025, 252, 113761. [Google Scholar] [CrossRef]
  19. Aguiar, J.A.; Jokisaari, A.M.; Kerr, M. Allen Roach, R. Bringing nuclear materials discovery and qualification into the 21st century. Nat. Commun. 2020, 11, 2556. [Google Scholar] [CrossRef]
  20. Weixing, X.U.; Weicheng, X.U. Comparison and understanding of the main revision contents of GB/T 228.1—2021. Phys. Test. Chem. Anal. Part A Phys. Test. 2022, 58, 1–4. [Google Scholar]
  21. Liu, Y.; Zheng, X.-M.; Li, Q.-M.; Liu, P.-Y.; Ji, H.-C.; Du, L.-X. Microstructure and Properties of Coarse Grain Zone in Single-Pass Welding of V-N Microalloyed Steel. J. Mater. Eng. Perform. 2025, 34, 4350–4358. [Google Scholar] [CrossRef]
  22. Guo, N.; Yu, J.; Zhou, Q.; Wang, J.; Xiao, G.; Tang, B.; Zhang, Z. Enhancing low-cycle fatigue performance of high-efficient laser additively manufactured TC11 titanium alloy: Mechanisms of cyclic softening/hardening and microstructural refinement. J. Mater. Res. Technol. 2025, 36, 2485–2500. [Google Scholar] [CrossRef]
  23. Han, S.; Dung Dinh, T.; De Baere, I.; Van Paepegem, W. Relation between ASTM E606 specimen geometry and misalignment in strain-controlled fatigue testing. Int. J. Fatigue 2023, 166, 107282. [Google Scholar] [CrossRef]
  24. Wang, H.; Liu, C.-W.; Wu, T.; Peng, H.-X. Laser-Directed EnergYDeposited Ti-6Al-4V: The Anisotropy of Its Microstructure, Mechanical Properties, and Fracture Behavior. Materials 2025, 18, 2360. [Google Scholar] [CrossRef]
  25. Pang, J.C.; Li, S.X.; Wang, Z.G.; Zhang, Z.F. General relation between tensile strength and fatigue strength of metallic materials. Mater. Sci. Eng. A 2013, 564, 331–341. [Google Scholar] [CrossRef]
  26. Lukáš, P.; Klesnil, M. Cyclic stress-strain response and fatigue life of metals in low amplitude region. Mater. Sci. Eng. 1973, 11, 345–356. [Google Scholar] [CrossRef]
  27. Suthar, H.; Sharma, M.; Bhattacharya, A.; Kumar Paul, S. Zone-wise low cycle fatigue behavior of AA6061-T6 similar friction stir welding. Int. J. Fatigue 2024, 182, 108155. [Google Scholar] [CrossRef]
  28. Raman, S.G.S.; Radhakrishnan, V.M. On cyclic stress–strain behaviour and low cycle fatigue life. Mater. Des. 2002, 23, 249–254. [Google Scholar] [CrossRef]
  29. Kappacher, J.; Renk, O.; Kiener, D.; Clemens, H.; Maier-Kiener, V. How grain boundary characteristics influence plasticity close to and above the critical temperature of ultra-fine grained bcc Ta2.5W. Acta Mater. 2021, 216, 117110. [Google Scholar] [CrossRef]
  30. Abareshi, M.; Emadoddin, E. Effect of retained austenite characteristics on fatigue behavior and tensile properties of transformation induced plasticity steel. Mater. Des. 2011, 32, 5099–5105. [Google Scholar] [CrossRef]
  31. Zhong, Y.; Shan, Y.; Xiao, F.; Yang, K. Effect of toughness on low cycle fatigue behavior of pipeline steels. Mater. Lett. 2005, 59, 1780–1784. [Google Scholar] [CrossRef]
  32. Javidrad, H.; Bahattin, K.; Hakan, B.; Ugur, S.; Gunaydin, K. Fatigue performance of metal additive manufacturing: A comprehensive overview. Virtual Phys. Prototyp. 2024, 19, 1745–2759. [Google Scholar] [CrossRef]
  33. Lefebvre, D.; Ellyin, F. Cyclic response and inelastic strain energy in low cycle fatigue. Int. J. Fatigue 1984, 6, 9–15. [Google Scholar] [CrossRef]
  34. Carneiro, L.; Jalalahmadi, B.; Ashtekar, A.; Jiang, Y. Cyclic deformation and fatigue behavior of additively manufactured 17–4 PH stainless steel. Int. J. Fatigue 2019, 123, 22–30. [Google Scholar] [CrossRef]
  35. Kamaya, M. Ramberg–Osgood type stress–strain curve estimation using yield and ultimate strengths for failure assessments. Int. J. Press. Vessel. Pip. 2016, 137, 1–12. [Google Scholar] [CrossRef]
  36. An, D.; Liu, X.; Xiao, Y.; Li, X.; Chen, J. Correlating the evolution of spatial-resolved microscale residual stress and the associated dislocation behavior in additively manufactured 316L stainless steel upon short-term annealing. Addit. Manuf. 2025, 106, 104807. [Google Scholar] [CrossRef]
  37. Cao, F.; Zhang, T.; Ryder, M.A.; Lados, D.A. A Review of the Fatigue Properties of Additively Manufactured Ti-6Al-4V. JOM 2018, 70, 349–357. [Google Scholar] [CrossRef]
  38. Li, J.; Sun, J.; Qian, G.; Shi, L. Defect-induced cracking and fine granular characteristics in verYhigh-cycle fatigue of laser powder bed fusion AlSi10Mg alloy. Int. J. Fatigue 2022, 158, 106770. [Google Scholar] [CrossRef]
  39. Sanaei, N.; Fatemi, A. Defects in additive manufactured metals and their effect on fatigue performance: A state-of-the-art review. Prog. Mater Sci. 2021, 117, 100724. [Google Scholar] [CrossRef]
  40. Xu, W.; Jiang, R.; Xu, M.; Delaney, C.; Yang, Y.; Torresani, E.; Shaikh, M.; Yan, Y.; Olevsky, E. High dislocation density formation in metallic materials by ultra-intense nanopulsing electric current. J. Alloys Compd. 2025, 1025, 180267. [Google Scholar] [CrossRef]
  41. Zhao, Y.; Zhang, Z.; Huang, C.; Yang, J.; Tan, C.; Wan, M.; Zhao, Y. Influence of multilevel lamellar microstructure on notch high cycle fatigue properties and crack initiation behavior of Ti-55531 alloy. J. Alloys Compd. 2025, 1010, 177684. [Google Scholar] [CrossRef]
  42. Liu, S.M.; Li, S.-H.; Han, W.-Z. Effect of ordered helium bubbles on deformation and fracture behavior of α-Zr. J. Mater. Sci. Technol. 2019, 35, 1466–1472. [Google Scholar] [CrossRef]
  43. Ispánovity, P.D.; Ugi, D.; Péterffy, G.; Knapek, M.; Kalácska, S.; Tüzes, D.; Dankházi, Z.; Máthis, K.; Chmelík, F.; Groma, I. Dislocation avalanches are like earthquakes on the micron scale. Nat. Commun. 2022, 13, 1975. [Google Scholar] [CrossRef] [PubMed]
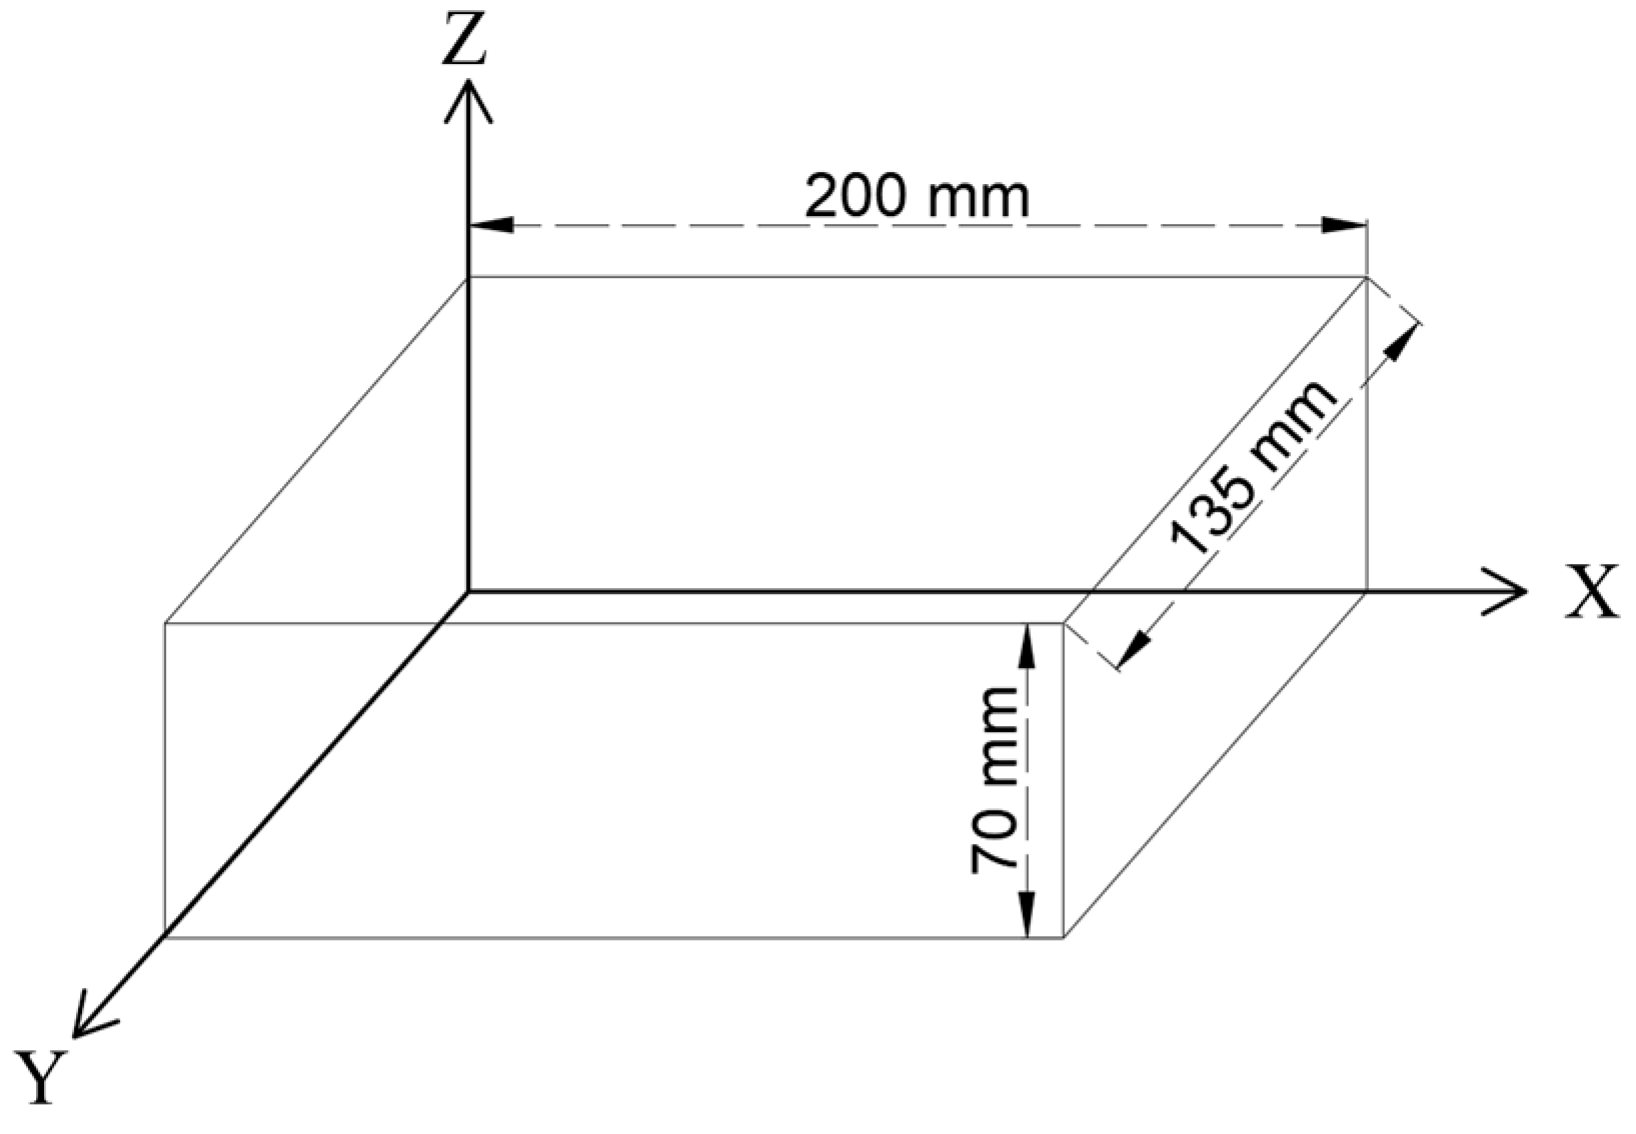
Figure 1. The dimensions and directions of AM materials.
Crystals 15 00644 g001
Figure 2. The shape and size of low-cycle fatigue specimens.
Crystals 15 00644 g002
Figure 3. Metallographic analysis of Z2CN19-10 controlled-nitrogen-content SS materials: (a) specimen of forged material; (b) AM material specimen in the X direction; (c) AM material specimen in the Y direction; (d) AM material specimen in the Z direction.
Crystals 15 00644 g003
Figure 4. EBSD analysis of Z2CN19-10 controlled nitrogen content SS materials: (a1,a2) specimen of forged material; (b1,b2) AM material specimen in the X direction; (c1,c2) AM material specimen in the Y direction; (d1,d2) AM material specimen in the Z direction.
Crystals 15 00644 g004
Figure 5. Room temperature tensile and impact performance curves of Z2CN19-10 controlled-nitrogen-content SS materials: (a) tensile performance; (b) impact performance.
Crystals 15 00644 g005
Figure 6. Cyclic stress response curves corresponding to strain amplitudes of 0.4%, 0.5%, and 0.6% for Z2CN19-10 controlled-nitrogen-content SS materials: (a) specimens of forged material; (b) AM material specimens in the X direction; (c) AM material specimens in the Y direction; (d) AM material specimens in the Z direction.
Crystals 15 00644 g006
Figure 7. The low-cycle fatigue strain–life relationship of Z2CN19-10 controlled-nitrogen-content SS materials: (a) specimens of forged material; (b) AM material specimens in the X direction; (c) AM material specimens in the Y direction; (d) AM material specimens in the Z direction.
Crystals 15 00644 g007
Figure 8. Summary of strain–fatigue life curves.
Crystals 15 00644 g008
Figure 9. The stress–strain hysteresis loops of Z2CN19-10 controlled-nitrogen-content SS materials: (a) specimens of forged material; (b) AM material specimens in the X direction; (c) AM material specimens in the Y direction; (d) AM material specimens in the Z direction.
Crystals 15 00644 g009
Figure 10. Cycle stress–strain relationship of Z2CN19-10 controlled-nitrogen-content SS materials.
Crystals 15 00644 g010
Figure 11. Fatigue source morphology of Z2CN19-10 controlled-nitrogen-content SS materials at 0.6% strain amplitude: (a) specimen of forged material; (b) AM material specimen in the X direction; (c) AM material specimen in the Y direction; (d) AM material specimen in the Z direction.
Crystals 15 00644 g011
Figure 12. The crack propagation zone morphology of Z2CN19-10 controlled-nitrogen-content SS materials at 0.6% strain amplitude: (a1,a2) specimen of forged material; (b1,b2) AM material specimen in the X direction; (c1,c2) AM material specimen in the Y direction; (d1,d2) AM material specimen in the Z direction.
Crystals 15 00644 g012
Figure 13. The transition zone between the crack propagation area and final fracture area of Z2CN19-10 controlled-nitrogen-content SS materials at 0.6% strain amplitude: (a) specimen of forged material; (b) AM material specimen in the X direction; (c) AM material specimen in the Y direction; (d) AM material specimen in the Z direction.
Crystals 15 00644 g013
Figure 14. Fatigue fracture microstructure of Z2CN19-10 controlled-nitrogen-content SS materials at 0.3% and 0.6% strain amplitude: (a) forged material of 0.3% strain amplitude, (b) AM material specimen in Z direction of 0.3% strain amplitude, (c) forged material of 0.6% strain amplitude, (d) AM material specimen in X direction of 0.6% strain amplitude, (e) AM material specimen in Z direction of 0.3% strain amplitude.
Crystals 15 00644 g014
Table 1. Chemical composition of Z2CN19-10 controlled nitrogen content SS (wt.%).
Manufacturing
Method
CSiMnPSCrNiCuN
AM0.0250.521.980.020<0.01019.969.43<0.040.037
Forge0.0230.501.370.023<0.01018.709.060.0680.066
Disclaimer/Publisher’s Note: The statements, opinions and data contained in all publications are solely those of the individual author(s) and contributor(s) and not of MDPI and/or the editor(s). MDPI and/or the editor(s) disclaim responsibility for any injury to people or property resulting from any ideas, methods, instructions or products referred to in the content.