Article

Experimental Investigation on Fatigue Crack Propagation in Surface-Hardened Layer of High-Speed Train Axles

1
School of Civil Engineering, Harbin University, Harbin 150086, China
2
Heilongjiang Province Key Laboratory of Underground Engineering Technology, Harbin University, Harbin 150086, China
3
College of Science, Heilongjiang University of Science and Technology, Harbin 150020, China
4
Heilongjiang Zhongbei Post and Telecommunications Construction and Development Company, Harbin 150036, China
5
Zhongte (Shenzhen) Intelligent Co., Ltd., Shenzhen 518000, China
6
School of Automation and Electrical Engineering, Linyi University, Linyi 276000, China
7
Department of Civil Engineering, University of California, Los Angeles, CA 90095, USA
*
Author to whom correspondence should be addressed.
Crystals 2025, 15(7), 638; https://doi.org/10.3390/cryst15070638
Submission received: 19 June 2025 / Revised: 5 July 2025 / Accepted: 9 July 2025 / Published: 11 July 2025
(This article belongs to the Special Issue Fatigue and Fracture of Crystalline Metal Structures)

Abstract

This study examines fatigue crack growth behavior in induction-hardened S38C axle steel with a gradient microstructure. High-frequency three-point bending fatigue tests were conducted to evaluate crack growth rates (da/dN) across three depth-defined regions: a hardened layer, a heterogeneous transition zone, and a normalized core. Depth-resolved da/dN–ΔK relationships were established, and Paris Law parameters were extracted. The surface-hardened layer exhibited the lowest crack growth rates and flattest Paris slope, while the transition zone showed notable scatter due to microstructural heterogeneity and residual stress effects. These findings provide experimental insight into the fatigue performance of gradient-structured axle steels and offer guidance for fatigue life prediction and inspection planning.

1. Introduction

High-speed railways have emerged as a cornerstone of modern sustainable transportation, with over 80,000 km of operational high-speed tracks worldwide by 2025 [1,2]. The reliability of key components like axles is critical, as fatigue failure in their surface-hardened layers poses significant safety risks [3,4,5]. Axles endure cyclic loading exceeding 108 cycles during their service life, necessitating investigations into very high cycle fatigue (VHCF) behavior, which is defined as fatigue failure beyond 107 cycles [6,7,8,9,10,11,12,13,14]. Traditional studies [15,16,17,18,19,20,21] on fatigue crack propagation (FCP) often focus on low-to-high cycle regimes, leaving a knowledge gap in VHCF mechanisms for gradient microstructures [22,23,24,25] in hardened layers.
The surface-hardened layer of axles [26,27,28,29,30,31], typically composed of tempered martensite (0–2 mm depth), transitions to pearlite–ferrite mixtures in the core region [23,32,33,34,35]. This gradient microstructure, induced by induction heating, enhances wear [36,37,38] and fatigue resistance [39,40,41,42,43]. However, in VHCF regimes, crack initiation from sub-surface inclusions or microstructural defects becomes prevalent, differing from high cycle fatigue (HCF) failure modes [44,45,46,47]. For instance, Pan et al. [48,49] observed that in titanium alloys, VHCF cracks initiate from nanograin formations near inclusion–matrix interfaces, while core materials exhibit faster crack growth rates. Such findings highlight the need to link microstructural gradients with VHCF performance in axle steels.
Additive manufacturing (AM), particularly laser-based powder bed fusion, has revolutionized material design by enabling tailored gradient microstructures [50,51,52,53,54,55,56]. Unlike conventional induction hardening, AM allows precise control over hardness [57,58] and phase distributions, potentially optimizing fatigue resistance [59]. In axle steels, AM could mitigate stress concentrations by integrating gradient layers with tailored hardness profiles, though its application in large-scale components like axles remains underexplored.
Current research on axle fatigue primarily relies on conventional testing methods, overlooking the synergistic effects of microstructural gradients and VHCF. Studies by Zhang et al. [23] revealed that in S38C steel, the hardened layer’s tempered martensite delays crack propagation, but the transition layer (2–6 mm) exhibits scatter in fatigue crack growth rate (da/dN) due to mixed microstructures. Meanwhile, AM-induced gradients in AlSi10Mg show reduced da/dN in VHCF, attributed to nanograin formation at crack tips [45]. These insights suggest that combining surface hardening with AM could enhance axle durability, yet experimental data on such hybrid approaches remain scarce.
This study provides clues by investigating FCP in induction-hardened S38C axle steel under VHCF conditions (up to 108 cycles). Three-point bending specimens with gradient microstructures (hardened layer, transition layer, core) were tested to characterize da/dN and stress intensity factor range (ΔK) relationships. By integrating findings from VHCF research on gradient materials [23,25,45] and AM’s potential for microstructure tailoring [60], this work aims to (1) establish da/dNK models for different depth zones; (2) interpret the crack propagation data and fracture surface morphology in relation to microstructural variations across depth; and (3) evaluate the implications of the findings for axle design, fatigue life prediction, and inspection planning. Gradient microstructures—whether produced by AM or induction hardening—can enhance fatigue resistance. However, the underlying mechanisms differ significantly: AM involves layer-wise deposition, thermal cycling, and defect evolution, whereas induction hardening relies on localized heating and phase transformation. This study focuses on the latter, which offers a controlled martensitic gradient with predictable surface hardening behavior. The naturally formed gradient in the axle offers a benchmark for similar AM-inspired designs, especially in fatigue-critical applications.

2. Materials and Methods

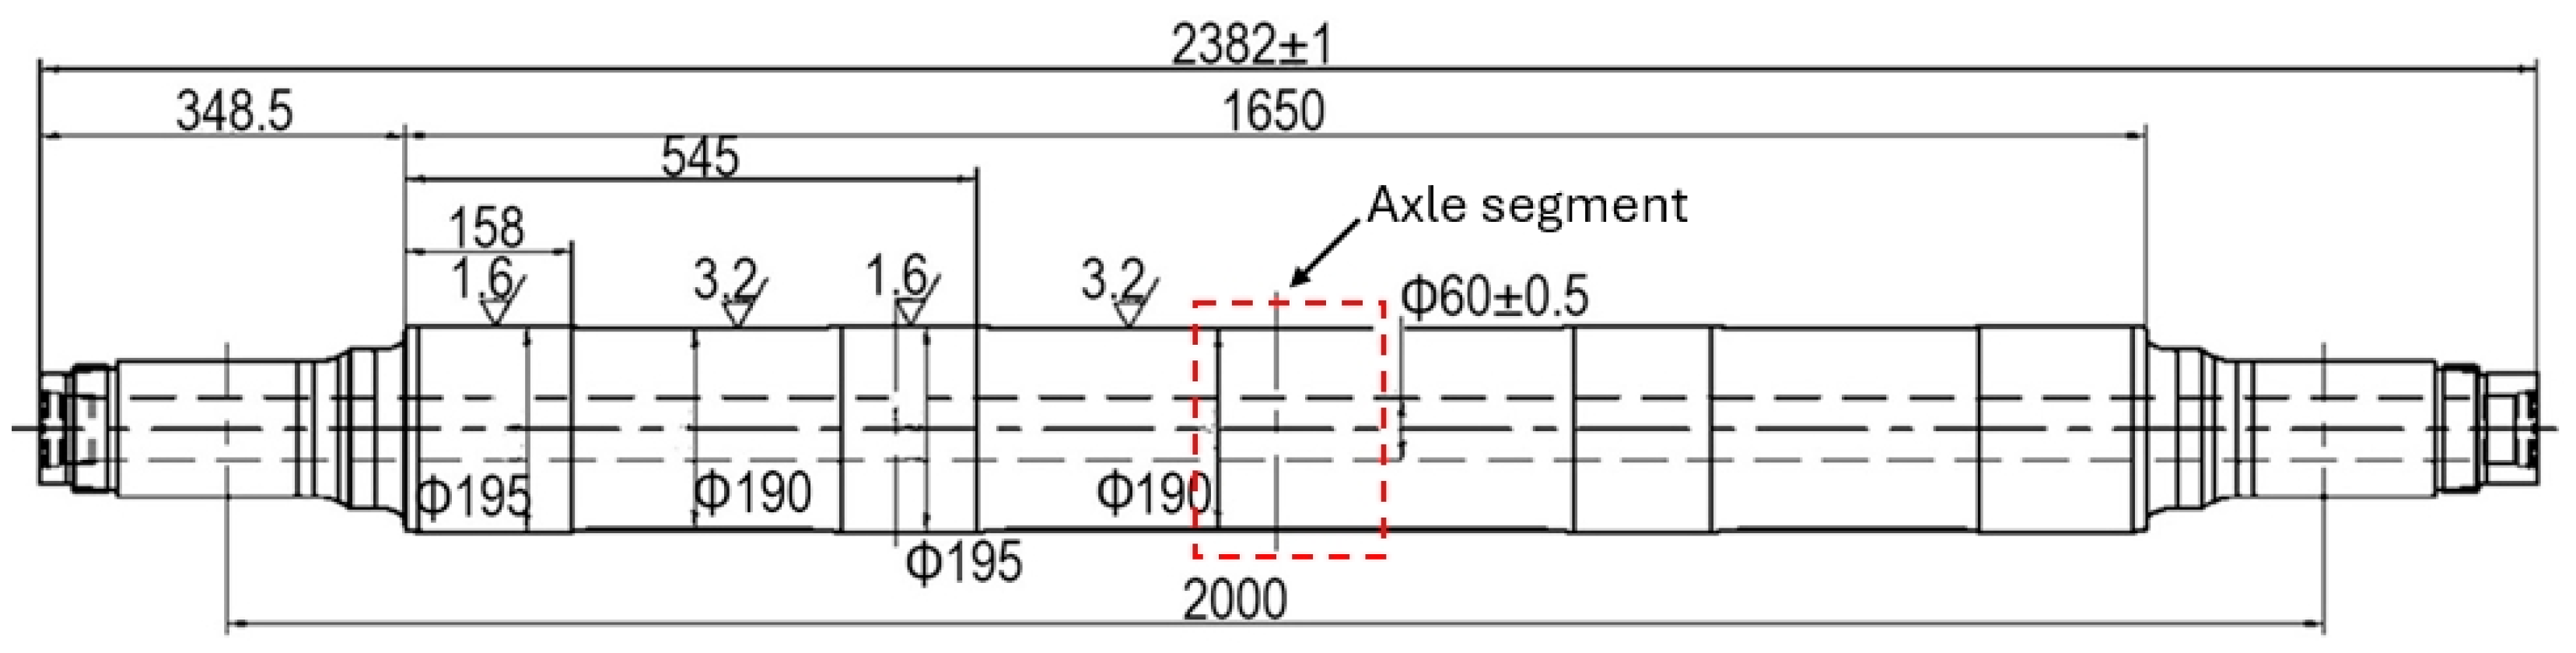
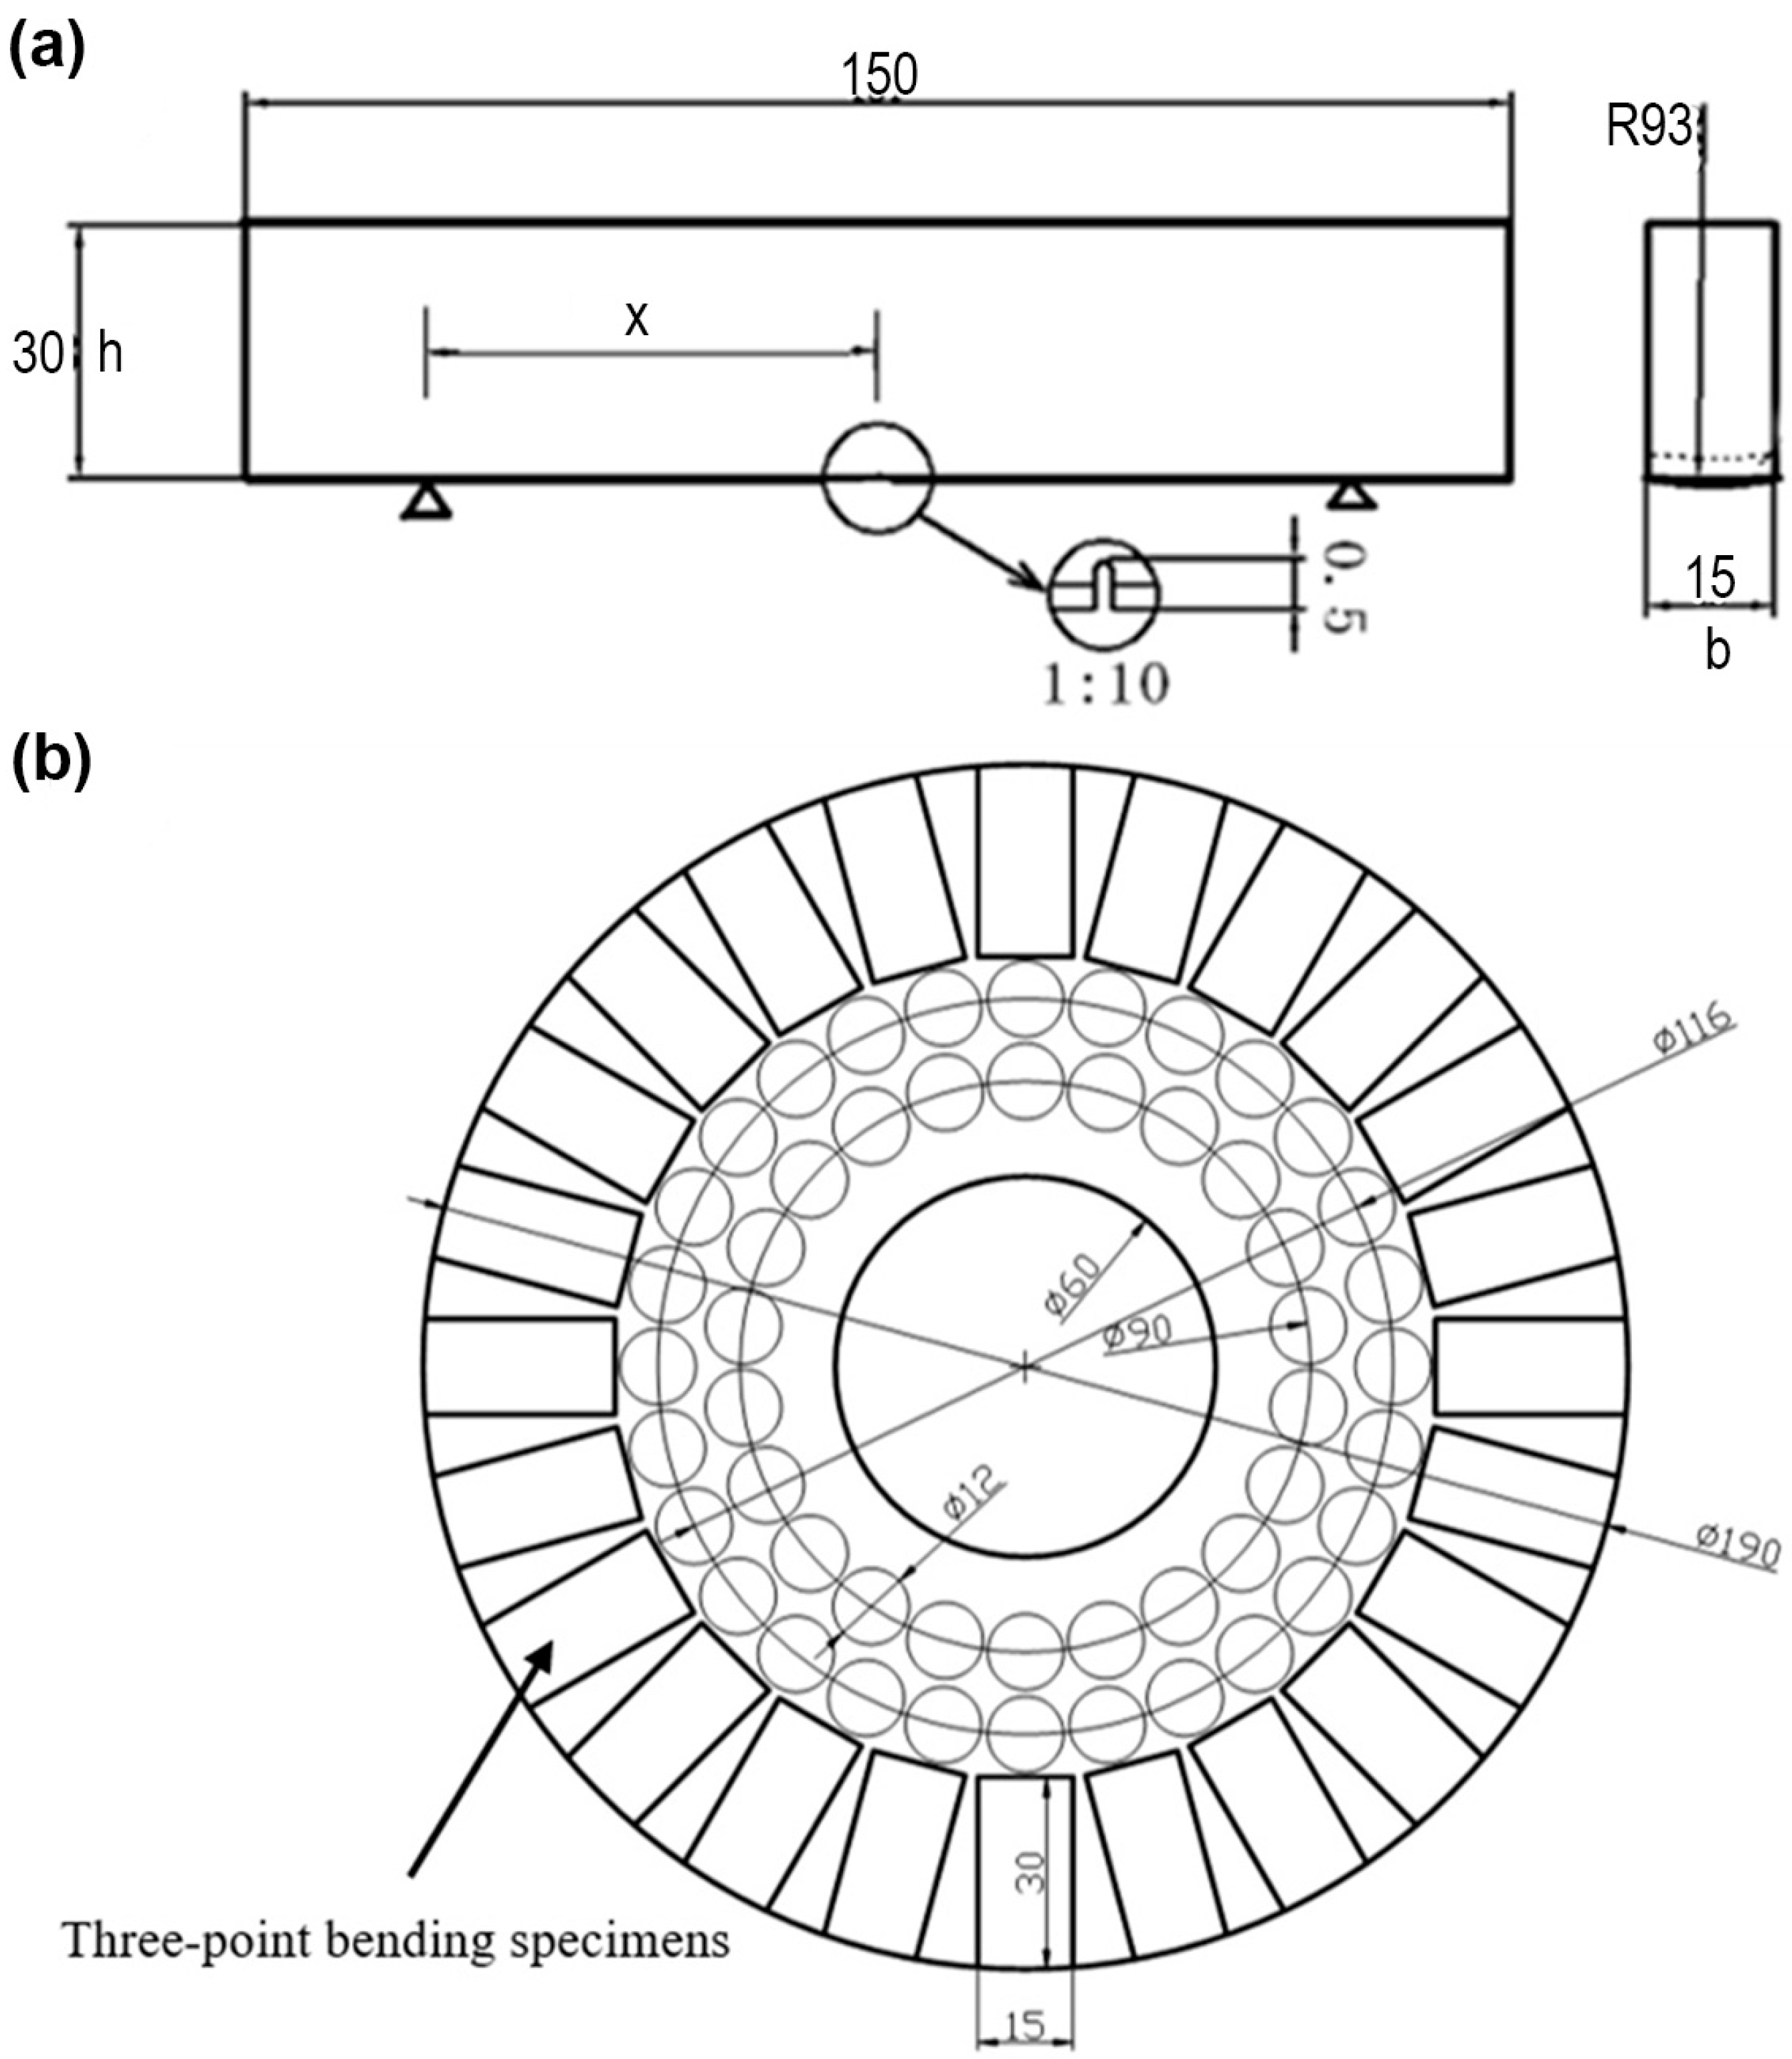
2.1. Specimen Design and Fabrication

The axle involved in this research belongs to the CRH2 EMU series (Japanese type), with its base material being S38C steel, as illustrated in Figure 1. The chemical composition of the axle material was analyzed, and the results are summarized in Table 1. The axle undergoes induction hardening with a heating frequency of 3 kHz. The surface is heated to 880–900 °C and immediately quenched by water spray to achieve martensitic transformation. Subsequently, the axle is tempered at 200 °C to relieve internal stress and improve toughness. The resulting hardened layer reaches a depth of approximately 2 mm from the surface. The surface layer of the axle consists of tempered martensite with a depth of approximately 2 mm. From 2 mm to around 6 mm beneath the surface, there exists a transition layer characterized by a mixture of quenched–tempered microstructure and pearlite–ferrite phases, with an increasing presence of pearlite and ferrite as the depth increases. Beyond 6 mm from the surface, the microstructure predominantly consists of a pearlite–ferrite mixture, indicating a normalized state [23,25].
Vickers microhardness tests were performed using a load of 500 gf, with a dwell time of 15 s, and an indentation spacing of 200 μm to prevent overlap or phase boundary interference. All measurements were conducted along the radial direction from the surface toward the core {3;6}. The Vickers microhardness within the first 2 mm of the surface layer is approximately 551 ± 36 HV beyond 2 mm, the microhardness significantly decreases, reaching around 230 HV at a depth of 6 mm, which is close to the hardness of the core material. Beyond 8 mm, the hardness fluctuates slightly within a narrow range, averaging 200 HV, representative of the normalized microstructure of the core.
To acquire the fatigue crack growth characteristics of the axle material containing a hardened surface layer, the specimens were designed as three-point bending samples, following the standard specimen dimensions outlined in GB/T4161-2007. The actual dimensions used for the specimens were 150 mm in length (span of 120 mm), 15 mm in width, and 30 mm in height, as shown in Figure 2a. The tension side of the specimen represents the axle surface, i.e., the hardened surface layer, and a 0.5 mm deep notch was pre-machined at the center of the tension side using CNC wire cutting technology to facilitate crack initiation and growth. Based on the principles of three-point bending beams, the nominal stress on the tensile side surface of the specimen can be calculated as follows:
σ = 3 P x w h 2
where σ represents the nominal stress at the notch, P is the applied load, w is the specimen width, h is the specimen height, and x is the half-span length.
Two axle segments were provided, each with a height of 170 mm, extracted from the middle section of the actual trailer axle. Based on the designed specimen shape and dimensions, the cutting scheme was established as shown in Figure 2b. A total of 24 three-point bending specimens were evenly distributed and cut from the surface layer along the circumferential direction of the axle segment. All specimens were extracted along the longitudinal (axial) direction of the axle. During testing, the tension surface represented the circumferential surface of the axle, and cracks propagated inward in the radial direction. This orientation replicates the actual crack growth path experienced by axles under service loading. To ensure precision during specimen cutting, the axle’s central axis was meticulously measured, and the axle segments were mounted on the cutting machine to ensure that the wire cutting process was perfectly aligned with the axle’s axis.
The front and back surfaces (30 mm × 150 mm) of the extracted three-point bending specimens were ground using a surface grinder, with the surface roughness controlled to Ra = 0.4 μm. This careful preparation ensured minimal surface defects or machining-induced notches outside the intentional pre-crack, reducing the likelihood of uncontrolled crack initiation from surface irregularities. The two support points on the surface layer of the specimen (i.e., the support surface or the tensile surface) were also ground to ensure stable support during loading. The middle region of the side surface of the processed specimens was sequentially polished with 400 grit, 800 grit, 1000 grit, 1500 grit, and 2000 grit sandpapers, followed by further polishing with 1.0 μm diamond paste. The actual width and height of the processed and polished specimens were measured by digital calipers. The actual dimensions of the 6 specimens used in this research are listed in Table 2.
The six specimens listed in Table 1 were selected for detailed fatigue crack growth testing based on their dimensional conformity, high-quality surface finish after polishing, and consistent microhardness gradient profiles confirmed via preliminary testing. Additionally, their circumferential distribution around the axle ensured minimal positional overlap, reducing the influence of any local variations in processing history.

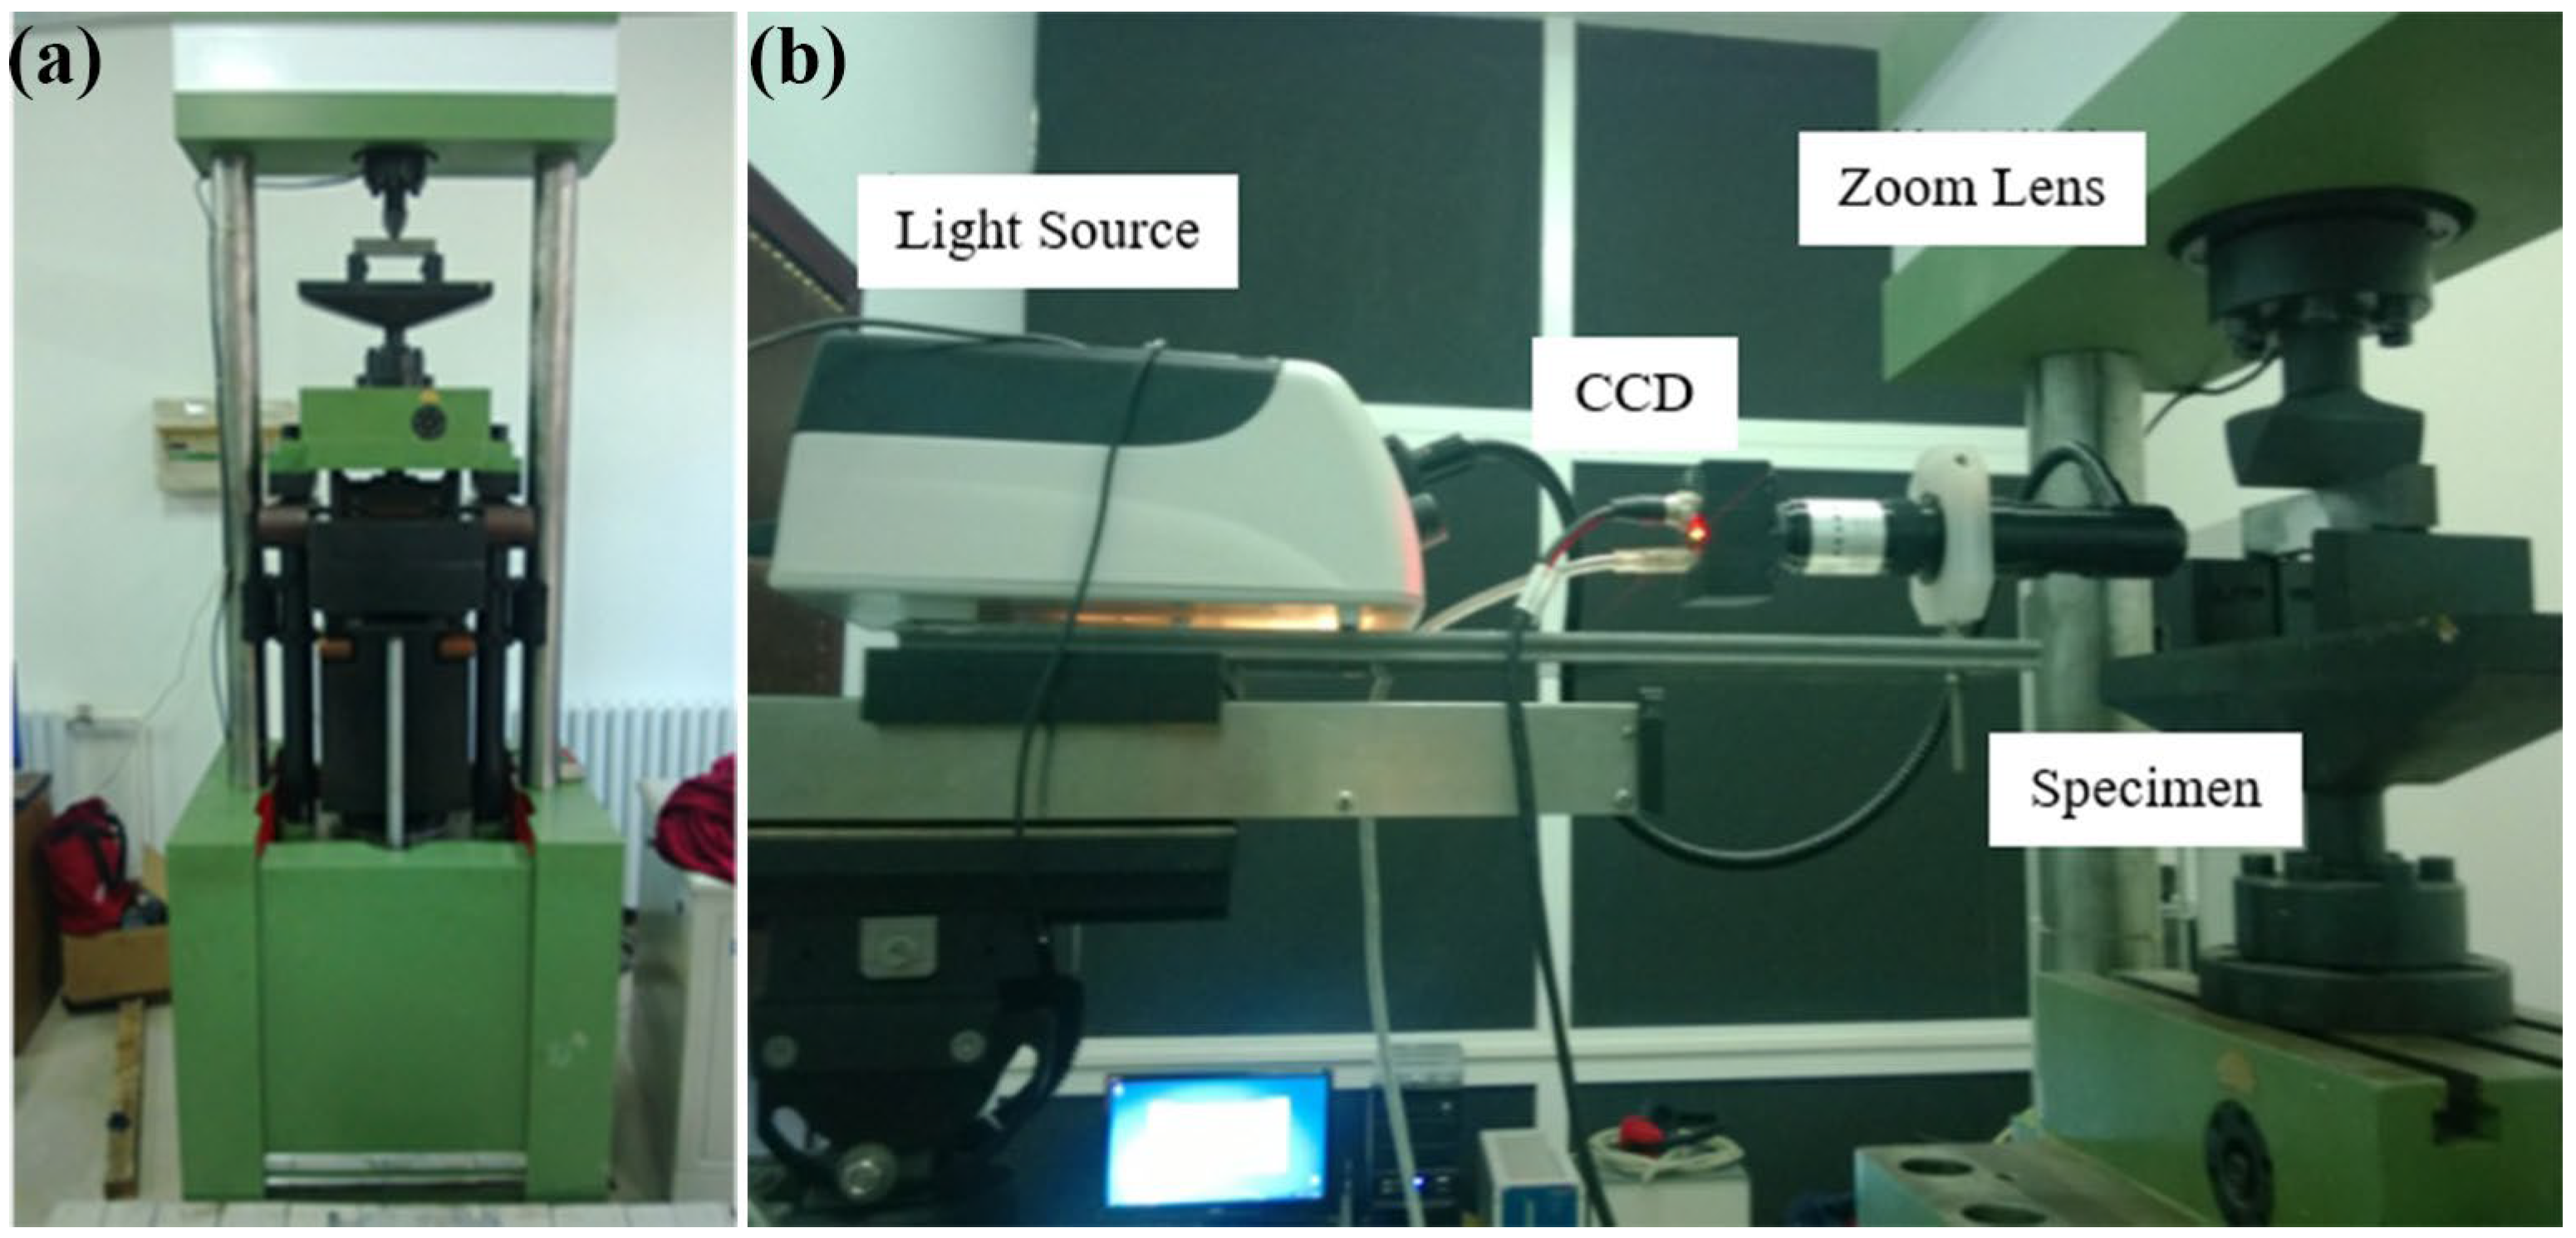
2.2. Testing Method and Devices

These specimens provide the opportunity to investigate and analyze the fatigue crack growth characteristics of the hardened surface layer of the axle, which exhibits variations in microstructure and mechanical properties across different depths. A PLG100 high-frequency fatigue testing machine, as shown in Figure 3a, was employed to perform three-point bending fatigue loading on the specimens, with a stress ratio R of 0.1. The fatigue tests were conducted using a sinusoidal waveform at a constant loading frequency of 120 Hz. All tests were performed at ambient laboratory temperature (approximately 25 °C) under an air environment without specific humidity control. The applied load was adjusted to produce nominal stress amplitudes between 150 MPa and 300 MPa, depending on the specimen and desired crack propagation rate.
An optical imaging and data acquisition system, as shown in Figure 3b, was used to observe the notched region on the side surface of the three-point bending specimens. Once crack initiation occurred, the propagation of the crack was tracked continuously. The fatigue loading was paused at specific intervals to photograph the crack, and then loading was resumed. Subsequently, image processing software was used to measure the crack length corresponding to each loading cycle. This procedure constitutes an optical crack monitoring method, wherein the side surface of the specimen was observed using a CCD-based imaging system. Crack length was determined by analyzing the stitched images with digital measurement tools, allowing accurate, non-contact assessment of surface crack propagation. By analysis and calculation, the relationships among crack length, fatigue crack growth rate, and stress intensity factor were established. For the specimens that reached the termination criteria of the experiment, low-temperature brittle fracture was induced, and the fracture surfaces were photographed using a stereomicroscope. The stress intensity factor range ΔK for the crack body in the three-point bending specimens can be calculated using the following equation:
Δ K = Δ σ π a f a b
f a b = 1 π 1.99 a b 1 a b 2.15 3.93 a b + 2.7 a b 2 1 + 2 a b 1 a b 3 2
where Δσ is the nominal stress amplitude corresponding to the applied load, a is the crack length, and b is the specimen height.
The da/dN is calculated using the differential method, expressed as follows:
d a / d N = The   crack   length   at   the   Nth   cycle   -   The   crack   length   at   the   Mth   cycle N - M
The measurement was conducted in several steps. After installing the specimen and the optical observation equipment, the fatigue experiment is initiated. During testing, the onset of crack initiation was defined as the point at which a crack became visually detectable under optical imaging. It was observed that surface crack growth of approximately 0.3–0.5 mm in length occurred before stable and measurable propagation behavior commenced. Therefore, the fatigue crack initiation stage was considered to end at a surface crack length of ~0.4 mm, and the subsequent phase was treated as the crack propagation stage. Once a fatigue crack appears and propagates to a certain length, the fatigue loading is paused to photograph the crack. If the crack does not propagate after 106 cycles at a given length, the applied stress is increased (minimum 5 MPa, maximum 20 MPa), and observations are continued. The process is repeated until the crack length exceeds 13 mm or the fatigue testing machine fails to maintain vibration. Note that this crack length was selected to ensure that the crack tip remained within the central third of the span, where the stress field is uniform and linear elastic fracture mechanics (LEFM) assumptions hold. Beyond 13 mm, stress gradients near the supports could affect K calculations, and optical crack tip tracking becomes less reliable due to boundary reflections and geometric distortion. Therefore, the 13 mm limit ensures both mechanical and measurement validity. Then, the captured images are stitched together using image processing software. The crack length on the surface is measured using specialized software. After completing the fatigue experiment, the specimens are rapidly fractured in a liquid nitrogen environment. The fracture surfaces are photographed using a stereomicroscope. Five evenly spaced measurement points are selected perpendicular to the crack propagation direction to measure the distance from the specimen surface to the crack trace at different cycle numbers. The crack growth length is obtained through this measurement, and the crack length observed on the surface is corrected using linear interpolation, as illustrated in Figure 4. Finally, the relationships among crack length, fatigue crack growth rate, and stress intensity factor range are obtained through calculation.

3. Results

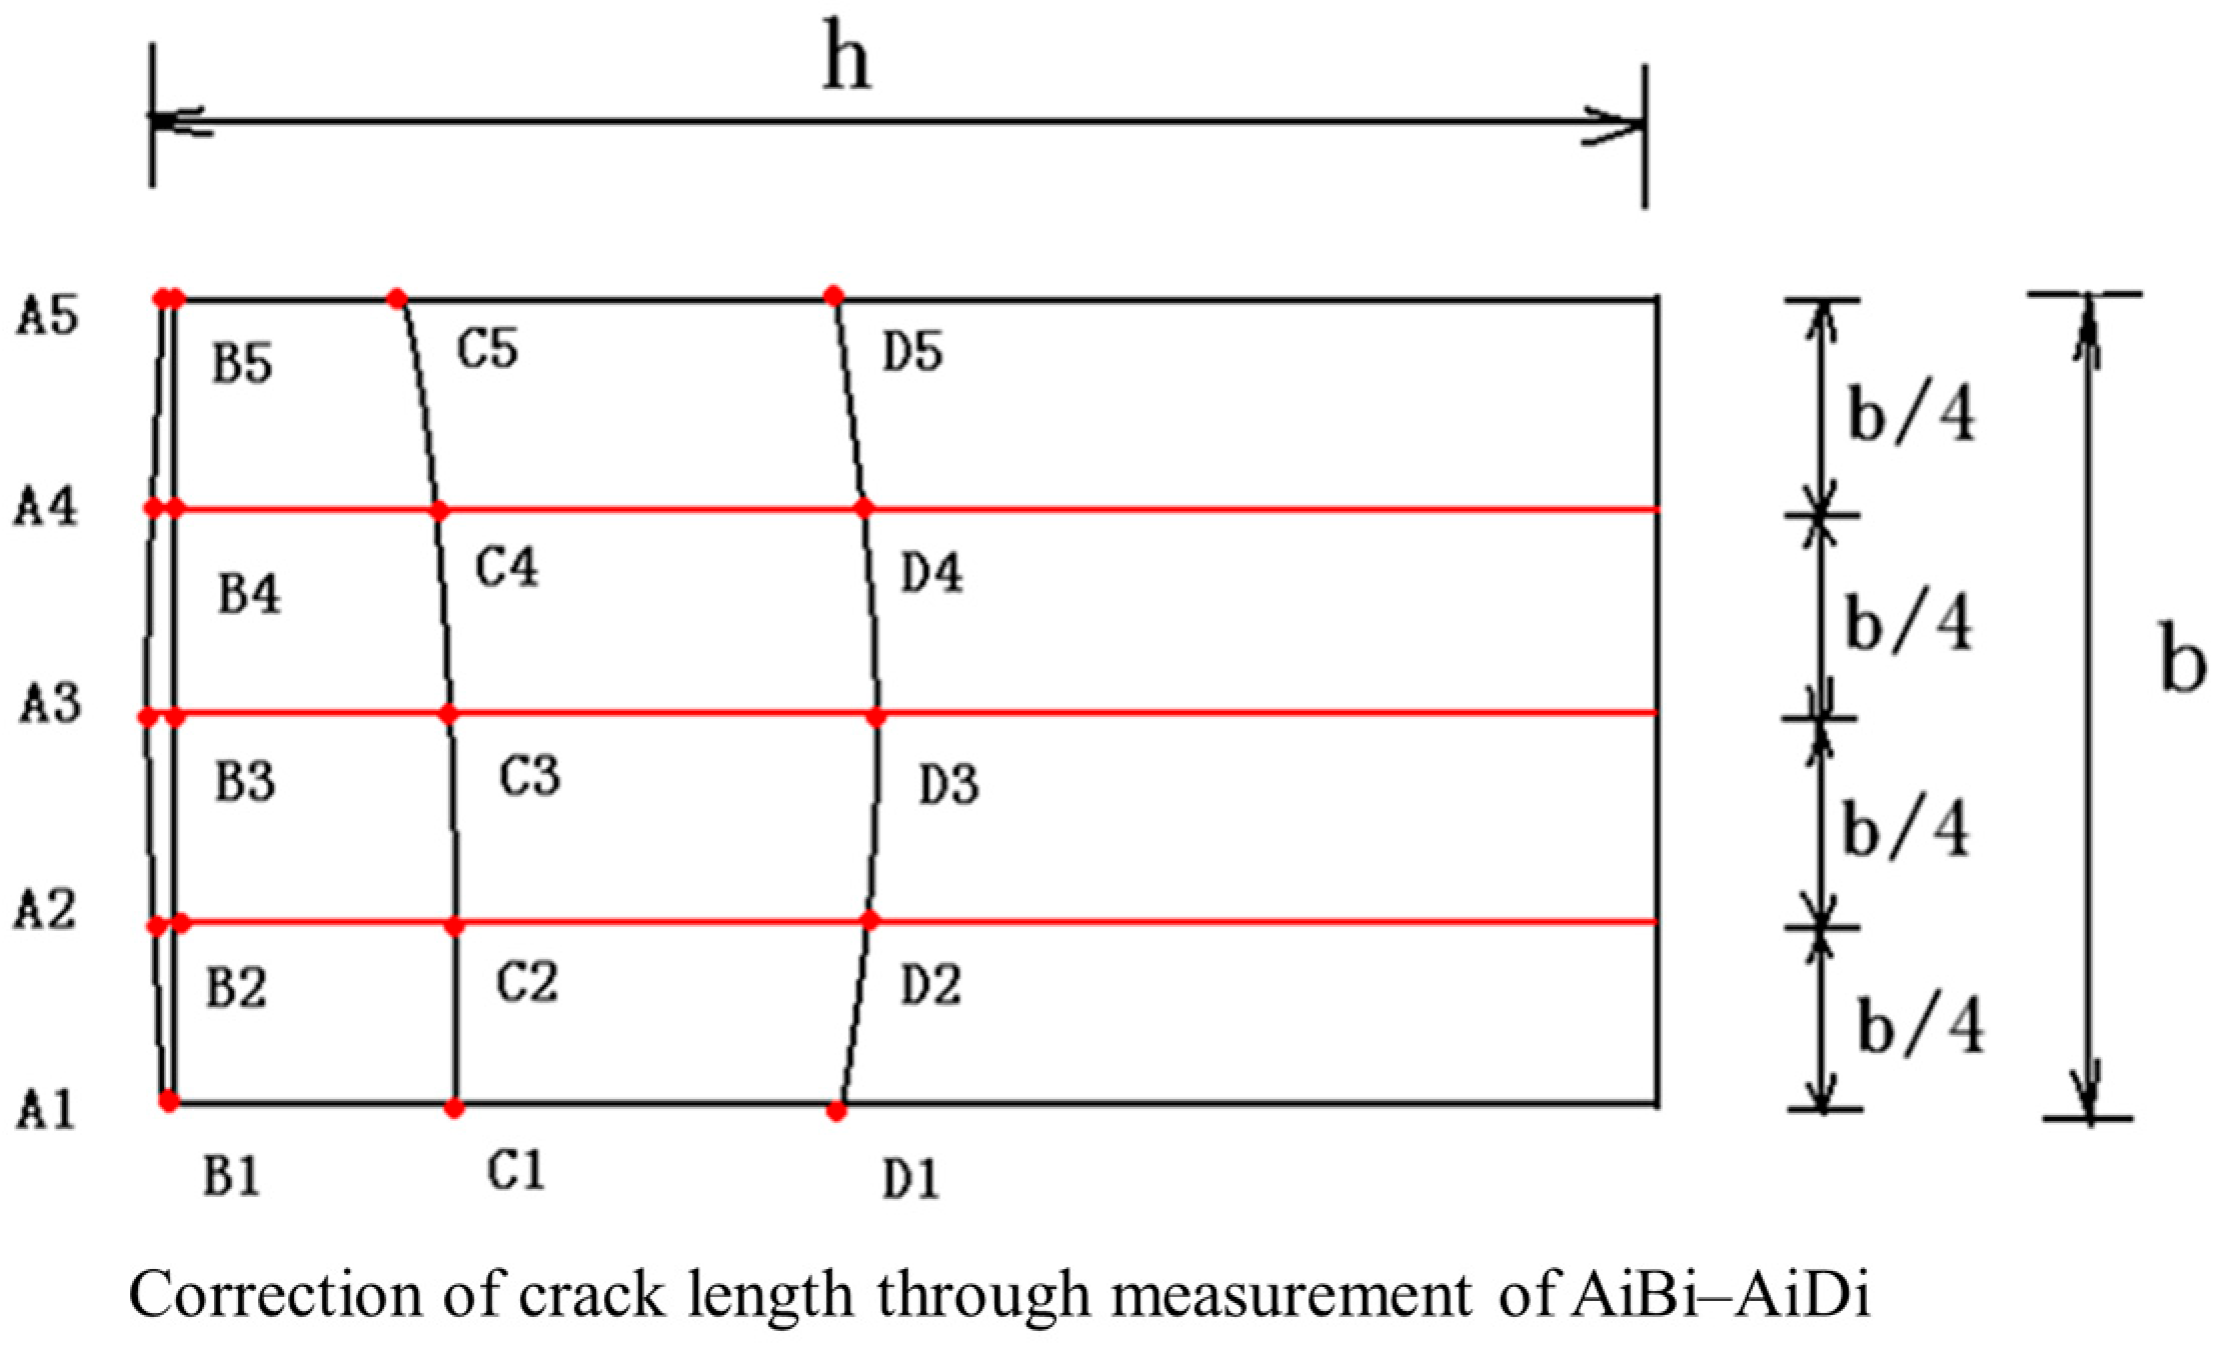
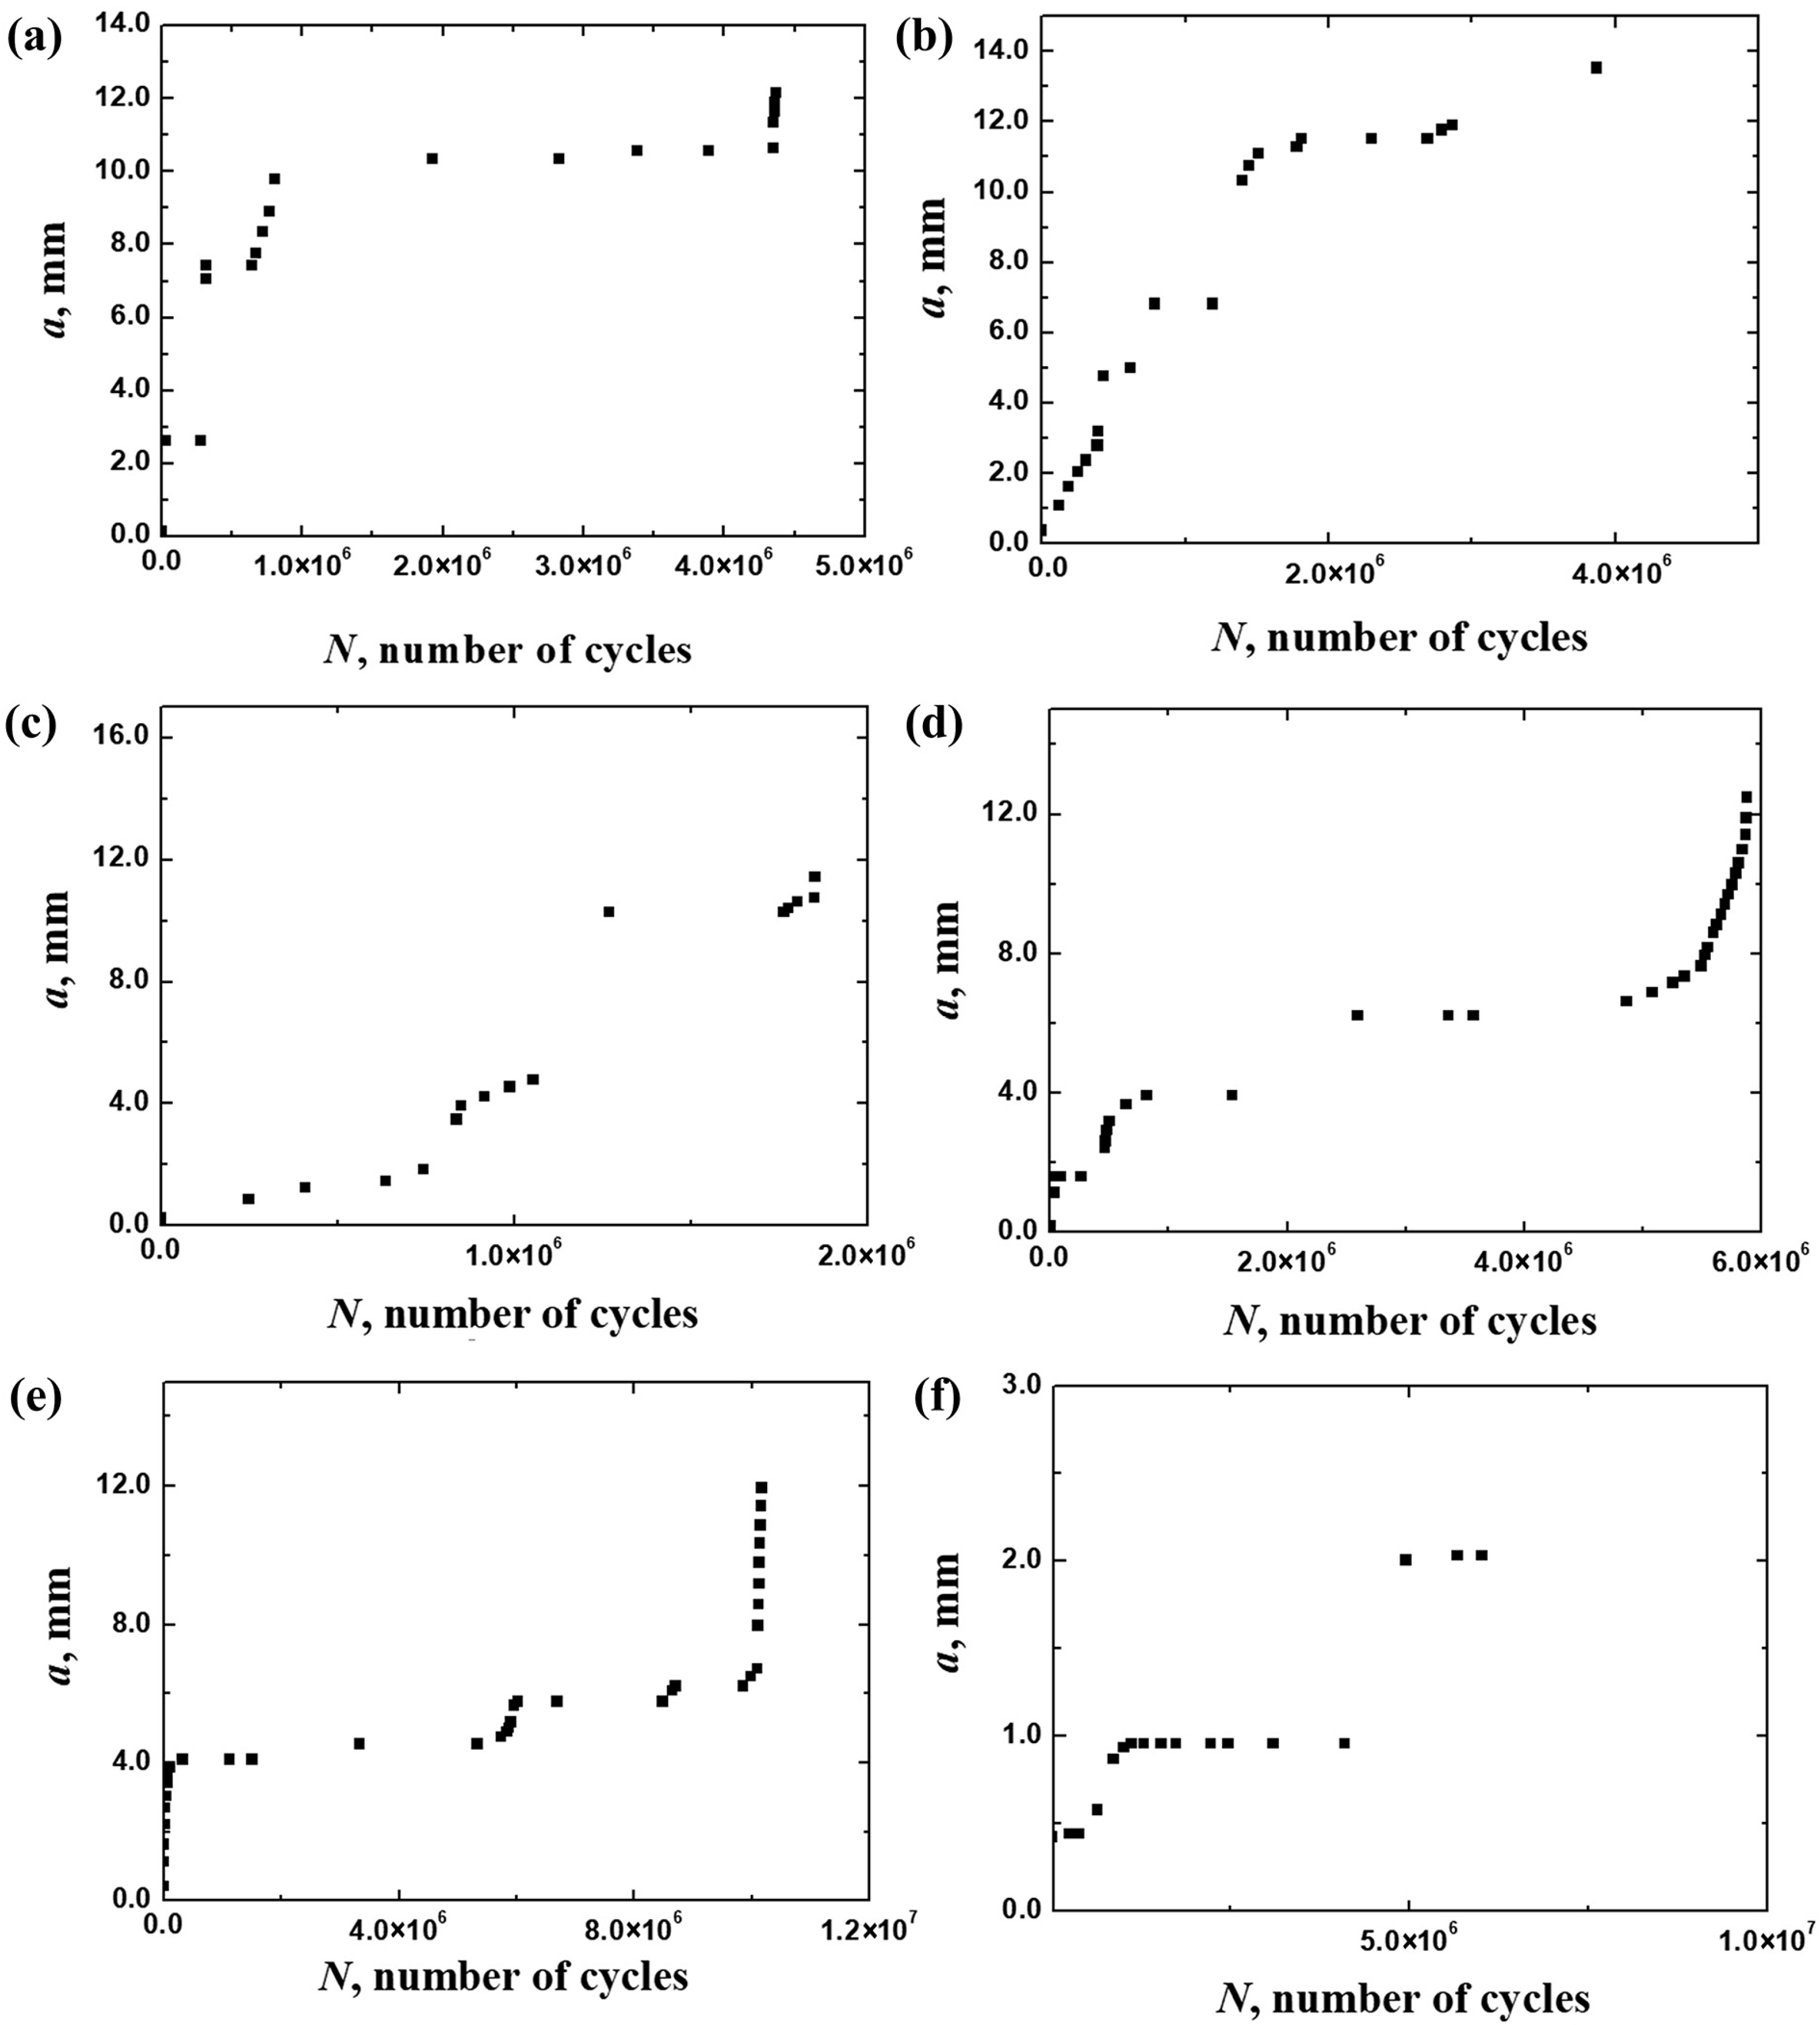
3.1. a−N Data and Fractography

Fatigue crack growth experiments were conducted on the six three-point bending specimens listed in Table 2. For each specimen, the crack length, along with the corresponding applied load and loading cycles, was recorded at various stages of crack propagation after initiation. It was consistently observed that cracks initiated from the pre-machined notch rather than from unintended surface features, indicating that surface roughness had a negligible influence on the initiation location under the current test conditions.
Figure 5 displays the results for Specimen 1, including six optical micrographs showing the crack initiation and its progression towards fracture at different stages. Figure 6 presents the observed results of crack growth length versus the number of loading cycles for the six specimens, namely the a–N data plots.
Fracture surfaces of all six specimens were observed using a stereomicroscope after the final brittle fracture in liquid nitrogen. The fracture surfaces shown in Figure 7 were imaged at low magnification using a stereomicroscope, providing general overviews of the crack propagation paths. Although detailed characterization was not available for this study, the stereomicroscopic images still enabled identification of fracture regions.
In the hardened surface layer (0–2 mm), fracture surfaces exhibited a rough and tortuous morphology with frequent local deflections and occasional branching, suggesting a high resistance to crack growth. These features are indicative of crack path tortuosity and energy dissipation through microstructural barriers. In the transition layer (2–6 mm), fracture features changed progressively. Some areas displayed relatively rough fractures, while others appeared smoother. This mixed morphology reflects the heterogeneity of the material, consisting of both tempered martensite and ferrite–pearlite phases, which may promote unstable crack propagation. In the core matrix (beyond 6 mm), the fracture surfaces became notably smoother, with a more planar crack path and reduced secondary cracking. These characteristics are consistent with faster crack growth due to the absence of microstructural barriers and lower hardness.

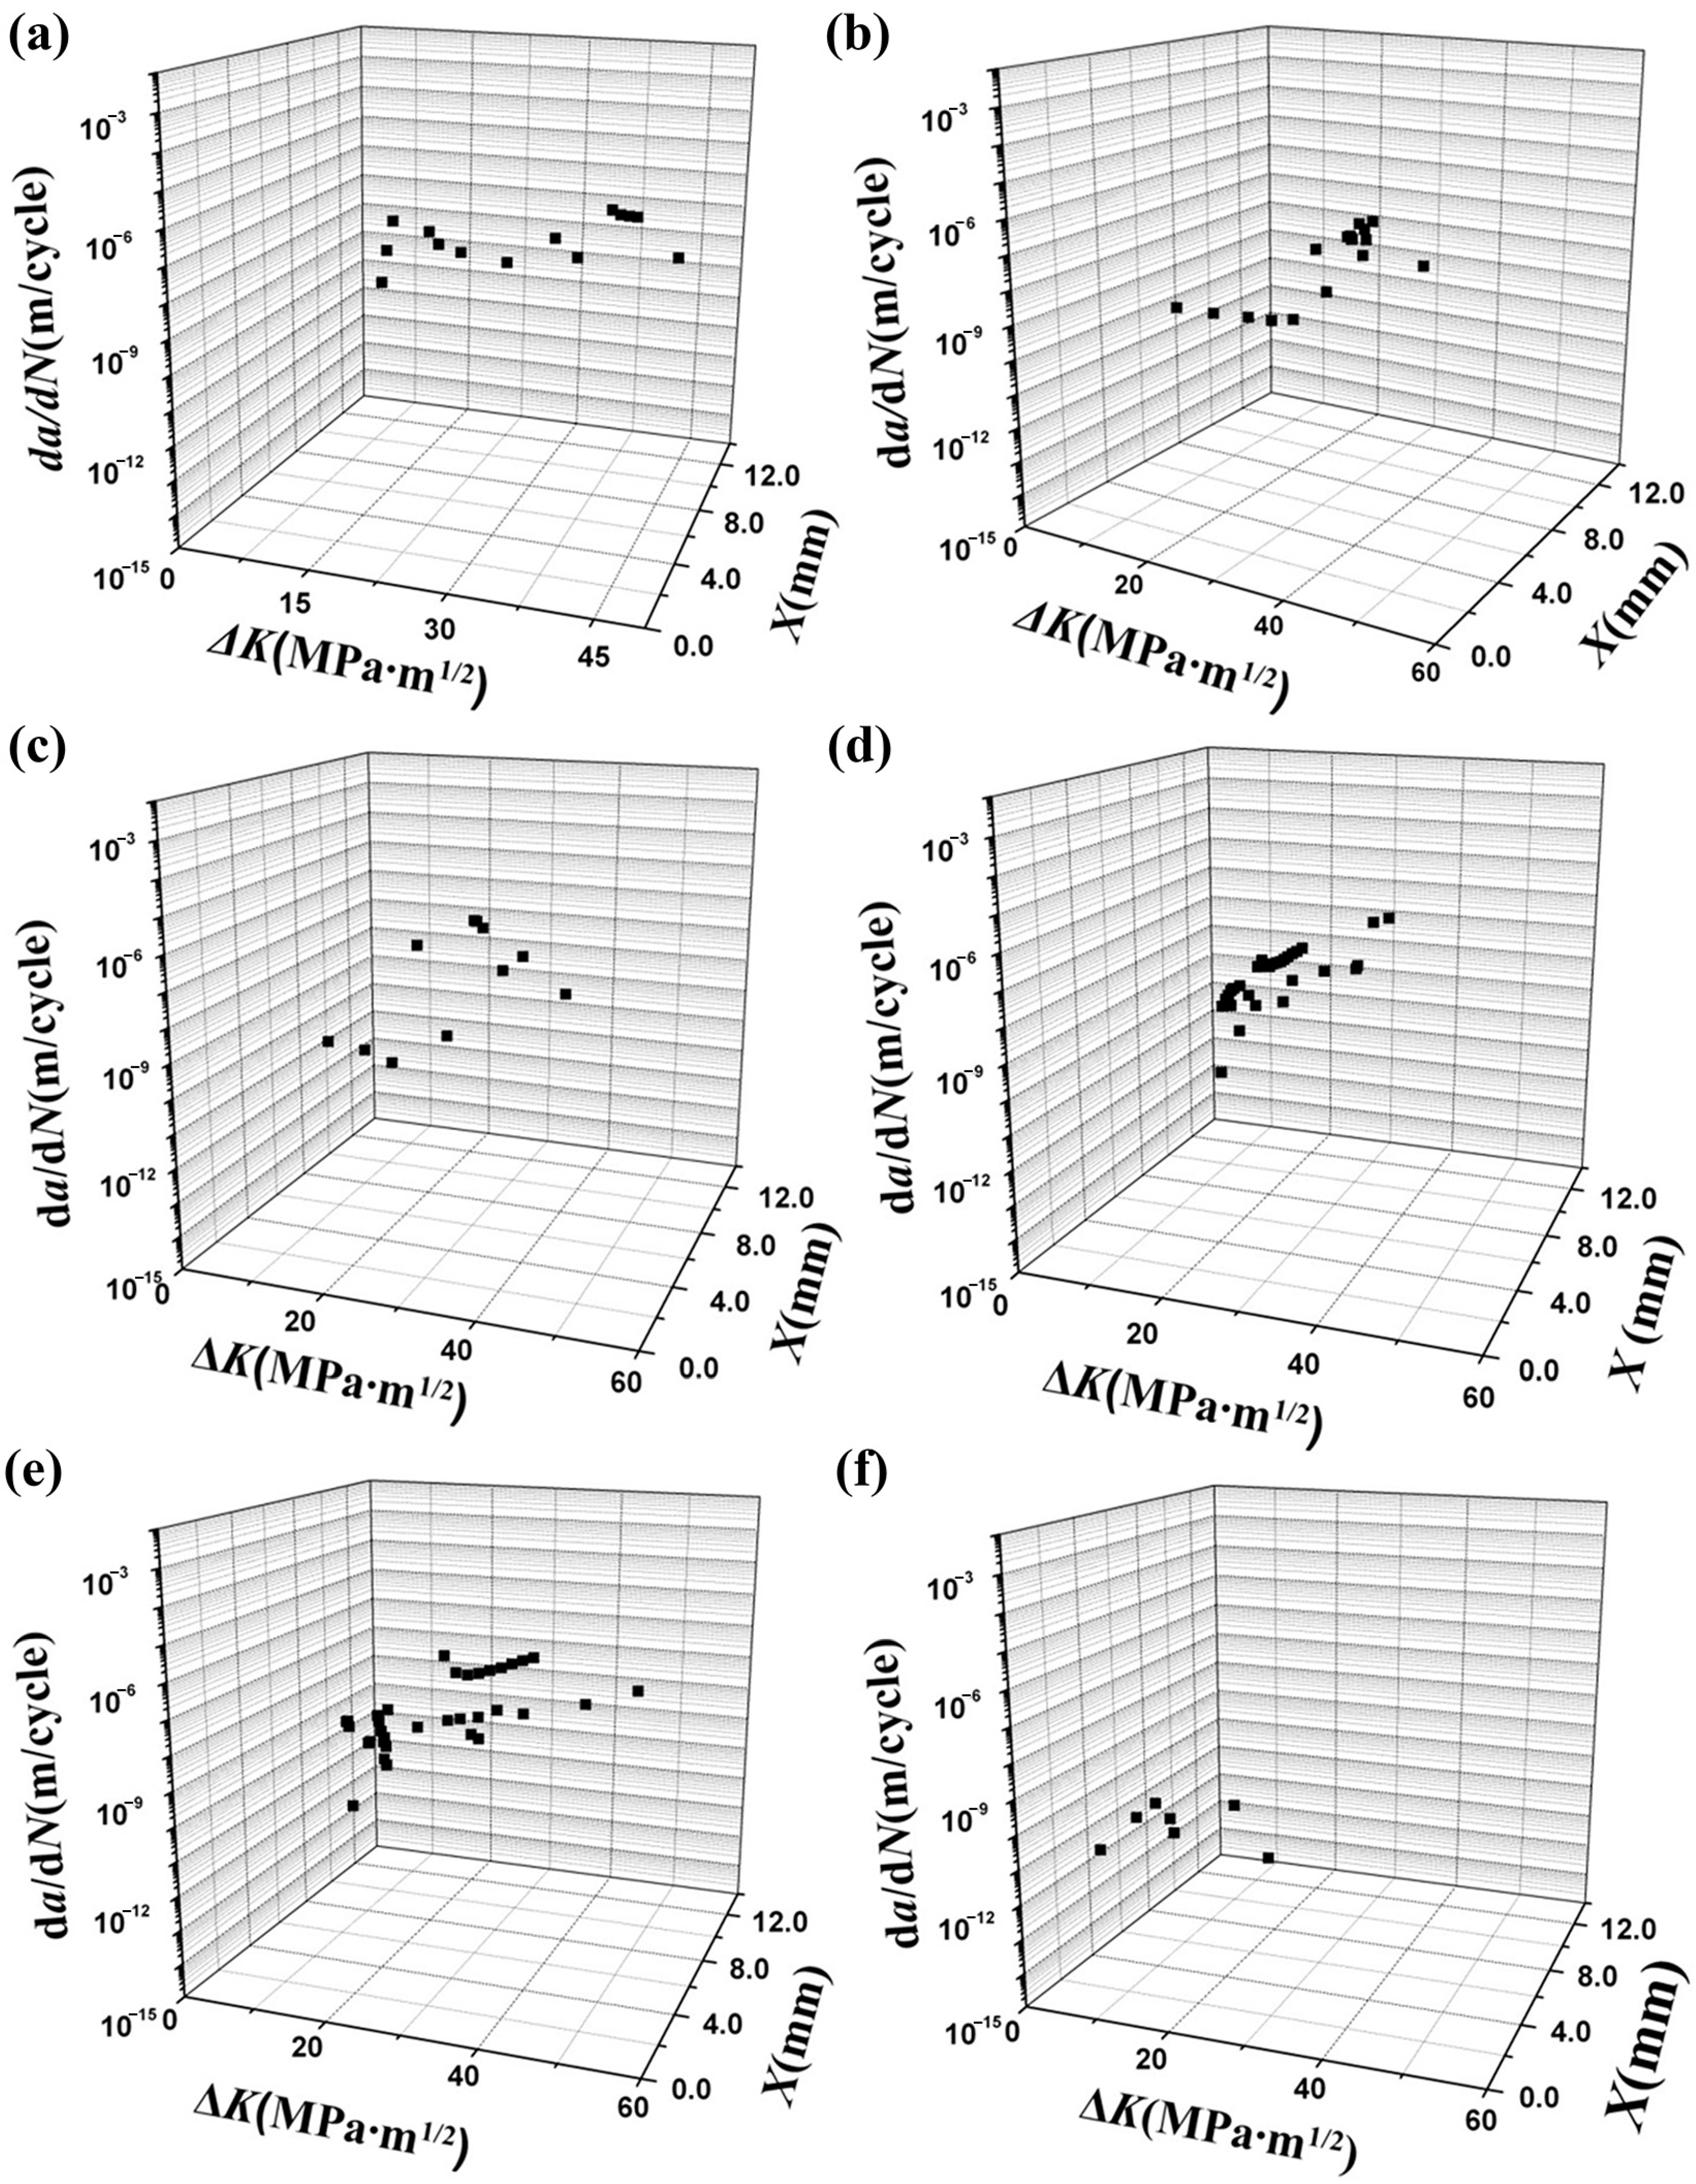
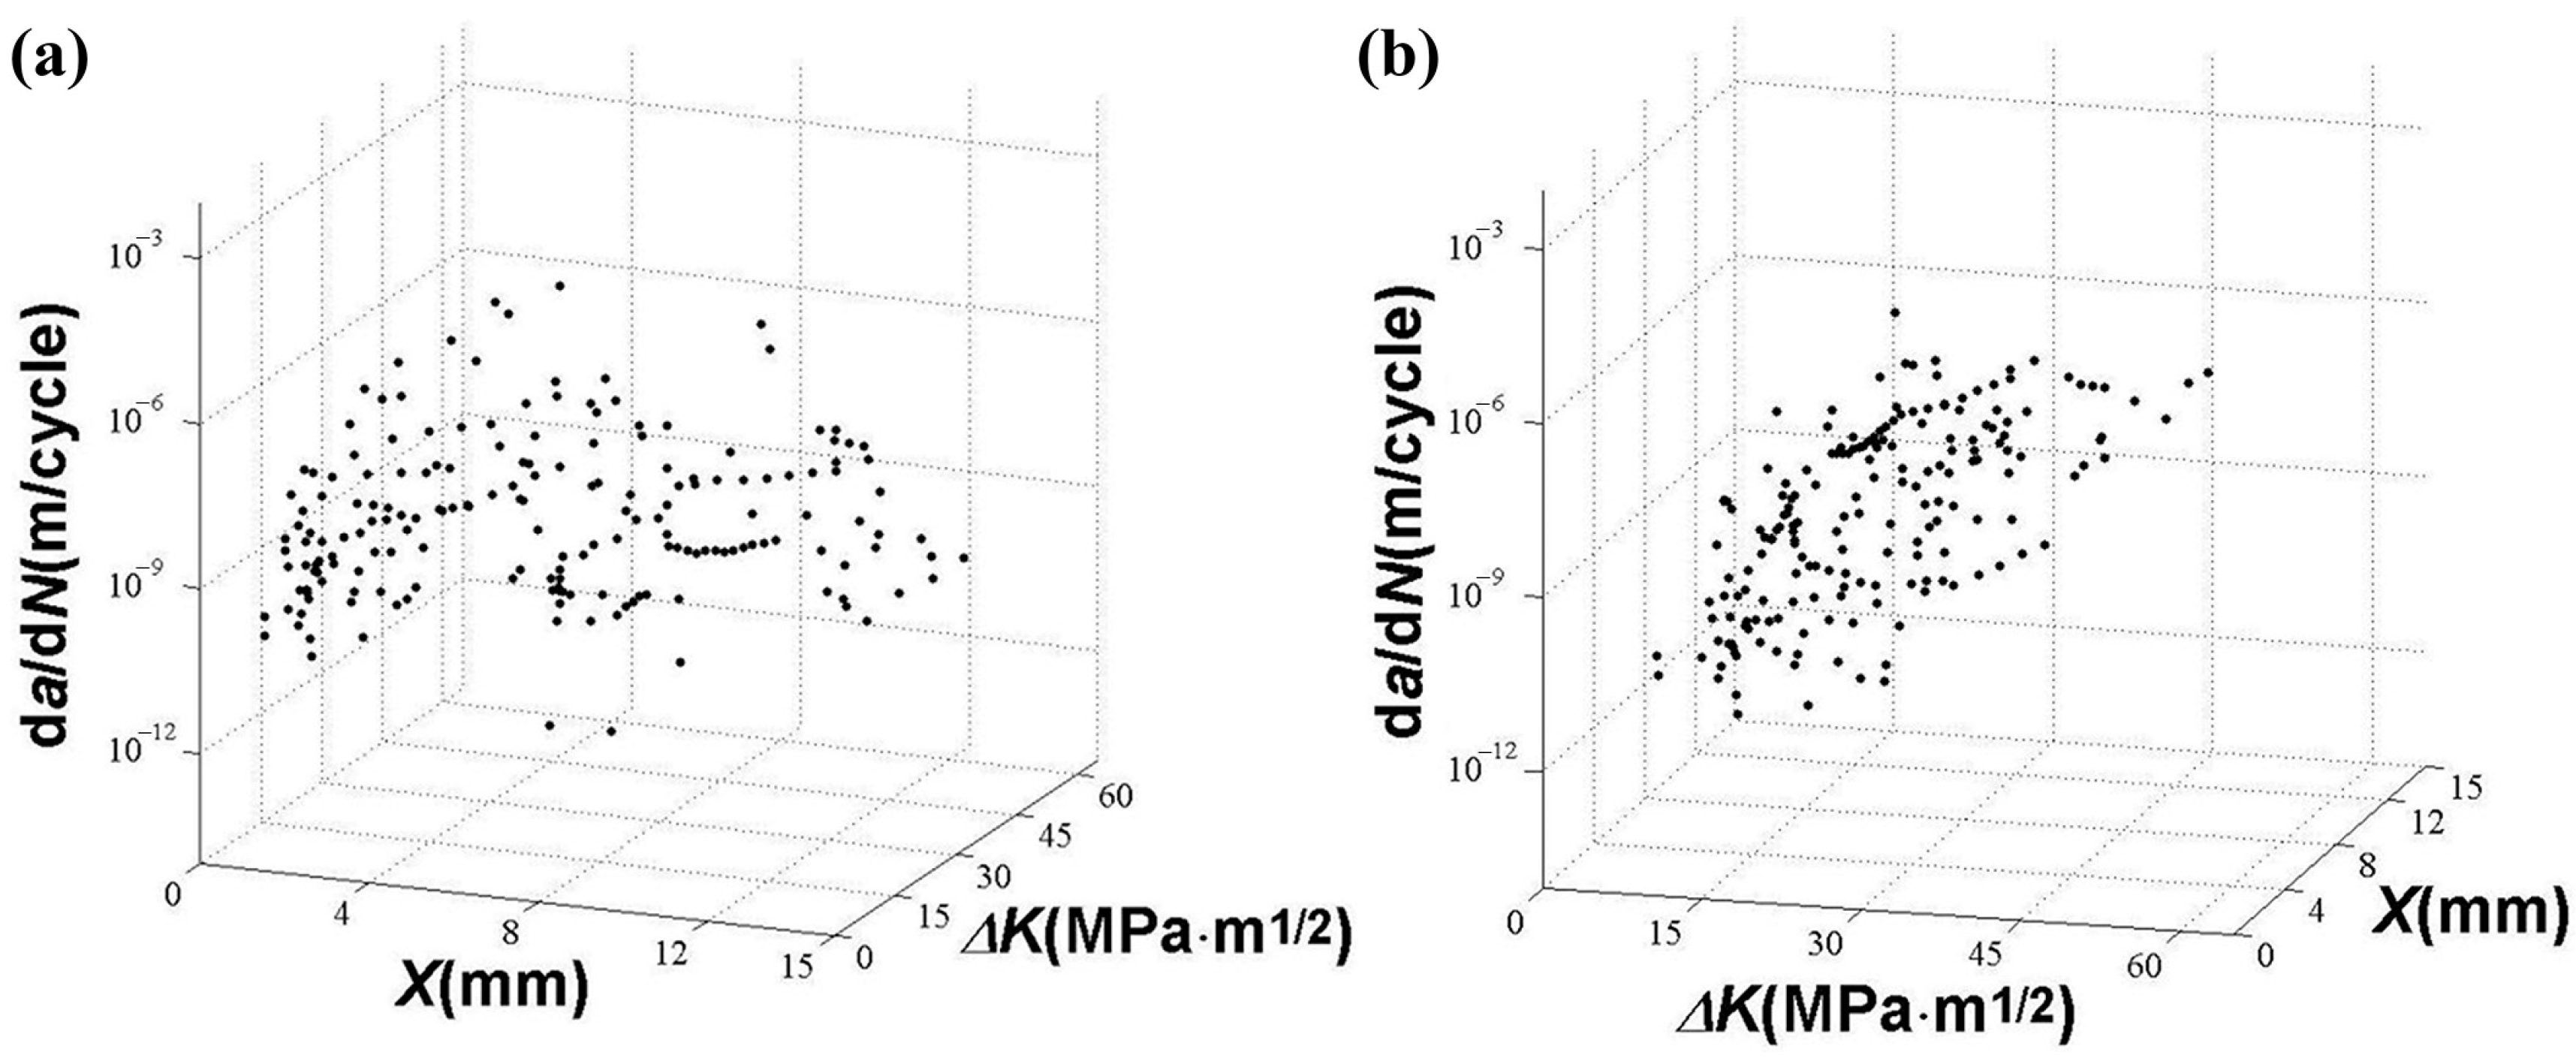
3.2. da/dN and ΔK Data

The fatigue crack growth experiments yielded the crack growth rate da/dN and the stress intensity factor range ΔK at various stages of crack propagation for each specimen. Due to the gradient variation in the microstructure of the hardened surface layer, da/dN differs at various positions within the hardened layer and the transition layer. Therefore, this research presents experimental results correlating da/dN, ΔK, and the distance of the crack tip from the surface X.
Figure 8 illustrates the relationship among da/dN, ΔK, and X for the six specimens. To aid interpretation, it is important to clarify that each data point in Figure 8 corresponds to a specific measurement of da/dN, ΔK, and X. The plots show how crack growth behavior evolves as the crack tip moves through the surface-hardened layer, transition zone, and into the core matrix. Although presented in three-dimensional format, the main trend is that da/dN increases with both ΔK and X, highlighting the influence of the material’s gradient microstructure on fatigue resistance.
In the near-surface region (0–2 mm), which corresponds to the tempered martensitic layer, the crack growth rate is notably suppressed. This can be attributed to the high dislocation density, refined microstructure, and residual compressive stresses, all of which enhance crack closure and slow propagation. As the crack front moves into the 2–6 mm region—the transition zone—da/dN increases and displays more scatter, reflecting the mixed microstructure of pearlite and martensite that results in spatial variation in crack resistance. Beyond X > 6 mm, where the structure becomes fully normalized (ferrite–pearlite), the da/dN–ΔK relationship becomes steeper, indicating lower crack growth resistance.
This depth-dependent behavior underscores the critical role of gradient microstructures in controlling fatigue crack propagation. The da/dN–ΔKX data collectively demonstrate that the hardened surface layer acts as a barrier to crack advancement, effectively delaying fatigue damage accumulation under cyclic loading.

4. Discussion

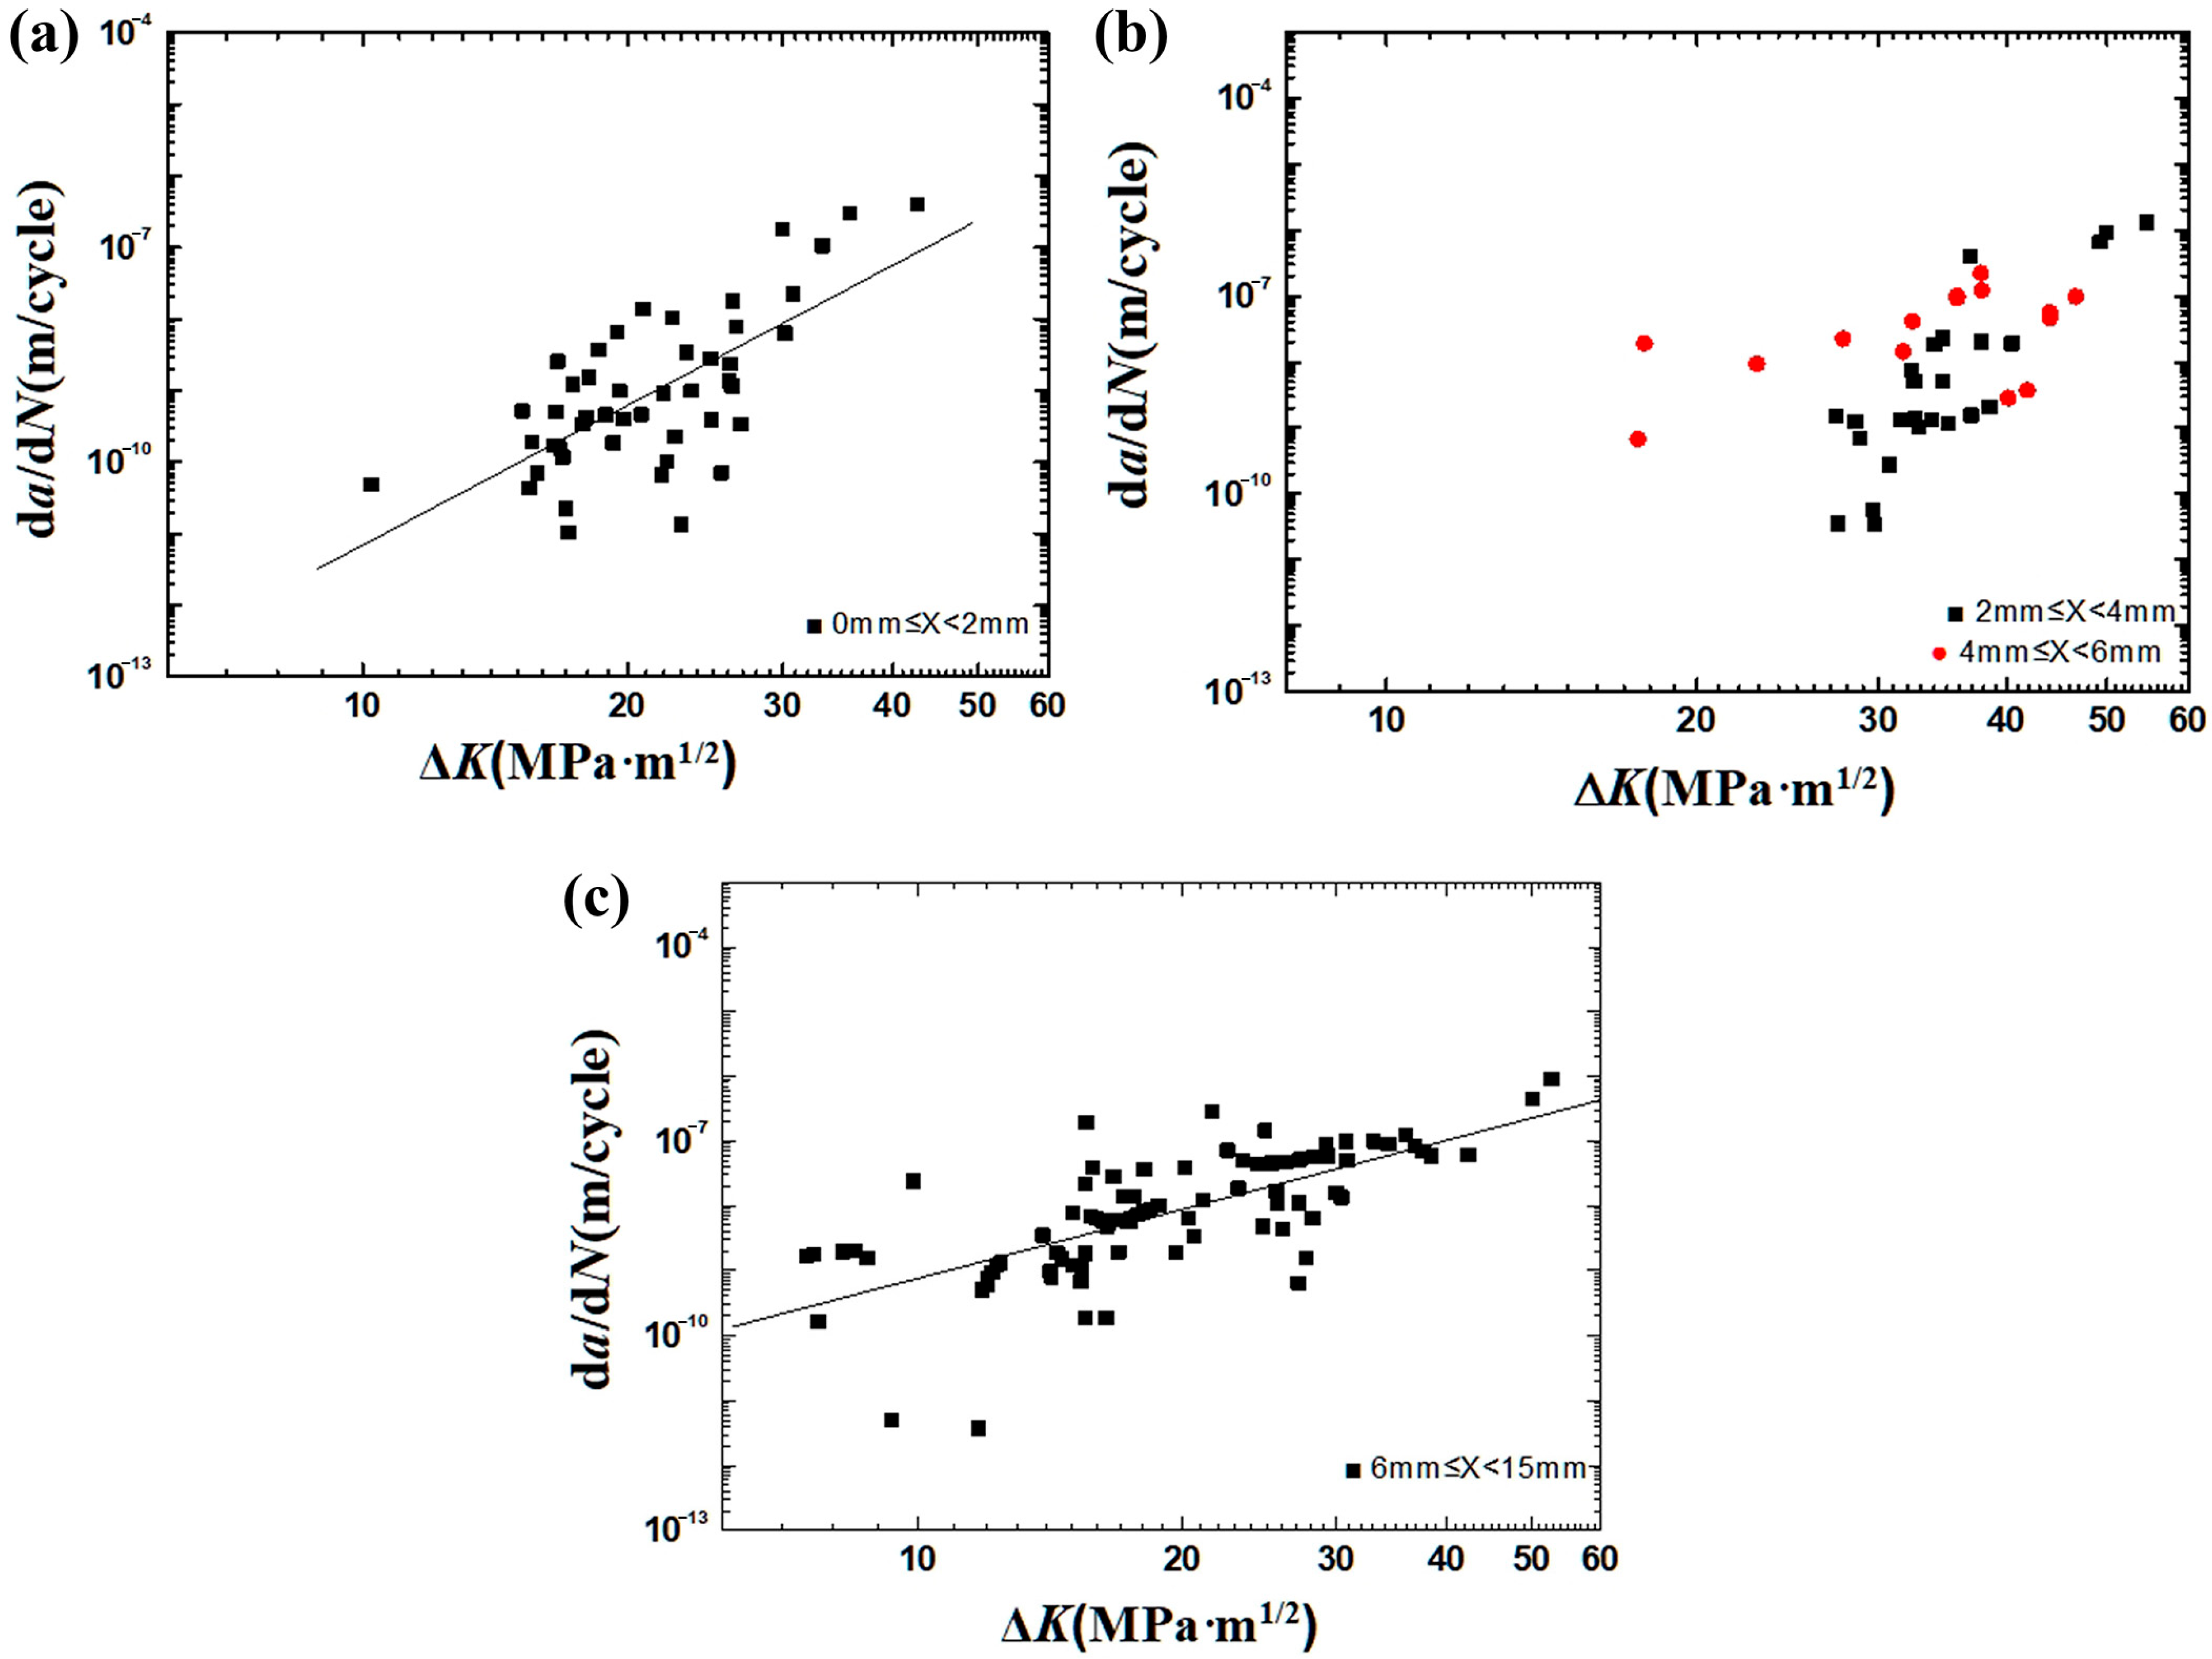
4.1. Summary and Analysis of da/dN and ΔK Data

Figure 9 provides a consolidated representation of the fatigue crack growth behavior across all specimens and depths. The surface plot in Figure 9a reinforces the trend observed in Figure 8, showing a continuous increase in da/dN with both increasing ΔK and X. This visualization makes it evident that the resistance to crack propagation diminishes as the crack advances inward from the hardened surface layer into the softer core region.
Figure 9b presents an alternative projection of the same dataset, highlighting the evolution of the da/dN–ΔK relationship at different depths. Notably, the Paris Law slope becomes steeper with increasing X, particularly beyond 6 mm, which corresponds to the normalized core microstructure. This suggests that the Paris exponent (m) increases with depth, indicating enhanced crack sensitivity to ΔK in the inner matrix. In contrast, the flatter slopes at shallow depths confirm that the surface-hardened layer offers significant resistance to crack growth even under rising ΔK.
Together, these figures provide strong visual and quantitative evidence that the gradient microstructure has a pronounced influence on fatigue behavior, and they validate the division of the material into three distinct zones for Paris Law fitting.
It should be noted that the fatigue crack growth experiments in this study were conducted under a stress ratio of R = 0.1, which differs from the actual service condition of railway axles, typically approximated as R = –1 due to fully reversed bending. The choice of R = 0.1 was made to ensure stable crack propagation and to suppress premature crack closure during the early growth stages. This reduces the potential influence from crack closure, especially in the near-threshold regime, thus allowing more accurate and repeatable crack length measurements. Evaluating ΔKeff or incorporating compliance-based methods to correct for closure effects and improve the accuracy of the Paris Law fitting can be expected in future work. Although the crack growth rates observed under R = 0.1 cannot be directly transferred to service life predictions, the relative differences among the hardened layer, transition layer, and core matrix remain valid and informative. Furthermore, the da/dN–ΔK relationships established herein can serve as input for fatigue life models incorporating stress ratio corrections (e.g., closure models or modified Paris Law), or as material-specific parameters in numerical simulations under R = –1 loading.

4.2. da/dN and ΔK in Multiple Depth Ranges

Evidently, materials with different microstructures exhibit varying mechanical properties, which, in turn, influence their fatigue crack growth rates. The three-point bending specimens used in the experiment were directly extracted from the actual axle, with the tensile side representing the hardened surface layer of the axle. Based on the microstructural stratification established in Section 2, the experimental da/dN–ΔK data were grouped into three depth intervals, as shown in Figure 10. Rather than reiterating the structural classification, we focus here on comparing their respective fatigue crack growth behaviors. The surface-hardened layer (0–2 mm) exhibits the lowest crack growth rates and flattest Paris slopes, attributed to its fine martensitic structure. In contrast, the transition zone (2–6 mm) shows significant scatter due to heterogeneous phase mixtures, while the normalized core (beyond 6 mm) allows faster crack propagation with a higher Paris exponent, reflecting its lower crack resistance.
In addition to microstructural factors, the presence of compressive residual stress in the surface-hardened layer may also play a critical role in reducing fatigue crack growth rates. Induction hardening is known to generate compressive stress near the surface due to rapid martensitic transformation and thermal gradients. This stress can reduce the effective stress intensity factor range (ΔKeff) at the crack tip, thereby impeding crack propagation. Although not measured in this study, the influence of residual stress is consistent with the observed crack retardation behavior.
Figure 10a illustrates da/dN as a function of ΔK within the 0–2 mm depth range from the specimen surface. Based on the data points presented in Figure 10a, the relationship between da/dN and ΔK follows the Paris Law, which is expressed as follows:
d a d N = C ( K ) m
A fitting procedure can be performed to establish the relationship between da/dN and ΔK, and the parameters C and m can be obtained as follows:
l g d a d N = 17.65 + 6.50 l g ( K )
The corresponding linear correlation coefficient r is 0.691, and the standard deviation δ is 0.79. Thus, Equation (6) can be rewritten as follows:
d a d N = 2.24 × 10 18 K 6.50
where da/dN is in units of m/cycle, and ΔK is in units of MPa·m1/2.
Figure 10b illustrates the variation in da/dN with ΔK within the 2–6 mm depth range from the specimen surface, which corresponds to the transition layer of the actual axle surface. It can be observed that da/dN exhibits significant scatter. To better analyze the data, the results are further divided into two subregions: 2–4 mm (marked in black) and 4–6 mm (marked in red). The data reveal that the region closer to the surface (2–4 mm) exhibits relatively higher fatigue crack growth resistance compared to the deeper region (4–6 mm). The transition zone displays the largest scatter in da/dN–ΔK response, which is attributed to its heterogeneous microstructure. This region contains an evolving mixture of tempered martensite, pearlite, and ferrite, leading to local differences in hardness, crack deflection behavior, and plastic deformation. As a result, crack growth in this zone is less stable, and the fitted Paris parameters show largely reduced reliability compared to the hardened layer or core. For this reason, the data are presented without a formal fitting curve, and their implications are discussed qualitatively. It is also noted that, in some specimens, the da/dN values in the 2–4 mm region appear lower than those in the 0–2 mm hardened layer. This local deviation may be attributed to microstructural heterogeneity, crack path deflection, or residual stress variations in the transition zone. Despite these fluctuations, the overall trend across all specimens confirms that the hardened surface layer exhibits the highest average resistance to fatigue crack propagation. These findings highlight the importance of controlling transition zone uniformity in surface-hardened axle steels.
Figure 10c shows da/dN versus ΔK within the 6–15 mm depth range, corresponding to the core matrix microstructure of the axle. Based on the data points, a fitting process following the Paris Law yields the relationship as follows:
l g d a d N = 12.67 + 3.54 l g ( K )
The corresponding linear correlation coefficient r is 0.696, and the standard deviation δ is 0.68, which turns Equation (8) into the following:
d a d N = 2.14 × 10 13 K 3.54
where da/dN is in units of m/cycle, and ΔK is in units of MPa·m1/2.
The Paris Law fittings were performed using the least squares regression. For the hardened layer (0–2 mm), the fitted curve yields an R2 (coefficient of determination) of 0.691 and standard deviation δ = 0.79. For the core matrix (6–15 mm), the R2 is 0.696 and δ = 0.68. In the transition zone (2–6 mm), data scatter results in a lower R2, indicating reduced fitting reliability due to microstructural heterogeneity.
While a combined overlay of all da/dN–ΔK curves was considered, such a plot was found to be visually ambiguous due to the density and overlap of data points from different zones. Therefore, the separate plots in Figure 10a–c were retained for clarity. Nonetheless, a comparative analysis based on curve fitting results is provided below to highlight the distinct fatigue behavior across the microstructural layers.
By comparing Figure 10a with Figure 10b,c, and correspondingly comparing Equation (7) with Equation (9), it is evident that within ΔK of 10–40 MPa·m1/2, da/dN in the hardened surface layer of the actual axle is relatively slower than that in the transition layer and the core matrix. This observation indicates that the hardened surface layer of the axle possesses a relatively higher resistance to fatigue crack growth, effectively impeding crack propagation under equivalent stress intensity factor conditions.

4.3. Engineering Implications and Limitations

The findings of this study offer practical value for the design and maintenance of railway axles. The demonstrated fatigue crack growth resistance of the surface-hardened layer validates the industrial application of induction hardening as an effective strategy to extend axle life. The transition layer, with its mixed-phase microstructure and high scatter in crack growth rates, should receive special attention during service inspection and non-destructive evaluation (NDE), as it represents a region of mechanical vulnerability.
Additionally, the depth-dependent da/dN–ΔK models provide a quantitative framework for fatigue life prediction in axles with gradient structures. These models can be integrated into maintenance planning tools to define inspection intervals and evaluate the need for hardened layer depth optimization based on service conditions and loading history. The depth-dependent fatigue crack growth data can also serve as input for numerical simulations or analytical models (e.g., Forman or modified Paris models) to improve fatigue life prediction of surface-hardened components.
However, this study has several limitations, which leave more space to improve in future studies. First, the sample size was limited to six specimens, which restricts statistical generalization. Second, the loading configuration was uniaxial three-point bending under constant amplitude, which does not capture the multiaxial and variable-amplitude conditions present in actual axle service. Third, the tests were conducted at room temperature in ambient air, without accounting for temperature variation, humidity, or corrosive environments. Fourth, quantitative microstructural characterization needs to be achieved. While the general features of the hardened layer, transition zone, and core were identified, detailed metrics such as martensite lath width, grain boundary density, and retained austenite content were not measured. Incorporation with SEM, EBSD, or XRD techniques to correlate these quantitative features with fatigue crack propagation behavior seems to be a better choice. All these limitations will be well addressed in future work. Future work may also explore how AM techniques can replicate or improve upon the fatigue-resistant gradient structures observed in induction-hardened axles, enabling customized design for advanced rail applications.

5. Conclusions

This study experimentally quantified fatigue crack growth behavior in a surface-hardened axle steel with a gradient microstructure. Among the three regions, the hardened surface layer (0–2 mm) exhibited the slowest da/dN and flattest Paris Law slope, indicating superior fatigue resistance. In contrast, the core matrix (>6 mm) showed the fastest crack growth, and the transition zone displayed intermediate and unstable behavior.
Depth-specific da/dN–ΔK relationships were established for each microstructural region, providing a basis for fatigue life prediction in components with graded structures. While the transition zone data could not be reliably fitted due to scatter, the experimental trends highlight the mechanical instability introduced by microstructural heterogeneity.
These findings support the continued use of induction hardening to enhance axle durability and inform future design of hardened layer profiles. The data can be further used to calibrate numerical fatigue models or guide non-destructive inspection strategies focused on transition zones. Future work will include residual stress quantification, SEM-based fractography, and testing under variable R-ratios to enhance applicability under service conditions.

Author Contributions

Conceptualization, C.G. and H.S. (Hang Su); Formal analysis, B.Z. and H.S. (Hang Su); Investigation, C.G., Z.Y., Y.Z. and B.Z.; Resources, Z.Y., Y.Z., T.F., B.Z. and H.S. (Huajian Song); Data curation, Z.Y., T.F. and H.S. (Huajian Song); Writing—original draft, H.S. (Hang Su); Writing—review & editing, H.S. (Huajian Song) and H.S. (Hang Su); Project administration, C.G.; Funding acquisition, C.G. All authors have read and agreed to the published version of the manuscript.

Funding

This research received no external funding.

Data Availability Statement

The original contributions presented in this study are included in the article. Further inquiries can be directed to the corresponding author(s).

Conflicts of Interest

Author Tao Fan was employed by Heilongjiang Zhongbei Post and Telecommunications Construction and Development Company; Author Bo Zhang was employed by Zhongte (Shenzhen) Intelligent Co., Ltd. The remaining authors declare that the research was conducted in the absence of any commercial or financial relationships that could be construed as a potential conflict of interest.

References

  1. Glossary: High-Speed Rail. Available online: https://ec.europa.eu/eurostat/statistics-explained/index.php?title=Glossary:High-speed_rail (accessed on 6 April 2025).
  2. High-Speed Rail. Available online: https://en.wikipedia.org/wiki/High-speed_rail (accessed on 6 April 2025).
  3. Ollivier, G.; Bullock, R.; Jin, Y.; Zhou, N. High-Speed Railways in China: A Look at Traffic; World bank: Washington, DC, USA, 2014. [Google Scholar]
  4. Zerbst, U.; Klinger, C.; Klingbeil, D. Structural assessment of railway axles—A critical review. Eng. Fail. Anal. 2013, 35, 54–65. [Google Scholar] [CrossRef]
  5. Tong, Y.Y.; Liu, G.X.; Yousefian, K.; Jing, G.Q. Track Vertical Stiffness -Value, Measurement Methods, Effective Parameters and Challenges: A review. Transp. Geotech. 2022, 37, 100833. [Google Scholar] [CrossRef]
  6. Pan, X.; Su, H.; Sun, C.; Hong, Y. The behavior of crack initiation and early growth in high-cycle and very-high-cycle fatigue regimes for a titanium alloy. Int. J. Fatigue 2018, 115, 67–78. [Google Scholar] [CrossRef]
  7. Sun, C.; Song, Q.; Zhou, L.; Pan, X. Characteristic of interior crack initiation and early growth for high cycle and very high cycle fatigue of a martensitic stainless steel. Mater. Sci. Eng. A 2019, 758, 112–120. [Google Scholar] [CrossRef]
  8. Pan, X.; Hong, Y. High-cycle and very-high-cycle fatigue behaviour of a titanium alloy with equiaxed microstructure under different mean stresses. Fatigue Fract. Eng. Mater. Struct. 2019, 42, 1950–1964. [Google Scholar] [CrossRef]
  9. Chang, Y.; Zheng, L.; Pan, X.; Hong, Y. Further investigation on microstructure refinement of internal crack initiation region in VHCF regime of high-strength steels. Fract. Struct. Integr. 2019, 13, 1–11. [Google Scholar] [CrossRef]
  10. Pan, X.; Xu, S.; Qian, G.; Nikitin, A.; Shanyavskiy, A.; Palin-Luc, T.; Hong, Y. The mechanism of internal fatigue-crack initiation and early growth in a titanium alloy with lamellar and equiaxed microstructure. Mater. Sci. Eng. A 2020, 798, 140110. [Google Scholar] [CrossRef]
  11. Chang, Y.; Pan, X.; Zheng, L.; Hong, Y. Microstructure refinement and grain size distribution in crack initiation region of very-high-cycle fatigue regime for high-strength alloys. Int. J. Fatigue 2020, 134, 105473. [Google Scholar] [CrossRef]
  12. Cong, T.; Qian, G.; Zhang, G.; Wu, S.; Pan, X.; Du, L.; Liu, X. Effects of inclusion size and stress ratio on the very-high-cycle fatigue behavior of pearlitic steel. Int. J. Fatigue 2021, 142, 105958. [Google Scholar] [CrossRef]
  13. Pan, X.; Su, H.; Liu, X.; Hong, Y. Multi-scale fatigue failure features of titanium alloys with equiaxed or bimodal microstructures from low-cycle to very-high-cycle loading numbers. Mater. Sci. Eng. A 2024, 890, 145906. [Google Scholar] [CrossRef]
  14. Pan, X.; Xu, S.; Nikitin, A.; Shanyavskiy, A.; Palin-Luc, T.; Hong, Y. Crack initiation induced nanograins and facets of a titanium alloy with lamellar and equiaxed microstructure in very-high-cycle fatigue. Mater. Lett. 2024, 357, 135769. [Google Scholar] [CrossRef]
  15. Weiss, V.; Lal, D.N. Threshold condition for fatigue crack-propagation. Metall. Trans. 1974, 5, 1946–1949. [Google Scholar] [CrossRef]
  16. Schijve, J. Fatigue of Structures and Materials, 2nd ed.; Springer: Dordrecht, Germany, 2009. [Google Scholar]
  17. Dowling, N.E. Mechanical Behavior of Materials: Engineering Methods for Deformation, Fracture, and Fatigue, 4th ed.; Pearson: Boston, MA, USA, 2013. [Google Scholar]
  18. Chen, Z.; Dai, Y.; Liu, Y. Crack propagation simulation and overload fatigue life prediction via enhanced physics-informed neural networks. Int. J. Fatigue 2024, 186, 108382. [Google Scholar] [CrossRef]
  19. Chen, Z.; Dai, Y.; Liu, Y. Structural fatigue crack propagation simulation and life prediction based on improved XFEM-VCCT. Eng. Fract. Mech. 2024, 310, 110519. [Google Scholar] [CrossRef]
  20. Mourad, A.H.I.; Sajith, S.; Shitole, S.; Almomani, A.; Khan, S.H.; Elsheikh, A.; Alzo’ubi, A.K. Fatigue life and crack growth prediction of metallic structures: A review. Structures 2025, 76, 109031. [Google Scholar] [CrossRef]
  21. Sangid, M.D. The physics of fatigue crack propagation. Int. J. Fatigue 2025, 197, 108928. [Google Scholar] [CrossRef]
  22. Meyers, M.A.; Mishra, A.; Benson, D.J. Mechanical properties of nanocrystalline materials. Prog. Mater. Sci. 2006, 51, 427–556. [Google Scholar] [CrossRef]
  23. Zhang, S.; Xie, J.; Jiang, Q.; Zhang, X.; Sun, C.; Hong, Y. Fatigue crack growth behavior in gradient microstructure of hardened surface layer for an axle steel. Mater. Sci. Eng. A 2017, 700, 66–74. [Google Scholar] [CrossRef]
  24. Lei, Y.B.; Wang, Z.B.; Xu, J.L.; Lu, K. Simultaneous enhancement of stress- and strain-controlled fatigue properties in 316L stainless steel with gradient nanostructure. Acta Mater. 2019, 168, 133–142. [Google Scholar] [CrossRef]
  25. Pan, X.; Qian, G.; Wu, S.; Fu, Y.; Hong, Y. Internal crack characteristics in very-high-cycle fatigue of a gradient structured titanium alloy. Sci. Rep. 2020, 10, 4742. [Google Scholar] [CrossRef]
  26. Garnham, J.E.; Davis, C.L. The role of deformed rail microstructure on rolling contact fatigue initiation. Wear 2008, 265, 1363–1372. [Google Scholar] [CrossRef]
  27. Klinger, C.; Bettge, D. Axle fracture of an ICE3 high speed train. Eng. Fail. Anal. 2013, 35, 66–81. [Google Scholar] [CrossRef]
  28. Fu, Z.K.; Ding, H.H.; Wang, W.J.; Liu, Q.Y.; Guo, J.; Zhu, M.H. Investigation on microstructure and wear characteristic of laser cladding Fe-based alloy on wheel/rail materials. Wear 2015, 330, 592–599. [Google Scholar] [CrossRef]
  29. Hassani-Gangaraj, S.M.; Carboni, M.; Guagliano, M. Finite element approach toward an advanced understanding of deep rolling induced residual stresses, and an application to railway axles. Mater. Design 2015, 83, 689–703. [Google Scholar] [CrossRef]
  30. Hu, Y.; Zhou, L.; Ding, H.H.; Lewis, R.; Liu, Q.Y.; Guo, J.; Wang, W.J. Microstructure evolution of railway pearlitic wheel steels under rolling-sliding contact loading. Tribol. Int. 2021, 154, 106685. [Google Scholar] [CrossRef]
  31. Unal, O.; Maleki, E.; Karademir, I.; Husem, F.; Efe, Y.; Das, T. Effects of conventional shot peening, severe shot peening, re-shot peening and precised grinding operations on fatigue performance of AISI 1050 railway axle steel. Int. J. Fatigue 2022, 155, 106613. [Google Scholar] [CrossRef]
  32. Du, S.; Wang, K.; Hu, F. Overview and prospect of axle technology for high speed trains at home and abroad. Mater. China 2019, 38, 641–650. (In Chinese) [Google Scholar]
  33. Liu, L.; Ma, Y.; Liu, S.; Wang, S. The fatigue behaviors of a medium-carbon pearlitic wheel-steel with elongated sulfides in high-cycle and very-high-cycle regimes. Materials 2021, 14, 4318. [Google Scholar] [CrossRef]
  34. Klenam, D.E.P.; Chown, L.H.; Papo, M.J.; Cornish, L.A. Steels for rail axles-an overview. Crit. Rev. Solid State Mater. Sci. 2024, 49, 163–193. [Google Scholar] [CrossRef]
  35. Zhang, R.; Zheng, C.; Lv, B.; Wang, X.; Li, X.; Li, Y.; Zhang, F. Research progress on rolling contact fatigue damage of bainitic rail steel. Eng. Fail. Anal. 2023, 143, 106875. [Google Scholar]
  36. Lewis, R.; Olofsson, U. Mapping rail wear regimes and transitions. Wear 2004, 257, 721–729. [Google Scholar] [CrossRef]
  37. Enblom, R.; Berg, M. Simulation of railway wheel profile development due to wear—Influence of disc braking and contact environment. Wear 2005, 258, 1055–1063. [Google Scholar] [CrossRef]
  38. Braghin, F.; Lewis, R.; Dwyer-Joyce, R.S.; Bruni, S. A mathematical model to predict railway wheel profile evolution due to wear. Wear 2006, 261, 1253–1264. [Google Scholar] [CrossRef]
  39. Hirakawa, K.; Toyama, K.; Kubota, M. The analysis and prevention of failure in railway axles. Int. J. Fatigue 1998, 20, 135–144. [Google Scholar] [CrossRef]
  40. Ekberg, A.; Kabo, E. Fatigue of railway wheels and rails under rolling contact and thermal loading—An overview. Wear 2005, 258, 1288–1300. [Google Scholar] [CrossRef]
  41. Zerbst, U.; Mädler, B.; Hintze, H. Fracture mechanics in railway applications: An overview. Eng. Fract. Mech. 2005, 72, 163–194. [Google Scholar] [CrossRef]
  42. Zerbst, U.; Beretta, S.; Köhler, G.; Lawton, A.; Vormwald, M.; Beier, H.T.; Klinger, C.; Cerny, I.; Rudlin, J.; Heckel, T.; et al. Safe life and damage tolerance aspects of railway axles—A review. Eng. Fract. Mech. 2013, 98, 214–271. [Google Scholar] [CrossRef]
  43. Ekberg, A.; Åkesson, B.; Kabo, E. Wheel/rail rolling contact fatigue—Probe, predict, prevent. Wear 2014, 314, 2–12. [Google Scholar] [CrossRef]
  44. Murakami, Y. Metal Fatigue: Effect of Small Defects and Nonmetallic Inclusions; Elsevier: Oxford, UK, 2002. [Google Scholar]
  45. Pan, X.; Du, L.; Qian, G.; Hong, Y. Microstructure features induced by fatigue crack initiation up to very-high-cycle regime for an additively manufactured aluminium alloy. J. Mater. Sci. Technol. 2024, 173, 247–260. [Google Scholar] [CrossRef]
  46. Pan, X.; Hong, Y. High-cycle and very-high-cycle fatigue of an additively manufactured aluminium alloy under axial cycling at ultrasonic and conventional frequencies. Int. J. Fatigue 2024, 185, 108363. [Google Scholar] [CrossRef]
  47. Du, L.; Pan, X.; Hong, Y. New insights into microstructure refinement in crack initiation region of very-high-cycle fatigue for SLM Ti-6Al-4V via precession electron diffraction. Materialia 2024, 33, 102008. [Google Scholar] [CrossRef]
  48. Pan, X.; Qian, G.; Hong, Y. Nanograin formation in dimple ridges due to local severe-plastic-deformation during ductile fracture. Scr. Mater. 2021, 194, 11363. [Google Scholar] [CrossRef]
  49. Du, L.; Pan, X.; Qian, G.; Zheng, L.; Hong, Y. Crack initiation mechanisms under two stress ratios up to very-high-cycle fatigue regime for a selective laser melted Ti-6Al-4V. Int. J. Fatigue 2021, 149, 106294. [Google Scholar] [CrossRef]
  50. Yap, C.Y.; Chua, C.K.; Dong, Z.L.; Liu, Z.H.; Zhang, D.Q.; Loh, L.E.; Sing, S.L. Review of selective laser melting: Materials and applications. Appl. Phys. Rev. 2015, 2, 041101. [Google Scholar] [CrossRef]
  51. DebRoy, T.; Wei, H.L.; Zuback, J.S.; Mukherjee, T.; Elmer, J.W.; Milewski, J.O.; Beese, A.M.; Wilson-Heid, A.; De, A.; Zhang, W. Additive manufacturing of metallic components—Process, structure and properties. Prog. Mater. Sci. 2018, 92, 112–224. [Google Scholar] [CrossRef]
  52. Qian, G.; Jian, Z.; Pan, X.; Berto, F. In-situ investigation on fatigue behaviors of Ti-6Al-4V manufactured by selective laser melting. Int. J. Fatigue 2020, 133, 105424. [Google Scholar] [CrossRef]
  53. Qian, G.; Jian, Z.; Qian, Y.; Pan, X.; Ma, X.; Hong, Y. Very-high-cycle fatigue behavior of AlSi10Mg manufactured by selective laser melting: Effect of build orientation and mean stress. Int. J. Fatigue 2020, 138, 105696. [Google Scholar] [CrossRef]
  54. Badoniya, P.; Srivastava, M.; Jain, P.K.; Rathee, S. A state-of-the-art review on metal additive manufacturing: Milestones, trends, challenges and perspectives. J. Braz. Soc. Mech. Sci. 2024, 46, 339. [Google Scholar] [CrossRef]
  55. Tao, Z.; Wang, Z.; Pan, X.; Su, T.; Long, X.; Liu, B.; Tang, Q.; Ren, X.; Sun, C.; Qian, G.; et al. A new probabilistic control volume scheme to interpret specimen size effect on fatigue life of additively manufactured titanium alloys. Int. J. Fatigue 2024, 183, 108262. [Google Scholar] [CrossRef]
  56. Xu, S.; Pan, S.; Li, Z.; Li, S.; He, X.; Pan, X. Anisotropic tensile behavior and fracture characteristics of an additively manufactured nickel alloy without and with a heat treatment of solution aging. Mater. Sci. Eng. A 2025, 927, 148015. [Google Scholar] [CrossRef]
  57. Tan, X.; Kok, Y.; Tan, Y.J.; Descoins, M.; Mangelinck, D.; Tor, S.B.; Leong, K.F.; Chua, C.K. Graded microstructure and mechanical properties of additive manufactured Ti-6Al-4V via electron beam melting. Acta Mater. 2015, 97, 1–16. [Google Scholar] [CrossRef]
  58. Long, X.; Jia, Q.; Li, J.; Chong, K.; Du, L.; Pan, X.; Chang, C. Mechanical properties and parameter optimization of TC4 alloy by additive manufacturing. China Surf. Eng. 2022, 35, 215–223. (In Chinese) [Google Scholar]
  59. Gao, C.; Zhang, Y.; Jiang, J.; Fu, R.; Du, L.; Pan, X. Research viewpoint on performance enhancement for very-high-cycle fatigue of Ti-6Al-4V alloys via laser-based powder bed fusion. Crystals 2024, 14, 749. [Google Scholar] [CrossRef]
  60. Xu, W.; Lui, E.W.; Pateras, A.; Qian, M.; Brandt, M. In situ tailoring microstructure in additively manufactured Ti-6Al-4V for superior mechanical performance. Acta Mater. 2017, 125, 390–400. [Google Scholar] [CrossRef]
Figure 1. Schematic of a high-speed train trailer axle (unit: mm).
Crystals 15 00638 g001
Figure 2. Schematics of (a) three-point bending specimen, (b) axle cross-sectional sampling. All specimens were sectioned longitudinally along the axle axis to ensure radial crack propagation direction in three-point bending (unit: mm).
Crystals 15 00638 g002
Figure 3. Fatigue testing system: (a) PLG100 high-frequency fatigue testing machine (frequency range: 80–250 Hz, maximum loading: ±50 kN), (b) imaging and data acquisition system.
Crystals 15 00638 g003
Figure 4. Schematic of crack measurement. Red lines and labeled points represent schematic measurement paths used to correct surface crack lengths.
Crystals 15 00638 g004
Figure 5. Optical observations of fatigue crack propagation of Specimen 1: (a) original specimen, (b) crack length ~1.4 mm, (c) crack length ~4.6 mm, (d) crack length ~8.2 mm, and (e) crack length ~10.2 mm.
Crystals 15 00638 g005
Figure 6. a–N data: (a) Specimen 1, (b) Specimen 3, (c) Specimen 4, (d) Specimen 8, (e) Specimen 17, and (f) Specimen 21.
Crystals 15 00638 g006
Figure 7. Fractographic observations using a stereomicroscope to show general fracture surface morphology: (a) Specimen 1, (b) Specimen 3, (c) Specimen 4, (d) Specimen 8, (e) Specimen 17, and (f) Specimen 21.
Crystals 15 00638 g007
Figure 8. The relationship among da/dN, ΔK, and X: (a) Specimen 1, (b) Specimen 3, (c) Specimen 4, (d) Specimen 8, (e) Specimen 17, and (f) Specimen 21.
Crystals 15 00638 g008
Figure 9. Summary diagrams of da/dN and ΔK data: (a) da/dNX–ΔK, and (b) da/dN–ΔKX.
Crystals 15 00638 g009
Figure 10. Relationship between da/dN and ΔK within different depth ranges from the specimen surface: (a) 0–2 mm; (b) 2–6 mm; (c) 6–15 mm.
Crystals 15 00638 g010
Table 1. Chemical composition of the S38C steel (wt.%).
CSiMnPSFe
0.410.260.760.00560.0090Remainder
Table 2. The actual sizes of the three-point bending specimens.
Specimen NumberWidth (mm)Height (mm)
115.6030.90
316.0031.00
416.0030.70
815.9831.20
1715.8830.80
2115.7031.00
Disclaimer/Publisher’s Note: The statements, opinions and data contained in all publications are solely those of the individual author(s) and contributor(s) and not of MDPI and/or the editor(s). MDPI and/or the editor(s) disclaim responsibility for any injury to people or property resulting from any ideas, methods, instructions or products referred to in the content.

