Article

The Modeling of Electromagnetic Behavior in the High-Frequency Range of Al2O3 and TiO2 Thermoplastic Composites in Support of Developing New Substrates for Flexible Electronics

by
Radu F. Damian
1,
Cristina Pachiu
2,
Alexandra Mocanu
2,
Alexandru Trandabat
1,3 and
Romeo Cristian Ciobanu
1,4,*
1
Department of Electrical Measurements and Materials, Gheorghe Asachi Technical University, 700050 Iasi, Romania
2
National Institute for Research and Development in Microtechnologies (IMT Bucharest), 126A Erou Iancu Nicolae Street, 077190 Voluntari, Romania
3
Intelectro Iasi SRL, 03 Iancu Bacalu Str., 700029 Iasi, Romania
4
All Green SRL, 05 Iancu Bacalu Str., 700029 Iasi, Romania
*
Author to whom correspondence should be addressed.
Crystals 2025, 15(7), 637; https://doi.org/10.3390/cryst15070637
Submission received: 6 May 2025 / Revised: 7 July 2025 / Accepted: 9 July 2025 / Published: 10 July 2025
(This article belongs to the Section Hybrid and Composite Crystalline Materials)

Abstract

The paper describes the simulation of energy absorption in polymer micro-composites that include dielectric inserts (commercial Al2O3 and TiO2 particles, with three particle sizes of 1, 5 and 25 µm, respectively). The investigated frequency spectrum, mainly from 0.001 to 100 GHz, is designed for various uses as substrates in electronic technologies. The electromagnetic simulation software chosen was CST Studio Suite, which evaluates the power loss at different frequencies, playing a crucial role in creating the ideal structure of these substrates. The effective limits of the electromagnetic simulation are specified. It is shown that a considerable increase in absorption occurs, by a factor of 12 to 120, depending on the dielectric material used for the inserts and the mass ratio applied in the insertion technique. Dielectrics with high permittivity provide higher absorption, but also create a nonuniform field distribution within the material, resulting in a high peak-to-average absorption ratio. In scenarios where this behavior is intolerable, the technology must be carefully tuned to improve the consistency of the insertions in the substrate material. The final outcomes of the simulations indicated that for creating new substrates for flexible electronics, polyethylene composites with TiO2 insertions are suggested, particularly at lower concentrations of up to 7% and with a larger radius, such as 25 μm, which could offer significant economic advantages considering that the current concept advises the use of costly particles ranging from nanoscale particles to those 1 μm in size and a composition exceeding 10%.

1. Introduction

Substrates, commonly known as the base of electronic devices, are materials or frameworks on which electronic components are built. They offer structural reinforcement, enable electrical connections, and act as the surface for the complex circuitry. Flexible substrates represent a key area where the technology of flexible and stretchable electronic devices diverges from conventional electronic technology. Flexible substrates possess the same qualities as conventional rigid substrates, but along with typical attributes like insulation, high strength, and affordability, flexible substrates possess distinct qualities such as flexibility and stretchability, along with corrosion resistance [1,2,3,4]. The benefits pertain to the production of thin films, usually ranging from 0.2 to 1 mm, which lowers material costs and decreases the product’s weight, but also provides a fresh perspective on reducing the carbon footprint of electronic technology [5]. Flexible electronic systems can utilize substrates made from various thermoplastic materials, such as silicon–organic resin, polyethylene, polyimide, polydimethylsiloxane, or polyethylene terephthalate [6,7,8].
Recent research indicates that, in addition to exceptional flexibility and imposed dielectric parameters, stable chemical properties (including low moisture adsorption), mechanical strength, and good thermal stability (low thermal expansion coefficient) are other crucial requirements for mass production in the innovative electronics sector [2,4]. These characteristics are typically associated with polymer composite film technology and can be easily modified; however, they do not provide an accurate depiction of material behavior at high frequencies, which is more challenging to evaluate [9,10,11]. The estimation of transmission losses and waveform distortion in high-frequency (up to 10 GHz) environments may be initially more efficiently conducted through modeling with specialized software, providing essential insights regarding optimal composite structure and formulation.
The research focuses on modeling the electromagnetic properties in the high-frequency range of Al2O3 and TiO2 thermoplastic composites, regarded as novel options for substrates in flexible electronics [12,13]. The advancement of thermoplastic composites featuring Al2O3 and TiO2 inserts has regained scientists’ interest in recent years, whether separately for TiO2 [14,15,16,17,18,19] and Al2O3 [20,21,22,23], or even in combination [24]. Due to their potential ability to operate effectively at high-speed signal frequencies, ranging from the upper-MHz to the GHz range, the understanding of their potential and specific requirements in high-frequency applications (e.g., base stations for flexible cell phones or communication and control systems—including for the automotive industry, wearable medical equipment, etc. [24,25,26,27,28,29]) is crucial for designing substrates that meet the demanding standards of advanced electronic technologies. The current paper represents a step forward in this area, addressing the modeling of electromagnetic performance concerning the composition of respective thermoplastic materials.
Some analytical techniques and theoretical methods have remained steady as the dielectric inserts have been discovered to achieve satisfactory performance at microwave frequencies [30,31,32,33]. Nevertheless, analytical methods have proven effective only for straightforward structures and tend to fall short in the frequency range where the wavelength approaches the distances between particles and/or their size. Electromagnetic simulation relies on the methodology initially suggested by Nicolson, Ross, and Weir (the NRW procedure), which has been refined as discussed in references [34,35,36] to overcome the NRW procedure’s instability when dealing with low-loss materials, where measurement inaccuracies significantly impact the precision of the results.
The selected software for electromagnetic simulation was CST Studio Suite [37]. The simulation demonstrated below for thermoplastic composites with Al2O3 and TiO2 inserts is groundbreaking and seeks to identify the ideal choices for particle size and power loss at different frequencies, serving as a foundation for advancing new substrates for flexible electronics within the high-frequency spectrum.

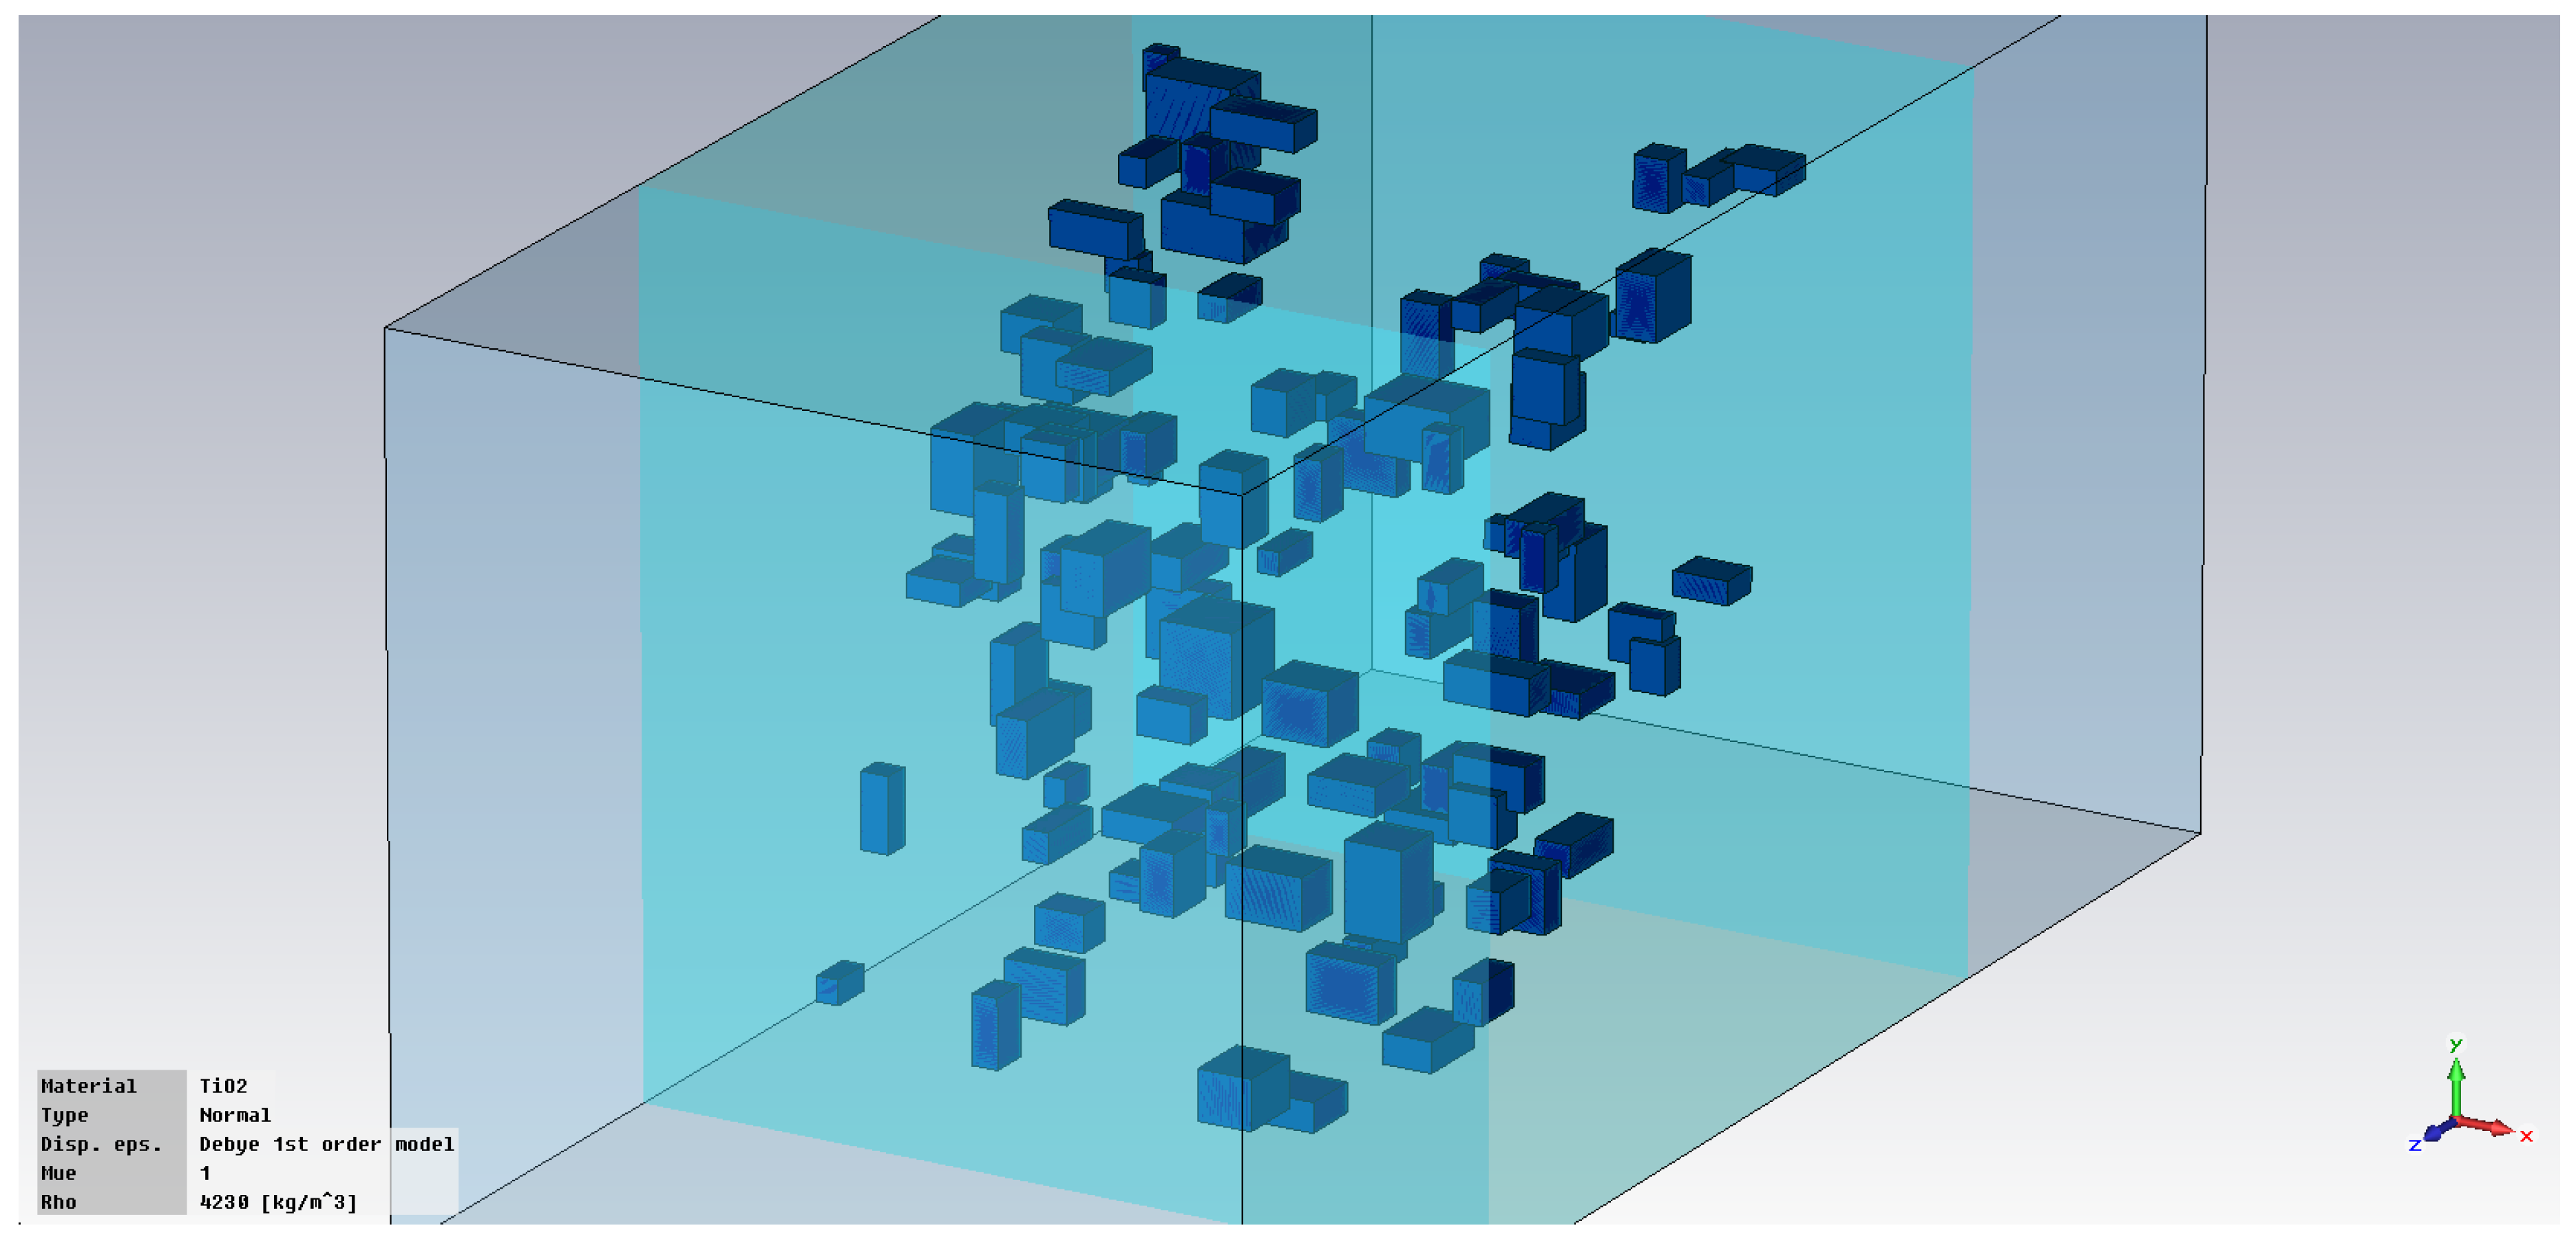
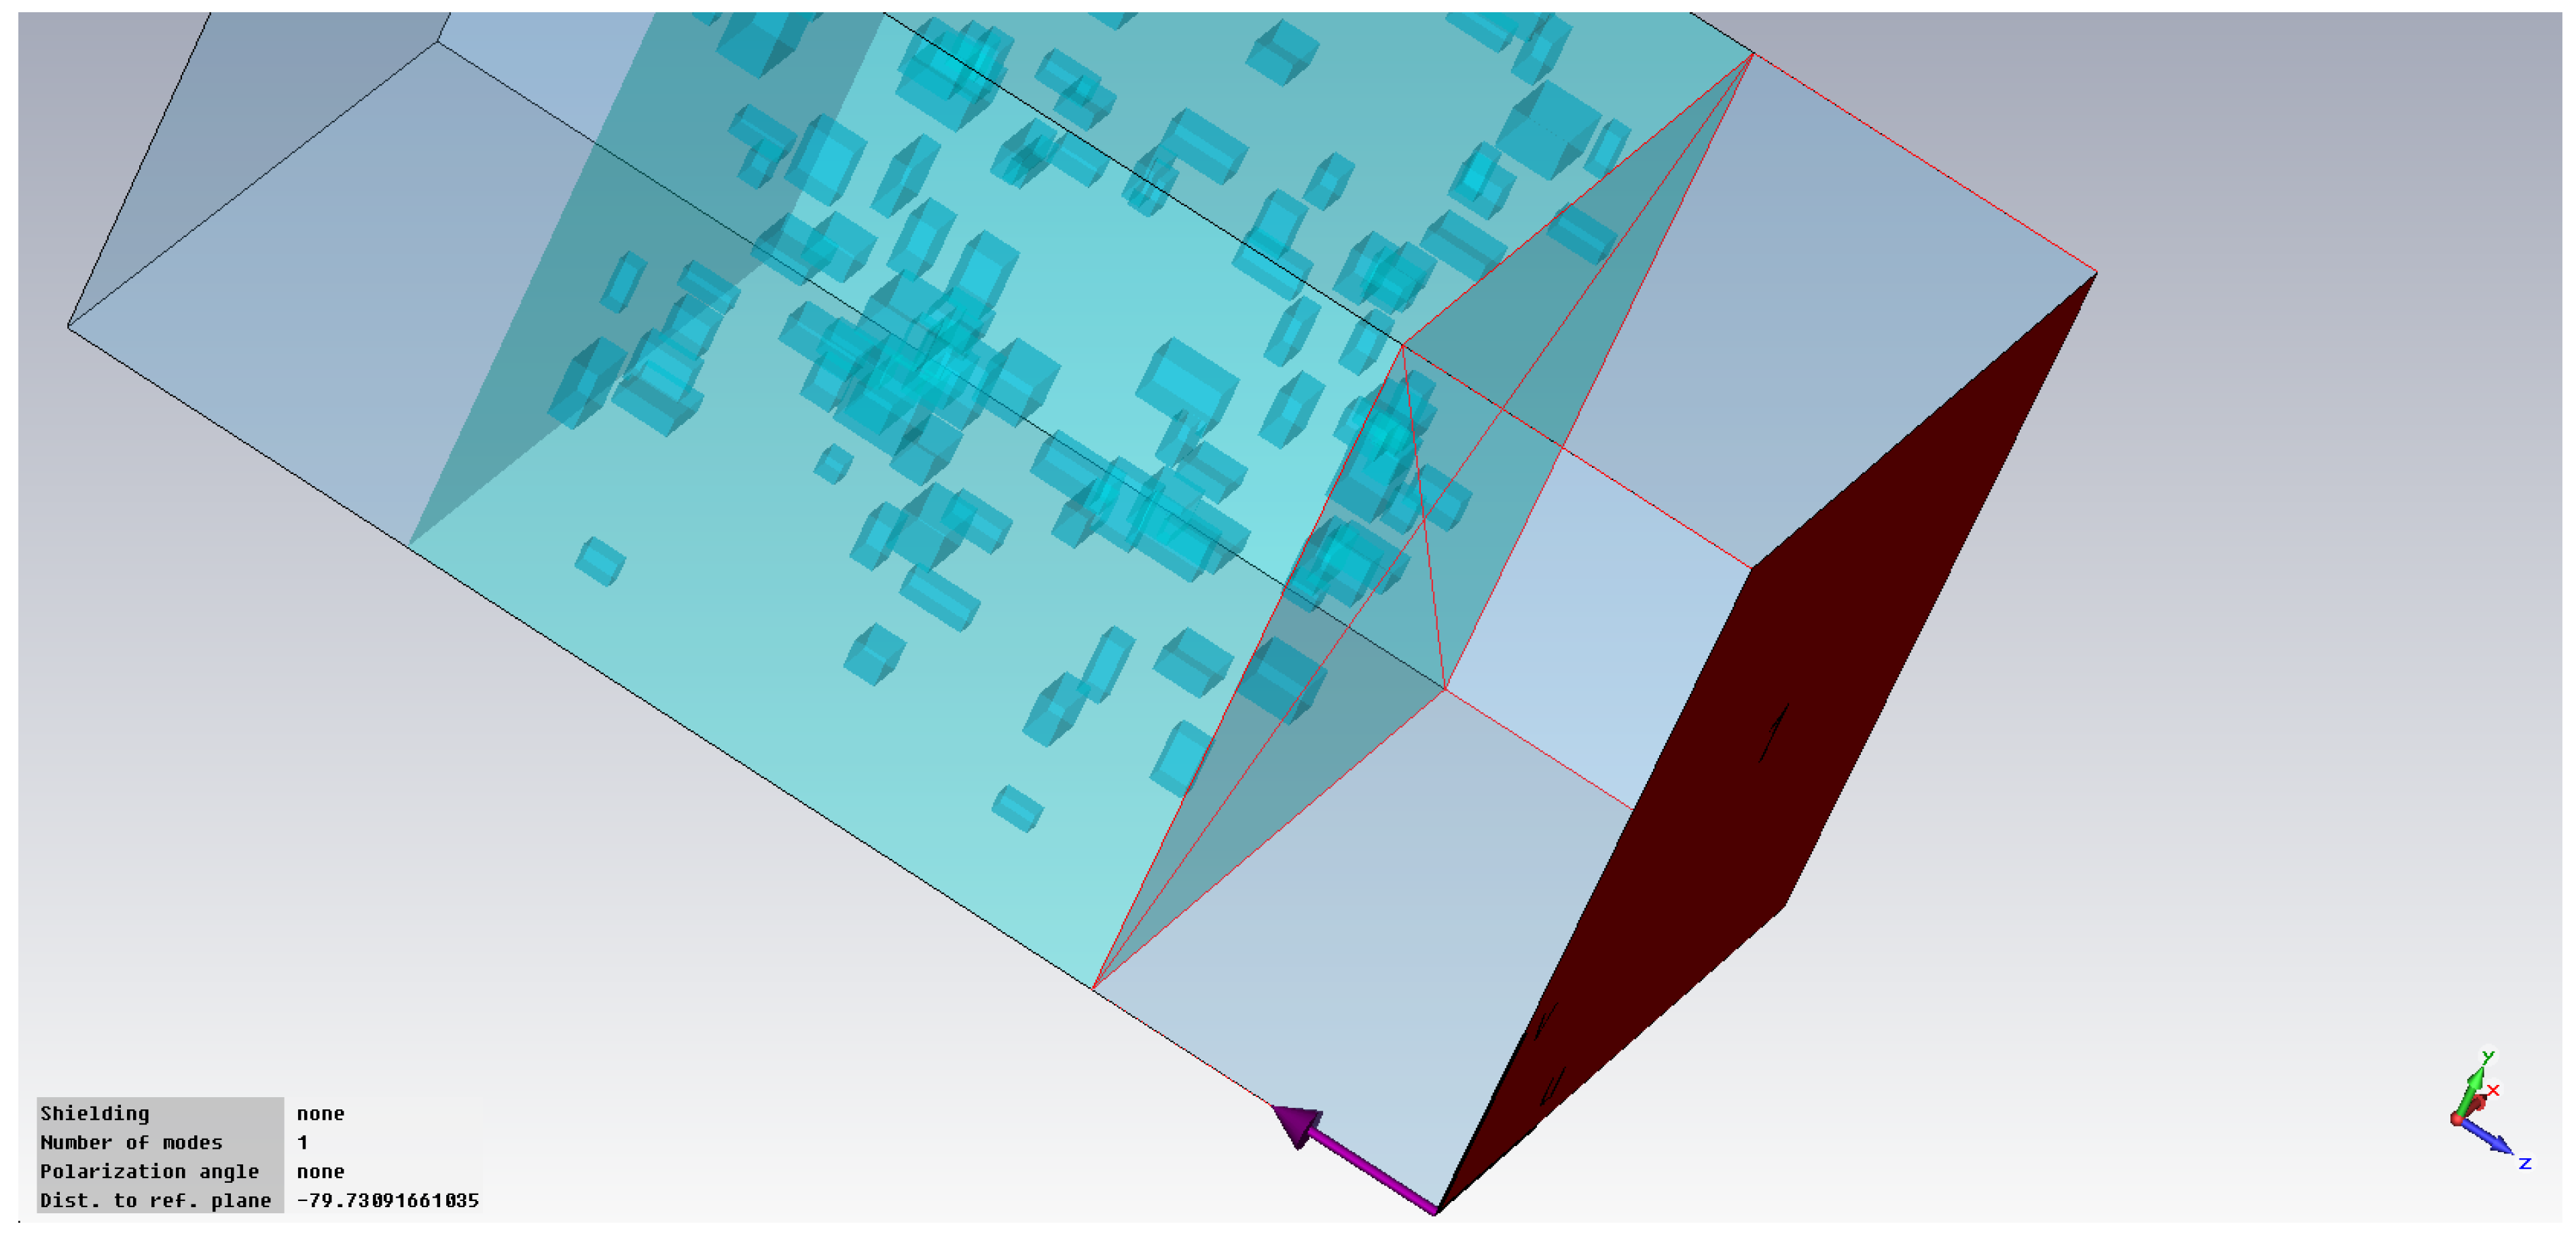
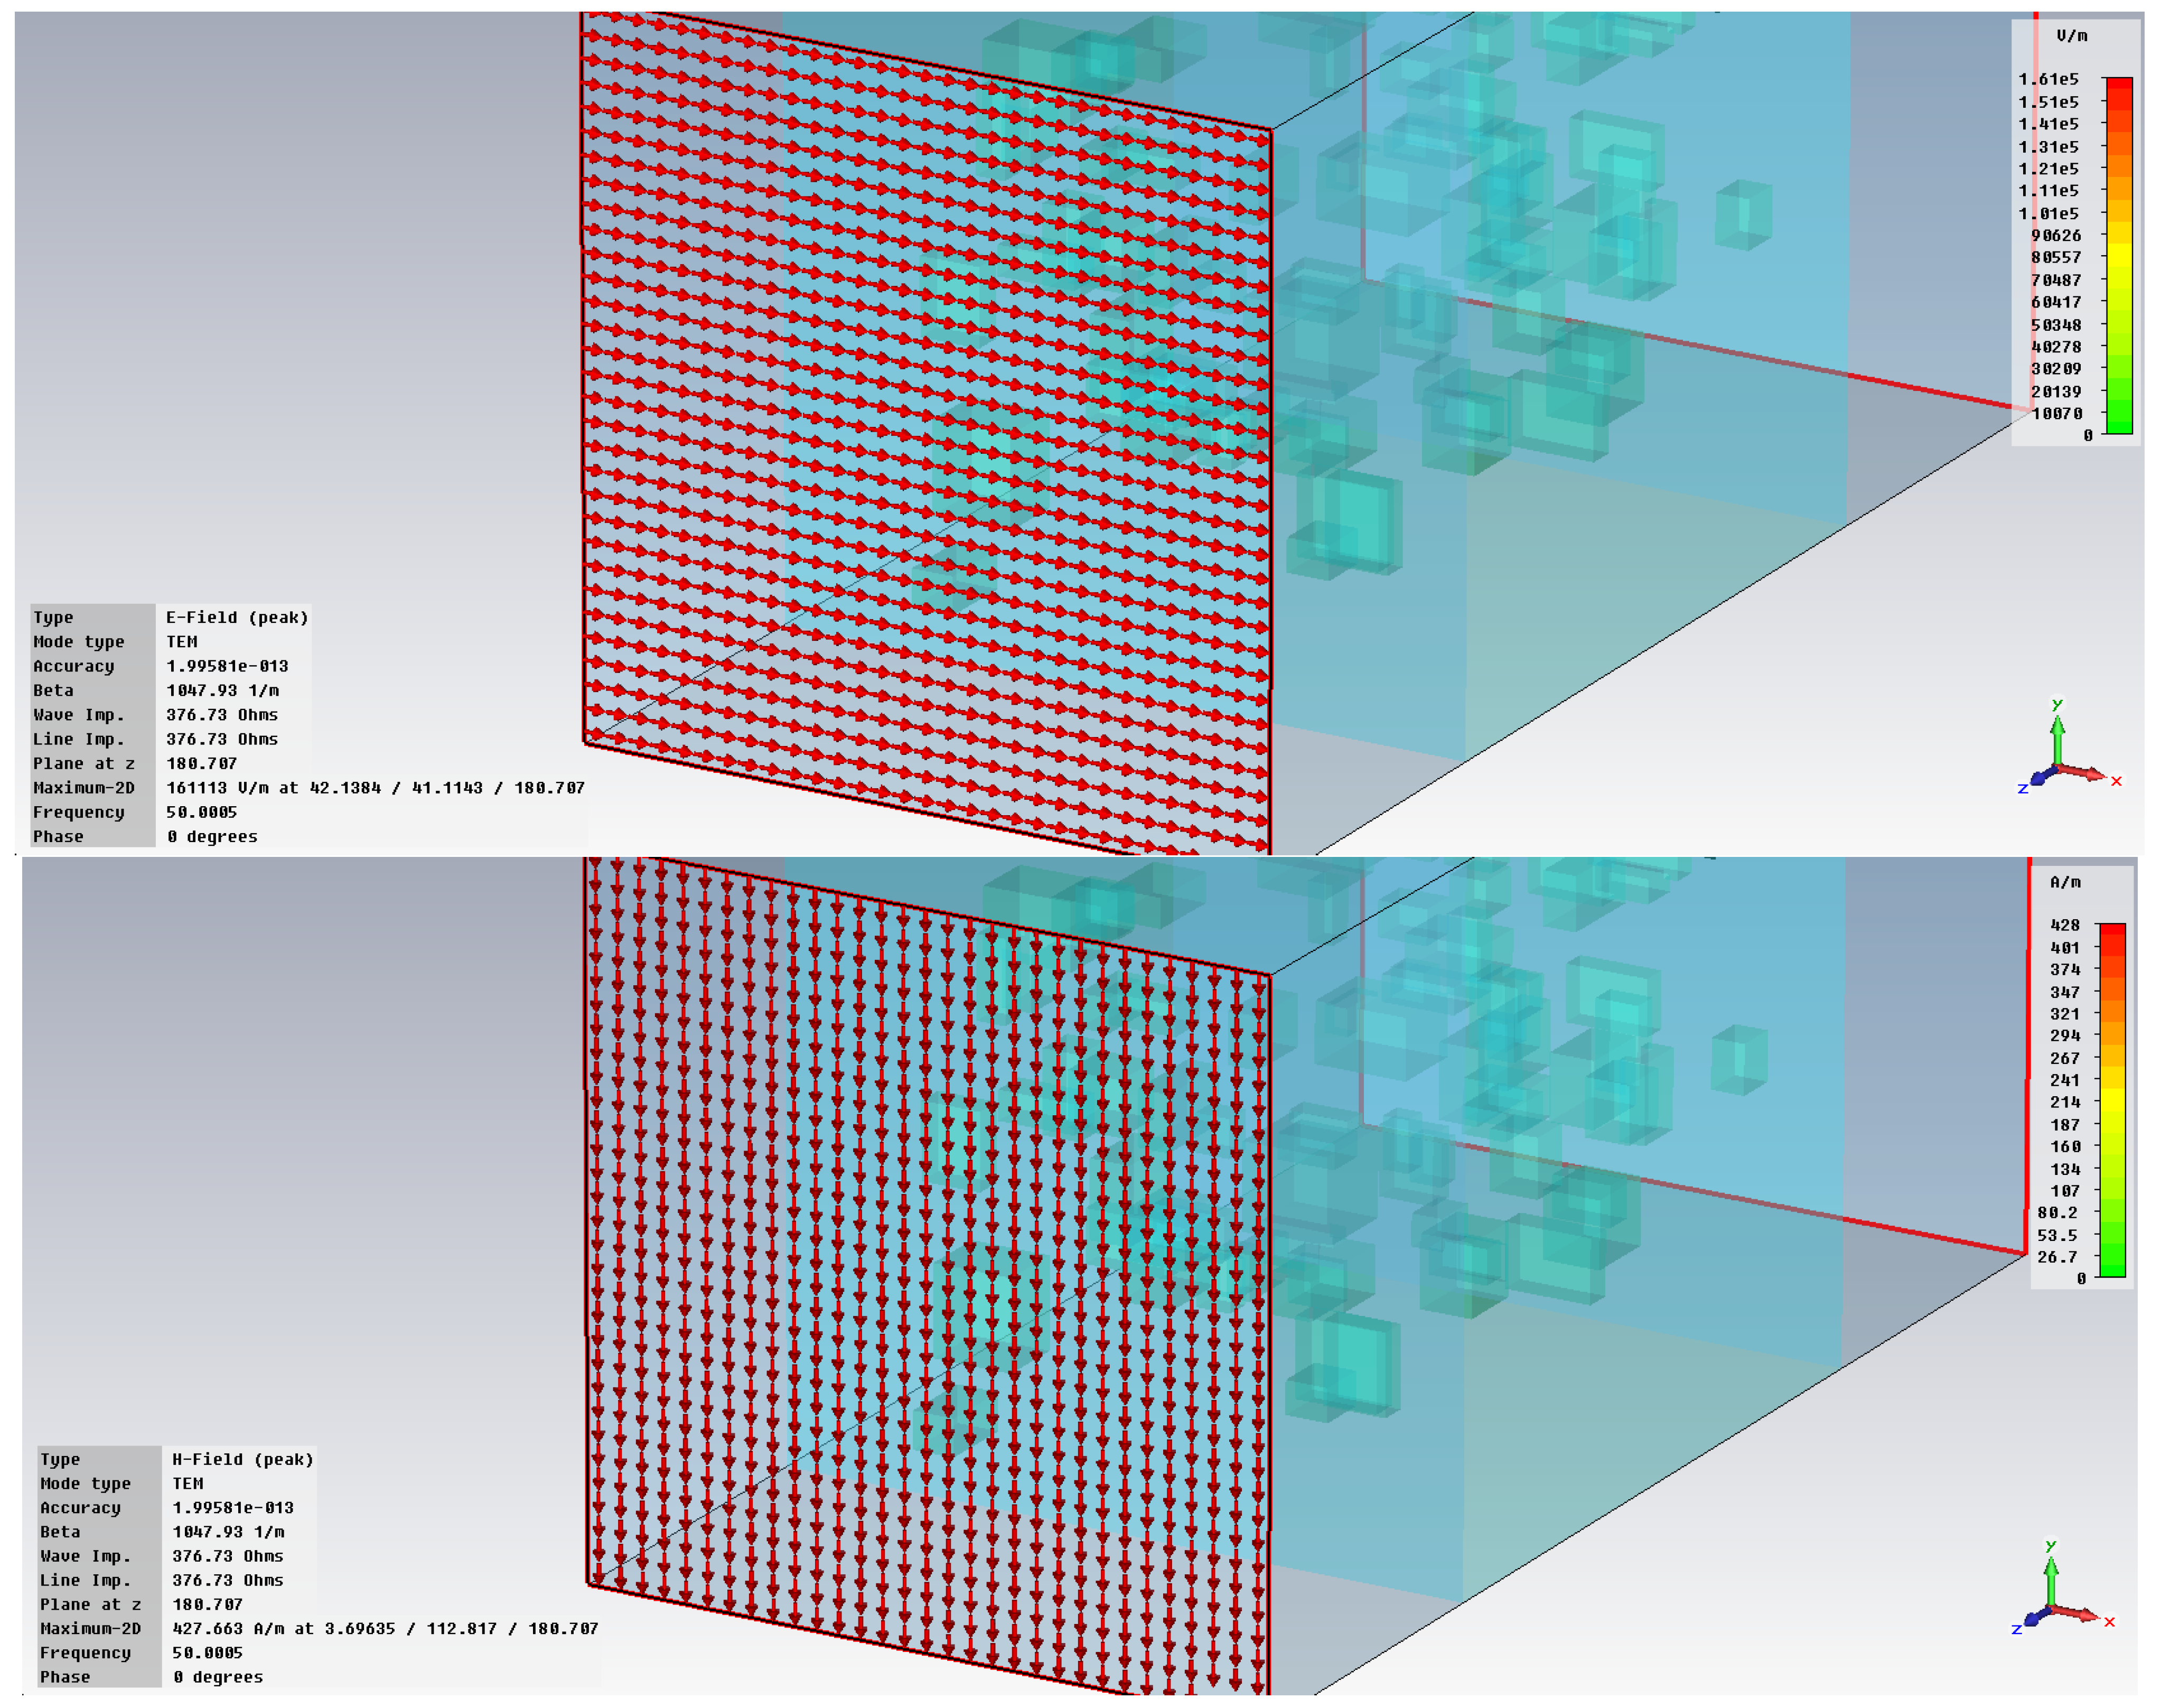
2. Electromagnetic Simulation

Usually, commercial Al2O3 and TiO2 particles which can potentially be used for composite substrates present a mainly quasi-spherical shape and dimensions between 1 and 40 μm. A preliminary investigation into the influence of particle shape on electromagnetic field absorption is presented in Figure 1 (for spherical particles of TiO2), where one can notice that the energy losses are volumetric rather than superficial.
Accordingly, in order to simplify the model, it is preferable to replace spherical particles with cubic (parallelepipedal) particles. A spherical particle can be replaced by a cube that provides a similar volume, as in Equation (1), or a cube that has the same external surface, as in Equation (2).
R c u b e ( V ) 3 = 4 π R s p h e r e 3 3 R c u b e ( V ) = R s p h e r e 4 π 3 3
6 R c u b e ( S ) 2 = 4 π R s p h e r e 2 R c u b e ( S ) = R s p h e r e 2 π 3
where Rcube denotes the side of the cube that provides a similar volume/area to a sphere of radius R.
The main electromagnetic evaluation relies on the computed electromagnetic field values in the composite structure, as outlined in references [38,39,40].
The simulation of energy losses [×10−3 W/kg] vs. frequency [GHz] depicted in Figure 2 is further proof of this concept (where Cube(V) is a cube that provides a similar volume to the sphere; Cube(S) is a cube that provides a similar exterior area to the sphere), but better precision is achieved when a spherical particle is replaced by a cube that provides a similar volume, especially at higher frequencies, over 1 GHz. So, it can be admitted that the use of cubic/parallelepipedal particles models the absorption offered by spherical particles sufficiently precisely across the entire frequency range.
The simulation was further performed in such a way that particles occupy an arbitrary position so as not to exceed the limits of the structure. A parallelepiped (quasi-cubic) shape was chosen for the particles; all particle dimensions (Lp, Wp, and Hp), as in Equation (3), being between half and double the side of the cube corresponding to the sphere, with the reference sizes chosen for the study—1 μm, 5 μm, and 25 μm—being in line with the commercial dimensions of such particles. In Equation (3), x is a randomly generated number between 0 and 1. Equations (4) and (5) represent the theoretical limit for the volume of the individual parallelepipedal particles.
L p , W p , H p = R c u b e 2 2 x 1
V m i n = 1 8 · R c u b e 3 ; V r e f = R c u b e 3 ; V m a x = 8 · R c u b e 3
V 1 8 · V r e f ; 8 · V r e f
The number of parallelepipedal particles is limited due to practical reasons to about 125 (a test with 8000 particles revealed an excessive generation time and excessive memory requirements for the simulation). As a result, the cubical substrate domain must be reduced in order to offer the required mass ratio (MR) (and volume ratio as detailed in [39]) for a typical number of 125 cubical particles, see the values in Table 1 and Table 2. Taking into account that the particles’ volume and dimensions may not be equal, the relationships in Equations (3)–(5) above cannot be applied to calculate the required number of particles, so particle generation continues incrementally until their total volume reaches the required value. As a result, an example of a typical simulated structure is the one shown in Figure 3 (for TiO2, with a reference sphere radius of 5 μm, the mass and volume ratio specified, and the random generation results in less than 125 particles for the required particle volume).
The boundary conditions and the generation of the plane wave characteristics of the electromagnetic field were determined by choosing the conditions of an electric wall (xmin and xmax) and, respectively, a magnetic wall (ymin and ymax). The conditions for the input and output ports are labeled “open”. Details about the procedure and related conditions can be found in [40]. Port definition was realized by positioning the ports at a fixed distance from the substrate (dependent on the wavelength, but not on the structure content). As a result, the ports were defined; namely, a free section of material (void) was introduced to move the port to a distance equal to half the side of the substrate/insert cube analyzed. Additionally, for the ports, the reference plane was moved to the boundary of the respective cube, as shown in Figure 4.
Even if at first glance some uncertainties in the simulation are evident, we point out that the use of simulation in defining the composite substrate technology will obviously also be accompanied by limited possibilities in terms of controlling the position of the particles inside the substrate.
The electric and magnetic fields at the ports can be visualized (Figure 5), thus verifying the judicious choice of boundary conditions generated as an interaction with a plane wave. Analysis of the vector distribution of power transfer (Poynting vectors) shows that dielectric inserts reduce the electromagnetic power transfer through the material, leading to additional energy losses.
The polymer matrices that host the inserts are low- and, respectively, high-density polyethylene (LDPE and HDPE), for which CST software does not have models in its own library, but a new model was made based on a first-order Debye equation, as described in [40], and presented in Table 3. The CST software has models in its own library for Al2O3 and, for TiO2, high-permittivity parameters from [41] were used, as in Table 4.
A preliminary example of power transfer (and implicit energy accumulation within the particles) is presented in Figure 6 as a plot of the directional electromagnetic energy flux (Poynting vector) for a composite of HDPE with 3% TiO2 at 10 GHz.

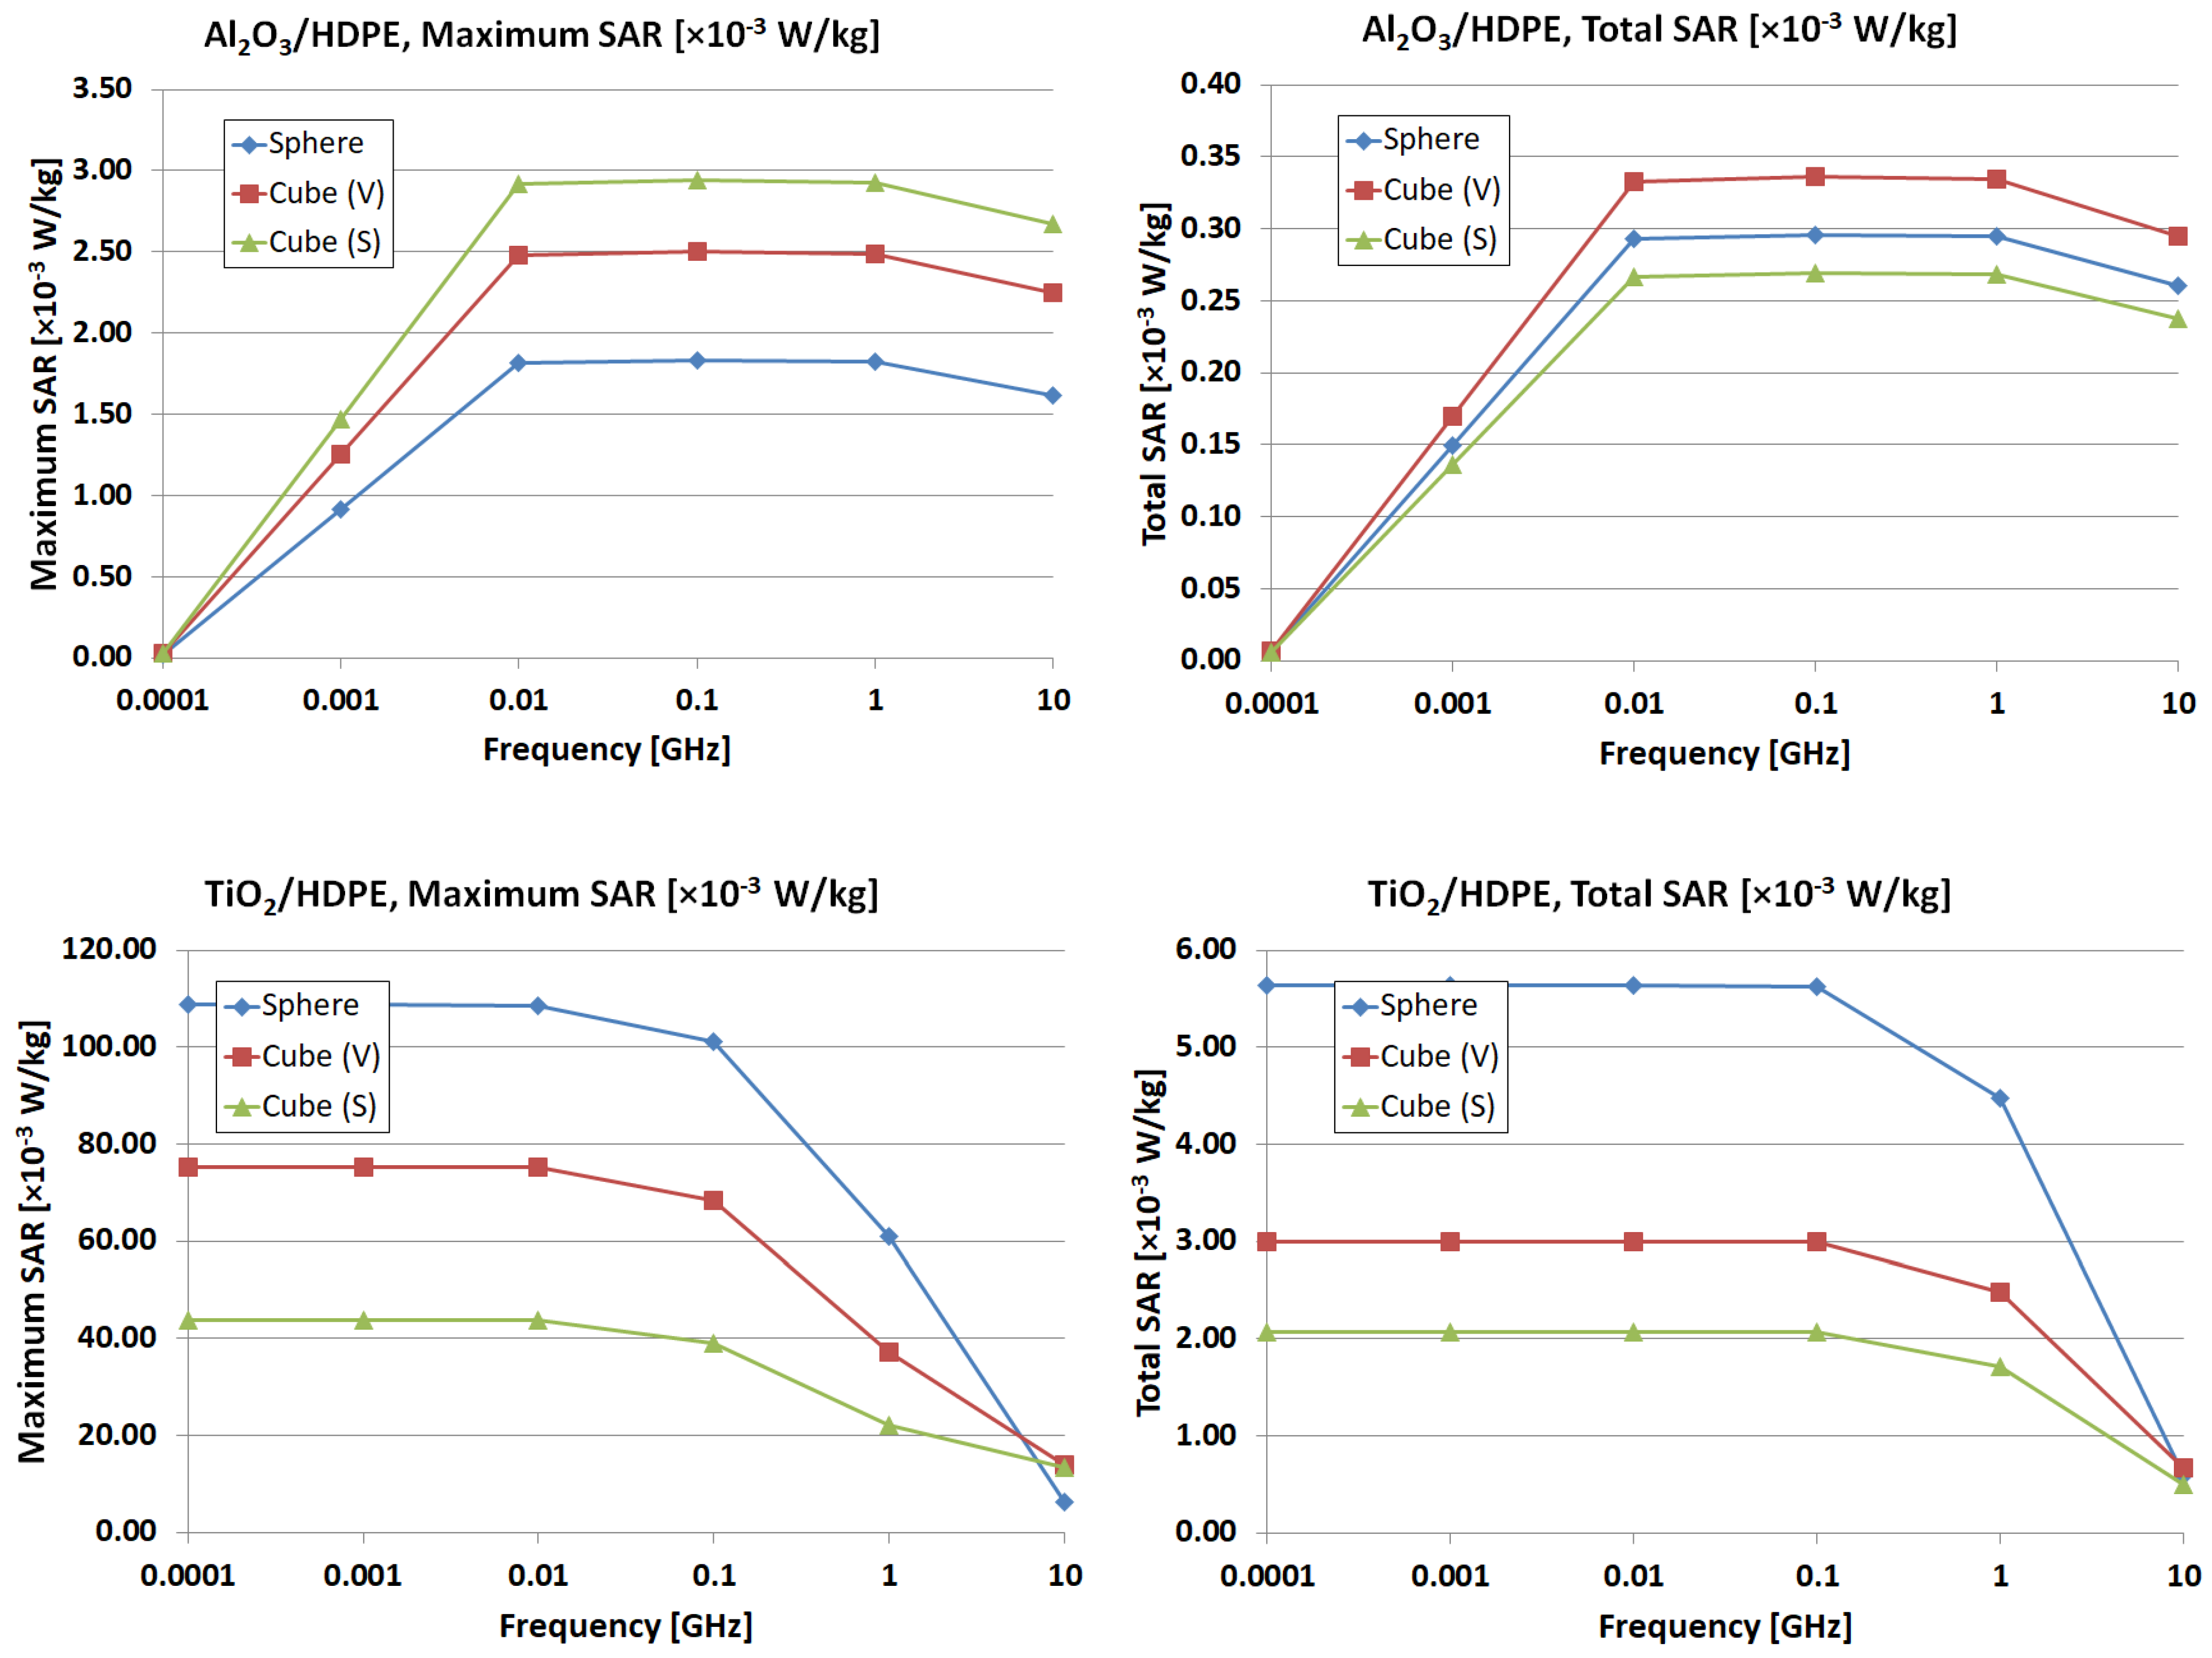
3. Results and Discussion

Analysis of the power loss density (see example in Figure 7 for 3% mass ratio 5 μm TiO2 particles in HDPE) shows significant absorption inside the particles. Moreover, the specific distribution of the particles generates local maxima at specific points where the fields are concentrated, making the results difficult to interpret.
We chose to use the specific absorption rate (SAR) computed by the software as a macroscopic indicator of loses inside the material. Due to the small dimensions of the simulated substrate (Table 1 and Table 2), a significantly smaller averaging mass was used.
The computed SAR still shows local maxima (see example in Figure 8 for 10% mass ratio 25 μm Al2O3 particles in HDPE); however, averaging, as in the computation of Total SAR, will show the overall effect of the insertions (including of course the effect of the displacement of some of the substrate material with those corresponding losses when using insertions).
Also, as SAR computations are inherently connected to the material mass, different materials for substrate and insertions, as well as different mass ratios for the insertions, will affect the absorption results. For every combination of mass ratio/substrate material/insertion material we made a reference analysis of the losses in a substrate without insertions with exactly the same dimensions, which later will accommodate those specific insertions. The effect of a specific set of insertions is computed as a relative increase in the total specific absorption rate (Total SAR), see the relationship in Equation (6), allowing for comparisons of different substrate materials (HDPE/LDPE), different insertion materials (Al2O3/TiO2), and different mass ratios (3/7/10%).
Δ S / S = S S r e f S r e f 100 %
We expect an increase in mass ratio for the insertion to generate increased absorption as in Figure 9 and Figure 10. Also, an increase in the dimensions of the insertions was expected to have the same effect, higher localized absorption.
The dielectric properties of the insertions are also important. In Figure 11 and Figure 12, we plot SAR for Al2O3. The dielectric model offered by CST results in decreased absorption at low frequencies (100 MHz in Figure 11) while, at high frequencies (1 GHz in Figure 12), absorption is increased significantly and also shows the same pattern of localized increase as for TiO2. In order to detect the influence of the frequency, the structure was the same (mass ratio and radius unchanged); also, the cutting plane for the figures was kept the same.
Figure 13 plots the Total SAR increase for various substrate materials and mass ratios in the mixture. The effect, especially for the high permittivity material (TiO2), is a significant increase (loses are increased by a factor between 35 and 120 depending on the mass ratio, for both substrate materials). The results are confirmed by the related literature [42,43,44,45], where the effect of TiO2 addition into other type of composites is presented. Even the low-permittivity material (Al2O3) shows an absorption increased by a factor between 12 and 40, an aspect in line with previous findings for other composite types [46,47,48].
Figure 14 shows the clear increase with the mass ratio of the absorption (the same conclusion as in the qualitative analysis in Figure 9 and Figure 10).
Figure 15 shows that, for low-loss substrates (HDPE and LDPE), the absorptive properties are governed by the insertion and not substrate. The difference between the two substrate materials is unsignificant and can be attributed to the random positioning of the insertions at every analysis.
Figure 16 shows the ratio between the localized Peak SAR and the average Total SAR for the entire structure. While there is a clear influence of the random positioning of the particles, we can find ratios between 200 and 700 for TiO2 and between 30 and 100 for Al2O3. This result is consistent with the previous observations over the electromagnetic field’s structure; the concentration of energy dissipation can reach significant values, depending on the random distribution of the particles. In applications where uniform absorption is required, the distribution of the insertions must be controlled by the insertion technology.
Furthermore, the volumetric distribution of power loss density within the material containing inserts continues to exhibit a significantly nonuniform loss distribution. One could attempt to manage the spatial arrangement of the inserts during manufacturing to direct the waves towards an area with superior absorbent qualities; however, this could lead to greater technological complexity and higher material expenses, with a limited improvement of electromagnetic parameters.
At the macroscopic level, for the entire structure we can investigate the electromagnetic field absorption features using the S parameters [49]. The relationships can also be used to extract the absorption characteristics of the homogeneous dielectric equivalent to the substrate with inserts.
R = S 11 2
T = S 21 2
A = 1 R T = 1 S 11 2 S 21 2
From Figure 17, it is obvious that a content of 3% TiO2 with a dimension of 1 μm presents a major influence mainly in composites with HDPE, in the case of the S11 parameter, especially in the frequency domain up to 2 GHz.
From Figure 18, it was noticed that even at higher contents of, e.g., 7%, the addition of Al2O3 with higher dimensions (here 25 μm) presents a limited influence upon the S parameters in the entire frequency range, an aspect which can be correlated with the results in Figure 13.
As long as the effect of Al2O3 insertions is less relevant compared to TiO2 insertions (as also suggested by Figure 16), Figure 19 and Figure 20 analyze the effect of particles dimension and content upon the S parameters. At higher dimensions, the effect is relevant mainly at higher frequencies, exceeding 1 GHz. On the other hand, an increase in TiO2 particle (with the dimension of 25 μm) content to over 3% brings no significant benefit in terms of the evolution of S parameters, especially at frequencies higher than 0.5 GHz.
The consolidated results of the simulations led to the conclusion that, for the development of new substrates for flexible electronics, composites of polyethylene with TiO2 insertions are recommended, especially at lower contents of up to 7% and with a higher radius, e.g., of 25 μm, which may bring important economic benefits when taking into account that current concepts recommend expensive particles with nanoscale to 1 μm dimensions and a content of over 10%. This study may represent a step forward in designing new cost-effective substrates for flexible electronics, and, based on such simulations, in establishing a more convenient design for experiments for innovative materials, being a more effective way than using more expensive matrices to test associations with TiO2, and more costly experimental procedures to assess the electromagnetic features, as presented in [50,51,52,53,54].
The results in Figure 17, Figure 18, Figure 19 and Figure 20 together with the relationships in Equations (7)–(9) can be used to compute and measure absorption if the insertion technology ensures a quasi-uniform distribution, for similar particles for electronic technology use.

4. Conclusions

The article outlines the simulation of absorbed energy in polymeric micro-composites containing dielectric inserts (commercial Al2O3 and TiO2 particles, featuring three particle sizes, 1, 5, and 25 µm, respectively). The examined frequency range, mainly of 0.001–100 GHz, is tailored for numerous applications of substrates in electronic technologies. The electromagnetic simulation software selected was CST Studio Suite, analyzing power loss at different frequencies, and serving as a necessary step in designing the optimal structure of such substrates. The real constraints in electromagnetic simulation are detailed.
It was shown that we achieved a significant increase in absorption, with a factor between 12 and 120, depending on the dielectric material used for the insertions and the mass ratio used in the insertion technology. High-permittivity dielectrics offer higher absorption, but also generate a nonuniform distribution of the field inside the material, leading to increased peak-to-average absorption ratios. In applications where such behavior is not acceptable, the technology must be controlled in detail to increase the uniformity of the insertions inside the substrate material.
For the development of new substrates for flexible electronics, composites of polyethylene with TiO2 insertions are recommended, especially at lower contents of up to 7% and a higher radius, e.g., of 25 μm.
If nonuniformity can be controlled, the composite material can be treated as a homogenous dielectric, with the computation or measurement of the scattering parameters allowing for the definition of an equivalent dielectric material which can be used in more complex structure simulations, for similar particles for electronic technology use.

Author Contributions

Conceptualization, R.F.D. and R.C.C.; methodology, R.F.D. and R.C.C.; validation, R.C.C.; formal analysis, R.F.D. and R.C.C.; investigation, R.F.D., R.C.C., C.P., A.M. and A.T.; data curation, R.F.D., R.C.C. and A.T.; writing—original draft preparation, R.F.D. and R.C.C.; writing—review and editing, R.C.C.; visualization, R.F.D. and R.C.C.; supervision, R.C.C. All authors have read and agreed to the published version of the manuscript.

Funding

This research received no external funding. This work was funded from the project “National Platform for Semiconductor Technologies”, contract no. G 2024-85828/390008/27.11.2024, SMIS code 304244, co-funded by the European Regional Development Fund under the Program for Intelligent Growth, Digitization, and Financial Instruments.

Data Availability Statement

The data are presented in this study.

Conflicts of Interest

The authors declare no conflicts of interest.

References

  1. Wang, Y.; Wang, H.; Liu, F.; Wu, X.; Xu, J.; Cui, H.; Wu, Y.; Xue, R.; Tian, C.; Zheng, B.; et al. Flexible printed circuit board based on graphene/polyimide composites with excellent thermal conductivity and sandwich structure. Compos. Part A Appl. Sci. Manuf. 2020, 138, 106075. [Google Scholar] [CrossRef]
  2. Li, L.; Han, L.; Hu, H.; Zhang, R. A review on polymers and their composites for flexible electronics. Mater. Adv. 2022, 4, 726–746. [Google Scholar] [CrossRef]
  3. Kim, J.; Kim, B.-Y.; Park, S.D.; Seo, J.-H.; Lee, C.-J.; Yoo, M.J.; Kim, Y. Mechanical Durability of Flexible Printed Circuit Boards Containing Thin Coverlays Fabricated with Poly(Amide-Imide-Urethane)/Epoxy Interpenetrating Networks. Micromachines 2021, 12, 943. [Google Scholar] [CrossRef]
  4. Tong, C. Substrate and Encapsulation Materials for Printed Flexible Electronics. In Advanced Materials for Printed Flexible Electronics; Springer Series in Materials Science; Springer: Cham, Switzerland, 2022; Volume 317. [Google Scholar] [CrossRef]
  5. Dušek, K.; Koc, D.; Veselý, P.; Froš, D.; Géczy, A. Biodegradable Substrates for Rigid and Flexible Circuit Boards: A Review. Adv. Sustain. Syst. 2024, 9, 2400518. [Google Scholar] [CrossRef]
  6. Iftikhar, A.; Naseer, N.; Yildiz, S.K.; Gokcen, D.; Fida, A.; Shafique, M.F.; Saka, B. Silicon elastomer as flexible substrate: Dielectric characterization and applications for wearable antenna. Flex. Print. Electron. 2023, 8, 045001. [Google Scholar] [CrossRef]
  7. Zardetto, V.; Brown, T.M.; Reale, A.; Di Carlo, A. Substrates for flexible electronics: A practical investigation on the electrical, film flexibility, optical, temperature, and solvent resistance properties. J. Polym. Sci. Part B Polym. Phys. 2011, 49, 638–648. [Google Scholar] [CrossRef]
  8. Liang, C.; Yan, C.; Zhai, S.; Wang, Y.; Hu, A.; Wang, W.; Pan, Y. Recent Progress in Flexible Surface Acoustic Wave Sensing Technologies. Micromachines 2024, 15, 357. [Google Scholar] [CrossRef]
  9. McGibney, E.; Barton, J.; Floyd, L.; Barrett, J. The High Frequency Electrical Properties of Interconnects on a Flexible Polyimide Substrate Including the Effects of Humidity. IEEE Trans. Compon. Packag. Manuf. Technol. 2011, 1, 4–15. [Google Scholar] [CrossRef]
  10. Li, H.; Wei, P.; Wang, Y.; Zhu, Q.; Wang, X.; Gao, W.; Tao, L.; Ma, K.; Hu, Z.; Chen, W. High-frequency 5G substrate: Low dielectric biphenyl polyimide with low CTE and high thermal stability. Mater. Today Adv. 2024, 23, 100514. [Google Scholar] [CrossRef]
  11. Li, H.; Wang, X.; Wu, T.; Gong, Y.; Zhao, H.; Liu, Z.; Dastan, D.; Ma, K.; Hu, Z. Mechanical enhancement and dielectric properties of SiO2 contained polyimides under high frequency. J. Mater. Sci. Mater. Electron. 2023, 34, 1–10. [Google Scholar] [CrossRef]
  12. Gallah, H.; Mighri, F.; Ajji, A.; Bandyopadhyay, J.; Ben Ghorbel, N.A.; Castillo-Rodriguez, J. New Flexible Electrospun PET/TiO2 Composite Photoanode Layer for Dye-Sensitized Solar Cells, DSSCs, and Its Photovoltaic Performances. Mater. Sci. Appl. 2024, 15, 481–503. [Google Scholar] [CrossRef]
  13. Shin, C.-H.; Huseynova, G.; Kim, E.; Lee, J.; Yoo, S.; Choi, Y.; Lee, J.-H. Random Al2O3 nanoparticle-based polymer composite films as outcoupling layers for flexible organic light-emitting diodes. Opt. Express 2020, 28, 26170–26179. [Google Scholar] [CrossRef] [PubMed]
  14. Stroe, M.; Burlanescu, T.; Paraschiv, M.; Lőrinczi, A.; Matei, E.; Ciobanu, R.; Baibarac, M. Optical and Structural Properties of Composites Based on Poly(urethane) and TiO2 Nanowires. Materials 2023, 16, 1742. [Google Scholar] [CrossRef]
  15. Rehman, W.U.; Rasheed, T.; Naveed, A.; Ali, A. Thermoplastic polyurethane/rutile titanium dioxide composites tuned for hydrophobicity with effective reinforcement. J. Polym. Res. 2022, 29, 1–8. [Google Scholar] [CrossRef]
  16. Kolesnik, S.A.; Bulychev, N.A. Reinforcement of polymer composite materials by titanium dioxide nanoparticles synthesized in plasma discharge under ultrasonic cavitation. J. Phys. 2022, 2231, 012012. [Google Scholar] [CrossRef]
  17. Cazan, C.; Enesca, A.; Andronic, L. Synergic Effect of TiO2 Filler on the Mechanical Properties of Polymer Nanocomposites. Polymers 2021, 13, 2017. [Google Scholar] [CrossRef] [PubMed]
  18. Alheeti, O.A.R.; Fatalla, A.A. The characteristics tests of the PEKK-titanium oxide composite material. Int. J. Health Sci. 2022, 6, 1569–1576. [Google Scholar] [CrossRef]
  19. Al Zoubi, W.; Al-Hamdani, A.A.S.; Sunghun, B.; Ko, Y.G. A review on TiO2-based composites for superior photocatalytic activity. Rev. Inorg. Chem. 2021, 41, 213–222. [Google Scholar] [CrossRef]
  20. Ouyang, Y.; Bai, L.; Tian, H.; Li, X.; Yuan, F. Recent progress of thermal conductive ploymer composites: Al2O3 fillers, properties and applications. Compos. Part A Appl. Sci. Manuf. 2022, 152, 106685. [Google Scholar] [CrossRef]
  21. Meena, R.; Mali, H.S.; Meena, A.; Sharma, P.; Kumar, P.; Choudhary, K. Influence of alumina powder (Al2O3) on mechanical and tribological properties of injection molded polyoxymethylene composites. Mater. Today Proc. 2023. [Google Scholar] [CrossRef]
  22. Wondu, E.; Lule, Z.; Kim, J. Thermal Conductivity and Mechanical Properties of Thermoplastic Polyurethane-/Silane-Modified Al2O3 Composite Fabricated via Melt Compounding. Polymers 2019, 11, 1103. [Google Scholar] [CrossRef] [PubMed]
  23. Wei, T.; Wang, J.; Yu, X.; Wang, Y.; Wu, Q.; Chen, C. Mechanical and thermal properties and cytotoxicity of Al2O3 nano particle-reinforced poly(ether-ether-ketone) for bone implants. RSC Adv. 2019, 9, 34642–34651. [Google Scholar] [CrossRef] [PubMed]
  24. Nabhan, A.; Taha, M.; Ghazaly, N.M. Filler loading effect of Al2O3/TiO2 nanoparticles on physical and mechanical characteristics of dental base composite (PMMA). Polym. Test. 2022, 117, 107848. [Google Scholar] [CrossRef]
  25. Review of Fabrication of SAW Sensors on Flexible Substrates: Challenges and Future. Available online: https://eae.edu.eu/research_article/Review%20of%20fabrication%20of%20S.html (accessed on 28 October 2024).
  26. Wolf, H.; Gieser, H.; Maurer, L. Transmission lines on flexible substrates with minimized dispersion and losses. In Proceedings of the 2013 European Microwave Conference (EuMC), Nuremberg, Germany, 6–10 October 2013. [Google Scholar]
  27. Borchert, J.W.; Zschieschang, U.; Letzkus, F.; Giorgio, M.; Weitz, R.T.; Caironi, M.; Burghartz, J.N.; Ludwigs, S.; Klauk, H. Flexible low-voltage high-frequency organic thin-film transistors. Sci. Adv. 2020, 6, eaaz5156. [Google Scholar] [CrossRef]
  28. Brandon, E.; Wesseling, E.E.; Chang, V.; Kuhn, W.B. Printed Microinductors on Flexible Substrates for Power Applications. IEEE Trans. Compon. Packag. Technol. 2003, 26, 1521–3331. [Google Scholar]
  29. Ibrahim, G.H.; Zschieschang, U.; Klauk, H.; Reindl, L. High-Frequency Rectifiers Based on Organic Thin-Film Transistors on Flexible Substrates. IEEE Trans. Electron Devices 2020, 67, 2365–2371. [Google Scholar] [CrossRef]
  30. Njoku, C.C.; Whittow, W.G.; Vardaxoglou, Y.C. Study on the Variation in Dielectric Properties of Heterogeneous Substrates Composed of Nanomaterials. In Proceedings of the 5th European Conference on Antennas and Propagation, Rome, Italy, 11–15 April 2011; pp. 488–492. [Google Scholar]
  31. Zhang, D.; Han, C.; Zhang, H.; Zeng, B.; Zheng, Y.; Shen, J.; Wu, Q.; Zeng, G. The Simulation Design of Microwave Absorption Performance for the Multi-Layered Carbon-Based Nanocomposites Using Intelligent Optimization Algorithm. Nanomaterials 2021, 11, 1951. [Google Scholar] [CrossRef]
  32. Llave, Y.; Kambayashi, D.; Fukuoka, M.; Sakai, N. Power absorption analysis of two-component materials during microwave thawing and heating: Experimental and computer simulation. Innov. Food Sci. Emerg. Technol. 2020, 66, 102479. [Google Scholar] [CrossRef]
  33. Li, G.; Zhou, J. COMSOL-Based Simulation of Microwave Heating of Al2O3/SiC Composites with Parameter Variations. Symmetry 2024, 16, 1254. [Google Scholar] [CrossRef]
  34. Rothwell, E.J.; Frasch, J.L.; Ellison, S.M.; Chahal, P.; Ouedraogo, R.O. Analysis of the Nicolson-Ross-Weir method for characterizing the electromagnetic properties of engineered materials. Prog. Electromagn. Res. 2016, 157, 31–47. [Google Scholar] [CrossRef]
  35. Das, S. Matlab Code of Nicholson-Ross-Weir (NRW) Algorithm to Estimate the Permeability and Permittivity of EMI Shielding Materials. 2020. Available online: https://www.researchgate.net/publication/341275777_Matlab_code_of_Nicholson-Ross-Weir_NRW_Algorithm_to_estimate_the_permeability_and_permittivity_of_EMI_shielding_materials#fullTextFileContent (accessed on 28 October 2024).
  36. Sahin, S.; Nahar, N.K.; Sertel, K. A Simplified Nicolson–Ross–Weir Method for Material Characterization Using Single-Port Measurements. IEEE Trans. Terahertz Sci. Technol. 2020, 10, 404–410. [Google Scholar] [CrossRef]
  37. Dassault Systèmes, CST Studio Suite-Electromagnetic Field Simulation Software. Available online: https://www.3ds.com/products/simulia/cst-studio-suite (accessed on 28 October 2024).
  38. Aradoaei, M.; Schreiner, O.; Alexa, I.; Olteanu, A.; Pintilei, M.A.; Ciobanu, R.C.; Aradoaei, S. Simulating the Interaction of Electromagnetic Radiation with Matter, Within Nano/Micro-Conductive Composite. In Proceedings of the 2023 International Conference on Electromechanical and Energy Systems (SIELMEN), Craiova, Romania, 11–13 October 2023; pp. 1–6. [Google Scholar]
  39. Ciobanu, R.C.; Damian, R.F.; Schreiner, C.M.; Aradoaei, M.; Sover, A.; Raichur, A.M. Simulation of Dielectric Properties of Nanocomposites with Non-Uniform Filler Distribution. Polymers 2023, 15, 1636. [Google Scholar] [CrossRef]
  40. Damian, R.F.; Ciobanu, R.C. Modeling Absorbed Energy in Microwave Range for Nanocomposite Hot Melts Containing Metallic Additives. Appl. Sci. 2025, 15, 541. [Google Scholar] [CrossRef]
  41. Wypych, A.; Bobowska, I.; Tracz, M.; Opasińska, A.; Kadlubowski, S.; Krzywania-Kaliszewska, A.; Grobelny, J.; Wojciechowski, P. Dielectric Properties and Characterisation of Titanium Dioxide Obtained by Different Chemistry Methods. J. Nanomater. 2014, 2014, 124814. [Google Scholar] [CrossRef]
  42. Zhang, X.; Qiao, J.; Wang, F.; Lv, L.; Xu, D.; Jiang, Y.; Cui, P.; Wang, Q.; Liu, W.; Liu, J. Tailoring electromagnetic absorption performances of TiO2/Co/carbon nanofibers through tuning graphitization degrees. Ceram. Int. 2020, 46, 4754–4761. [Google Scholar] [CrossRef]
  43. Dhanasekaran, A.; Malakar, A.; Lakshmanan, A.; Stranak, V.; Bose, S.; Dhanaraj, K.; Venugopal, V. Electromagnetic Interference Shielding Properties of Conductive Polyaniline/TiO2/MoS2 Hybrid Composites. ACS Omega 2025, 10, 28143–28152. [Google Scholar] [CrossRef]
  44. Su, Q.; Wang, H.; He, Y.; Liu, D.; Huang, X.; Zhong, B. Preparation of CIP@TiO2 composite with broadband electromagnetic wave absorption properties. Int. J. Miner. Met. Mater. 2024, 31, 197–205. [Google Scholar] [CrossRef]
  45. Prince, M.E.; Tamilarasi, K.; Thiagamani, S.M.K.; Hashem, M.; Fouad, H.; Ansari, A. Effects of TiO2 nanoparticles on the dielectric and electromagnetic shielding performance of PVA/POM hybrid nanocomposites. Polym. Technol. Mater. 2024, 63, 1874–1886. [Google Scholar] [CrossRef]
  46. Vakhitov, M.; Klygach, D.; Kudryavtsev, O.; Zhikharev, M.; Knyazev, N.; Malkin, A.; Trukhanov, A. Highly efficient functional composites based on Al2O3 for combined electromagnetic and mechanical protection. Ceram. Int. 2020, 46, 17584–17590. [Google Scholar] [CrossRef]
  47. Regis, V.; Šadl, M.; Brennecka, G.; Bradeško, A.; Tomc, U.; Uršič, H. Investigation of Structural and Electrical Properties of Al2O3/Al Composites Prepared by Aerosol Co-Deposition. Crystals 2023, 13, 850. [Google Scholar] [CrossRef]
  48. Chen, H.; Wang, Y.; Zhang, W.; Nan, Y.; Yue, X.; Zhang, Y.; Fan, H. Effect of Al2O3 and BN compounding on thermal and mechanical properties of PP composites. Mater. Today Commun. 2023, 37, 107300. [Google Scholar] [CrossRef]
  49. What Are S-parameters? Available online: https://www.ansys.com/simulation-topics/what-are-s-parameters (accessed on 28 October 2024).
  50. Vanskeviče, I.; Kinka, M.; Banys, J.; Macutkevič, J.; Schaefer, S.; Selskis, A.; Fierro, V.; Celzard, A. Dielectric and Ultrasonic Properties of PDMS/TiO2 Nanocomposites. Polymers 2024, 16, 603. [Google Scholar] [CrossRef] [PubMed]
  51. Liu, X.; Li, X.; Lei, X.; Zhang, D.; Liu, Z.; Long, X.; Gong, R. Research on dielectric and microwave absorbing properties of TiO2/TiB2/Thermoplastic polyurethanes (TPU) composite materials. J. Phys. Conf. Series 2022, 2248, 012012. [Google Scholar] [CrossRef]
  52. Veselý, P.; Froš, D.; Hudec, T.; Sedláček, J.; Ctibor, P.; Dušek, K. Dielectric spectroscopy of PETG/TiO 2 composite intended for 3D printing. Virtual Phys. Prototyp. 2023, 18, e2170253. [Google Scholar] [CrossRef]
  53. Das, S.K.; Bharatiya, D.; Minz, S.; Saraswat, R.; Swain, S.K. Effect of clay on dielectric behaviour of TiO2 embedded PVDF nanocomposite for charge storage applications. Mater. Sci. Semicond. Process. 2025, 192, 109480. [Google Scholar] [CrossRef]
  54. Gaabour, L.H. Effect of addition of TiO2 nanoparticles on structural and dielectric properties of polystyrene/polyvinyl chloride polymer blend. AIP Adv. 2021, 11, 105120. [Google Scholar] [CrossRef]
Figure 1. Influence of particle shape on absorption. Sphere and cube Al2O3 (top) and TiO2 (bottom).
Crystals 15 00637 g001
Figure 2. Comparative energy losses simulation vs. particle shape; SAR: specific absorption rate, Maximum (local) SAR, and Total (mean) SAR.
Crystals 15 00637 g002
Figure 3. Typical simulated structure, 111 parallelepipeds, TiO2, R = 5 μm, MR = 7%, VR = 1.61%.
Crystals 15 00637 g003
Figure 4. Defining ports and reference planes.
Crystals 15 00637 g004
Figure 5. Electric and magnetic field at the port level, plane wave configuration.
Crystals 15 00637 g005
Figure 6. Electromagnetic power flow (Poynting vector), [VA/m2], TiO2, 10 GHz, MR = 3%, R = 5 μm, HDPE.
Crystals 15 00637 g006
Figure 7. Power loss density, [W/m3], TiO2, 10 MHz, MR = 3%, R = 5 μm, HDPE.
Crystals 15 00637 g007
Figure 8. SAR, 3D, [W/kg], Al2O3, 100 MHz, MR = 10%, R = 25 μm, HDPE.
Crystals 15 00637 g008
Figure 9. SAR, [W/kg], TiO2, 10 GHz, MR = 3%, R = 5 μm, HDPE.
Crystals 15 00637 g009
Figure 10. SAR, [W/kg], TiO2, 1 GHz, MR = 10%, R = 25 μm, HDPE.
Crystals 15 00637 g010
Figure 11. SAR, [W/kg], Al2O3, 0.1 GHz, MR = 7%, R = 1 μm, HDPE.
Crystals 15 00637 g011
Figure 12. SAR, [W/kg], Al2O3, 1 GHz, MR = 7%, R = 1 μm, HDPE.
Crystals 15 00637 g012
Figure 13. Influence of the insertion types on the Total SAR increase, [%]; substrate: HDPE/LDPE, MR: 3, 7, and 10%.
Crystals 15 00637 g013
Figure 14. Influence of the mass ratio on the Total SAR increase, [%]; substrate: HDPE/LDPE, R: 1 and 5 μm.
Crystals 15 00637 g014
Figure 15. Influence of the substrate material on the Total SAR increase, [%]; MR: 3 and 10%, R: 5 μm.
Crystals 15 00637 g015
Figure 16. Ratio between local Peak SAR and average Total SAR; various substrates, mass ratios, and frequencies.
Crystals 15 00637 g016
Figure 17. S11 and S21, TiO2 insertions, MR = 3%, R = 1 μm, HDPE and LDPE compared (CST).
Crystals 15 00637 g017
Figure 18. S11 and S21, Al2O3 insertions, MR = 7%, R = 25 μm, HDPE and LDPE compared (CST).
Crystals 15 00637 g018
Figure 19. S11 and S21, TiO2 insertions, MR = 3%, HDPE, various Radius (CST).
Crystals 15 00637 g019
Figure 20. S11 and S21, TiO2 insertions, R = 25 μm, HDPE, various MR (CST).
Crystals 15 00637 g020
Table 1. Dimensions of structures, ~125 particles, TiO2 in polymer matrices HDPE/LDPE.
RSph [μm]1525
RCube [μm]1.6128.0640.3
SubstrateInsertion MR [%]L = W = H [μm]
HDPE10%27.857139.28696.42
7%31.636158.18790.89
3%42.415212.071060.4
LDPE10%28.081140.41702.03
7%31.892159.46797.31
3%42.762213.811069.1
Table 2. Dimensions of structures, ~125 particles, Al2O3 in polymer matrices HDPE/LDPE.
RSph [μm]1525
RCube [μm]1.6128.0640.3
SubstrateInsertion MR [%]L = W = H [μm]
HDPE10%26.904134.52672.59
7%30.544152.72763.61
3%40.936204.681023.4
LDPE10%27.12135.6677.99
7%30.792153.96769.79
3%41.271206.361031.8
Table 3. LDPE and HDPE matrix properties.
MatrixLDPEHDPE
Model typeNormalNormal
Thermal conductivity0.48 [W/K/m]0.51 [W/K/m]
Density945 kg/m3964 kg/m3
Dielectric permittivity2.22.4
Magnetic permeability11
Specific heat1.9 kJ/K/kg1.9 kJ/K/kg
Table 4. Inserts properties.
MaterialAl2O3TiO2
ModelNormalNormal
Dielectric permittivity 9.463.7
Magnetic permeability11
Thermal conductivity0.88 kJ/K/kg0.69 kJ/K/kg
Density3800 kg/m34230 kg/m3
Specific heat0.88 kJ/K/kg0.69 kJ/K/kg
Disclaimer/Publisher’s Note: The statements, opinions and data contained in all publications are solely those of the individual author(s) and contributor(s) and not of MDPI and/or the editor(s). MDPI and/or the editor(s) disclaim responsibility for any injury to people or property resulting from any ideas, methods, instructions or products referred to in the content.

