Abstract
In this work, the degradation in luminous characteristics of red, green, and blue (RGB) micro-LEDs (10 µm × 10 µm) under electrical stress at 360 K has been investigated. After 280 h of aging, the AlGaInP-based red micro-LEDs exhibit a 31.7% reduction in maximum external quantum efficiency, which is significantly greater than the reductions observed in InGaN-based green and blue micro-LEDs. Specifically, the peak wavelength redshift by 0.6 nm, and blueshift 1.0 nm, and 0.5 nm for RGB micro-LEDs, respectively. The color purity of green and blue micro-LEDs decreases by 3.6% and 0.7%, respectively, resulting in a 7% reduction in color gamut.
1. Introduction
Micro-light-emitting diode (Micro-LED) display acts as an advanced display technology wherein individually addressable micro-LEDs function as light-emitting pixels [1], demonstrating key performance advantages including high luminance, long lifespan, and high resolution, among others [2]. Additionally, micro-LED displays offer outstanding color purity, wide viewing angles, and the potential for innovative applications such as flexible and transparent displays [3,4,5]. Despite their compelling advantages, micro-LED displays still face significant challenges, including efficiency degradation and color shift during prolonged operation. Additionally, high manufacturing costs, low production yields, and difficulties in achieving uniformity across millions of micro-LEDs further impede their commercialization [6,7]. While recent studies have explored driving schemes, efficiency enhancement, and manufacturing methods [8,9,10,11,12,13,14], it has become increasingly important to examine the variations in the optical, colorimetric, and electrical properties of red, green, and blue (RGB) micro-LEDs over extended operation times. Although previous research has largely focused on issues such as efficiency droop, defect formation mechanisms, and lifetime predictions [15,16,17], the chromatic variations in RGB micro-LEDs during prolonged operation remain insufficiently investigated. The thermal stability and lifespan of micro-LEDs is a meaningful topic during the practical application, possible thermal management strategies, such as enhanced heat dissipation through substrate engineering [18], the use of thermal interface materials, and optimizing current injection [19], can help improve device reliability. Therefore, analyzing the aging behavior of micro-LEDs under high-temperature conditions is particularly important.
Current-stress and thermal-stress tests have been widely employed as the primary methodologies for evaluating the reliability and degradation mechanisms of LED devices [20]. This work investigates the electrical and chromatic properties of 10 µm × 10 µm red (AlGaInP), green (InGaN), and blue (InGaN) micro-LEDs subjected to a 280 h aging process at 360 K under electrical stress. The red micro-LEDs experience a more pronounced efficiency loss, compared to the green and blue counterparts, due to the significant increase in Shockley–Read–Hall (SRH) non-radiative recombination. The green LEDs exhibit noticeable shifts in their dominant luminous regions, while the light emission distribution of red and blue micro-LEDs remains relatively stable. Furthermore, the variation in color gamut has been investigated.
2. Experiments
Each RGB micro-LED array consists of 100 micro-LED chips arranged in a 10 × 10 matrix, with an overall device size of 850 μm × 850 μm. The structure of the red micro-LEDs, illustrated in Figure 1a, is initially grown as a double heterojunction epitaxial structure lattice-matched to a GaAs substrate, and subsequently transferred onto a sapphire substrate via adhesive bonding. A p-type GaP window layer is deposited on top of the heterostructure to function as a transparent current spreading layer. In contrast, the green and blue micro-LED chips, shown in Figure 1b, are fabricated from commercial InGaN/GaN blue LED epitaxial wafers grown on c-plane patterned sapphire substrates (PSS) by metal–organic chemical vapor deposition (MOCVD). Finally, a silicon dioxide (SiO2) layer is deposited by plasma-enhanced chemical vapor deposition (PECVD) on all RGB micro-LEDs as a sidewall passivation layer.
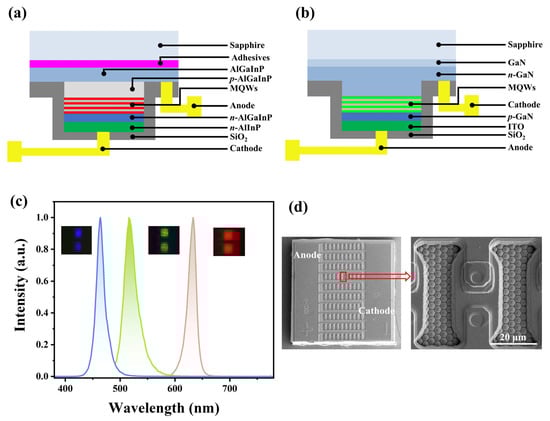
Figure 1.
The schematic structure for (a) red and (b) green, blue micro-LEDs. (c) Typical spectra of RGB micro-LEDs under 1 mA driven at 300 K. The insets show microscopic photographs of the micro-LEDs. (d) SEM image of the blue and green micro-LED chip arrays. The device size is 850 μm × 850 μm.
Figure 1c shows the typical electroluminescence spectra of RGB micro-LEDs measured at 300 K under a driving current of 1 mA. The peak wavelengths are 631.2 nm, 522.7 nm, and 466.4 nm for the red, green, and blue micro-LEDs, respectively. Figure 1d presents a scanning electron microscope (SEM) image illustrating the array structure of the blue and green micro-LED chips. Notably, the positions of the anode and cathode in the red micro-LEDs are reversed compared to those in the green and blue devices. During the aging, the RGB micro-LEDs were placed in a programmable high-temperature aging chamber (DEJG-80, Deyi Equipment, Xiamen, China), maintained at a consistent temperature of 360 K. The micro-LEDs were driven by current densities corresponding to the maximum external quantum efficiency (EQE), namely, 400 A/cm2, 20 A/cm2, and 30 A/cm2 for RGB micro-LEDs, respectively. The spectra were measured at 300 K by mounting micro-LEDs onto a heat sink whose temperature was regulated by a precise heat controller (5305 TECSource, Arroyo Instruments, San Luis Obispo, CA, USA). Electroluminescence (EL) spectra were collected by using a spectrometer (Spectro-320e, Instrument Systems, Munich, Germany). In addition to spectral luminance variation, the spatially resolved light emission distributions across the top surface of the RGB micro-LEDs were examined using a microscopic hyperspectral imaging system. This setup consisted of a hyperspectral camera (GaiaField-F-V10, Shuanglihepu, Chengdu, China) coupled with a high-magnification metallographic microscope (MJ51, Mingmei, Guanghzou, China), which allowed for detailed mapping of the luminous regions before and after the stress test. The samples were powered by a current source (Keithley 2911A, Keithley, Cleveland, OH, USA) operating in direct current (DC) mode during testing.
3. Results
3.1. Luminous Characteristics
Figure 2a illustrates the evolution of peak wavelengths across different stress durations. For the red micro-LED, the peak wavelength exhibits a redshift of approximately 0.6 nm, increasing from 631.1 nm to 631.7 nm. In contrast, the blue micro-LED experiences a blueshift of about 1.0 nm, moving from 522.7 nm to 521.7 nm. Meanwhile, the green micro-LED’s peak wavelength changes by 0.5 nm, from 466.3 nm to 465.8 nm. Figure 2b shows the reduction in maximum EQE of the RGB micro-LEDs under prolonged electrical stress. All RGB devices exhibit a gradual degradation in efficiency over time. After 280 h of aging, the AlGaInP-based red micro-LEDs exhibit a reduction of 31.7% in maximum EQE, while those of InGaN-based green and blue micro-LEDs retain 91.4% and 96.1%, respectively. This discrepancy highlights a critical challenge in the reliability of AlGaInP-based red micro-LEDs with the efficiency droop rate exceeding 0.11%/hour, which is far larger than those observed in green (0.03%/hour) and blue (0.01%/hour) counterparts. At a current density of 10 A/cm2, the increase in the forward voltages of the RGB micro-LEDs exceeds 0.1 V, changing from 1.7 V to 1.9 V (red), 2.3 V to 2.4 V (green), and 2.5 V to 2.6 V (blue), respectively. With aging under high-temperature electrical stress, the forward voltage of RGB micro-LEDs gradually increases, as shown in Figure 2d–f. The voltage elevation observed in micro-LEDs under high-temperature electrical stress arises from resistive degradation, which stems from the deterioration of contact interfaces [21], proliferation of material defects [17], or aging of solder joints [22], causing increased series and contact resistance. Additionally, passivation layer deterioration further impairs carrier injection and current spreading, contributing to voltage rise.
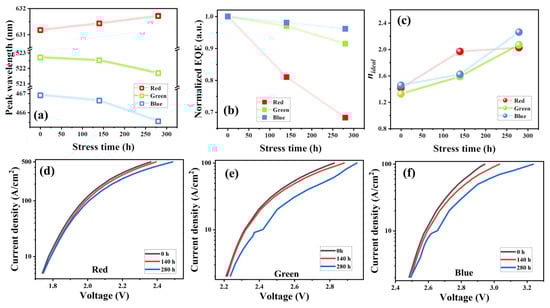
Figure 2.
(a) FWHM under the current density corresponding to the maximum EQE. (b) Normalized maximum EQE and (c) Ideal factor of RGB micro-LEDs. Current density versus voltage characteristics of (d) red, (e) green, and (f) blue.
The ideal factor (), a commonly used parameter [23], reflects the carrier transport and recombination processes in LEDs, according to the relationship:
where e denotes the elementary charge, kB is the Boltzmann’s constant, and T is the temperature. When the is less than 1, the carrier recombination mechanism in the LED is predominantly radiative recombination. When is between 1 and 2, SRH non-radiative recombination becomes significant. If the exceeds 2, carrier leakage occurs. Figure 2c illustrates the fitted for micro-LEDs. The for RGB micro-LEDs progressively increase with prolonged stress time, increasing from 1.4 to 2.0 for red, 1.3 to 2.1 for green, and 1.4 to 2.3 for blue, respectively, suggesting that enhanced nonradiative recombination and carrier leakage took place in these devices [23].
After aging the micro-LEDs to 280 h at 360 K, a noticeable decline is observed in the EQE under low current densities for RGB micro-LEDs. The classical ABC model is widely recognized as an effective method for investigating carrier recombination mechanisms in micro-LEDs [24], the ABC model is adopted to examine the recombination mechanisms in micro-LEDs both prior to and following the stress tests [25]. The total recombination rate G in micro-LEDs can be described as:
where n denotes the carrier concentration, A, B, and C denote coefficients of Shockley–Read–Hall (SRH) non-radiative recombination, radiative recombination, and Auger recombination, respectively. The extraction of the recombination parameters was performed by fitting the EQE () as a function of current density to the classical ABC model, according to the expression:
where is the light extraction efficiency, is the injection efficiency. The fitted values of A, B, and C were then used to calculate the relative contributions of each recombination process, as shown in Figure 3d–f.
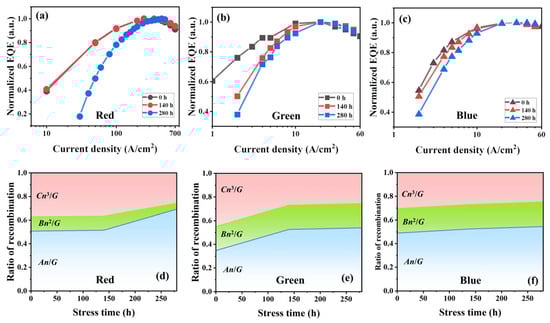
Figure 3.
Normalized EQE for (a) red, (b) green, (c) blue micro-LEDs. Calculated ratios of recombination for (d) red, (e) green, (f) blue micro-LEDs at the currents corresponding to the maximum EQE.
For the red micro-LEDs, with increasing aging time, SRH non-radiative recombination contribution (An/G) increases from 50.7% to 69.3%, the radiative recombination contribution (Bn2/G) drops from 12.1% to 5.0%, while the Auger recombination contribution (Cn3/G) decreases from 37.1% to 25.6% (Figure 3d). For green micro-LEDs, as stress time accumulates, An/G increases from 34.6% to 53.8%, Bn2/G remains almost unchanged, staying at around 20.0%, and Cn3/G decreases from 45.1% to 25.5% (Figure 3e). For blue micro-LEDs, An/G increases from 48.7% to 54.3%, Bn2/G decreases from 20.7% to 20.8% and Cn3/G varies from 30.5% to 24.8% as stress time increases (Figure 3f). The red micro-LEDs demonstrate a more notable increase in SRH non-radiative recombination, correlating with the significant efficiency degradation (Figure 2c). After electrical stress, elevated temperatures can accelerate dislocation motion, defect formation, and atomic diffusion processes. In particular, Ga and In diffusion in InGaN-based devices and Al diffusion in AlGaInP-based red devices may become more pronounced. These thermally activated mechanisms increase carrier trapping and non-radiative recombination, leading to reduced internal quantum efficiency (IQE). The red AlGaInP micro-LEDs experience more pronounced degradation, which can be attributed to their significantly higher current density corresponding to the maximum EQE, which is multiple times that of blue and green counterparts. The high current drives stronger heat generation due to self-heating, which accelerates thermal degradation originating from interfacial interdiffusion and the formation of non-radiative centers [26].
3.2. Spatially Resolved Light Emission
Thermal expansion induced by localized self-heating, particularly at high current densities, can shift the emission spectrum, thereby impacting both the reliability and color stability of micro-LEDs [26]. Hence, we present spatially resolved light emission data obtained with a hyperspectral system to highlight these localized effects. Figure 4 illustrates the post-aging EL intensity distributions across the mesas of red, green, and blue micro-LEDs. After 280 h of electrical stress, the red micro-LEDs exhibit no appreciable spatial redistribution of emission; the brightest light emission region remains centrally located on the mesa. By contrast, the green micro-LEDs display a pronounced increase in peripheral emission accompanied by a concomitant attenuation of central intensity. In the blue devices, after aging, sidewall regions exhibit higher emission intensity compared to central regions, although the light emission from the central region also has been enhanced.
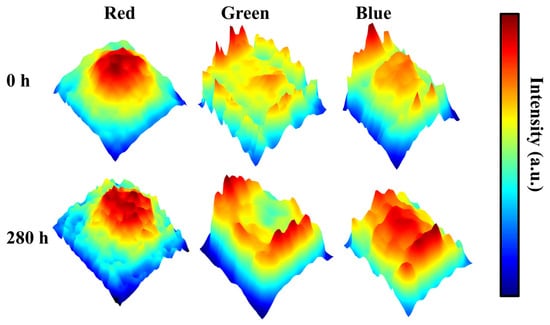
Figure 4.
Mappings of luminous intensity of red, green, and blue micro-LED at 300 K before and after stress of 280 h. The RGB micro-LEDs are driven at the current densities corresponding to the maximum EQE.
To further elucidate the differences among RGB micro-LEDs under high-temperature electrical stress, two representative regions, namely the center and the sidewall region of mesa, were analyzed separately (Figure 5a). As shown in Figure 5b, the red micro-LEDs exhibit a redshift around 0.3 nm in the central region after aging. For the green micro-LEDs (Figure 5c), a pronounced blueshift of 3 nm in the central region has been demonstrated. As presented in Figure 6d, for the blue micro-LEDs, the blueshift of the central region and the sidewall region is close, around 2 nm which is smaller than that of the central region in green micro-LEDs. Consequently, green micro-LEDs exhibit heightened susceptibility to degradation under combined thermal and electrical stresses, resulting in spectral broadening at the center region.
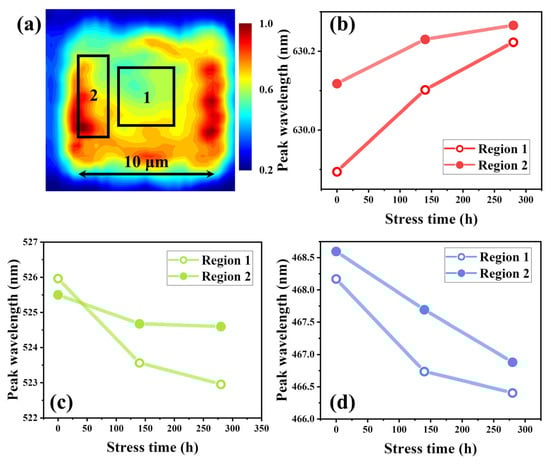
Figure 5.
(a) locations of two regions in the mesa of micro-LEDs, and the peak wavelength of two regions for (b) red, (c) green, and (d) blue micro-LEDs under different stress time. The currents correspond to the maximum EQE.
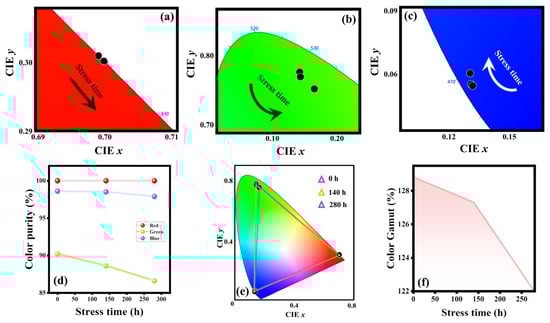
Figure 6.
Chromaticity coordinates (x, y) for (a) red, (b) green, (c) blue micro-LEDs. (d) Color purity. (e) The triangular area obtained by chromaticity coordinates of RGB micro-LEDs. (f) Color gamut.
3.3. Color Gamut
The chromatic stability of micro-LEDs is crucial for display applications since the color gamut of full-color displays is determined by the chromaticity coordinates of RGB micro-LEDs. The chromaticity coordinate shifts under prolonged operation may result in noticeable visual non-uniformity or color imbalance [27,28]. The chromaticity coordinates in CIE 1931 color space of RGB micro-LEDs under different stress time are illustrated in Figure 6a–c. The chromaticity coordinates of red micro-LEDs exhibit minimal variation with increasing stress time, consistently remaining near the edge of the chromaticity diagram. This indicates that red micro-LEDs can maintain high color purity over extended aging time. For the chromaticity coordinates of green micro-LEDs, which are crucial for RGB self-emissive displays [29], they shift curvilinearly towards the bottom-right direction as the stress time increases. For the blue micro-LEDs, the chromaticity coordinates a shift towards the top-left direction as stress time accumulates. Figure 6d illustrates the variation in color purity of RGB micro-LEDs as a function of stress time. As the stress duration increases, the color purity for the green and blue micro-LEDs decreases from 90.2% to 86.6%, and 98.6% to 97.9%, respectively. In contrast, the color purity of the red micro-LEDs remains stable at 100%. Figure 6e illustrates the triangular area defined by the chromaticity coordinates of the RGB micro-LEDs corresponding to the maximum EQE before and after stress. As the stress time increases, the triangular area slightly decreases. There are two definitions of color gamut: color gamut area and color gamut coverage. In this work, we utilized the area ratio of National Television Standards Committee (NTSC) color gamut to compare the gamut before and after aging of 280 h, demonstrating that the color gamut drops from 122.2% to 115.2% (Figure 6f).
4. Conclusions
In this work, we investigated the electrical and chromatic properties of 10 × 10 µm RGB micro-LEDs after a 280 h stress at 360 K. Three key metrics—external quantum efficiency, luminous intensity, and color gamut—were evaluated for each device. The classical ABC model was employed to analyze carrier-recombination processes throughout the ageing period. The red micro-LEDs exhibited the most pronounced efficiency degradation, with a 31.7% decrease in peak EQE, primarily due to a substantial increase in SRH non-radiative recombination. The green micro-LEDs displayed a notable blueshift in emission wavelength and suffered a 3.6% reduction in color purity due to spectral broadening, reducing the color gamut by 7%.
Author Contributions
Conceptualization, methodology, validation, formal analysis, investigation, writing—original draft preparation, writing—review and editing by C.T., Y.L. (Yu Liu), Q.D., L.P., G.C., Y.L. (Yijun Lu), T.W., Z.C. and W.G. All authors have read and agreed to the published version of the manuscript.
Funding
This research was funded by the Science and Technology Project of Fujian Province (2023H6038), in part by the Fujian Provincial Natural Science Foundation of China (2024J01052), in part by the Suzhou integrated circuit advanced packaging substrate technology innovation consortium (LHT202329), in part by the Xiamen Science and Technology Plan Project (3502Z20241021).
Data Availability Statement
Data underlying the results presented in this paper are not publicly available at this time but may be obtained from the authors upon reasonable request.
Conflicts of Interest
Author Li Pan was employed by the company AKM Electronic Technology (Suzhou) Co., Ltd. The remaining authors declare that the research was conducted in the absence of any commercial or financial relationships that could be construed as a potential conflict of interest.
References
- Lee, S.; Eo, Y.J.; Ko, M.; Ahn, S.; Yun, S.; Kim, H.J.; Hong, E.; Kwon, Y.; Kang, H.; Lee, Y.J.; et al. Development of fin-LEDs for next-generation inorganic displays using face-selective dielectrophoretic assembly. Nat. Commun. 2024, 15, 9536. [Google Scholar] [CrossRef] [PubMed]
- Lin, C.C.; Wu, Y.R.; Kuo, H.C.; Wong, M.S.; DenBaars, S.P.; Nakamura, S.; Pandey, A.; Mi, Z.; Tian, P.; Ohkawa, K.; et al. The micro-LED roadmap: Status quo and prospects. J. Phys. Photonics 2023, 5, 042502. [Google Scholar] [CrossRef]
- Chang, W.; Kim, J.; Kim, M.; Lee, M.W.; Lim, C.H.; Kim, G.; Hwang, S.; Chang, J.; Min, Y.H.; Jeon, K.; et al. Concurrent self-assembly of RGB microLEDs for next-generation displays. Nature 2023, 617, 287–291. [Google Scholar] [CrossRef] [PubMed]
- Li, G.; Tseng, M.C.; Chen, Y.; Yeung, F.S.Y.; He, H.; Cheng, Y.; Cai, J.; Chen, E.; Kwok, H.S. Color-conversion displays: Current status and future outlook. Light Sci. Appl. 2024, 13, 301. [Google Scholar] [CrossRef]
- Miao, W.C.; Hsiao, F.H.; Sheng, Y.; Lee, T.Y.; Hong, Y.H.; Tsai, C.W.; Chen, H.L.; Liu, Z.; Lin, C.L.; Chung, R.J.; et al. Microdisplays: Mini-LED, Micro-OLED, and Micro-LED. Adv. Opt. Mater. 2023, 12, 2300112. [Google Scholar] [CrossRef]
- Lu, B.; Wang, L.; Hao, Z.; Luo, Y.; Chen, C.J.; Wu, M.C.; Tang, J.; Kim, J.K.; Schubert, E.F. Dennard scaling in optoelectronics: Scientific challenges and countermeasures of Micro-LEDs for displays. Laser Photon. Rev. 2022, 16, 2100433. [Google Scholar] [CrossRef]
- Anwar, A.R.; Sajjad, M.T.; Johar, M.A.; Hernández Gutiérrez, C.A.; Usman, M.; Łepkowski, S.P. Recent Progress in Micro-LED-Based Display Technologies. Laser Photon. Rev. 2022, 16, 2100427. [Google Scholar] [CrossRef]
- He, W.; Zhang, K.; Zheng, X.; Li, M.; Ke, Z.; Lu, Y.; Chen, Z.; Guo, W. Reduction in the Number of Quantum Wells Alleviates the Sidewall Effect in AlGaInP-Based Red Micro-LEDs. ACS Photonics 2024, 11, 4769–4777. [Google Scholar] [CrossRef]
- Ou, C.J.; Chang, K.P.; Tasi, M.W.; Chen, C.C.; Chen, Y.M.; Lo, C.W.; Wuu, D.S. Detailed Successive Layer Modeling and Design Factor Analysis for Single Micro-LED Pixel. IEEE Photonics J. 2022, 14, 7059309. [Google Scholar] [CrossRef]
- Li, M.H.; Zheng, X.; Zhang, K.; Zhong, C.M.; Lu, Z.C.; Lu, Y.J.; Chen, Z.; Guo, W.J. Highly Efficient AlGaInP-Based Micro-LEDs Achieved by Plasma Sidewall Treatment. IEEE Trans. Electron. Devices 2025, 72, 1839–1843. [Google Scholar] [CrossRef]
- Zhanghu, M.; Liu, Y.; Hyun, B.R.; Li, Y.; Liu, Z. Optimizing InGaN Micro-LED Efficiency: Investigating the Internal Quantum Efficiency and Ideality Factor Connection. IEEE Trans. Electron. Devices 2024, 71, 6190–6197. [Google Scholar] [CrossRef]
- Zou, P.A.; Xu, Y.G.; Liu, C.; Zhang, L.R.; Zhang, J.H.; Yuan, Y.K.; Cai, W.; Han, S.H.; Zhou, L.; Xu, M.; et al. A New Analog PWM Pixel Circuit with Metal Oxide TFTs for Micro-LED Displays. IEEE Trans. Electron. Devices 2022, 69, 4306–4311. [Google Scholar] [CrossRef]
- Gao, H.; Zou, M.; Zhong, C.; Zhuang, J.; Lin, J.; Lu, Z.; Jiang, Z.; Lu, Y.; Chen, Z.; Guo, W. Advances in pixel driving technology for micro-LED displays. Nanoscale 2023, 15, 17232–17248. [Google Scholar] [CrossRef] [PubMed]
- Zheng, X.; Xiao, J.; Dai, Y.; Tong, C.; Ai, S.; Zhu, L.; Lu, Y.; Chen, Z.; Guo, W. Impacts and effectiveness of sidewall treatment on the spatially resolved optical properties and efficiency enhancement for GaN-based blue and green micro-LEDs. Opt. Laser Technol. 2025, 181, 111611. [Google Scholar] [CrossRef]
- Liu, H.; Yu, D.; Niu, P.; Zhang, Z.; Guo, K.; Wang, D.; Zhang, J.; Ma, X.; Jia, C.; Wu, C. Lifetime prediction of a multi-chip high-power LED light source based on artificial neural networks. Results Phys. 2019, 12, 361–367. [Google Scholar] [CrossRef]
- Roccato, N.; Piva, F.; De Santi, C.; Buffolo, M.; Haller, C.; Carlin, J.F.; Grandjean, N.; Vallone, M.; Tibaldi, A.; Bertazzi, F.; et al. Modeling the electrical characteristic of InGaN/GaN blue-violet LED structure under electrical stress. Microelectron. Reliab. 2022, 138, 114724. [Google Scholar] [CrossRef]
- Zheng, X.; Ai, S.; Lu, T.; Dai, Y.; Tong, C.; Lu, Y.; Chen, Z.; Guo, W. Efficiency droop of AlGaN-based deep-ultraviolet miniaturized light-emitting diodes under electrical stress. Appl. Phys. Lett. 2024, 125, 231101. [Google Scholar] [CrossRef]
- Li, C.; Chen, Z.; Jiao, F.; Zhan, J.; Chen, Y.; Chen, Y.; Nie, J.; Zhao, T.; Kang, X.; Feng, S.; et al. Effects of interfaces and current spreading on the thermal transport of micro-LEDs for kA-per-square-cm current injection levels. RSC Adv. 2019, 9, 24203–24211. [Google Scholar] [CrossRef]
- Liu, T.; Liu, S.; Zhang, Z.; Guo, W.; Chen, X.; Yang, Y.; Chen, G.; Lu, Y.; Chen, Z.; Wu, T. Optimization of P-electrode structures to enhance current spreading uniformity in micro-LEDs. Opt. Lett. 2024, 49, 6645–6648. [Google Scholar] [CrossRef]
- Lin, Y.; Peng, Z.; Zhu, L.; Yan, W.; Shih Tm Wu, T.; Lu, Y.; Gao, Y.; Chen, Z.; Guo, Z.; Liu, Z. Evolution of crystal imperfections during current-stress ageing tests of green InGaN light-emitting diodes. Appl. Phys. Express 2016, 9, 092101. [Google Scholar] [CrossRef]
- Cho, W.S.; Park, J.Y.; Yoo, C.J.; Lee, J.-L. Design of highly transparent ohmic contact to N face n-GaN for enhancing light extraction in GaN-based micro LED display. Opt. Express. 2023, 31, 41611–41621. [Google Scholar] [CrossRef] [PubMed]
- Ji, X.; Wang, F.; Lin, P.; Yin, L.; Zhang, J. Fabrication and Mechanical Properties Improvement of Micro Bumps for High-Resolution Micro-LED Display Application. IEEE Trans. Electron. Devices 2022, 69, 3737–3741. [Google Scholar] [CrossRef]
- Guo, W.; Chen, N.; Lu, H.; Su, C.; Lin, Y.; Chen, G.; Lu, Y.; Zheng, L.; Peng, Z.; Kuo, H.C.; et al. The impact of luminous properties of red, green, and blue Mini-LEDs on the color gamut. IEEE Trans. Electron. Devices 2019, 66, 2263–2268. [Google Scholar] [CrossRef]
- La Grassa, M.; Meneghini, M.; De Santi, C.; Mandurrino, M.; Goano, M.; Bertazzi, F.; Zeisel, R.; Galler, B.; Meneghesso, G.; Zanoni, E. Ageing of InGaN-based LEDs: Effects on internal quantum efficiency and role of defects. Microelectron. Reliab. 2015, 55, 1775–1778. [Google Scholar] [CrossRef]
- Peng, Z.; Guo, W.; Wu, T.; Guo, Z.; Lu, Y.; Zheng, Y.; Lin, Y.; Chen, Z. Temperature-Dependent Carrier Recombination and Efficiency Droop of AlGaN Deep Ultraviolet Light-Emitting Diodes. IEEE Photonics J. 2020, 12, 8200108. [Google Scholar] [CrossRef]
- Tong, C.D.; Guo, W.J.; Zhong, C.M.; Wang, Z.Y.; Gao, Y.L.; Chen, Y.Y.; Zhu, W.P.; Zhu, L.H.; Lu, Y.J.; Wu, Z.Z.; et al. Effect of current on the inhomogeneous light emission From AlGaInP-based flip-chip red mini-LEDs. IEEE Electron. Device Lett. 2022, 43, 402–405. [Google Scholar] [CrossRef]
- Liu, Y.; Xia, T.; Du, A.; Liang, T.; Fan, Z.; Chen, E.; Sun, J.; Yan, Q.; Guo, T. Omnidirectional color shift suppression of full-color micro-LED displays with enhanced light extraction efficiency. Opt. Lett. 2023, 48, 1650–1653. [Google Scholar] [CrossRef]
- Chen, E.; Fan, Z.; Zhang, K.; Huang, C.; Xu, S.; Ye, Y.; Sun, J.; Yan, Q.; Guo, T. Broadband beam collimation metasurface for full-color micro-LED displays. Opt. Express 2024, 32, 10252–10264. [Google Scholar] [CrossRef]
- Tong, C.D.; Li, G.Y.; Zheng, X.; Chen, C.B.; Ke, Z.J.; Wu, R.X.; Wu, T.Z.; Lu, Y.J.; Chen, Z.; Zhuang, J.B.; et al. Luminous properties of red, green, and blue Micro-LEDs and the impacts on color gamut. IEEE Trans. Electron. Devices 2023, 70, 1733–1738. [Google Scholar] [CrossRef]
Disclaimer/Publisher’s Note: The statements, opinions and data contained in all publications are solely those of the individual author(s) and contributor(s) and not of MDPI and/or the editor(s). MDPI and/or the editor(s) disclaim responsibility for any injury to people or property resulting from any ideas, methods, instructions or products referred to in the content. |
© 2025 by the authors. Licensee MDPI, Basel, Switzerland. This article is an open access article distributed under the terms and conditions of the Creative Commons Attribution (CC BY) license (https://creativecommons.org/licenses/by/4.0/).