1. Introduction
1.1. Floating Zone Method
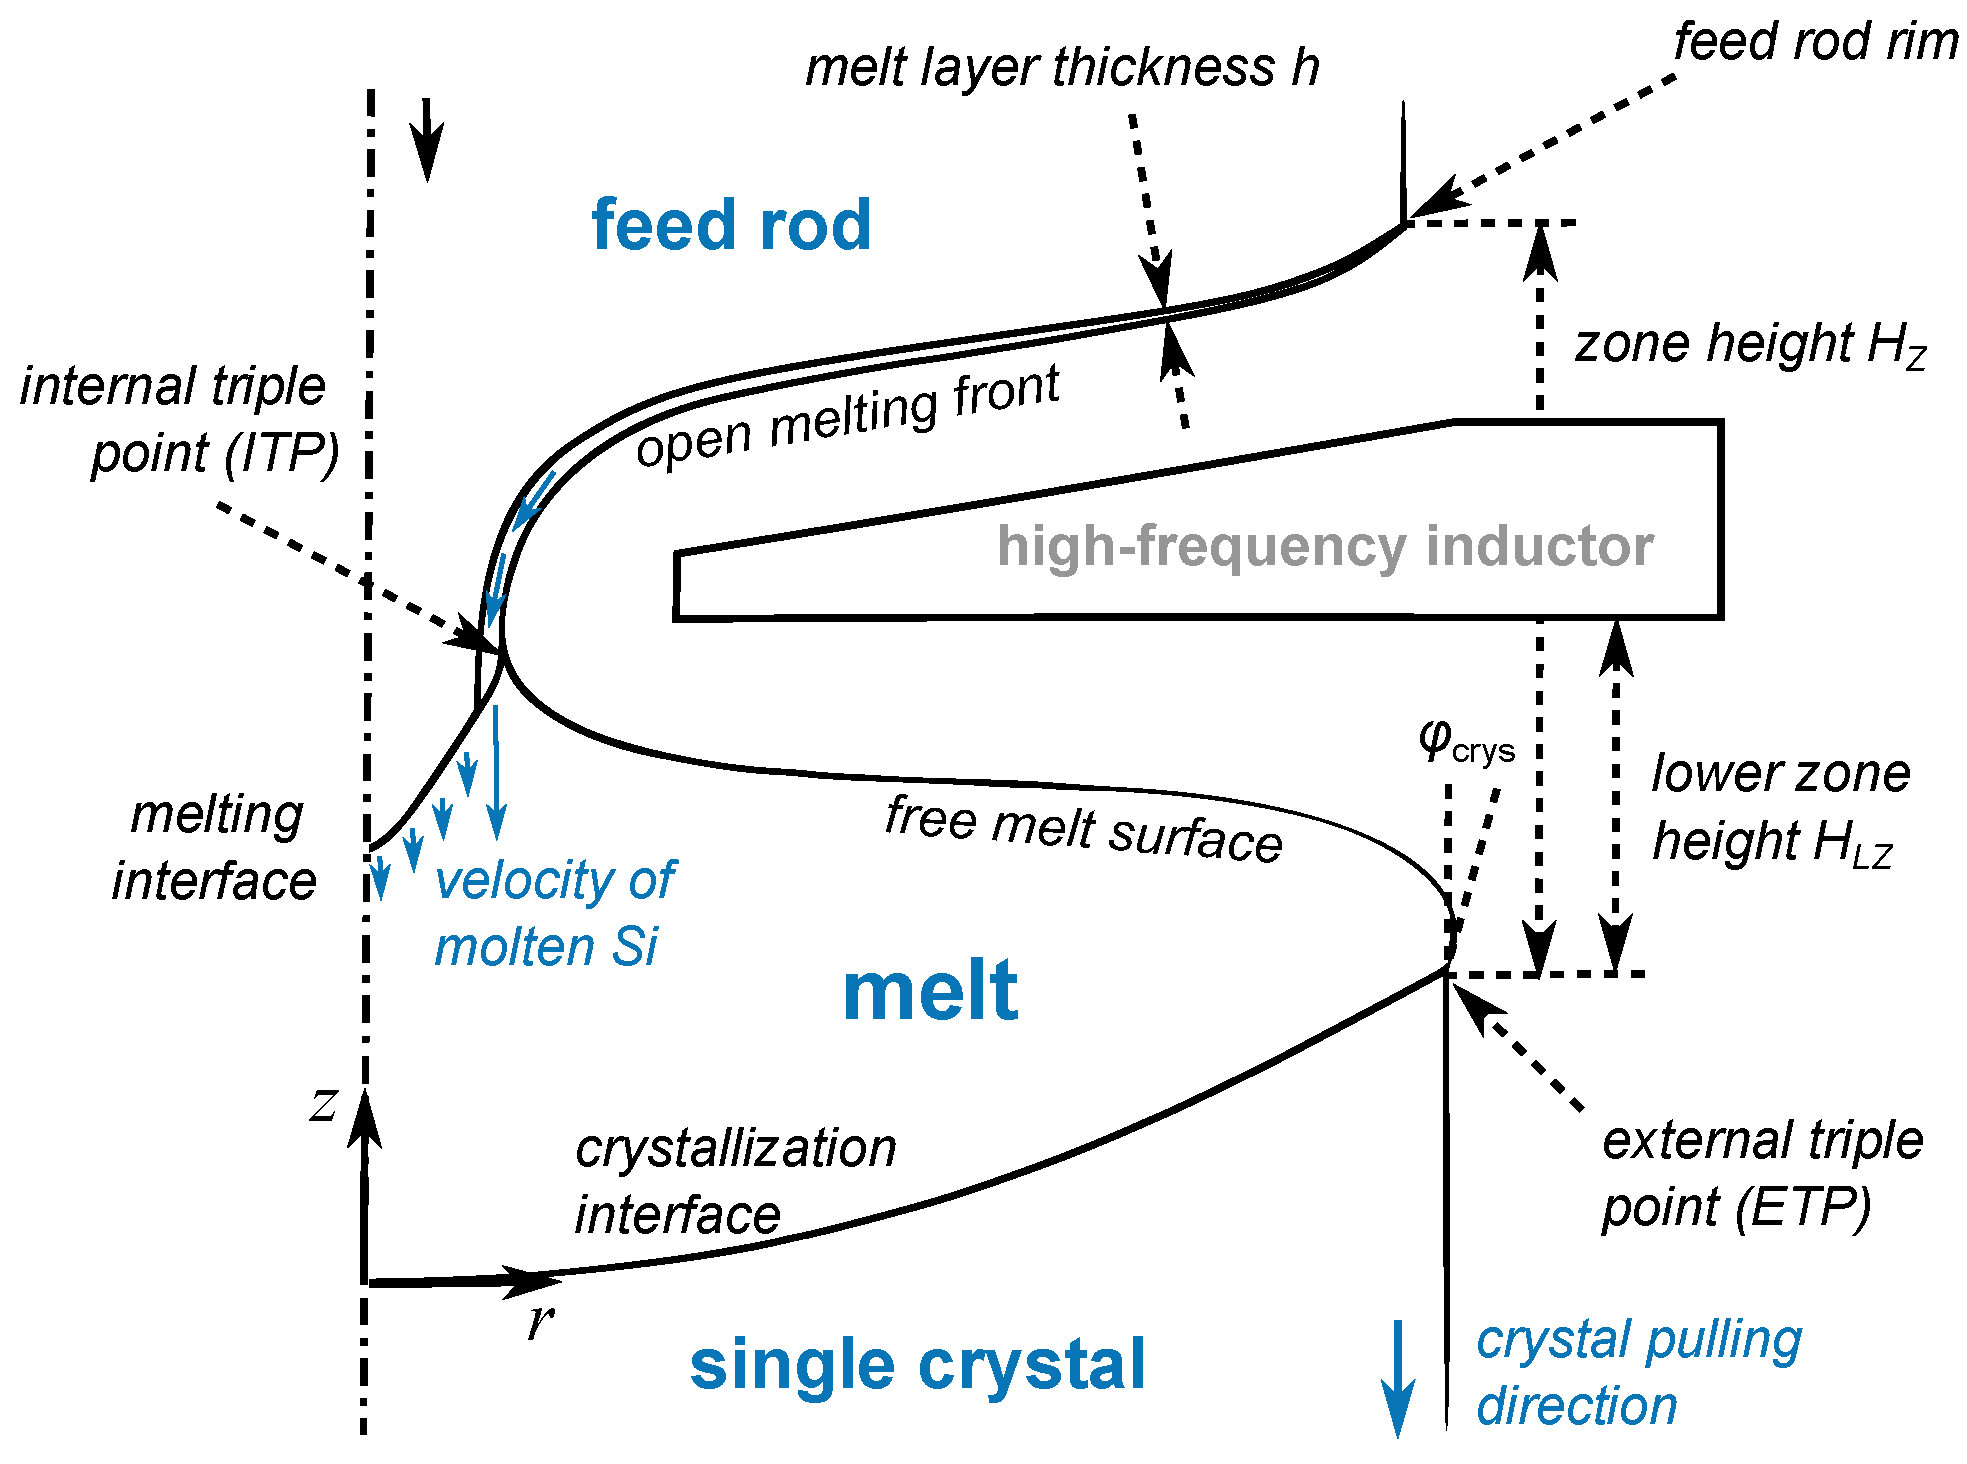
Silicon crystals serve as the base material for a variety of applications in electronics and photonics. One of the methods for crystal growth is the floating zone (FZ) method, which is used to produce high purity crystals, because during the process, the molten silicon does not touch any other material except the feed rod and the grown crystal.
In the FZ method, a high-frequency inductor is used to melt a rod of polycrystalline silicon (the feed material) located above the inductor (see
Figure 1). The electric current in the silicon is induced only in a thin film because the frequency of the inductor current is high, typically around 3 MHz. The molten silicon then flows down through the opening in the middle of the inductor and forms a melt held together by the relatively high surface tension and electromagnetic (EM) pressure. At a greater distance below the inductor, where the induced EM power is lower, the molten silicon cools due to thermal radiation and crystallizes, forming a single crystal.
1.2. Numerical Modelling
Several numerical models for melt flow and impurity transport in the FZ process have been developed so far. One of the first 3D hydrodynamic models for FZ silicon growth was created in 2007 [
1]. A model developed in 2020 [
2] showed how the 3D melt velocity field affects the distribution of dopants in the crystal, and the simulation results were compared with the experimentally measured resistivity in a crystal with a diameter of 200 mm. Other models took into account several additional aspects, such as impurity transport in the gas [
3] or the non-symmetric 3D shape of the crystallisation front [
4]. An elaborate 3D heat transfer model, including the convection in the puller atmosphere, was created [
5].
However, these models of the FZ process were either verified using only one experiment per model or not verified at all. It means that the predictive power of these models and their usefulness for crystal production processes have not been thoroughly tested yet.
1.3. The Present Research
In this research, the previously developed numerical model [
1] was used to predict crystal resistivity profiles for different crystal rotation rates ranging from 2 to 10 rpm, and the modelling results were compared to the experimental data. First, different shapes of phase boundaries were calculated (the results are provided in
Section 3.2). Then, the melt flow and dopant transport simulations (see
Section 3.3) were run using the obtained zone shapes. The material properties used in the model were calibrated by comparing the simulated crystal resistivity profiles with the experimentally measured ones, and a novel discussion about the influence of turbulence on melt flow for different crystal rotation rates is presented.
2. Numerical Model
2.1. Phase Boundaries
Specialized software (version 5.19)
FZone for the modelling of the floating zone crystal growth process was introduced in 2003 [
6]. The program considers the axisymmetric geometry of the phase boundaries, while the 3D EM field created by the high-frequency inductor coil is calculated by the boundary element method [
7] and then azimuthally averaged. The shape of the interfaces is determined by the heat flux balance, and the obtained solution is independent of time. The software is used to calculate the quasi-stationary geometry that corresponds to the fully developed cylindrical stage of the crystal growth process.
The molten silicon forms a thin fluid film layer with variable thickness on the open melting front. Due to large differences in the electrical conductivity of solid and liquid silicon, the induced heat source distribution is highly dependent on the thickness of the fluid film. Therefore, the Joulean heat flux (i.e., surface density of the induced power)
in the heat balance equation can be expressed as the sum of the induced power density
inside the melt layer and
inside the solid silicon:
where
is the surface power density that would be induced if the thickness of the melt layer was much larger than the skin layer depth. The analytical model [
6] introduces the dimensionless heat source coefficient
to evaluate the actually induced heat sources based on the calculated
:
where
is the effective surface current,
is the electrical conductivity of the liquid silicon,
is the skin layer depth,
is the relative permeability of silicon,
is the vacuum permeability, and
f is EM field frequency.
The value of the coefficient
is equal to 1 when the melt layer is significantly larger than the skin layer depth of the EM field, and all of the heat sources are induced in the melt layer. A reduction in the melt layer thickness leads to an increase in the coefficient value up to 5 in the case of an infinitely small melt layer thickness when all of the heat sources are concentrated in the solid. In the analytical model, the melt layer thickness is derived from process parameters and the radial position on the interface [
6].
However, experiments have shown that the surface of the open melting front is not uniform, and asymmetric local structures can appear. These structures result in an inconsistent melt layer thickness, which cannot be precisely evaluated using the analytical approach. Local simulations have shown that the heat source coefficient is independent of the radial position on the interface, and the use of a constant
value on all of the points of the open melting front during
FZone simulations leads to better agreement with experimental results [
8].
2.2. Melt Flow and Dopant Transport
In the scope of this work, hydrodynamics and dopant transport in melt were simulated with a solver based on the
OpenFOAM C++ library [
1]. Liquid silicon flow was assumed to be incompressible and either laminar or turbulent, optionally described by a large-eddy simulation (LES) one-equation model [
9]. The transient Navier–Stokes equation was solved for melt velocity using the Boussinesq approximation for thermal convection.
A 3D finite-volume hexahedral mesh was created by rotating the axisymmetric phase boundaries obtained by
FZone. The geometry of the melt was assumed to be constant during the melt flow simulations. To improve simulation precision, a 3D high-frequency EM field was recalculated [
7] using a finer mesh on the free melt surface.
The boundary conditions for velocity v and temperature T are as follows:
For dopant concentration C, a standard convection–diffusion equation was solved with the following boundary conditions:
2.3. Material Properties
The values of the material properties are summarized in
Table 1. The intervals of possible values are given for some of the properties because the uncertainty of the literature data exceeds 5%. In some cases a parameter depends on experimental conditions; in other cases there are disagreements between sources in the literature. For example, Marangoni’s coefficient—the derivative of surface tension over temperature—depends on the oxygen content in the puller [
10]. Since the precise level of oxygen in the experimental furnace was not been measured, the exact value of the Marangoni coefficient could not be precisely predicted, and several values were tested. The influence of the phosphorus concentration on surface tension (soluto-capillary effect) may also be significant; however, it was not considered in this research due to a lack of data from the literature.
Such parameters were calibrated using parameter studies, except solid silicon heat capacity , which is not relevant for the scope of this study since FZone operates in the quasi-stationary mode. The Value column contains values that provide the best agreement between simulated and experimentally measured phase boundaries and resistivity profiles in the present research.
3. Results
3.1. Experimental Data
The 4″ FZ crystal growth experiments were performed at the Leibniz-Institut für Kristallzüchtung (IKZ), Berlin, and the system parameters are listed in
Table 2. A one-turn inductor with a main slit and three side slits was used [
29]. Approximate experimental values of the zone height
, lower zone height
, and ITP radius
are included as well. Photographs of the process were taken to detect the shape of phase boundaries and were used for the verification of
FZone simulations shown in
Section 3.2.
Crystal rotation rates from 2 rpm to 10 rpm were applied. Data was collected from crystal sections grown with constant process parameters and for which quasi-stationary thermal conditions can be assumed. When multiple rotation rates were applied in a single growth run, the following procedure was used to ensure that input parameters could be clearly associated with the resulting dopant distribution without interference from transient thermal effects or overlapping conditions:
After the start of the cylindrical phase, an initial crystal section with a 10 cm length was grown; it was excluded from characterization since it is still influenced by the start cone, where the smaller surface results in a different heat irradiation;
A constant rotation rate was maintained during the growth of a 15 cm crystal section;
Assuming that the new thermal conditions and melt flow regime would be stabilized within the first 5 cm of the section’s length, the remaining 10 cm was selected for the resistivity measurements.
The resistivity of the samples was measured using the 4-point probe method, averaged over the crystal section length, and then used for the comparison with the results of dopant transport simulations; see
Section 3.3. The average crystal resistivity was
in the 2 rpm experiment and
in the 5 rpm and 10 rpm experiments.
3.2. Phase Boundaries
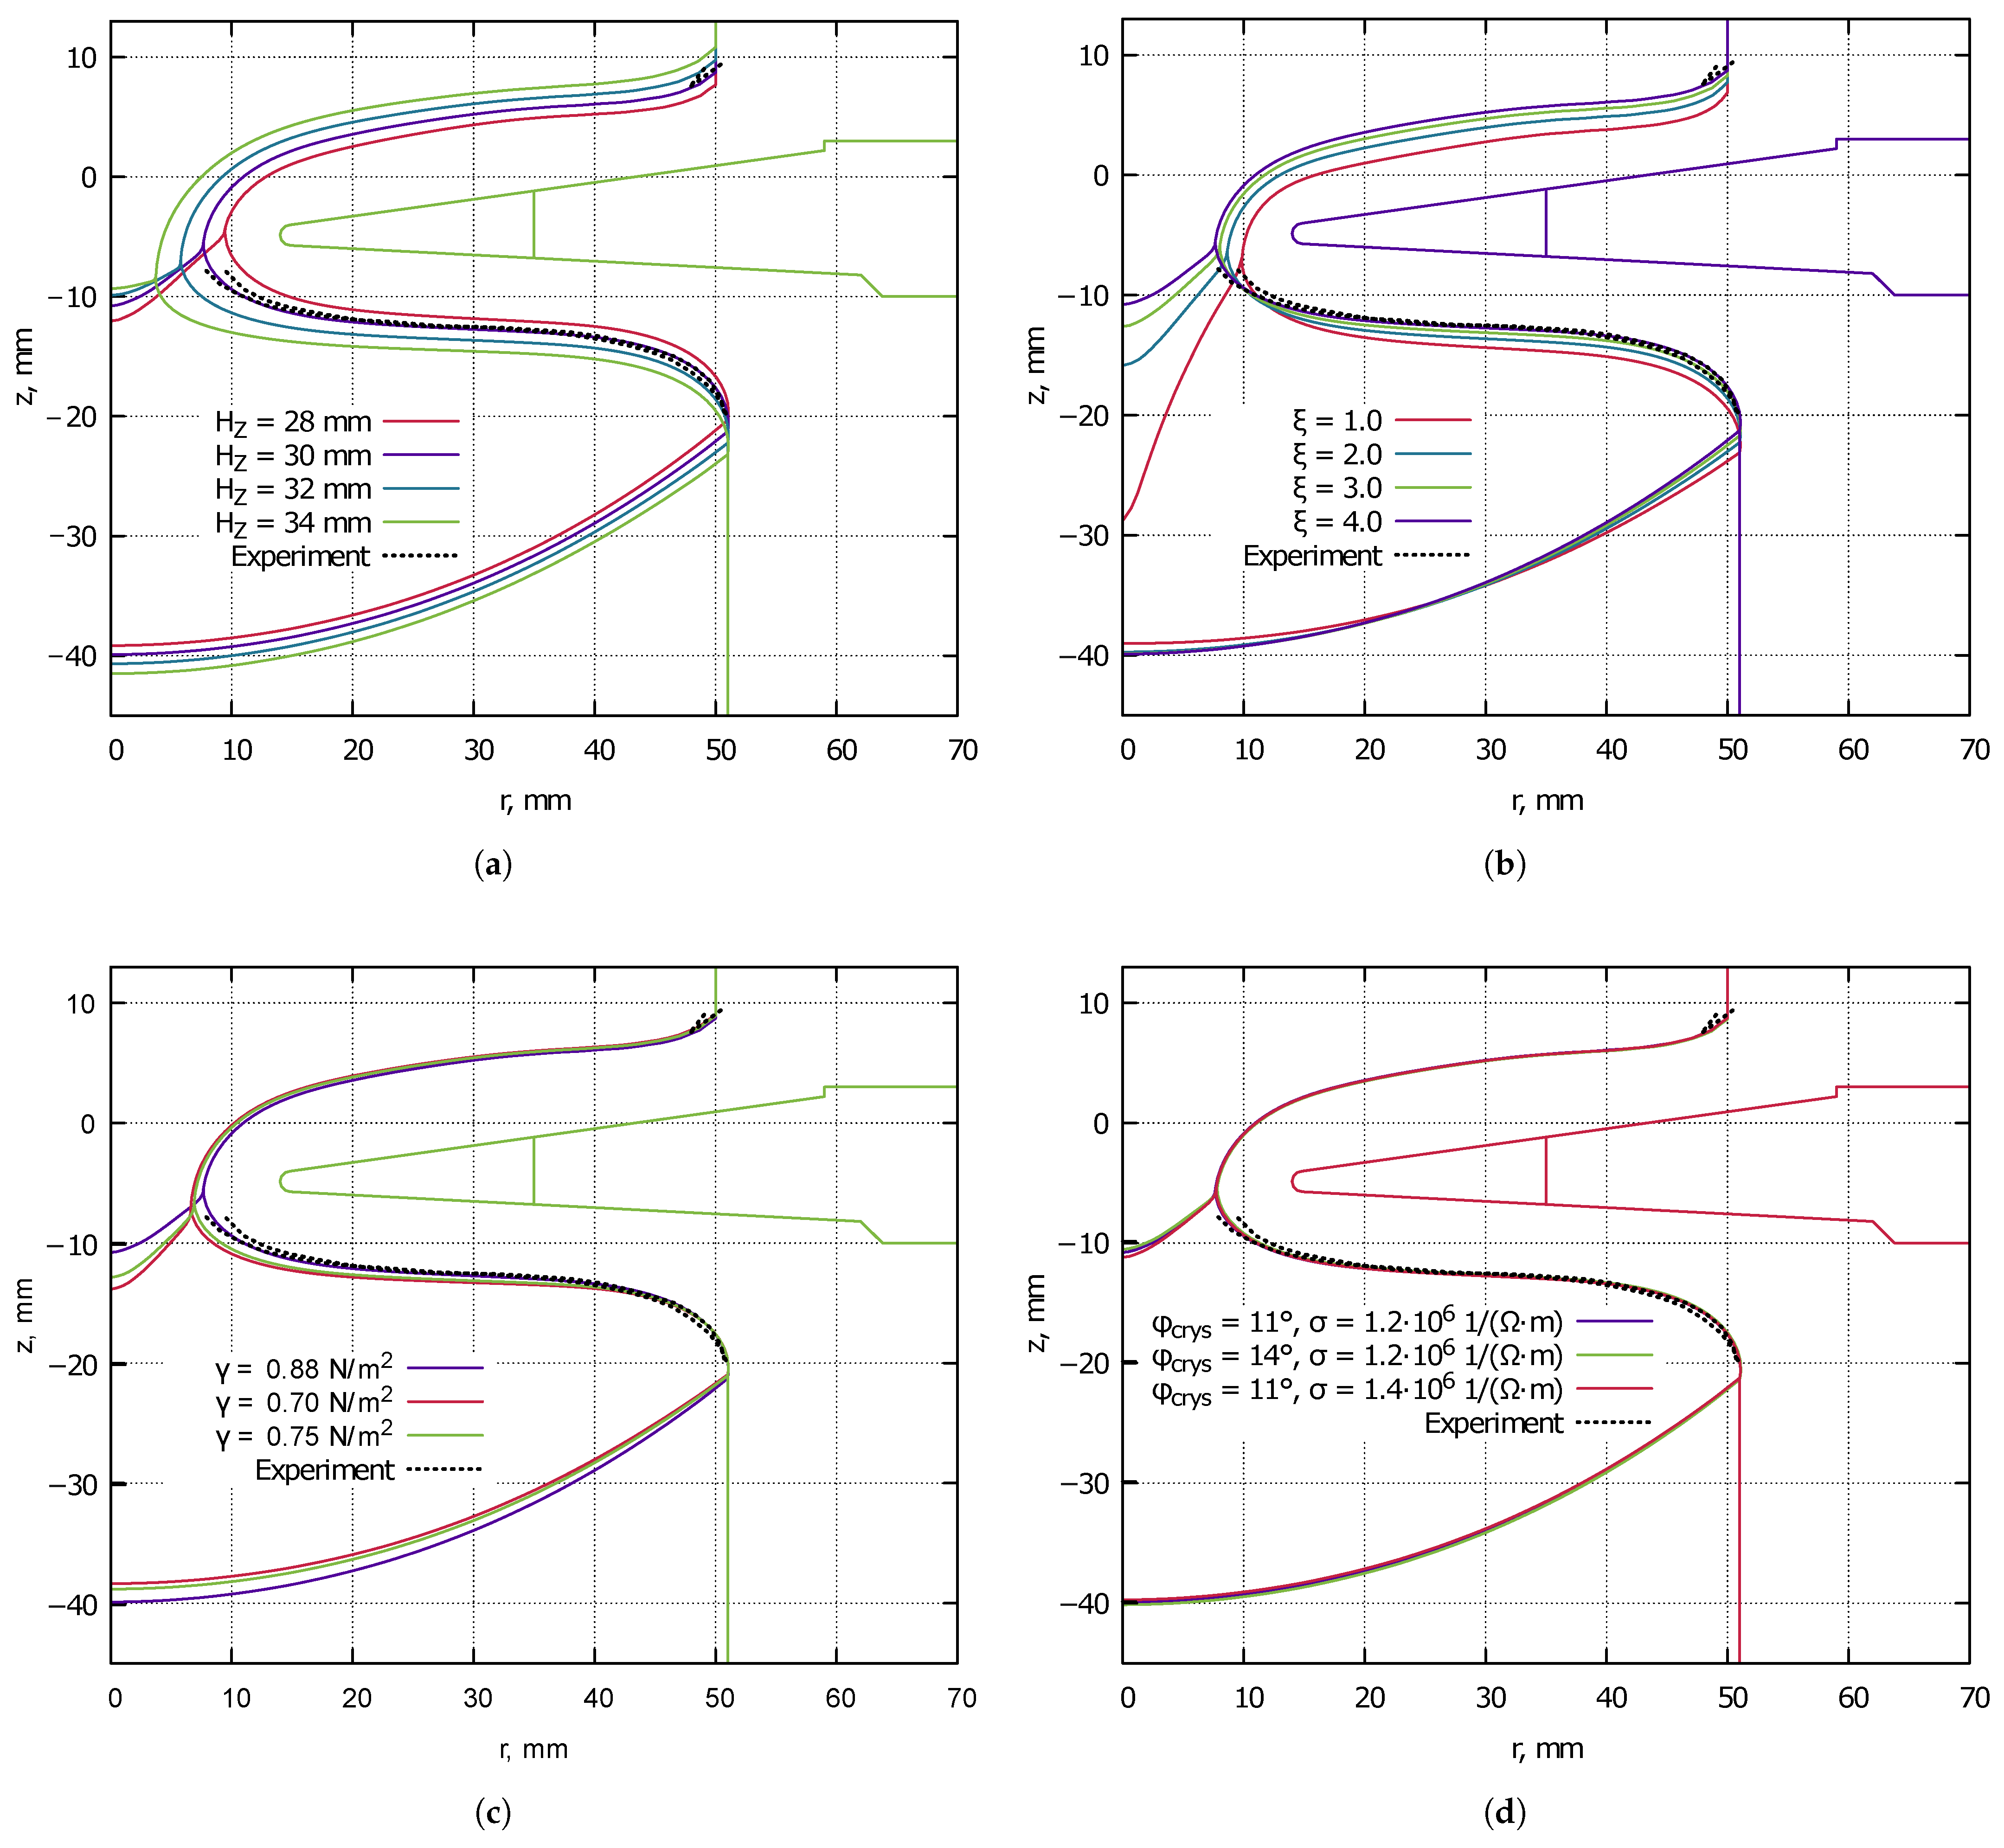
The influence of the following material properties on the phase boundaries was analysed: heat source coefficient , surface tension , melt electrical conductivity , and the free surface angle in the case of cylindrical crystal growth . Since the zone height was not maintained during the experiment precisely—the generator power was held constant, but different zone heights were observed due to the influence of the rotation rate on the thermal field—it was varied during the parameter studies as well. The goal of this part of the research was to find a parameter combination that ensures the best agreement with the experimental photograph of phase boundaries.
Figure 2 shows the results of the simulations of phase boundaries (solid lines) and the readings from the experimental photograph (dotted lines), which were aligned by the inductor position. Since the shape of the free surface in the experiment was not perfectly axially symmetrical, two different lines were plotted, corresponding to the surface shapes below the main slit and below the additional slit on the opposite side of the inductor. The small parts of the open melting front near the feed rod rim that were visible on the photograph were included as well.
Figure 2a demonstrates that the higher values of zone height decrease the radius of the internal triple point (ITP, see scheme in
Figure 1), lower the vertical position of the external triple point (ETP), and elevate the vertical position of the feed rod rim. It can be explained by a larger EM power required to melt the feed material for the constant pulling rate. The value of
mm allows us to obtain good agreement with the experiments for the free surface shape and the feed rod rim position, even though the ETP position is still off by several millimetres.
Higher
values decrease the ITP radius, as shown in
Figure 2b, and elevate vertical positions of the ETP and the feed rod rim, which is beneficial for describing experimentally obtained phase boundaries. This effect can be explained by the redistribution of the induced power towards the feed rod—more heat is induced there, since
is proportional to
; see Equation (
1). The total induced power, which is necessary to grow the crystal with the given pulling rate and
, stays the same; thus, the increase in
redistributes the power from the free surface to the feed rod. Lower power and lower EM pressure on the free surface elevate the vertical position of the ETP. In conclusion, the value of
ensures the correct positions of the free surface and the feed rod, and it describes the neck shape relatively well.
Lower surface tension (
Figure 2c) decreases neck radius and decreases crystallization interface deflection. The free surface shape is best described using the standard value of
. Melt electrical conductivity and free surface angle (
Figure 2d) have no significant effect on the shape of phase boundaries in simulations.
3.3. Melt Flow and Crystal Resistivity
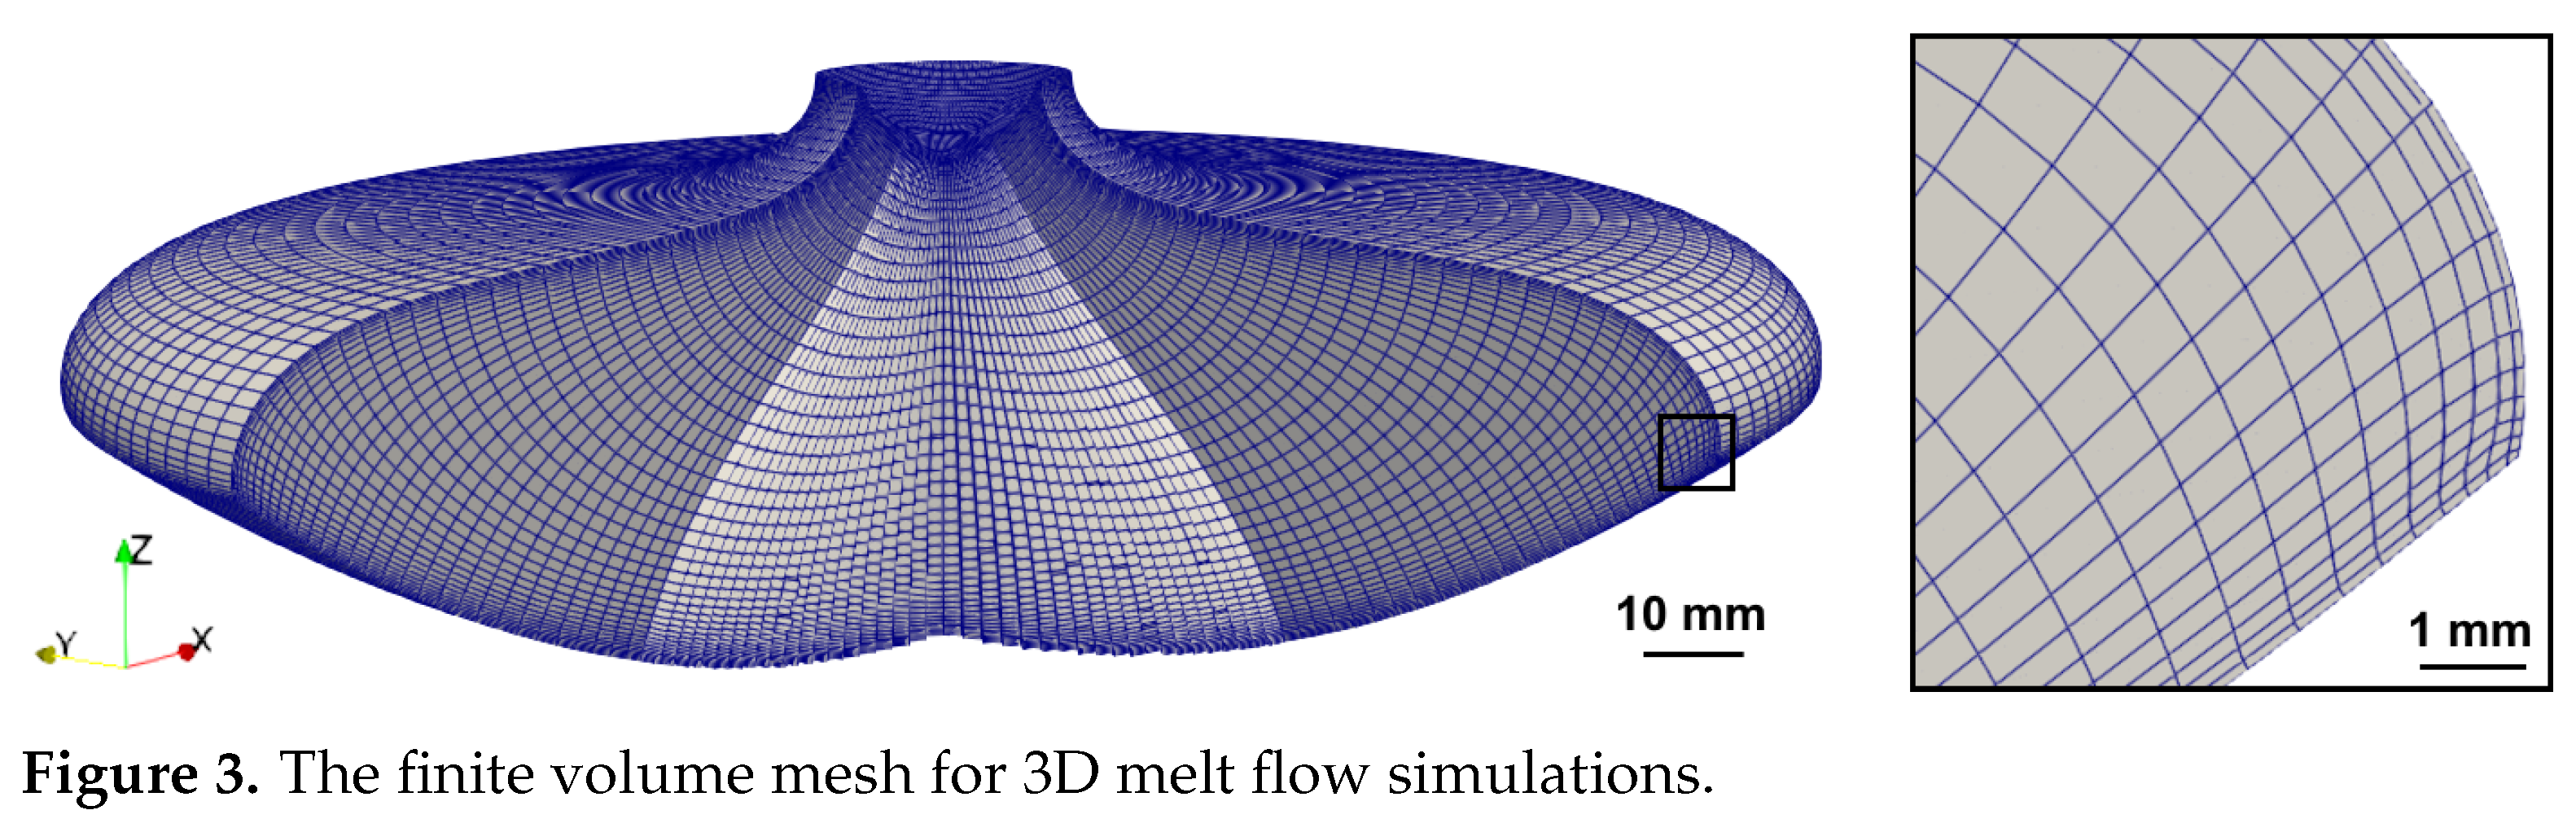
The phase boundaries that agreed the most with the experimental data (
mm,
) were used to create a 3D finite volume mesh with 330,050 elements (see
Figure 3), where the width of the smallest elements in the boundary layer was 0.1 mm. This mesh was used to perform melt flow and dopant transport simulations—the first 200 s of melt flow were simulated to ensure that the average flow regime stabilizes, and then the simulations continued for another 200 s to obtain time-averaged results. The time step was set to 1 ms.
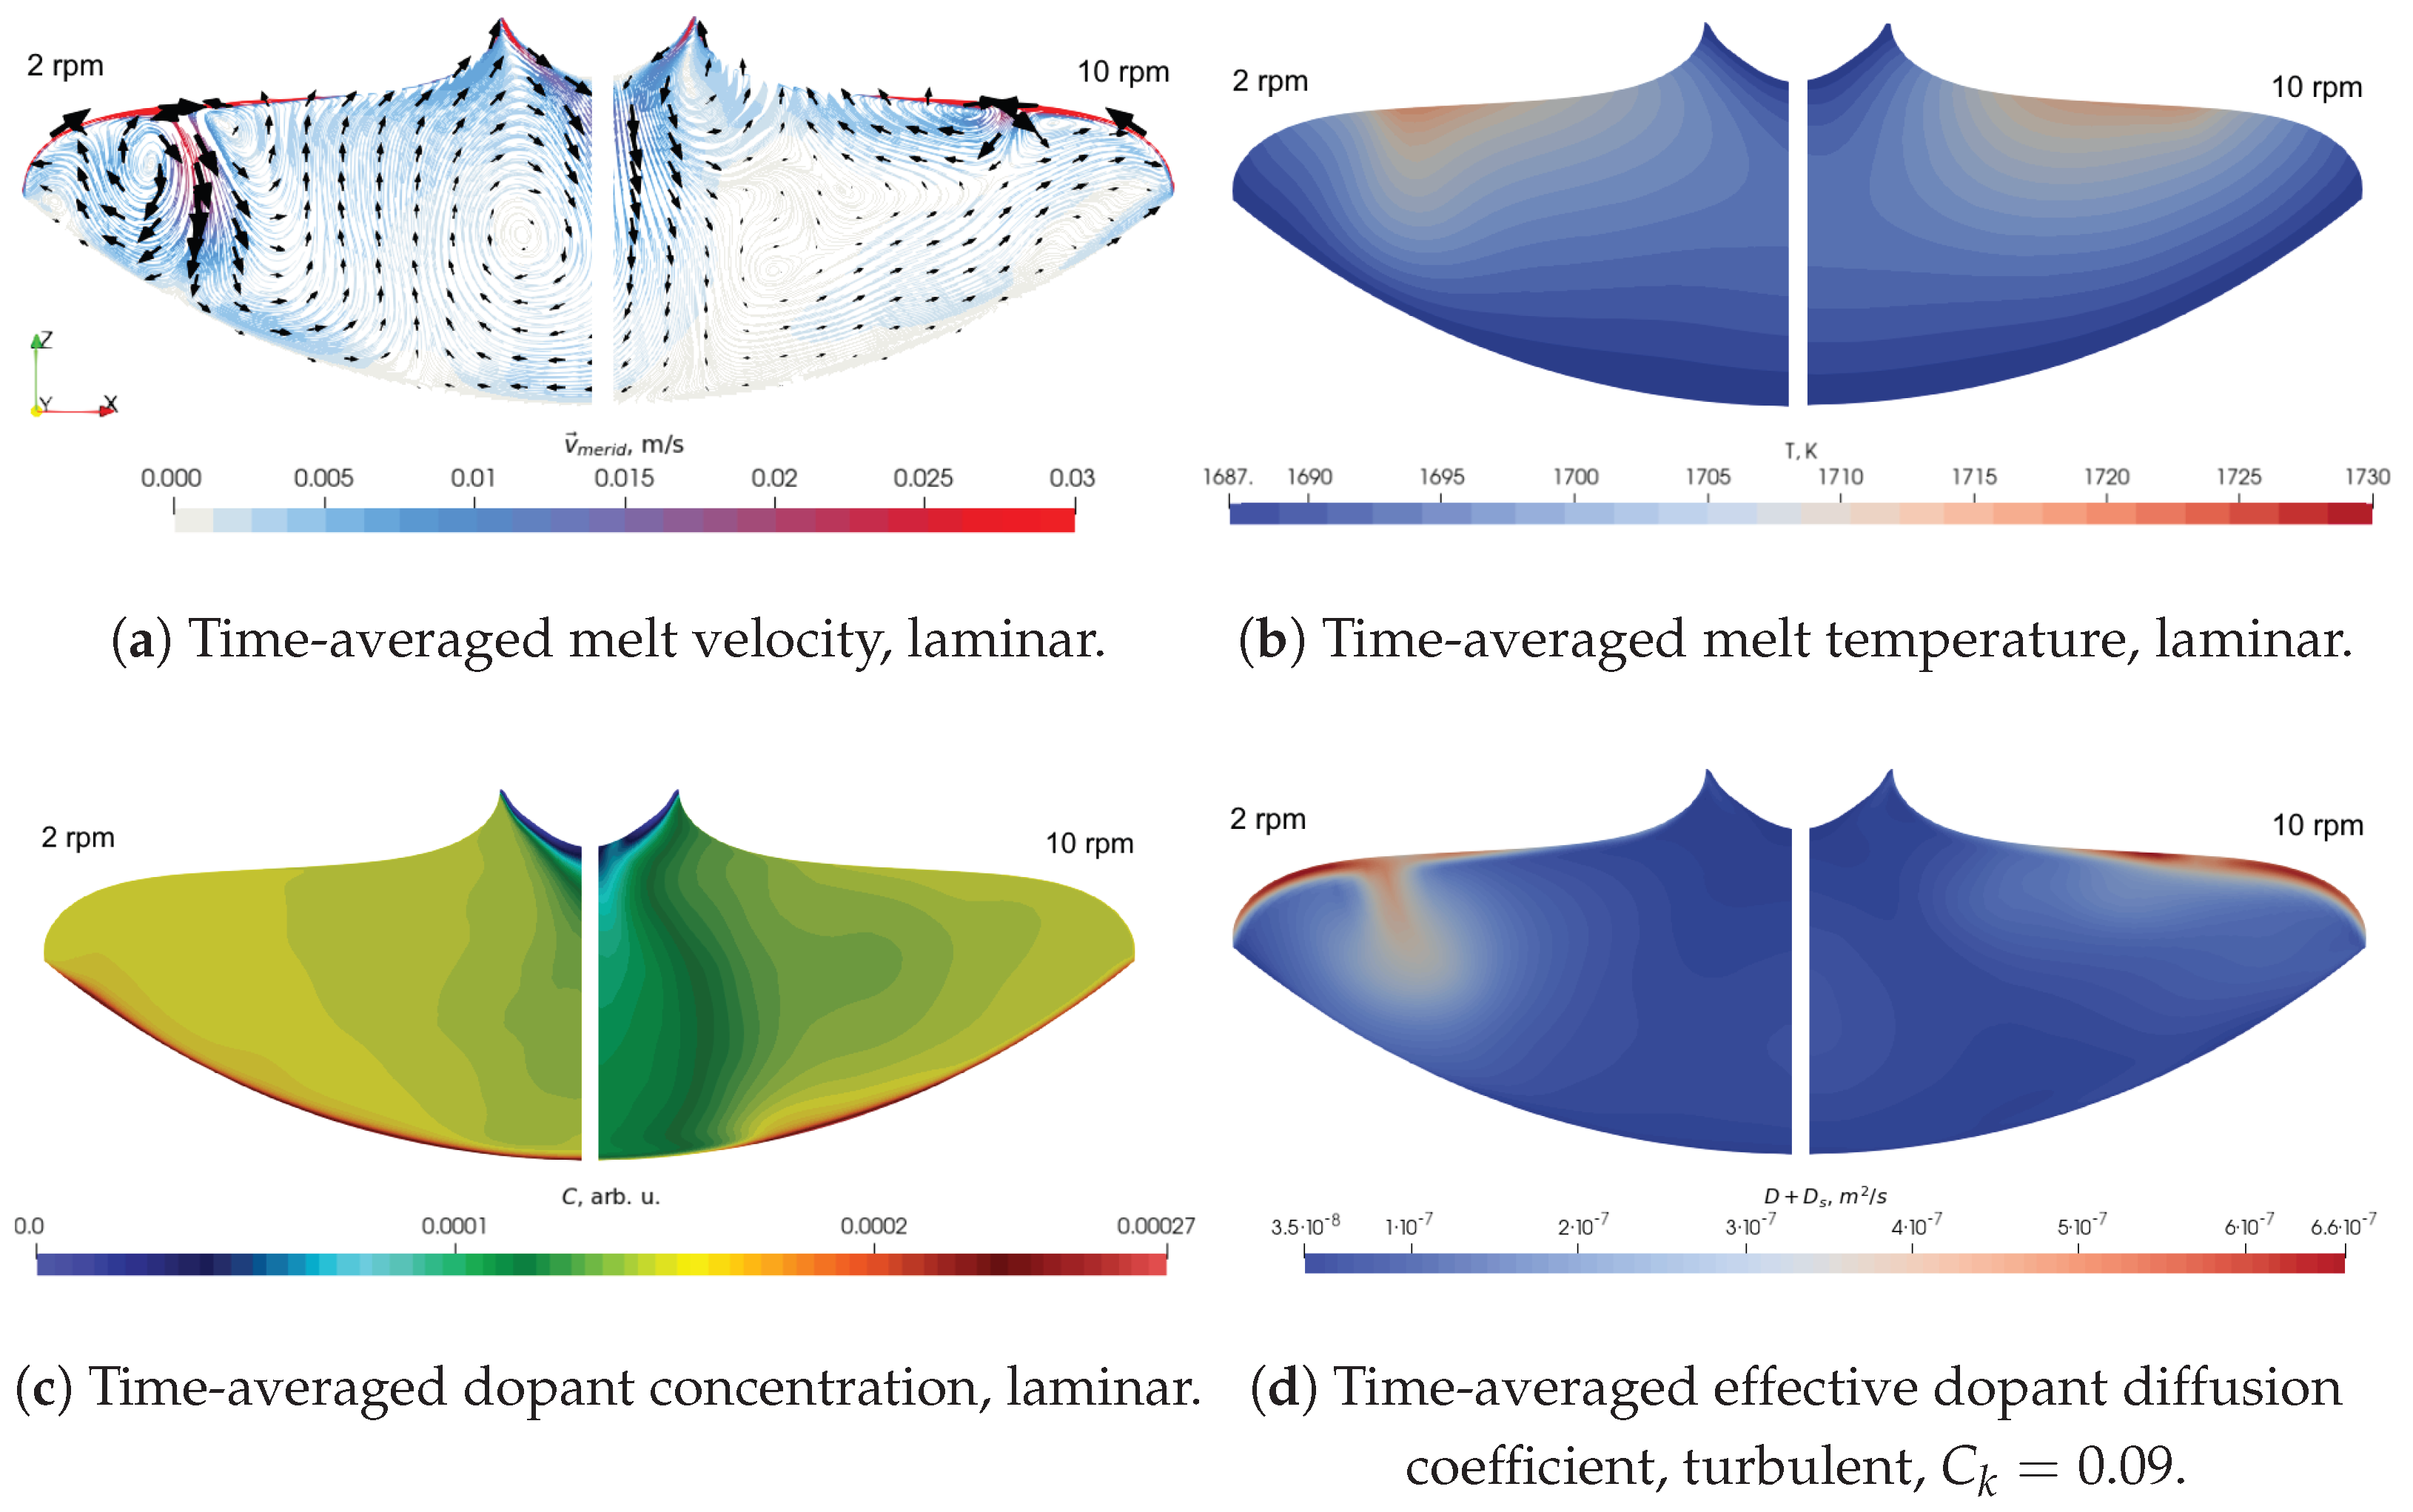
An example of the simulated melt velocity in the vertical plane, below the additional slit of the inductor, is shown in
Figure 4a. When the crystal rotation rate was low (2 rpm, left part of the slice), a large toroidal vortex was created by the EM force, which brought the melt from the free surface downwards. The high rotation rate (10 rpm, right) suppressed meridional motion; therefore, the velocity in the vertical plane was high only near the free surface. Such differences in melt velocity impact the simulated temperature (b) and dopant concentration (c) fields. A strong meridional flow in the case of 2 rpm made the dopant concentration much more homogeneous than in the case of 10 rpm, which was observed further in the crystal resistivity
distributions as well.
Figure 4d depicts an example of an effective dopant diffusion coefficient simulated using the turbulence model described in
Section 3.3.2. The following subsections describe the influence of various material properties on simulated resistivity profiles.
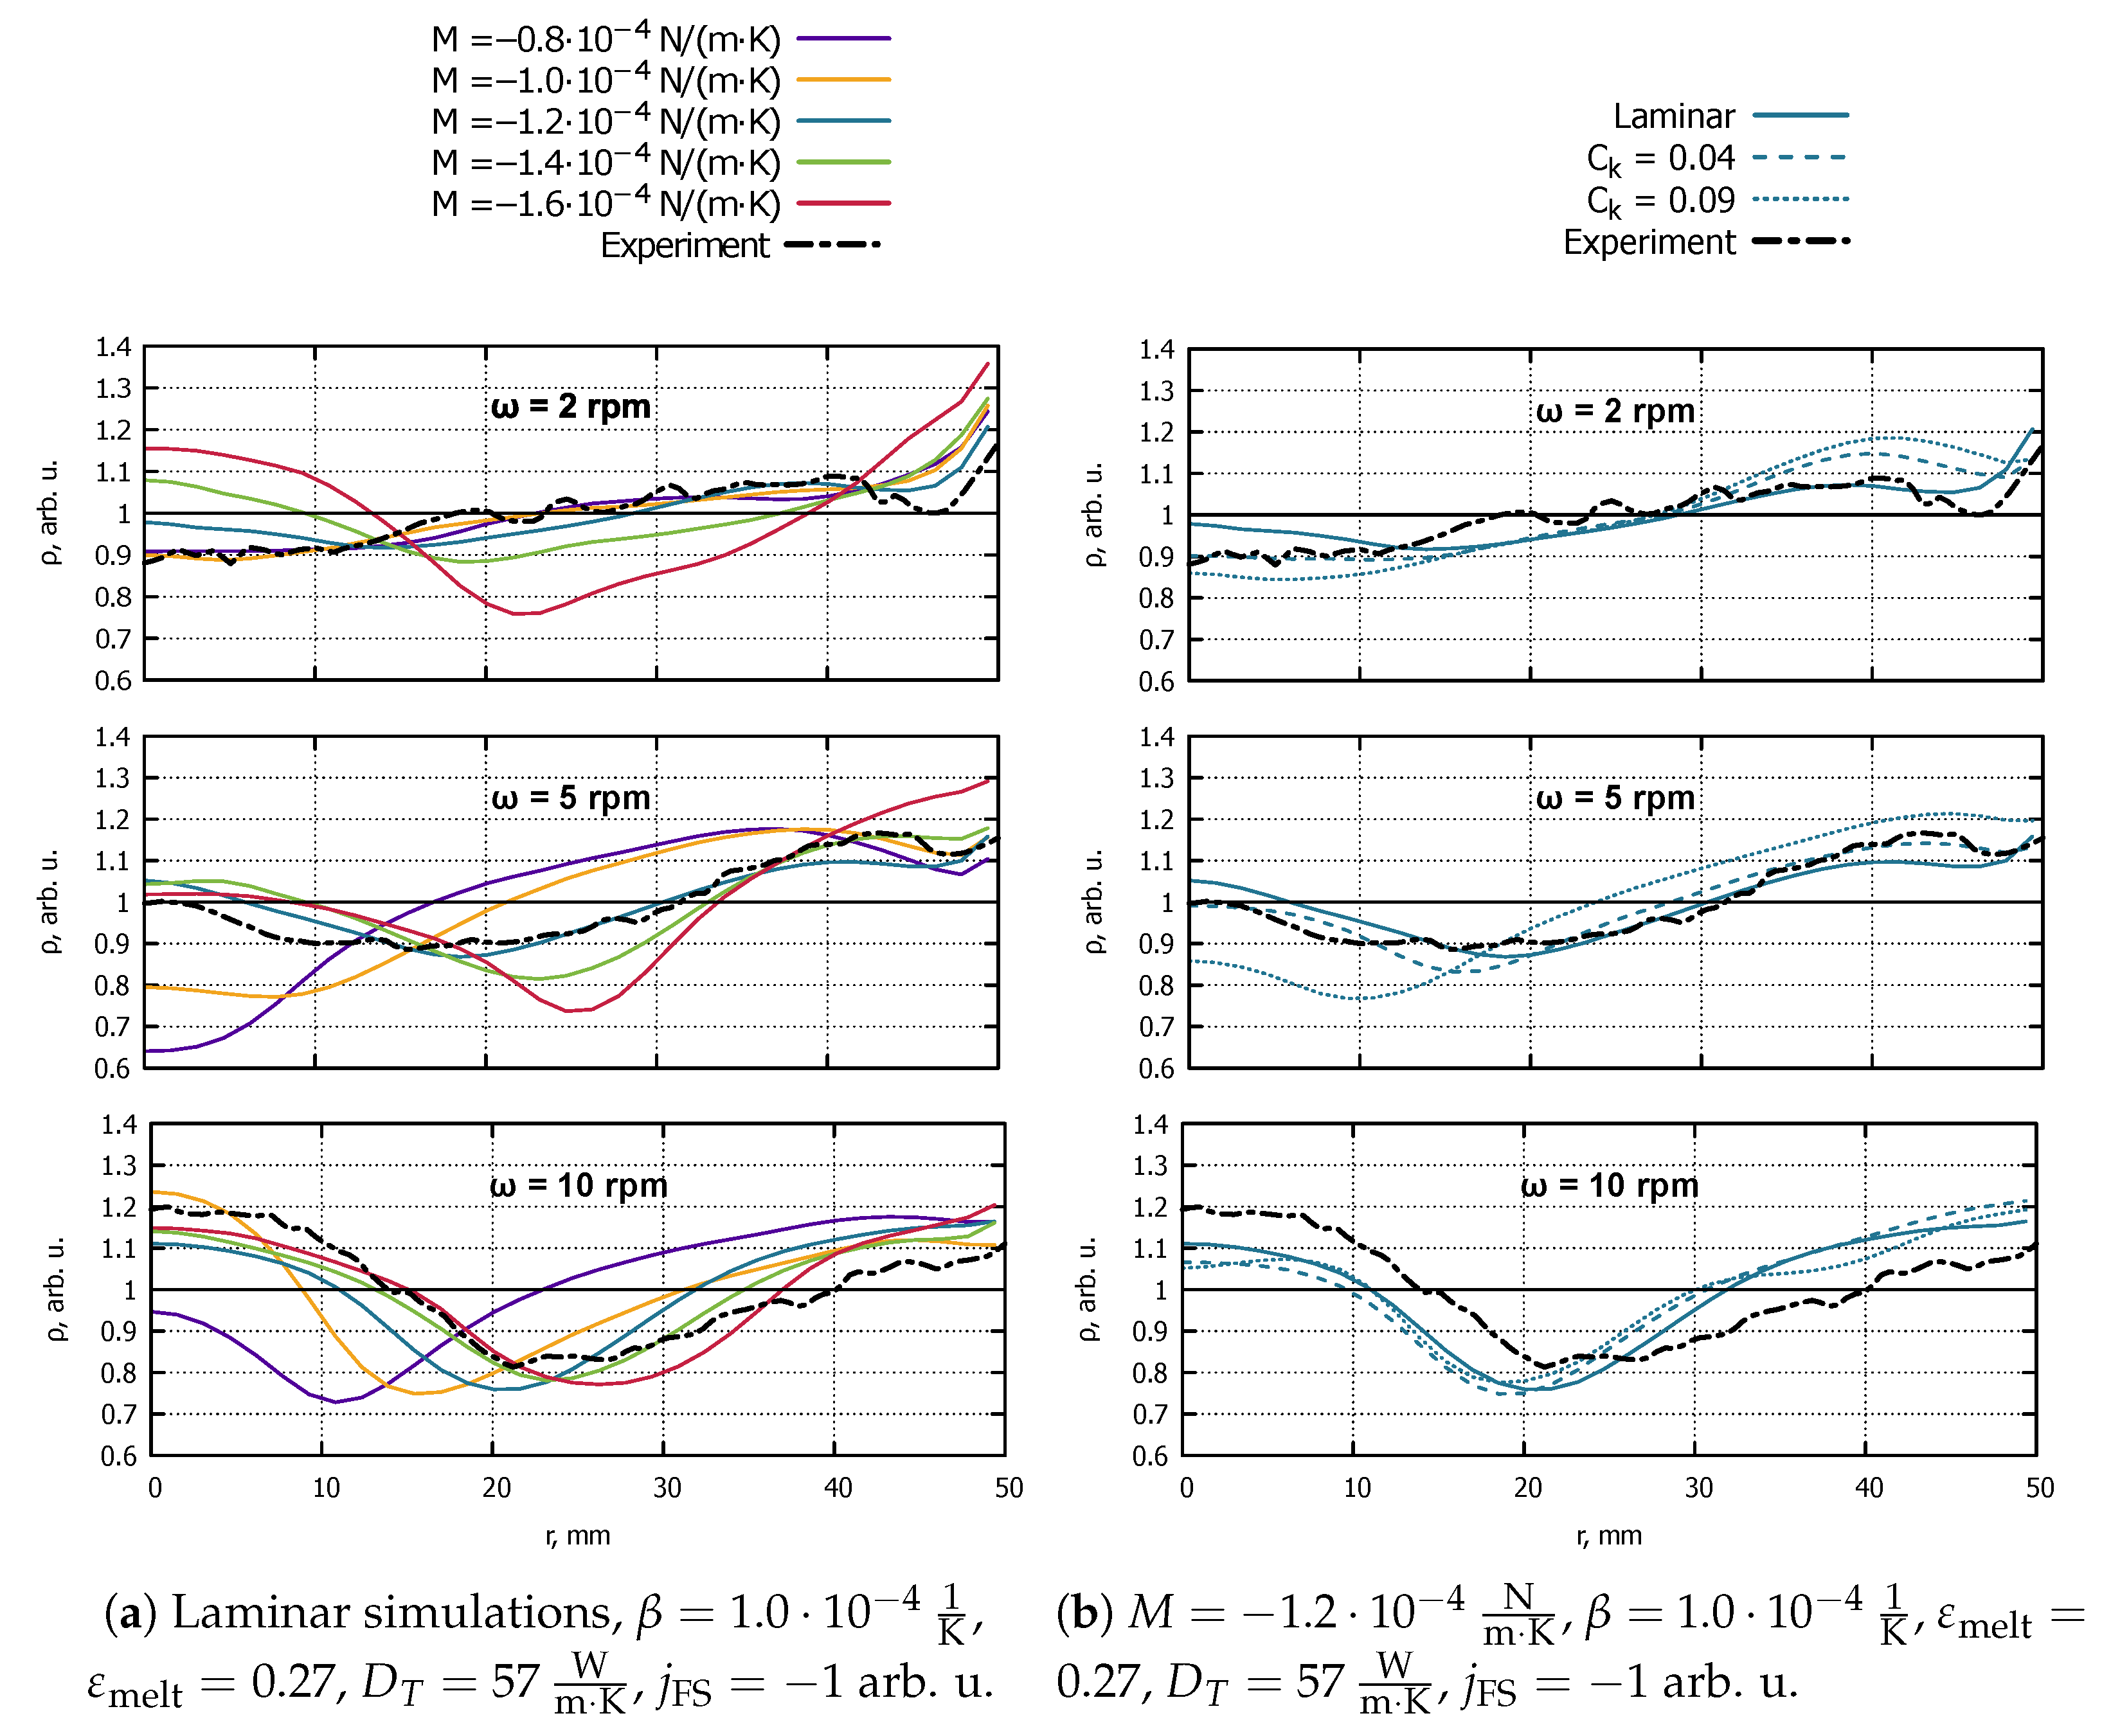
3.3.1. Marangoni Coefficient
Since the value of the Marangoni coefficient
M can vary in a wide range [
30] and was previously predicted to have a large influence on the simulation results [
31], it was tested first. A negative uniform dopant flux
was set on the free surface (e.g., evaporation of dopants was assumed). The simulated radial profiles of crystal resistivity are indeed extremely sensitive on
M, as shown in
Figure 5a. However, this sensitivity depends on crystal rotation rate.
When , which is the lowest of the tested values, resistivity profiles are a minimum in the crystal centre () in cases of 2 rpm and 5 rpm crystal rotation rates and a slight maximum in the case of 10 rpm. When M was increased to , the resistivity in the crystal centre changed by almost 30% in the case of 10 rpm and practically did not change in the case of 2 rpm. The further increase in moved the resistivity minimum “to the right” (i.e., increased its radial coordinate) in all three cases. The best agreement with all three experiments was achieved using .
3.3.2. Turbulence
Si melt flow in the 4″ FZ process can become turbulent. Especially for large crystal rotation rates such as 10 rpm, the Reynolds number exceeds the typical boundary between laminar and turbulent flows:
, where
is the characteristic length (crystal radius) and the maximal velocity
(velocity of the crystal rim). However, turbulence has only very recently started to be considered for FZ Si melt flow, and only one paper has been published about the topic, presenting rather large discrepancies between the simulation and experiment [
32].
To test the influence of turbulence on the numerical results, the LES subgrid-scale (SGS) kinetic energy one-equation model was selected [
9]. It was preferred over Reynolds-averaged Navier–Stokes models because the melt flow is unsteady. To test the influence of the model coefficient
, the value 0.04 (smaller than the standard 0.09) was used as well, since it may be more realistic for melt flow in FZ Si according to [
33]. This coefficient is used to calculate the subgrid (eddy) viscosity
, and consequently subgrid thermal conductivity
and dopant subgrid diffusion coefficient
:
where
is subgrid scale kinetic energy,
—grid filter width,
—turbulent Prandtl number, and
—turbulent Schmidt number. The laminar model is, thus, equivalent to
.
An example of the calculated effective dopant diffusion coefficient
is shown in
Figure 4d, indicating that
near the free surface can be up to 20 times higher than
D if
is used.
Figure 5b demonstrates that the increase in
noticeably decreases resistivity in the crystal centre (a possible explanation is that the central flow jet is being hindered by increased subgrid viscosity), except the case with 10 rpm. In the case of 10 rpm, despite the highest Reynolds number and the highest turbulence intensity on average, melt flow is less dependent on
, possibly because it is dominated by centrifugal forces.
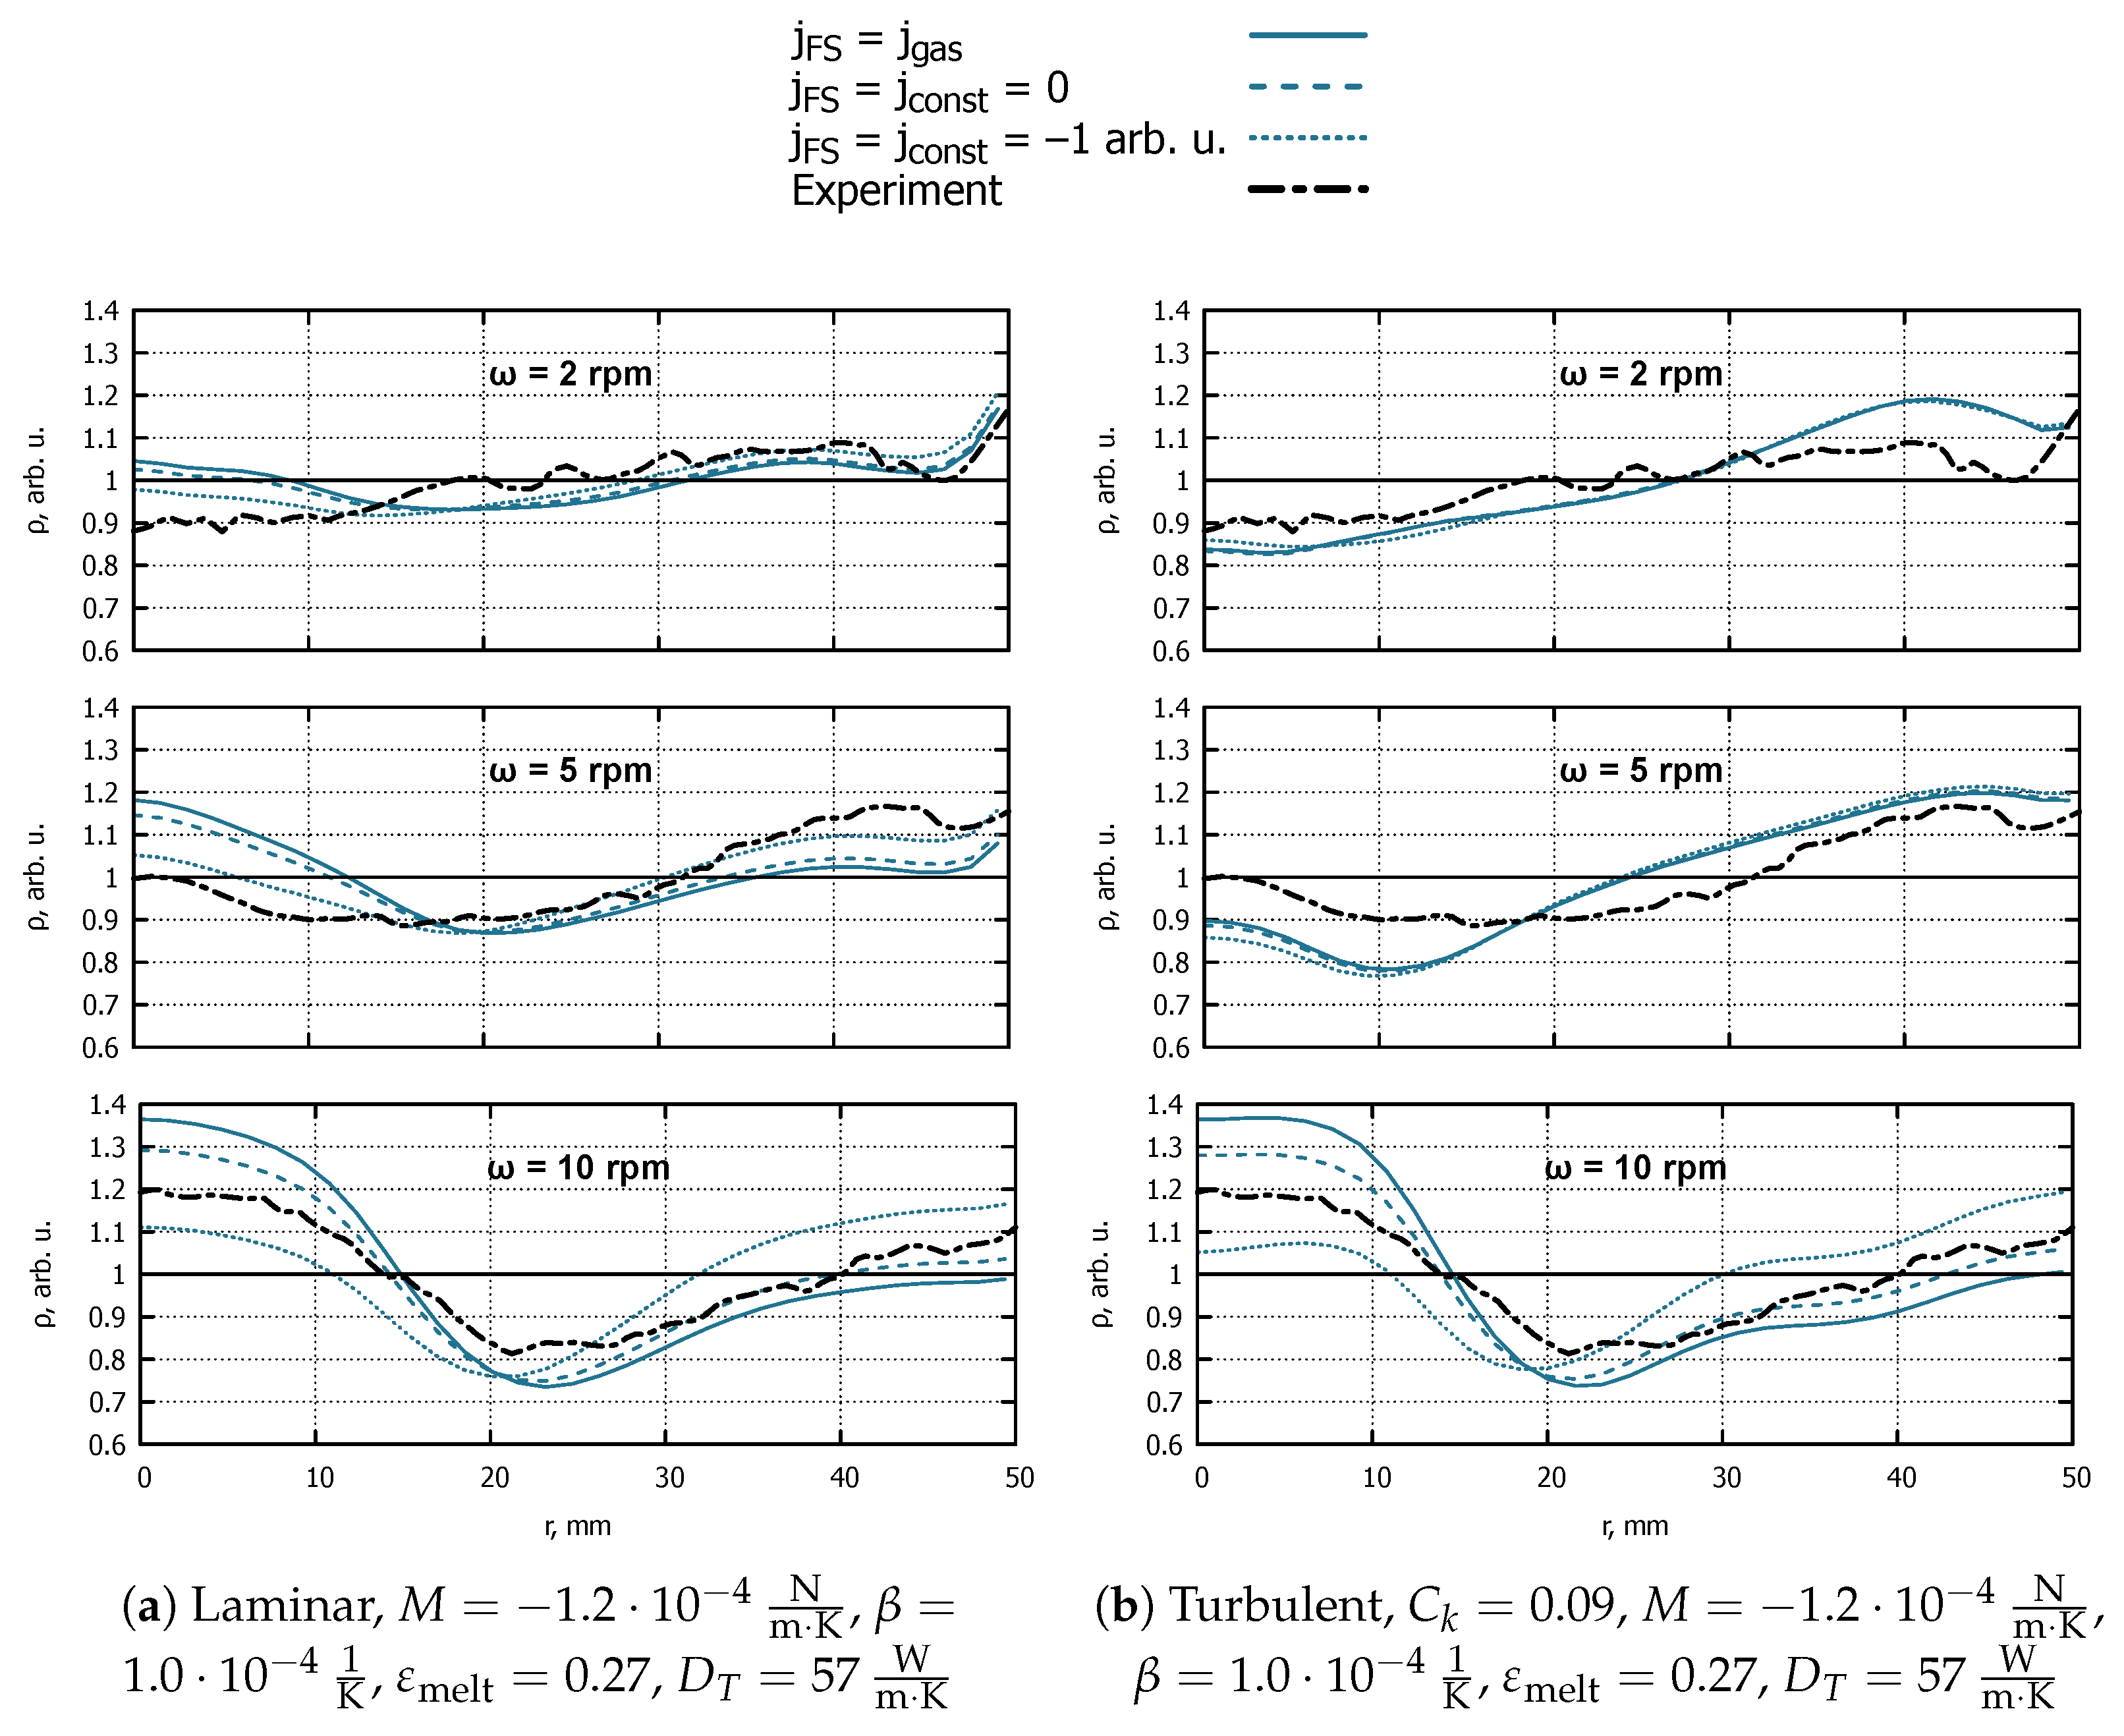
3.3.3. Dopant Flux on the Free Melt Surface
Three boundary conditions were tested for dopant concentration on the free surface:
The resistivity profiles obtained with these boundary conditions are shown in
Figure 6. Negative
, which corresponds to possible dopant evaporation, decreases
C in the outer part of the crystal and increases resistivity, since it is inversely proportional to
C. However, this effect is present for all crystal rotation rates in laminar simulations (a) and only for 10 rpm in the turbulent simulations with
(b).
We have no explanation yet as to why the response on the change of is so different between laminar and turbulent simulations. A hypothesis was proposed that it may be connected to an effective Péclet number, i.e., the ratio between convective transport rate and diffusive transport rate , where L is the characteristic length and is the characteristic flow velocity. However, the analysis showed that Pe depends on significantly more strongly than on , which means that the differences in model sensitivity between the 2 rpm and 5 rpm cases cannot be explained by Pe.
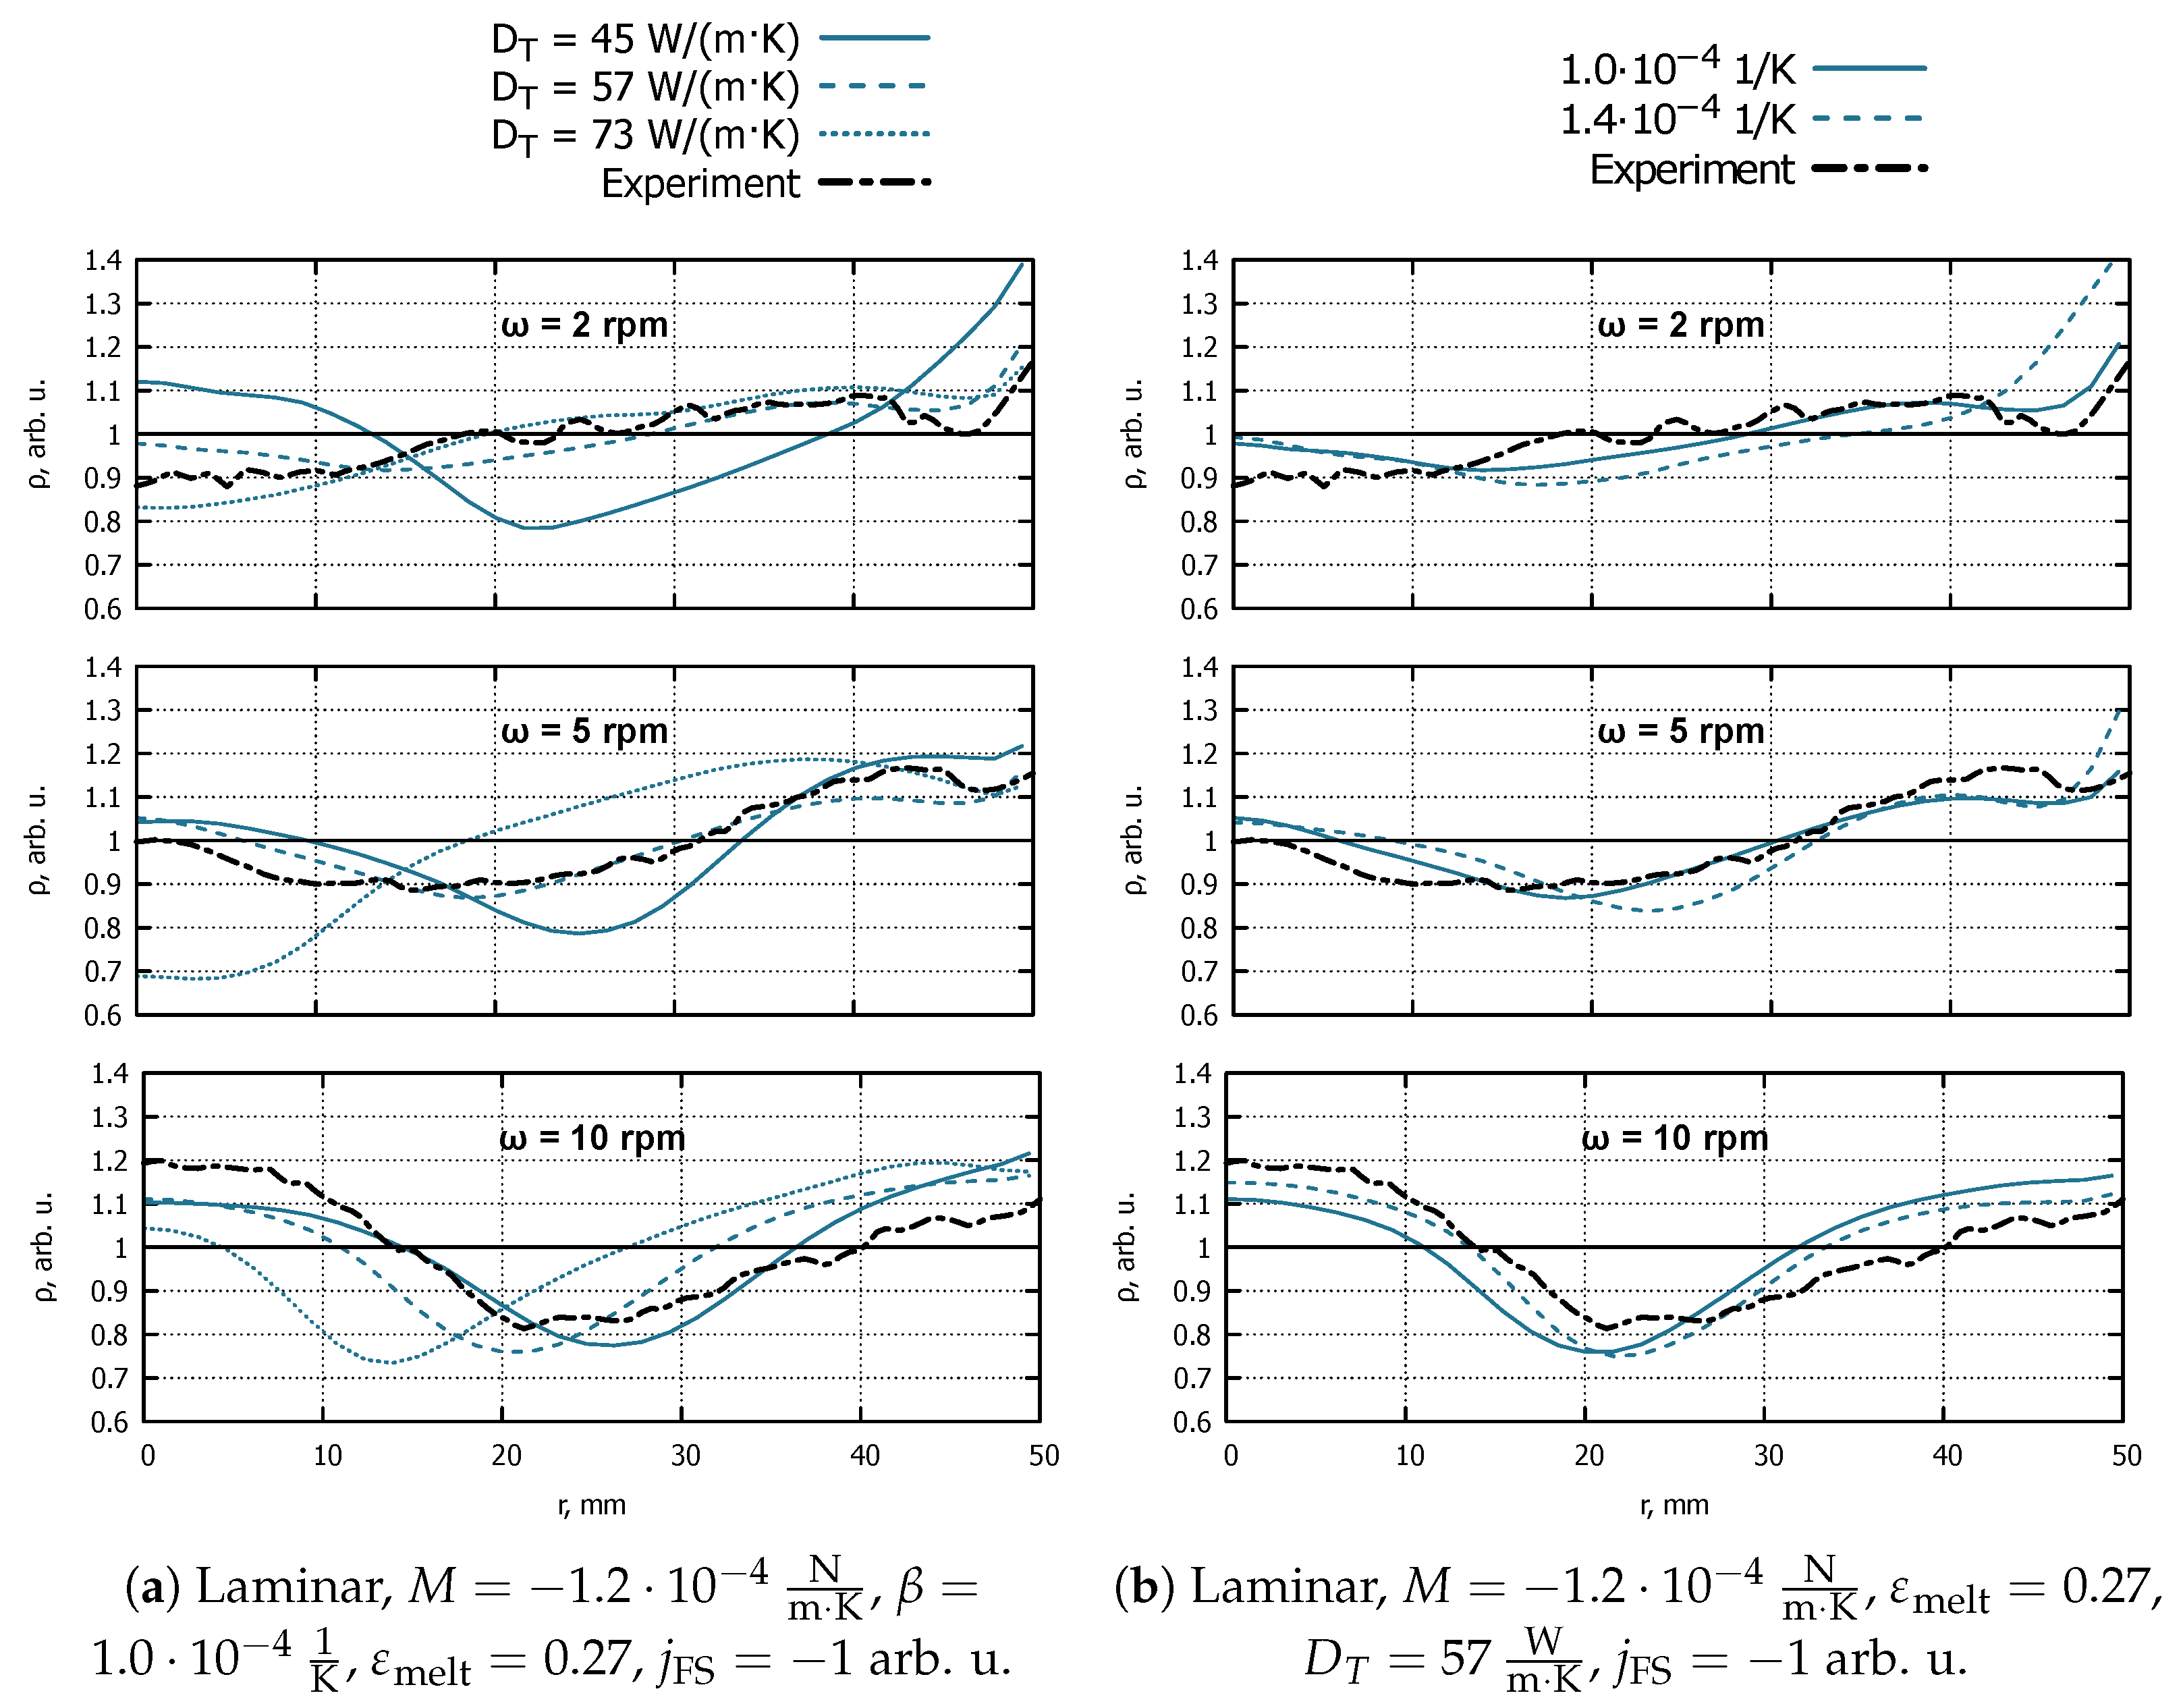
3.3.4. Thermal Conductivity
Figure 7a shows the influence of thermal conductivity
on crystal resistivity profiles. In all cases, the increase in
moves the resistivity minimum to the left. In the case of the lowest rotation rate, it improves agreement with the experiment; however, in the case of the highest rotation rate, it makes the agreement significantly worse.
3.3.5. Thermal Expansion Coefficient
Figure 7b shows the influence of the thermal expansion coefficient
on crystal resistivity profiles. In the case of the lowest rotation rate, an increased
significantly increases resistivity at the crystal rim. In the simulations with a faster crystal rotation, the resistivity minimum moves to the right, worsening agreement with the experiment in the 5 rpm case and slightly improving it in the 10 rpm case. In addition, in the case of
rpm, the resistivity’s minimum value decreases, which is not beneficial for the agreement with experimental values.
3.4. Summary
Due to a very large number of performed simulations, not all of the results are shown here in the form of resistivity profiles. Another measure is introduced instead—the root of the mean square error (RMSE), i.e., the difference between simulated resistivity
and the experimentally measured resistivity
:
where
i is the index of a measurement point and
n is the total number of points in a radial profile. The RMSE of all of the simulations is summarized in
Table 3.
The main trend that stands out considering all of the simulations is that the low values of
are more suitable for the simulation of slow crystal rotation (indicated by green colour in the upper part of the table) and the high
values for fast crystal rotation (lower right corner of the table). It is noticeable in
Figure 5a as well.
Another important observation is that the best agreement with all three experiments simultaneously was obtained with mild turbulence (
), zero dopant flux on the free surface,
, and standard values of other parameters (see simulation with ID 17 in
Table 3). The usage of
allowed us to obtain satisfactory agreement for the non-uniform
as well; see ID 18—this is an important result since
was obtained from gas flow simulations [
3] and, thus, is believed to be the most physically realistic condition. Generally speaking, the introduction of turbulence helped to improve the predictive power of the model for a large
when a moderate
was used.
Another part of the study was performed with lower melt emissivity
instead of the standard value of 0.27. Different shape of phase boundaries was obtained; thus, new 3D mesh was created for melt flow and dopant transport, the summarized results of which are shown in rows with IDs 1, 6, 8, and 10–12 in
Table 3. The decrease in
made the agreement with the 5 rpm and 10 rpm cases noticeably worse, while no improvement was obtained regarding the 2 rpm case.
The changes in thermal conductivity (decreased in row 9, increased in row 22) undermined the agreement with at least one of the experiments. Finally, the increase in , despite being beneficial for the precision of simulations with the largest rotation rate, led to the large disagreement in the case of 2 rpm (ID 23).
4. Discussion
Multiple material properties of silicon are not yet known precisely from the scientific literature. In this work, they were varied and calibrated for the models of phase boundaries and melt flow.
The heat source coefficient on the open melting front was found to be decisive for simulations of phase boundaries—the increased described the neck diameter and the distance from the free surface to the inductor more precisely. The obtained shape of phase boundaries was used in the melt flow and dopant transport simulations.
A significant novelty of this work is that a turbulence model was applied to the melt flow simulations in FZ Si, employing an LES one-equation model. The main factor that influences melt flow and, therefore, radial resistivity profiles in grown crystals is the Marangoni coefficient M. Other material properties with unclear values were calibrated as well: thermal expansion coefficient , liquid silicon heat conductivity , and emissivity . The best agreement in all three experiments with different rotation rates was obtained with , , , , and .
The present work shows that it is not, as it was previously believed [
35], necessary to assume dopant evaporation through the free melt surface. A satisfactory agreement with the experiments with all three crystal rotation rates was obtained using the dopant influx through the free surface in accordance with the dopant transport model in gas. However, it should be kept in mind that the optimal values of material properties may not be the same for different dopant levels or when the crystal is doped with different species.
There are multiple possibilities of further investigations. First, some of the parameters such as and can be recalibrated using the turbulent simulations with dopant influx from gas; since the usage of turbulence seemed promising, other models such as Smagorinsky or wall-adapting local eddy viscosity can be tested as well. Second, a possibility of differences in M between cases with different crystal rotation rates may be considered, e.g., by modelling oxygen transport in the puller. Thirdly, a soluto-capillary effect can be included if gradients of oxygen concentration in melt are found to be significant.
Author Contributions
Conceptualization, K.S. and J.V.; methodology, K.S. and S.L.S.; software, G.R. and S.L.S.; validation, R.M. and S.L.S.; investigation, S.L.S. and R.M.; data curation, S.L.S.; writing—original draft preparation, K.S., S.L.S. and M.S.; writing—review and editing, J.V., G.R., and R.M.; visualization, S.L.S.; supervision, J.V.; project administration, K.S.; funding acquisition, K.S. All authors have read and agreed to the published version of the manuscript.
Funding
This research was funded by University of Latvia, Faculty of Physics, Mathematics and Optometry, grant number Dr.2111-02-02.
Data Availability Statement
The datasets presented in this article are not readily available because of technical limitations.
Acknowledgments
We thank Kathleen Schindler, Iryna Buchovska, and Frank M. Kiessling from IKZ Berlin for their support with the FZ crystal growth experiments and data acquisition.
Conflicts of Interest
Author Gundars Ratnieks was employed by the company Siltronic AG. The remaining authors declare that the research was conducted in the absence of any commercial or financial relationships that could be construed as a potential conflict of interest. The funders had no role in the design of the study; in the collection, analyses, or interpretation of data; in the writing of the manuscript; or in the decision to publish the results.
Abbreviations
The following abbreviations are used in this manuscript:
| FZ | floating zone |
| EM | electromagnetic |
| LES | large-eddy simulation |
| ITP | internal triple point |
| ETP | external triple point |
| RMSE | root of the mean square error |
| SGS | subgrid scale |
References
- Muiznieks, A.; Lacis, K.; Nacke, B. 3D Unsteady Modeling of the Melt Flow in the FZ Silicon Crystal Growth Process. Magnetohydrodynamics 2007, 43, 377–386. [Google Scholar] [CrossRef]
- Han, X.F.; Liu, X.; Nakano, S.; Kakimoto, K. Numerical Analysis of Dopant Concentration in 200 mm (8 inch) Floating Zone Silicon. J. Cryst. Growth 2020, 545, 125752. [Google Scholar] [CrossRef]
- Sabanskis, A.; Surovovs, K.; Virbulis, J. 3D Modeling of Doping From the Atmosphere in Floating Zone Silicon Crystal Growth. J. Cryst. Growth 2017, 457, 65–71. [Google Scholar] [CrossRef]
- Han, X.F.; Liu, X.; Nakano, S.; Harada, H.; Miyamura, Y.; Kakimoto, K. 3D Numerical Analysis of the Asymmetric Three-phase Line of Floating Zone for Silicon Crystal Growth. Crystals 2020, 10, 121. [Google Scholar] [CrossRef]
- Han, X.F.; Liu, X.; Nakano, S.; Harada, H.; Miyamura, Y.; Kakimoto, K. 3D Global Heat Transfer Model on Floating Zone for Silicon Single Crystal Growth. Cryst. Res. Technol. 2018, 53, 1700246. [Google Scholar] [CrossRef]
- Ratnieks, G.; Muižnieks, A.; Mühlbauer, A. Modelling of Phase Boundaries for Large Industrial FZ Silicon Crystal Growth with the Needle-eye Technique. J. Cryst. Growth 2003, 255, 227–240. [Google Scholar] [CrossRef]
- Ratnieks, G.; Muiznieks, A.; Buligins, L.; Raming, G.; Mühlbauer, A.; Lüdge, A.; Riemann, H. Influence of the Three Dimensionality of the HF Electromagnetic Field on Resistivity Variations in Si Single Crystals During FZ Growth. J. Cryst. Growth 2000, 216, 204–219. [Google Scholar] [CrossRef]
- Surovovs, M.; Sjomkane, M.; Virbulis, J.; Ratnieks, G. Numerical modelling of melting front structures during floating zone silicon crystal growth. J. Cryst. Growth 2024, 643, 127788. [Google Scholar] [CrossRef]
- Yoshizawa, A.; Horiuti, K. A Statistically-Derived Subgrid-Scale Kinetic Energy Model for the Large-Eddy Simulation of Turbulent Flows. J. Phys. Soc. Jpn. 1985, 54, 2834–2839. [Google Scholar] [CrossRef]
- Mukai, K.; Yuan, Z. Measurement of the Density of Molten Silicon by a Modified Sessile Drop Method. Mater. Trans. JIM 2000, 41, 323–330. [Google Scholar] [CrossRef]
- Henins, I. Precision Density Measurement of Silicon. J. Res. Natl. Bur. Stand. A Phys. Chem. 1964, 68, 529–533. [Google Scholar] [CrossRef] [PubMed]
- Sasaki, H.; Tokizaki, E.; Huang, X.M.; Terashima, K.; Shigeyuki Kimura, S.K. Temperature Dependence of the Viscosity of Molten Silicon Measured by the Oscillating Cup Method. Jpn. J. Appl. Phys. 1995, 34, 3432. [Google Scholar] [CrossRef]
- Assael, M.J.; Armyra, I.J.; Brillo, J.; Stankus, S.V.; Wu, J.; Wakeham, W.A. Reference Data for the Density and Viscosity of Liquid Cadmium, Cobalt, Gallium, Indium, Mercury, Silicon, Thallium, and Zinc. J. Phys. Chem. Ref. Data 2012, 41, 033101. [Google Scholar] [CrossRef]
- Assael, M.J.; Antoniadis, K.D.; Wakeham, W.A.; Huber, M.L.; Fukuyama, H. Reference Correlations for the Thermal Conductivity of Liquid Bismuth, Cobalt, Germanium, and Silicon. J. Phys. Chem. Ref. Data 2017, 46, 033101. [Google Scholar] [CrossRef] [PubMed]
- Chase, M. NIST-JANAF Themochemical Tables, Fourth Edition. J. Phys. Chem. Ref. Data 1998, 9, 1–1951. [Google Scholar]
- Rhim, W.K.; Ohsaka, K. Thermophysical Properties Measurement of Molten Silicon by High-Temperature Electrostatic Levitator: Density, Volume Expansion, Specific Heat Capacity, Emissivity, Surface Tension and Viscosity. J. Cryst. Growth 2000, 208, 313–321. [Google Scholar] [CrossRef]
- Langen, M.; Hibiya, T.; Eguchi, M.; Egry, I. Measurement of the Density and the Thermal Expansion Coefficient of Molten Silicon Using Electromagnetic Levitation. J. Cryst. Growth 1998, 186, 550–556. [Google Scholar] [CrossRef]
- Takasuka, E.; Tokizaki, E.; Terashima, K.; Kimura, S. Emissivity of Liquid Silicon in Visible and Infrared Regions. J. Appl. Phys. 1997, 81, 6384–6389. [Google Scholar] [CrossRef]
- Yu, K.; Zhang, H.; Liu, Y.; Liu, Y. Study of Normal Spectral Emissivity of Copper during Thermal Oxidation at Different Temperatures and Heating Times. Int. J. Heat Mass Transf. 2019, 129, 1066–1074. [Google Scholar] [CrossRef]
- Wünscher, M.; Lüdge, A.; Riemann, H. Growth Angle and Melt Meniscus of the RF-heated Floating Zone in Silicon Crystal Growth. J. Cryst. Growth 2011, 314, 43–47. [Google Scholar] [CrossRef]
- Homa, M.; Sobczak, N. Measurements of Temperature and Heat of Phase Transformation of Pure Silicon by Using Differential Scanning Calorimetry. J. Therm. Anal. Calorim. 2019, 138, 4215–4221. [Google Scholar] [CrossRef]
- Sasaki, H.; Ikari, A.; Terashima, K.; Kimura, S. Temperature Dependence of the Electrical Resistivity of Molten Silicon. Jpn. J. Appl. Phys. 1995, 34, 3426. [Google Scholar] [CrossRef]
- Eustathopoulos, N.; Drevet, B. Surface Tension of Liquid Silicon: High or Low Value? J. Cryst. Growth 2013, 371, 77–83. [Google Scholar] [CrossRef]
- Mills, C.; Courtney, L. Thermophysical Properties of Silicon. ISIJ Int. 2000, 40, 130–138. [Google Scholar] [CrossRef] [PubMed]
- Fan, S.; Plascencia, G.; Utigard, T. High Temperature Electric Conductivity of Pure Silicon. Can. Metall. Q. 2008, 47, 509–512. [Google Scholar] [CrossRef]
- Kodera, H. Diffusion Coefficients of Impurities in Silicon Melt. Jpn. J. Appl. Phys. 1963, 2, 212. [Google Scholar] [CrossRef]
- Garandet, J.P. New Determinations of Diffusion Coefficients for Various Dopants in Liquid Silicon. Int. J. Thermophys. 2007, 28, 1285–1303. [Google Scholar] [CrossRef]
- Sze, S.; Lee, M. Semiconductor Devices: Physics and Technology; John Wiley & Sons, Inc.: Hoboken, NJ, USA, 2012; p. 361. [Google Scholar]
- Rost, H.J.; Menzel, R.; Luedge, A.; Riemann, H. Float-Zone Silicon Crystal Growth at Reduced RF Frequencies. J. Cryst. Growth 2012, 360, 43–46. [Google Scholar] [CrossRef]
- Mukai, K.; Yuan, Z.; Nogi, K.; Hibiya, T. Effect of the Oxygen Partial Pressure on the Surface Tension of Molten Silicon and Its Temperature Coefficient. ISIJ Int. 2000, 40, S148–S152. [Google Scholar] [CrossRef] [PubMed]
- Hibiya, T.; Asai, Y.; Sumiji, M.; Kojima, T. Effect of oxygen partial pressure on silicon single crystal growth by floating zone technique: Surface oxidation and Marangoni flow. Cryst. Res. Technol. 2003, 38, 619–626. [Google Scholar] [CrossRef]
- Yan, D.; Wang, Y.; Shang, R.; Zhang, G. Effect of Crystal Rotation on Melt Convection and Resistivity Distribution in 200 mm Floating Zone Silicon Single Crystal Growth. ACS Omega 2024, 9, 41629–41635. [Google Scholar] [CrossRef] [PubMed]
- Winkler, C.; Rani, S. Evaluation of Subgrid Scale Kinetic Energy Models in Large Eddy Simulations of Turbulent Channel Flow. Int. J. Numer. Methods Heat Fluid Flow 2006, 16, 226–239. [Google Scholar] [CrossRef]
- Li, P.; Wang, Z.; Shi, S.; Ren, S.; Jiang, D.; Li, J.; Ul Huda Asghar, H.N.; Tan, Y. Distribution of Phosphorus in n-Type Multicrystalline Silicon Produced by Directional Solidification. IEEE J. Photovoltaics 2018, 8, 1486–1493. [Google Scholar] [CrossRef]
- Strozevs, S.; Surovovs, K.; Virbulis, J. Effect of Dopant Boundary Conditions on Crystal Resistivity During Floating Zone Growth of Silicon Crystals. In Proceedings of the 9th International Scientific Colloquium “Modelling for Materials Processing”, Riga, Latvia, 18–19 September 2023; p. 122. [Google Scholar] [CrossRef]
Figure 1.
The axisymmetric scheme of the FZ method, providing the names of phase boundaries and geometrical parameters.
Figure 1.
The axisymmetric scheme of the FZ method, providing the names of phase boundaries and geometrical parameters.
Figure 2.
The shape of phase boundaries obtained in FZone simulations. (a) Different zone heights in simulations with , , °, . (b) Different parameters in simulations with mm, , °, . (c) Different surface tension coefficients in simulations with mm, , °, . (d) Different free surface angles and melt conductivities in simulations with mm, , .
Figure 3.
The finite volume mesh for 3D melt flow simulations.
Figure 3.
The finite volume mesh for 3D melt flow simulations.
Figure 4.
The influence of the change in the crystal rotation rate from 2 rpm (left) to 10 rpm (right) on physical fields, averaged over 200 s—melt velocity projection on the vertical plane (a), temperature (b), dopant concentration (c), and effective dopant diffusion coefficient (d)—in a vertical slice and obtained with , , , , .
Figure 5.
The influence of the Marangoni coefficient M (a) and turbulence parameter (b) on normalized resistivity profiles, simulated with different values of the crystal rotation rate .
Figure 5.
The influence of the Marangoni coefficient M (a) and turbulence parameter (b) on normalized resistivity profiles, simulated with different values of the crystal rotation rate .
Figure 6.
The influence of dopant flux on normalized resistivity profiles obtained with a different crystal rotation rate using the laminar model (a) and turbulence model with (b).
Figure 6.
The influence of dopant flux on normalized resistivity profiles obtained with a different crystal rotation rate using the laminar model (a) and turbulence model with (b).
Figure 7.
The influence of heat conductivity (a) and thermal expansion coefficient (b) on normalized resistivity profiles, simulated with different values of the crystal rotation rate .
Figure 7.
The influence of heat conductivity (a) and thermal expansion coefficient (b) on normalized resistivity profiles, simulated with different values of the crystal rotation rate .
Table 1.
Material properties of silicon (top part) and phosphorus (bottom part) that were used for the numerical modelling.
Table 1.
Material properties of silicon (top part) and phosphorus (bottom part) that were used for the numerical modelling.
| Parameter | Value | Uncertainty | Reference |
|---|
| Solid silicon density , | 2329 | <5% | [11] |
| Liquid silicon density , | 2580 | <5% | [10] |
| Viscosity , | | 2.25–3.5 | [12,13] |
| Liquid silicon heat conductivity , | 57 | 45–73 | [14] |
| Solid silicon specific heat capacity , | 1032 | 786–1032 | [15] |
| Liquid silicon specific heat capacity , | 1000 | 857–1000 | [16] |
| Thermal expansion coefficient , | | 1.0–2.6 | [16,17] |
| Liquid silicon emissivity | 0.27 | 0.21–0.30 | [16,18] |
| Inductor emissivity | 0.1 | 0.05–0.7 | [19] |
| Surface angle for cylindrical crystal , ° | 11 | 9–13 | [20] |
| Latent crystallization heat , | | <5% | [21] |
| Liquid silicon electric conductivity , | | 1.2–1.4 | [22] |
| Surface tension , | 0.88 | 0.7–0.88 | [16,23] |
| Marangoni coefficient , | | 0.8–7.0 | [23] |
| Solid silicon heat conductivity , | Temperature-dependent according to [24] |
| Solid silicon electric conductivity , | Temperature-dependent according to [25] |
| Phosphorus diffusivity in silicon D, | | 2.3– | [26,27] |
| Phosphorus segregation coefficient | 0.35 | <5% | [28] |
Table 2.
Summary of independent (top) and process-dependent (bottom) experiment variables.
Table 2.
Summary of independent (top) and process-dependent (bottom) experiment variables.
| Parameter | Value |
|---|
| Crystal diameter , mm | 102 |
| Crystal rotation rate , rpm | 2–10 |
| Crystal pulling rate , | 3.5 |
| Feed rod diameter , mm | 94–102 |
| Feed rod rotation rate , rpm | |
| Feed rod push rate , | 3.5–3.9 |
| Inductor frequency f, MHz | 3 |
| Zone height , mm | 28–34 |
| Lower zone height , mm | 10–11 |
| ITP radius , mm | 7.5–8.5 |
Table 3.
The summary of RMSE—a measure of disagreement—comparing radial resistivity profiles obtained in simulations and experiments for different crystal rotation rate values. M is given in , in , in in , in arb. u., while and are dimensionless.
Table 3.
The summary of RMSE—a measure of disagreement—comparing radial resistivity profiles obtained in simulations and experiments for different crystal rotation rate values. M is given in , in , in in , in arb. u., while and are dimensionless.
| | Simulation Parameters | | RMSE, % for |
|---|
| ID | | | | | | | 2 rpm | 5 rpm | 10 rpm |
|---|
| 1 | | 1.0 | 57 | 0.21 | 0 | | 4.0 | 9.5 | 23.2 |
| 2 | | 1.0 | 57 | 0.27 | 0 | | 4.4 | 16.0 | 21.7 |
| 3 | | 1.0 | 57 | 0.27 | 0 | | 4.8 | 15.8 | 18.5 |
| 4 | | 1.0 | 57 | 0.27 | 0.09 | | 2.9 | 13.1 | 17.2 |
| 5 | | 1.0 | 73 | 0.27 | 0 | | 3.9 | 16.4 | 22.9 |
| 6 | | 1.0 | 57 | 0.21 | 0.04 | | 4.8 | 5.3 | 11.6 |
| 7 | | 1.0 | 57 | 0.27 | 0 | | 4.0 | 11.2 | 11.3 |
| 8 | | 1.0 | 57 | 0.21 | 0.04 | | 3.4 | 8.9 | 9.4 |
| 9 | | 1.0 | 45 | 0.27 | 0 | | 16.7 | 7.7 | 6.9 |
| 10 | | 1.0 | 57 | 0.21 | 0 | | 5.0 | 12.1 | 9.2 |
| 11 | | 1.0 | 57 | 0.21 | 0.04 | | 4.4 | 18.4 | 9.2 |
| 12 | | 1.0 | 57 | 0.21 | 0.09 | | 4.8 | 9.1 | 18.5 |
| 13 | | 1.0 | 57 | 0.27 | 0 | | 4.6 | 3.8 | 9.3 |
| 14 | | 1.0 | 57 | 0.27 | 0 | | 6.2 | 8.8 | 5.7 |
| 15 | | 1.0 | 57 | 0.27 | 0 | | 7.2 | 10.8 | 9.5 |
| 16 | | 1.0 | 57 | 0.27 | 0.04 | | 4.8 | 3.1 | 11.9 |
| 17 | | 1.0 | 57 | 0.27 | 0.04 | | 4.6 | 4.3 | 5.3 |
| 18 | | 1.0 | 57 | 0.27 | 0.04 | | 4.7 | 5.2 | 8.1 |
| 19 | | 1.0 | 57 | 0.27 | 0.09 | | 7.1 | 9.4 | 10.1 |
| 20 | | 1.0 | 57 | 0.27 | 0.09 | | 7.2 | 8.2 | 6.2 |
| 21 | | 1.0 | 57 | 0.27 | 0.09 | | 7.2 | 7.7 | 10.8 |
| 22 | | 1.0 | 73 | 0.27 | 0 | | 4.0 | 15.1 | 18.1 |
| 23 | | 1.4 | 57 | 0.27 | 0 | | 10.8 | 6.3 | 5.7 |
| 24 | | 1.0 | 57 | 0.27 | 0 | | 10.4 | 6.1 | 5.5 |
| 25 | | 1.0 | 57 | 0.27 | 0 | | 18.3 | 9.4 | 6.0 |
| 26 | | 1.0 | 57 | 0.27 | 0.09 | | 30.3 | 24.0 | 13.0 |
| 27 | | 1.0 | 57 | 0.27 | 0.09 | | 37.2 | 30.0 | 17.9 |
| Disclaimer/Publisher’s Note: The statements, opinions and data contained in all publications are solely those of the individual author(s) and contributor(s) and not of MDPI and/or the editor(s). MDPI and/or the editor(s) disclaim responsibility for any injury to people or property resulting from any ideas, methods, instructions or products referred to in the content. |
© 2025 by the authors. Licensee MDPI, Basel, Switzerland. This article is an open access article distributed under the terms and conditions of the Creative Commons Attribution (CC BY) license (https://creativecommons.org/licenses/by/4.0/).


 ,
, 

