Article

Temperature-Controlled Defective Phononic Crystals with Shape Memory Alloys for Tunable Ultrasonic Sensors

Department of Mechanical, Robotics and Energy Engineering, Dongguk University, Seoul 04620, Republic of Korea
Crystals 2025, 15(5), 412; https://doi.org/10.3390/cryst15050412
Submission received: 5 March 2025 / Revised: 15 April 2025 / Accepted: 27 April 2025 / Published: 28 April 2025
(This article belongs to the Special Issue Research and Applications of Acoustic Metamaterials)

Abstract

Phononic crystals (PnCs) have garnered significant interest owing to their ability to manipulate wave propagation, particularly through phononic band gaps and defect modes. However, conventional defective PnCs are limited by their fixed defect-band frequencies, which restricts their adaptability to dynamic environments. This study introduces a novel approach for temperature-controlled tunability of defective PnCs by integrating shape memory alloys (SMAs) into defect regions. The reversible phase transformations of SMAs, driven by temperature variations, induce significant changes in their mechanical properties, enabling real-time adjustment of defect-band frequencies. An analytical model is developed to predict the relationship between the temperature-modulated material properties and defect-band shifts, which is validated through numerical simulations. The results demonstrate that defect-band frequencies can be dynamically controlled within a specified range, thereby enhancing the operational bandwidth of the ultrasonic sensors. Additionally, sensing-performance analysis confirms that while defect-band frequencies shift with temperature, the output voltage of the sensors remains stable, ensuring reliable sensitivity across varying conditions. This study represents a significant advancement in tunable PnC technology, paving the way for next-generation ultrasonic sensors with enhanced adaptability and reliability in complex environments.

1. Introduction

In recent years, phononic crystals (PnCs) have emerged as a topic of considerable interest in the scientific and engineering community [1,2,3]. These engineered structures, composed of periodically arranged unit cells, enable the manifestation of wave-propagation phenomena that are not observed in natural systems. A notable example is a phononic band gap, which is the frequency range in which all incident waves are completely reflected [4,5]. The deliberate introduction of localized disruptions to the periodicity of PnCs leads to the formation of defective PnCs, which exhibit a phenomenon termed defect-band formation [6]. At defect-band frequencies, incident waves become spatially localized and exhibit amplified energy within the defect region, a phenomenon termed defect-mode-enabled energy localization [7,8,9].
The exploration of defective PnCs has advanced through diverse approaches, leading to substantial improvements in modeling and design strategies. Analytical models have been developed to efficiently predict wave-localization properties, providing rapid insights that are particularly valuable during the early stages of analysis [10,11,12]. In addition, numerical modeling techniques have been employed to simulate PnCs with complex geometries [13,14,15]. These advancements have enabled the development of innovative designs that enhance wave-localization performance and broaden the operational frequency range of PnCs [16,17,18]. Concurrently, structural optimization techniques have been employed to enhance the design of defective PnCs [19,20]. These methods minimize/maximize specific objectives while adhering to rigorous design constraints, thereby ensuring both practicality and high performance. Recent advancements in computational hardware and the proliferation of open-source tools have created new opportunities for integrating artificial intelligence into the design process. This integration has enabled the automated generation of optimized PnC configurations tailored to unique design requirements, significantly reducing reliance on manual intervention.
Defective PnCs have significant potential for use in advanced technologies, such as highly sensitive ultrasonic sensors, ultrasonic actuators, and efficient energy-harvesting devices. The implementation of ultrasonic sensors and actuators enables the execution of nondestructive evaluation and prognostic health management, thereby facilitating real-time monitoring of the system’s health conditions. Furthermore, energy-harvesting devices have the potential to facilitate the sustainable powering of Internet-of-Things (IoT) sensors. However, their effectiveness is constrained to predefined frequencies. When the excitation frequency deviates significantly from one defect-band frequency, defective PnCs no longer exhibit energy-localized behavior. Instead, they manifest band-gap characteristics, resulting in complete wave reflection. For example, in the context of rotating machines in the field of prognostics and health management [21,22], fault-mode-relevant frequencies are newly generated in the frequency spectrum of the system. Of particular significance is the direct association between these frequencies and the rotational frequency of the rotating body. However, fluctuations in these frequencies are attributed to variations in the operating conditions of the machinery [23,24]. If a defective PnC is optimized for a specific initial frequency, its performance is susceptible to these variations, resulting in reduced effectiveness under dynamic conditions. This underscores the need for methodologies or designs that enable external tuning of defect bands. Such tunable strategies can enhance the practicality of defective PnCs, thereby expanding their applicability to dynamic and unpredictable environments.
Despite the nascent state of research in this domain, a literature review reveals several tunable strategies that can be broadly categorized into three primary approaches. The first approach involves installing an elastic foundation on the exterior of a generic defective PnC (Ref. [25]). In instances in which a defective PnC has been predesigned, its defect bands can be adjusted by modifying the effective stiffness of the unit cells and defects according to the externally controlled stiffness value. However, this method requires a cumbersome process to attach and detach the elastic foundation, which presents a practical limitation. To address this challenge, Ref. [26] introduces a methodology utilizing steel beams and permanent magnet blocks to construct defective PnCs. These materials are selected based on their capacity to attach via magnetic forces, thereby obviating the need for mechanical bonding. Consequently, the permanent magnet blocks can be readily repositioned. However, this approach lacks automation and relies on manual labor, which constitutes a substantial drawback. To overcome these limitations, a third approach is to utilize piezoelectric materials and electrical circuits. In Refs [27,28], piezoelectric materials are attached to defects and coupled with synthetic negative capacitors and inductors. By tuning the parameters of the associated electrical circuits, existing defect bands can be altered, or new electrically controllable defect bands can be induced. However, the defect bands demonstrate a high degree of sensitivity to the values of the synthetic negative capacitors or inductors. This sensitivity poses a substantial challenge because it impedes precise tuning of the defect bands to the desired level.
This study proposes a novel approach for achieving temperature-controlled tunability of defective PnCs by integrating shape memory alloys (SMAs) into their defect regions. SMAs, renowned for their ability to undergo reversible phase transformations in response to temperature changes, exhibit substantial variations in their mechanical properties, such as Young’s modulus [29,30]. The integration of SMAs with heat patches, in conjunction with electrical circuits for precise temperature regulation, facilitates real-time tuning of defect bands. To support this innovation, an analytical model is developed to accurately predict the relationship between SMA-induced mechanical property changes and corresponding shifts in defect-band frequencies. This temperature-modulated tuning mechanism enhances the operational range of ultrasonic sensors, allowing them to maintain high sensitivity in dynamic and unpredictable environments. This work signifies a substantial advancement in tunable PnC technology, paving the way for next-generation ultrasonic sensors with augmented applications and enhanced performance.
The remainder of this paper is organized as follows. Section 2 provides a detailed description of the target system, including its configuration and setup. Section 3 introduces the SMA-incorporated analytical model used in this study. Section 4 focuses on the numerical validation, presents the results of the band structure and sensing performance analyses, and discusses their implications. Finally, Section 5 summarizes the key findings and conclusions drawn from this study.

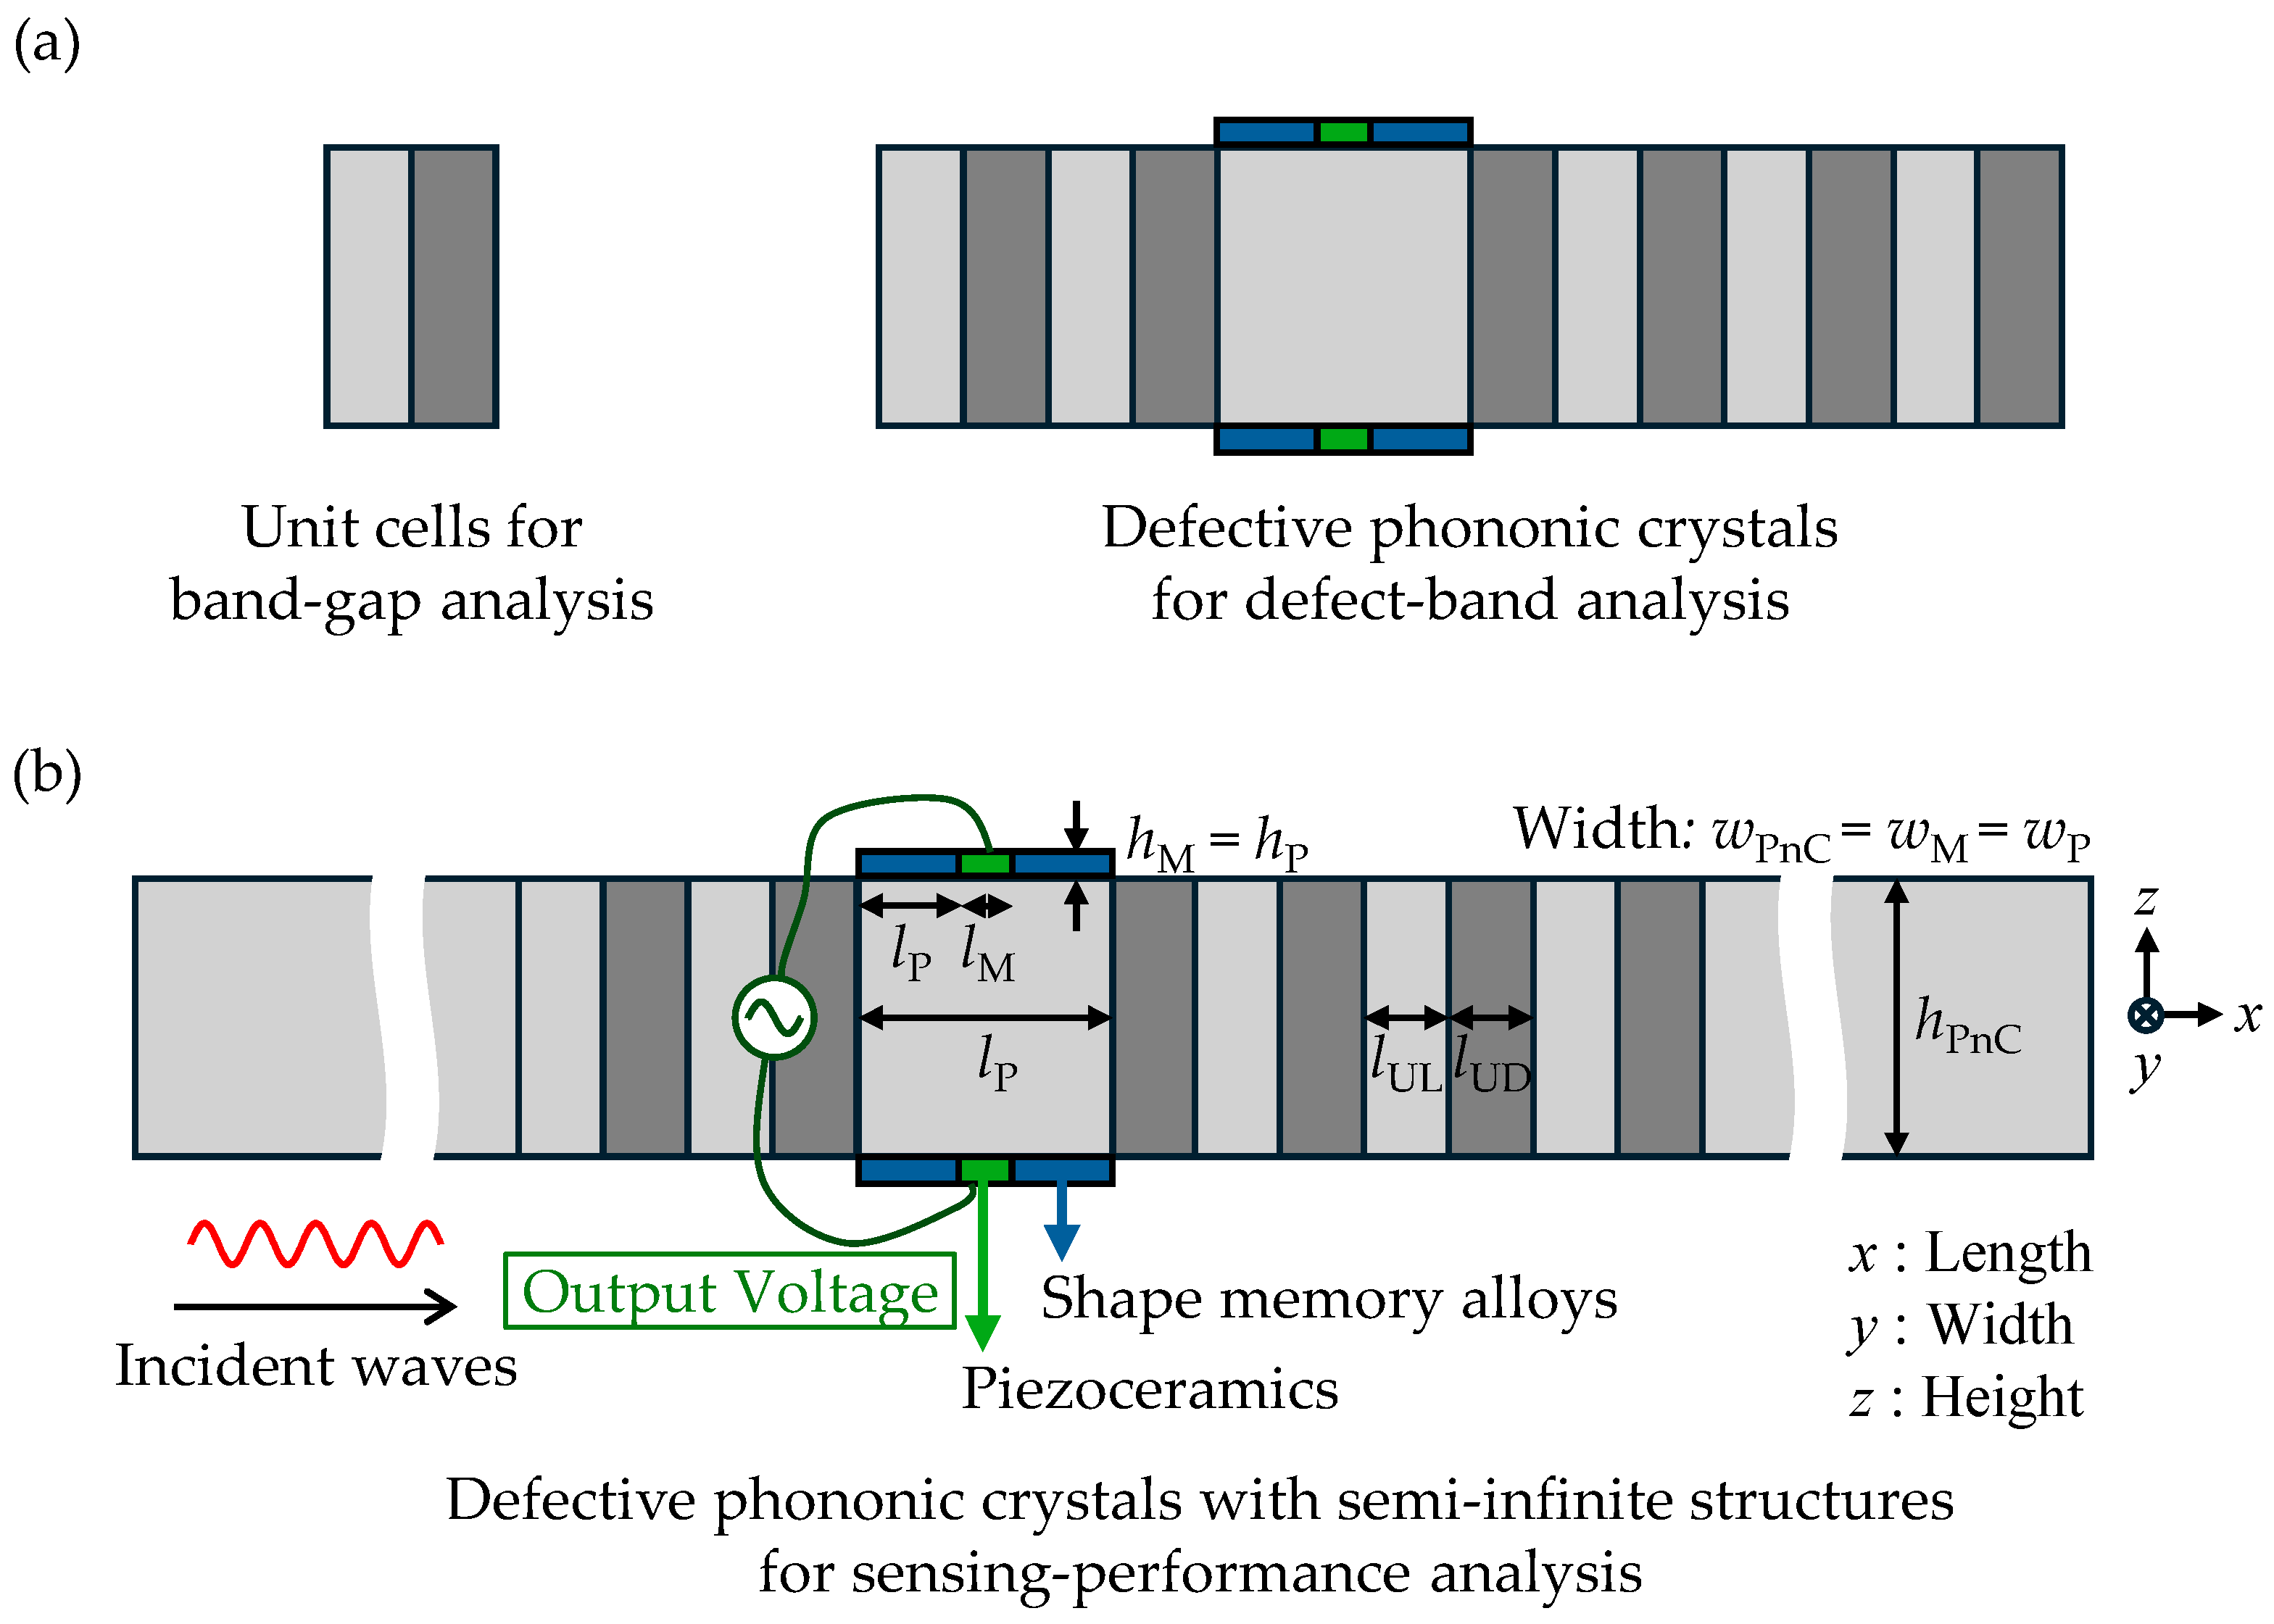
2. Target System Description

Figure 1 presents the front view of a one-dimensional defective PnC consisting of N unit cells. Each unit cell consists of two distinct metallic materials, represented by light- and dark-gray components. A defect is introduced by altering the length of the light-gray component in the Q-th unit cell. Subsequently, six additional structures are attached to this defect: two green piezoceramics and four blue SMAs. It is noteworthy that structures composed of the same material are assigned identical geometric dimensions. Specifically, the piezoceramics are attached to the top and bottom surfaces of the central region of the defect, while the SMAs are affixed to the remaining four regions (two at the top and two at the bottom) within the defect. The structural configuration within the defect is set such that it exhibits symmetry around the central axis of the defect. The combined length of one piezoceramic and two SMAs is equivalent to the total defect length. Therefore, the defect can be segmented into three distinct areas.
In the band-structure analysis (Figure 1a, Section 3.2), which can be regarded as a particular instance of an eigenvalue problem, the defect-band frequencies (corresponding to the eigenvalues) and defect-mode shapes (related to the eigenvectors) of the defective PnC are determined. These physical quantities can be obtained through analytical or numerical methods by implementing periodic boundary conditions in accordance with the Floquet–Bloch theory at both ends of a defective PnC. In energy-amplification analysis (Figure 1b, Section 3.3), two semi-infinite light-gray structures are connected to each terminus of the defective PnC. In this configuration, the wave field in the left domain is represented as a superposition of the right- and left-going reflected waves, whereas that in the right domain is solely characterized by the left-going transmitted wave. Two primary challenges arise when considering structures of finite length. First, the presence of boundary conditions such as fixed or free ends introduces additional wave reflections. Second, the finite length of the structure gives rise to external resonances that are unrelated to the defective PnC, thereby complicating the precise characterization of its performance of the defective PnC. To address these issues, semi-infinite structures are employed in this study.
The piezoceramics within this defective PnC operate in the 31-mode, signifying that the induced electric field aligns along the thickness direction (z-axis) in response to mechanical stress or strain in the perpendicular direction (x-axis) [31,32,33]. This 31-mode represents the piezoelectric coupling coefficient e31 or d31. The electric fields in the remaining directions are assumed to be negligible. The transverse isotropic properties of piezoceramics ensure uniform electroelastic behavior within a plane perpendicular to the polarization direction. Additionally, piezoceramics exhibit a reduced thickness compared to the overall height of defect-free PnCs. Bimorph piezoceramics are composed of two piezoelectric layers with the same polarization direction. These materials are engineered for longitudinal wave sensing rather than bending deformation. These materials are electrically connected in a series configuration and externally interfaced in an open-circuit configuration. The bottom electrode of the top piezoceramic layer is connected to the top electrode of the bottom piezoceramic layer, resulting in an additive voltage output under uniform mechanical strain. This configuration is advantageous for sensing applications due to its enhanced voltage sensitivity. The absence of an external load on the electrodes, as indicated by the open-circuit configuration, enables direct measurement of the induced voltage in response to the applied mechanical input.
The geometric properties of each structure are defined as follows: l denotes the length, h the height, and w the width, with the symbol A representing the cross-sectional area. The material properties are described using ρ for mass density and Y for Young’s modulus. For piezoceramics, the symbol eP corresponds to the 31-mode piezoelectric coupling coefficient, while the symbol ε P S represents the permittivity under constant mechanical strain. By adopting the small-strain approximation, the linear constitutive equation can be expressed as follows:
σ m = Y m S m ,
σ P = Y P S P e P E P ,   D P = e P S P + ε P S E P .
Throughout this study, the subscript m is used to identify specific structural components: UL for the light-gray structure, UD for the dark-gray structure, SL for the left semi-infinite structure, SR for the right semi-infinite structure, M for SMAs, and P for piezoceramics. Additional subscripts U, MD, PD, and PnC are introduced to denote parameters relevant to the unit cell, the defect domain with SMAs, the defect domain with piezoceramics, and defective PnC, respectively. The notations σ, S, E, and D represent key physical quantities: σ corresponds to the x-axial stress, S to the x-axial strain, E to the z-axial electric field, and D to the z-axial electric displacement.
This part is devoted to an analysis of the defect region. As previously noted, the defect is divided into three distinct regions, each composed of a composite of two materials. When bimorph structures (e.g., SMAs and piezoceramics) are seamlessly bonded to a defect, each composite can be treated as a single homogenized material. The bonding process may result in alterations in the overall height, which could potentially lead to stress concentration at the corners. However, given the negligible effects of SMAs and piezoceramics in the context of system analysis owing to their thin profile, the following equations describe the key homogenized mechanical properties, specifically, the mass per unit length and axial stiffness scaled by length:
ρ A MD = w PnC ρ D h PnC + 2 ρ M h M ,   ρ A PD = w PnC ρ D h PnC + 2 ρ P h P ,
Y A MD = w PnC Y D h PnC + 2 Y M h M ,   Y A PD = w PnC Y D h PnC + 2 Y P h P .

3. Analytical Modeling

3.1. Temperature-Dependent Material Properties of Shape Memory Alloys

The central theme of this study is the integration of SMAs into the design framework of defective PnCs to achieve defect-band tunability of ultrasonic sensors through temperature variations. The use of SMAs for tuning phononic band gaps has been reported in Refs [34,35,36]. This section begins by examining the temperature-dependent mechanical properties of the SMAs. A key characteristic of SMAs is their ability to undergo reversible temperature-driven phase transformations between martensitic and austenitic phases [29,30]. These phase transformations modulate the Young’s modulus of SMAs, thereby facilitating the dynamic regulation of the mechanical properties and defect-band frequencies in defective PnCs.
The Lagoudas model describes the phase transformation behavior of SMAs and their concomitant mechanical properties. This model captures the evolution of the martensitic fraction, denoted as ξM (0 ≤ ξM ≤ 1), as a function of the temperature T, incorporating internal state variables to describe the response of the material during phase transformations. The parameter is defined using smooth transition functions, such as cosine expressions, which represent the progression between the martensitic and austenitic phases across specific temperature ranges. The temperature-dependent Young’s modulus YM(T) is expressed as follows:
Y M T = ξ M T Y M , M + 1 ξ M T Y M , A ,
where YM,M and YM,A represent the elastic moduli of the fully martensitic and austenitic phases, respectively. T denotes an arbitrary temperature.
Here, TM,Ms, TM,Mf, TM,As, and TM,Af are the martensite start, martensite finish, austenite start, and austenite finish temperatures, respectively. For the forward transformation from martensite to austenite during heating (TM,AsTTM,Af), the martensitic fraction ξ is given by:
ξ M T = 1 2 cos π T T M , As T M , Af T M , As + 1 .
For the reverse transformation from austenite to martensite during cooling (TM,MfTTM,Ms), the martensitic fraction ξ is given by:
ξ M T = 1 2 cos π T T M , Mf T M , Mf T M , Ms + 1 .
Equation (6) describes the smooth reduction in the martensitic phase as the temperature increases, whereas Equation (7) captures the smooth reappearance of the martensitic phase as the temperature decreases. By combining these equations, the Lagoudas model in Figure 2 effectively describes the cyclic variations in Young’s modulus during heating and cooling, thereby providing a robust foundation for predicting the temperature-dependent mechanical properties of SMAs.

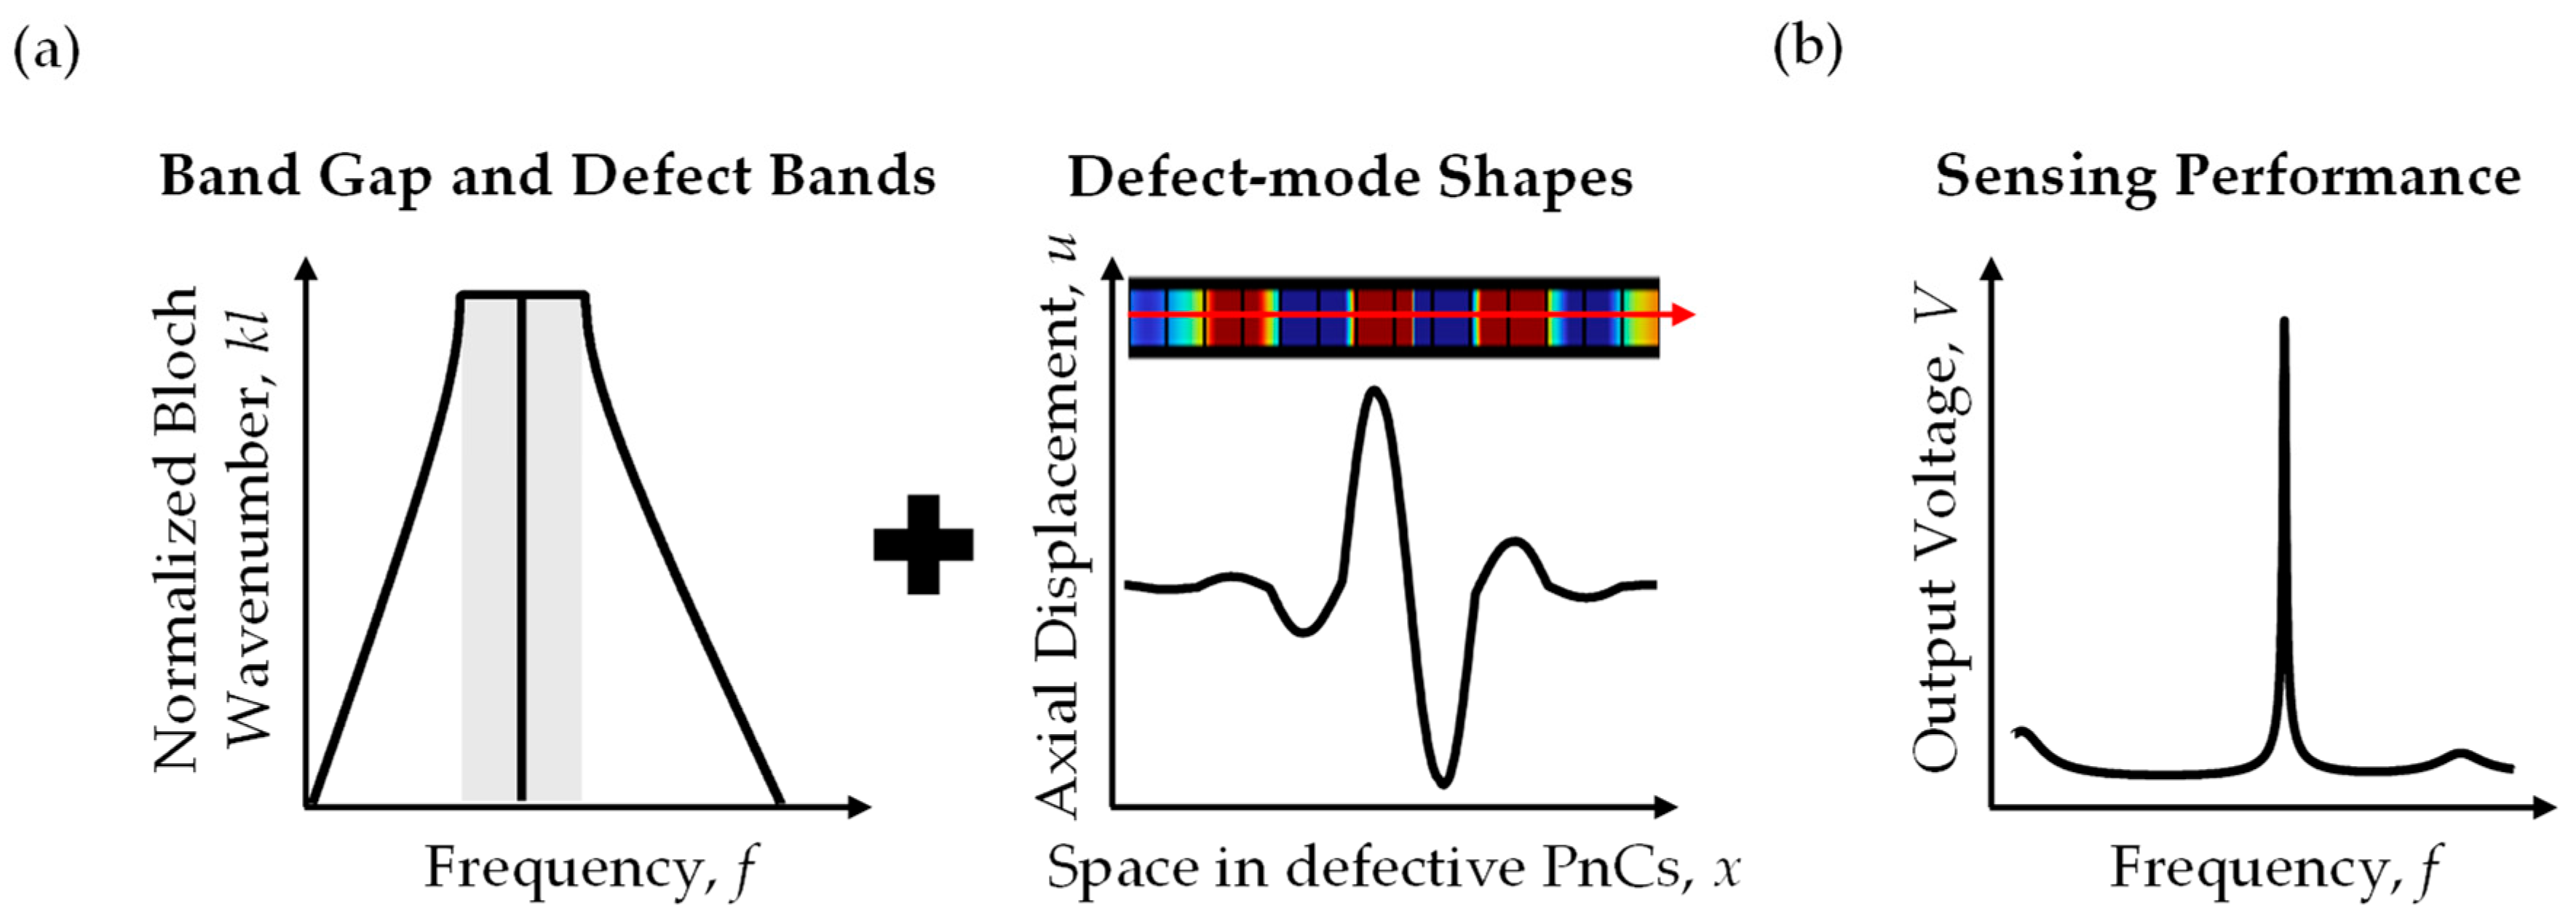
3.2. Band-Structure Analysis

This study utilizes the transfer-matrix method for band-structure analysis, a decision made over competing methods such as the finite element [37,38] and plane-wave expansion methods [39,40]. This selection was motivated by the transfer-matrix method’s superior ability to explicitly solve the wave equation, which is a critical factor in this context. In this approach, a 2 × 2 transfer matrix is used to link the longitudinal velocity and force across the end boundaries of one-dimensional structures. The predictive capabilities of this method for the output response evaluation are well supported by previous investigations [41,42,43].
In this context, several fundamental aspects are considered. The predefined mathematical expressions for the displacement field of the propagating waves are specified as follows: Pexp(j(ωtkx)) for right-going waves and Qexp(j(ωt + kx)) for left-going waves. The symbols x and t represent space and time variables, respectively. In addition, the time-harmonic solution for the output voltage is denoted by Vexp(j(ωt)). The constitutive equations in Equations (1) and (2) are employed in line with classical rod theory, which neglects lateral and shear effects and assumes uniform displacement and stress fields over the cross-sections. This theory is valid for rods with large slenderness ratios.
In the absence of the piezoelectric domain, the transfer matrix TM for a structure of length l at angular frequency ω is represented as follows:
TM = cos k l j Z 1 sin k l j Z sin k l cos k l ,
where the wavenumber k and mechanical impedance Z are calculated using ωρ1/2Y1/2 and 1/2Y1/2, respectively, based on classical rod theory. For a domain within the defect that incorporates bimorph piezoceramics of length lPD, the electroelastically coupled transfer matrix TMPD is expressed as follows:
TM PD = cos k PD l PD j Z PD 1 sin k PD l PD j Z PD sin k PD l PD cos k PD l PD + κ PD open sin k PD l PD j Z PD 1 1 + cos k PD l PD j Z PD 1 cos k PD l PD sin k PD l PD ,
where the symbol κ PD open indicates the electroelastic coupling coefficient under an open circuit and modifies the components of the transfer matrix in Equation (8). This is a quantitative measure of the influence of mechanical and electrical interactions on the transfer matrix as follows:
κ PD open = Z PD 1 e P w PnC 2 1 cos k PD l PD ω C P / 2 + Z PD 1 e P w PnC 2 sin k PD l PD ,
where the capacitance CP, wavenumber kPD, and mechanical impedance ZPD are expressed as ε P S l PD w PnC h P 1 , ω ρ A PD 1 / 2 Y A PD 1 / 2 , and ρ A PD 1 / 2 Y A PD 1 / 2 , respectively. It should be noted that the process for deriving the electroelastically coupled transfer matrix is comprehensively described in Refs [44,45]. Because this matrix has been steadily utilized and validated in previous studies through comparison with the finite element method, its detailed derivation is omitted here for brevity.
Figure 1a illustrates the band-structure analysis, which evaluates two structural configurations under a single boundary condition. Under the assumption of continuity of both velocity and force across all interfaces within the unit cell or defective PnC, a system-level transfer matrix is derived to establish the relationship between the velocity and force vectors at the boundaries of each structure. The subsequent application of the Floquet–Bloch theory introduces periodic boundary conditions, thereby enabling the formulation of two corresponding eigenvalue problems, as detailed below:
TM U exp j k U Bloch l U I W F x U = 0 = 0 ,
TM PnC T exp j k PnC Bloch l PnC I W F x PnC = 0 = 0 ,
TM U = TM UD TM UL ,
TM PnC T = TM U N D TM M T TM PD TM M T TM UL TM U D 1 ,
where the unit-cell length lU is calculated as lUL + lUD. For the defective PnC, the overall length lPnC is determined using the expression NlU + lDlUD. The spatial domains for the unit cell (xU) and defective PnC (xPnC) span the ranges of 0 ≤ xUlU and 0 ≤ xPnClPnC, respectively. Furthermore, the normalized Bloch wavenumbers associated with the unit cell ( k U Bloch l U ) and defective PnC ( k PnC Bloch l PnC ) lie within the interval [0, π].
It is imperative to emphasize that the transfer matrix corresponding to the SMAs is represented by the TMM(T) in Equations (12) and (14). To further elucidate this, the transfer matrix TMM (T) is expressed as a temperature-dependent function. The transfer matrix, as described in Equation (6), encompasses elements pertinent to the wavenumber kM and mechanical impedance ZM, both of which are contingent on Young’s modulus YM in Equation (5). Consequently, for SMAs, the transfer matrix undergoes temperature-dependent variations. Additionally, temperature changes in SMAs may induce heat conduction to neighboring structures, potentially engendering slight thermal strain and variations in their Young’s moduli. However, the impact of these factors is considered negligible within the scope of this analysis.
This study utilizes the concepts of eigenvalues and eigenvectors as foundational tools to investigate the band structures of defective PnCs, with a particular emphasis on phononic band gaps, defect-band frequencies, and defect-mode shapes. The expected results are shown in Figure 3a. The eigenvalues (or eigenfrequencies) presented in Equations (11) and (12), when analyzed with respect to normalized Bloch wavenumbers, characterize band structures. At the unit-cell level, Equation (11) defines the phononic band gap as the range of frequencies excluded from the specified set of real-valued, normalized Bloch wavenumbers. Subsequently, by narrowing the frequency range of interest to within the band gap, Equation (12) at the defective PnC level identifies defect-band frequencies that lie within the band gap yet correspond to all real-valued, normalized Bloch wavenumbers. The sequential nature of this approach is physically justified by the underlying mechanisms of defect-band formation [46]. Furthermore, conducting band-gap analysis on smaller structures, followed by defect-band analysis within a refined frequency range for larger systems, provides a more time-efficient alternative to performing comprehensive band-structure analysis across a broad frequency range for larger structures.
Next, the eigenvectors derived from Equation (12) at the defect-band frequencies offer insights into the velocity and force at the leftmost edge of the defective PnC. This information facilitates the computation of the displacement coefficient for the displacement field within the first light-gray substructure, thereby enabling the determination of its complete displacement field. Subsequently, continuity conditions are applied to evaluate the velocity and force at the left end of the second dark-gray substructure, allowing the displacement field to be determined through a similar process. By iteratively applying this procedure to all substructures of the defective PnC, the complete displacement field can be systematically constructed. In addition, other field quantities, such as the strain field, can be calculated if necessary. This iterative process ultimately defines the defect-mode shapes.

3.3. Sensing-Performance Analysis

The subsequent analysis utilizes the S-parameter method to evaluate the sensing performance. This method differs from band-structure analysis based on the transfer-matrix approach in two significant ways. The S-parameter method does not apply periodic boundary settings but instead focuses on a finite array of unit cells. Next, the analysis emulates an engineering context in which a semi-infinitely long light-gray rod is connected to each end of the defective PnC. As depicted in Figure 1b, longitudinal waves of a specified frequency are introduced on the left side. The semi-infinite rod on the left is subjected to both incident waves (“In”) and reflected waves (“Ref”), while the semi-infinite rod on the right exclusively carries transmitted waves (“Trans”). The central aim of this study is to assess the output voltage generated by bimorph piezoceramics connected in series.
Within the specified setting, the displacement fields on the left and right sides of the semi-infinite structures can be expressed through mathematical formulations as follows: “uSL = PInexp(j(ωtkSLxSL)) + QRefexp(j(ωt + kSLxSL))” and “uSR = PTransexp(j(ωtkSRxSR))”, respectively, for xSL ≤ 0 and xSR ≥ 0. Here, PIn, QRef, and PTrans represent the displacement coefficients of the incident, reflected, and transmitted waves, respectively. Given a predefined incident wave amplitude (PIn), the scattering matrix SMPnC in Equation (15) is employed to compute the remaining coefficients, QRef and PTrans. As shown in Equation (16), the construction of the scattering matrix SMPnC is based on the transfer matrix TMPnC of the defective PnC, as outlined in Equation (14), and the transformation matrices IMSL and IMSR, provided in Equation (17). This transformation matrix acts as an intermediary, connecting the velocity-force vector and displacement coefficient vector at the finite ends (xSL = xSR = 0) of the semi-infinite structures. The utilization of these transformation matrices guarantees compatibility between the mechanical response of the defective PnC and wave dynamics on either side of the structure. Equations (15)–(17) are outlined as follows:
P Trans 0 = SM PnC T P In Q Ref ,
SM PnC T = IM SR 1 TM PnC T IM SL ,
IM SL = j ω 1 1 Z SL Z SL ,   IM SR = j ω 1 1 Z SR Z SR .
Subsequent to determining the reflection and transmission coefficients with respect to the incident waves, the ensuing step involves the identification of the displacement field uPD within the bimorph piezoceramics. In accordance with the extant literature [44,45], the displacement field under an open circuit is as follows:
u PD = P PD exp j ω t k PD x PD + Q PD exp j ω t + k PD x PD + w PnC e P j ω Z PD exp j ω t k PD x PD exp j ω t + k PD x PD l PD V P ,
V P = w PnC e P P PD exp j k PD l PD 1 + Q PD exp j k PD l PD 1 C P 2 w PnC e P 2 j ω Z PD exp j k PD l PD 1 exp j ω t ,
where Equation (18) comprises two principal components. The first two terms describe the displacement field typically observed in metallic bodies and are derived as a homogeneous solution of the longitudinal wave equation. By contrast, the final term represents the displacement field resulting from the electroelastic coupling effect (i.e., the output voltage in Equation (19)), which constitutes an inherently nonhomogeneous solution. It is important to note that the displacement field uPD can also be formulated using the displacement coefficients PPD and QPD. These coefficients are calculated using a methodology analogous to the S-parameter approach as follows:
P PD Q PD = IM PD 1 TM M T TM UL TM U D 1 IM SL P In Q Ref ,
IM PD = j ω 1 1 Z PD Z PD + κ PD open κ PD open + j exp j k PD l PD 1 Z PD exp j k PD l PD Z PD .
The substitution of the displacement amplitudes PPD and QPD, obtained from Equation (20), back into the displacement field expression provided in Equation (19) allows for the determination of the amplitude of the generated output voltage, |VP|. This process enables the quantification of the electrical output generated by mechanical excitation and highlights the critical role of the electroelastic coupling effect in dictating the performance of bimorph piezoceramics. The expected results are shown in Figure 3b.
It is important to emphasize that Equations (15) and (20) reflect the transfer matrices associated with the SMAs. Consequently, it is expected that the sensing performance, along with the transmission and reflection coefficients, will vary in response to temperature-induced changes in the material properties of SMAs. This indicates that both the peak frequency, at which the sensing performance is maximized, and the corresponding voltage amplitude are inherently temperature-dependent.

4. Numerical Validation

4.1. Evaluation Plan

In the case studies, the defective PnC consists of magnesium (light-gray) and copper (dark-gray). The corresponding material properties, including densities and Young’s moduli, are as follows: for magnesium (ρUL, YUL) = (1770 kg·m3, 45 GPa) and for copper (ρUD, YUD) = (7850 kg·m3, 200 GPa). The piezoceramics are fabricated from PZT-5H, with material properties specified as follows: (ρP, YP, eP, ε P S ) = (7500 kg·m3, 60.6 GPa, −16.6 C·m2, 25.55 nF·m1). These data are retrieved from the built-in material library in COMSOL Multiphysics. It is imperative to acknowledge that the selection of two materials is predicated on the objective of ensuring a substantial mechanical impedance contrast. This is a pivotal design criterion, as it facilitates the formation of pronounced band gaps within the band structures. The magnitude of this contrast directly correlates with the size of the band gap. It is also crucial to recognize the function of piezoelectric materials as active components in voltage generation and sensing through piezoelectric effects. Their incorporation is imperative for the effective functioning of ultrasonic sensor applications. Piezoceramics, in particular, have demonstrated the capacity to detect mechanical vibrations in defect modes and effectively convert them into electrical signals.
Subsequently, the material properties of the SMAs are described. Examples of SMAs include nitinol (an alloy of nickel and titanium), Cu-based alloys (e.g., Cu-Al, Cu-Zn, Cu-Sn), and Fe-based alloys (e.g., Fe-Pt, Fe-Mn-Si, Fe-Ni). Of these, Nitinol is selected for this study because of its well-established advantages, such as its remarkable shape memory effect and superelasticity, which make it highly suitable for use in sensors, actuators, and biomedical devices [47,48]. The phase transitions, namely, the martensite start, martensite finish, austenite start, and austenite finish temperatures, as well as the material properties (e.g., the elastic moduli of the fully martensitic and fully austenitic phases), are influenced by the composition ratio of nickel and titanium, as well as the processing method. Considering these factors, Section 4.2 focuses on the analysis of the band structure and sensing performance when (ρM, YM,M, YM,A) = (6450 kg·m3, 30, 90 GPa) and (TM,Mf, TM,Ms, TM,As, TM,Af) = (40, 50, 60, 70 °C). Furthermore, Section 4.3 provides a detailed analysis of how variations in the length (geometric perspective) and Young’s modulus (material perspective) of SMAs affect the defect bands and sensing capabilities.
The geometric dimensions of the structural components within the unit cell are specified as follows: length (lUL = lUD = 30 mm), height (hPnC = 5 mm), and width (wPnC = 5 mm). The defect has a length of 100 mm (lD = 100 mm). Given that the piezoceramic component occupies 20% of the total length, the length of the piezoceramic component is 20 mm (lP = 20 mm). The remaining portion is occupied by SMAs, resulting in a length of 40 mm for each SMA (lM = 40 mm). The heights of both the piezoceramic and SMA components are 0.5 mm (hP = hM = 0.5 mm), and the widths of both components are consistent with the overall PnC width of 5 mm (wP = wM = 5 mm). The system under consideration comprises five unit cells (N = 5), with the defect located in the third unit cell (D = 3). After introducing these values into Section 3.2, band-structure analysis can be conducted.
The incident wave has a velocity amplitude of π mm/s (ωPIn = π mm/s). To ensure energy conservation, the velocity is maintained constant with respect to frequency. Although the validity of this value may be subject to further scrutiny, the previous experiments on elastic waves in a standard aluminum plate established a displacement amplitude of the order of several nanometers at an excitation frequency of 50 kHz. This study adopts this value as the baseline. Subsequent to the introduction of these values into Section 3.3, a sensing performance analysis can be conducted.
In this context, it is pertinent to pose a query regarding the fundamental distinctions between analytical and numerical models. Analytical models are predicated on closed-form mathematical expressions derived from physical principles and frequently involve simplifying assumptions to obtain rapid and interpretable solutions. Conversely, numerical models (e.g., finite element methods) are computational in nature, bypassing the simplifications inherent in analytical models. This enables more intricate analysis of complex geometries and multi-physics interactions, though at a higher computational cost.
The analytical model presented in Section 3 is implemented using MATLAB 2024a, and numerical analysis was conducted using COMSOL Multiphysics 6.1. The following computational specifications are utilized to execute these simulations: Gigabyte B760M Aorus Elite motherboard, Intel® Core™ i9-13900KF processor, GeForce RTX 3060 Storm X Dual OC D6 12GB graphics card, and Samsung DDR5-4800AM. A comprehensive description of the COMSOL implementation is provided in Appendix A.

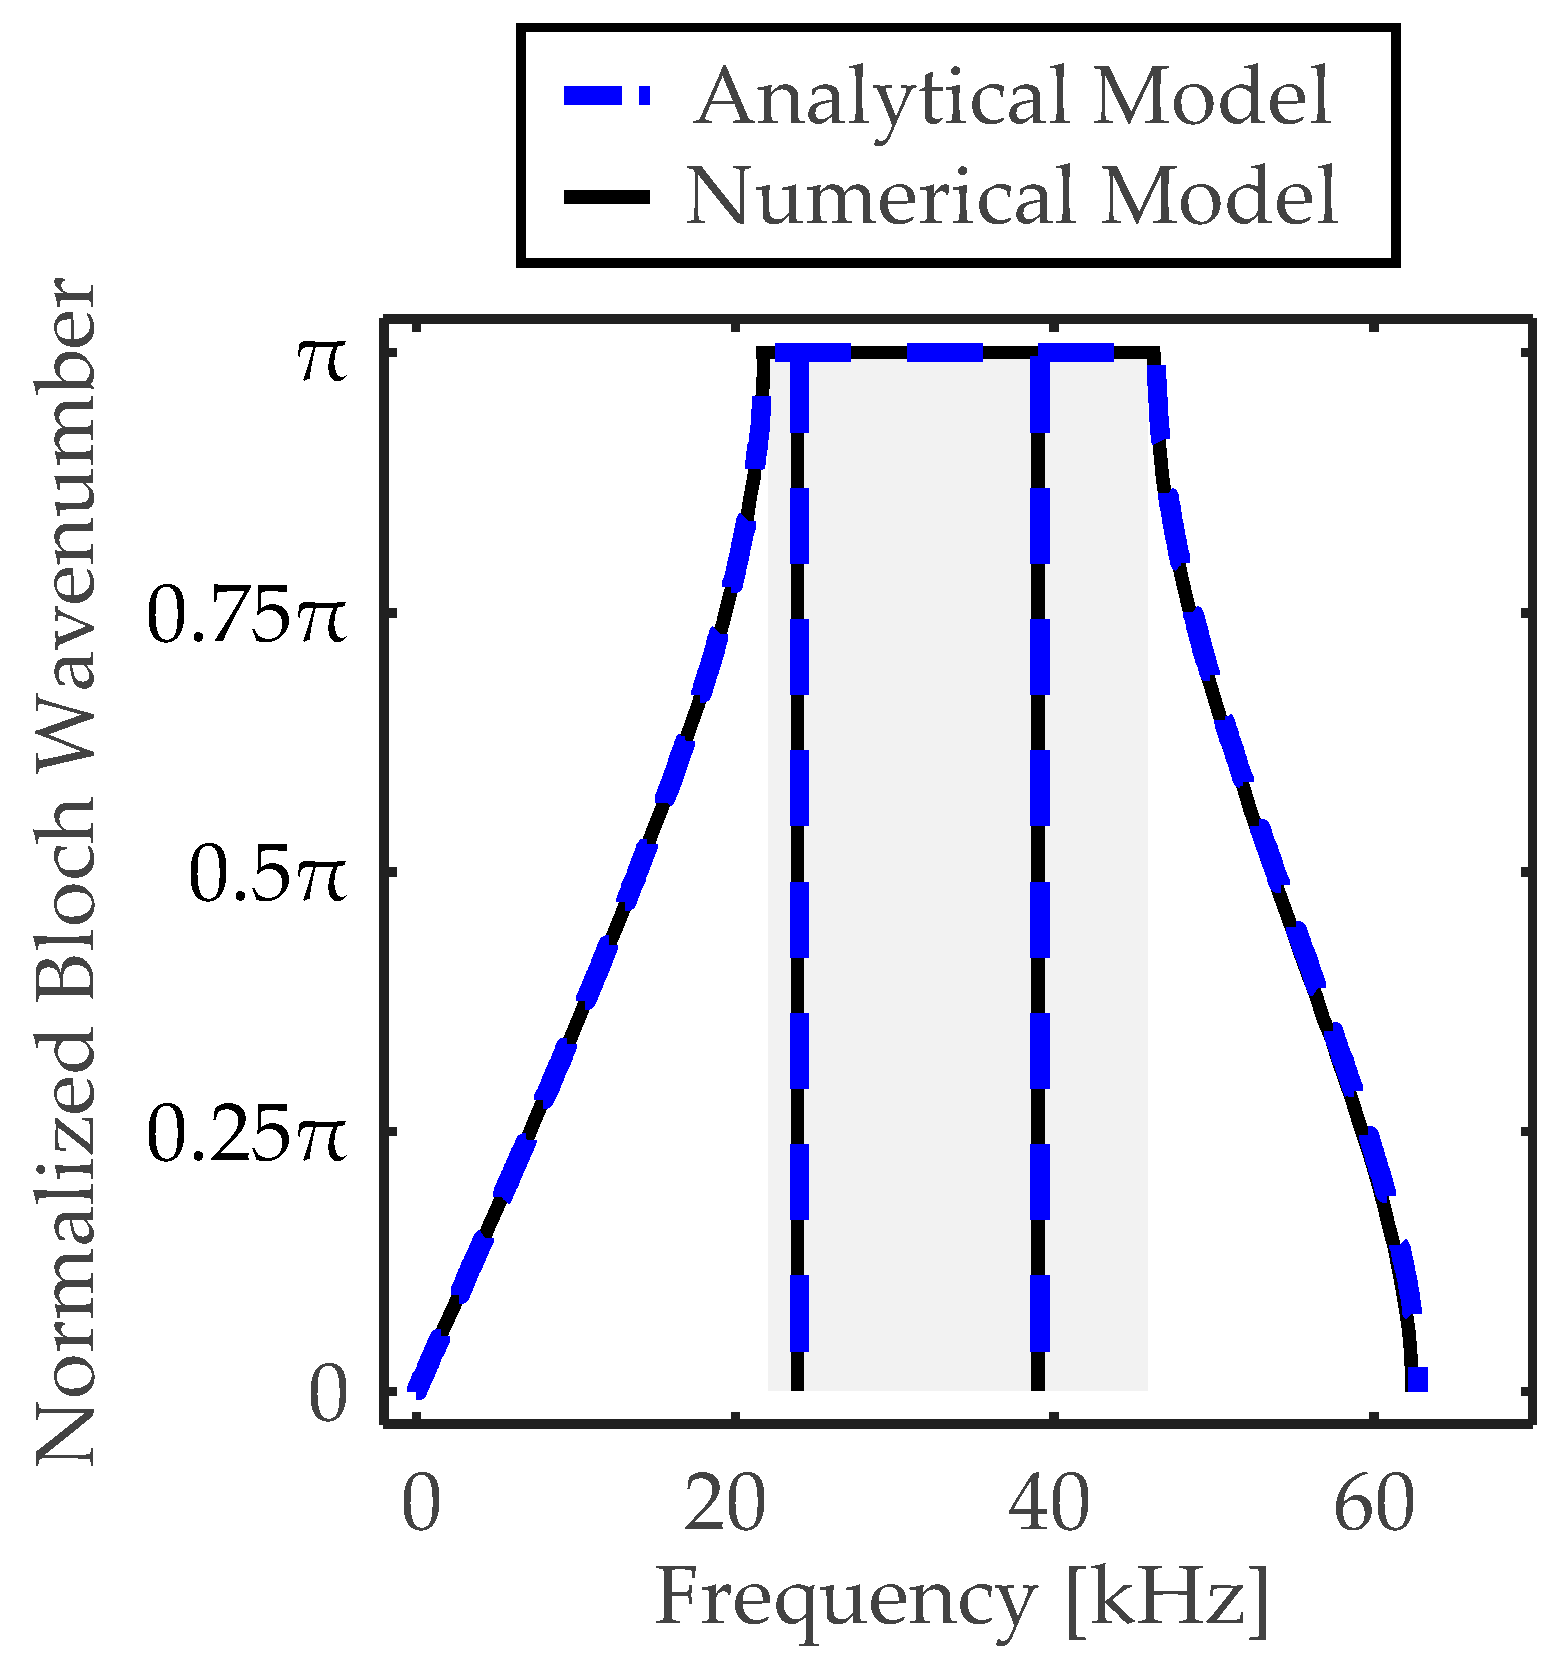
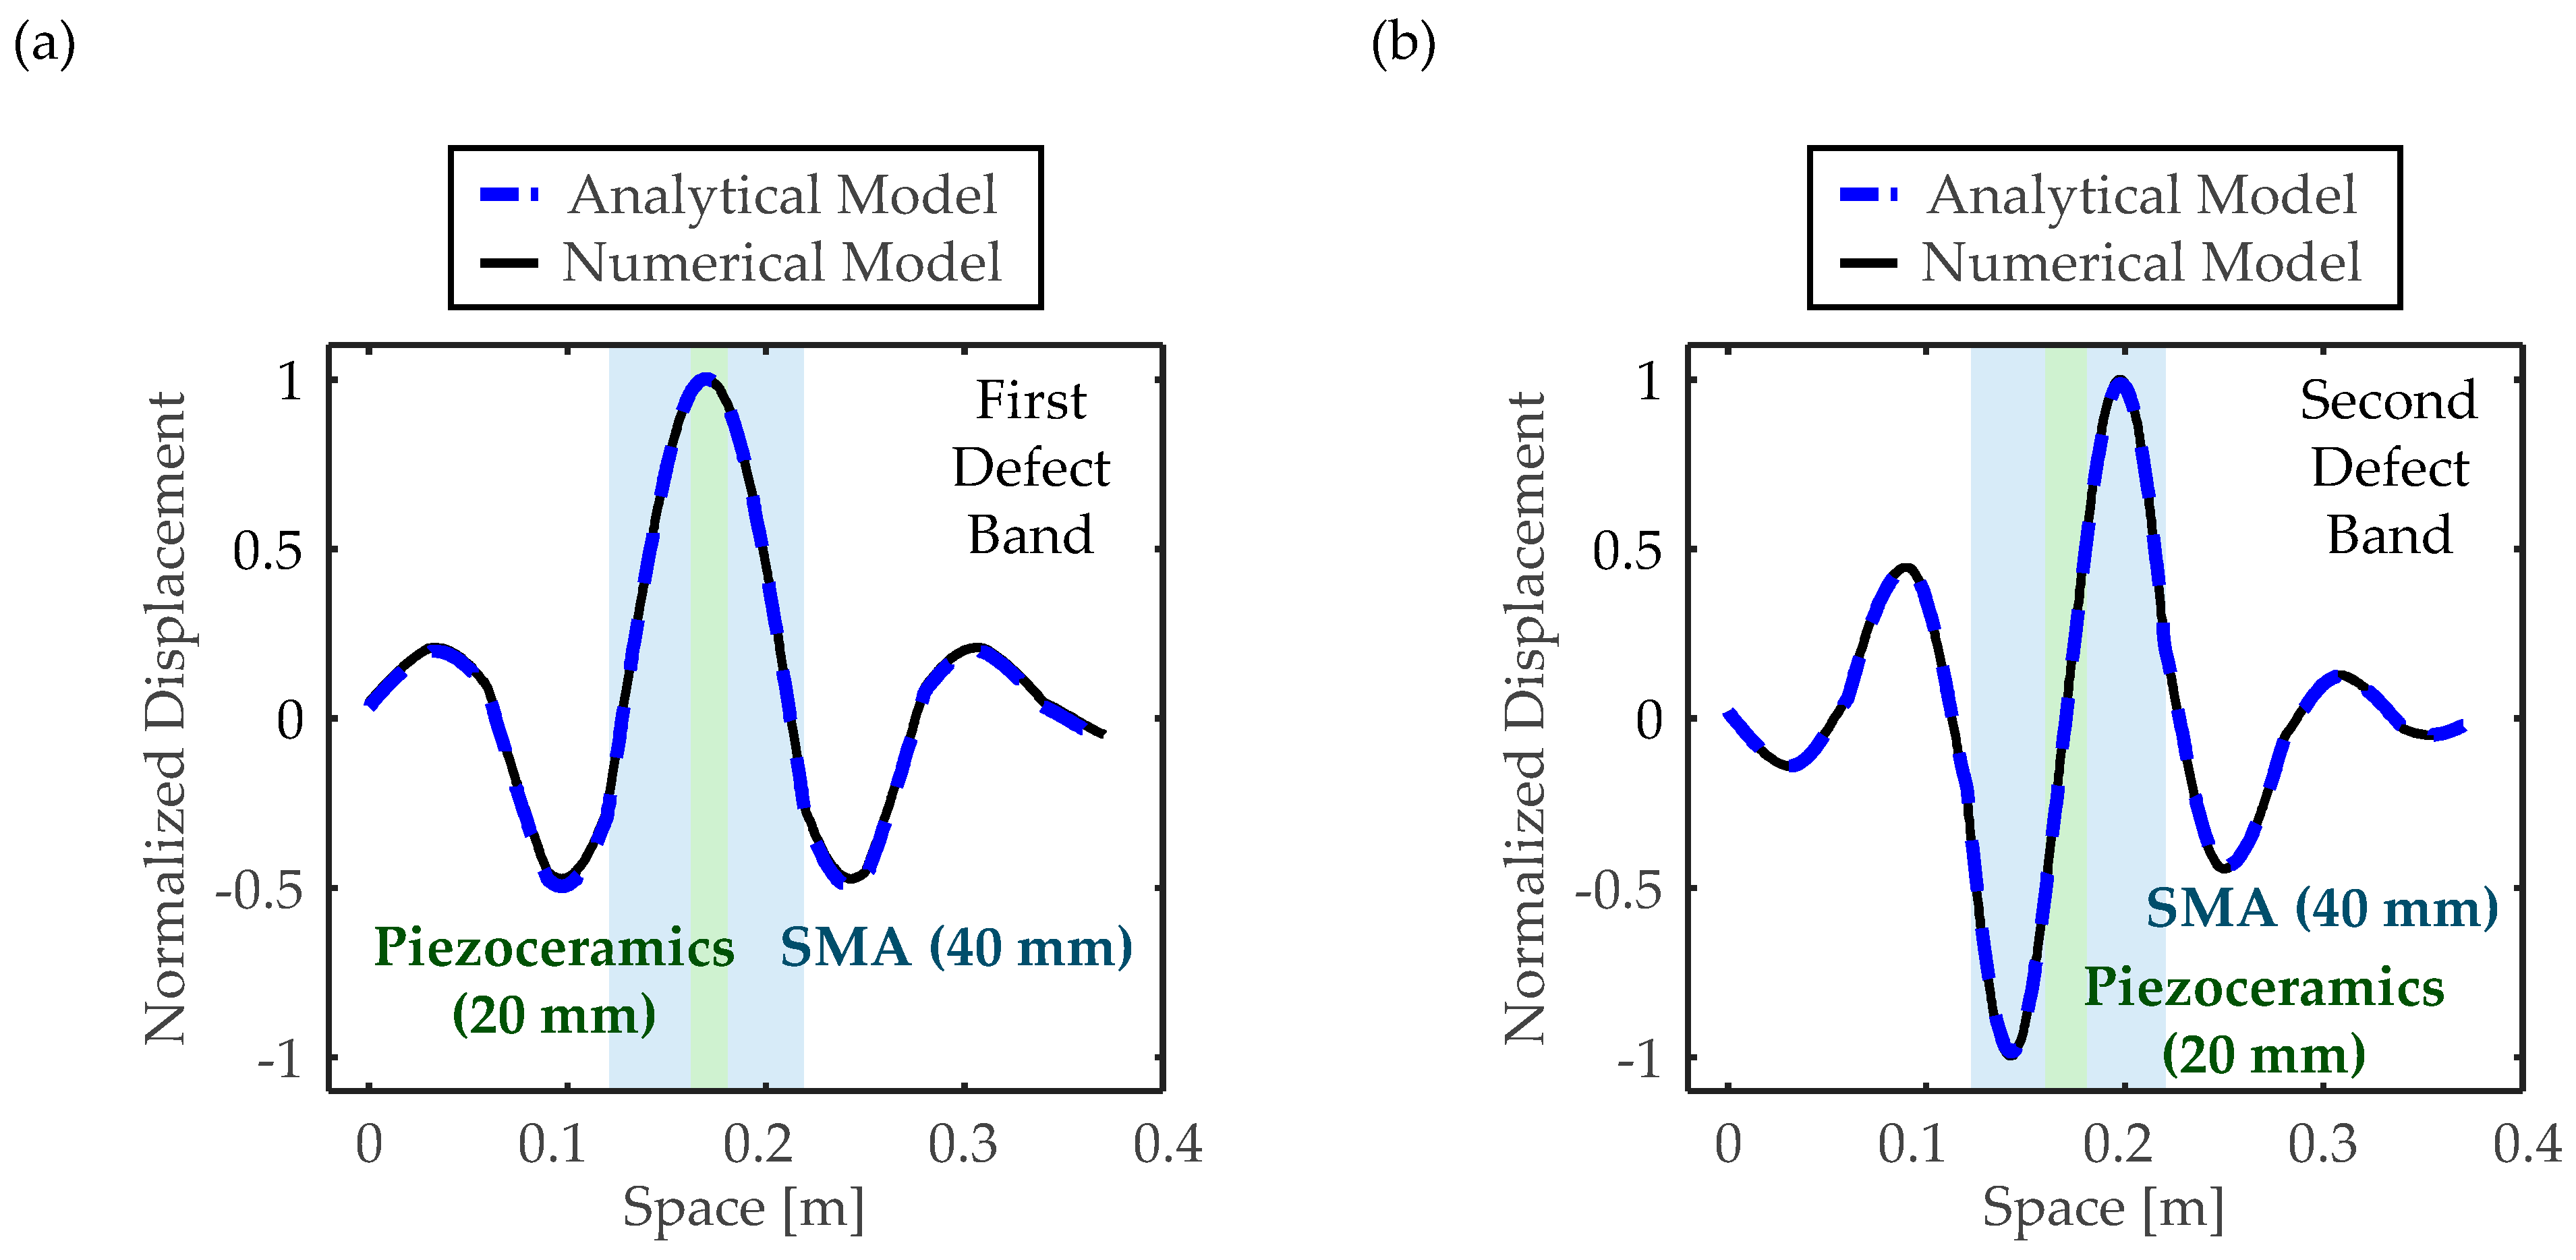
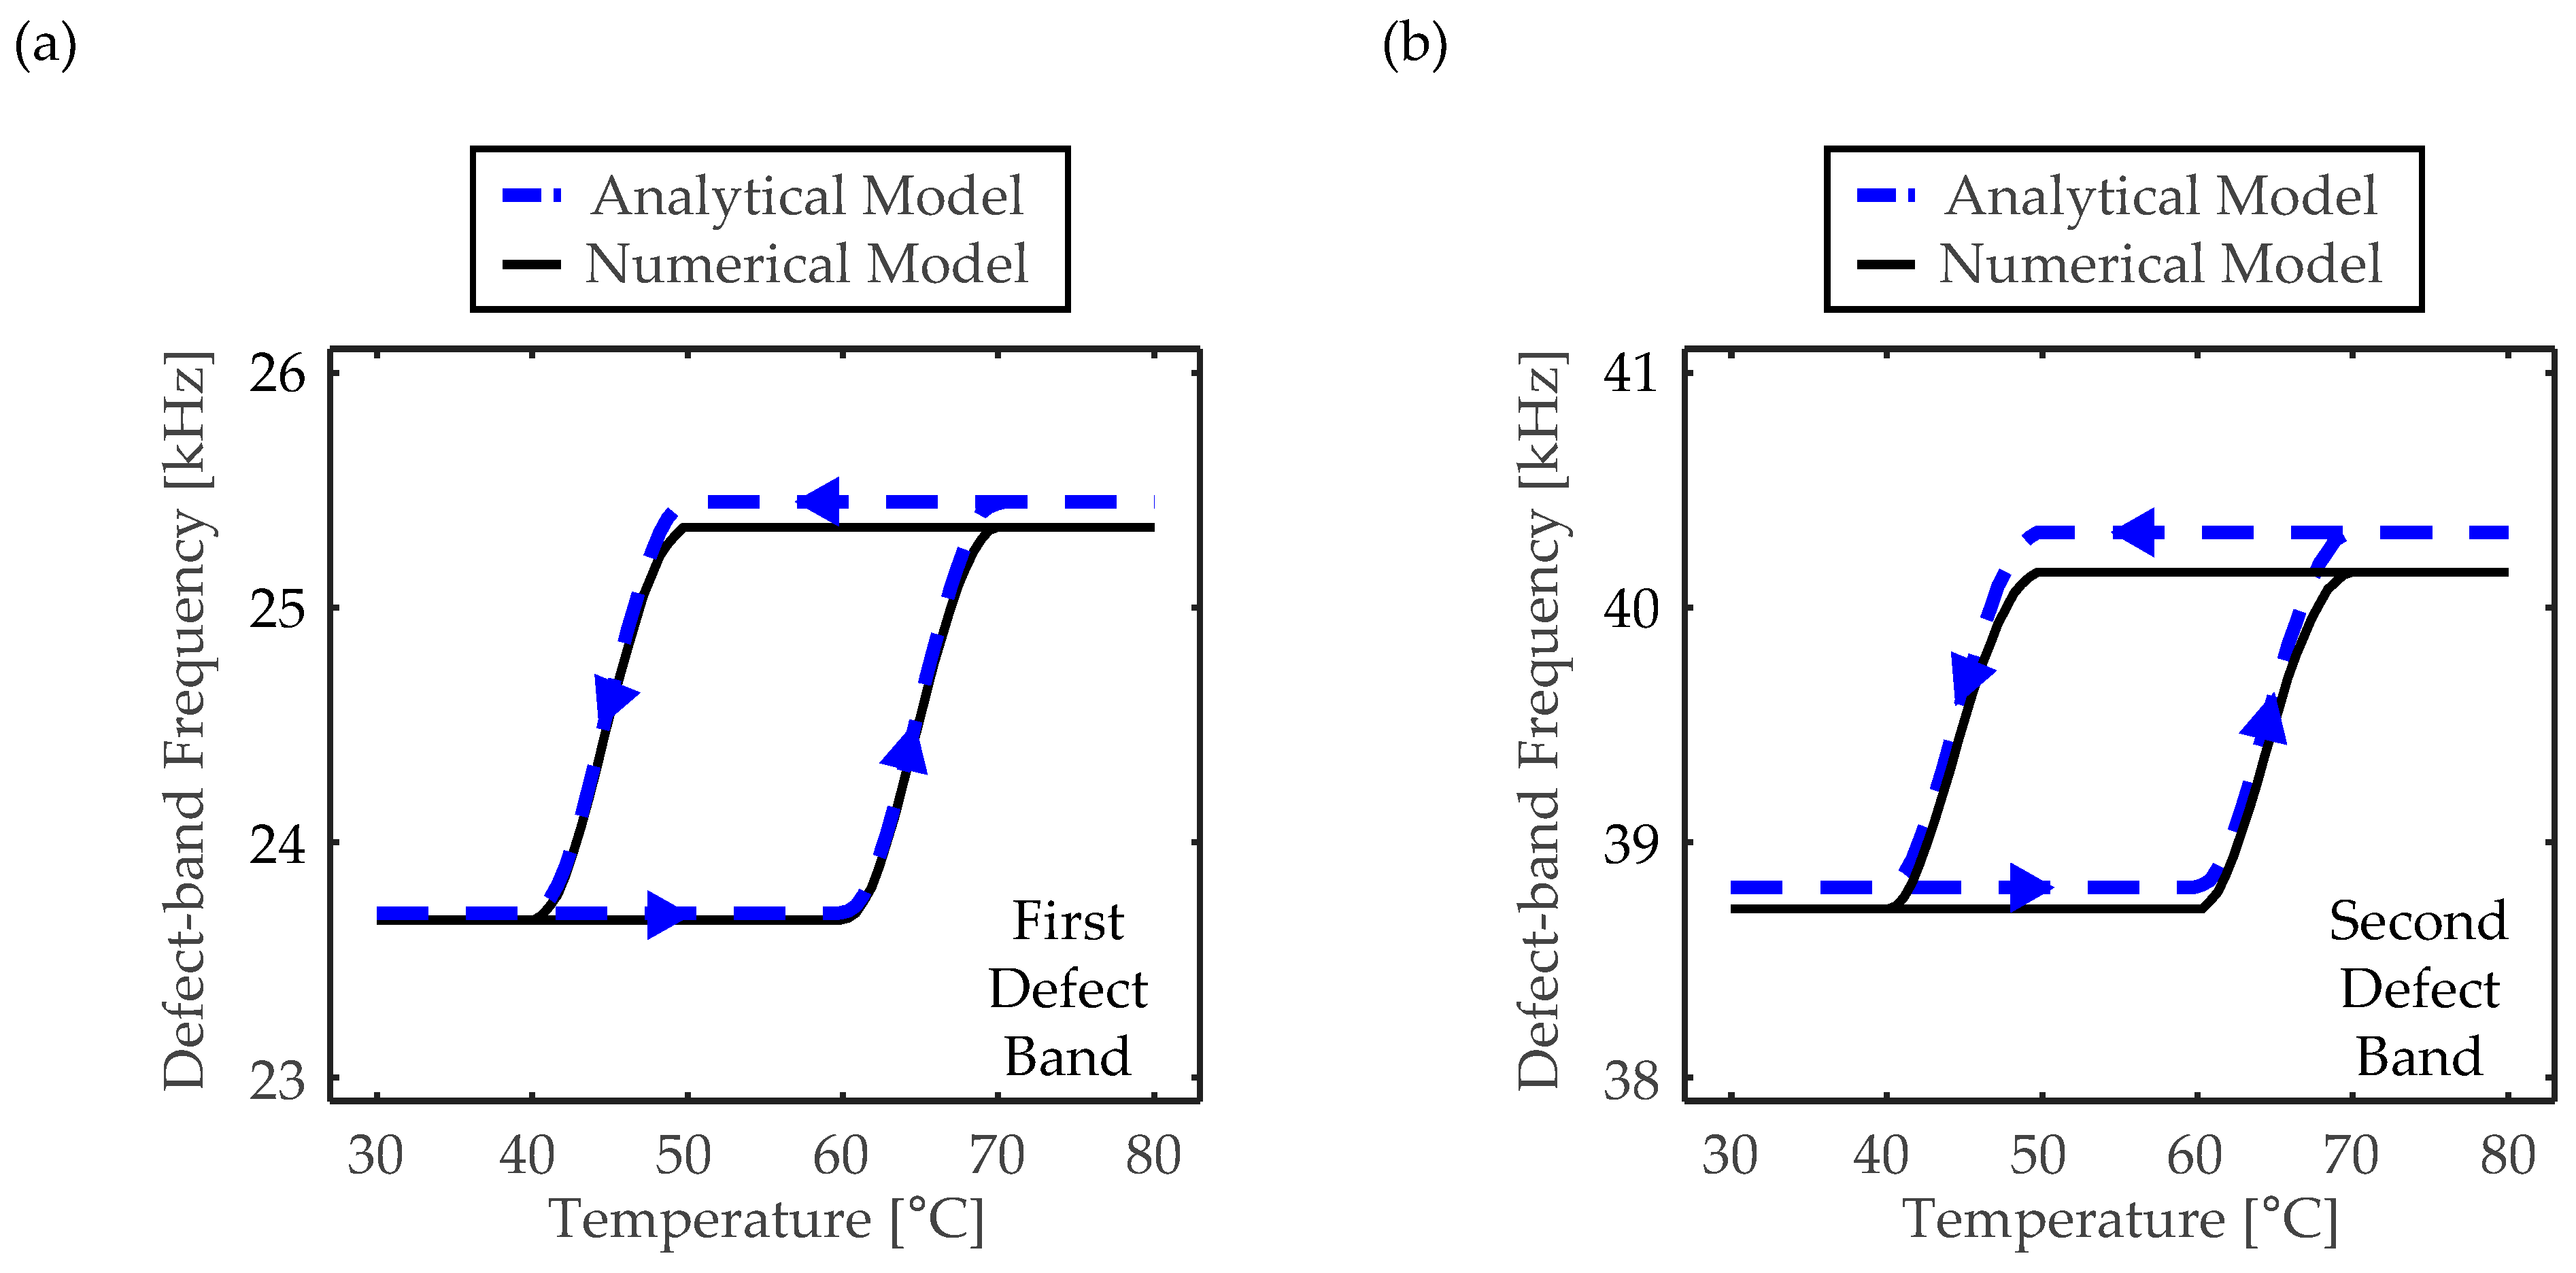
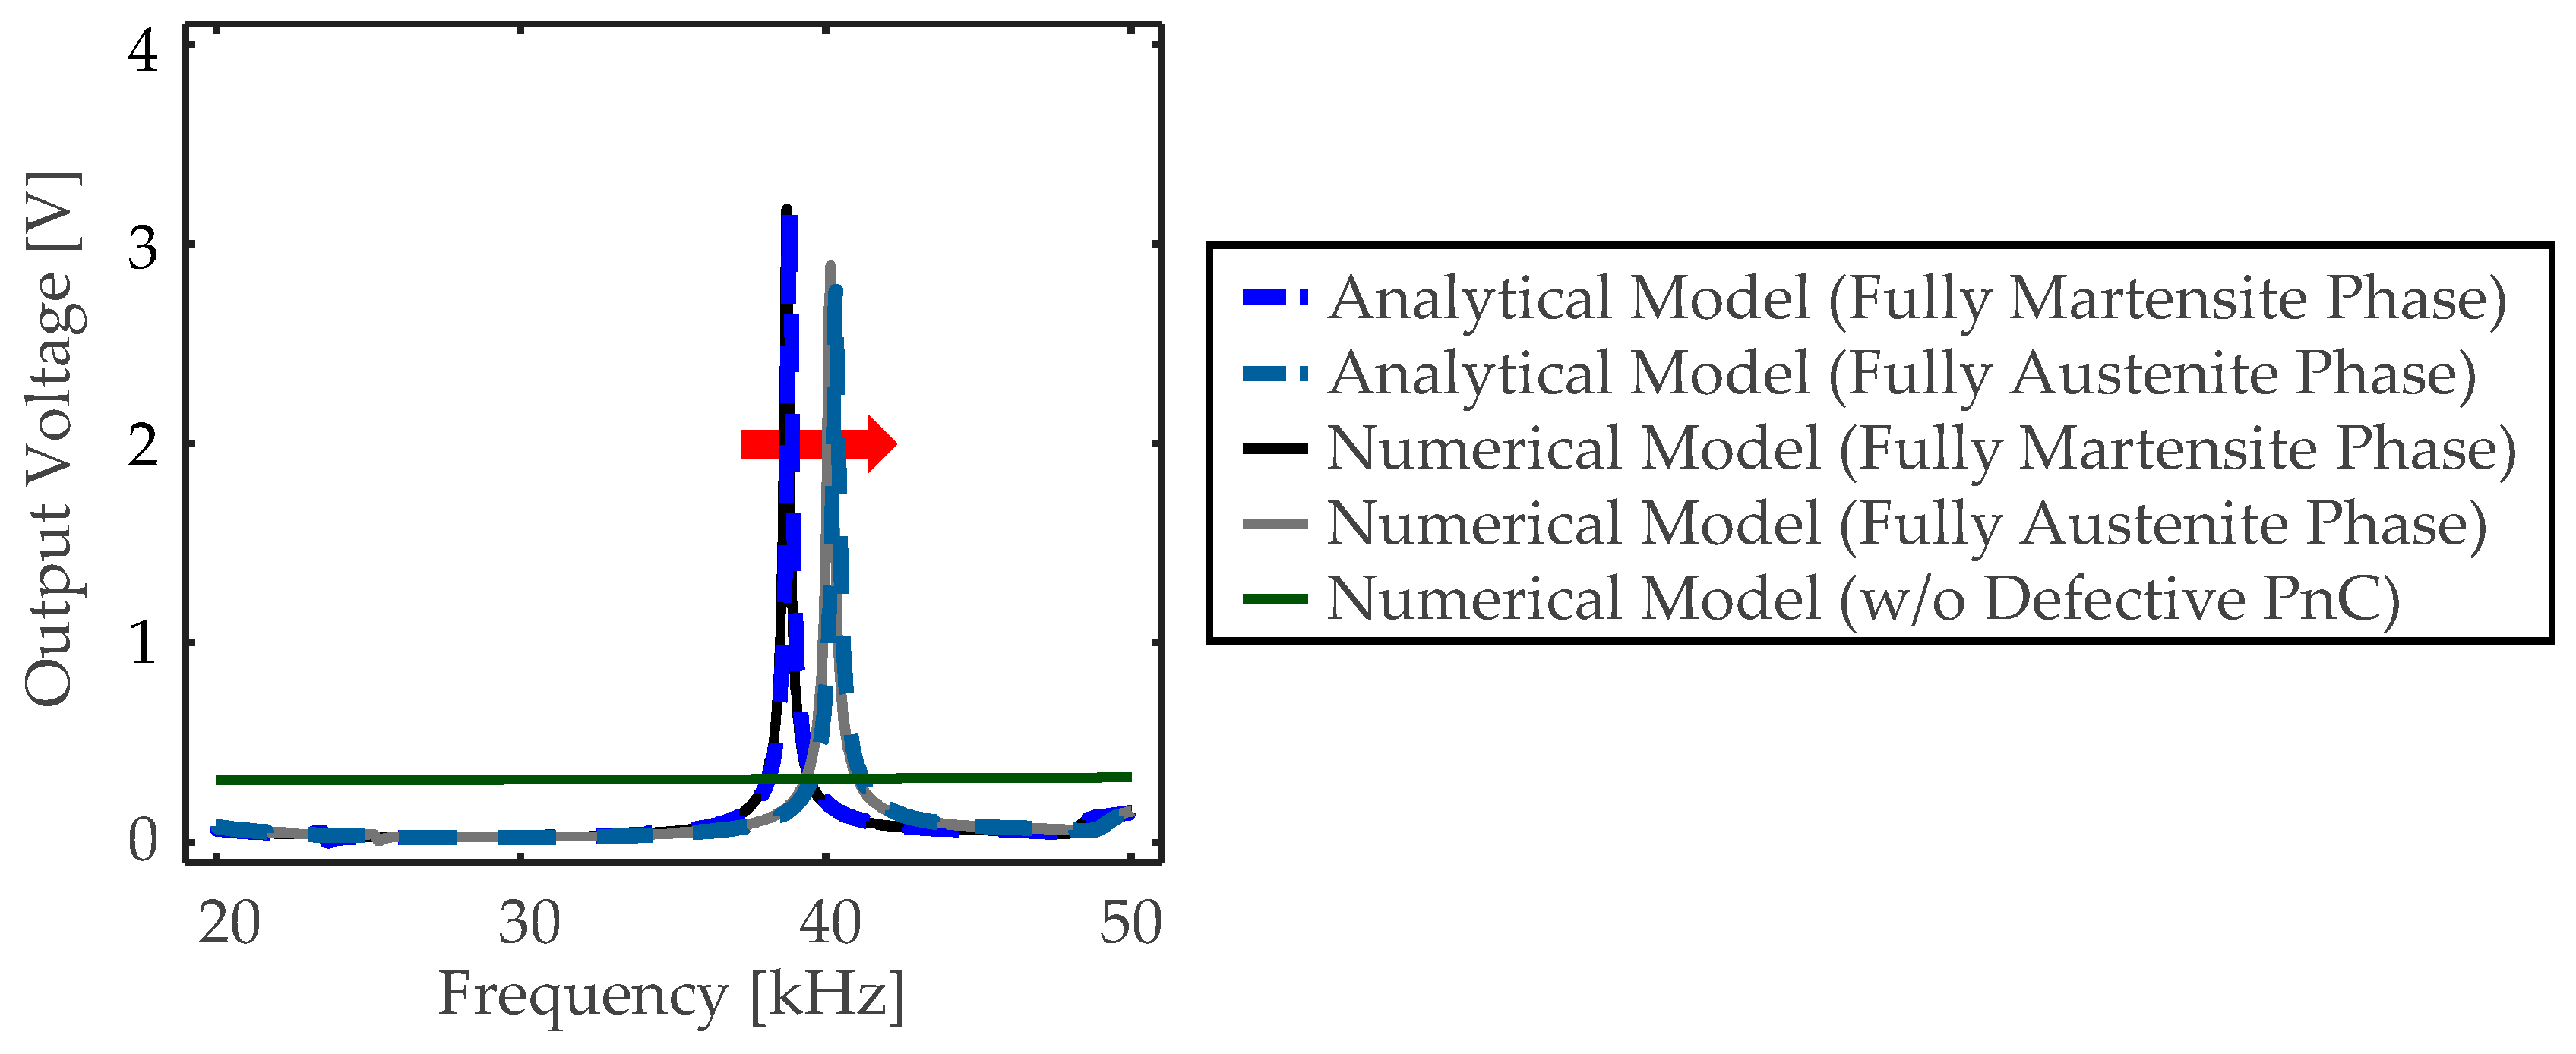
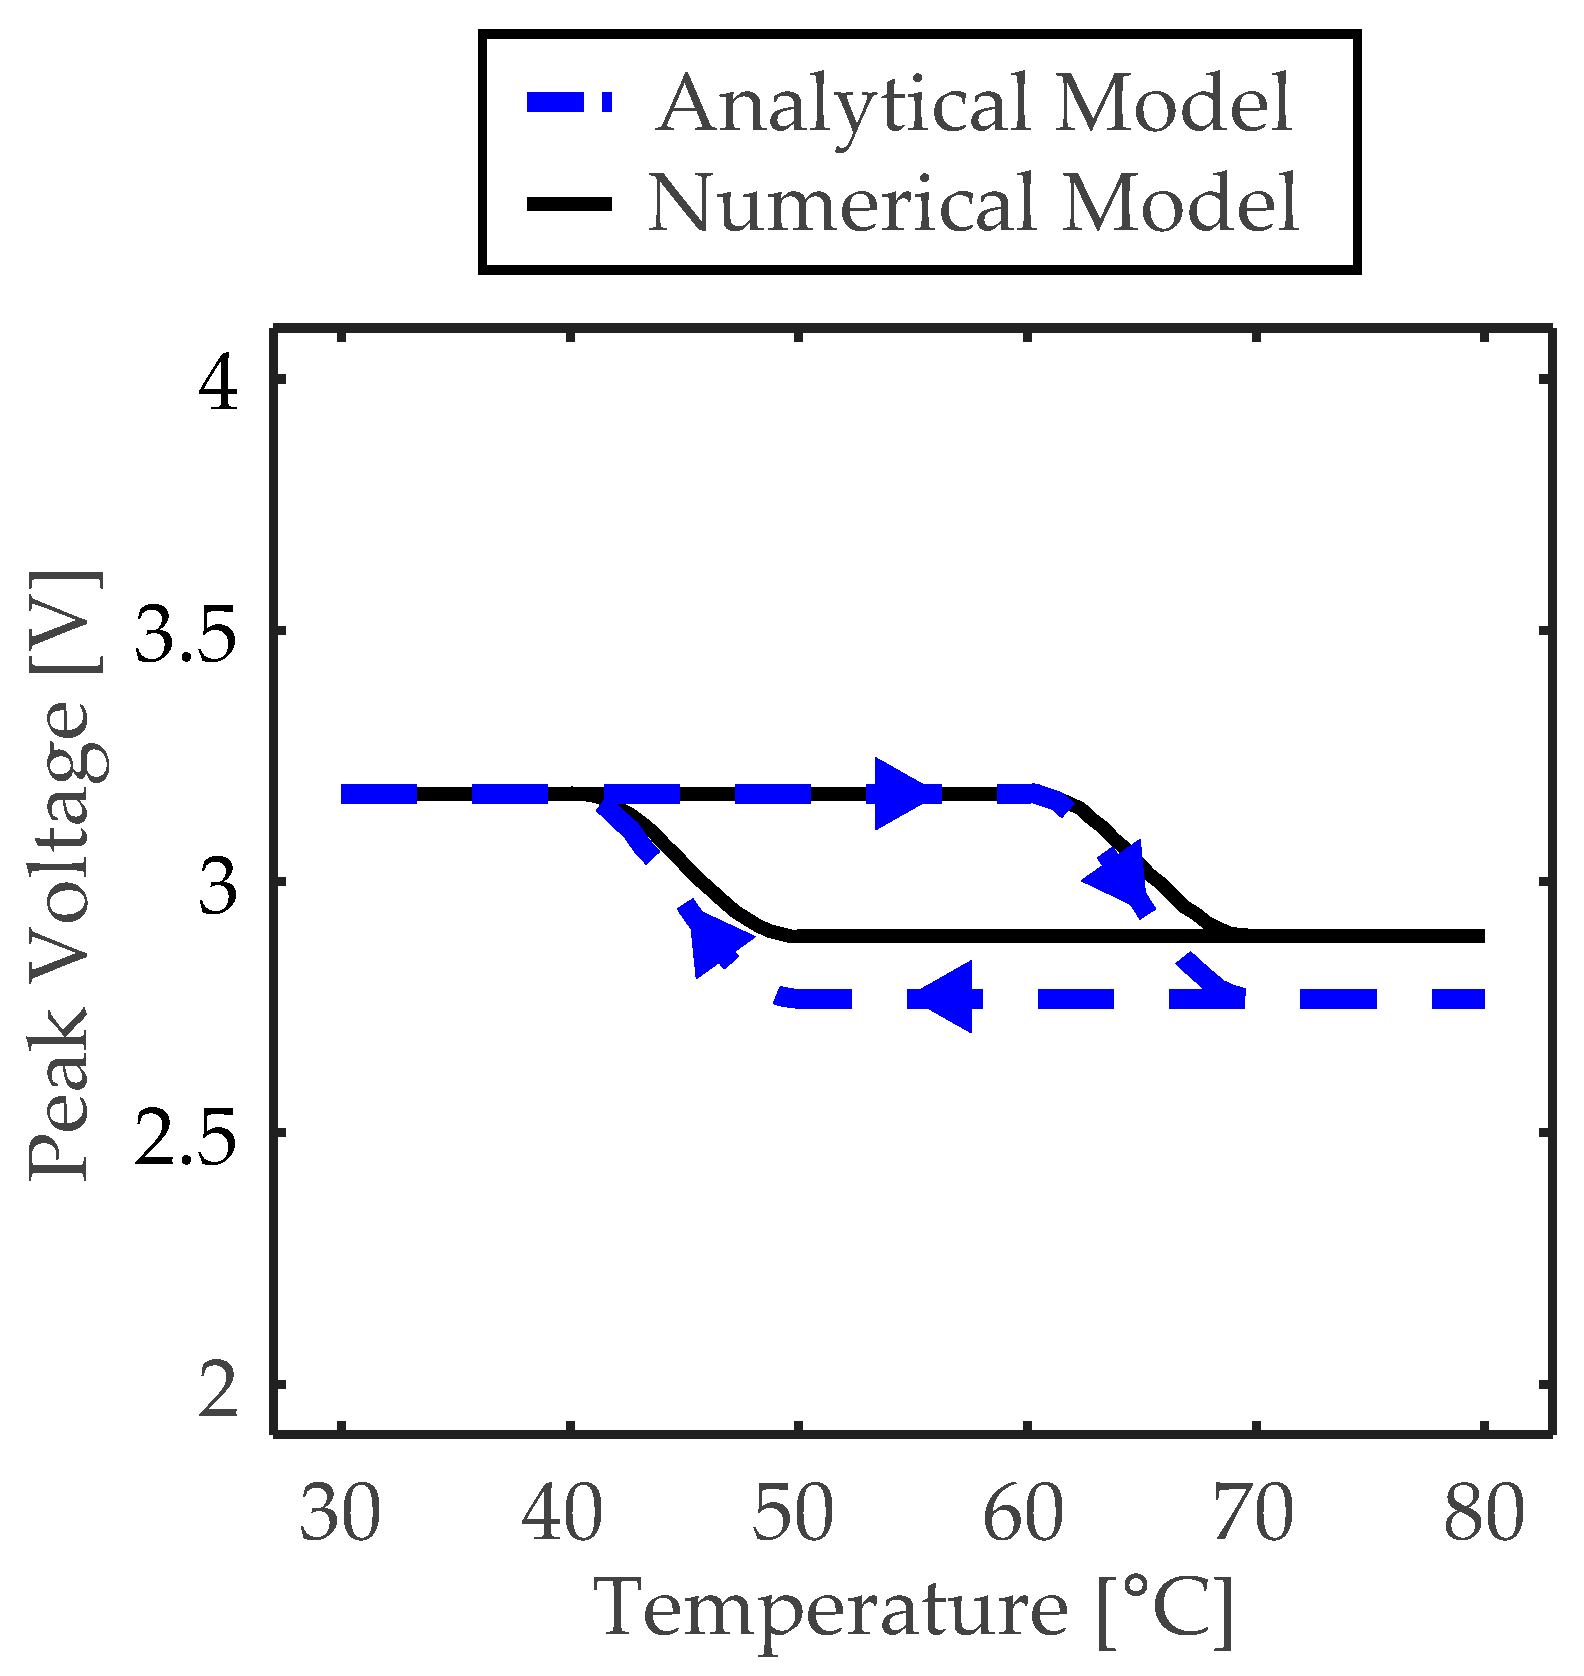
4.2. Validation Study in Analyses of Band Structure and Sensing Performance

When the SMAs are set to be in the fully martensite phase, as shown in Figure 4, the band-structure analysis reveals the presence of one phononic band gap (colored by the light-gray box) at the unit-cell level and two defect bands at the defective PnC level. The results for these band structures are overlaid in Figure 4. The defect-mode shapes corresponding to each defect band are shown in Figure 5. These defect-mode shapes can be conceptualized as displacement fields. These defect-mode shapes can be conceptualized as displacement fields. Prior to the discussion of the results, it is beneficial to provide concise definitions of the symmetry concepts employed. Left-right (mirror) symmetry is defined as a displacement field that exhibits a vertical axis of symmetry passing through the defect’s center, while point symmetry is characterized by a 180° rotational symmetry around the defect’s center. These symmetry characteristics are widely employed in the classification of defect-mode shapes in defective PnCs [44,49]. With respect to the center of the defect, Figure 5a exhibits left-right line symmetry, whereas Figure 5b shows point-symmetric behavior. Notwithstanding the observed differences in symmetry, it is evident that the displacement at the defect is amplified in both cases. It is imperative to acknowledge that the absolute displacement values obtained from the eigenvector are not inherently meaningful; instead, emphasis is placed exclusively on the displacement ratio between two distinct points. For clarity, the data are normalized such that the maximum value is set to 1.
In Figure 4 and Figure 5, the dashed line represents the results determined by the analytical model, whereas the solid line corresponds to the results from the COMSOL simulation. The analytical model predicts band-gap frequencies in the range of 21.73 to 46.38 kHz, whereas the COMSOL simulation yields frequencies between 21.73 and 46.24 kHz. For quantitative evaluation, the center and width of the band gap can be obtained as follows: for the analytical model, 34.06 and 24.65 kHz; for the COMSOL simulation, 33.99 and 24.51 kHz. The corresponding relative errors are calculated to be 0.2% and 0.6%, respectively. For the defect-band frequency, the analytical model provides values of 23.70 and 38.81 kHz, while the COMSOL simulation results are 23.67 and 38.72 kHz, respectively. The relative errors for these values are 0.1% and 0.2%, respectively. These results demonstrate that the analytical model can predict band structures with high accuracy. A qualitative analysis of Figure 5 further shows strong agreement between the results of the two models. Note that this phononic band gap is characterized by a complex number of wavenumbers, with the real part fixed at π. Consequently, the observed band structures within the gray box manifest as flat at π.
Recent theoretical studies have demonstrated that the underlying mechanism is evanescent waves, which induce mechanical resonance by establishing virtual fixed-like boundaries along with the unit cells adjacent to the defect [46]. Consequently, the defect-band frequency can be interpreted as the natural frequency that manifests in the wave region. It is noteworthy that the presence of two defect bands within the band gap is not a universal phenomenon. This phenomenon is attributed to the distinct configurations, as the band gaps are defined at the unit-cell level, while defect bands are primarily determined by the defects themselves. Consequently, the manifestation of defect bands may vary, ranging from an absence of bands to the emergence of a single band or the introduction of two bands when a defect is introduced. This paper intends to observe two defect bands, thereby providing insights into the selection of effective defect bands based on voltage cancellation from an ultrasonic sensing perspective.
Next, the focus shifts to increasing the temperature to transition SMAs into a fully austenitic phase. Subsequently, the temperature decreases to revert the SMAs to the fully martensitic phase. As outlined in Section 3.1, repeated heating and cooling cycles result in variations in the Young’s moduli of the SMAs. This change in Young’s modulus is expected to influence the defect-band frequencies, as shown in Figure 6. According to the analytical model, in the fully austenitic phase, the defect-band frequencies are approximately 25.34 and 40.32 kHz. As the temperature fluctuates, the first defect band is expected to have frequencies ranging from 23.7 to 25.34 kHz for the analytical model and from 23.67 to 25.45 kHz for the numerical model, whereas the second defect band spans frequencies from 38.81 to 40.32 kHz for the analytical model and 38.72 to 40.15 kHz for the numerical model. It has been demonstrated that by precisely controlling the temperature of SMAs using heat patches, defect-band frequencies can be dynamically adjusted within a specified frequency range. From a physical perspective, increasing the area or volume occupied by the SMAs within the defect (e.g., by increasing the length or height) will have a more pronounced effect on the variation in Young’s modulus, leading to a significantly broader range of frequencies. This constitutes a fundamental finding of the present study. It is noteworthy that the incorporation of SMAs fulfills a complementary function, such as the temperature-controlled mechanical properties. However, the presence of piezoceramics is imperative for active sensing.
The ensuing discourse directs attention to sensing performance, as illustrated in Figure 7. This figure presents five results, two of which are derived from the analytical model. The model posits that SMAs are either fully martensitic or austenitic. The remaining three results are derived from the COMSOL simulation. Two of these simulation results correspond to the scenario where defective PnC is present, with the SMAs in the fully martensitic or fully austenitic phases, respectively. The other result represents the case in which a defective PnC is absent, and only bimorph piezoceramics with the same specifications and configuration are placed on an infinite light-gray bar. This scenario is instrumental in determining the extent to which voltage sensitivity is enhanced by utilizing a defective PnC.
This analysis yields several key findings. First, the analytical and numerical models show consistent frequency response curves, validating the analytical model’s accuracy in predicting sensing performance. However, the relative difference becomes increasing when transitioning from martensite to austenite due to the limitations of classical rod theory. The difference in Young’s modulus between magnesium and SMA rises from 15 GPa in martensite to 45 GPa in austenite. As this difference grows, unaccounted effects in classical rod theory become more pronounced in COMSOL simulations. Second, the enhancement in the sensing performance is observed exclusively in the second defect band, whereas no amplification is detected near the first defect band. This phenomenon can be explained by the defect modes shown in Figure 5. For longitudinal waves, the spatial derivative of displacement represents the strain field. Therefore, the defect-mode shape in Figure 5a corresponds to a point-symmetric strain field. Consequently, positive and negative strains coexist within bimorph piezoceramics, leading to charge cancellation. Although this charge cancellation contributes to mechanical performance amplification by the defect mode, it does not result in any electrical performance enhancement. These conclusions are consistent with those reported in Refs [45,50,51]. Third, a discernible shift in the frequency response curve of the voltage is evident upon transitioning from the fully martensitic phase to the fully austenitic phase of the SMAs, which is attributed to the increase in Young’s modulus. In the fully martensitic phase, the peak frequency is 38.81 kHz, with a corresponding voltage of 3.17 V, whereas in the fully austenitic phase, the peak frequency is 40.32 kHz, and the corresponding voltage is 2.76 V. This demonstrates that the phase transformation of the SMA influences the peak frequency, thereby enabling adjustment of the sensing performance within a defined frequency range. Finally, it is evident that the peak output voltage in each phase is amplified by 10.2 and 8.9 times compared to the case without a defective PnC. This suggests that when the Young’s modulus of the SMAs is modified, the defect band or peak frequency is altered, whereas the output voltage is still highly amplified. These findings have significant implications for the design and performance of highly sensitive sensors.
It is imperative to note that the criteria employed for the selection of the frequency value require further investigation. Prior studies have documented the presence of elastic waves in two distinct ranges: 40 to 300 kHz in transformers [52] and 20 to 100 kHz in rotating machinery [53]. These findings suggest the existence of an overlapping frequency range, from which a minimum value of 40 kHz is consequently designated.
The ensuing analysis in Figure 8 shows the changes in the sensing performance during the heating and cooling processes. Given the consistency of the defect band and peak frequencies, these parameters are excluded from the present analysis, with emphasis on the variation in voltage. The data unequivocally demonstrate that the piezoceramic maintains a highly amplified voltage across all temperatures despite substantial temperature-induced changes in the Young’s modulus of the SMAs. The results of this study definitively address the question of whether the phase transition of SMAs can worsen the sensing performance. The findings demonstrate that the SMA-integrated defective PnC exhibits reliable sensing performance that is resilient to temperature variations.
The observed discrepancy between the analytical and numerical models can be attributed primarily to the foundational assumptions inherent in the analytical models. Specifically, the analytical model disregards lateral and shear deformations, while the numerical model incorporates these effects. Additionally, the homogenization techniques employed in the analytical model to approximate composite-type defects have a tendency to induce errors, particularly in cases where there is a substantial contrast in the Young’s moduli of the constituent materials. Furthermore, the assumption of a uniform displacement field throughout the cross-section introduces discrepancies that are contingent on the specific nature of the composite-type defects.

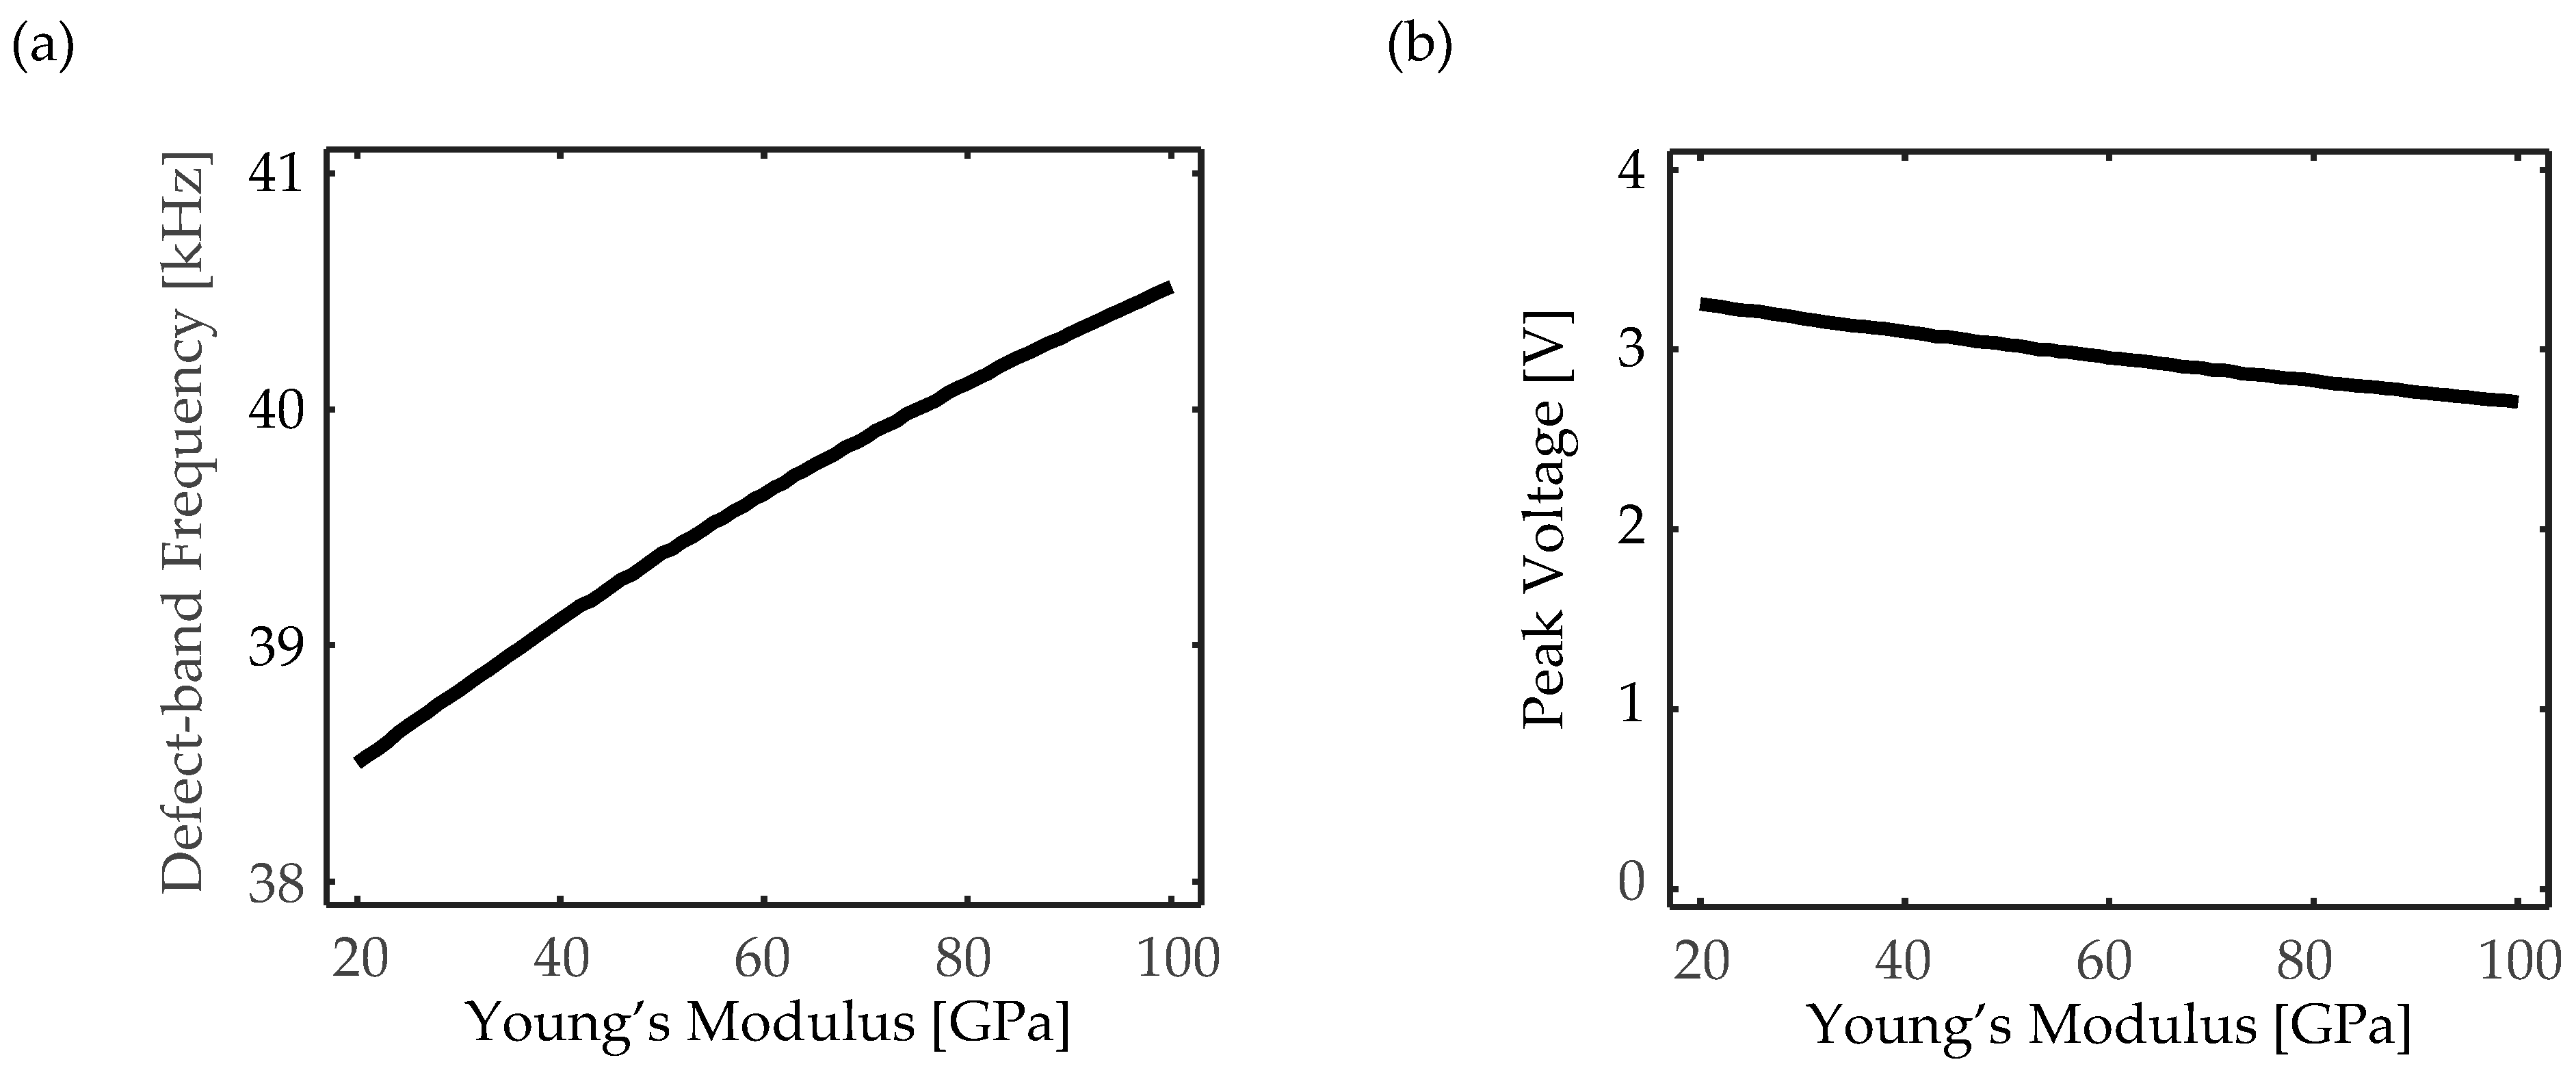
4.3. Parametric Study

This section presents two parametric studies designed to elucidate the effects of SMAs. Parametric studies are performed using the proposed analytical model. The first study investigates how the proportion of SMAs within the defect (i.e., the extent of SMAs) influences the defect-band frequency, which is critical for ultrasonic sensors, and the corresponding peak voltage. Figure 9 shows the results of this analysis. As shown in Figure 9a, as the proportion of SMAs increases, the defect-band frequency in the fully martensitic phase exhibits highly nonlinear behavior, in contrast to the monotonic increase observed in the fully austenitic state. Given that the density of SMAs is lower than that of piezoceramics, increasing the SMA ratio reduces the mass of the defect area. A parallel trend is observed in the behavior of Young’s modulus. In a fully martensitic state, where Young’s modulus is lower than that of piezoceramics, an increase in the SMA ratio leads to a decrease in the stiffness of the defect region. Conversely, under fully austenitic conditions, where Young’s modulus exceeds that of piezoceramics, an increase in the SMA ratio results in an increase in the stiffness of the defect region. In vibration analysis, when both mass and stiffness are reduced, the natural frequency is predicted to reach an extremum, defined as a maximum or a minimum, depending on the relative extent of the reductions. Conversely, when mass decreases while stiffness increases, the natural frequency is predicted to show a consistent upward trend. These theoretical predictions are clearly reflected in the trends depicted in Figure 9a. In contrast, Figure 9b illustrates that the peak voltage monotonically increases, regardless of the SMA phase, as the proportion of SMAs increases. From the standpoint of tunable ultrasonic sensors, Figure 9 serves as a design guide for defective PnCs. This result indicates that a higher SMA proportion enhances tunable capabilities, driven by the phase transformation between martensite and austenite, while simultaneously improving the sensing performance. Consequently, within a given configuration, utilizing miniaturized piezoceramics proves to be a more advantageous approach. This finding simplifies the fabrication and production of defective PnC-based ultrasonic sensors, as illustrated in Figure 1.
Next, the variation in the defect-band frequency and the corresponding peak voltage with respect to the Young’s modulus of the SMAs is analyzed. As shown in Figure 10, the results exhibit a straightforward trend. When the length ratio is fixed, as presented in Section 4.1, the defect-band frequency in Figure 10a increases monotonically with increasing Young’s modulus. In contrast, the peak voltage in Figure 10b shows a slight but consistent decrease with increasing Young’s modulus. These findings suggest that the selection of stiffness in both the martensitic and austenitic phases during SMAs’ fabrication would ultimately define the frequency range available for tunable ultrasonic sensor applications. Additionally, while voltage variations occur across the entire Young’s modulus range, the overall voltage remains significantly higher compared to cases without defective PnCs, ensuring that high-sensitivity performance is not compromised.

5. Conclusions

This study introduced a novel temperature-controlled tuning mechanism for defective phononic crystals (PnCs) by integrating shape memory alloys (SMAs). Through reversible phase transformations, SMAs enabled dynamic control over defect-band frequencies, thereby significantly enhancing the adaptability of ultrasonic sensors to complex environments. The analytical model developed in this study accurately predicted temperature-dependent changes in the defect bands and sensing performance, and numerical validation confirmed its effectiveness. The results demonstrated that defect-band frequencies could be precisely modulated while maintaining a high sensitivity. These findings represented a significant advancement in tunable PnC technology, providing a pathway for next-generation ultrasonic sensors with improved reliability and operational flexibility.
Subsequent research endeavors will center on experimental validation to substantiate theoretical and numerical findings under real-world conditions. In addition, the exploration of optimization strategies that leverage artificial intelligence and advanced computational techniques will be undertaken to enhance defective PnC designs and maximize tunability. The integration of multiphysics modeling, encompassing mechanical, thermal, and electrical interactions, will further refine the predictive capabilities of the analytical model by additionally considering thermal expansion of all structures and temperature-dependent geometric deformations of SMAs. Future work will center on the estimation of the control error and the calibration of inertia by incorporating transient heat transfer simulations. This approach will facilitate the assessment of delays and deviations in frequency calibration attributable to thermal exchange between the SMAs and the surrounding components. Expanding the application of temperature-controlled defective PnCs to fields such as biomedical imaging, vibration control, and energy harvesting is also a key direction. Finally, the development of novel SMA compositions or the consideration of shape memory characteristics will be investigated to improve the tunability, response time, and overall efficiency, paving the way for more advanced and adaptable ultrasonic sensing technologies.

Funding

This work was supported by the Basic Science Research Program through the National Research Foundation of Korea (NRF), funded by the Ministry of Education under Grant 2022R1I1A1A01056406.

Data Availability Statement

The original contributions presented in this study are included in the article. Further inquiries can be directed to the corresponding author.

Conflicts of Interest

The author declares no conflicts of interest.

Appendix A. Settings in COMSOL Simulations

COMSOL simulations are utilized to conduct both eigenfrequency and frequency domain analyses, with simulations carried out in a two-dimensional framework. The modeled structures are primarily composed of blocks and arrays that serve as fundamental geometric elements. Most structures follow an isotropic, linear elastic material model, except for piezoceramics and shape memory alloys. The analysis incorporates (nonlinear) solid mechanics, electrostatics, and electric circuit modules, with multiphysics coupling facilitating the conversion between mechanical and electrical responses. The displacement field and electric potential are discretized using a quadratic serendipity approach. A mapped meshing technique is applied uniformly across simulations, maintaining a maximum element size of 2 mm, which resulted in 1735 quadratic elements. The default simulation settings remain unchanged, and traction-free conditions are imposed on all exposed structural surfaces.
In the eigenfrequency analysis, the Floquet periodicity is applied as a periodic condition within the solid mechanics module. Conversely, frequency-domain analysis relies on three separate solid mechanics modules to examine the incident, transmitted, and reflected waves. To ensure proper interaction between these modules, displacement and force continuity conditions are enforced at their interfaces. In the case of incident waves, predefined displacement amplitudes are introduced into the input domain. A perfectly matched layer (PML), a frequently employed numerical boundary condition designed to absorb outgoing waves and minimize reflections in computational wave propagation simulations, is incorporated to emulate the semi-infinite structures. To ensure an accurate analysis of sensing performance, the structural dimensions are designed to exceed the wavelength corresponding to the target frequency range. In this study, each PML is configured with a length three times greater than that of the unit cell.
The electrostatic module integrates key elements, including charge conservation (piezoelectric), the ground, and terminal connections. When two piezoceramic components are electrically connected in series, a continuity condition is enforced at the interface, where the bottom surface of the upper component meets the top surface of the lower component. Moreover, the bottom surface of the lower piezoceramic was grounded, whereas the top surface of the upper component is linked to the terminal. In an electric circuit module, the ultrasonic sensor relies on an exceptionally high resistance of 1 GΩ for its operation.

References

  1. Vasileiadis, T.; Varghese, J.; Babacic, V.; Gomis-Bresco, J.; Navarro Urrios, D.; Graczykowski, B. Progress and perspectives on phononic crystals. J. Appl. Phys. 2021, 129, 160901. [Google Scholar] [CrossRef]
  2. Dong, H.-W.; Shen, C.; Liu, Z.; Zhao, S.-D.; Ren, Z.; Liu, C.-X.; He, X.; Cummer, S.A.; Wang, Y.-S.; Fang, D. Inverse design of phononic meta-structured materials. Mater. Today 2024, 80, 824–855. [Google Scholar] [CrossRef]
  3. Lee, J.; Kim, Y.Y. Elastic metamaterials for guided waves: From fundamentals to applications. Smart Mater. Struct. 2023, 32, 123001. [Google Scholar] [CrossRef]
  4. Zhou, X.; Sun, Y.; Yang, S.; Bian, Z. Band gap manipulation on P-wave propagating in functionally graded phononic crystal by periodical thermal field. Int. J. Mech. Sci. 2021, 212, 106817. [Google Scholar] [CrossRef]
  5. Wu, Q.; He, J.; Chen, W.; Li, Q.; Liu, S. Topology optimization of phononic crystal with prescribed band gaps. Comput. Methods Appl. Mech. Eng. 2023, 412, 116071. [Google Scholar] [CrossRef]
  6. Akbari-Farahani, F.; Ebrahimi-Nejad, S. From defect mode to topological metamaterials: A state-of-the-art review of phononic crystals & acoustic metamaterials for energy harvesting. Sens. Actuators A Phys. 2024, 365, 114871. [Google Scholar]
  7. Zhang, S.; Zhang, Z. Magnetically tunable band gaps and defect states of longitudinal waves in hard magnetic soft phononic crystal beams. Eur. J. Mech.-A/Solids 2025, 111, 105575. [Google Scholar] [CrossRef]
  8. Gao, X.; Qin, J.; Hong, J.; Wang, S.; Zhang, G. Wave propagation characteristics and energy harvesting of magnetically tunable defective phononic crystal microbeams. Acta Mech. 2025, 236, 1579–1597. [Google Scholar] [CrossRef]
  9. Yao, B.; Wang, S.; Hong, J.; Gu, S. Size and temperature effects on band gap analysis of a defective phononic crystal beam. Crystals 2024, 14, 163. [Google Scholar] [CrossRef]
  10. Jo, S.-H.; Lee, D. An improved analytical model of a thick defective phononic crystal for bending wave excitation. Int. J. Mech. Sci. 2024, 264, 108822. [Google Scholar] [CrossRef]
  11. Jo, S.-H. Electroelastically coupled stiffness matrix method for phononic crystals with piezoelectric defects and its applications to filters, sensors, and energy harvesters. Mech. Mater. 2025, 203, 105262. [Google Scholar] [CrossRef]
  12. Zhang, G.; Gao, X.; Wang, S.; Hong, J. Bandgap and its defect band analysis of flexoelectric effect in phononic crystal plates. Eur. J. Mech.-A/Solids 2024, 104, 105192. [Google Scholar] [CrossRef]
  13. Biçer, A.; Cicek, A. Liquid concentration sensing via weakly coupled point defects in a phononic crystal. J. Mol. Liq. 2024, 409, 125487. [Google Scholar] [CrossRef]
  14. Cao, Z.; Wang, K.; Wang, B. Energy harvesting performance of acoustic energy harvesters consisting of flexoelectric plates and defect-state phononic crystals. J. Vib. Eng. Technol. 2024, 12, 5101–5117. [Google Scholar] [CrossRef]
  15. Katch, L.; Moghaddaszadeh, M.; Willey, C.; Juhl, A.; Nouh, M.; Argüelles, A. Analysis of geometric defects in square locally resonant phononic crystals: A comparative study of modeling approaches. J. Acoust. Soc. Am. 2023, 154, 3052–3061. [Google Scholar] [CrossRef]
  16. Zhang, L.-Y.; Yin, X.; Yang, J.; Li, A.; Xu, G.-K. Multilevel structural defects-induced elastic wave tunability and localization of a tensegrity metamaterial. Compos. Sci. Technol. 2021, 207, 108740. [Google Scholar] [CrossRef]
  17. Hosseinkhani, A.; Ebrahimian, F.; Younesian, D.; Moayedizadeh, A. Defected meta-lattice structures for the enhanced localized vibrational energy harvesting. Nano Energy 2022, 100, 107488. [Google Scholar] [CrossRef]
  18. Zhong, J.; Xiang, J. Designing a phononic crystal with a large defect to enhance elastic wave energy localization and harvesting. Jpn. J. Appl. Phys. 2022, 61, 017002. [Google Scholar]
  19. Zhang, X.; Li, Y.; Wang, Y.; Jia, Z.; Luo, Y. Narrow-band filter design of phononic crystals with periodic point defects via topology optimization. Int. J. Mech. Sci. 2021, 212, 106829. [Google Scholar] [CrossRef]
  20. He, J.; Sun, J.; Fan, J.; Jia, Z.; Zhang, X. Optimal designs of phononic crystal microstructures considering point and line defects. Symmetry 2021, 13, 1993. [Google Scholar] [CrossRef]
  21. Xiao, J.; Ding, X.; Wang, Y.; Huang, W.; He, Q.; Shao, Y. Gear fault detection via directional enhancement of phononic crystal resonators. Int. J. Mech. Sci. 2024, 278, 109453. [Google Scholar] [CrossRef]
  22. Xiao, J.; Ding, X.; Huang, W.; He, Q.; Shao, Y. Rotating machinery weak fault features enhancement via line-defect phononic crystal sensing. Mech. Syst. Signal Process. 2024, 220, 111657. [Google Scholar] [CrossRef]
  23. Na, K.; Kim, K.; Yoo, J.; Lee, J.; Youn, B.D. Optimized relative entropy for robust fault detection in excavator traveling gearboxes via smeared envelope spectrum analysis of cyclo-non-stationary signals. Expert Syst. Appl. 2025, 266, 126110. [Google Scholar] [CrossRef]
  24. Na, K.; Kim, Y.; Yoon, H.; Youn, B.D. FASER: Fault-affected signal energy ratio for fault diagnosis of gearboxes under repetitive operating conditions. Expert Syst. Appl. 2024, 238, 122078. [Google Scholar] [CrossRef]
  25. Zhang, G.; He, Z.; Wang, S.; Hong, J.; Cong, Y.; Gu, S. Elastic foundation-introduced defective phononic crystals for tunable energy harvesting. Mech. Mater. 2024, 191, 104909. [Google Scholar] [CrossRef]
  26. Yang, J.; Jo, S.-H. Experimental validation for mechanically tunable defect bands of a reconfigurable phononic crystal with permanent magnets. Crystals 2024, 14, 701. [Google Scholar] [CrossRef]
  27. Jo, S.-H. Electrically controllable behaviors in defective phononic crystals with inductive-resistive circuits. Int. J. Mech. Sci. 2024, 278, 109485. [Google Scholar] [CrossRef]
  28. Jo, S.-H.; Park, M.; Kim, M.; Yang, J. Tunable bandpass filters using a defective phononic crystal shunted to synthetic negative capacitance for longitudinal waves. J. Appl. Phys. 2024, 135, 164502. [Google Scholar] [CrossRef]
  29. Kim, M.S.; Heo, J.K.; Rodrigue, H.; Lee, H.T.; Pané, S.; Han, M.W.; Ahn, S.H. Shape memory alloy (SMA) actuators: The role of material, form, and scaling effects. Adv. Mater. 2023, 35, 2208517. [Google Scholar] [CrossRef]
  30. Tabrizikahou, A.; Kuczma, M.; Łasecka-Plura, M.; Farsangi, E.N.; Noori, M.; Gardoni, P.; Li, S. Application and modelling of Shape memory alloys for structural vibration control: State-of-the-art review. Constr. Build. Mater. 2022, 342, 127975. [Google Scholar] [CrossRef]
  31. Miyabuchi, H.; Yoshimura, T.; Murakami, S.; Fujimura, N. Characterization of direct piezoelectric effect in 31 and 33 modes for application to vibration energy harvester. Jpn. J. Appl. Phys. 2011, 50, 09ND17. [Google Scholar] [CrossRef]
  32. Kim, D.; Hewa-Kasakarage, N.N.; Hall, N.A. A theoretical and experimental comparison of 3-3 and 3-1 mode piezoelectric microelectromechanical systems (MEMS). Sens. Actuators A Phys. 2014, 219, 112–122. [Google Scholar] [CrossRef]
  33. Kim, S.-B.; Park, H.; Kim, S.-H.; Wikle, H.C.; Park, J.-H.; Kim, D.-J. Comparison of MEMS PZT cantilevers based on d33 and d31 modes for vibration energy harvesting. J. Microelectromechanical Syst. 2012, 22, 26–33. [Google Scholar] [CrossRef]
  34. Candido de Sousa, V.; Tan, D.; De Marqui, C.; Erturk, A. Tunable metamaterial beam with shape memory alloy resonators: Theory and experiment. Appl. Phys. Lett. 2018, 113, 143502. [Google Scholar] [CrossRef]
  35. Chuang, K.-C.; Lv, X.-F.; Wang, Y.-H. A bandgap switchable elastic metamaterial using shape memory alloys. J. Appl. Phys. 2019, 125, 055101. [Google Scholar] [CrossRef]
  36. Lv, X.-F.; Xu, S.-F.; Huang, Z.-L.; Chuang, K.-C. A shape memory alloy-based tunable phononic crystal beam attached with concentrated masses. Phys. Lett. A 2020, 384, 126056. [Google Scholar] [CrossRef]
  37. van den Boom, S.; van Keulen, F.; Aragón, A. Fully decoupling geometry from discretization in the Bloch–Floquet finite element analysis of phononic crystals. Comput. Methods Appl. Mech. Eng. 2021, 382, 113848. [Google Scholar] [CrossRef]
  38. Chin, E.B.; Mokhtari, A.A.; Srivastava, A.; Sukumar, N. Spectral extended finite element method for band structure calculations in phononic crystals. J. Comput. Phys. 2021, 427, 110066. [Google Scholar] [CrossRef]
  39. Schalcher, L.; Dos Santos, J.; Miranda, E., Jr. Extended plane wave expansion formulation for 1-D viscoelastic phononic crystals. Partial Differ. Equ. Appl. Math. 2023, 7, 100489. [Google Scholar] [CrossRef]
  40. Shen, W.; Cong, Y.; Gu, S.; Yin, H.; Zhang, G. A rasterized plane wave expansion method for complex 2-D phononic crystals. Mech. Syst. Signal Process. 2024, 212, 111324. [Google Scholar] [CrossRef]
  41. Jo, S.-H.; Lee, D.; Yoon, H.; Youn, B.D. Double piezoelectric defects in phononic crystals for ultrasonic transducers. J. Phys. D Appl. Phys. 2023, 56, 074002. [Google Scholar] [CrossRef]
  42. Manktelow, K.; Leamy, M.J.; Ruzzene, M. Comparison of asymptotic and transfer matrix approaches for evaluating intensity-dependent dispersion in nonlinear photonic and phononic crystals. Wave Motion 2013, 50, 494–508. [Google Scholar] [CrossRef]
  43. Han, L.; Zhang, Y.; Ni, Z.-Q.; Zhang, Z.-M.; Jiang, L.-H. A modified transfer matrix method for the study of the bending vibration band structure in phononic crystal Euler beams. Phys. B Condens. Matter 2012, 407, 4579–4583. [Google Scholar] [CrossRef]
  44. Jo, S.-H.; Youn, B.D. An explicit solution for the design of a target-frequency-customized, piezoelectric-defect-introduced phononic crystal for elastic wave energy harvesting. J. Appl. Phys. 2021, 130, 184902. [Google Scholar] [CrossRef]
  45. Jo, S.-H.; Yoon, H.; Shin, Y.C.; Youn, B.D. An analytical model of a phononic crystal with a piezoelectric defect for energy harvesting using an electroelastically coupled transfer matrix. Int. J. Mech. Sci. 2021, 193, 106160. [Google Scholar] [CrossRef]
  46. Jo, S.-H.; Yoon, H.; Shin, Y.C.; Youn, B.D. Revealing defect-mode-enabled energy localization mechanisms of a one-dimensional phononic crystal. Int. J. Mech. Sci. 2022, 215, 106950. [Google Scholar] [CrossRef]
  47. Billah, T.; Aquib, T.I.; Dey, K. A review on surface modification of NiTinol for biomedical applications. J. Mater. Sci. 2024, 59, 19340–19379. [Google Scholar] [CrossRef]
  48. Wadood, A. Brief overview on nitinol as biomaterial. Adv. Mater. Sci. Eng. 2016, 2016, 4173138. [Google Scholar] [CrossRef]
  49. Jo, S.-H.; Youn, B.D. Longitudinal wave localization using a one-dimensional phononic crystal with differently patterned double defects. Int. J. Mech. Sci. 2023, 237, 107783. [Google Scholar] [CrossRef]
  50. Zhang, G.-Y.; Liu, Z.-J.; Guo, Y.; Dou, X.-L.; Zhang, C.-R.; Sun, X.-W. Effect of incomplete line defect size on energy localization and harvesting in phononic crystals. J. Acoust. Soc. Am. 2024, 156, 3921–3929. [Google Scholar] [CrossRef]
  51. Deng, T.; Zhao, L.; Jin, F. Dual-functional perforated metamaterial plate for amplified energy harvesting of both acoustic and flexural waves. Thin-Walled Struct. 2024, 197, 111615. [Google Scholar] [CrossRef]
  52. Lima, S.E.; Frazão, O.; Farias, R.G.; Araujo, F.M.; Ferreira, L.A.; Santos, J.L.; Miranda, V. Mandrel-based fiber-optic sensors for acoustic detection of partial discharges—A proof of concept. IEEE Trans. Power Deliv. 2010, 25, 2526–2534. [Google Scholar] [CrossRef]
  53. Kim, S.J.; Kim, K.; Hwang, T.; Park, J.; Jeong, H.; Kim, T.; Youn, B.D. Motor-current-based electromagnetic interference de-noising method for rolling element bearing diagnosis using acoustic emission sensors. Measurement 2022, 193, 110912. [Google Scholar] [CrossRef]
Figure 1. Front view of the system configurations used for predicting and evaluating band structures and sensing performance: (a) unit cells and defective PnCs for band-structure analysis, including phononic band gaps, defect bands, and defect-mode shapes; (b) defective PnCs integrated with semi-infinite structures for sensing-performance analysis, such as frequency response curves of the output voltage.
Crystals 15 00412 g001
Figure 2. Temperature-dependent Young’s modulus transition in SMAs during periodic heating-cooling cycles. The red solid curve represents the increase in modulus during heating as the material transitions from martensite to austenite, while the blue dashed curve illustrates the decrease in modulus during cooling as the material transforms back to martensite.
Crystals 15 00412 g002
Figure 3. Expected results from the analytical model presented in Section 3.2 and Section 3.3: (a) schematic representation of the band gap and defect bands, along with the corresponding defect-mode shapes; (b) predicted sensing performance, showing a sharp resonance peak in output voltage as a function of frequency. In (b), the top figure represents the visualized displacement field in the two-dimensional space, and the red arrow denotes the space where the displacement information is extracted.
Crystals 15 00412 g003
Figure 4. Results of phononic band gaps and defect bands when the SMAs are set to be in the fully martensite phase.
Crystals 15 00412 g004
Figure 5. Results of defect-mode shapes when the SMAs are set to be in the fully martensite phase: (a) the first defect-mode shape identified at the defect-band frequencies of 23.70 (analytical model) and 23.67 kHz (numerical model); (b) the second defect-mode shape identified at the defect-band frequencies of 38.81 (analytical model) and 38.72 kHz (numerical model). The green and blue regions within the figure represent the piezoceramics and SMAs, respectively.
Crystals 15 00412 g005
Figure 6. Results of the temperature effects on defect-band frequencies: (a) the first defect band and (b) the second defect band.
Crystals 15 00412 g006
Figure 7. Results of frequency response curves for output voltage when the SMAs are set to be in the fully martensite or austenite phases. The red arrow represents the movement of the output voltage when the SMA’s phase is transformed from the full martensite to austenite.
Crystals 15 00412 g007
Figure 8. Results of the temperature effects on peak voltage values.
Crystals 15 00412 g008
Figure 9. Effects of the SMA ratio within the defect: (a) defect-band frequency and (b) corresponding peak voltage response. For a given length, the physical properties can remain within the bounds of the light-gray box at a specific temperature.
Crystals 15 00412 g009
Figure 10. Effects of the Young’s modulus of the SMAs: (a) defect-band frequency and (b) corresponding peak voltage response.
Crystals 15 00412 g010
Disclaimer/Publisher’s Note: The statements, opinions and data contained in all publications are solely those of the individual author(s) and contributor(s) and not of MDPI and/or the editor(s). MDPI and/or the editor(s) disclaim responsibility for any injury to people or property resulting from any ideas, methods, instructions or products referred to in the content.

