Article

Impact of Inter-Modular Connections on Progressive Compressive Behavior of Prefabricated Column-Supported Volumetric Modular Steel Frames

1
Department of Civil Engineering & Architecture, Taizhou University, Taizhou 317700, China
2
Department of Civil Engineering, Tianjin University, Tianjin 300350, China
3
Jieyi Architectural Technology Co., Ltd., Shanghai 200031, China
4
Central Research Institute, Baosteel Group, Shanghai 201900, China
*
Author to whom correspondence should be addressed.
These authors contributed equally to this work.
Crystals 2025, 15(5), 413; https://doi.org/10.3390/cryst15050413
Submission received: 29 March 2025 / Revised: 21 April 2025 / Accepted: 25 April 2025 / Published: 28 April 2025

Abstract

:
This study investigates the progressive compressive behavior of modular interior frames with rotary-type module-to-module inter-modular (M2M) connections under sequential column failure. A novel two-stage testing protocol was applied, compressing the left upper column to failure, followed by the right, to simulate realistic loading progression in prefabricated column-supported volumetric modular steel structures. Detailed refined finite-element models (FEMs) were developed and validated against experimental results, accurately capturing local and global responses with an average prediction error of 2–10% for strength and stiffness. An extensive parametric study involving varying frame configurations evaluated the influence of frame member geometric properties, connection details, and column/beam gap interaction on progressive collapse behavior. The results demonstrated that upper columns govern failure through elastic–plastic buckling near M2M joints while other members/connections remain elastic/unyielded. Increasing column cross section and thickness significantly enhanced strength and stiffness, while longer columns and prior damage reduced capacity, particularly during right-column loading. Conventional steel design codes overestimated column strength, with mean Pu,FEM/Pu,code ratios below unity and high scatter (Coefficient of variation ~0.25–0.27), highlighting the inadequacy of isolated member-based design equations for modular assemblies. The findings emphasize the need for frame-based stability approaches that account for M2M joint semi-rigidity, sway sensitivity, and sequential failure effects to ensure the reliable design of modular steel frames under progressive compressive loads.

1. Introduction

Prefabricated column-supported volumetric modular steel structures (MSSs) facilitate faster assembly, enhanced quality control, and optimized material utilization for high-rise projects by shifting 95% of construction off-site [1,2,3]. These large-scale projects, including the Croydon (44-story) and B2 (32-story) towers, exemplify the feasibility and efficiency of modular construction [4,5]. A critical component in these structures is the module-to-module inter-modular (M2M) connections, which govern global stability, force transferability, and structural integrity by linking adjacent modules [6,7,8,9]. Extensive studies have examined M2M behavior under tensile [10,11,12,13], shear [14,15,16], bending [17,18,19,20], seismic [21,22,23,24], and compressive loads [25,26], revealing that their semi-rigid and discontinuous nature significantly influences failure modes and load transfer mechanisms compared to monolithic steel frames. However, most studies assume uniform compressive loading and overlook progressive column failure, where sequential column collapse alters stress distribution within the frame.
The compressive behavior of steel columns has been widely studied, focusing on the influence of cross-section and material properties on buckling resistance. Chan and Gardner [27] found that elliptical sections outperform circular due to their higher moment of inertia. Meng and Gardner [28] demonstrated that local buckling governs capacity loss in slender square/rectangular columns. Ma et al. [29] observed that higher-strength steel increases the column’s capacity but amplifies imperfections and residual stresses, reducing ductility. Chen et al. [30] concluded that AISC 360-16 [31] and EN 1993 [32] tend to overestimate safety margins for high-strength columns. While these studies provide critical insights into axial compression, they assume uniform loading and idealized boundary conditions, neglecting modular frames’ semi-rigid behavior, discontinuities, and member grouping effects against progressive compressive loading.
Research on modular walls has revealed that concrete filling enhances buckling resistance, with GB50017 [33] providing conservative capacity estimates [34,35,36,37,38]. However, these studies focus on single-story walls, disregarding load redistribution in multi-story modular frames. Other investigations of modular columns featuring shear key M2M joints have led to effective length factors, buckling loads, and strength equations [39,40,41,42,43,44]. Yet, these findings remain specific to particular column types, limiting their applicability to full-scale modular frames. Additionally, compared to shear-keyed M2M joints [45,46,47,48], other types like bolted [49,50,51,52], welded [53,54], self-locking [13,18,55,56], pre/post-tension [57,58,59,60,61], and rotary [11,62] connections exhibit distinct stiffness characteristics, making existing design assumptions inadequate. Efforts to improve compressive stability design have proposed alignment charts, classification frameworks, and effective length factor equations for pin, semi-rigid, and rigid modular sway/non-sway frames [63,64,65,66,67,68]. However, these approaches fail to capture nonlinear post-buckling behavior and lack validation for progressive collapse scenarios. Additionally, existing steel design codes have yet to be experimentally assessed for their applicability in modular frame columns under progressive compressive failure, warranting further investigation.
Extensive studies on progressive collapse in MSSs have primarily focused on sudden column or module loss scenarios, evaluating load redistribution and failure propagation mechanisms. Alembagheri et al. [69] and Luo et al. [70] found that the shear stiffness and high rotational stiffness of M2M connections enhance collapse resistance. He et al. [71] and Chua et al. [72] revealed that MSSs have lower progressive collapse resistance than conventional steel frames due to discontinuous diaphragms. Peng et al. [73] and Yu et al. [74] observed that taller modular frames delay collapse via catenary action, while Shan and Pan [75], Mao et al. [76], and Zhang et al. [77] concluded that bracing systems, corrugated steel walls, beam/column configurations, and increased M2M stiffness improve robustness. While these studies provide insights into modular progressive collapse, they focus on instantaneous column/module removal and tensile mechanisms (e.g., catenary action, membrane forces) as mitigation strategies. However, they fail to capture gradual stress redistribution, P-Δ effects, and the sequential nature of column failure under real-world progressive loading. Unlike sudden column/module removal, progressive column compressive failure occurs stepwise, with load redistribution influenced by M2M stiffness, inter-module force transfer, and member slenderness—factors that have been overlooked in current research.
This study investigates the progressive compression response of modular frames with rotary-type M2M connections. By applying sequential compression, where the left column is loaded to failure followed by the right column, it captures stepwise load redistribution, stress evolution, and stability loss under controlled axial loading. Unlike traditional progressive collapse studies, this research emphasizes P-Δ effects and frame stability variations, offering new insights into modular progressive-failure mechanisms. This study comprises experimental testing on a modular frame, which is validated by a finite-element model (FEM) simulating progressive column failure. A parametric study further evaluates the effects of beam and column length, cross-section dimensions, and spacing on compressive resistance, stiffness, and ductility. Theoretical models based on GB 50017 [33], NZS 3404 [78], IS800 [79,80], AISC360 [31], EC3 [32], and CSA S16 [81] assess whether existing codes accurately predict progressive compressive failure in MSSs. This research aims to enhance modular frame design for safety, efficiency, and cost-effectiveness, informing potential code modifications for progressive failure scenarios.

2. Experimental Testing

The progressive compressive testing of column-supported modular steel frames with rotary M2M connections was conducted to examine sequential load redistribution and failure mechanisms under axial compression. A scaled subassembly was tested to replicate the behavior of a full-scale modular frame, maintaining realistic inflection points for beams and columns [82].

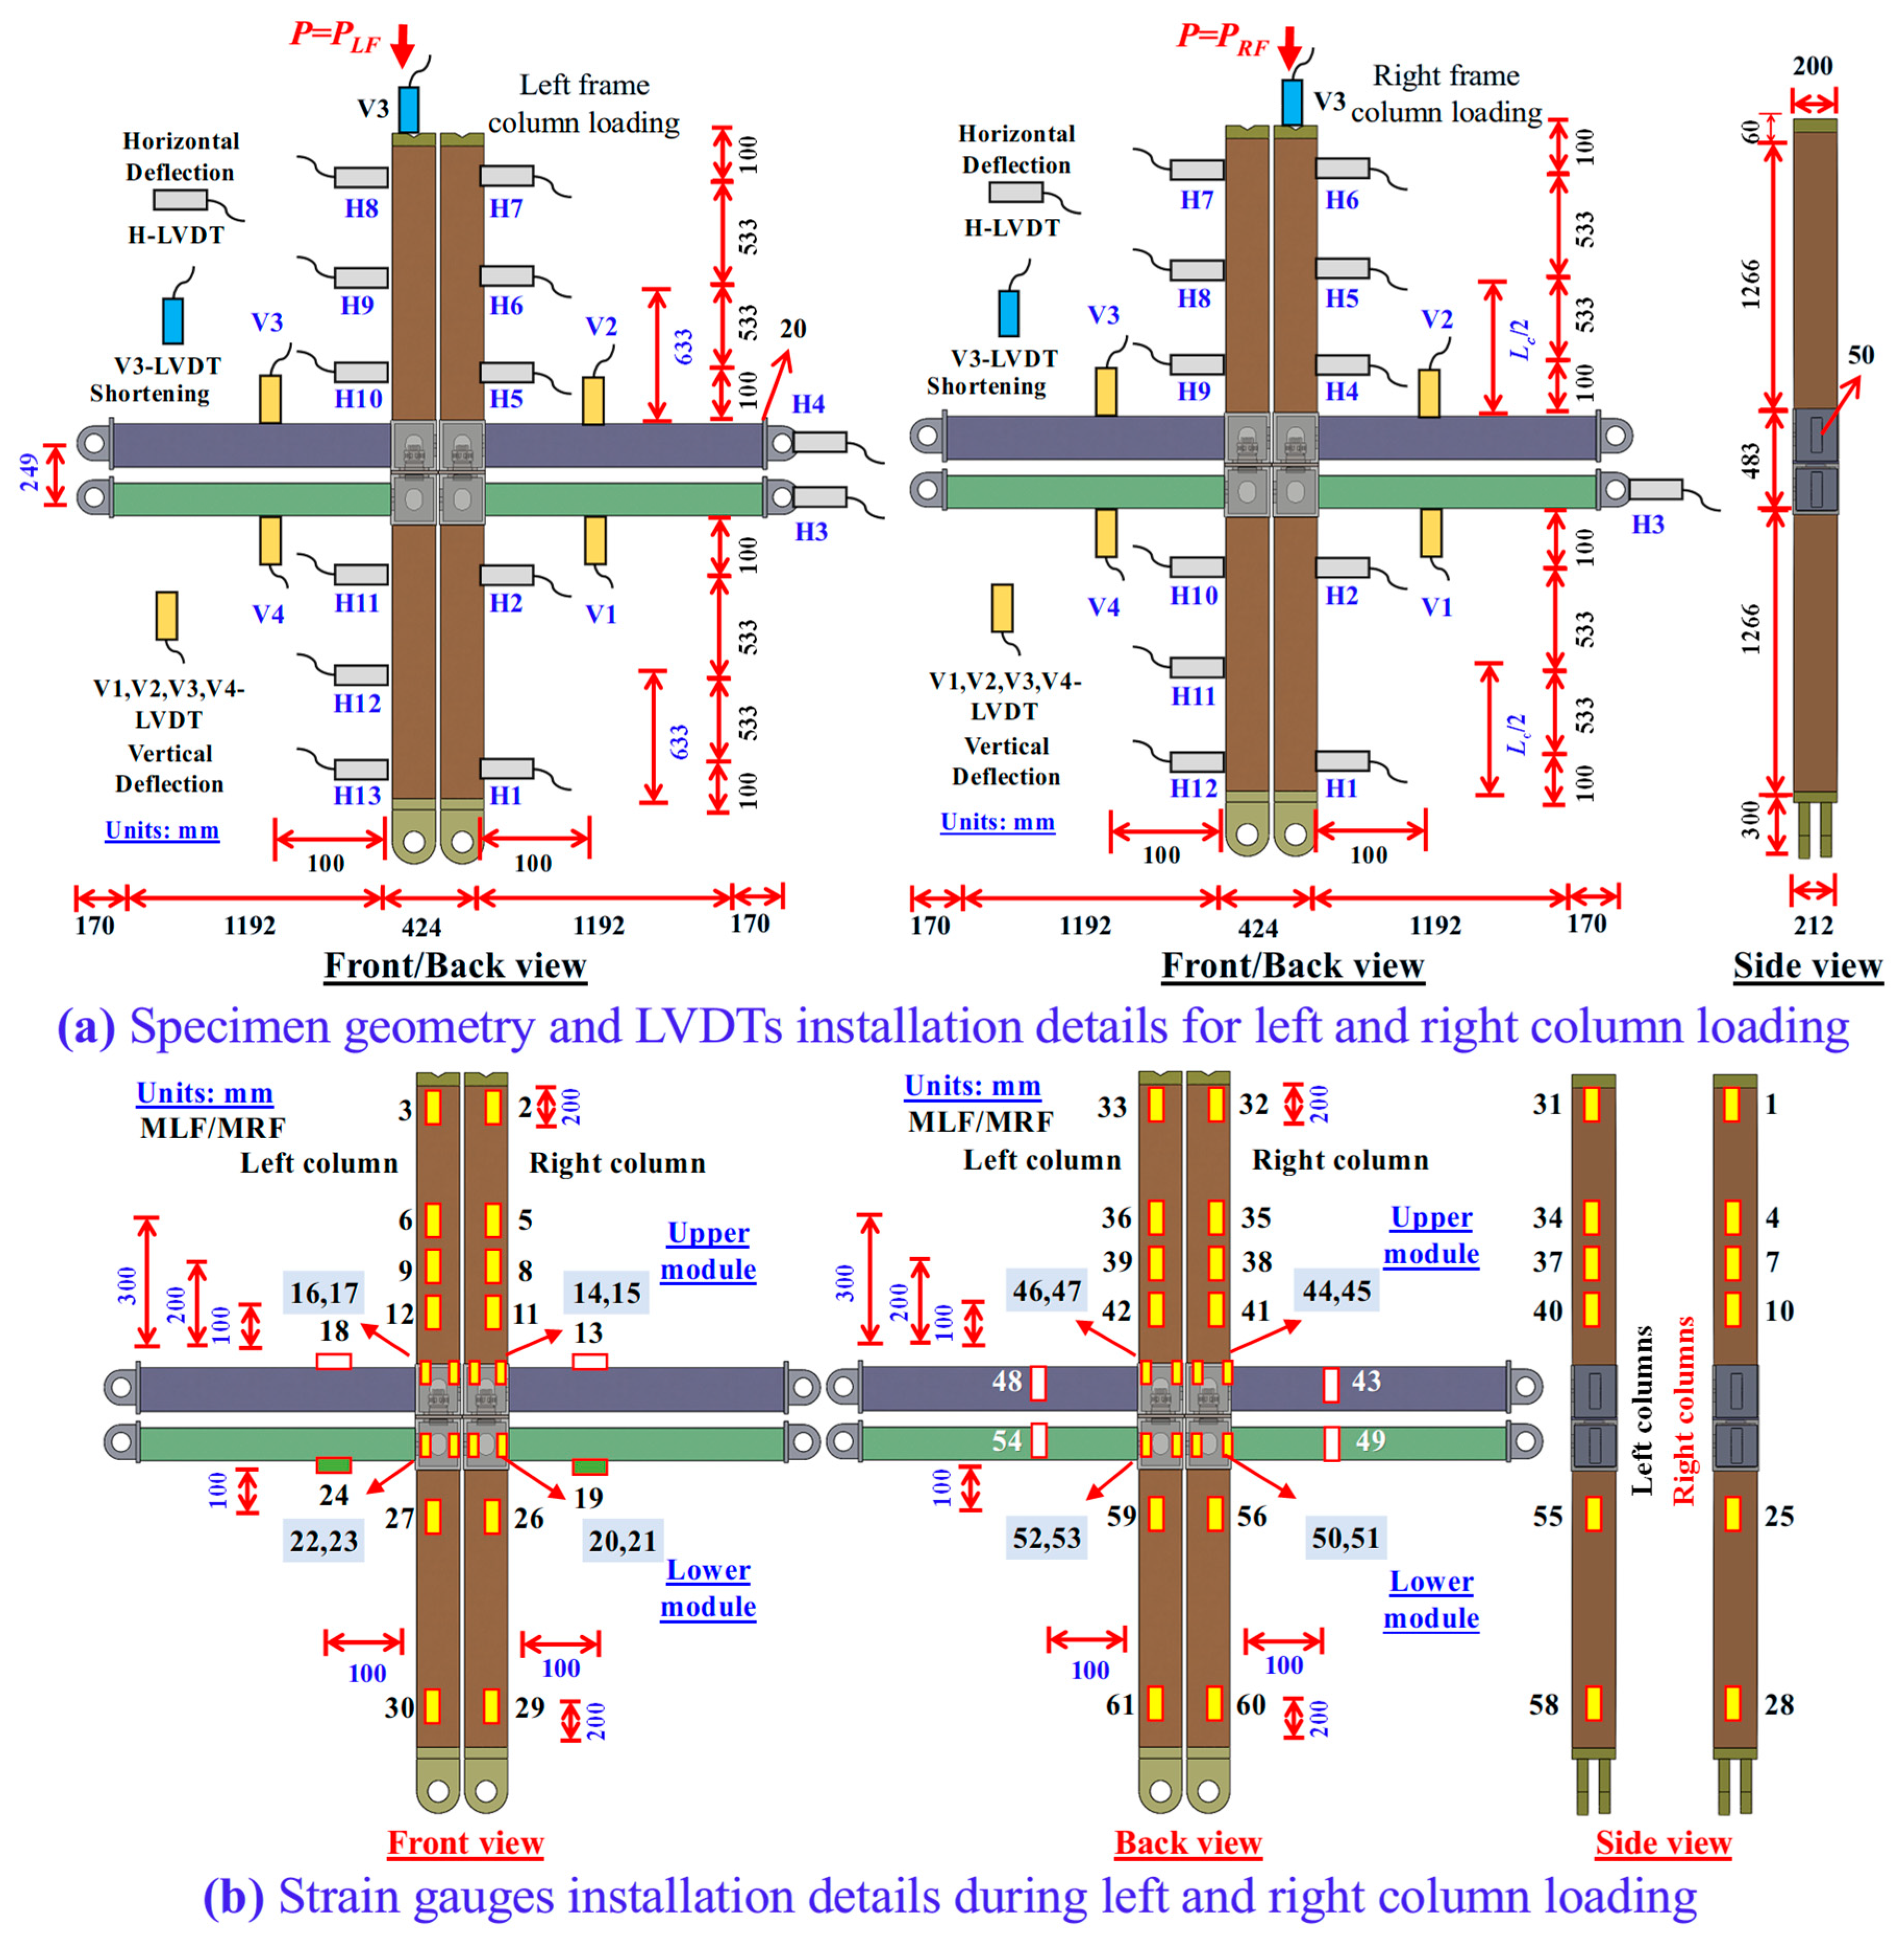
2.1. Specimen Design and Geometry

The modular frame and rotary M2M connections were designed based on the mid-rise MSS prototype described in Refs. [11,62] to ensure a secure load path between adjacent modules, as illustrated in Figure 1. A progressive loading setup was implemented, where the left frame column was subjected to compressive loading until failure, followed by the right frame column, allowing an evaluation of P-Δ effects and stepwise load redistribution in progressive failure scenarios. After experimental validation, an FEM was developed to analyze load transfer mechanisms further and conduct parametric studies for theoretical capacity modeling. To accommodate modular assembly and mechanical, electrical, and plumbing (MEP) installations, a 74 mm (24 mm) gap was allocated between adjacent beams (columns).
The specimen geometry, M2M connection details, linear variable differential transformer (LVDT) arrangement, and strain gauge placement are depicted in Figure 2a,b. In the experimental investigation, LVDT models YWD-100, YWD-200, and YWD-300 manufactured by Weekend (Tianjin Weekend Measurement and Control Technology Co., Ltd., Tianjin, China) were used. These LVDTs featured measurement ranges of ±50 mm, ±100 mm, and ±150 mm, respectively, with full-scale outputs of 20,000 microstrains for YWD-100 and YWD-200 and 15,000 microstrains for YWD-300. Calibration factors for these sensors were 0.005 mm/µε, 0.01 mm/µε, and 0.02 mm/µε, respectively, and bridge resistances were 75 Ω, 150 Ω, and 300 Ω accordingly. Sensor dimensions varied by model—305 × 38 × 25 mm (YWD-100), 505 × 38 × 25 mm (YWD-200), and 710 × 38 × 25 mm (YWD-300)—with self-weights of 250 g, 350 g, and 600 g, respectively. Measurement reaction forces ranged from 1.0 to 3.0 N for the YWD-100 model and 2.0–3.5 N for both YWD-200 and YWD-300 models. Additionally, strain measurements were performed using BX120-5AA (Tianjin Electric Measurement Technology Co., Ltd., Tianjin, China) strain gauges, characterized by a sensitive grid length of 5 mm, resistance of 120 Ω, and unidirectional measurement capability and equipped with 200 mm insulated lead wires. These strain gauges featured built-in thermal compensation to reduce measurement errors induced by temperature fluctuations.
Because floor beams (FBs) serve as primary load-bearing members, they were designed with higher flexural stiffness than ceiling beams (CBs), necessitating a deeper cross section for floor beams. The specimen height (width) was 3375 mm (3148 mm), with an apparent height and length of the lower and upper columns (LCs/UCs) of 1266 mm, while the FBs’ and CBs’ lengths were 1192 mm. The column (floor beam or ceiling beam) cross sections (D × B × t) were 200 × 200 × 8 mm (150 × 200 × 8 mm or 150 × 150 × 8 mm) in size, with a width of 200 mm (150 or 150 mm), length of 200 mm (200 or 150 mm), and thickness of 8 mm (8 or 8 mm).

2.2. Material Testing
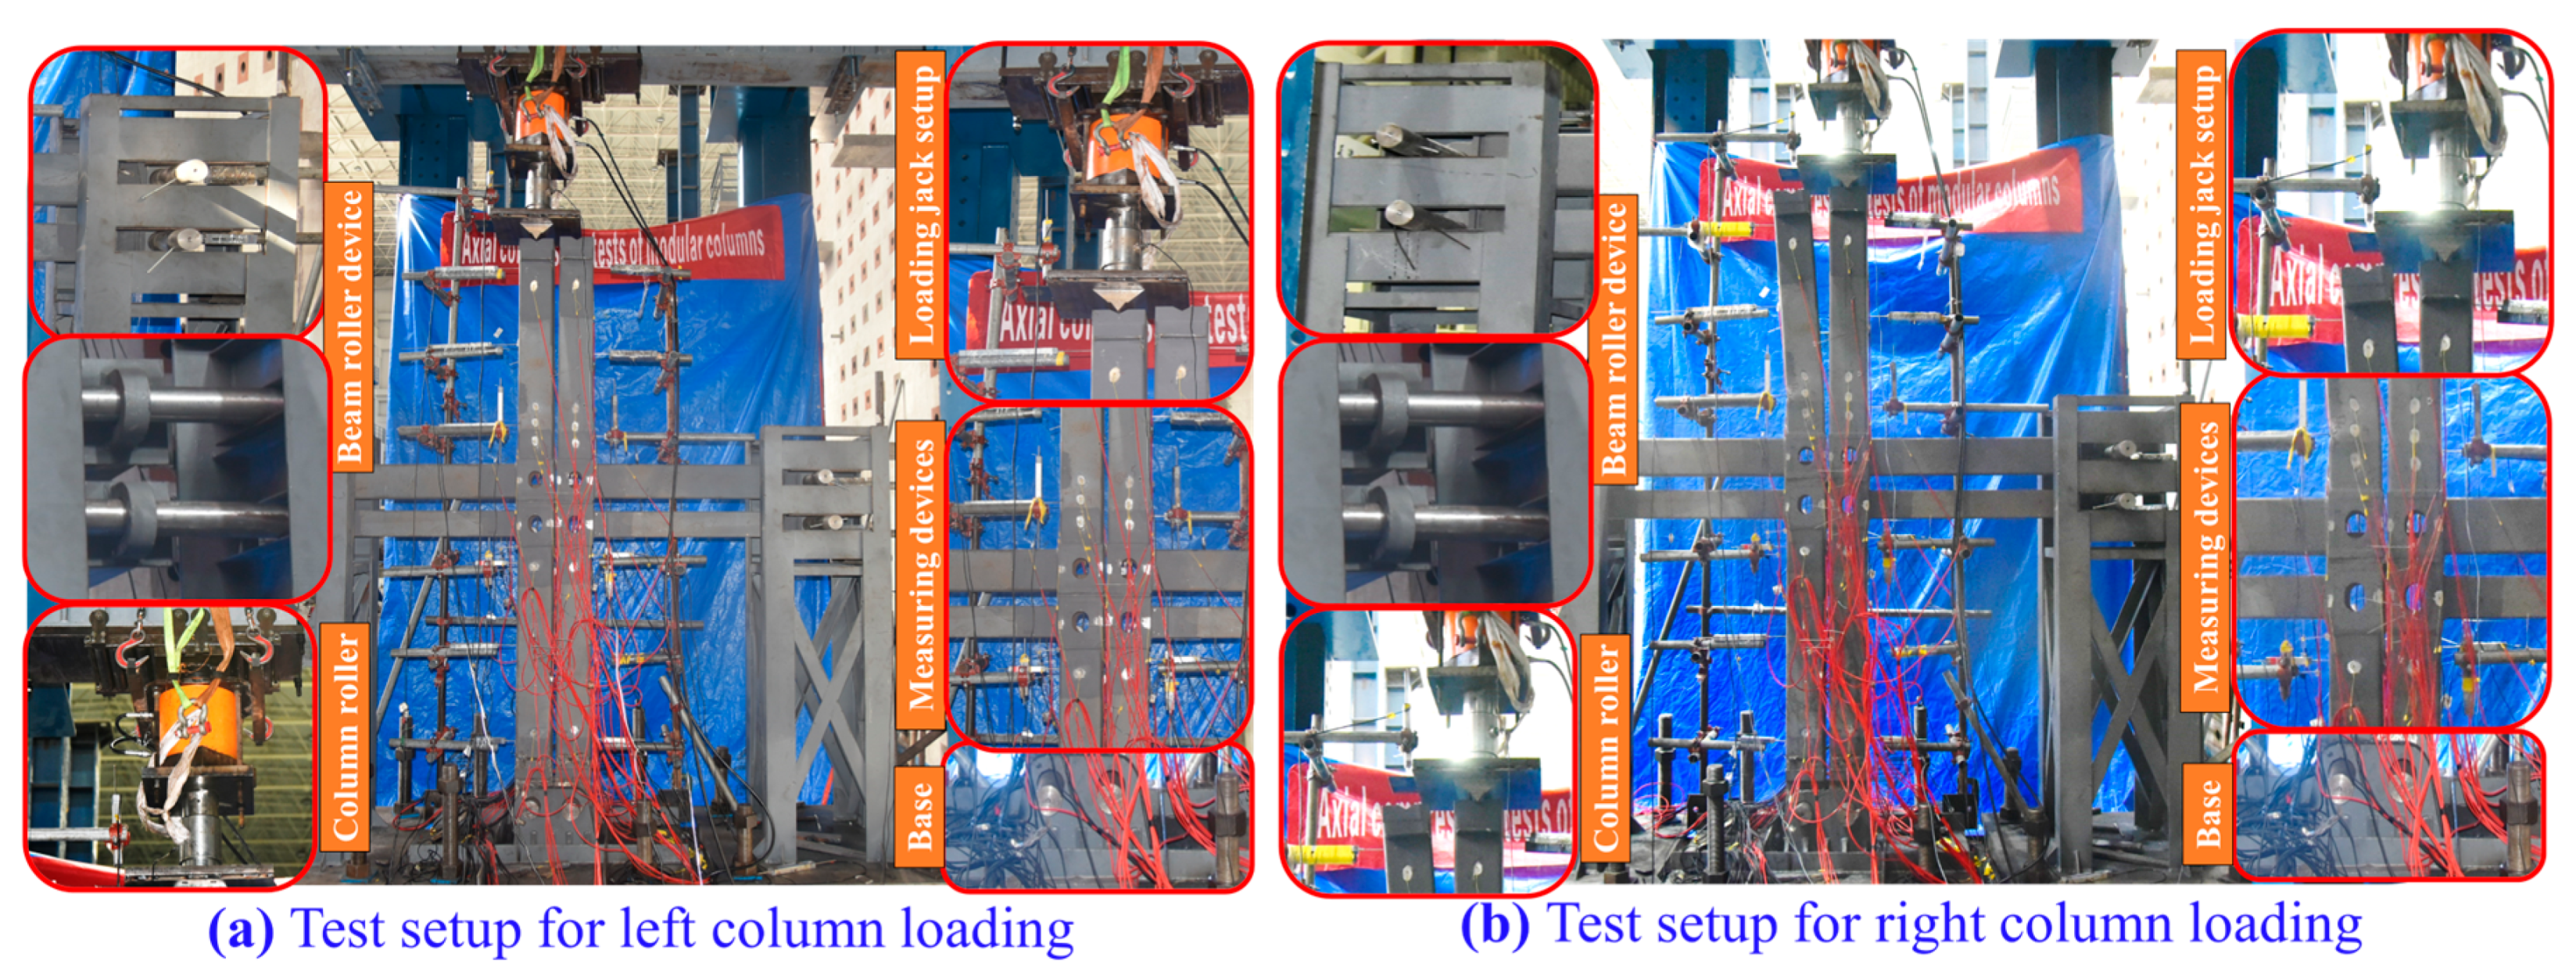
Fundamental material properties were obtained through tensile tests following GB/T228.1-2010 [83]. A total of nine steel coupons extracted from the UCs/LCs, FBs, and CBs were tested to ensure consistency with the FEM validation process. The UCs/LCs exhibited a yield (ultimate strength and modulus of elasticity) of 380 MPa (434 MPa and 206 GPa), while the FBs and CBs recorded 342 MPa (455 MPa and 210 GPa) and 321 MPa (439 MPa and 209 GPa), respectively, with respective elongation values of 22.7%, 23.5%, and 23.6%. The detailed material test setup, failure modes, stress–strain curves, and material properties of M2M connections can be seen in Ref. [63].

2.3. Test Setup

The progressive compressive loading setup for modular steel frames, shown in Figure 3a,b, was designed to apply sequential column loading. First, the left column was loaded until failure, after which the loading system was shifted to the right column to examine load redistribution, P-Δ effects, and progressive failure behavior. During testing, the adjacent upper column remained free (linked via an M2M connection) to simulate realistic load transfer mechanisms in modular frames. A compressive load was applied to the UC using a hydraulic jack connected to the roller supports above to ensure consistent vertical loading throughout specimen deformation. A load sensor, secured between the jack and base plate, recorded reaction forces. A single-column knife-edge support, fixed to the base plate, permitted in-plane but constrained out-plane displacement/rotation, thereby enabling precise load transmission. LCs were pin-supported at the base, allowing in-plane rotation while preventing translation. To control beam movements, beam roller supports were installed on both left and right modules, restricting vertical displacement while permitting in-plane translation and rotation. This configuration aligns with recommended sway-frame testing methods [63]. Following GB/T50344-2019 [84], the loading protocol incorporates preloading (20% of ultimate capacity for two minutes, followed by unloading) and formal hybrid force–displacement control loading. Force-controlled (and displacement-controlled) formal loading was applied until yielding (after yielding until the applied load dropped to 85% of ultimate capacity) at a 0.05 mm/min rate. Reaction forces were recorded via the load sensor, while end-shortening measurements were taken using a vertical LVDT (V3), as shown in Figure 2a. Figure 2b illustrates that 61 strain gauges were installed to track buckling, yielding, and force transfer mechanisms. Because local buckling (LB) was expected near M2M connections on UCs, gauges were concentrated at column ends, midpoints, and highly stressed regions. Due to space constraints, no strain gauges were placed between beam and column gaps. Thirteen (or twelve) horizontal LVDTs (H1-H14) were positioned on UCs/LCs/FBs/CBs during left (or right) column loading to monitor lateral deflection and buckling, while four additional LVDTs (V1–V4) were placed near M2M zones for joint rotation and beam deflections. Data were continuously recorded using a high-precision acquisition system to ensure accurate tracking of progressive failure mechanisms.

3. Experimental Findings

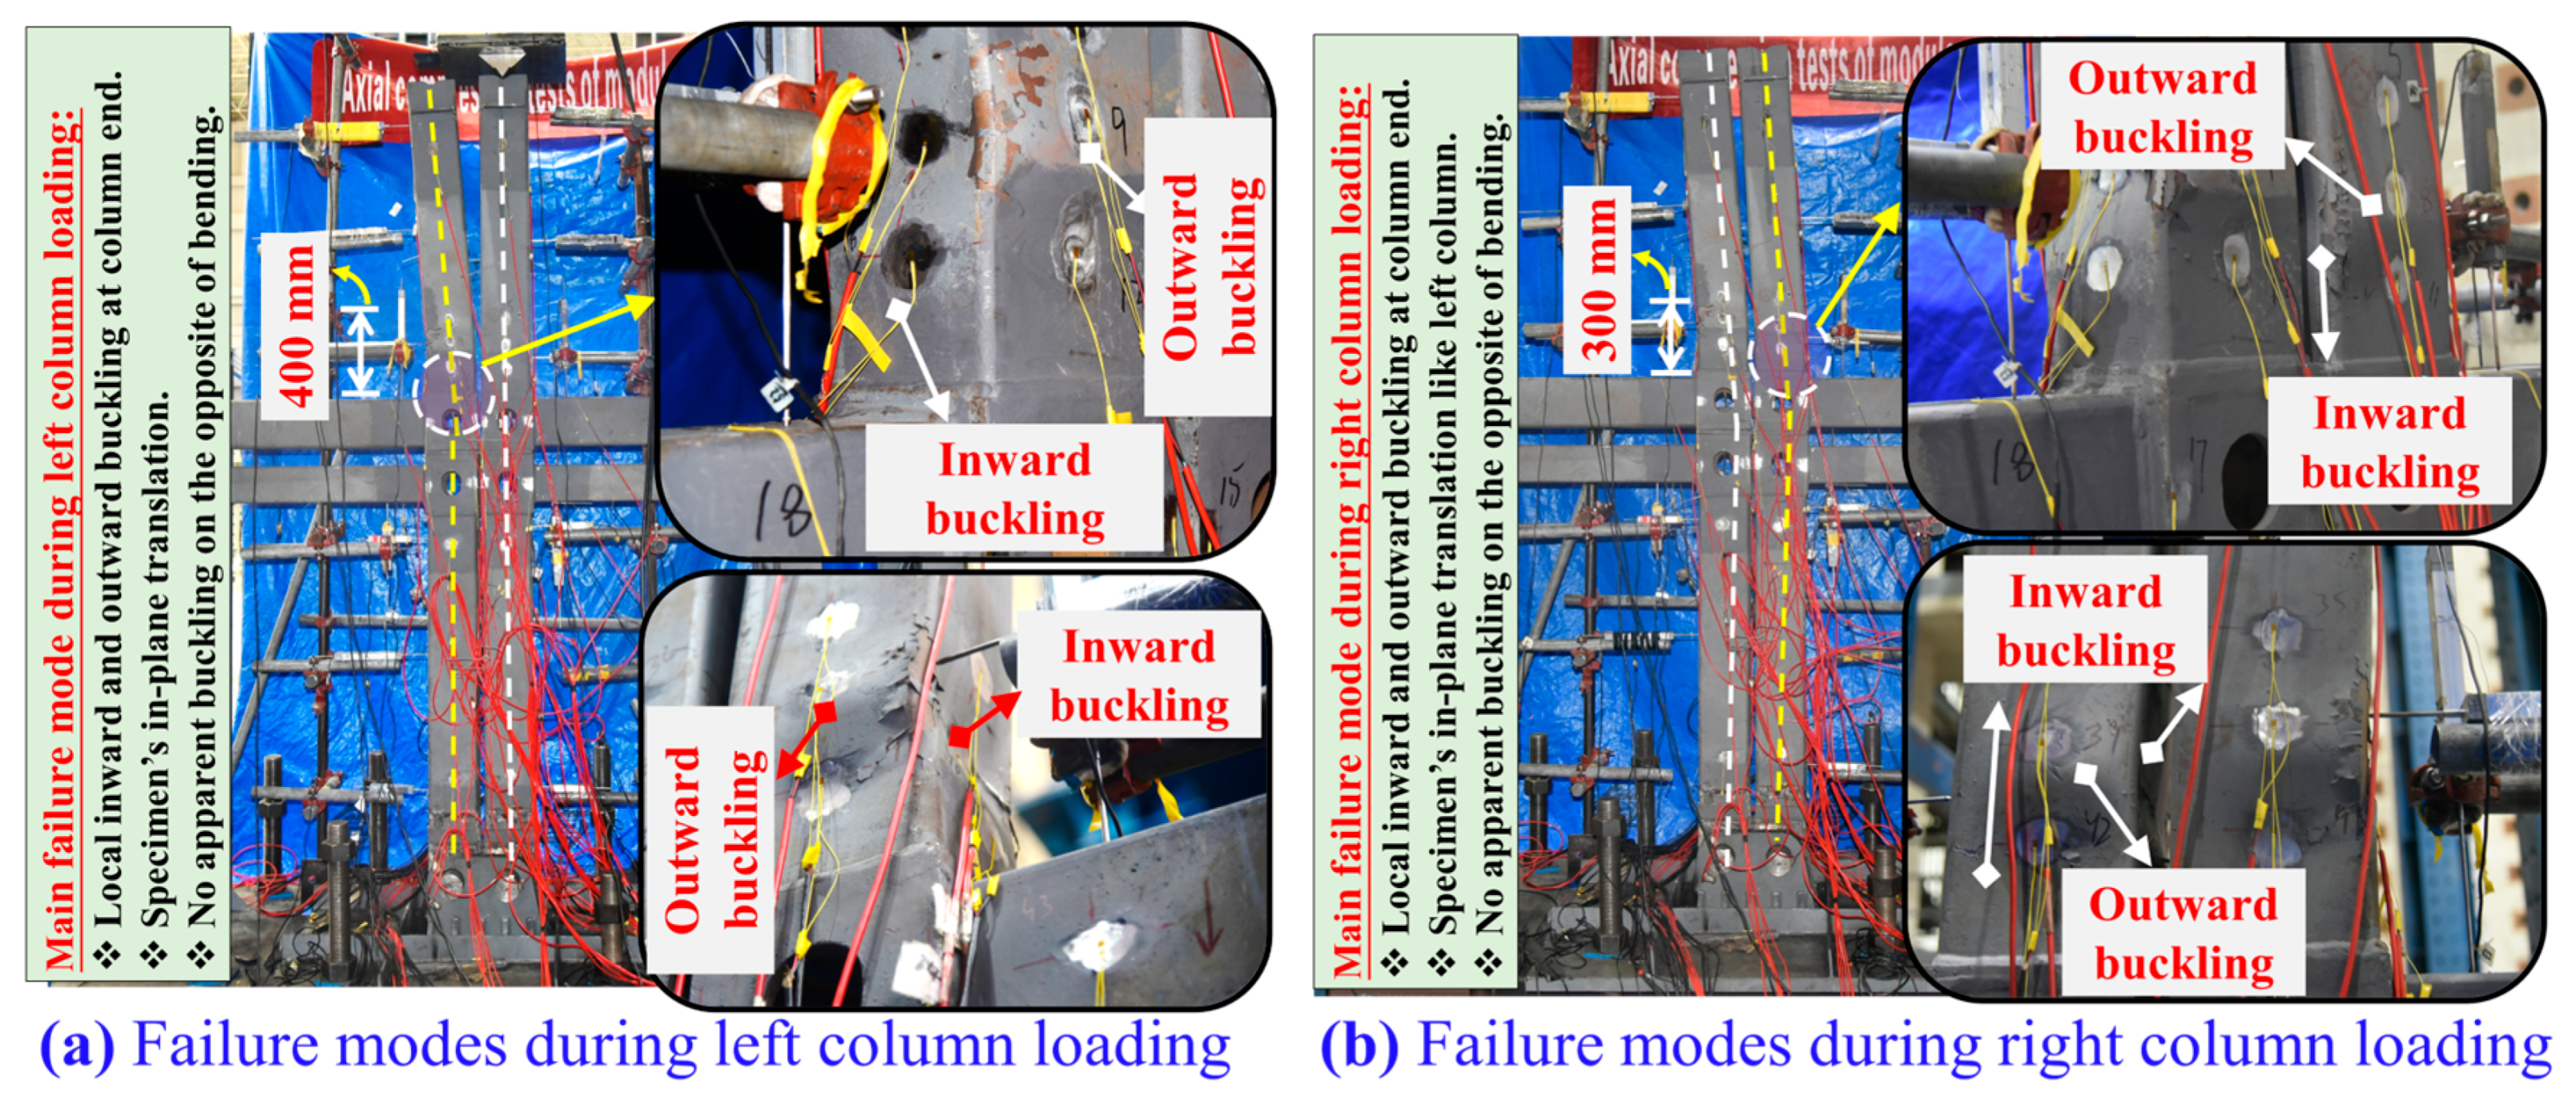
3.1. Damaging Patterns

Figure 4a,b illustrates that the modular steel frame exhibited in-plane translation in the direction of column bending. During left-column loading, the entire frame translated left, and when the right column was loaded, the exact directional translation was observed, indicating that failure progression followed the initial failure pattern. The extent of translation was influenced by the rigidity contrast between beams and columns, with more flexible beams exacerbating lateral instability. As system translation increased, gaps formed at the M2M connections between the upper and lower frame skeletons, shifting force transfer through the connecting plate. This confirms the semi-rigid behavior of the M2M connections, reinforcing their role in load redistribution. Upon reaching compressive capacity, the left column exhibited local buckling at the upper column root, approximately 400 mm from the joint. This buckling was characterized by inward and outward deformations along the bending face and adjacent sides, while the opposite face remained largely unaffected. Similarly, the right column, upon loading, exhibited local buckling at a lower height of approximately 300 mm, maintaining the same bending direction as the left column. The adjacent inner faces of the columns did not collide, as the left column remained free of inward buckling while the right column developed localized inward deformations. However, as buckling intensified, the right column was at risk of colliding with the left column, potentially compromising frame stability and necessitating a halt in loading for safety considerations. Strain measurements revealed that local buckling initiated elastically (before yielding) along regions aligned with or opposite to bending, while plastic buckling (post-yielding) occurred in adjacent column faces. The FBs/CBs, LCs, and M2M connections did not buckle or yield, which demonstrates their role in efficient load transfer and preventing premature failure. However, several locations on the UCs experienced yielding, as they were the primary load-bearing members. Despite variations in local buckling locations between the left and right columns, the modular frame remained structurally stable, as the M2M connections effectively redistributed forces to adjacent members without localized failure. These results highlight the safety and integrity of modular frames with rotary M2M connections under progressive compressive loading, which ensure continued structural performance despite sequential column failures.

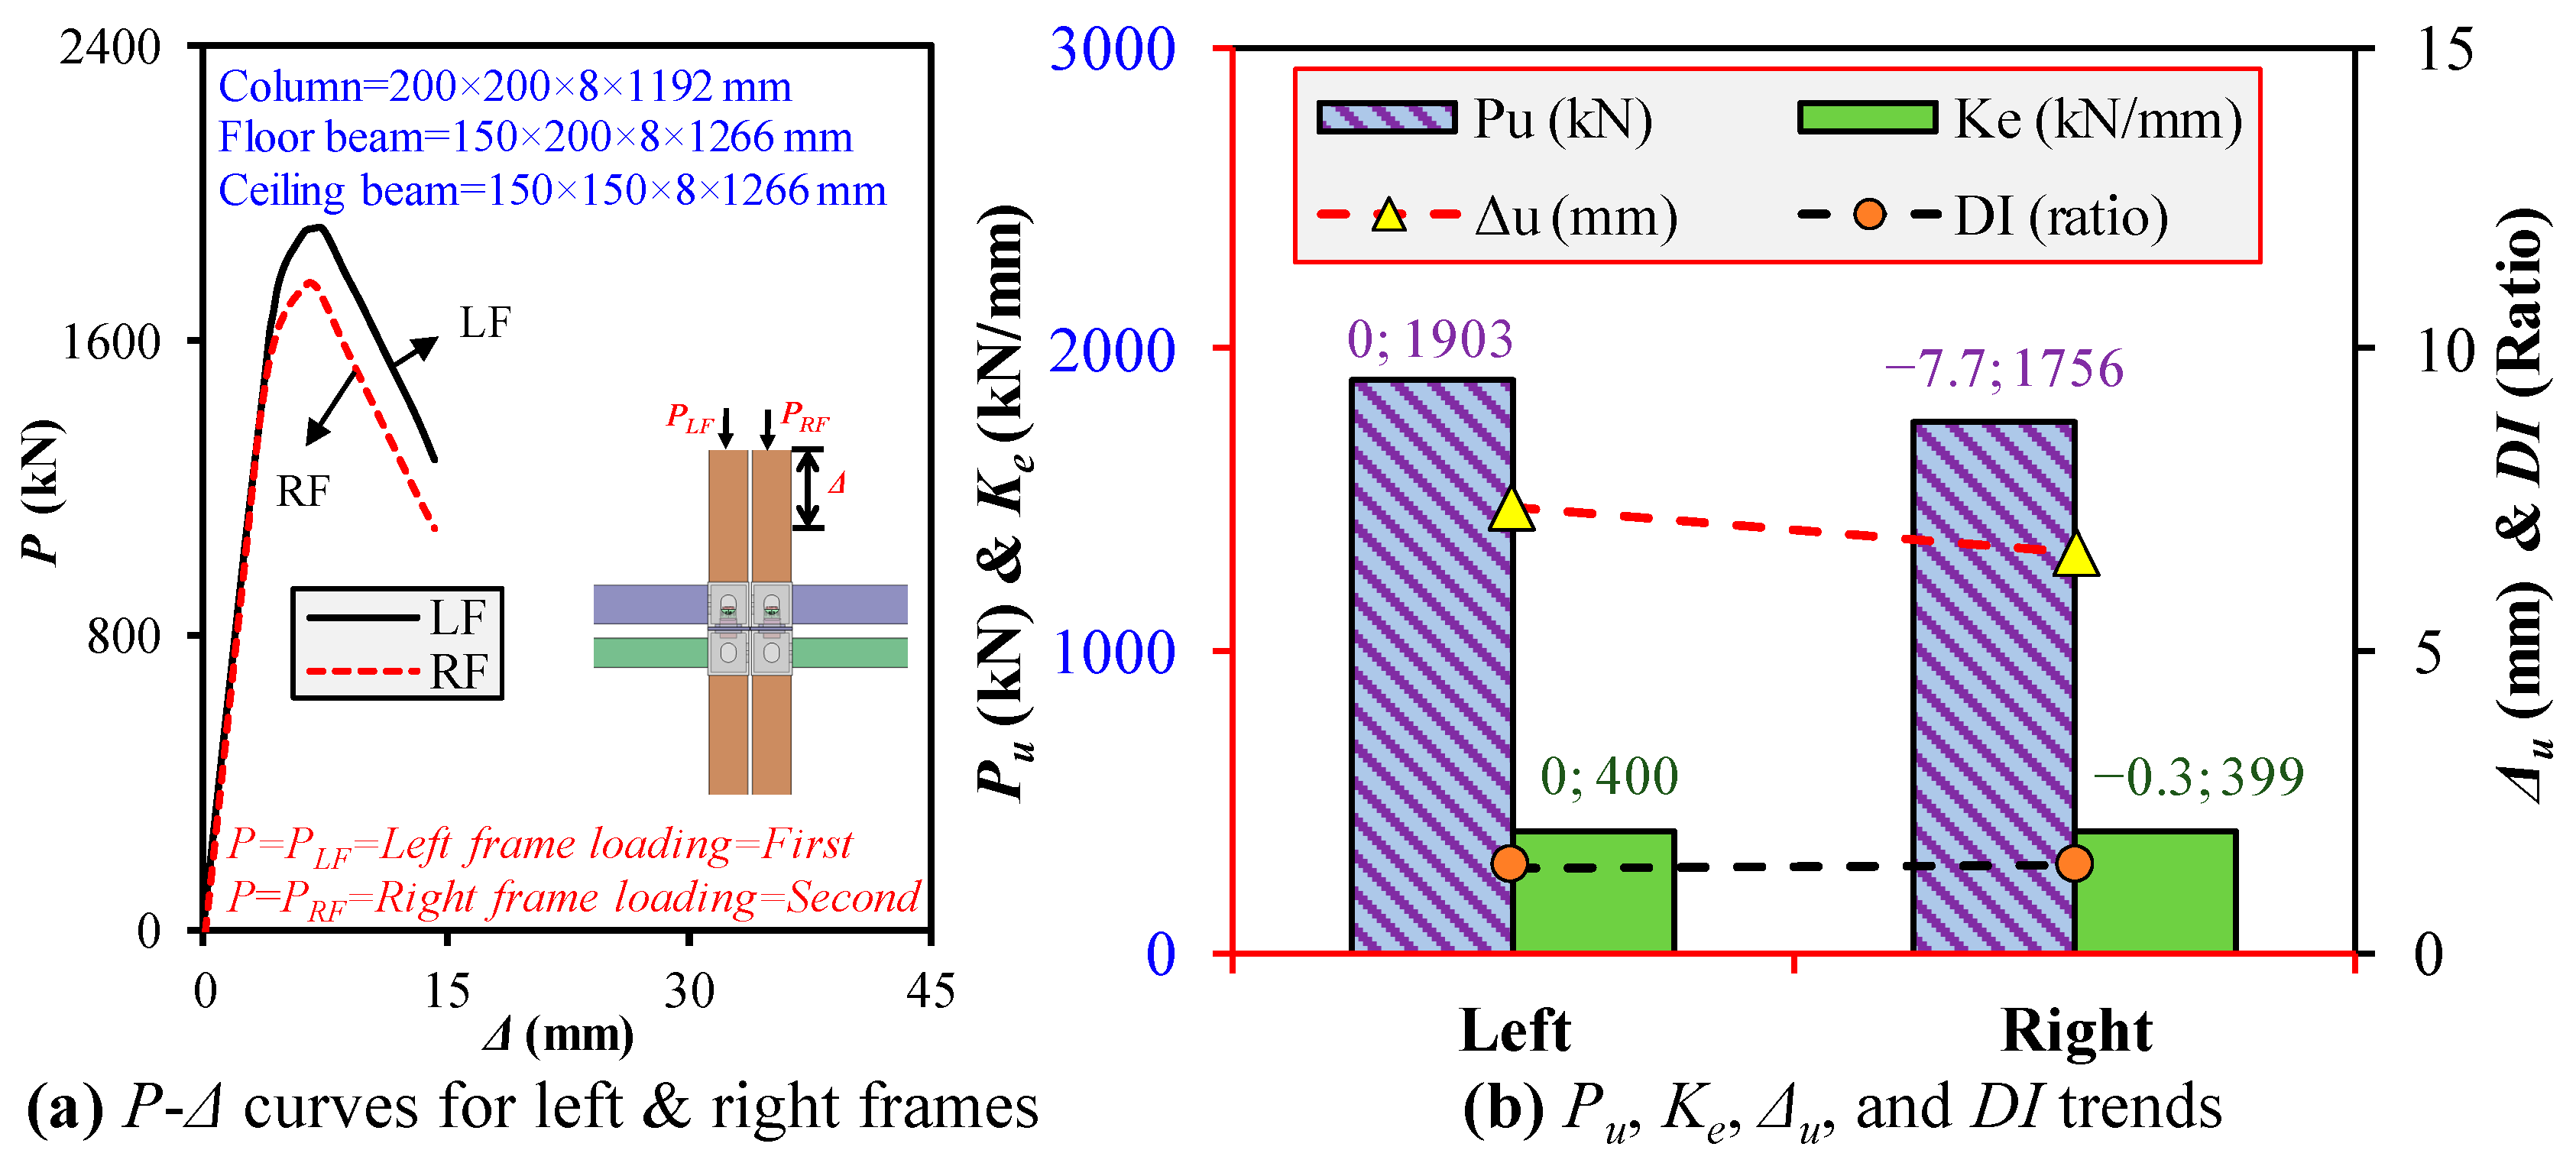
3.2. Load and Axial Shortening Behaviors

Figure 5a,b presents the load–axial shortening trend for left (and right) column loading, capturing the modular steel frame’s elastic, inelastic, and post-ultimate recession phases. These stages provide insight into strength/stiffness (Pu/Ke) and pre-/post ultimate ductility (Δu/DI), following the methodology in Ref. [63]. During the elastic stage (origin to yield), the load and shortening show a linear rise until the yield strength is reached, recorded at 856 kN (790 kN) for the left (right) column. Beyond this point, stiffness decreases as lateral translation, bending, and buckling stresses escalate at various UC locations. During the inelastic region (yield to ultimate), the curves follow the parabolic trend, where load rises until the Pu reaches 1903 kN (1756 kN) for the left (right) column, with local inward and outward buckling observed at the UC ends. The right column exhibited a 7.7% reduction in Pu and a 0.3% lower Ke than the left. This can be attributed to the redistribution of internal stresses and load history from the left column failure via M2M connections, increased secondary moments, in-plane translation, and accumulated stress concentrations, reducing the right column’s stiffness and capacity. Δu was 9.5% lower for the right column, highlighting weaker pre-ultimate ductility due to earlier instability onset and accumulated deformations from the left column’s failure phase. The frame marks a rapid capacity drop, significant lateral deformation, and intensified local buckling during the post-ultimate region. The right column exhibited a 0.7% higher DI, which suggests that it retained better residual strength before failure propagation. Despite these differences, the modular frame maintained its overall integrity, which demonstrates that rotary M2M connections effectively redistributed forces, ensuring structural continuity even under progressive compressive failure.

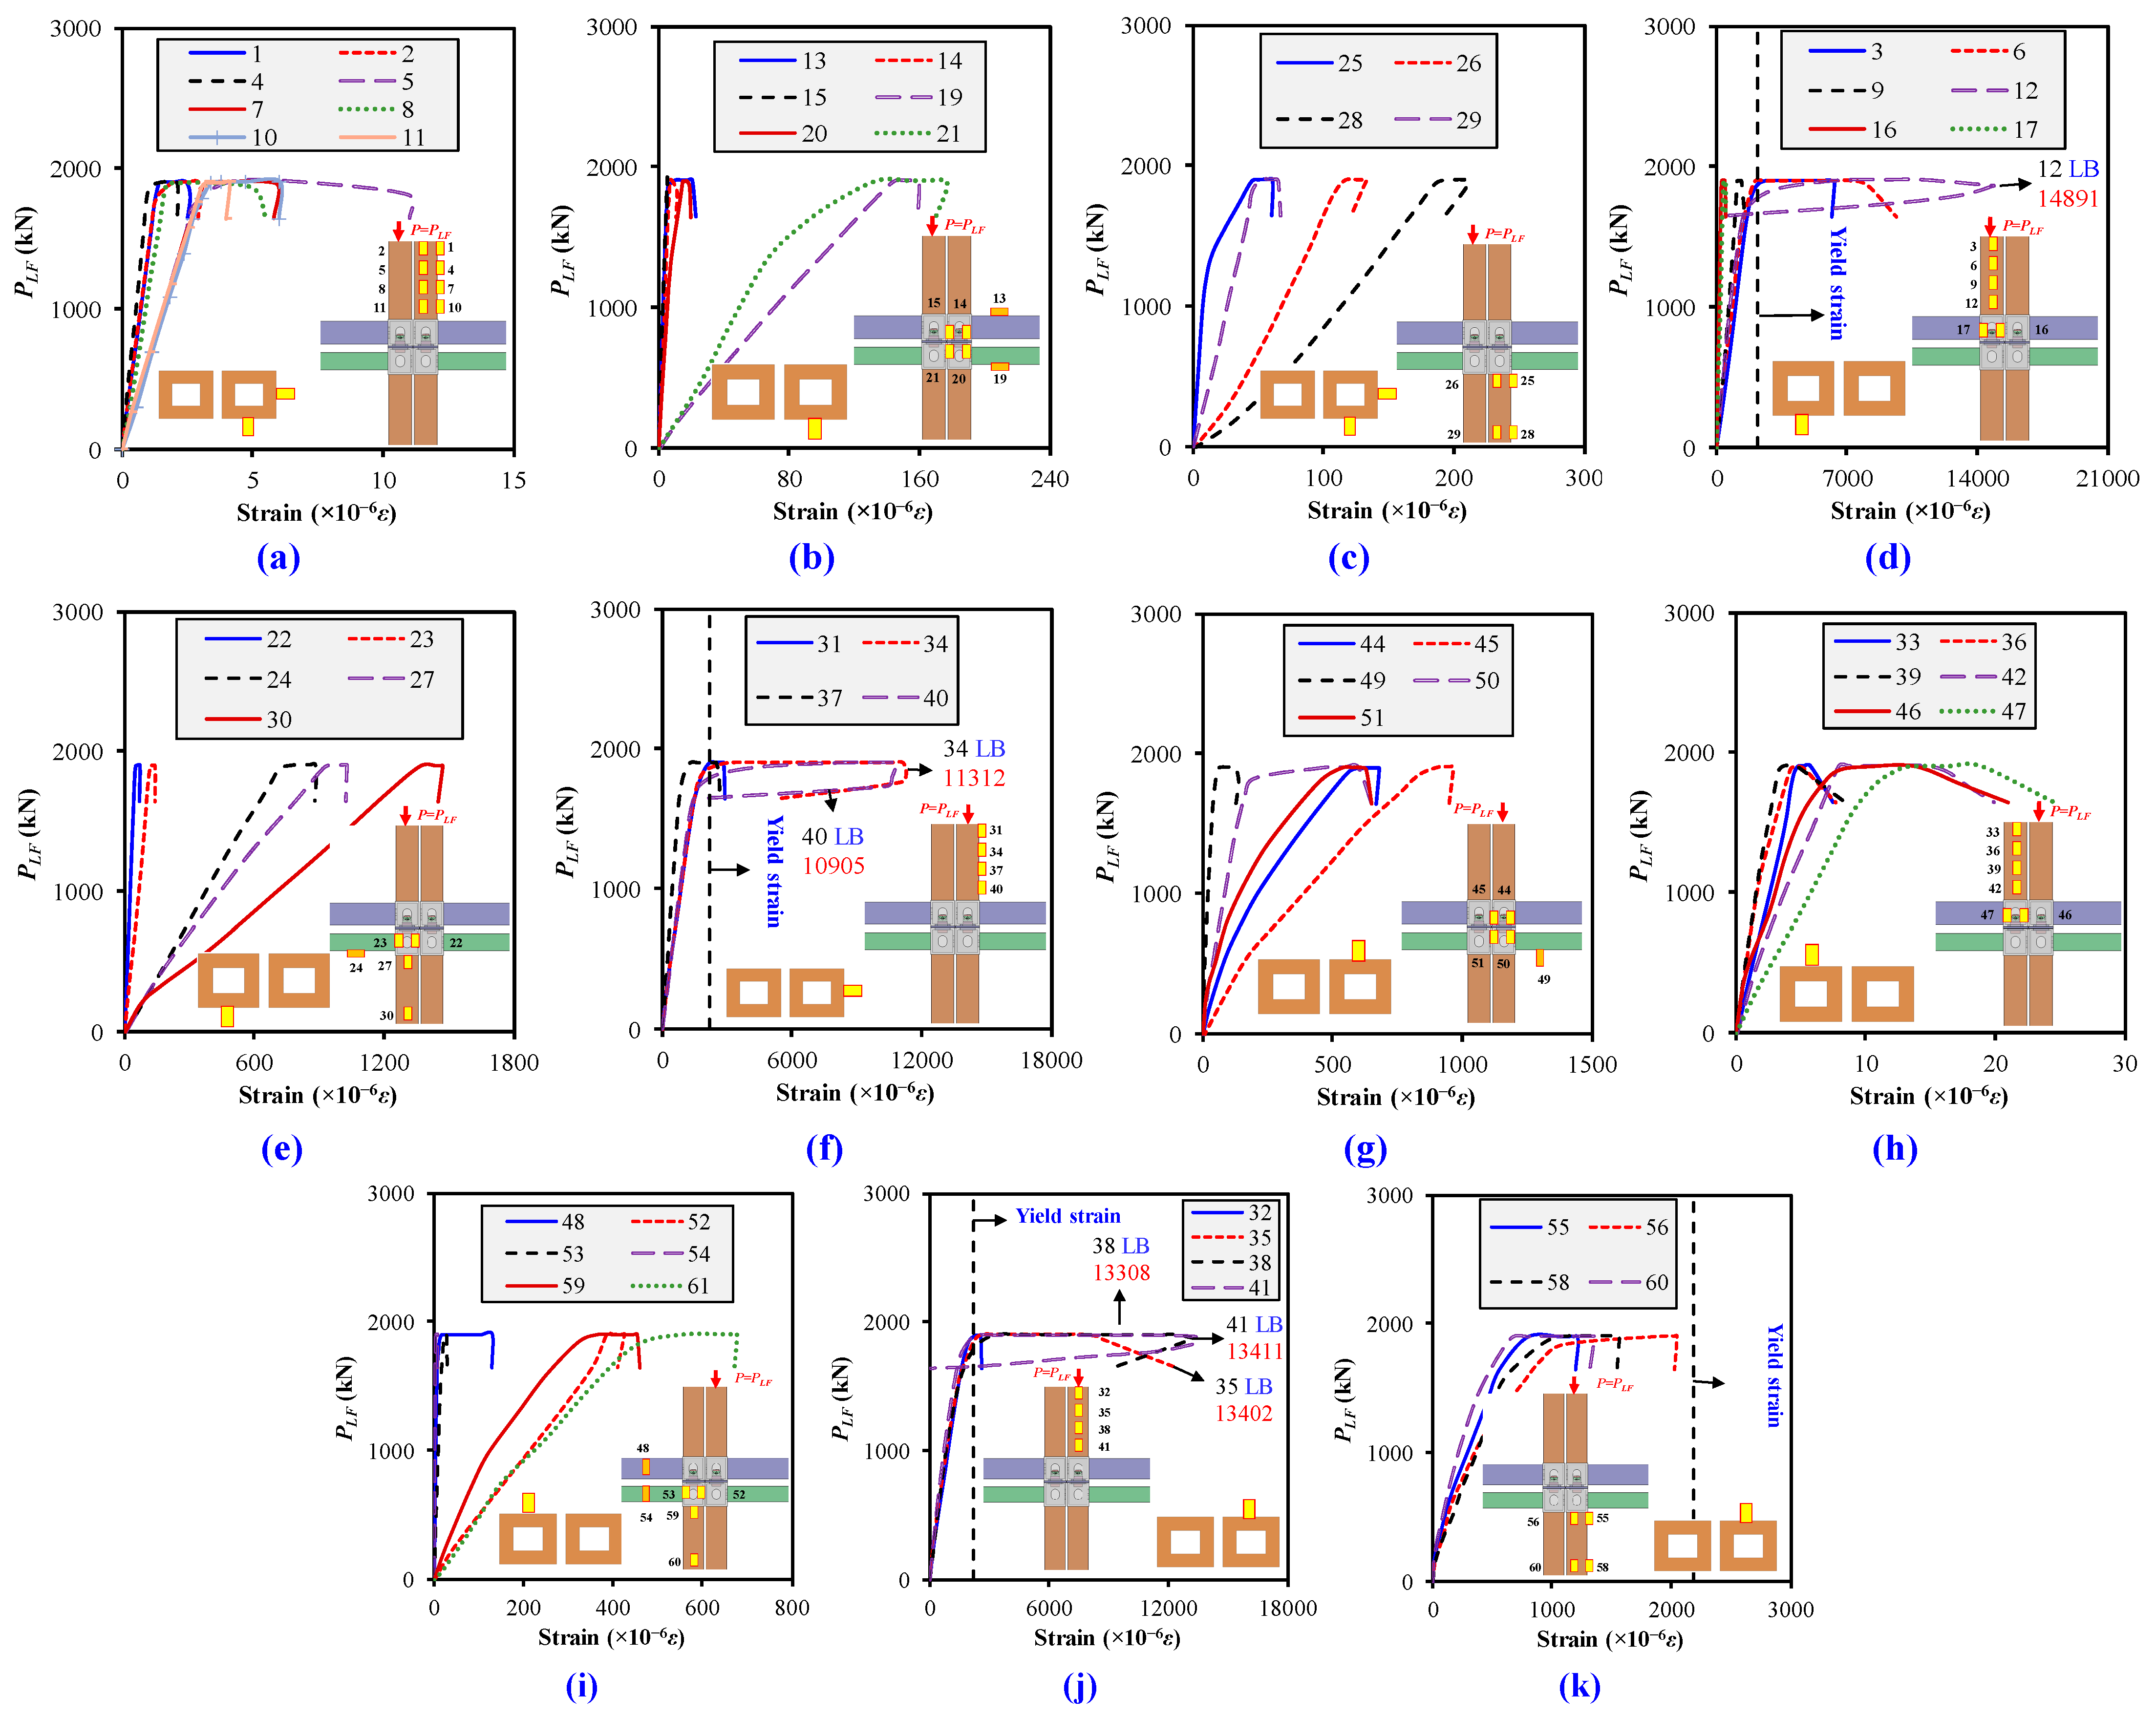
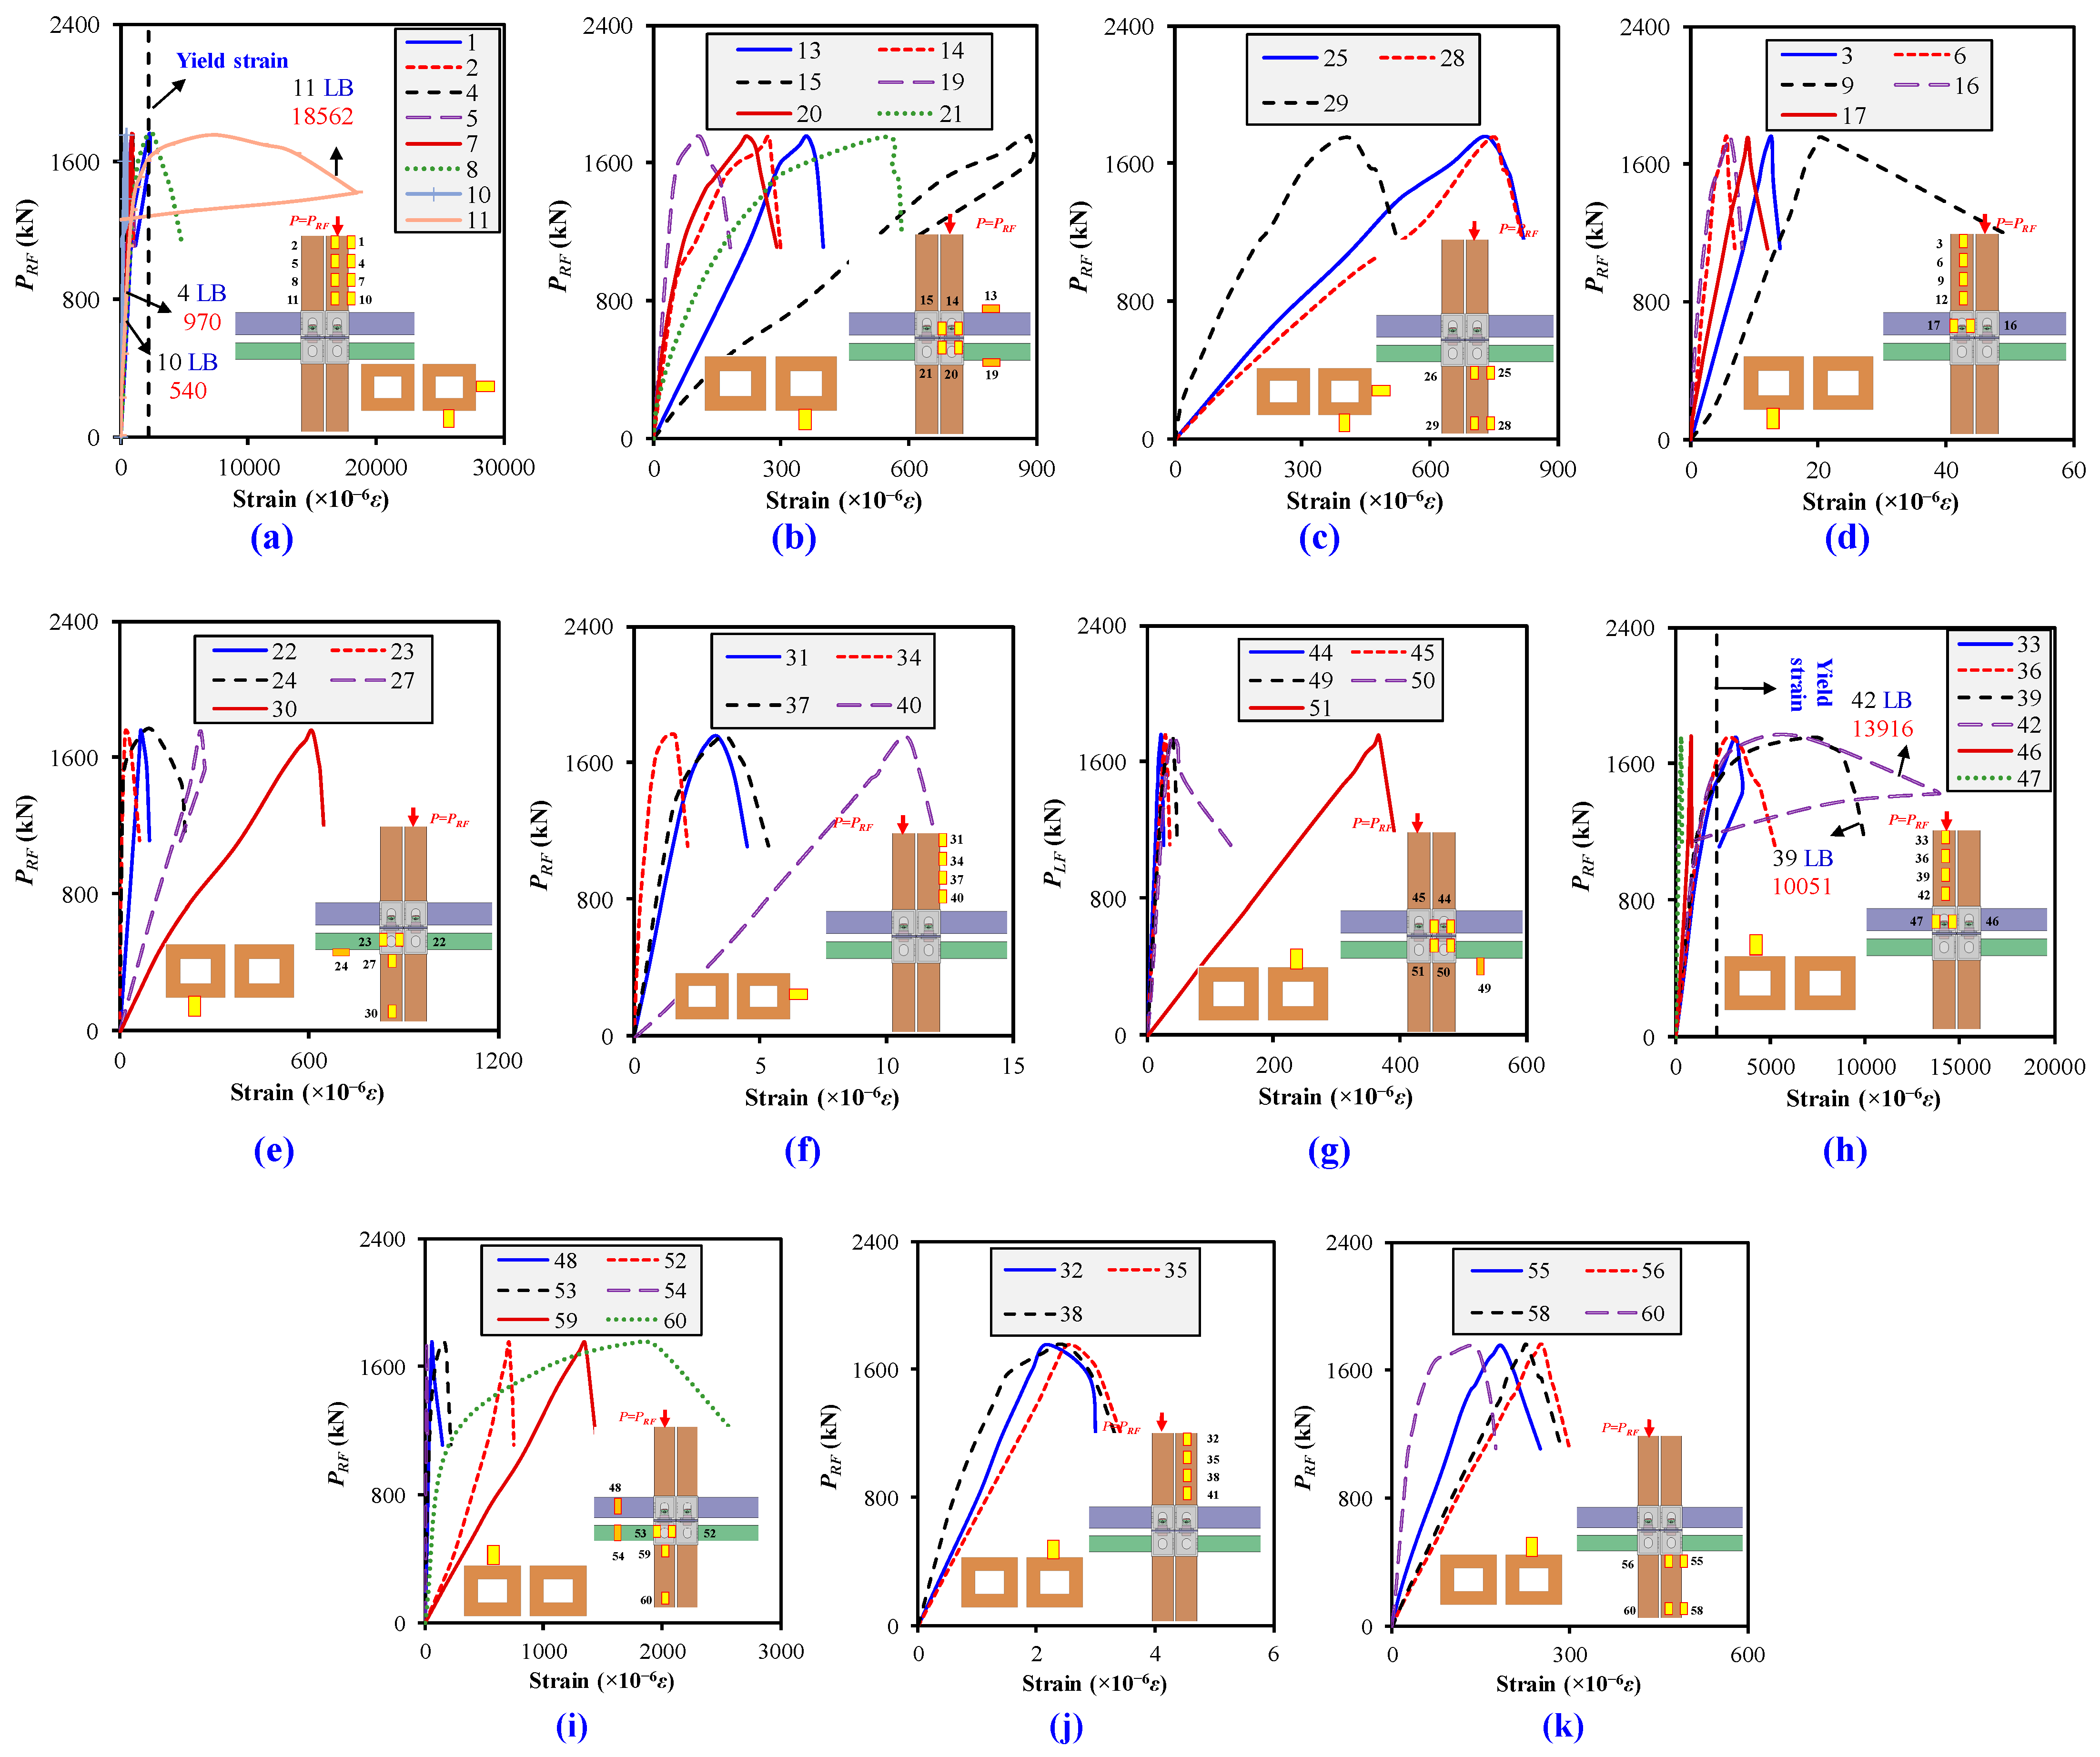
3.3. Load and Strain Behaviors

Figure 6a–k and Figure 7a–k illustrate the load–strain behavior of modular interior frames during left- and right-column loading, highlighting strain variations, yield strain, and local buckling in UCs/LCs, corner fittings, and FBs/CBs. As the applied load increased, strain values rose until local buckling occurred in the UCs, characterized by a sudden inversion or steep decline in the curves. Local elastic buckling was identified when the strain values reversed near or below the yield strain, indicating buckling before the material reached its plastic limit. Conversely, plastic buckling occurred when strain values exceeded the yield strain, leading to irreversible deformation and rapid capacity reduction. The load–strain data validated the presence of localized buckling at different column locations for left- and right- column loading. Specifically, buckling occurred approximately 400 mm from the M2M connection in the UC during the left-column loading, whereas in the right-column loading, it was observed around 300 mm from the connection. Strain measurements revealed distinct buckling behaviors: under left-column loading, locations 12, 34, 35, 38, 40, and 41 exhibited plastic buckling, whereas under right-column loading, locations 11, 39, and 42 showed plastic buckling, while 4 and 10 displayed elastic buckling. Notably, plastic buckling primarily occurred on column faces not directly subjected to bending, while elastic buckling was prominent on bending-exposed faces. This distinction suggests that stresses accumulated from the left-column failure and induced secondary moment effects contributed to local elastic buckling in the right column, affecting its load-bearing efficiency. Moreover, no noticeable buckling was observed in LCs, FBs/CBs, or M2M connections, which confirms that these members remained structurally intact throughout the tests. The results indicate that columns loaded first primarily experienced strength-governed failure while those loaded subsequently exhibited a combination of strength and stability failure modes influenced by stress redistribution and accumulated deformations. These findings emphasize the necessity of accurate predictive capacity models for columns in modular interior frames under progressive compressive loading to account for redistribution effects and evolving stability conditions.

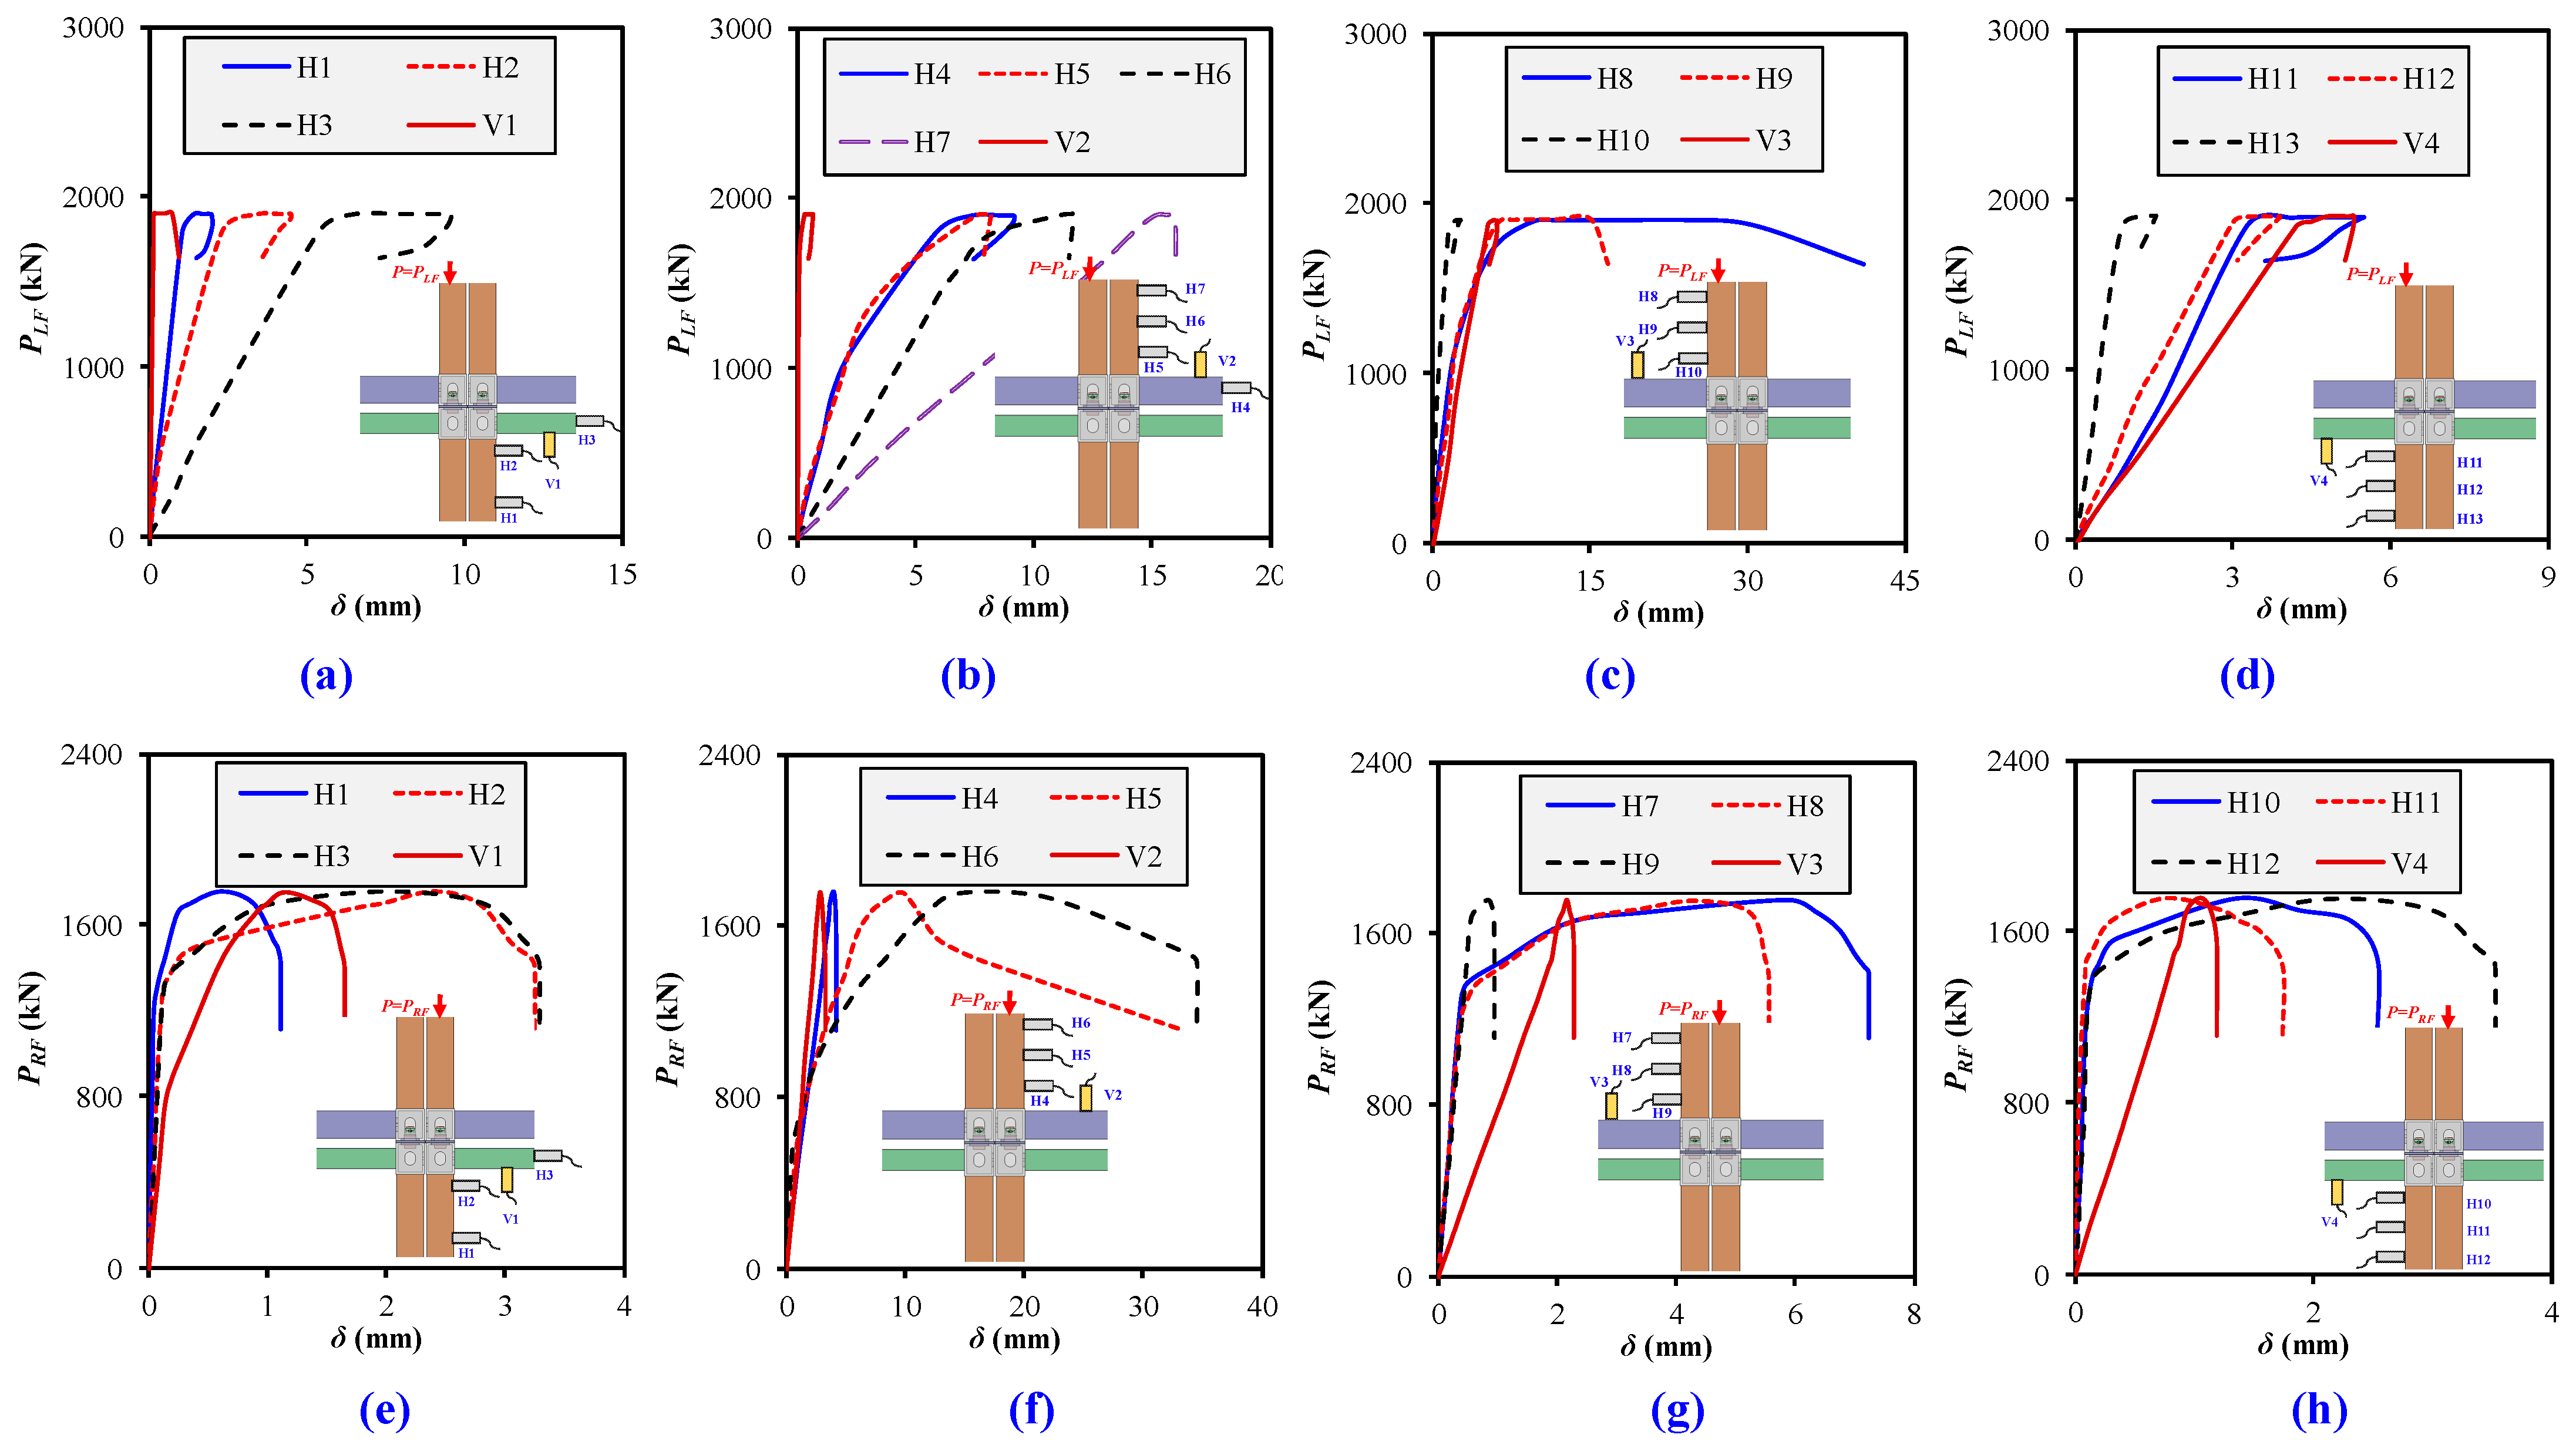
3.4. Load and Deflection Behaviors

Figure 8a–d demonstrates the load–deflection behaviors for left-column loading, and Figure 8e–h for successive right-column loading illustrates the structural response of the modular steel frame under progressive compression. The curves display linear, nonlinear, and post-ultimate softening phases, with deformation measured at multiple locations, highlighting the influence of P-Δ effects and progressive failure mechanisms. During left-column loading (Figure 8a–d), deflection increased gradually with load, stabilizing upon reaching ultimate capacity. The presence of sway, evident from the incremental deflection from the lower to upper column sections, confirms the progressive nature of failure. Notably, rotational movement at the M2M connections is observed, which suggests that these connections contribute to force redistribution and exhibit semi-rigid behavior rather than idealized pinned or rigid conditions. The maximum deflection was recorded at the upper-column top, indicating initial failure localization. In right-column loading (Figure 8e–h), which follows the complete failure of the left column, the deflection trends differ. Due to accumulated deformation and stress redistribution from the first failure stage, the right column undergoes more significant lateral displacement, leading to increased structural instability. The maximum lateral deflection occurs earlier compared to the left column, correlating with a lower ultimate load capacity and initial stiffness reduction. This confirms that the right column experiences amplified secondary moments and increased susceptibility to bending-induced local buckling. The asymmetric deflection patterns suggest relative rotation between the frame skeletons at the M2M connections, reinforcing the semi-rigid nature of these joints. Despite these progressive deformations, no detrimental failure was observed in M2M connections or beams, which indicates their effective force transfer mechanism.

4. Finite-Element Analysis

Experimental findings provided crucial insights into the progressive compression behavior of modular steel frames. However, a comprehensive parametric study is necessary to evaluate force transfer mechanisms, instability progression, and post-buckling responses and assess the applicability of existing design codes. A validated FEM was developed to predict load-carrying capacity, progressive failure modes, and stress redistribution mechanisms.

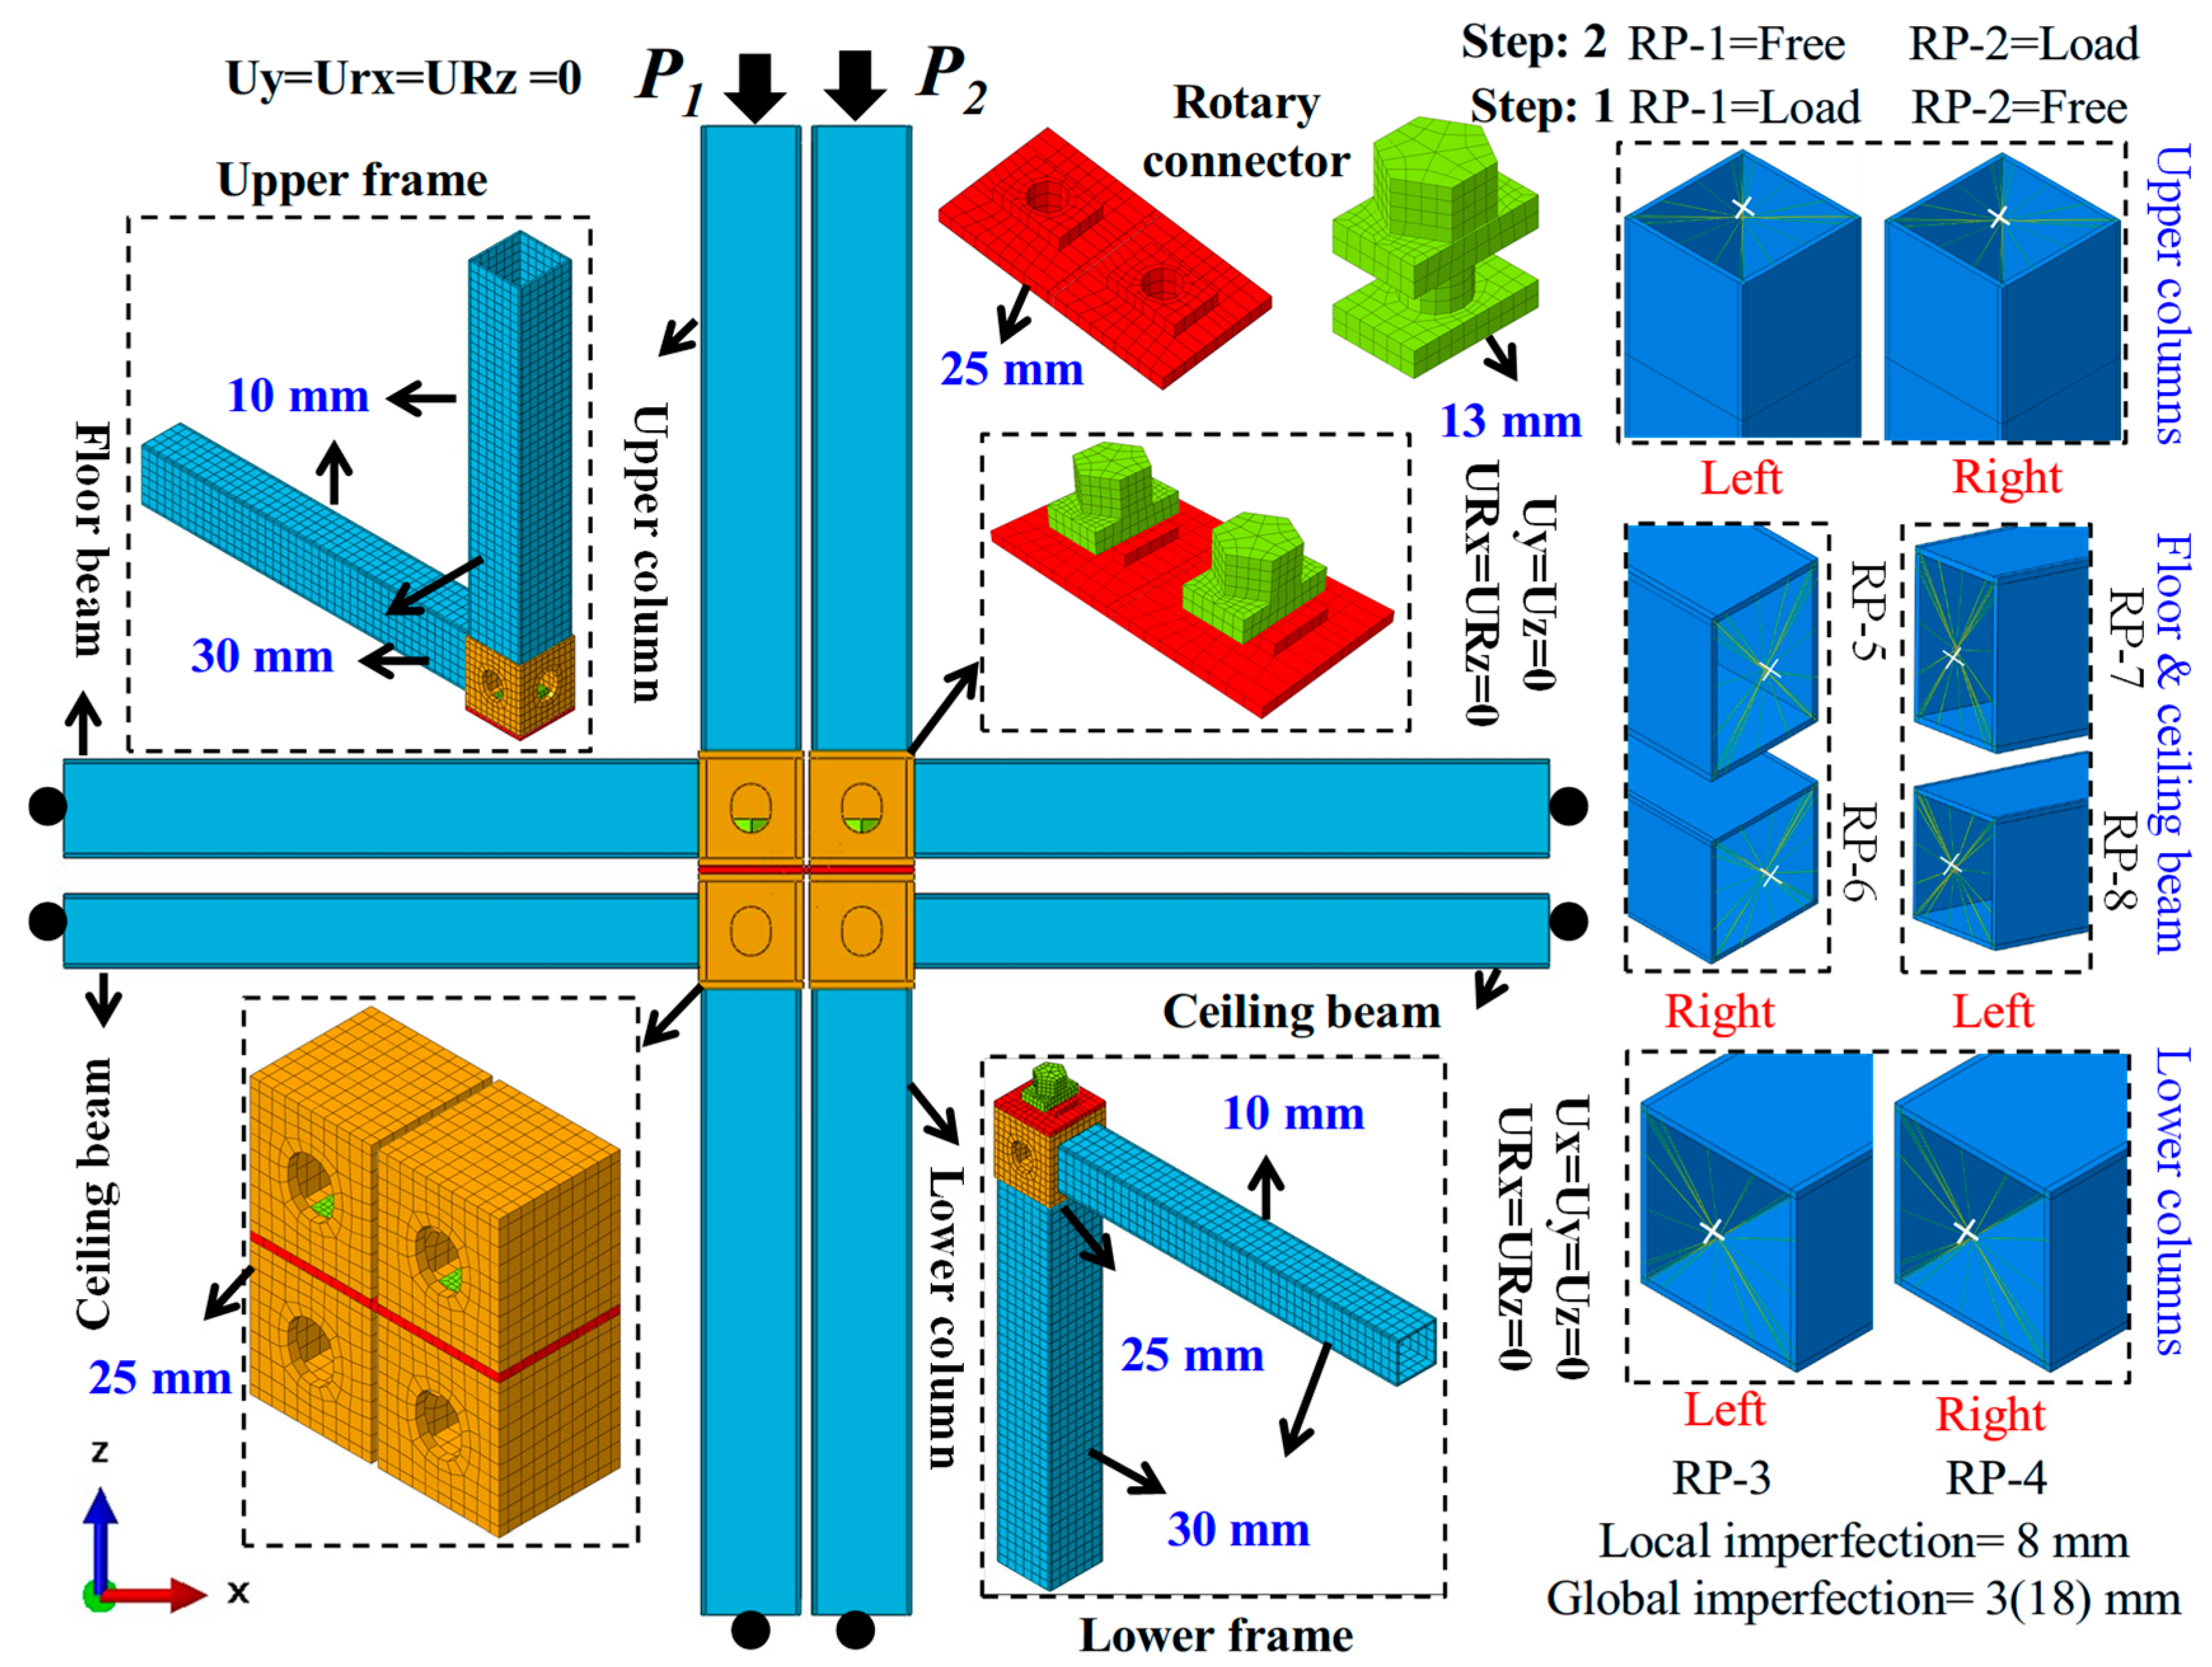
4.1. Establishment of FEMs

The full-scale modular frame was simulated using ABAQUS, as shown in Figure 9 [85]. Two numerical analyses were performed: (i) linear perturbation buckling analysis to determine buckling modes and critical loads and (ii) nonlinear static/general and Riks-type analysis to capture post-buckling progressive failure propagation. The bilinear kinematic hardening model and von Mises yield criterion were adopted, with a Poisson’s ratio of 0.3, while material properties were taken from experimental data in Ref. [63].

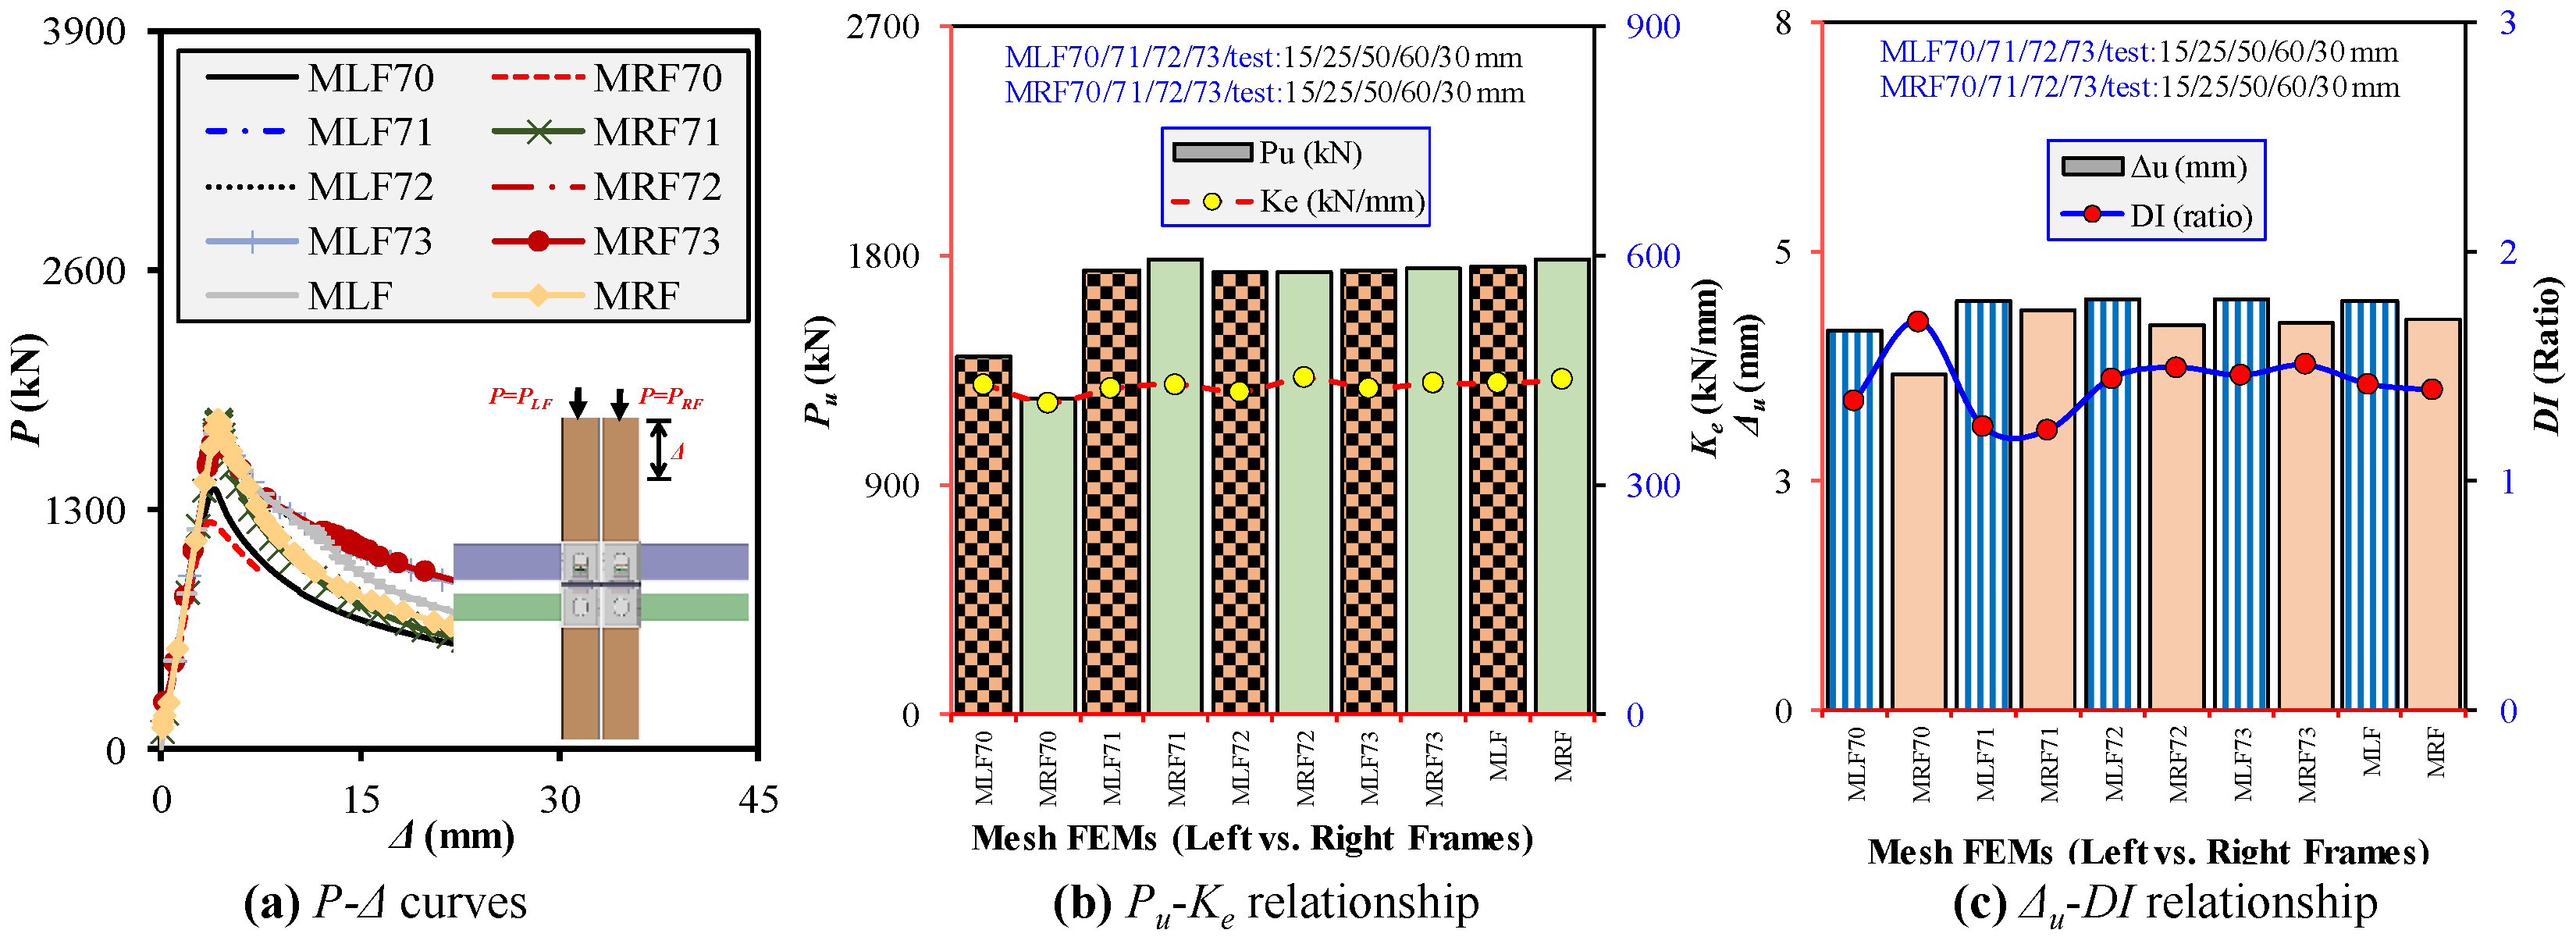
4.2. Mesh Sensitivity Analysis

A mesh sensitivity analysis determined the optimal element size for accurately capturing progressive compressive failure in modular steel frames. The FEM was developed using C3D8R solid elements for all structural components, including UCs/LCs, FBs/CBs, rotary M2M connections, and corner fittings, as illustrated in Figure 9, following Ref. [63]. Solid elements (C3D8R) rather than shell elements (such as S4R) represent the structural members. The geometry and thickness characteristics of the structural sections primarily drove the selection of solid elements. Specifically, hot-rolled steel columns and beams were employed, featuring substantial cross-sectional thicknesses rather than thin-walled or cold-formed tubular sections, which typically benefit from shell-element modeling. C3D8R elements enabled the accurate representation of the local deformation, stress gradients, and overall structural force-transmission response of the thickness of these members. Moreover, the suitability and accuracy of the selected elements were confirmed by direct comparison with experimental test results, demonstrating good agreement and validating the reliability of the adopted modeling approach. Structured meshing was applied to hollow sections by partitioning their thickness edges, thus ensuring precise stress distribution and buckling predictions. Five mesh sizes, i.e., MLF/RF70, 71, test, 72, and 73 (15, 25, 30, 50, and 60 mm, respectively) were tested, and their effects on P-Δ curves and Pu-to-Ke and Δu-to-DI relationships were compared, as shown in Figure 10a–c. For both left- and right-column loading, refining the mesh from 30 to 15 mm led to a 20% (31%) reduction in Pu and a 7% (14%) decrease in Δu, while Ke and DI remained nearly unchanged, which suggests that over-refined meshes significantly underestimated strength. This effect was more pronounced in right-column loading, attributed to stress accumulation from prior left-column failure. Conversely, comparing 30 to 25, 50, and 60 mm, Pu and Ke exhibited minor reductions, whereas Δu and DI fluctuated slightly, which indicates that coarser meshes slightly overestimated strength but misrepresented plasticity effects. The 30 mm mesh was selected to best agree with the experimental results, with the Pu, Ke, Δu, and DI values of the FEM within 5% of the experimental results. Furthermore, it enhanced failure-mode visualization, confirming the FEM’s reliability in predicting progressive compressive failure in modular steel frames.

4.3. Loading and Boundary Constraints

The progressive compressive boundary/loading constraints were defined according to reference points (RP 1-8) using surface-based coupling constraints to ensure force transfer between frame components while maintaining realistic modular behavior. The LCs were not fully restrained but had only restricted translational movement, while all columns and beams were allowed in-plane translation and rotation, thus replicating modular frame flexibility. A three-step progressive loading protocol was applied: (i) Step 1 (Static General)—Pretension bolt loading, which was fixed at its initial length in later stages; (ii) Step 2 (Static General)—Left-column compressive loading until failure (30 mm shortening), while the right column remained free, simulating sequential column failure; (iii) Step 3 (Static Riks)—Right-column loading until failure, with the neighboring failed left column kept free, capturing progressive instability and load redistribution. UCs/LCs and FBs/CBs were welded to the M2M connections, which were represented using a “tie constraint”. The M2M connection components were modeled through surface-to-surface contact interactions, with hard contact defined in the normal direction to prevent interpenetration and finite sliding in the tangential direction, incorporating a friction coefficient of 0.3 based on friction sensitivity analysis. The analysis used μ = 0.1, 0.3, and 0.5 (MLF/RF74, test, and 75, respectively) to evaluate their impact on Pu, Ke, Δu, and DI for both left- and right-column loading, as shown in Figure 11a,b. Reducing friction from 0.3 to 0.1 slightly increased Pu (0.28% left, 0.06% right) and Δu but decreased DI, which suggests that lower friction weakened post-failure ductility. Increasing the friction from 0.3 to 0.5 decreased Pu (−0.23% left, −0.04% right) and Ke (−0.81% left, −1.38% right), while Δu and DI increased, which indicates that excessive friction overestimated ductility but compromised strength and stiffness. Based on these findings, μ = 0.3 was chosen, as it provided the best balance between load-bearing capacity, stiffness, and realistic deformation behavior, ensuring an accurate representation of progressive compressive failure in modular frames. Because the specimens were hot-rolled steel sections, residual stresses and temperature effects were not considered as in Ref. [63].

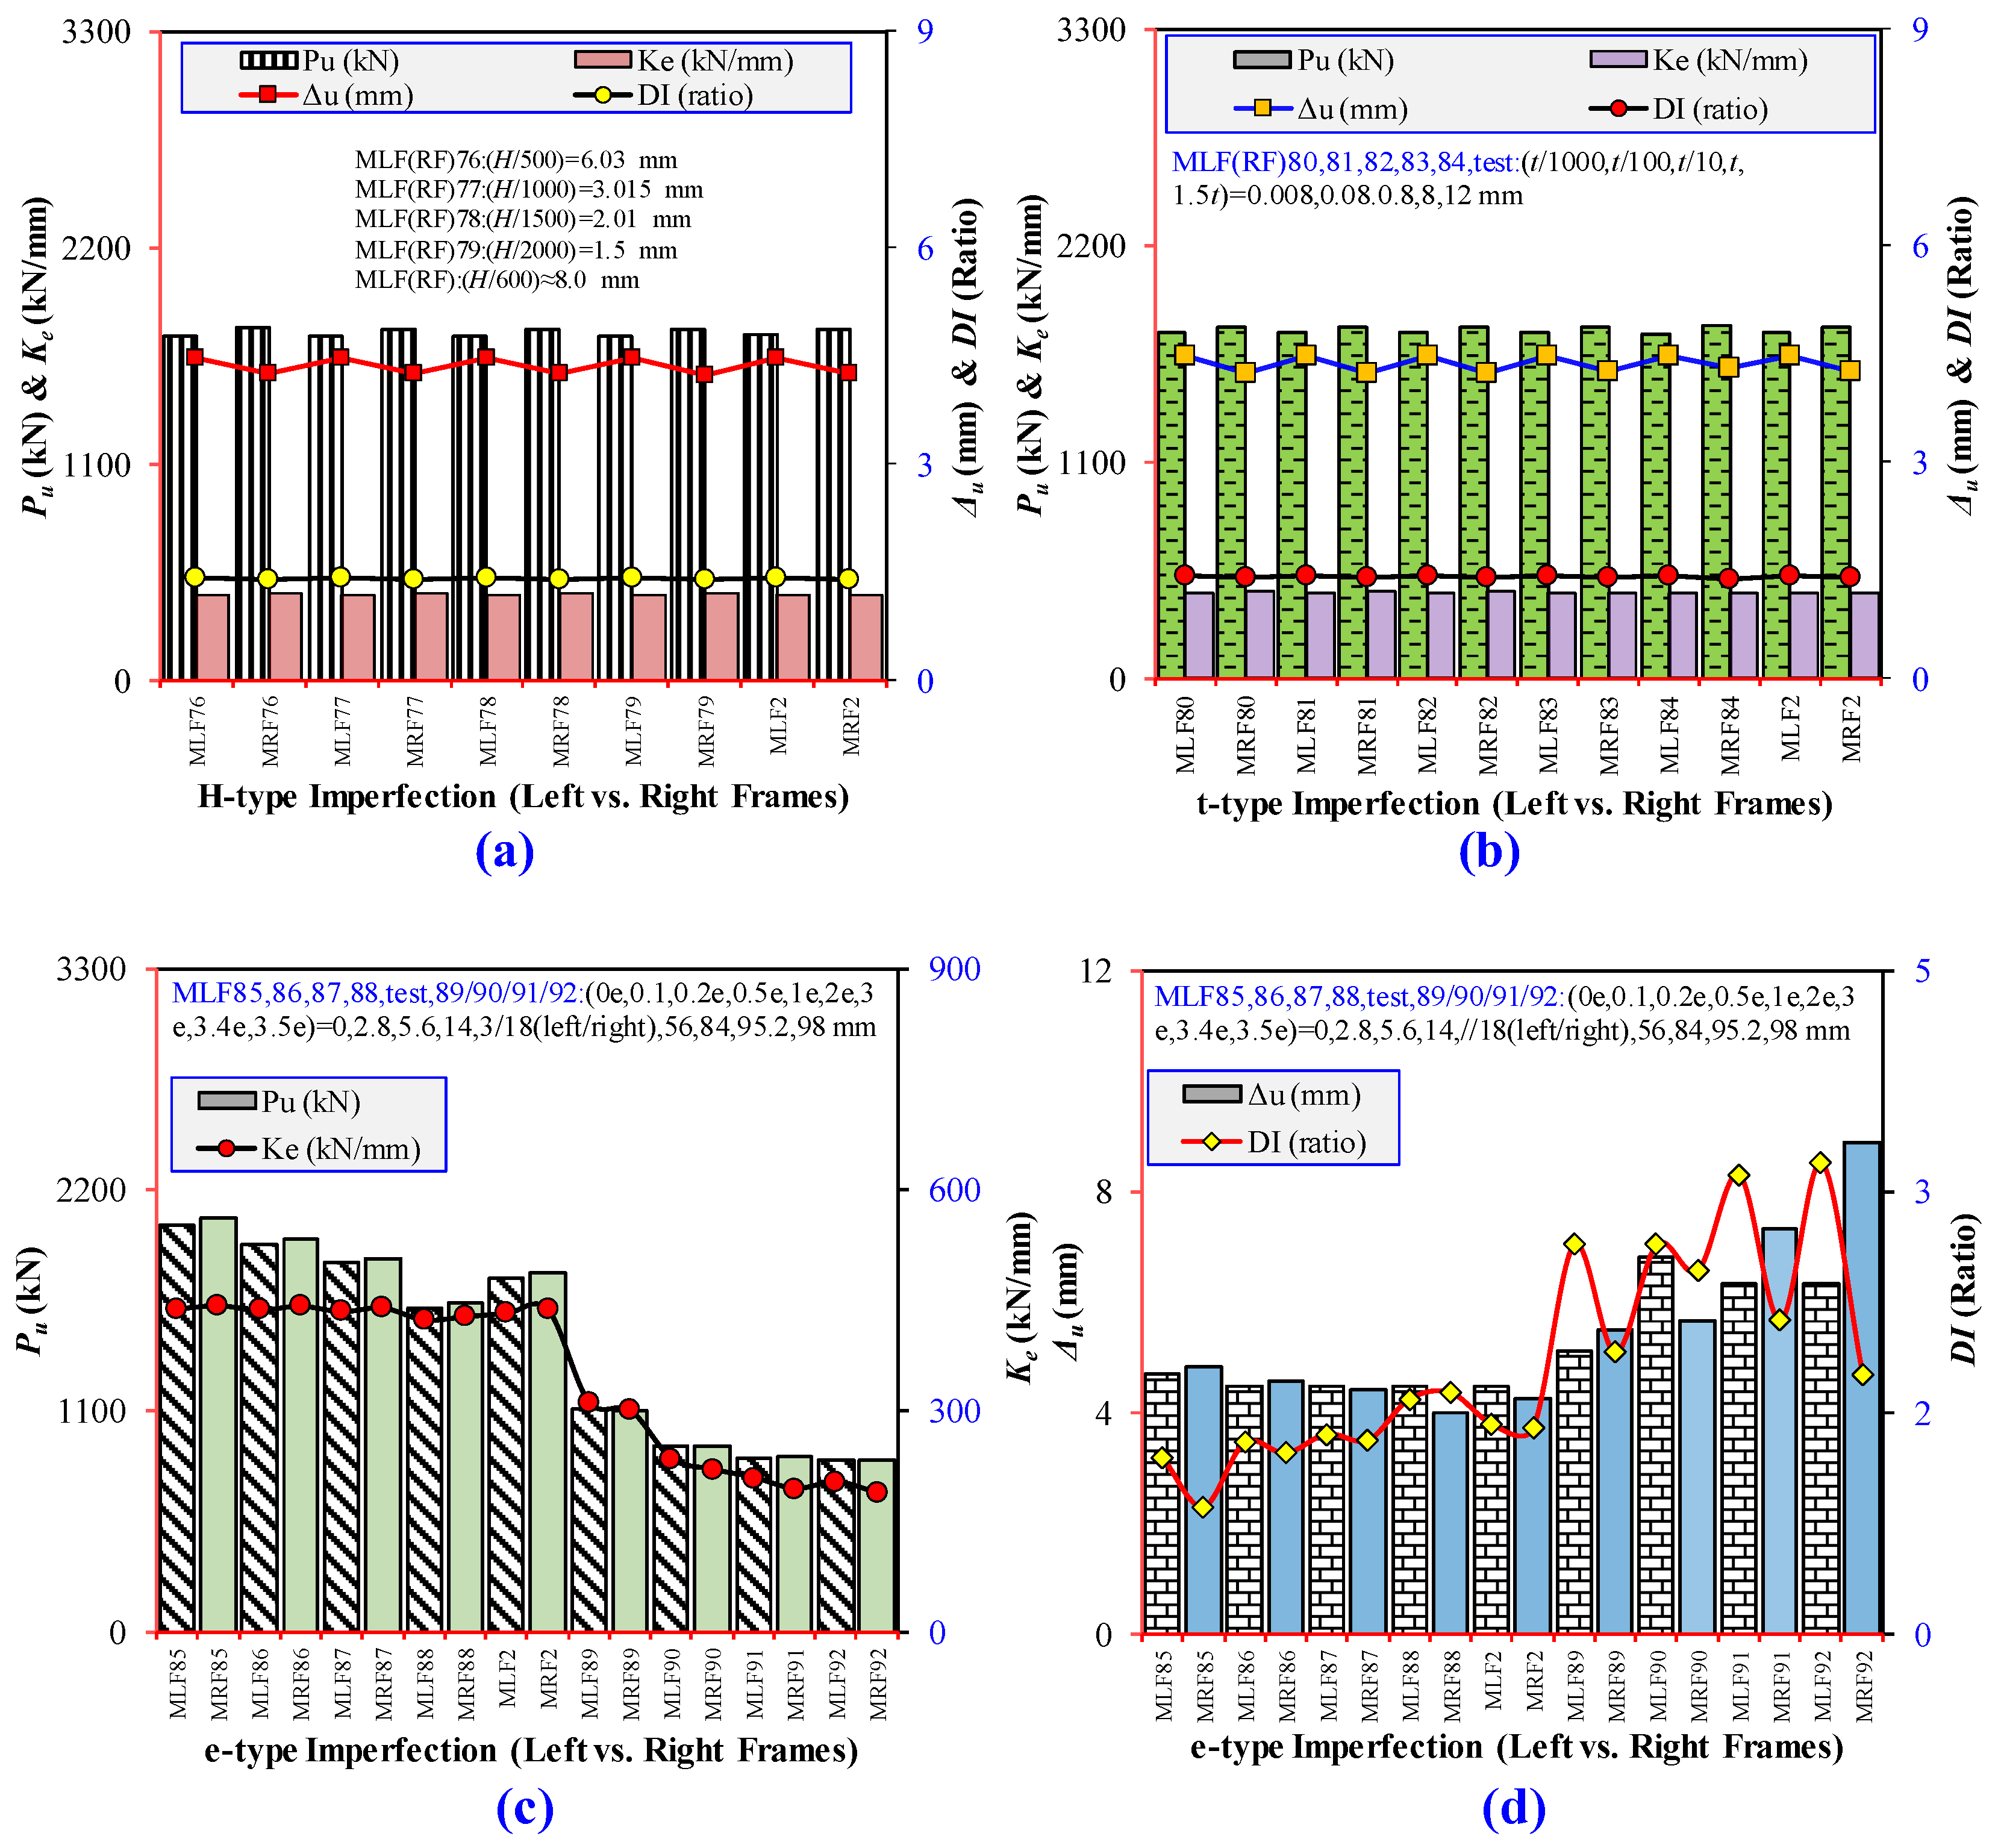
4.4. Initial Imperfections
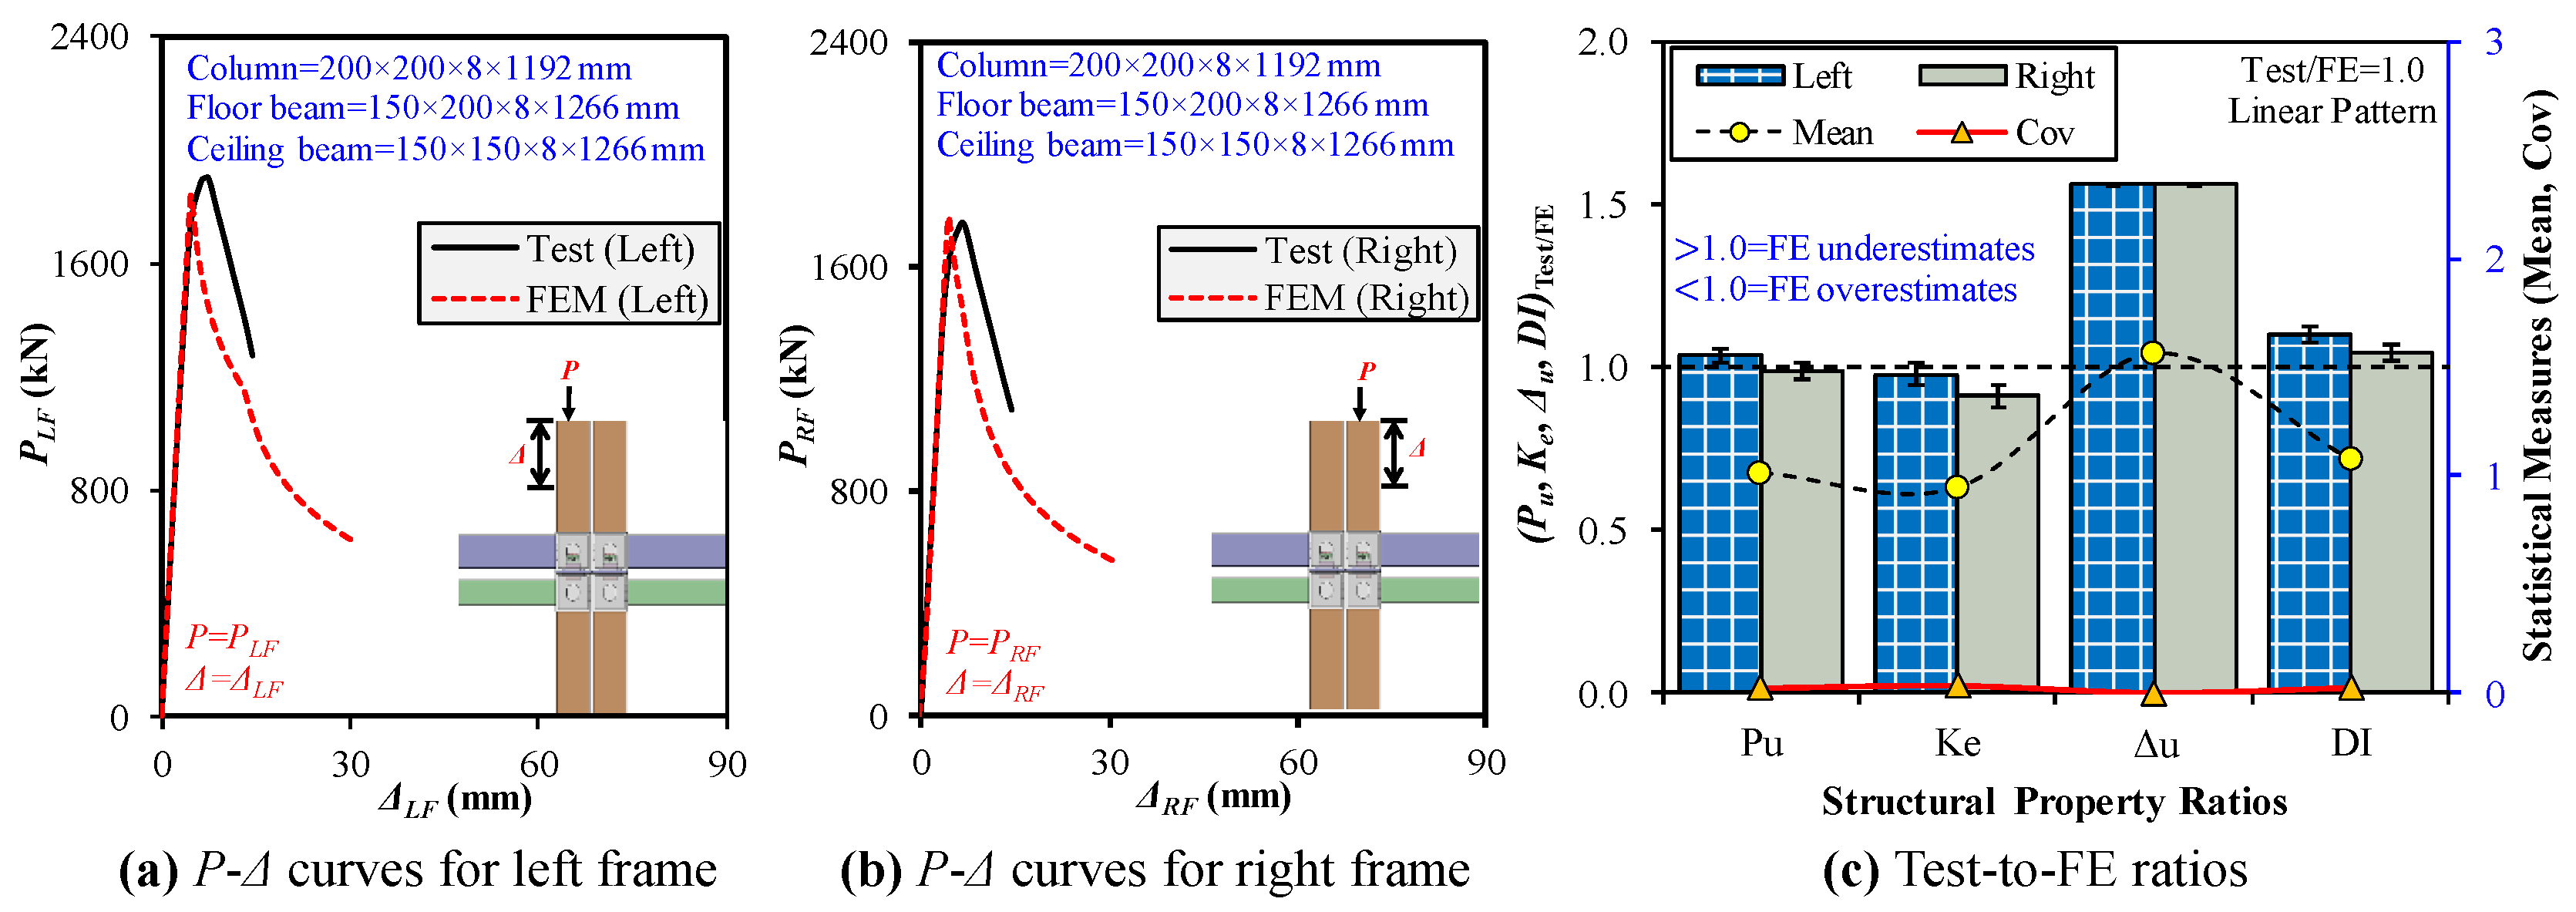
Initial local (and global) geometric imperfections critically affect the progressive compressive performance of modular steel frames by significantly altering buckling initiation, force redistribution, and failure propagation. This study numerically studied the effect of controlled local imperfections in the form of column height (H) deviations (1/500 to 1/1000, 1/1500, and 1/2000) and wall thickness (t) variations (1/1000t to 1/100t, 1/10t, t, and 1.5t), alongside global imperfections modeled as axial load eccentricities (e) ranging from 0 to 0.1, 0.2, 0.5, 1, 2, 3, 3.4, and 3.5. Imperfection shapes followed Mode 1 from linear buckling analysis and were embedded in nonlinear static general and Riks-type analyses to assess their impact on Pu, Ke, Δu, and DI. Comparative simulations were performed under left- and successive right-column loading conditions, with findings benchmarked against experimental data. The results indicated that local imperfections (H-type and t-type) caused negligible variation in key response parameters. Across all amplitudes, changes in Pu and Ke remained within ±0.3%, while Δu and DI showed minor fluctuations, which affirms that these small-scale imperfections do not significantly influence failure mechanisms or global behavior in progressive loading scenarios. By contrast, global imperfections (e-type) had a pronounced impact. Increasing the eccentricity to 2e or higher led to a strength reduction exceeding 35% and stiffness loss above 30%, accompanied by a sharp rise in post-peak ductility. Excessive eccentricity also led to a shift in failure modes by causing earlier instability and stress concentration in critical regions, particularly in the right column, following the collapse of the left column. Based on these trends, global imperfection as an eccentricity of e = 3 mm (18 mm) for left- (right-) column loading, combined with H or t of 8 mm as local imperfection amplitudes, yielded the best agreement with experimental outcomes regarding load–shortening behavior, deformation pattern, and failure location. As illustrated in Figure 12a–d, the influence of imperfection type and magnitude is asymmetric across progressive loading stages, which highlights the importance of selecting rational imperfection amplitudes during sequential column failure.

4.5. Validations

The efficacy of the FEMs was verified by comparing the predictions with the experimental results for both left- and right-column progressive compressive loading scenarios, as depicted in Figure 13a–d and Figure 14a–c and Table 1. Key metrics evaluated include the Pu, Ke, Δu, and DI. For the left-column loading, the FEM predicted Pu, Ke, Δu, and DI with ratios of 1.04, 0.98, 1.56, and 1.10, respectively, relative to test values. The respective ratios for the right-column loading were 0.99, 0.91, 1.56, and 1.05. Despite simplifications in material modeling, boundary flexibility, and geometric imperfections, these comparisons indicate excellent agreement in strength and stiffness predictions (within 2–10%) and reasonable accuracy in deformation and ductility estimations. The statistical analysis further confirms the robustness of the FEM. Across both loading scenarios, the mean test-to-FEM ratio for Pu and Ke was 1.01 and 0.94 with low coefficients of variation (Cov) of 0.02 and 0.03, respectively. The FEM effectively captured both the initiation and evolution of buckling, including local inward and outward deformation at the UC ends, as well as stress transmission during left-column failure and lower column zones in right-column loading. The deformed shapes observed in the simulation mirrored the physical test behavior, which validates that the model accurately reflects the progressive failure mechanisms in modular interior frames with rotary M2M connections. These results verify that the proposed FEM is capable of capturing nonlinear behavior, load redistribution, and failure evolution under sequential column loading, which makes it a reliable tool for extended parametric and theoretical studies.

5. Parametric Analysis

After validating the finite-element model (FEM) using the progressive loading tests on both left and right columns, an extensive parametric study was carried out to examine the effects of critical design parameters on the progressive compressive response of modular steel interior frames incorporating semi-rigid rotary M2M connections. The same FEM—verified for sequential column failure—was adopted to simulate various design scenarios, thus ensuring consistency in evaluating progressive instability and load redistribution mechanisms. The numerical model employed a 30 mm structured mesh to balance computational efficiency and accuracy. Local initial imperfections incorporated an amplitude of 8 mm while, globally, e = 3 mm (18 mm) was used for left- (right-) column loading to accurately capture local buckling onset, P-Δ effects, and nonlinear deformation patterns. A total of 92 parametric cases were analyzed by varying beam and column cross-sectional sizes, member lengths, inter-module gaps, column quantities, and connecting plate thicknesses. The rotary M2M connections and corner fittings were modeled consistently across all simulations to isolate the effects of frame-level geometry and stiffness variation.

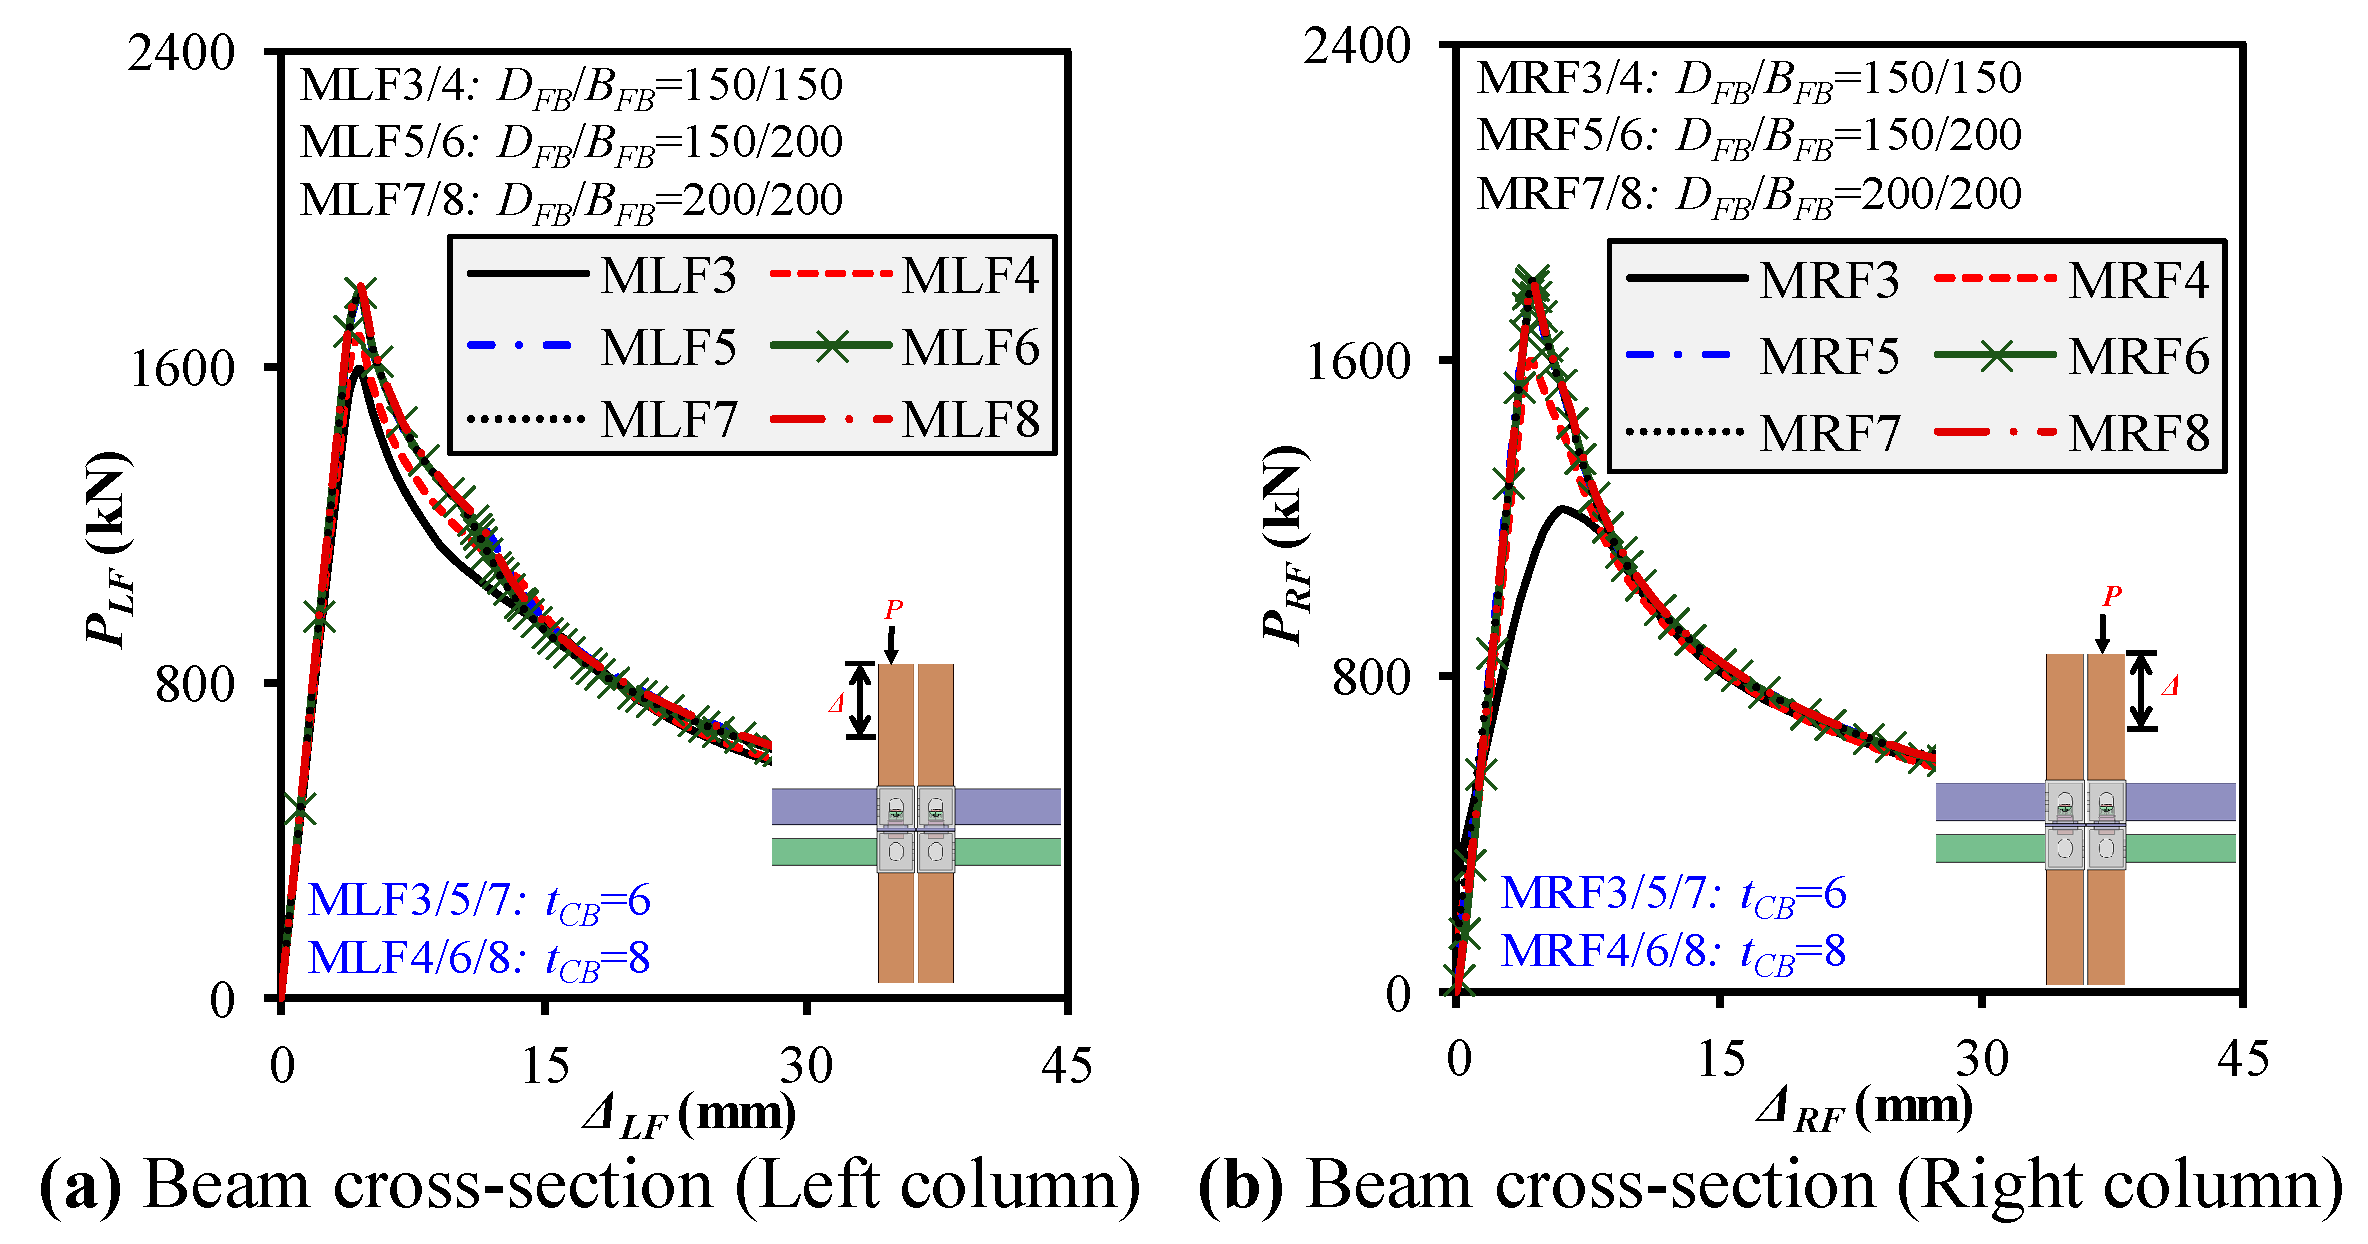
5.1. Influence of Beam Cross Sections on Progressive Compression Behavior

The progressive compressive response of modular steel interior frames was evaluated under varying floor and ceiling beam cross-sectional dimensions (D × B × t)FB/CB while keeping all other structural parameters consistent with the validated FEM configuration, as shown in Figure 15a,b. Cross-sectional variations were introduced across specimens MLF3–MLF8 (for left-column loading) and MRF3–MRF8 (for right-column loading), with FB sizes ranging from 150 × 150 × 8 mm to 200 × 200 × 8 mm and CB sizes from 150 × 150 × 6 mm to 150 × 150 × 8 mm. The findings reveal that increasing the FB cross section from 150 × 150 × 8 mm to 200 × 200 × 8 mm improved the Pu of the MLF specimens by up to 7.6%, with corresponding Ke increases of about 4.5%. The Δu remained relatively stable, around 4.48 mm, while DI showed a marginal decline of approximately 2%. Similar improvements in Pu and Ke were observed in the MRF series, where Pu rose from 1597.97 kN in MRF3 to 1802.06 kN in MRF8—an increase of about 12.8%—with stiffness gains of 8%, despite minor reductions in Δu (2%) and DI (9.3%). The rise in the cross section clearly enhanced frame stability by delaying buckling and minimizing sway, contributing to higher strength and reduced post-ultimate deformation. Interestingly, the variation in CB thickness (from 6 to 8 mm) had a limited impact on the load-bearing performance compared to changes in FB size, which indicates that the floor beams, being the primary load-transferring elements, play a more significant role in resisting progressive compressive loads. The difference in behavior between the left- and right-column loading scenarios also highlights the influence of progressive stress redistribution and residual deformation from prior loading, especially in MRF4, where a notable drop in Pu (23.4%) and rise in DI (6.1%) suggest instability induced by prior failure in the adjacent column.

5.2. Influence of Beam Lengths on Progressive Behavior

The progressive compressive response of modular steel interior frames was evaluated under varying floor and ceiling beam lengths (L)FB/CB while keeping all other structural parameters consistent with the validated FEM configuration, as shown in Figure 16a,b. When analyzing frames with identical cross sections but varying beam lengths (e.g., 150 × 150 × 8 mm in MLF/RF-9, 4, 12) from 600 mm to 3000 mm, Pu decreased by 25.7% (from 1725.36 to 1282.97 kN), Ke dropped by 49.4%, Δu reduced by 13%, and the DI rose to 70% for left-frame column loading (MLF), which indicates instability-driven failure but a more extended post-buckling phase. For the right frame (MRF), the reduction in Pu was even more critical—32.6%—along with a 33% drop in Ke and a dramatic increase in Δu to 7.38 mm (75%), which implies accumulated sway and delayed failure due to prior left-side loading. Similarly, for the 150 × 200 mm beam group (MLF/RF-10, 6, 13), Pu peaked at 1841.27/1771.62 kN (600 mm), stayed steady at 1790.06/1798.03 kN (1196 mm), and then dropped to 1729.56/1771.25 kN (3000 mm). The stiffness followed a similar declining pattern. However, right-frame loading showed a dip in DI in the 3000 mm cases (e.g., MRF13: 0.85), which suggests asymmetric post-buckling behavior under progressive failure. Similarly, for 200 × 200 mm beams (MLF/RF-11, 8, 14), longer spans slightly reduced Pu and Ke but retained more consistent ductility. However, the right frame again showed greater sensitivity, where DI fell from 1.48 (MRF11) to 0.86 (MRF14), thus reinforcing that instability effects from left-side loading dominate the right column’s failure path, especially in longer beam configurations. Increasing beam cross sections enhances strength and stiffness with minimal impact on ductility. By contrast, longer beam spans significantly reduce Pu and Ke while amplifying ductility inconsistencies, especially under right-column loading, due to accumulated deformation from progressive sequencing. This underscores the need to optimize beam size and span to balance load capacity and post-peak resilience, particularly in modular structures prone to sequential failure propagation.

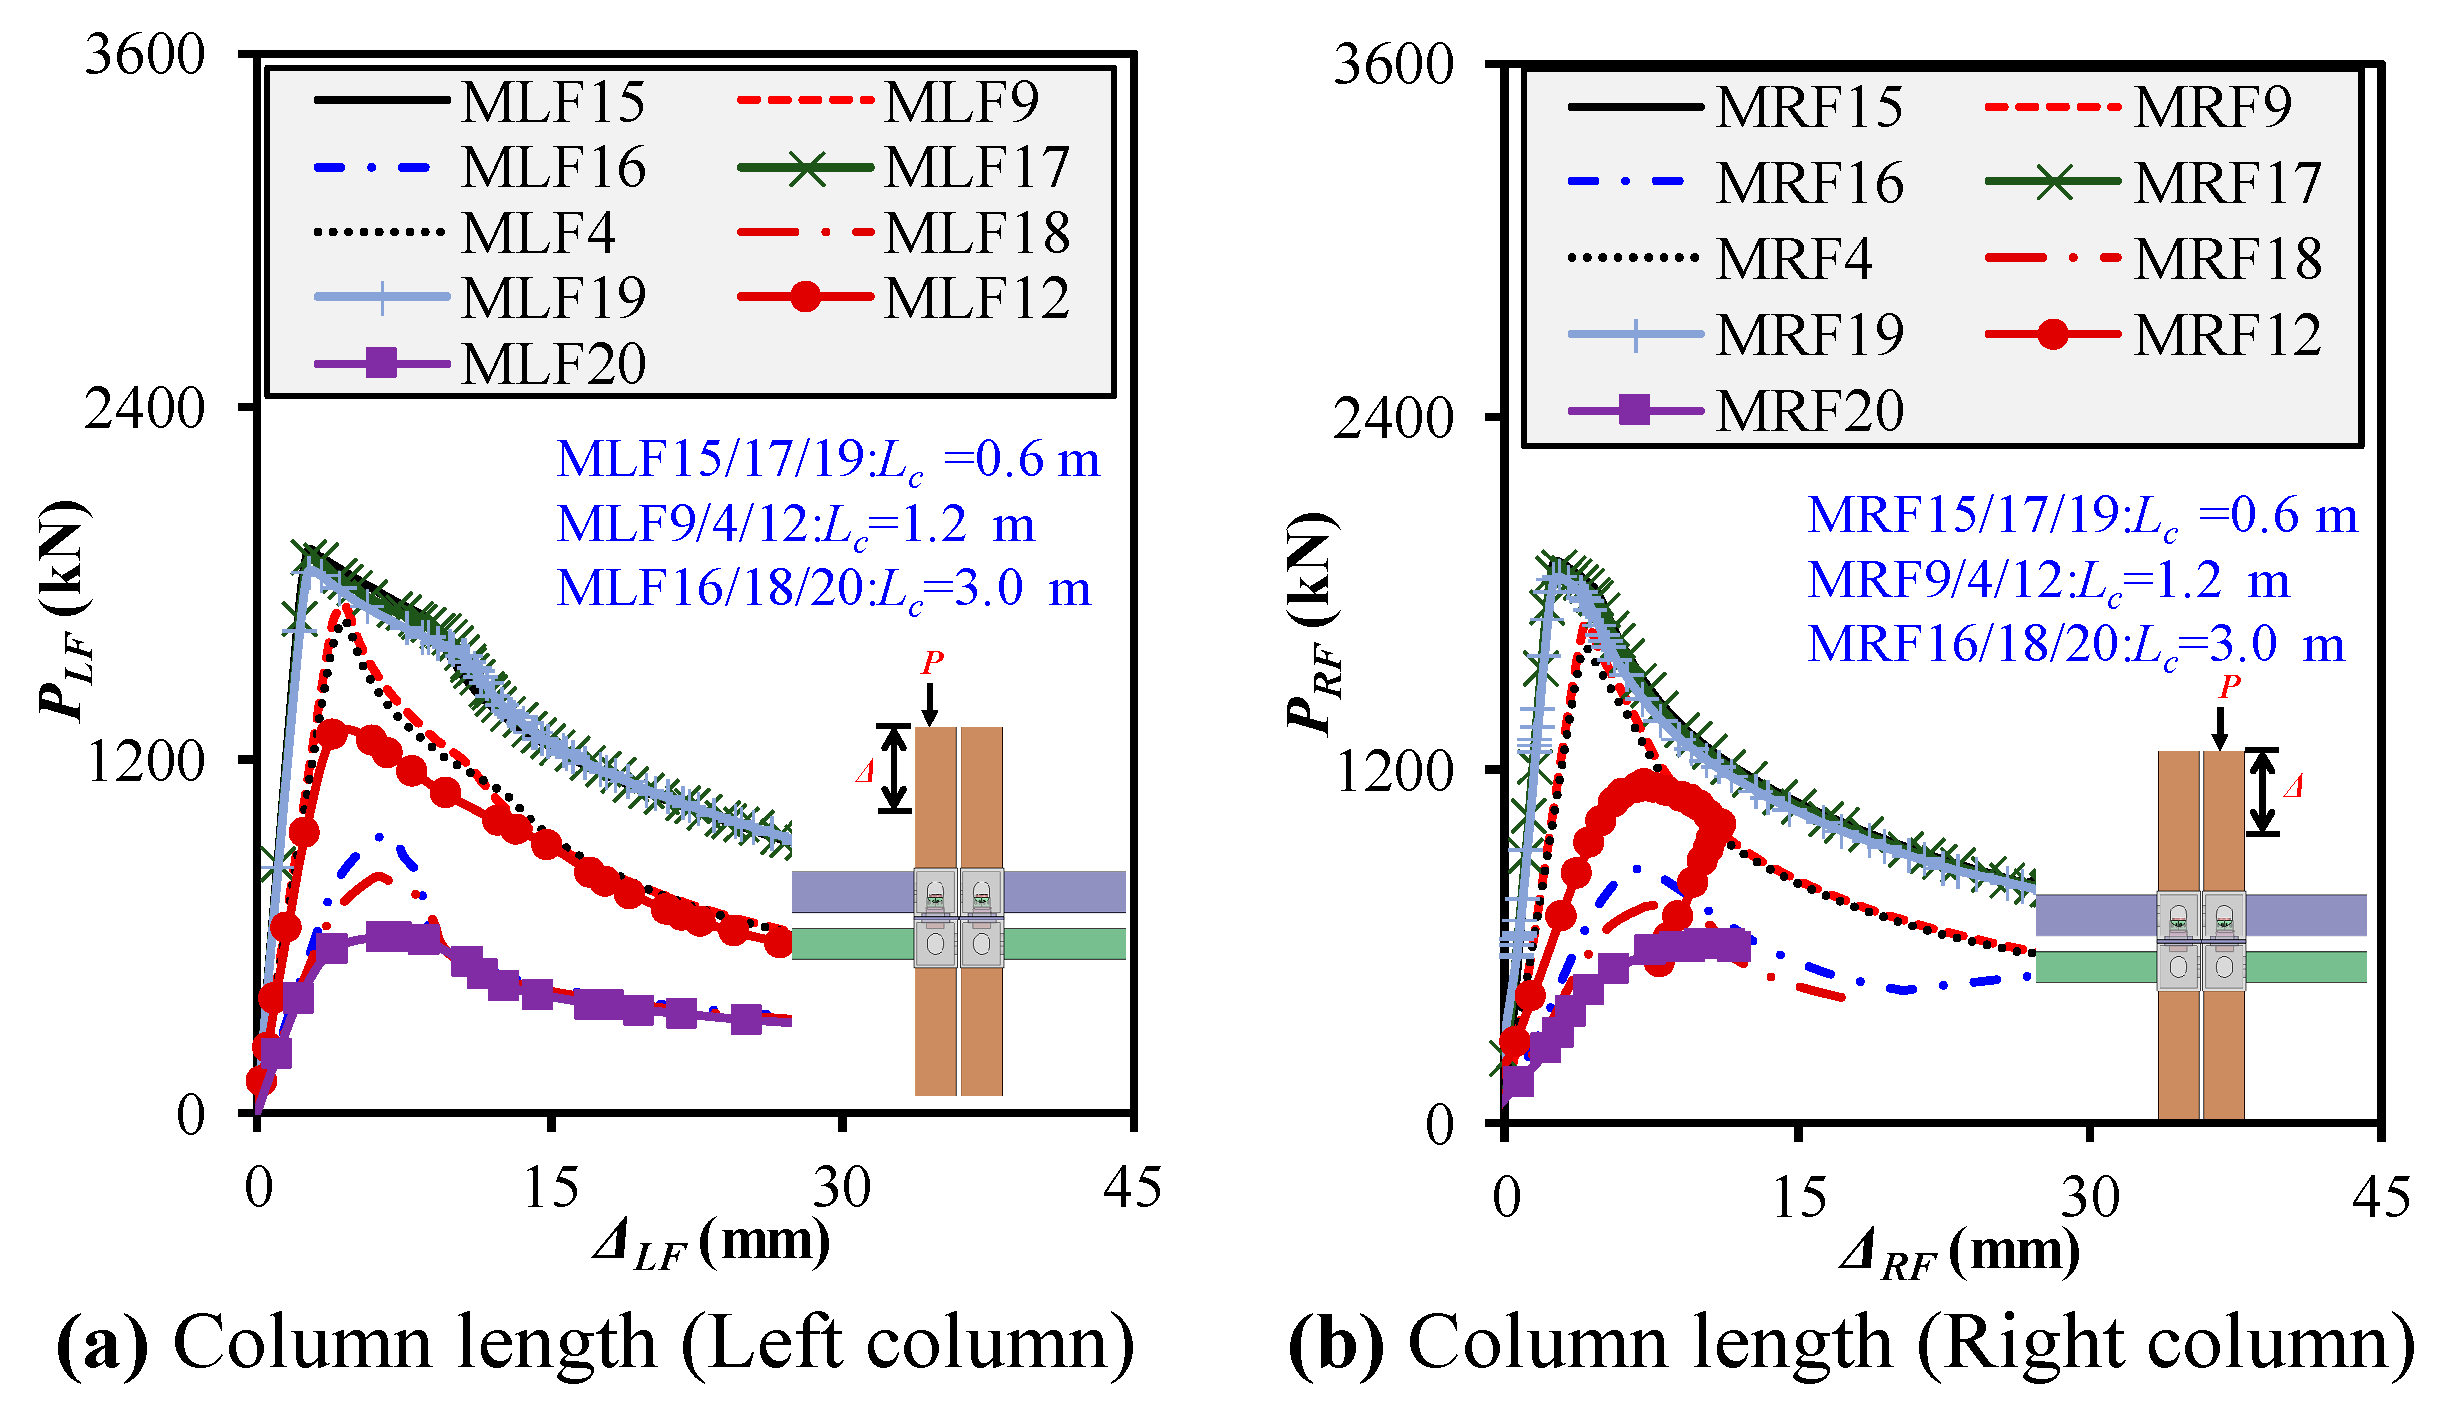
5.3. Influence of Column Length on Progressive Behavior

In order to investigate the effect of column length (Lc) on the progressive compressive response of modular steel frames, two sets of configurations were analyzed, each with constant beam and column cross sections (200 × 200 × 8 columns; 150 × 150 × 8 or 200 × 200 × 8 mm beams), while systematically varying the column height across 600 mm, 1200 mm, and 3000 mm, as depicted in Figure 17a,b. Each group was tested under three different beam spans (600 mm, 1192 mm, and 3000 mm) to explore interaction effects. For the first group with smaller beams (MLF/RF15, 9, and 16; 17, 4, and 18; and 19, 12, and 20), increasing the column length from 600 mm to 1200 mm caused a notable decrease in strength and stiffness under left-column loading. For instance, Pu dropped by 9.3% (from 1904.99 to 1725.36 kN), and Ke declined by 45%, which indicates increased flexibility and lateral deformation. When the column height was further increased to 3000 mm, Pu reduced drastically by 50% (to 945.61 kN) and Ke by 74.8%, which shows that taller columns significantly compromise stability under compressive loading. The same trend was observed for right-frame loading, where Pu dropped from 1905.18 kN (600 mm) to 861.25 kN (3000 mm)—a 54.8% reduction. Moreover, the DI in right frames increased slightly for moderate lengthening due to delayed failure (e.g., MRF9 = 1.48), but at extreme heights (MRF20), sway and instability took over, reflected by a sharp rise in Δu (11.17 mm) and a drop in DI (1.06). Furthermore, a similar pattern emerged in frames with larger beams (MLF/RF21, 11, and 22; 23, 8, and 24; and 25, 14, and 26) but with improved overall capacity due to the stiffer beam sections. For left frames, Pu decreased by 4% from 1921.25 kN (MLF23, 600 mm columns) to 1807.82 kN (MLF8, 1200 mm) and then sharply to 1277.84 kN (MLF24, 3000 mm), which appeared counterintuitive. However, the Ke value dropped from 813.2 to 206.3 kN/mm, which suggests that the increased flexibility offset the higher axial capacity. Δu increased to over 6.5 mm, and DI rose to 1.4, which indicates prolonged deformation after peak load. For the corresponding right frame (MRF21 → MRF26), the Pu value decreased from 1904.35 kN to 1059.31 kN, marking a 44% strength loss across increasing column heights. Ke dropped by over 75%, and while DI remained stable (~2.15 to 1.29), the excessive shortening and lateral instability became the controlling failure mode. Across both beam types, increasing the column height consistently reduced strength and stiffness, particularly under right-column loading, where prior left-side loading had already introduced sway and stress redistribution. Longer columns contributed to lateral instability and amplified imperfection sensitivity, while DI behavior depended on the interaction between frame stiffness and accumulated deformation. The 3000 mm columns proved particularly vulnerable, regardless of beam section, which highlights the need for effective bracing or cross-sectional enhancement when designing taller modular frames for progressive compressive scenarios.

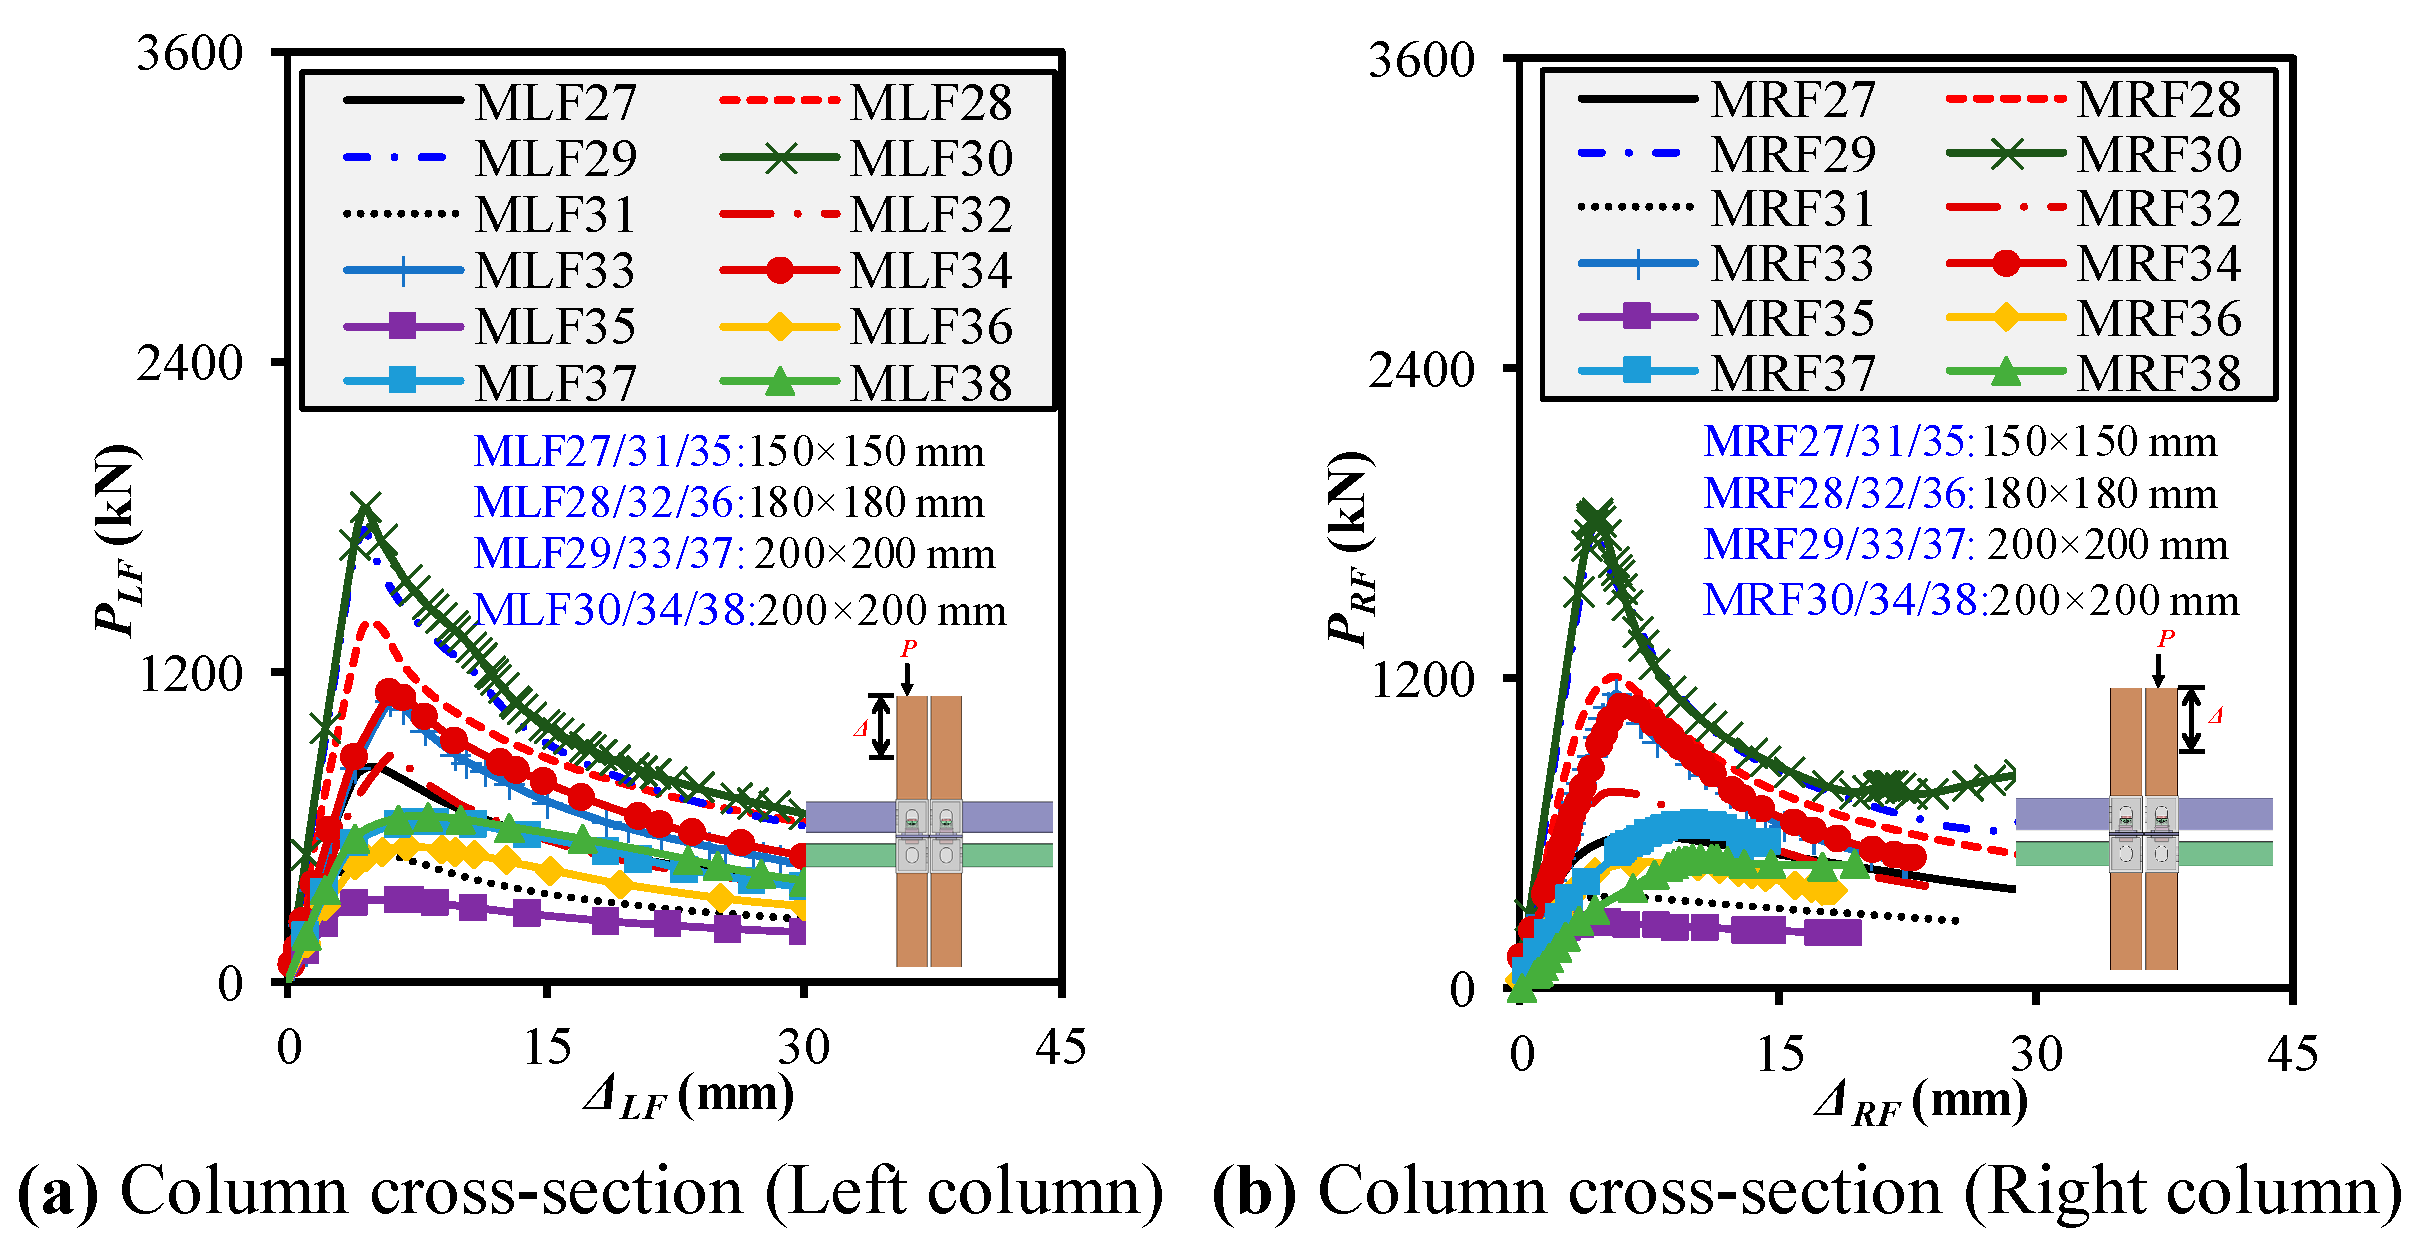
5.4. Influence of Column Cross Sections on Progressive Behavior

The impact of column cross-sectional measurements on the progressive compressive behavior of modular steel frames was studied under the matched beam and column lengths in three groups—1266/1196 mm, 2500/2500 mm, and 3000/3000 mm—as shown in Figure 18a,b. In each group, the column section was varied across 150 × 150 × 8, 180 × 180 × 8, 200 × 200 × 8, and 210 × 210 × 8 mm, while beam sections and lengths were held constant. The progressive behavior was analyzed under both left- and right-column loading. In the short-frame configuration (MLF/RF 27–30), increasing the column size from 150 × 150 × 8 to 210 × 210 × 8 mm led to a sharp rise in strength and stiffness. Pu increased by 121% (from 831 to 1834 kN) and Ke by 96% (from 228 to 446 kN/mm) for left-frame loading. Similar improvements were observed in right-frame loading: Pu rose from 596.8 to 1834.1 kN, and Ke from 215 to 455 kN/mm. Despite the stiffness gain, ductility decreased slightly (DI fell from ~1.69 to ~1.52), which suggests a trade-off between strength and post-peak deformability. For intermediate frame lengths, with increased member lengths (MLF/RF 31–34), a similar trend was observed, but strength gains were comparatively moderate due to slenderness effects. Pu for left frames rose from 487 to 1113 kN, and Ke nearly doubled from 139 to 233 kN/mm across the four cross sections. However, DI showed more variability, especially in right-column loading, where frames with 150 × 150 × 8 mm columns (MRF31) showed excessively high DI (3.75) due to post-peak drift and softening effects. Larger columns provided better balance: DI values of 1.39–1.62 were recorded for MRF33 and MRF34, which indicates stable ductile failure. In the tall-frame scenario (MLF/RF 35–38), slenderness governed behavior more dominantly. As the column cross section increased from 150 × 150 × 8 to 210 × 210 × 8 mm, the left frame Pu improved from 315 to 639 kN, while the stiffness rose from 102 to 163 kN/mm. However, this increase was modest compared to that for the shorter frames due to greater second-order effects and instability risks. The right frames showed similar patterns, with Pu peaking at 501 kN and Ke at only 75 kN/mm. Interestingly, DI fluctuated across cases: for MRF35 (150 × 150 × 8), the DI was 3.50, while MRF38 (210 × 210 × 8) had a DI of 1.85, which indicates that cross-section enhancement mitigated post-yield deformation variability. Overall, increasing the column cross-sectional area significantly enhanced both Pu and Ke under progressive loading for both left and right columns. However, the benefit reduced as the frame height increased, with diminishing returns for tall frames due to geometric instability. The DI decreased with larger columns in short frames but became more consistent in taller frames, which suggests improved control over post-peak response. For design applications in modular interior frames, optimizing the column cross section is crucial to balancing strength, stiffness, and deformability under sequential compressive failure.

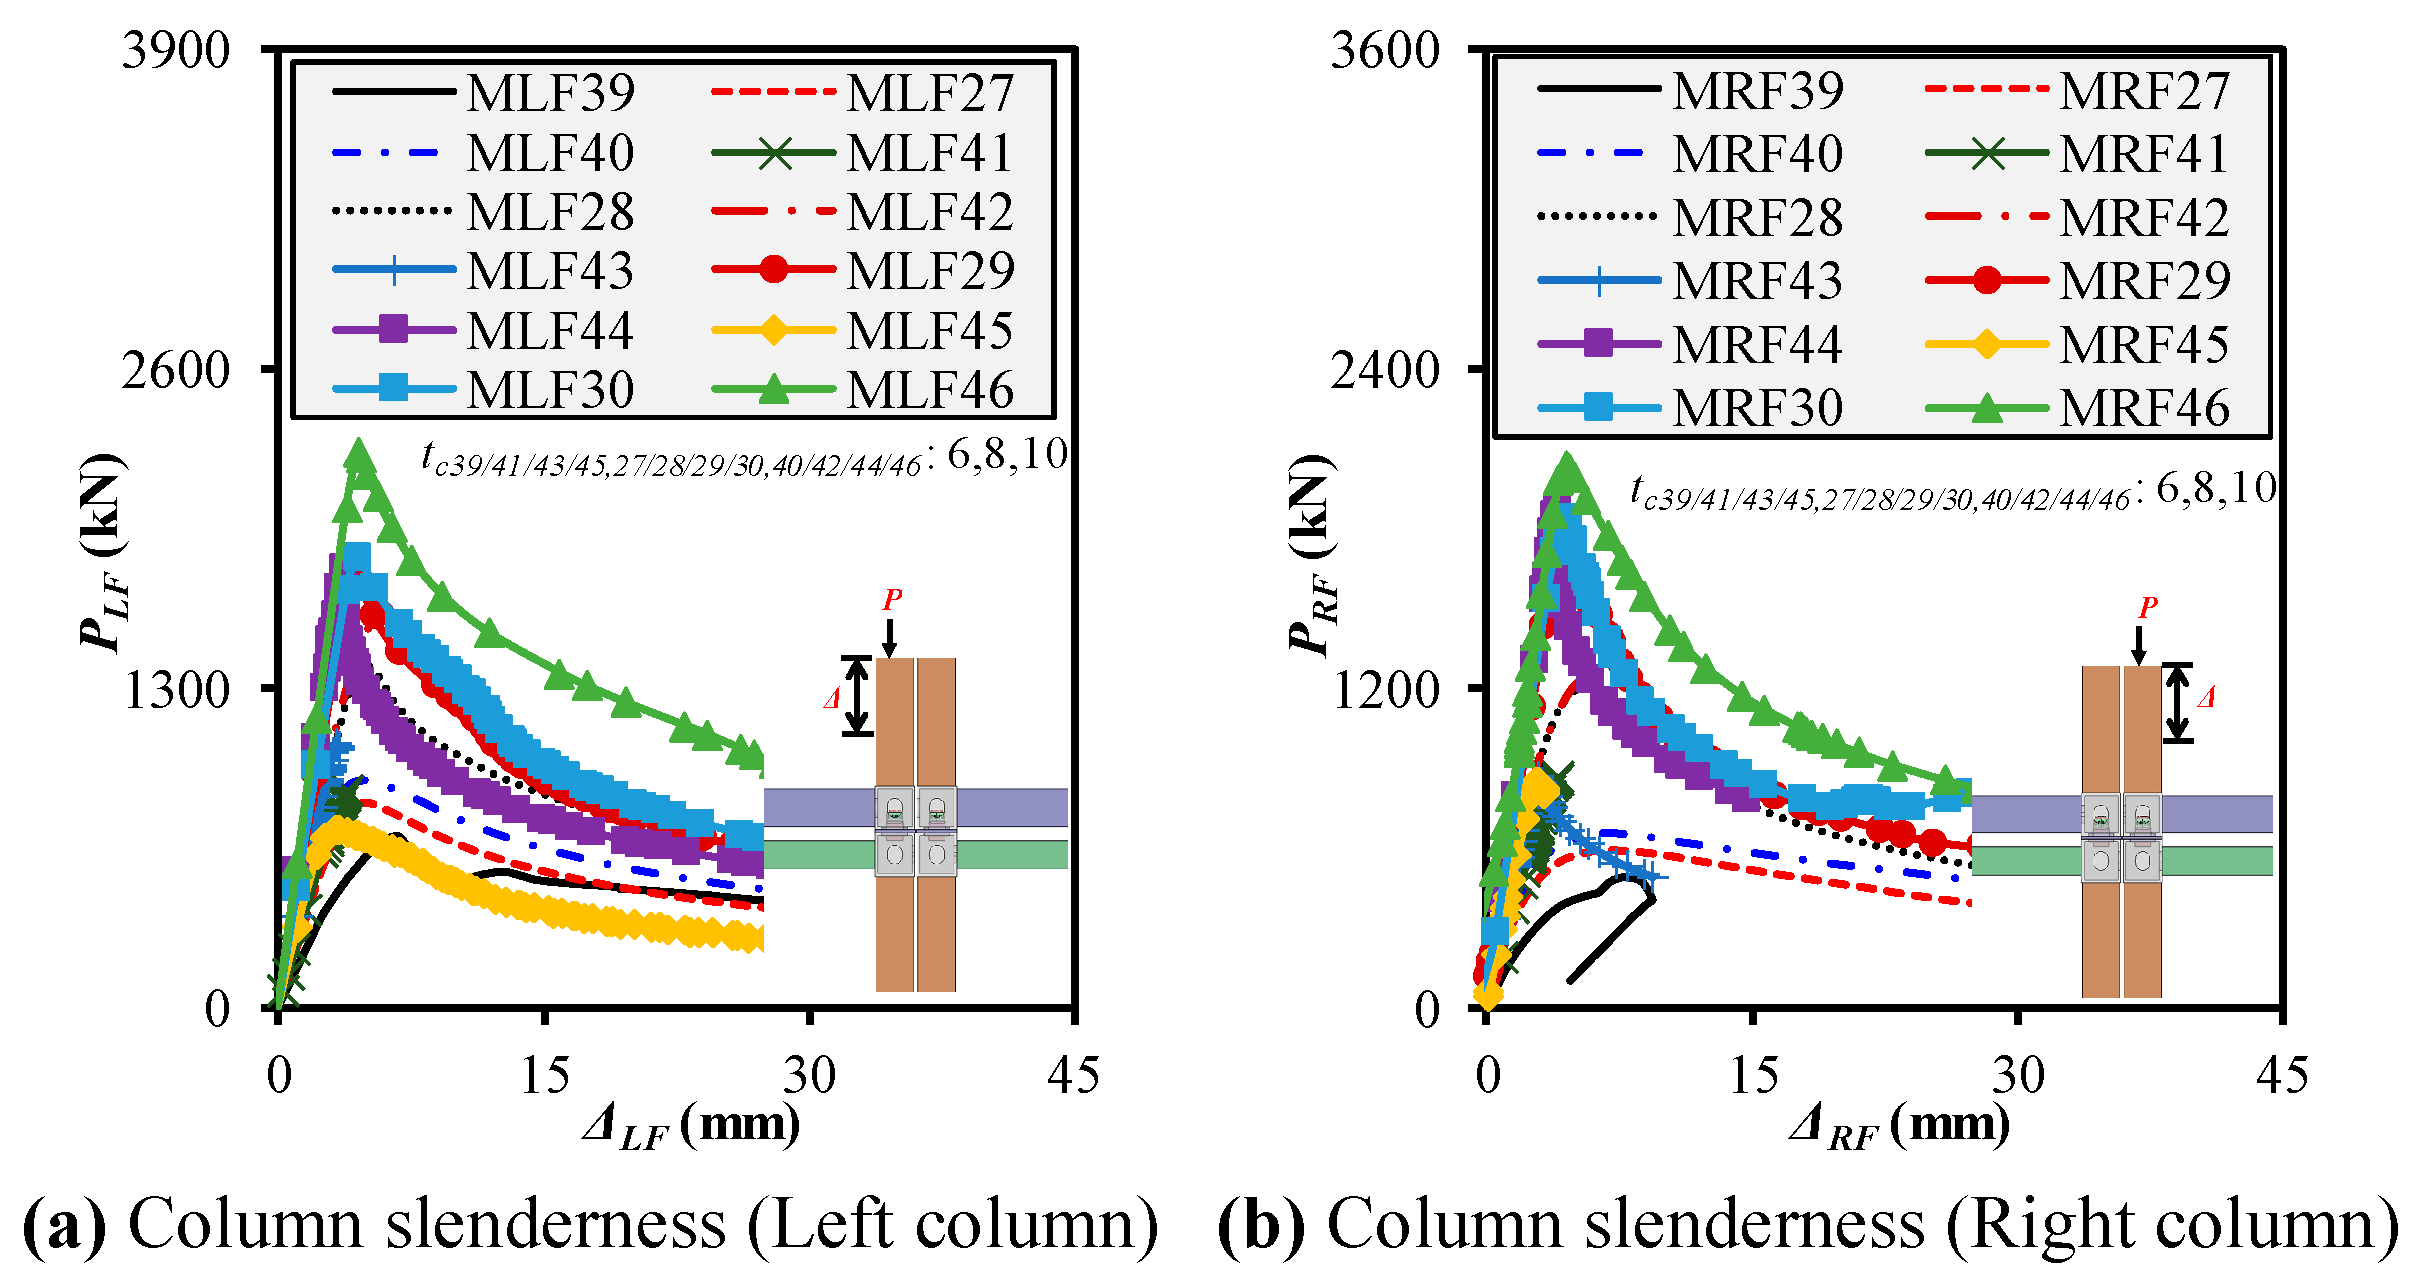
5.5. Effect of Column Slenderness on Progressive Behavior

To evaluate the influence of column slenderness on progressive compression performance, four sets of columns—150 × 150 (MF39/27/40), 180 × 180 (MF41/28/42), 200 × 200 (MF43/29/44), and 210 × 210 (MF45/30/46) mm—were analyzed, each with three thicknesses—6, 8, and 10 mm—as presented in Figure 19a,b. Beam and column lengths were fixed at 1196 mm and 1266 mm, respectively. This allowed the isolation of wall thickness as a variable to focus on its effect on strength, stiffness, and ductility under sequential column failure. For 150 × 150 mm cross-section series (MLF/RF 39, 27, and 40), increasing the thickness from 6 mm to 10 mm improved strength and stiffness. For the left frame (MLF), Pu rose from 705 to 927 kN (+31%) and Ke from 150 to 334 kN/mm (+122%). For the right frame (MRF), Pu increased from 488 to 656 kN, while Ke improved from 117 to 245 kN/mm. DI showed contrasting trends: left frames experienced a decrease in DI from ~1.19 to 0.29, which indicates increased brittleness with thicker walls, while right frames showed DI fluctuations due to accumulated damage effects and second-order instability, with a peak DI of 2.6 at 8 mm thickness. For the 180 × 180 mm cross-section series (MLF/RF 41, 28, and 42), with larger cross sections, thickness increases had a more pronounced impact on strength. Pu in left frames rose from 882 to 1642 kN and Ke from 252 to 369 kN/mm. Right frames (MRF41 to MRF42) showed a similar strength gain from 864 to 1299 kN, and Ke improved from 237 to 342 kN/mm. Interestingly, ductility (DI) improved modestly for left frames (1.00 → 1.11) but remained high and stable for right frames (DI ~1.02–2.11), which suggests that increasing the thickness helped stabilize the post-yield response without compromising plastic deformation. For the 200 × 200 mm cross-section series (MLF/RF 43, 29, and 44), in this series, increasing the thickness from 6 to 10 mm yielded modest Pu and Ke improvements but a more significant DI reduction. The MLF Pu rose from 1071 to 1783 kN, while Ke increased from 340 to 499 kN/mm. Pu increased from 864 to 1874 kN for right frames, with a notable Ke jump from 324 to 479 kN/mm. DI declined from ~1.33 to ~1.04, which reflects increasing stiffness-driven brittle failure tendencies in the right columns under secondary instability effects. For the 210 × 210 mm cross-section series (MLF/RF 45, 30, and 46), increased thickness produced the most substantial strength enhancement. Pu for left frames rose from 720 to 2256 kN and Ke from 303 to 538 kN/mm, marking a 213% gain in strength and a 77% increase in stiffness. The right-frame results were consistent: Pu rose from 852 to 2036 kN and Ke from 342 to 542 kN/mm. Unlike for the thinner columns, ductility remained relatively steady across both loading directions (DI ~1.28–1.60), which shows that a higher thickness in large columns offers a better balance between strength and deformation capacity.
Increasing column thickness consistently enhances load-bearing capacity and initial stiffness across all cross-sectional groups. However, the impact on the ductility index is nuanced: slender, thinner columns (e.g., 6 mm) offer more excellent deformability but lower strength, whereas thicker columns (10 mm) improve strength but can reduce DI if not counterbalanced by sufficient energy-dissipating mechanisms. The sensitivity of DI is more evident under right-column loading, where prior damage accumulation from left-column failure exacerbates stiffness-driven failures. This emphasizes the need for optimized wall thickness in balancing strength, stiffness, and controlled ductility in progressive-failure-resistant modular frame systems.

5.6. Effect of Beam Gap on Progressive Behavior

The floor-to-ceiling beam gap influences modular frame systems’ overall load transfer and buckling resistance under progressive compression, as Figure 20a,b shows. All column and beam lengths were held constant at 1266 mm and 1196 mm, respectively, while the inter-beam gap was varied across three levels—20, 74, and 133 mm—for four different column cross-sections—150 × 150, 180 × 180, 200 × 200, and 210 × 210 mm—each with 8 mm thickness. This setup enabled the evaluation of how varying the vertical spacing between beams affects the structural integrity and failure mechanisms under both left- and right-column loading sequences. For the 150 × 150 × 8 mm column series (MLF/RF 47, 27, and 48), as the gap increased from 20 mm (MLF47) to 74 mm (MLF27) and 133 mm (MLF48), there was a mild decrease in Pu from 836.9 to 804.3 kN (↓ ~4%) and in Ke from 223.3 to 224.4 kN/mm, with a slight increase in ductility (Δu and DI). Right-frame counterparts showed a similar trend—Pu dropped from 587.8 to 576.7 kN, while DI remained consistently high (≈2.1–2.6), which indicates increased sway and plasticity with larger gaps. For the 180 × 180 × 8 mm column series (MLF/RF 49, 28, and 50), the left-frame strength remained relatively stable, with Pu values ranging between 1410 and 1380 kN, while DI decreased slightly with the increased gap. Pu declined from 1195 to 1180 kN for the right frames, and Ke followed a similar trend. However, ductility measures showed a more prominent response, with DI peaking for the intermediate gap (74 mm), which indicates a potential transition point in the sway–buckling mechanism. For the 200 × 200 × 8 mm column series (MLF/RF 51, 29, and 52), this group exhibited a minor variation in Pu and Ke across the gap changes (within 1–2%), which suggests that the beam gap has a limited impact on strength when column cross-sectional size is relatively large. The DI for left frames stayed within 1.43–1.44, while right frames displayed slightly reduced ductility with larger gaps, likely due to increased localized deformations from reduced beam confinement. For the 210 × 210 × 8 mm column series (MLF/RF 53, 30, and 54), in this largest column group, the influence of the gap was negligible on load-bearing capacity (Pu ~1814–1831 kN) and Ke (≈445 kN/mm). DI and Δu values remained consistent across all three gaps for both left and right frames, which emphasizes that once column and beam cross-sections are sufficiently stiff, the inter-beam spacing has little influence on progressive failure patterns.
Across all column sizes, increasing the floor-to-ceiling beam gap reduces strength and stiffness, particularly for smaller cross sections like 150 and 180 mm, while having a marginal influence on ductility. The impact is nearly negligible for larger column profiles (200 and 210 mm). However, right-frame ductility consistently showed higher sensitivity to gap changes, likely due to prior damage from left-column failure and accumulated instability. Therefore, moderate inter-beam gaps (around 74 mm) offer a balanced trade-off between strength and energy absorption without compromising stability for optimized structural performance under progressive compression.

5.7. Impact of Gap Between Adjacent Columns on Progressive Behaviors

In progressive modular frame assemblies, the spacing between adjacent columns can significantly affect internal force transfer, rotational compatibility, and load redistribution between left and right frames, as shown in Figure 21a,b. This study held column and beam lengths constant at 1266 mm and 1196 mm, respectively. All specimens used a UC/LC cross section of 200 × 200 × 8 mm, FB section of 150 × 200 × 8 mm, and CB section of 150 × 150 × 8 mm. The only varying parameter was the gap between adjacent columns, set to 12 (MF55), 18 (MF56), 24 (MF29), and 36 (MF57) mm, investigated in both the left (MLF)- and right (MRF)-column loading stages. For the left frame (MLF55–MLF57, MLF29), the Pu showed a gradual increase from 1701.9 kN for the 12 mm gap (MLF55) to 1810.5 kN for the 36 mm gap (MLF57), an overall improvement of ~6.4%, which indicates that a larger gap provides improved rotational flexibility and stress distribution. However, Ke slightly declined from 446.6 to 422.8 kN/mm, which suggests a modest loss in elastic rigidity. The Δu primarily remained stable (~4.48 mm), with only a minor fluctuation in DI around 1.44–1.50, which confirms that the left frames maintained consistent energy absorption despite gap variations. For the right frame (MRF55–MRF57, MRF29), the results exhibited more fluctuation due to the cumulative instability following left-side failure. Pu decreased from 1850.7 kN (12 mm) to 1725.3 kN (36 mm), a ~6.8% drop, likely due to reduced lateral restraint as the gap widened. Interestingly, Ke also declined from 470.5 to 409.7 kN/mm, which aligns with expectations of reduced stiffness with wider spacing. However, Δu increased slightly, and DI remained fairly balanced (~1.34–1.45), which indicates that post-peak ductility was not compromised despite the strength loss.
A moderate increase in the column gap (from 12 to 36 mm) improves left-frame load-bearing behavior by enhancing deformability and releasing restraint-induced stresses. However, the same increase slightly undermines right-frame performance due to earlier instability activation. Overall, the 24 mm gap (MLF29/MRF29) yielded the most balanced performance, offering strong strength–ductility synergy under progressive compression without excessive stiffness compromise. This highlights the importance of gap optimization in designing robust inter-column modular assemblies.

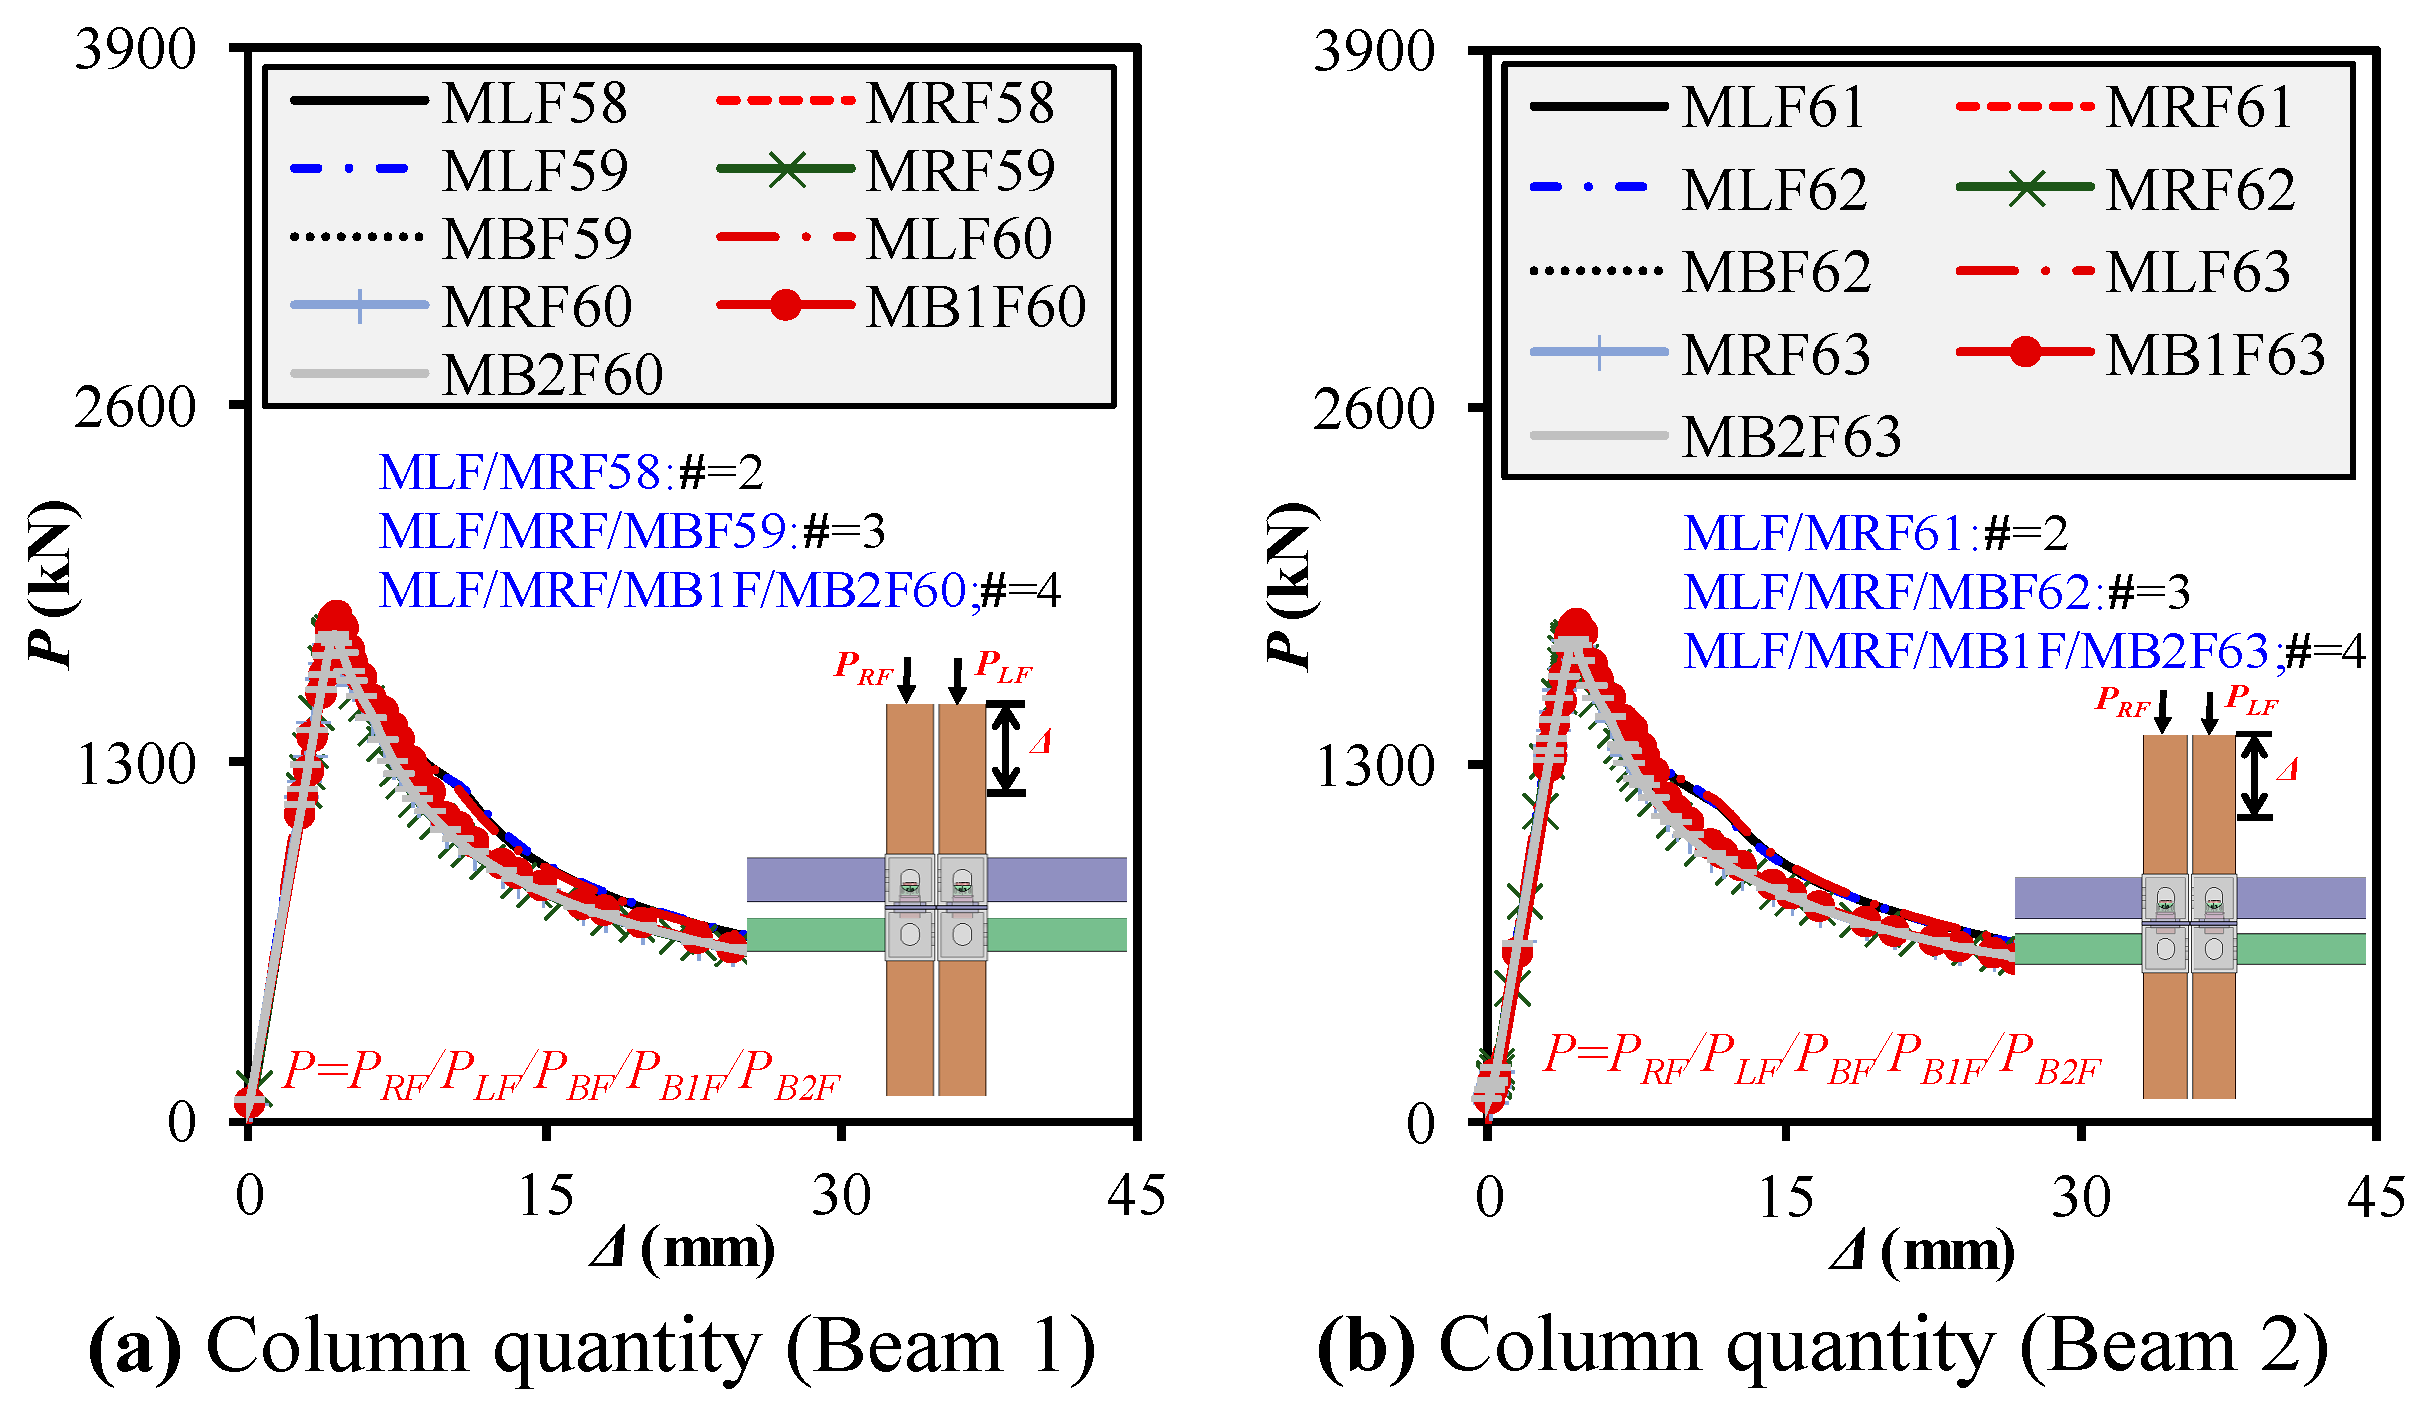
5.8. Impact of Number of Columns on Progressive Behaviors

The number of columns within modular interior frames significantly affects load distribution, system redundancy, and progressive failure propagation, as presented in Figure 22a,b. This study investigated progressive compression behavior by varying the number of vertical columns from two to four while maintaining constant beam and column lengths (1196 and 1266 mm, respectively) and UC/LC cross sections of 200 × 200 × 8 mm and FBs of 150 × 200 × 8 mm, while CBs were categorized into two cases—150 × 150 × 8 mm (Case A) and 150 × 150 × 6 mm (Case B)—to examine the influence of out-of-plane stiffness in multi-column configurations. For thicker CBs (150 × 150 × 8 mm), in the two-column setup (MLF58/MRF58), high Pu (1753–1790 kN) and Ke (~432–438 kN/mm) values were observed. With the increase to three columns (MLF59/MRF59/MBF59), there was a minor drop in left-frame Δu (3.91 mm) but a rise in MBF ductility (~4.34 mm). The system showed a more uniform force distribution with four columns (MLF60–MB2F60). Although the Pu values remained fairly stable (~1753–1767 kN), stiffness values varied depending on the frame’s position in the sequence, with MB1F showing the lowest Ke (421 kN) and highest deformation. This reveals that additional columns improved ductility redistribution, especially in the later failure stages. The DI for the left columns slightly increased from ~1.43 (two-column) to ~1.63 (four-column), which indicates better energy absorption. A similar trend was observed for thinner CBs (150 × 150 × 6 mm) for this configuration. While Pu and Ke slightly decreased due to reduced ceiling-beam stiffness, multi-column arrangements exhibited effective ductility propagation. For example, MLF61 (two-column) maintained a Pu of ~1730 kN with a DI of ~1.44, whereas MLF63 (two-column) maintained a similar strength (1744 kN) with a higher DI ~1.59. Notably, MB1F and MB2F in the four-column case (MB1F63/MB2F63) continued to carry substantial loads (~1814 and 1752 kN, respectively), even as their Ke values decreased. This indicates that thinner CB sections can still sustain progressive failure efficiently if supported by a robust multi-column layout. Increasing the number of columns enhanced global deformation capacity and delayed failure propagation, especially in stiffer CBs. While Pu remained mostly stable across different configurations, ductility (Δu and DI) became more balanced and distributed as columns increased. In both CB thickness cases, the three- and four-column frames demonstrated improved redundancy and sustained capacity after the initial column failure, which emphasizes their value in resisting progressive collapse in modular assemblies.

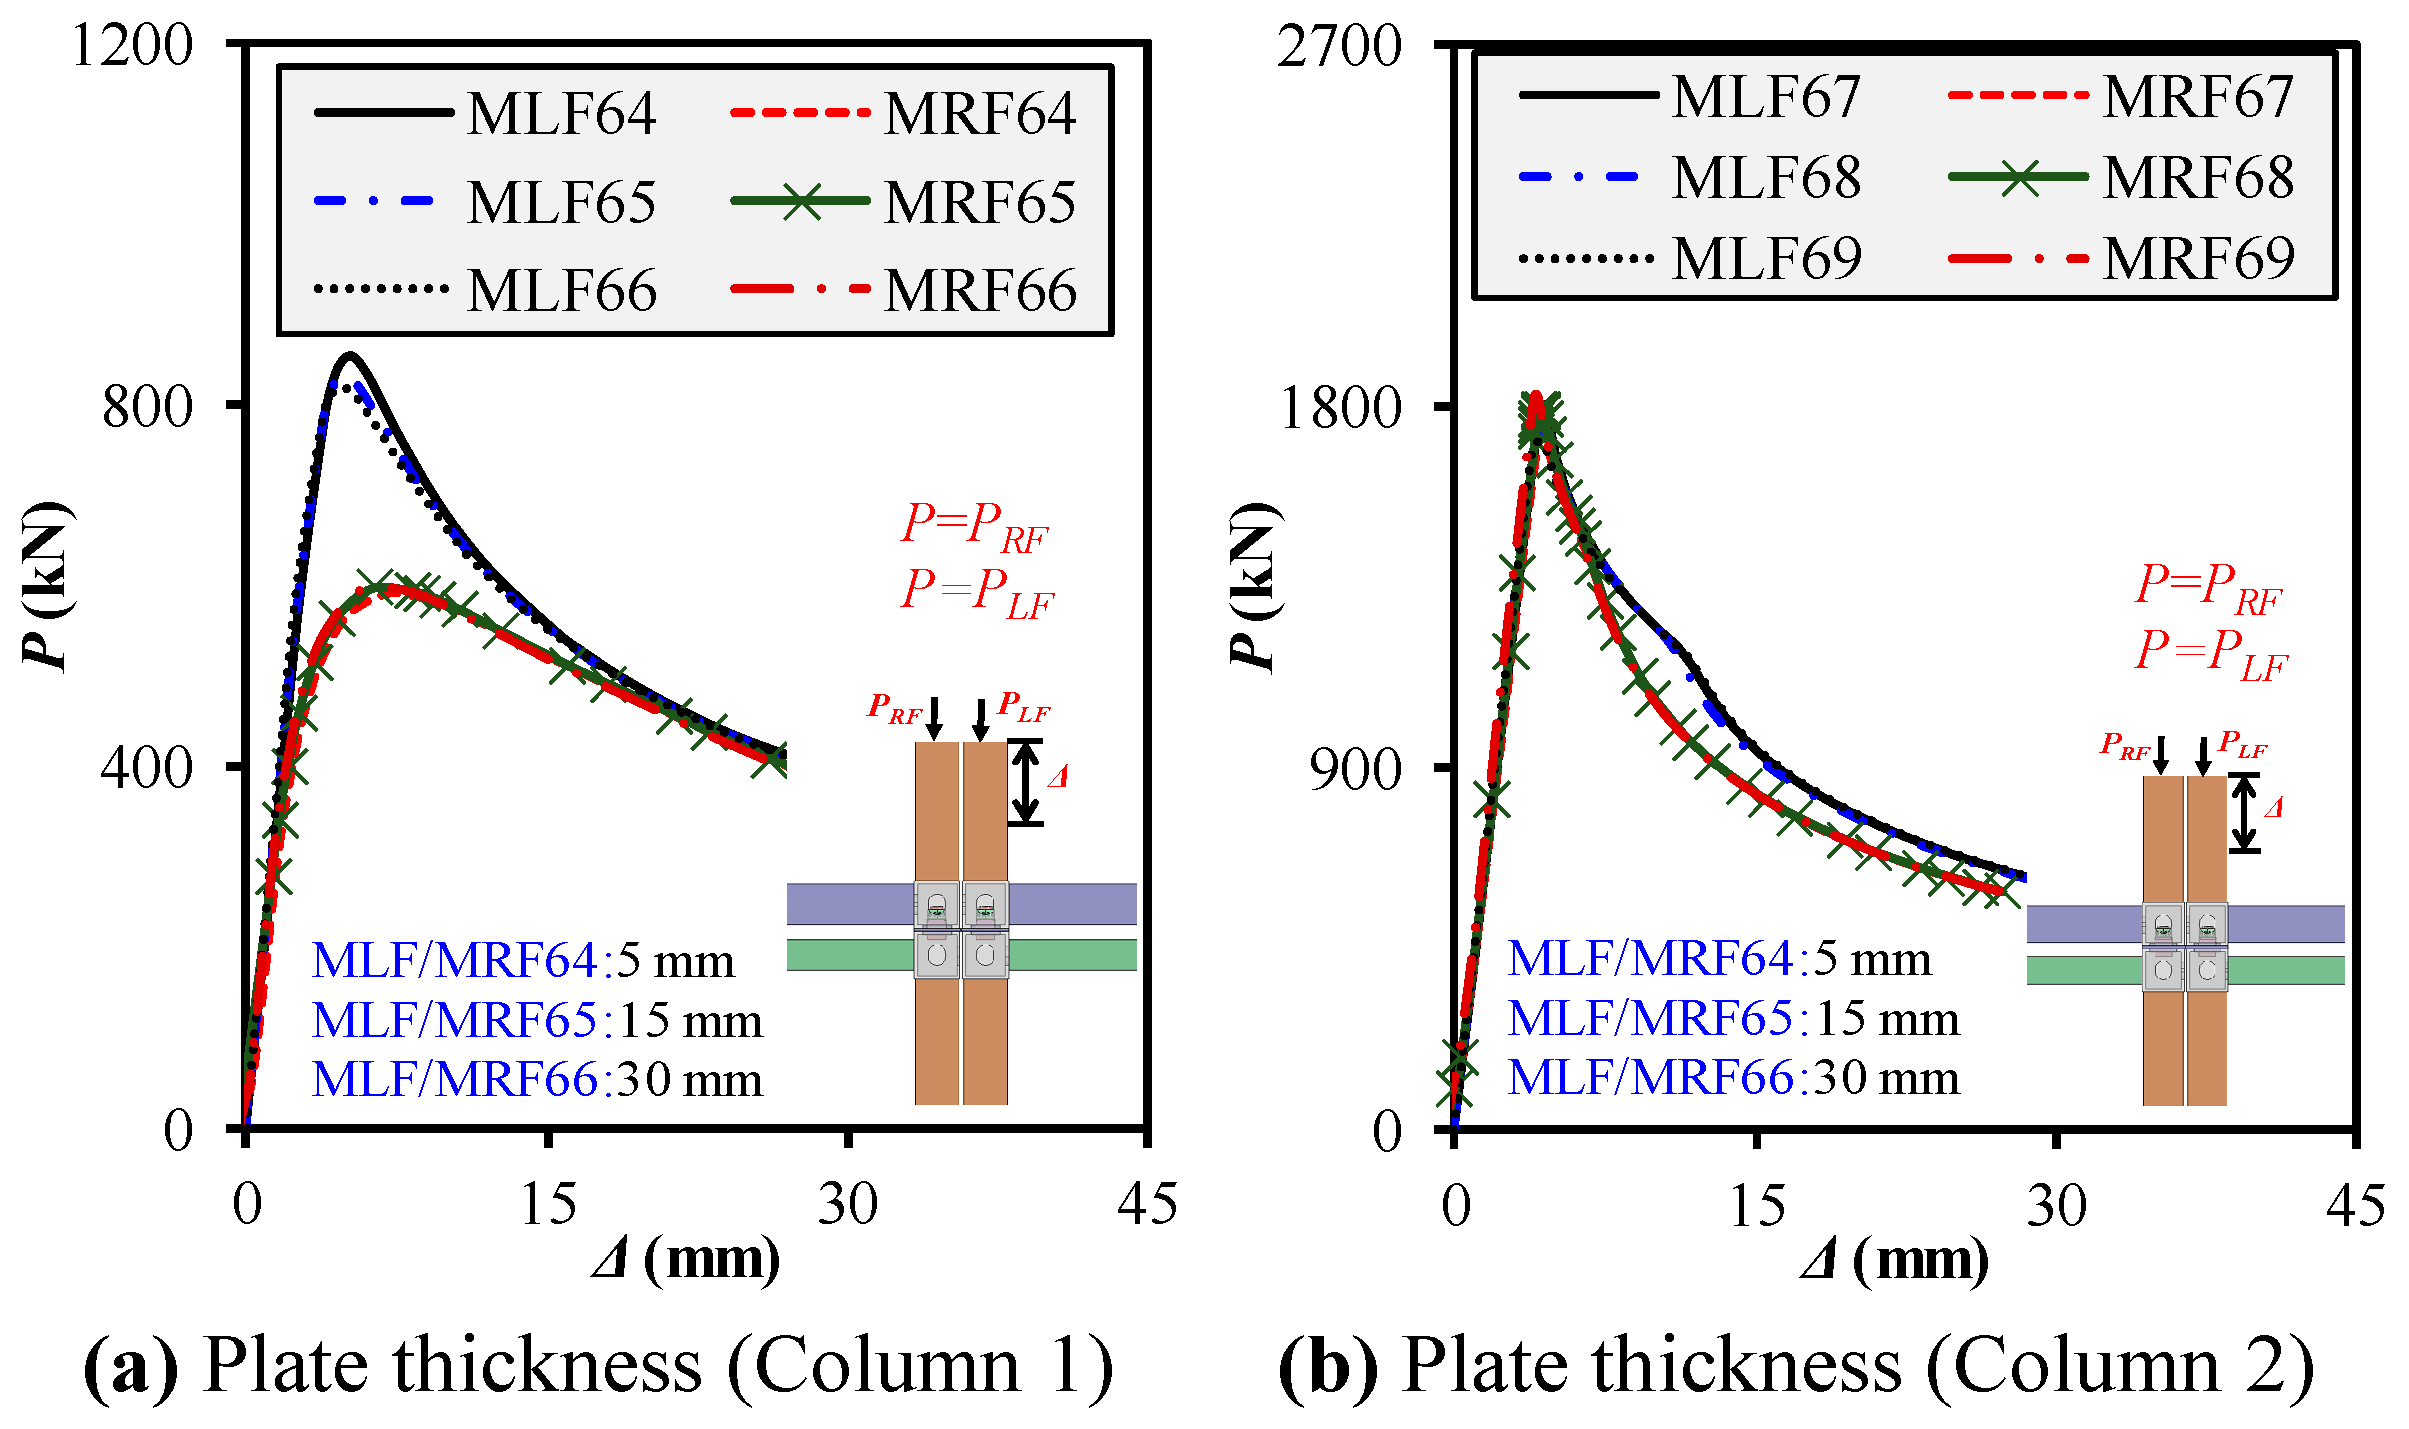
5.9. Impact of Connection Plate Thickness on Progressive Behaviors

The thickness of horizontal connection plates in M2M interfaces significantly influences stiffness distribution and load transfer mechanisms during progressive failure. This parametric investigation explored the impact of increasing the plate depth from 5 to 15 and 30 mm under a fixed column and beam length configuration (1266 mm columns and 1196 mm beams), as depicted in Figure 23a,b. Two column cross sections—150 × 150 × 8 and 200 × 200 × 8 mm—were analyzed, with all frames incorporating a constant floor beam of 150 × 200 × 8 mm and ceiling beam of 150 × 150 × 8 mm. For columns with a 150 × 150 × 8 mm cross section, enhancing the plate depth/thickness from 5 (MLF64/MRF64) to 15 mm (MLF65/MRF65) led to a slight fall/rise in Pu (by ~1–3%) and Ke (by ~4–6%), while Δu remained relatively stable. However, at 30 mm (MLF66/MRF66), left-frame ductility reduced by 18%, whereas right-frame ductility (Δu = 7.4 mm) sharply increased, which indicates higher post-failure energy absorption. The DI values in the right frame consistently exceeded 2.1, which highlights strong redistribution potential as the plate thickness increased. The results suggest that overly thick plates (>15 mm) may compromise pre-ultimate ductility on the loaded side while promoting ductile behavior in adjacent frame members. For larger columns (200 × 200 × 8 mm), the general trend reversed. Thinner connecting plates (5 mm) in MLF67/MRF67 led to slightly higher Δu and DI on the loaded side, while thicker plates (30 mm in MLF69/MRF69) enhanced stiffness (Ke = 445–470 kN/mm) and strength (Pu = 1710–1831 kN) but marginally reduced ductility on the right frame. Compared to 5 mm plates, increasing the thickness to 15 mm showed a slight decline in DI but better force transfer between adjacent modules. The variation in DI remained within 10%, which suggests stable plastic deformation performance across thickness levels. The analysis revealed that moderate connecting plate thickness (15 mm) offers an optimal balance between structural stiffness and ductility for smaller and larger column cross sections. While very thick plates (30 mm) contribute to strength and stiffness, they may reduce the deformation capacity of the loaded column. On the contrary, thinner plates allow larger deformation but introduce risks of instability under sequential loading. These results confirm that connecting plate thickness should be optimized based on the member geometry and intended failure redistribution strategy to ensure robustness in modular frame assemblies under progressive collapse conditions.

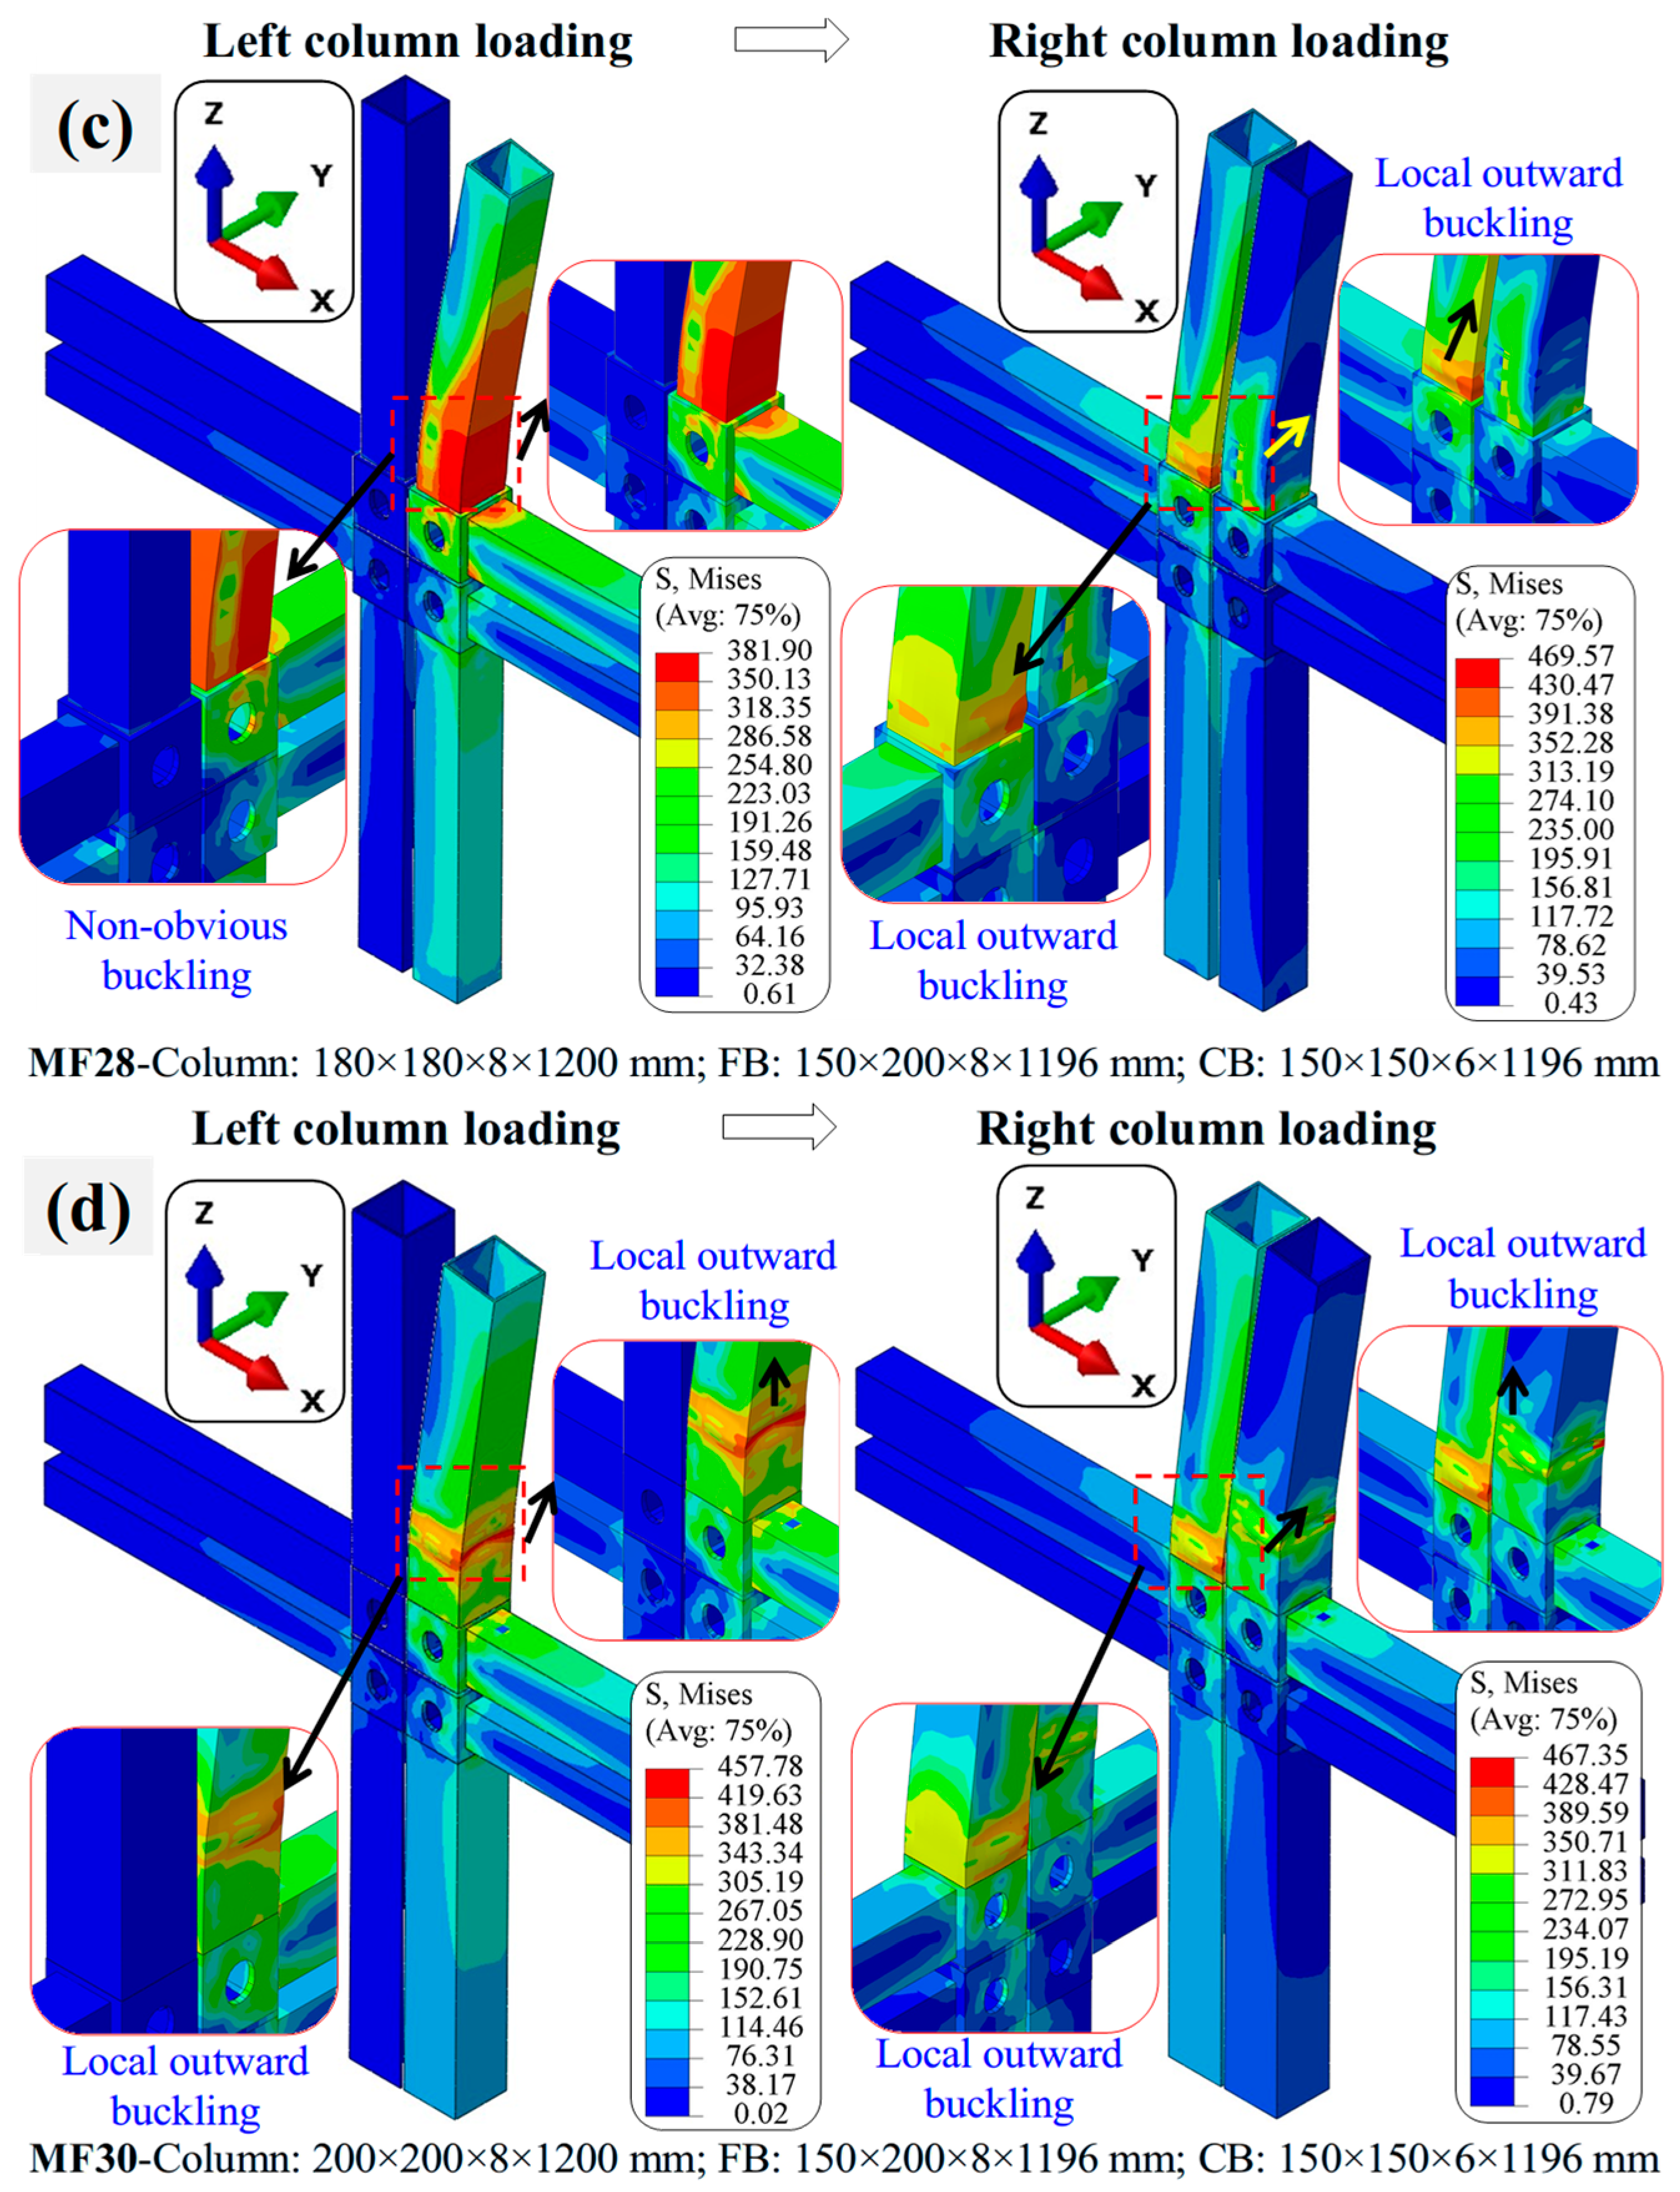
5.10. Typical Failure Modes Under Progressive Compression

The failure modes observed across the parametric analyses closely resemble the experimentally recorded behaviors of modular interior frames subjected to progressive column loading, as shown in Figure 24a–d. A dominant failure mechanism involved the lateral movement of the UCs and frame in the direction of column bending, which initiated asymmetric deformation during both the left- and right-column loading stages. As the load increased, this global instability was followed by localized buckling phenomena—predominantly near the M2M connections and upper portions of the columns. The simulations consistently captured two distinct forms of local buckling: (1) local inward buckling, where the column wall deformed toward the cross-sectional centerline, and (2) local outward buckling, which occurred more visibly along the columns’ external faces. Moreover, deformations and stress concentration regions were mainly located on the intersection zones of FBs, CBs, and UCs/LCs, particularly in areas where geometric imperfections and plate flexibility exacerbated stress concentration. Nonobvious buckling was also evident in cases involving weaker or thinner cross-sectional properties, which is often less discernible in experimental setups, which highlights the FEM’s ability to capture minor instability growth preceding ultimate collapse. The progressive sequence of failure—starting with global sway, then outward buckling on the unloaded side and inward buckling on the loaded side—demonstrates the critical interaction between loading sequence, frame connectivity, and geometric discontinuities. These patterns were consistently reproduced across variations in beam/column gaps, beam/column geometric configurations, column quantities, and connecting plate thicknesses, which confirms the robustness of the developed FEM in capturing the realistic failure mechanisms of modular frames under progressive axial shortening.

6. Applicability of Conventional Steel Design Code Predictions

In MSS frames subjected to progressive compressive loading, the critical failure mechanism is primarily governed by the behavior of the upper columns. These columns yield, followed by local inward or outward buckling, particularly near the M2M connection zones. By contrast, other components, such as horizontal beams and lower columns, primarily serve as boundary-restraint elements and do not participate in yielding or buckling. This behavior highlights that column strength is the dominant parameter for evaluating frame stability, thereby justifying the application of conventional steel design code equations to assess axial resistance. In this study, the axial load capacities of upper columns were evaluated considering column rotation at the ends using standard provisions from GB 50017GB 50017 [33], NZS 3404 [78], IS800 [79,80], AISC360 [31], EC3 [32], and CSA S16 [81]. The design equations, including cross-section classification rules, strength reduction factors, and effective length formulations, were directly adopted as defined in the original codes without any modification. A detailed implementation of these code formulations can be found in Ref [40].

Validations

The predictions from these codes were benchmarked against validated FEM outcomes using normalized ratios of Pu,FEM/Pu,code to assess their conservatism across a broad set of parametric variations. Figure 25a–i shows that all the investigated design codes consistently overestimated column strength, with mean ratios well below unity. The most unconservative results were found for EC3 (mean ratio = 0.64), followed by GB (0.66), IS (0.71), NZS (0.72), CSA (0.72), and AISC (0.72). This discrepancy arises primarily due to the idealized assumptions inherent in these codes—typically pinned boundary conditions on isolated members—that fail to capture the complex semi-rigid, sway-sensitive behavior introduced by M2M connections in modular assemblies. Additionally, these codes do not account for the progressive nature of the loading path, frame interaction effects, and post-yield redistribution observed in modular systems. The Cov ranging from 0.25 to 0.27 further underscores the high scatter in code predictions, indicating their sensitivity to modular-specific boundary and geometric conditions. To improve prediction reliability, it is recommended that code-based approaches be modified for MSS frames under progressive loading—either by increasing the column slenderness or applying a more conservative strength reduction factor. Alternatively, applying frame-based stability equations, such as those proposed in Ref. [63] for uniformly compressed modular frames, offers a more realistic approach by incorporating full-frame stiffness effects and the rotational behavior of M2M joints.

7. Conclusions

A comprehensive investigation was performed on the progressive compressive behavior of modular interior frames with M2M connections through experimental testing, detailed FEM validation, and a parametric study involving 92 configurations. A unique two-stage loading protocol was applied—first loading the left upper column to failure, followed by sequential loading of the right upper column—to capture the degradation behavior under realistic progressive loading. Additionally, this study assessed the applicability of conventional steel design codes and proposed insights into frame-based stability behavior. The key conclusions are as follows:
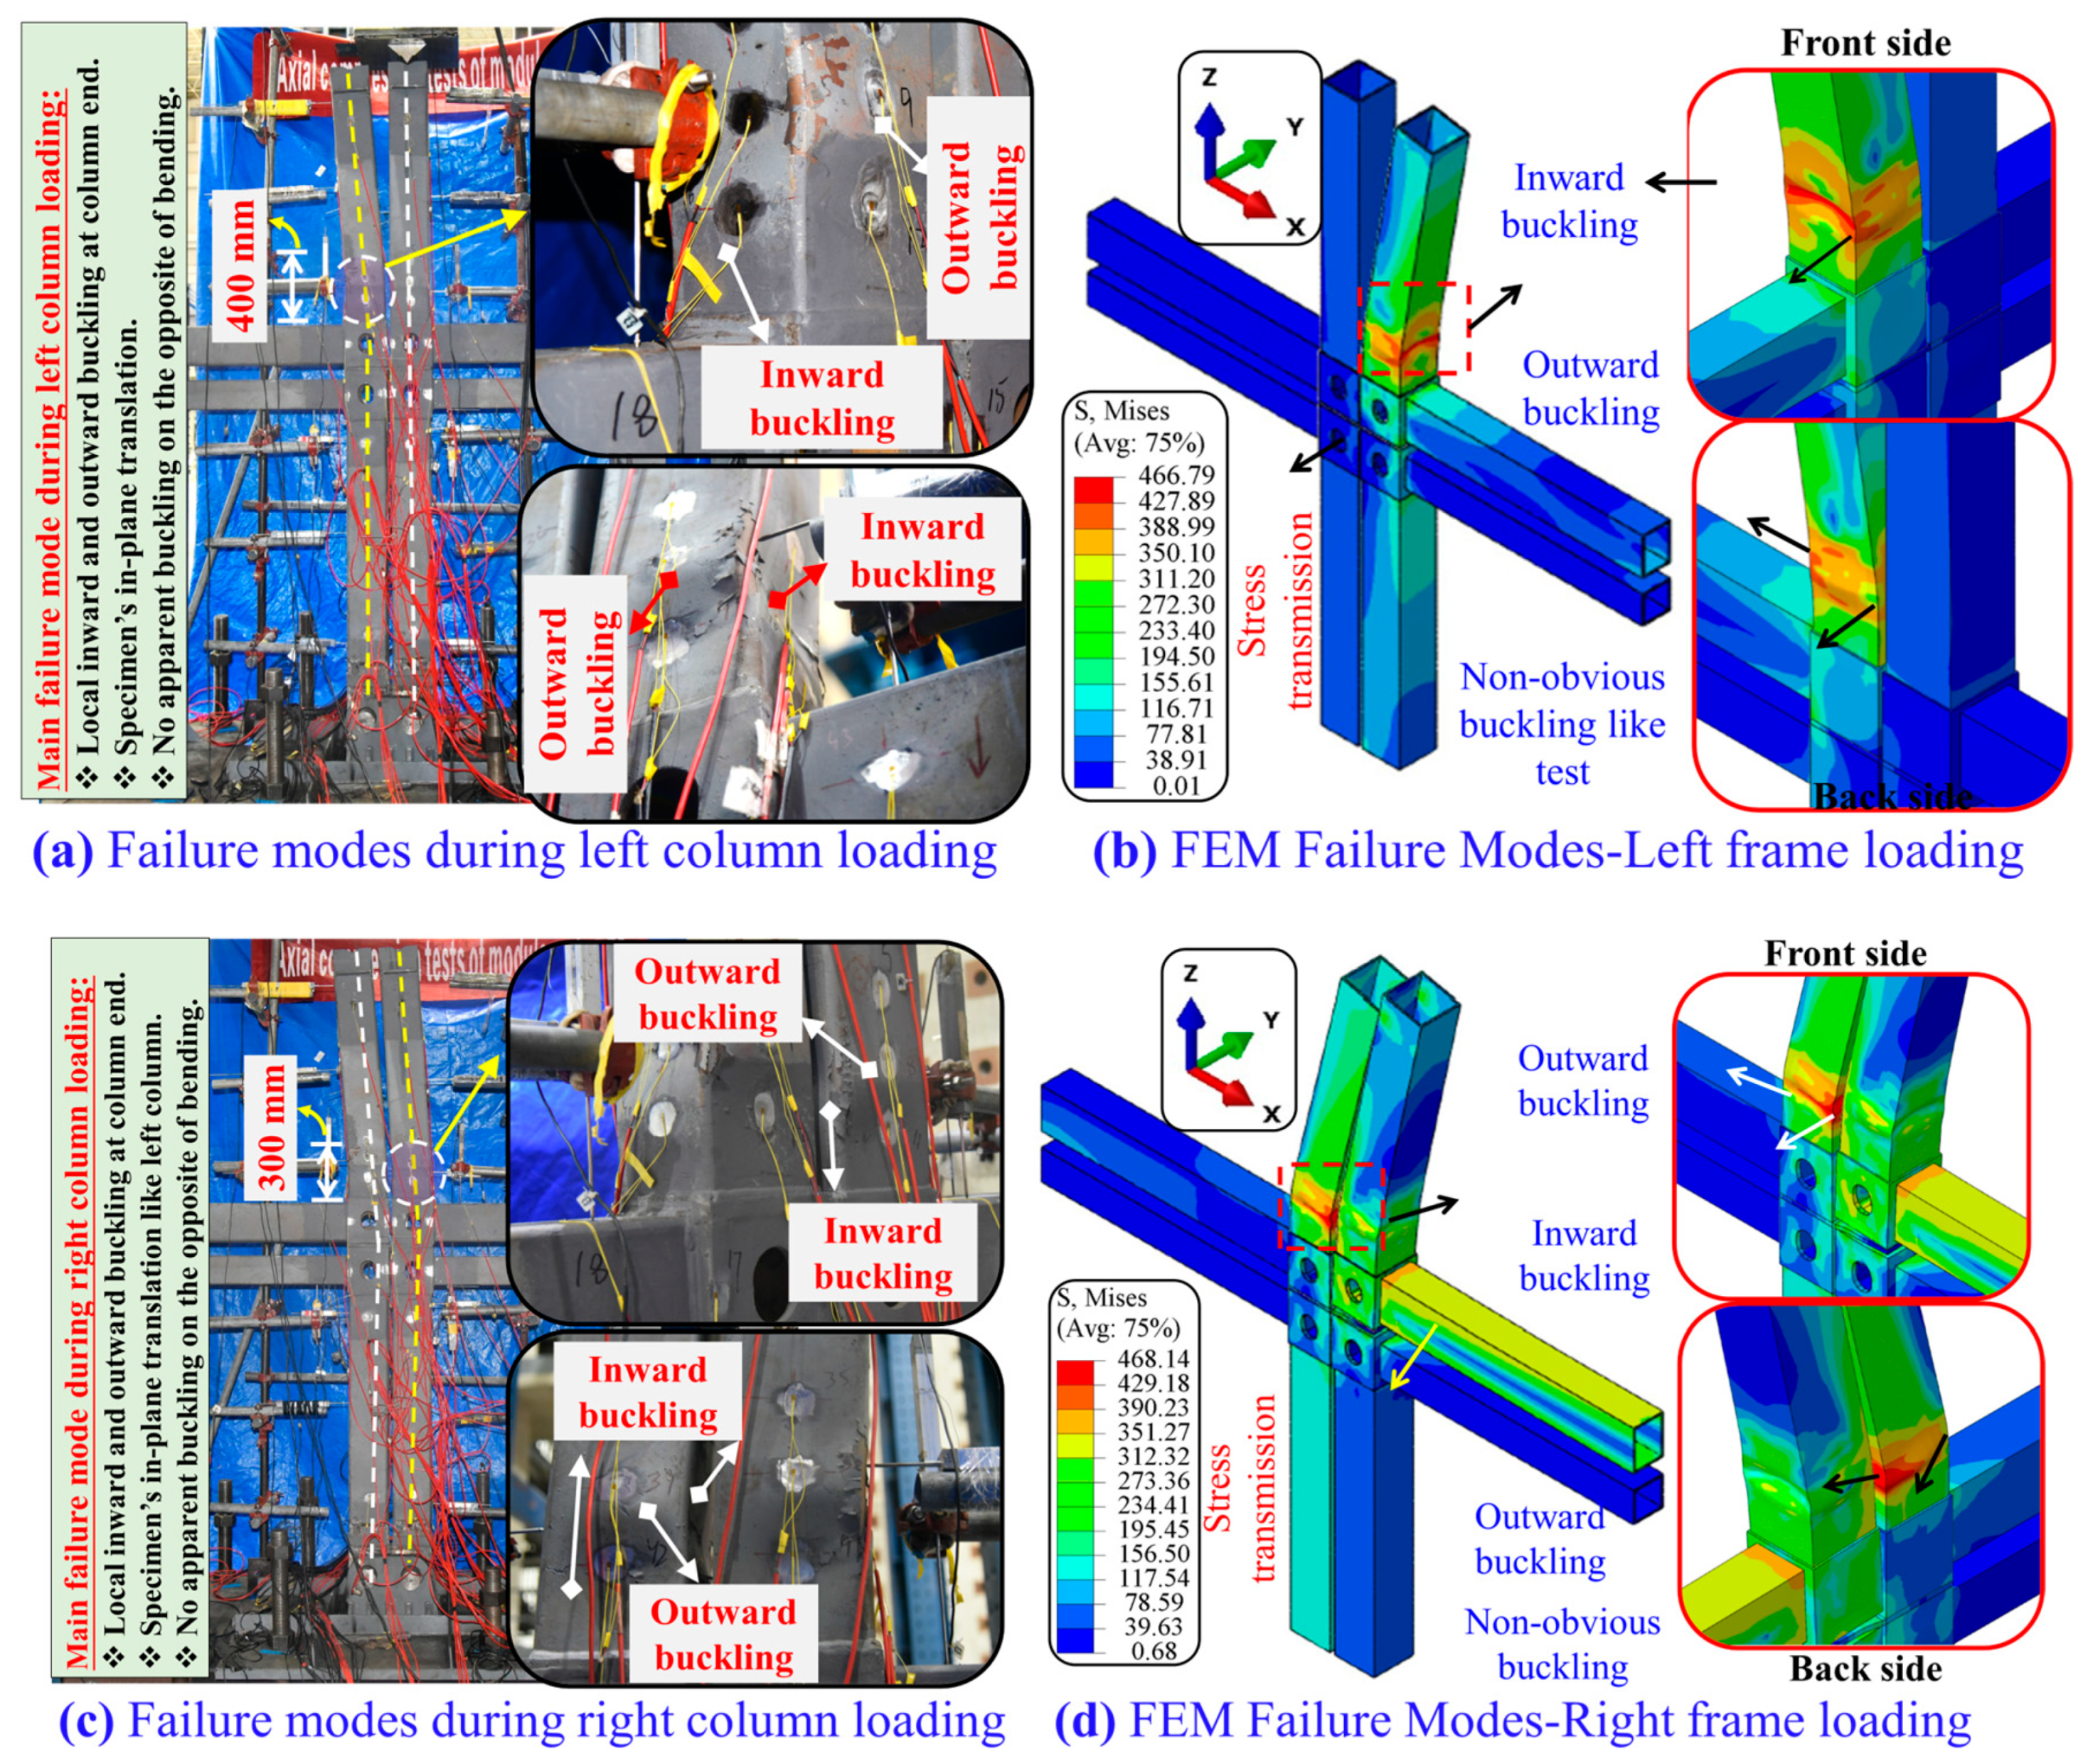
  • Progressive failure in modular frames was predominantly governed by the upper columns, which underwent elastic-to-inelastic transition followed by local inward or outward buckling (from ultimate-to-recession phase), often near the M2M joints. Beams, lower columns, and M2M connections remained elastic, acting primarily as boundary restraints. This confirms that upper columns are the primary load-bearing elements under progressive compression.
  • Consistent failure modes were characterized by the lateral sway of columns and local buckling patterns—typically forming in the same direction on opposite faces but at different heights. Buckling was primarily elastic and initiated within 400 mm of the column–M2M interface during initial (left-column) loading and shifted to elastic–plastic buckling behavior near 300 mm during right-column loading due to residual deformation. These phenomena were successfully captured in FEM simulations.
  • The validated FEMs (with 30 mm element size, 8 mm local, and 3/18 mm global imperfection) accurately replicated both local and global responses under progressive loading. FEM predictions showed excellent agreement (within 2–10%) for strength and stiffness under both left- and right-column loading, confirming their suitability for modeling progressive behavior in sway-sensitive modular frames.
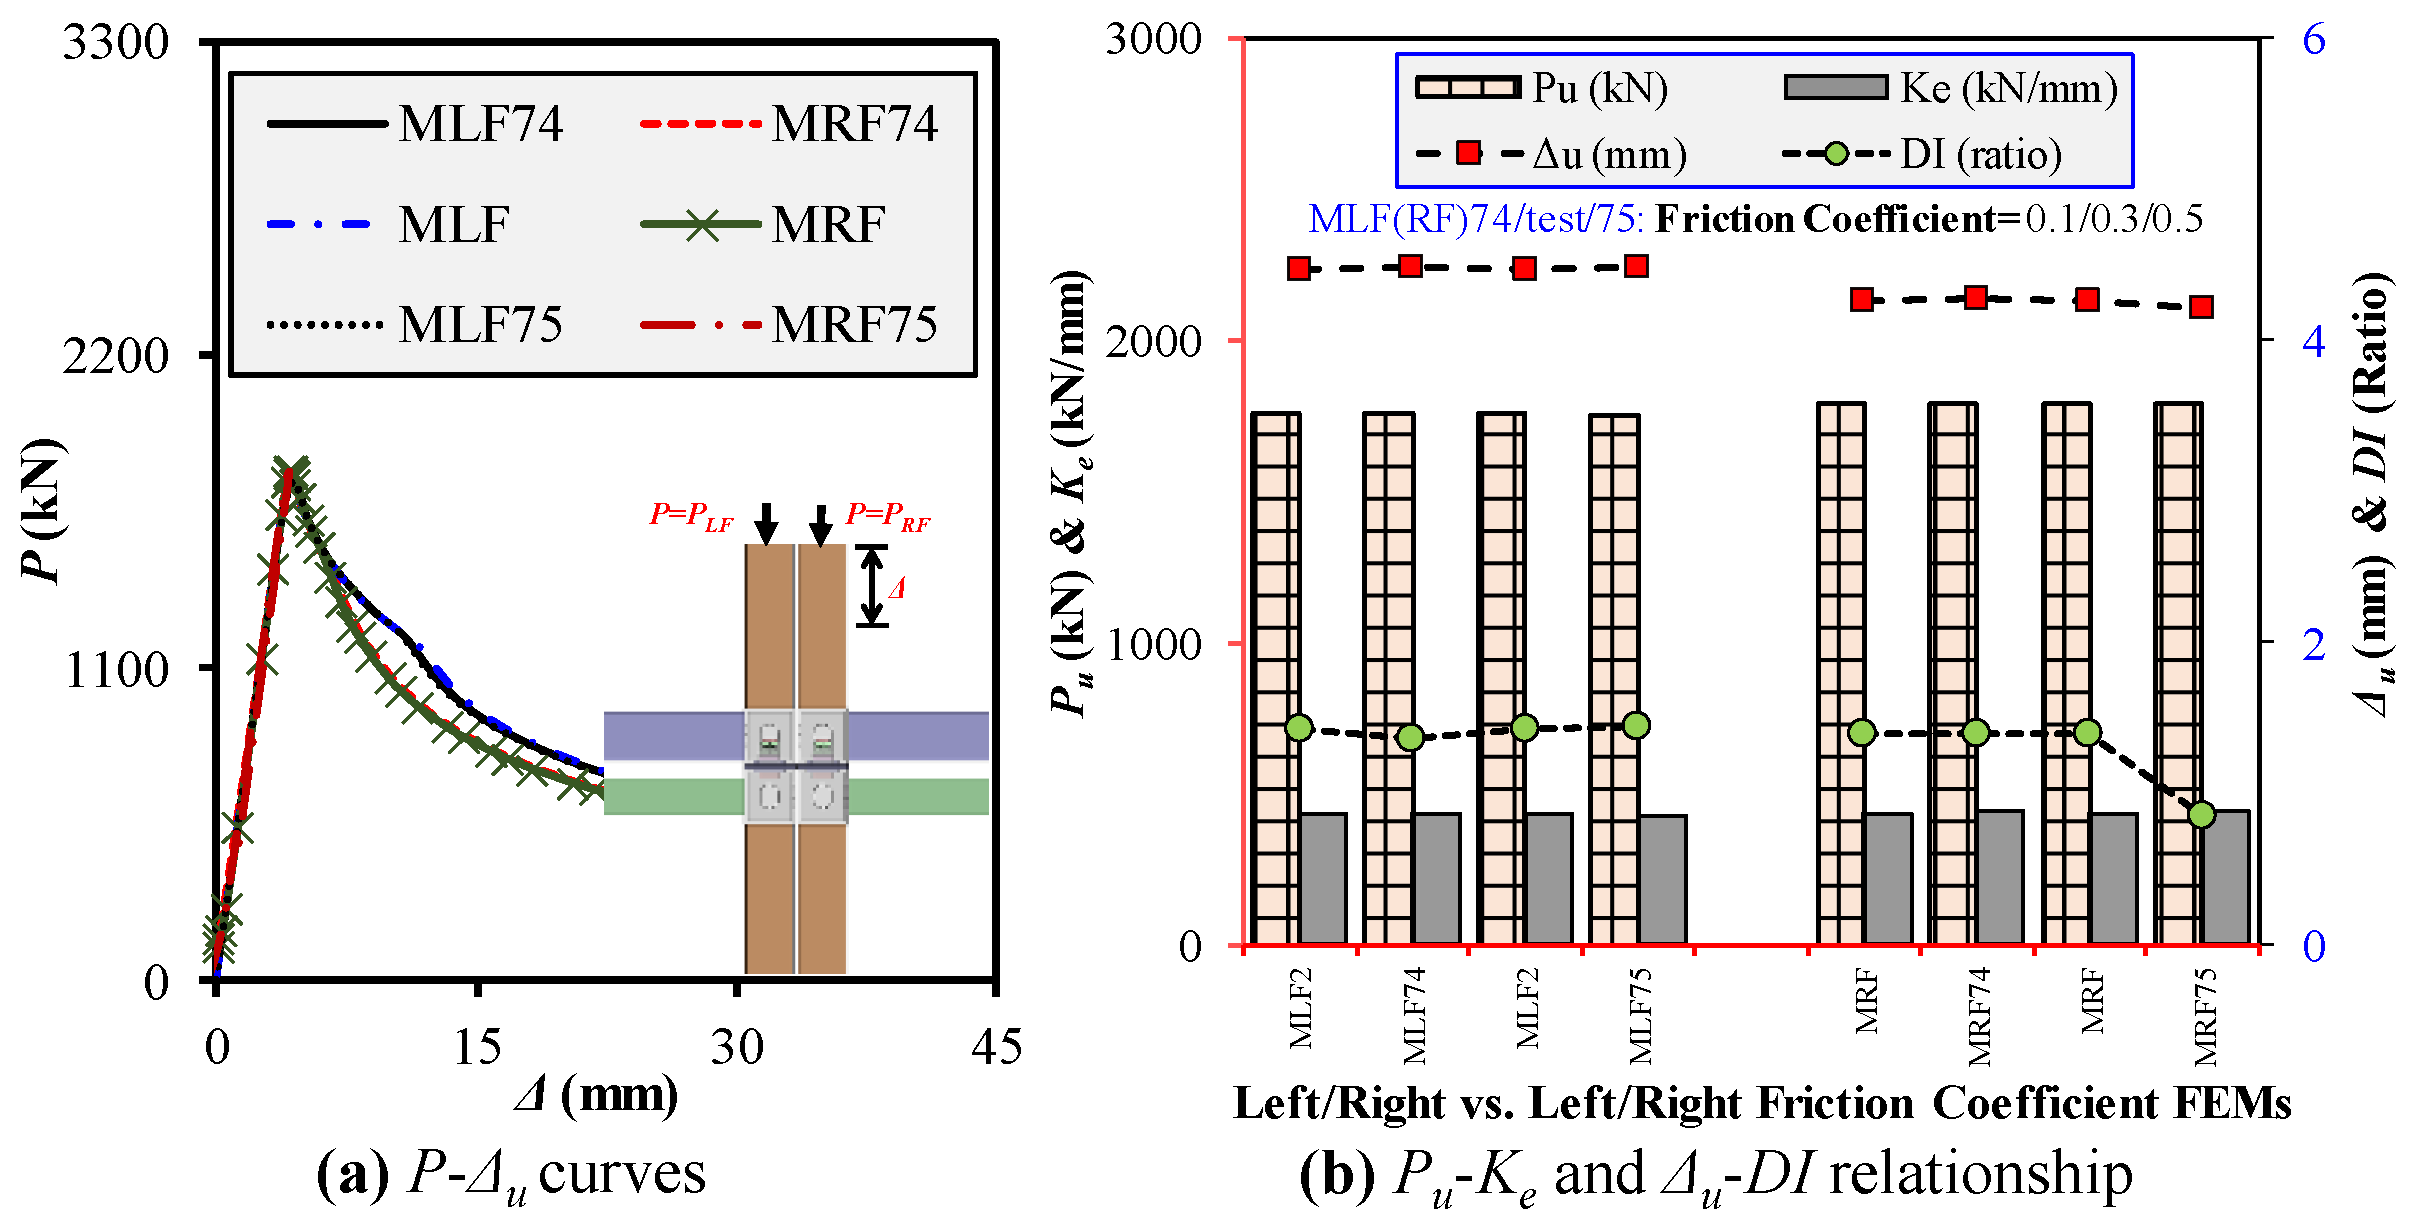
  • Increasing the column cross section from 150 to 210 mm improved strength and stiffness by up to 121% and 96%, respectively, especially during left-column loading. Increasing the thickness from 6 to 10 mm resulted in strength and stiffness gains of over 200% and 100%, respectively. By contrast, increasing the column height to 3000 mm reduced strength by up to 54% due to elastic buckling. Due to cumulative sway effects and residual deformation, right-column loading consistently exhibited lower strength and more variable ductility. Beam/column gaps and connecting plate thickness had a minor influence (≤6%) on strength but affected ductility patterns. Increasing the number of columns provided strength gains and improved ductility up to 1.6×, enhancing redundancy and energy dissipation in progressive collapse scenarios.
  • Average normalized ratios (Pu,FEM/Pu,code) were consistently below unity, which indicates that all six codes evaluated—EC3 (mean = 0.64), GB (0.66), IS (0.71), NZS (0.72), CSA (0.72), and AISC (0.72)—tended to overestimate column capacity. The Cov ranged from 0.25 to 0.27, which reflects significant scatter and underscores the inaccuracy of applying isolated-member-based predictions to sway-sensitive modular frames with semi-rigid M2M joints. The findings suggest that current code-based approaches require modification through stricter reduction factors, revised slenderness limits, or, ideally, the use of frame-level stability design methods that incorporate full-frame stiffness, rotational flexibility, and progressive failure characteristics.
This research underscores that while conventional design codes offer value for standard members, modular structural systems demand refined design methods that consider frame interactions and M2M joint behavior. Future research should focus on modifying existing code formulations or adopting frame-based stability approaches tailored to progressive loading, potentially through simplified models that integrate vertical and horizontal joint stiffness. These advances will support the safe and efficient design of multi-story, multi-bay modular buildings subject to progressive failure risks.

Author Contributions

Conceptualization, K.Y., K.K., Y.Y., L.J. and Z.C.; methodology, K.Y. and K.K.; software, K.Y., K.K., and Z.C.; validation, K.K., Y.Y., L.J. and Z.C.; formal analysis, K.Y. and K.K.; investigation, K.Y. and K.K.; resources, Y.Y., L.J., and Z.C.; data curation, K.K., L.J. and Z.C.; writing—original draft preparation, K.Y. and K.K.; writing—review and editing, Y.Y., L.J. and Z.C.; visualization, K.Y., K.K. and Z.C.; supervision, Y.Y., L.J. and Z.C.; project administration, K.K. and Z.C.; funding acquisition, K.Y., K.K. and Z.C. All authors have read and agreed to the published version of the manuscript.

Funding

This research was funded by the National Natural Science Foundation of China, grant number 51978457.

Data Availability Statement

Data will be available upon reasonable request.

Acknowledgments

The authors acknowledge the financial support offered by the NSFC for carrying out the research. Additionally, the corresponding author expresses his deepest gratitude to the Marie Curie Individual Fellowship for supporting his postdoctoral fellowship at the School of Science and Technology, Department of Engineering, City St George’s, University of London (UK).

Conflicts of Interest

Author Yukun Yang was employed by the company Jieyi Architectural Technology Co., Ltd. Author Lu Jiang was employed by the company Central Research Institute, Baosteel Group. The remaining authors declare that the research was conducted in the absence of any commercial or financial relationships that could be construed as a potential conflict of interest in connection with the work submitted.

Abbreviations

MSSs, modular steel structures; M2M, module-to-module inter-modular connection; FEM, finite-element model; UC/LC, upper/lower module column; FB/CB, floor/ceiling beam; Dc/FB/CB, UCs/LCs/FBs/CBs cross-sectional length; Bc/FB/CB, UCs/LCs/FBs/CBs cross-sectional width; tc/FB/CB, UCs/LCs/FBs/CBs cross-sectional thickness; Lc/FB/CB, UCs/LCs/FBs/CBs length; LB, local buckling; C3D8R, eight-node linear brick element with reduced integration and hourglass control; MLF(RF), middle left frame/right frame; Cov; coefficient of variation; Pu/Ke/Δu/DI, ultimate compressive strength/initial stiffness/axial shortening/ductility index.

References

  1. Kazeem, K.O.; Olawumi, T.O.; Adam, J.J.; Lam, E.W.M. Integration of Building Services in Modular Construction: A PRISMA Approach. Appl. Sci. 2024, 14, 4151. [Google Scholar] [CrossRef]
  2. Gunawardena, T.; Ngo, T.; Mendis, P.; Alfano, J. Innovative Flexible Structural System Using Prefabricated Modules. J. Archit. Eng. 2016, 22, 05016003. [Google Scholar] [CrossRef]
  3. Wee, F.Y.Z. A Comprehensive Study on the Prefabricated Modular House. Bachelor’s Thesis, Universiti Tunku Abdul Rahman, Kampar, Malaysia, 2022. Volume 9. [Google Scholar]
  4. Thai, H.-T.; Ngo, T.; Uy, B. A Review on Modular Construction for High-Rise Buildings. Structures 2020, 28, 1265–1290. [Google Scholar] [CrossRef]
  5. Khan, K.; Chen, Z.; Liu, J.; Javed, K. State-of-the-Art on Technological Developments and Adaptability of Prefabricated Industrial Steel Buildings. Appl. Sci. 2023, 13, 685. [Google Scholar] [CrossRef]
  6. Ma, R.; Xia, J.; Chang, H.; Xu, B.; Zhang, L. Experimental and Numerical Investigation of Mechanical Properties on Novel Modular Connections with Superimposed Beams. Eng. Struct. 2021, 232, 111858. [Google Scholar] [CrossRef]
  7. Yang, C.; Xu, B.; Xia, J.; Chang, H.; Chen, X.; Ma, R. Mechanical Behaviors of Inter-Module Connections and Assembled Joints in Modular Steel Buildings: A Comprehensive Review. Buildings 2023, 13, 1727. [Google Scholar] [CrossRef]
  8. Habib, A.; Al Houri, A.; Alibrahim, B.; Habib, M. Behavior and Sustainability Benefits of Modular Steel Buildings. Int. J. Sustain. Eng. 2025, 18, 2459715. [Google Scholar] [CrossRef]
  9. Srisangeerthanan, S.; Hashemi, M.J.; Rajeev, P.; Gad, E.; Fernando, S. Review of Performance Requirements for Inter-Module Connections in Multi-Story Modular Buildings. J. Build. Eng. 2020, 28, 101087. [Google Scholar] [CrossRef]
  10. Chen, Z.; Wang, J.; Liu, J.; Cong, Z. Tensile and Shear Performance of Rotary Inter-Module Connection for Modular Steel Buildings. J. Constr. Steel Res. 2020, 175, 106367. [Google Scholar] [CrossRef]
  11. Liang, X.; Hou, C.; Peng, J. Experimental Study on Rotary Inter-Module Connections with Corrosion-Resistant Metal Materials: Under Axial Tension. Thin-Walled Struct. 2024, 205, 112507. [Google Scholar] [CrossRef]
  12. Peng, J.; Hou, C. Experimental and Numerical Study on a Novel Self-Locking Inter-Module Connection with Spring-Loaded Plunger Latches: Under Axial Tension. Eng. Struct. 2025, 324, 119364. [Google Scholar] [CrossRef]
  13. Liu, J.; Jiang, J.; Liu, Y.; Chen, Z.; Khan, K. Tensile Behavior of a Novel Self-Locking Inter-Module Connection in Modular Steel Buildings. Structures 2024, 62, 106190. [Google Scholar] [CrossRef]
  14. Li, T.; Tian, H.; Xiao, B.; Huang, Z.; Wang, X. Comparative Study on the Shear Resistance of L-Shaped and Square Grouted Sleeve Connections in Modular Integrated Construction. J. Constr. Steel Res. 2025, 229, 109521. [Google Scholar] [CrossRef]
  15. Lacey, A.W.; Chen, W.; Hao, H.; Bi, K.; Tallowin, F.J. Shear Behaviour of Post-Tensioned Inter-Module Connection for Modular Steel Buildings. J. Constr. Steel Res. 2019, 162, 105707. [Google Scholar] [CrossRef]
  16. Deng, E.-F.; Du, Y.-P.; Lian, J.-Y.; Zhang, Z.; Qian, H.; Zhang, J.-F.; Liu, C.-Z. Shear Behavior of the Fully Prefabricated Liftable Connection for Modular Steel Construction. J. Build. Eng. 2024, 92, 109793. [Google Scholar] [CrossRef]
  17. Dai, Z.; Cheong, T.Y.C.; Pang, S.D.; Liew, J.Y.R. Experimental Study of Grouted Sleeve Connections under Bending for Steel Modular Buildings. Eng. Struct. 2021, 243, 112614. [Google Scholar] [CrossRef]
  18. Yang, N.; Xia, J.; Chang, H.; Zhang, L. The Flexural Mechanical Response of a Novel Plug-in Self-Locking Inter-Module Connection for Modular Steel Buildings. Eng. Struct. 2024, 308, 118008. [Google Scholar] [CrossRef]
  19. Zhai, S.-Y.; Lyu, Y.-F.; Cao, K.; Li, G.-Q.; Wang, W.-Y.; Chen, C. Experimental-Numerical Investigation and Design of Bolted-Cover Plate Connections under Bending for Modular Steel Buildings. J. Build. Eng. 2023, 75, 107057. [Google Scholar] [CrossRef]
  20. Zhang, A.; Liu, J.; Chen, Z.; Chen, T. Bending Behavior of Detachable Tapered-Head Bolt Inter-Module Connection of Steel Modular Structure. J. Constr. Steel Res. 2024, 220, 108829. [Google Scholar] [CrossRef]
  21. Deng, E.-F.; Du, Y.-P.; Gao, J.-D.; Zhang, Z.; Wang, Y.-B. Seismic Performance of an Innovative Self-Centering and Repairable Connection with SMA Bolts in Modular Steel Construction. Thin-Walled Struct. 2024, 205, 112377. [Google Scholar] [CrossRef]
  22. Deng, E.-F.; Wang, Y.-H.; Zong, L.; Zhang, Z.; Zhang, J.-F. Seismic Behavior of a Novel Liftable Connection for Modular Steel Buildings: Experimental and Numerical Studies. Thin-Walled Struct. 2024, 197, 111563. [Google Scholar] [CrossRef]
  23. Liu, J.; Cao, X.; Yan, S.; Chen, Z.; Liu, Y.; Lu, G. Research on Seismic Behavior of Tapered-Head Bolted Inter-Module Connection of Modular Steel Buildings. Eng. Struct. 2024, 304, 117586. [Google Scholar] [CrossRef]
  24. Jiang, J.; Chen, Z.; Liu, Y.; Liu, X.; Lu, G.; Lin, X. Experimental and Numerical Investigation on the Seismic Behavior of a Novel Bolted Inter-Module Connection. J. Constr. Steel Res. 2025, 224, 109101. [Google Scholar] [CrossRef]
  25. Deng, E.-F.; Lian, J.-Y.; Zhang, Z.; Qian, H.; Zhang, G.-C.; Zhang, P.; Sheikh, S.A. Axial Mechanical Behavior of an Innovative Liftable Connection for Modular Steel Construction. Thin-Walled Struct. 2023, 182, 110256. [Google Scholar] [CrossRef]
  26. Shi, F.-W.; Ding, Y.; Zong, L.; Meng, X.; Chen, Y. Axial Mechanical Behavior of Innovative Inter-Module Connection for Modular Steel Constructions. J. Build. Eng. 2023, 65, 105765. [Google Scholar] [CrossRef]
  27. Chan, T.M.; Gardner, L. Compressive Resistance of Hot-Rolled Elliptical Hollow Sections. Eng. Struct. 2008, 30, 522–532. [Google Scholar] [CrossRef]
  28. Meng, X.; Gardner, L. Testing of Hot-Finished High Strength Steel SHS and RHS under Combined Compression and Bending. Thin-Walled Struct. 2020, 148, 106262. [Google Scholar] [CrossRef]
  29. Ma, J.-L.; Chan, T.-M.; Young, B. Experimental Investigation on Stub-Column Behavior of Cold-Formed High-Strength Steel Tubular Sections. J. Struct. Eng. 2016, 142, 04015174. [Google Scholar] [CrossRef]
  30. Chen, J.; Chan, T.-M.; Varma, A.H. Stub Column Behavior of Cold-Formed High-Strength Steel Circular Hollow Sections under Compression. J. Struct. Eng. 2020, 146, 04020277. [Google Scholar] [CrossRef]
  31. ANSI/AISC 360-16; AISC360/16 Specification for Structural Steel Buildings-An American National Standard. American Institute of Steel Construction: Chicago, IL, USA, 2016.
  32. EN 1993-1-1; Eurocode 3: Design of Steel Structures-Part 1-1: General Rules and Rules for Buildings. European Committee for Standardization: Brussels, Belgium, 2005; Volume 1, ISBN 0580663876, 9780580663871.
  33. GB50017-2017; Standard for Design of Steel Structures. National Standard of China: Beijing, China, 2017. (In Chinese)
  34. Mark Lawson, R.; Richards, J. Modular Design for High-Rise Buildings. Proc. Inst. Civ. Eng. Struct. Build. 2010, 163, 151–164. [Google Scholar] [CrossRef]
  35. Hou, J.; Wang, X.; Liu, J.; Chen, Z.; Zhong, X. Study on the Stability Bearing Capacity of Multi-Column Wall in Modular Steel Building. Eng. Struct. 2020, 214, 110648. [Google Scholar] [CrossRef]
  36. Khan, K.; Chen, Z.; Liu, J.; Khan, A. Numerical and Parametric Analysis on Compressive Behaviours of Continuous-Supported Wall Systems in MSB. Structures 2021, 33, 4053–4079. [Google Scholar] [CrossRef]
  37. Khan, K.; Chen, Z.; Liu, J.; Khan, A.; Javed, K. Axial Compression Behaviours of Tubular Sectioned C-Shape Continuous-Supported Steel Walls in MSB. J. Constr. Steel Res. 2022, 188, 107009. [Google Scholar] [CrossRef]
  38. Khan, K.; Chen, Z.; Liu, J.; Khan, A. Experimental and Numerical Study on Planar Multi-Column Walls Behaviours with Boundary Supports. J. Constr. Steel Res. 2021, 186, 106880. [Google Scholar] [CrossRef]
  39. Chen, Y.; Hou, C.; Peng, J. Stability Study on Tenon-Connected SHS and CFST Columns in Modular Construction. Steel Compos. Struct. 2019, 30, 185–199. [Google Scholar] [CrossRef]
  40. Khan, K.; Chen, Z.; Youssef, M.A.; Abbas, D. Numerical and Theoretical Studies on Axial Compression Performance of Modular Steel Tubular Columns Grouped with Shear-Key Connectors. Buildings 2024, 14, 2018. [Google Scholar] [CrossRef]
  41. Deng, E.F.; Yan, J.B.; Ding, Y.; Zong, L.; Li, Z.X.; Dai, X.M. Analytical and Numerical Studies on Steel Columns with Novel Connections in Modular Construction. Int. J. Steel Struct. 2017, 17, 1613–1626. [Google Scholar] [CrossRef]
  42. Khan, K.; Chen, Z.; Liu, J.; Tsavdaridis, K.D.; Poologanathan, K. Axial Compression Behaviors of Steel Shear-Keyed Tubular Columns: Numerical and Analytical Studies. J. Constr. Steel Res. 2023, 205, 107894. [Google Scholar] [CrossRef]
  43. Khan, K.; Chen, Z.; Liu, J.; Javed, K.; Tsavdaridis, K.D.; Poologanathan, K. Compressive Behaviors of Modular Steel Shear-Keyed Grouped Tubular Columns. J. Build. Eng. 2023, 66, 105861. [Google Scholar] [CrossRef]
  44. Khan, K.; Chen, Z.; Liu, J.; Javed, K. Experimental and Analytical Investigations on Compressive Behaviors of Modular Steel Shear-Keyed Tubes. Eng. Struct. 2023, 279, 115604. [Google Scholar] [CrossRef]
  45. Zhang, G.; Xu, L.; Xie, X.; Bi, K. Seismic Evaluation of a Self-Centering Retrofit Solution for Modular Steel Structure Connections. J. Constr. Steel Res. 2024, 218, 108701. [Google Scholar] [CrossRef]
  46. Xu, B.; Xia, J.; Chang, H.; Ma, R.; Zhang, L. Evaluation of Superimposed Bending Behaviour of Laminated Channel Beams in Modular Steel Buildings Subjected to Lateral Load. Thin-Walled Struct. 2022, 175, 109234. [Google Scholar] [CrossRef]
  47. Chen, Z.; Liu, J.; Yu, Y.; Zhou, C.; Yan, R. Experimental Study of an Innovative Modular Steel Building Connection. J. Constr. Steel Res. 2017, 139, 69–82. [Google Scholar] [CrossRef]
  48. Shi, F.-W.; Li, Y.-M. Innovative Inner Sleeve Composite Bolted Connections for Modular Steel Constructions: Experimental and Numerical Studies. J. Build. Eng. 2023, 64, 105624. [Google Scholar] [CrossRef]
  49. Hwan Doh, J.; Ho, N.M.; Miller, D.; Peters, T.; Carlson, D.; Lai, P. Steel Bracket Connection on Modular Buildings. J. Steel Struct. Constr. 2017, 2, 1000121. [Google Scholar] [CrossRef]
  50. Lee, S.S.; Park, K.S.; Jung, J.S.; Lee, K.S. Evaluation of the Structural Performance of a Novel Methodology for Connecting Modular Units Using Straight and Cross-Shaped Connector Plates in Modular Buildings. Appl. Sci. 2020, 10, 8186. [Google Scholar] [CrossRef]
  51. Lyu, Y.-F.; Li, G.-Q.; Cao, K.; Zhai, S.-Y.; Li, H.; Chen, C.; Wang, Y.-Z. Behavior of Splice Connection during Transfer of Vertical Load in Full-Scale Corner-Supported Modular Building. Eng. Struct. 2021, 230, 111698. [Google Scholar] [CrossRef]
  52. Lacey, A.W.; Chen, W.; Hao, H.; Bi, K. Review of Bolted Inter-Module Connections in Modular Steel Buildings. J. Build. Eng. 2019, 23, 207–219. [Google Scholar] [CrossRef]
  53. Annan, C.D.; Youssef, M.A.; El Naggar, M.H. Experimental Evaluation of the Seismic Performance of Modular Steel-Braced Frames. Eng. Struct. 2009, 31, 1435–1446. [Google Scholar] [CrossRef]
  54. Fathieh, A.; Mercan, O. Seismic Evaluation of Modular Steel Buildings. Eng. Struct. 2016, 122, 83–92. [Google Scholar] [CrossRef]
  55. Nadeem, G.; Safiee, N.A.; Bakar, N.A.; Karim, I.A.; Mohd Nasir, N.A. Experimental and Numerical Study of Self-Locking Adaptable Inter Connection for Modular Steel Structures. J. Build. Eng. 2023, 65, 105723. [Google Scholar] [CrossRef]
  56. Liu, X.; Meng, Q.; Xu, L.; Liu, Y.; Tian, X. Modular Steel Buildings Based on Self-Locking-Unlockable Connections Seismic Performance Analysis. Buildings 2025, 15, 678. [Google Scholar] [CrossRef]
  57. Lacey, A.W.; Chen, W.; Hao, H.; Bi, K. New Interlocking Inter-Module Connection for Modular Steel Buildings: Experimental and Numerical Studies. Eng. Struct. 2019, 198, 109465. [Google Scholar] [CrossRef]
  58. Lee, K.; Cho, B.H.; Rasmussen, K.J.R.; Jung, D. Experimental and Numerical Investigation of Bolt-Free Preloaded Connection for Steel-Framed Modular Buildings. J. Constr. Steel Res. 2024, 220, 108827. [Google Scholar] [CrossRef]
  59. Sanches, R.; Mercan, O.; Roberts, B. Experimental Investigations of Vertical Post-Tensioned Connection for Modular Steel Structures. Eng. Struct. 2018, 175, 776–789. [Google Scholar] [CrossRef]
  60. Liew, J.Y.R.; Chua, Y.S.; Dai, Z. Steel Concrete Composite Systems for Modular Construction of High-Rise Buildings. Structures 2019, 21, 135–149. [Google Scholar] [CrossRef]
  61. Kujawa, M.; Smakosz, Ł.; Iwicki, P.; Perliński, A.; Tejchman, J. Mechanical Performance Investigations of a Post-Tensioned Inter-Module Connection in Steel Buildings. Structures 2025, 71, 108187. [Google Scholar] [CrossRef]
  62. Chen, Z.; Liu, Y.; Zhong, X.; Liu, J. Rotational Stiffness of Inter-Module Connection in Mid-Rise Modular Steel Buildings. Eng. Struct. 2019, 196, 109273. [Google Scholar] [CrossRef]
  63. Khan, K.; Chen, Z.; Liu, J.; Tsavdaridis, K.D. Compressive Behaviors of Corner-Supported Modular Steel Sway Frames with Rotary Inter-Modular Connections. Thin-Walled Struct. 2023, 193, 111245. [Google Scholar] [CrossRef]
  64. Farajian, M.; Sharafi, P.; Eslamnia, H.; Kildashti, K.; Bai, Y. Classification of Inter-Modular Connections for Stiffness and Strength in Sway Corner-Supported Steel Modular Frames. J. Constr. Steel Res. 2022, 197, 107458. [Google Scholar] [CrossRef]
  65. He, X.-H.-C.; Chan, T.-M. Classification System for Inter- and Intra-Module Joints in Non-Sway Steel MiC Structures. J. Constr. Steel Res. 2023, 206, 107913. [Google Scholar] [CrossRef]
  66. Farajian, M.; Sharafi, P.; Eslamnia, H.; Bai, Y.; Samali, B. Classification System for Inter-Modular Connections in Non-Sway Corner-Supported Steel Modular Buildings. Structures 2023, 49, 807–825. [Google Scholar] [CrossRef]
  67. Zhai, X.; Zha, X.; Chen, D. Elastic Stability of Unbraced Plate-Type Modular Steel Frames with Semi-Rigid Corner Connections. J. Constr. Steel Res. 2022, 192, 107243. [Google Scholar] [CrossRef]
  68. Wang, Q.; Su, M. Stability Study on Sway Modular Steel Structures with Semi-Rigid Connections. Thin-Walled Struct. 2021, 161, 107529. [Google Scholar] [CrossRef]
  69. Alembagheri, M.; Sharafi, P.; Hajirezaei, R.; Tao, Z. Anti-Collapse Resistance Mechanisms in Corner-Supported Modular Steel Buildings. J. Constr. Steel Res. 2020, 170, 106083. [Google Scholar] [CrossRef]
  70. Luo, F.J.; Bai, Y.; Hou, J.; Huang, Y. Progressive Collapse Analysis and Structural Robustness of Steel-Framed Modular Buildings. Eng. Fail. Anal. 2019, 104, 643–656. [Google Scholar] [CrossRef]
  71. He, X.-H.-C.; Meng, G.; An, Y. Progressive Collapse Resistance of Steel Modular Integrated Construction Structures: Comparison with Steel Frame Structures and an Enhancement Method. J. Build. Eng. 2025, 104, 112382. [Google Scholar] [CrossRef]
  72. Chua, Y.S.; Pang, S.D.; Liew, J.Y.R.; Dai, Z. Robustness of Inter-Module Connections and Steel Modular Buildings under Column Loss Scenarios. J. Build. Eng. 2022, 47, 103888. [Google Scholar] [CrossRef]
  73. Peng, J.; Hou, C.; Shen, L. Progressive Collapse Analysis of Corner-Supported Composite Modular Buildings. J. Build. Eng. 2022, 48, 103977. [Google Scholar] [CrossRef]
  74. Yu, Z.-W.; Ma, W.-L.; Zhang, J.-Z.; Tian, Z. Comparative Study on Collapse Behavior of Modular Steel Buildings: Experiment and Analysis. Thin-Walled Struct. 2025, 206, 112695. [Google Scholar] [CrossRef]
  75. Shan, S.; Pan, W. Progressive Collapse Mechanisms of Multi-Story Steel-Framed Modular Structures under Module Removal Scenarios. Structures 2022, 46, 1119–1133. [Google Scholar] [CrossRef]
  76. Jiaxi, M. Performance Evaluation Method Research of Modular Prefabricated Steel Structure to Resist Progressive Collapse. Build. Sci. 2015, 31, 87–97. (In Chinese) [Google Scholar]
  77. Zhang, J.-Z.; Lin, X.; Zhang, W.-J.; Yu, Z.-W. Collapse Behavior and Resistance Mechanisms of Steel Modular Buildings with Corrugated Walls: Experimental, Numerical, and Analytical Insights. Thin-Walled Struct. 2025, 212, 113157. [Google Scholar] [CrossRef]
  78. NZS3404; Part 1:1997-Steel Structures Standard. ISO: Geneva, Switzerland, 1997.
  79. IS 801-1975; Indian Standard Code of Practice for Use of Cold-Formed Light Gauge Steel Structural Members in General Building Construction. Bureau of Indian Standards: New Delhi, India, 1975.
  80. IS 801-1975; Indian Standard Code of Practice for General Construction in Steel. Bureau of Indian Standards: New Delhi, India, 2007.
  81. CSA-S16-09; CSA Standard-Design of Steel Structures. Canadian Standards Association: Toronto, ON, Canada, 2009; p. 7.
  82. Han, X.-Z.; Wang, C.; He, X.-H.-C.; Hu, Y.-F.; Chan, T.-M.; Chung, K.-F. Experimental Investigation on Bolted Inter-Module Connections and Subassemblies of Steel Modular Frames. J. Constr. Steel Res. 2023, 211, 108118. [Google Scholar] [CrossRef]
  83. GB/T 228.1-2010; Metallic Materials-Tensile Testing-Part 1: Method of Test at Room Temperature. National Standard of China: Beijing, China, 2010. (In Chinese)
  84. GBT50344-2019; Technical Standards for Building Structure Inspection. National Standard of China: Beijing, China, 2019. (In Chinese)
  85. ABAQUS, User Manual Version 6.23; DS SIMULIA Corp.: Providence, RI, USA, 2023.
Figure 1. Assembly of modular frames with rotary M2M connections [i, Nut; ii, Rotary part; iii, Connecting plate; and iv, Bolt]. Note: (a) Parts i, ii, iii, and iv of the M2M connection are inserted into the corner fittings of the upper, lower, right, and left modules, respectively; (b) Part iv is rotated by 90°; (c) Part ii is rotated by 90°; (d) Part i is finally tightened to complete the assembly.
Crystals 15 00413 g001
Figure 2. Details of (a) Geometry and LVDTs and (b) Strain Gauges of the Tested Specimen.
Crystals 15 00413 g002
Figure 3. Progressive compression tests are set up on modular steel interior frames.
Crystals 15 00413 g003
Figure 4. Failure modes under progressive compression loading. The white/yellow dashed line in (a) shows the unbent straight unloaded right column centerline and the bent buckled loaded left column centerline, while the white/yellow dashed line in (b) shows the bent buckled left column centerline and the bent buckled right column centerline.
Crystals 15 00413 g004
Figure 5. Mechanical performance trend of the frame under progressive compression.
Crystals 15 00413 g005
Figure 6. Load vs. strain curves of frames under left column compression loading: (a) Strain curves at the upper right column, front direction; (b) Strain curves at the right beams and M2M connections, front direction; (c) Strain curves at the lower right columns, front direction; (d) Strain curves at the upper left columns and M2M connections, front direction; (e) Strain curves at the lower left columns and M2M connections, front direction; (f) Strain curves at the upper left column, side direction; (g) Strain curves at the back side of left M2M connections; (h) Strain curves at the back side of the upper right column and M2M connections; (i) Strain curves at the back side of the right beams, lower right columns, and M2M connections; (j) Strain curves at the back side of the left columns; (k) Strain curves at the back and side of the lower left column.
Crystals 15 00413 g006
Figure 7. Load vs. strain curves of frames under right-column compression loading: (a) Strain curves at the upper right column, front direction; (b) Strain curves at the right beams and M2M connections, front direction; (c) Strain curves at the lower right columns, front direction; (d) Strain curves at the upper left columns and M2M connections, front direction; (e) Strain curves at the lower left columns and M2M connections, front direction; (f) Strain curves at the upper left column, side direction; (g) Strain curves at the back side of left M2M connections; (h) Strain curves at the back side of the upper right column and M2M connections; (i) Strain curves at the back side of the right beams, lower right columns, and M2M connections; (j) Strain curves at the back side of the left columns; (k) Strain curves at the back and side of the lower left column.
Crystals 15 00413 g007
Figure 8. Load vs. deflection curves of the frame under left-/right-column compression: (a) Deflection curves at the lower right column and right ceiling beam under left column loading; (b) Deflection curves at the right floor beam and upper right column under left column loading; (c) Deflection curves at the upper left column and left floor beam under left column loading; (d) Deflection curves at the lower right column and right ceiling beams under left column loading; (e) Deflection curves at the lower right column and right ceiling beam under right column loading; (f) Deflection curves at the right floor beam and upper right column under right column loading; (g) Deflection curves at the upper left column and left floor beam under right column loading; (h) Deflection curves at the lower right column and right ceiling beams under right column loading.
Crystals 15 00413 g008
Figure 9. Experimentally validated FEM of the modular frame for progressive behavior. Note: White crosses at the cross-section centers represent the reference points named RP-1, RP-2, RP-3, RP-4, RP-5, RP-6, RP-7, and RP-8, corresponding to the upper left column, upper right column, lower left column, lower right column, right floor beam, right ceiling beam, left floor beam, and left ceiling beam, respectively.
Crystals 15 00413 g009
Figure 10. Mesh sensitivity analysis outcomes for progressive compression loading: (a) Load–shortening curves; (b) Ultimate strength and initial stiffness relationships; (c) Ultimate displacement and ductility index relationships.
Crystals 15 00413 g010
Figure 11. Friction sensitivity analysis outcomes for progressive compression loading: (a) Load–shortening curves; (b) Ultimate strength and initial stiffness relationships, and ultimate displacement and ductility index relationships.
Crystals 15 00413 g011
Figure 12. Imperfection outcomes for frames under progressive compression loading: (a) H-type local imperfection effect on ultimate strength/initial stiffness vs. ultimate displacement/ductility index; (b) t-type local imperfection effect on ultimate strength/initial stiffness vs. ultimate displacement/ductility index; (c) e-type global imperfection effect on ultimate strength vs. initial stiffness; (d) e-type global imperfection effect on ultimate displacement vs. ductility index.
Crystals 15 00413 g012
Figure 13. Comparison of test and FEM failure modes under left-/right-column loadings.
Crystals 15 00413 g013
Figure 14. Comparison of test and FEM mechanical behavior under left-/right-column loadings: (a) Load–shortening curves comparison for test and FEM under left column loading; (b) Load–shortening curves comparison for test and FEM under right column loading; (c) Mean and coefficient of variation of test-to-FEM ratios under left and right column loading for ultimate strength, initial stiffness, ultimate displacement, and ductility index.
Crystals 15 00413 g014
Figure 15. Impact of beam cross sections on frame mechanical behavior under left-/right-column loadings.
Crystals 15 00413 g015
Figure 16. Impact of beam lengths on frame mechanical behavior under left-/right-column loadings.
Crystals 15 00413 g016
Figure 17. Impact of column lengths on frame mechanical behavior under left-/right-column loadings.
Crystals 15 00413 g017
Figure 18. Impact of column cross sections on frame mechanical behavior under left-/right-column loadings.
Crystals 15 00413 g018
Figure 19. Impact of column slenderness on frame mechanical behavior under left-/right-column loadings.
Crystals 15 00413 g019
Figure 20. Impact of beam gap on frame mechanical behavior under left-/right-column loadings.
Crystals 15 00413 g020
Figure 21. Impact of column gap on frame mechanical behavior under left-/right-column loadings.
Crystals 15 00413 g021
Figure 22. Impact of number of columns on frame mechanical behavior under left-/right-column loadings. Note: "#" represents the number of adjacent columns in modular frames.
Crystals 15 00413 g022
Figure 23. Impact of connecting plate thickness on frame mechanical behavior under left-/right-column loadings.
Crystals 15 00413 g023
Figure 24. Typical failure modes of modular frames under progressive loading: (a) FEM MF4 under left and right column loading scenario; (b) FEM MF8 under left and right column loading scenario; (c) FEM MF28 under left and right column loading scenario; (d) FEM MF30 under left and right column loading scenario.
Crystals 15 00413 g024aCrystals 15 00413 g024b
Figure 25. Pu, FEM-to-Pu, code for modular frames under left-/right-column progressive loading.
Crystals 15 00413 g025aCrystals 15 00413 g025b
Table 1. Measurements and material properties of modular frame tested specimen.
Items(D/B/t)c
(mm)
(D/B/t)FB
(mm)
(D/B/t)CB
(mm)
Lc/Lb
(m)
(Pu)Test/FEM (kN)(Ke)Test/FEM (kN/mm)(Δu)Test/FEM (mm)(DI)Test/FEM (Ratio)
MLF200/200/8150/200/8150/150/81.26/1.191903/1838400/4097.4/4.71.5/1.3
MRF1756/1778399/4386.7/4.31.5/1.4
1.040.981.561.10
0.990.911.561.05
Mean 1.010.941.560.03
Cov 0.020.040.000.02
(D/B/t)c/FB/CB and Lc/Lb stand for cross section width/length/thickness and lengths of UCs/LCs/FBs/CBs; (Pu/Ke/Δu/DI)Test/FEM represent test-to-FEM ultimate compressive resistance/initial stiffness/axial shortening/ductility index.
Disclaimer/Publisher’s Note: The statements, opinions and data contained in all publications are solely those of the individual author(s) and contributor(s) and not of MDPI and/or the editor(s). MDPI and/or the editor(s) disclaim responsibility for any injury to people or property resulting from any ideas, methods, instructions or products referred to in the content.

