Article

A Novel Zinc-Based MOF Featuring 2,4,6-Tris-(4-carboxyphenoxy)-1,3,5-triazine: Structure, Adsorption, and Photocatalytic Activity

1
Institute of Mineralogy and Crystallography “Acad. Ivan Kostov”, Bulgarian Academy of Sciences, Acad. G. Bonchev Street, bl. 107, 1113 Sofia, Bulgaria
2
Institute of Organic Chemistry with Centre of Phytochemistry, Bulgarian Academy of Sciences, Acad. G. Bonchev Street, bl. 9, 1113 Sofia, Bulgaria
3
National Centre of Excellence “Mechatronics and Clean Technologies”, Sofia, 8 bul. Kliment Ohridski, 1756 Sofia, Bulgaria
4
PERIMED-2, BG16RFPR002-1.014-0007, Central District, Vasil Aprilov Blvd. 15A, 4002 Plovdiv, Bulgaria
*
Author to whom correspondence should be addressed.
Crystals 2025, 15(4), 348; https://doi.org/10.3390/cryst15040348
Submission received: 14 March 2025 / Revised: 4 April 2025 / Accepted: 6 April 2025 / Published: 8 April 2025

Abstract

:
A metal–organic framework, MOF-S1, was synthesized via a solvothermal reaction between 2,4,6-tris-(4-carboxyphenoxy)-1,3,5-triazine (TCPT) and zinc nitrate hexahydrate. Single-crystal and powder X-ray diffraction analyses confirmed the formation of hexagonal rod-shaped crystals with a trigonal (P-31c) structure featuring a two-fold interpenetrated 3D framework. A comprehensive characterization—including NMR spectroscopy, thermogravimetric analysis, and surface area measurements (using Langmuir, t-plot, Horváth–Kawazoe, and Dubinin–Radushkevich models)—revealed an ultramicroporous material with a Langmuir surface area of 711 m2/g and a median pore width of ~6.5 Å. Adsorption studies using Congo Red, Methylene Blue, Methyl Orange, and Rhodamine B demonstrated the rapid uptake and effective removal from aqueous solutions, with kinetic modeling indicating a dominant chemisorption mechanism. Photocatalytic tests under UV irradiation yielded degradation efficiencies of ~93% for Methyl Orange and ~74% for Rhodamine B. These findings suggest that MOF-S1 is a promising candidate for wastewater treatment applications and UV-related processes, offering a strong adsorption capacity and thermal stability.

1. Introduction

Metal–organic frameworks (MOFs) represent a class of porous crystalline materials that have attracted significant attention due to their diverse structural features and versatile applications, including gas storage, separation, catalysis, and environmental remediation [1,2,3,4]. The design of novel MOFs often involves the careful selection of metal ions and organic ligands, enabling the fine-tuning of pore structures and chemical functionalities [5,6,7].
Among various ligands employed, 2,4,6-tris-(4-carboxyphenoxy)-1,3,5-triazine (TCPT) stands out due to its rigid structure and multifunctional carboxylate groups, which facilitate the formation of stable frameworks with unique topologies [8,9,10,11,12]. Previously reported TCPT-based MOFs, such as hexagonal Zn2(TCPT)OH [13] and SNU-100 [14], have demonstrated the potential of this ligand in achieving complex framework architectures and high adsorption capacities. The structural diversity exhibited by these materials arises primarily from variations in metal coordination geometry and ligand orientation, which significantly influence their physicochemical properties and application potential [15,16,17].
TCPT-based MOFs have shown notable efficiency in the adsorption and separation of various gases, including carbon dioxide (CO2), hydrogen (H2), methane (CH4), and nitrogen (N2) [18,19,20]. Studies have illustrated that these MOFs possess desirable characteristics for selective gas adsorption, primarily due to their tunable microporosity and the presence of polar functional groups capable of specific gas interactions [21].
Additionally, TCPT-based MOFs have been explored extensively for their catalytic and photocatalytic activities [22,23]. Such frameworks have shown promising results in the photocatalytic degradation of organic pollutants like dyes and pharmaceuticals under UV and visible irradiation. Their catalytic effectiveness is attributed to their structural stability, porosity, and availability of active sites provided by the coordinated metal ions and organic linkers. Recent studies have specifically highlighted the efficacy of these MOFs in photodegradation processes, demonstrating their potential for environmental applications [24].
In the current study, we report the synthesis, structural characterization, and adsorption properties of a novel zinc-based MOF designated as MOF-S1, synthesized by the solvothermal method using zinc nitrate hexahydrate and TCPT ligand. MOF-S1 crystallizes in a trigonal space group (P-31c) and joins the growing family of TCPT-based MOFs. It distinctly stands out due to its two-fold interpenetrated trigonal structure composed of zinc paddle-wheel units and a shorter metal-to-metal distance. This interpenetration arises from symmetry operations/constraints, creating a robust and thermally stable framework characterized by ultramicroporosity and a wide band gap favorable for UV-driven processes. Consequently, MOF-S1 demonstrates a superior dye adsorption capacity and enhanced UV photocatalytic efficiency, positioning it as an excellent candidate for multifunctional environmental remediation applications. This study examines the structure–property relationship of MOF-S1 and compares its adsorption characteristics with related TCPT-based MOFs, highlighting its suitability for applications in wastewater treatment and UV-driven photocatalysis.

2. Materials and Methods

2.1. Materials

All reagents are purchased from Aldrich, Merck, and Fluka and are used without any further purification.

2.2. Synthesis

2.2.1. Preparation of Ligand

To a solution of 4-hydroxybenzoic acid (4.28 g, 31 mmol) and NaOH (2.4 g, 60 mmol) in distilled water (50 mL), a solution of cyanuric chloride (1.844 g, 10 mmol) in acetone (50 mL) was added and the mixture was stirred at rt for 3.5 h. The small amount of solid phase was filtered off and the solution was acidified to pH 2–3 by nitric acid. The precipitate formed was filtered off, washed subsequently with water, ethanol, and acetone, and dried in air to give pure TCPT in 96% yield (4.69 g).

2.2.2. Preparation of MOF-S1 [Zn2(TCPT). × H2O]

In a 40 mL glass bottle, 204 mg of zinc nitrate hexahydrate (Zn(NO3)2·6H2O) is dissolved in 0.6 mL of deionized water. Separately, in a beaker, 122 mg of TCPT is dissolved in 10 mL of DMF (dimethylformamide). Once both reagents are fully dissolved, the TCPT solution in DMF is poured into the bottle containing the zinc nitrate solution. The mixture is then placed in a preheated oven at 105 °C for 14 h. As a result, white hexagonal rod-shaped crystals are obtained and subsequently filtered through filter paper. The obtained crystals were analyzed using X-ray structural analysis, which confirmed that the zinc ions from the salt interacted with the carboxyl groups of the ligand, forming the MOF-S1 structure [Zn2(TCPT). × H2O].

2.3. Characterization Methods

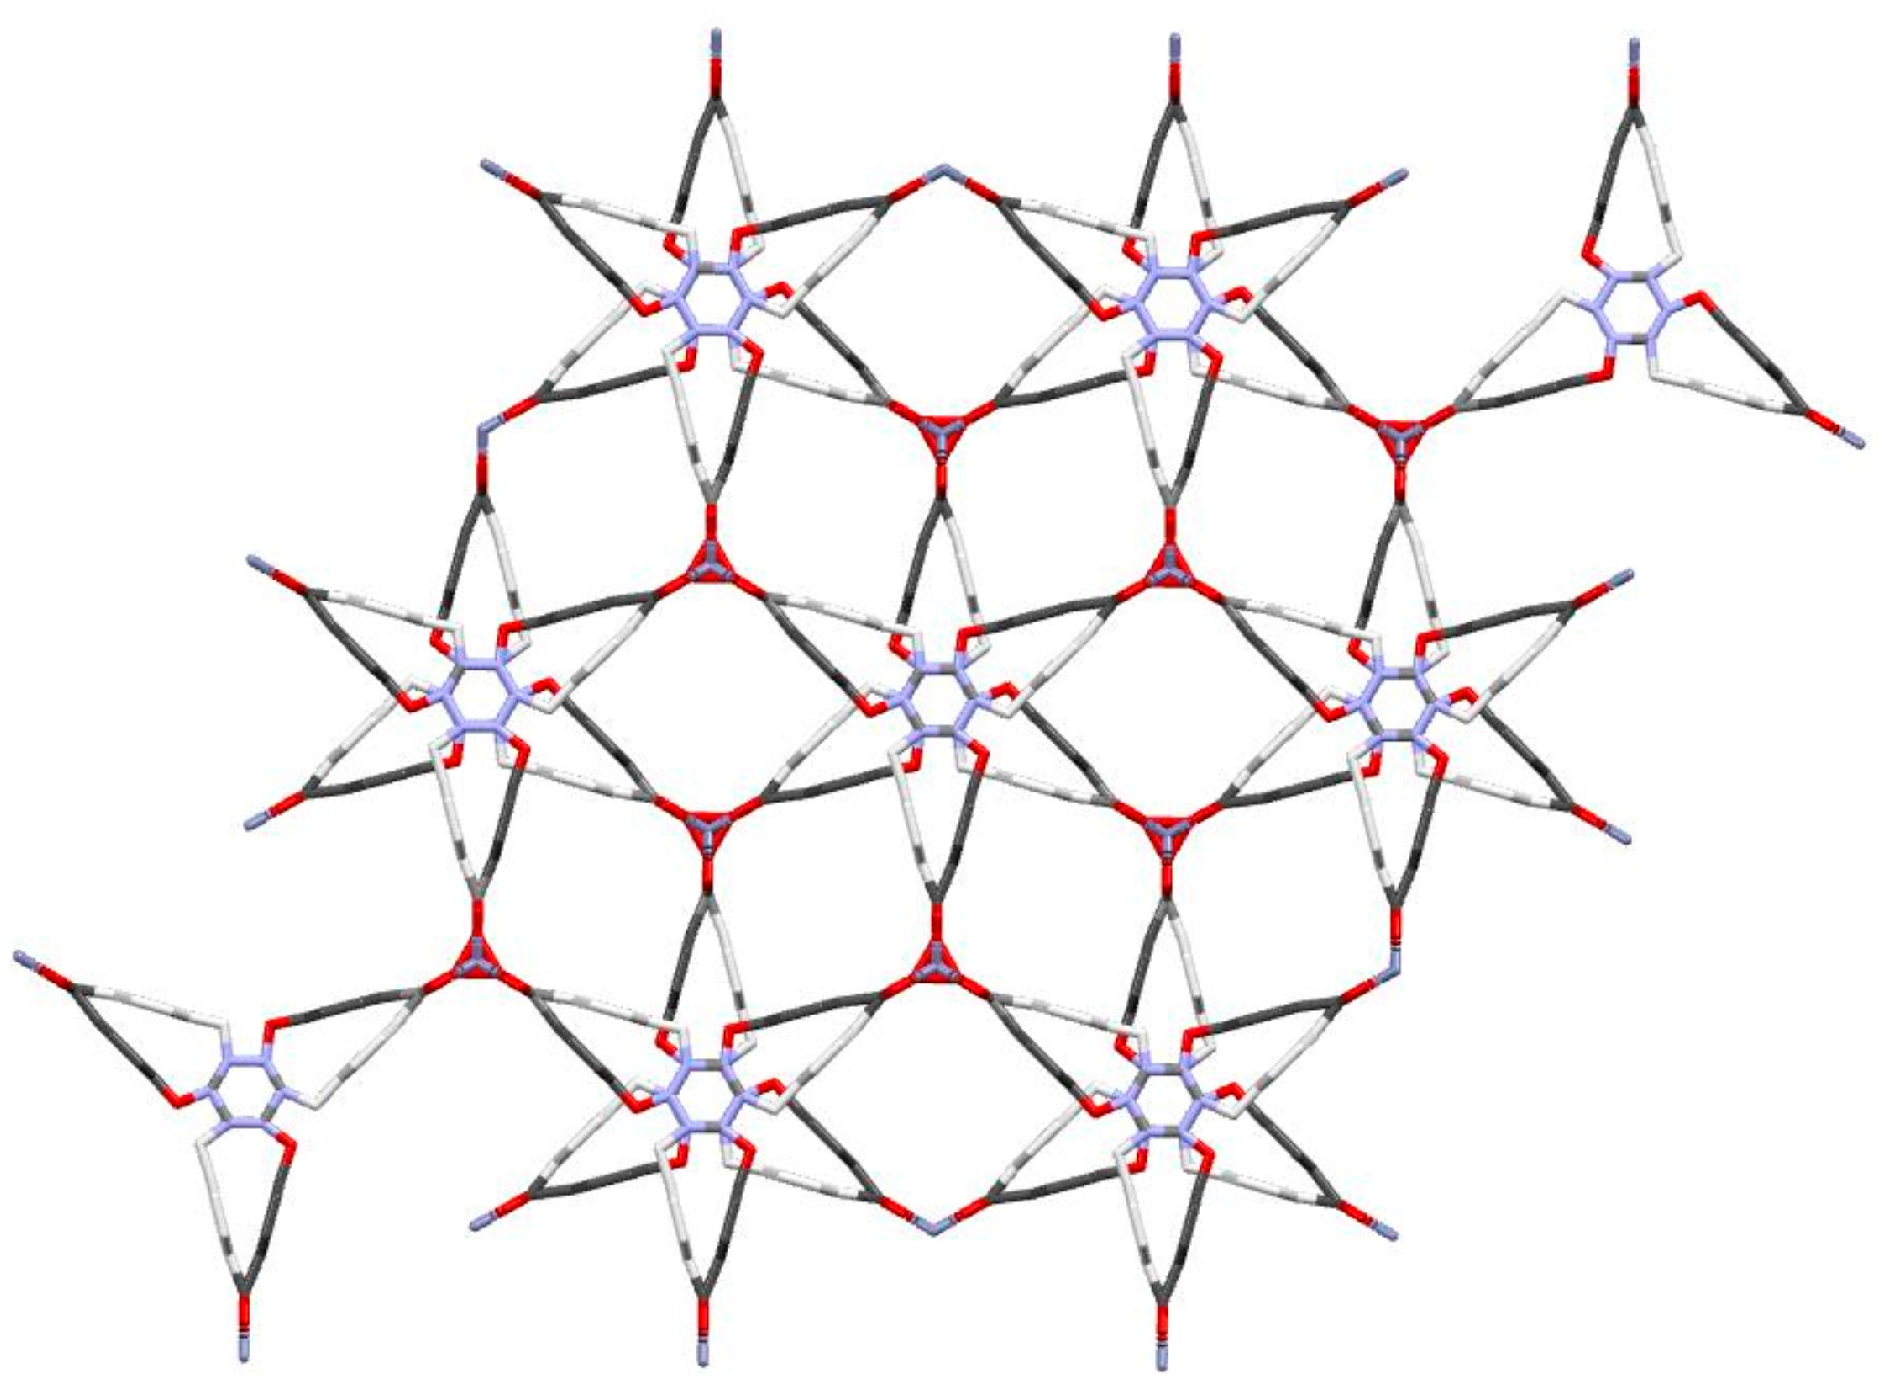
2.3.1. Single-Crystal X-Ray Diffraction (SCXRD) Analysis

Colorless crystals of MOF-S1 were mounted on a nylon loop and used for single crystal diffraction analyses. The data collection experiments were performed on Bruker D8 Venture diffractometer. The determination of unit cell parameters, data integration, scaling, and absorption corrections were carried out using APEX4 program package (2020.7-2, Bruker AXS). The crystal structures were solved by direct methods (SHELXS-97/2013) [25] and refined by full-matrix least-square procedures on F2 (SHELXL-97/2013) [26]. The hydrogens of the TCPT and hydroxyl group were found by Fourier difference and refined by a riding model with Uiso = 1.2 and 1.5 times that of the attached carbon and oxygen atom correspondingly. The experimental and structure refinement parameters are given in Table 1. A visualization of the MOF-S1 structure is shown on Figure 1. Information about the structural data is available in the Cambridge Structural Database (CSD) 2431147 number.

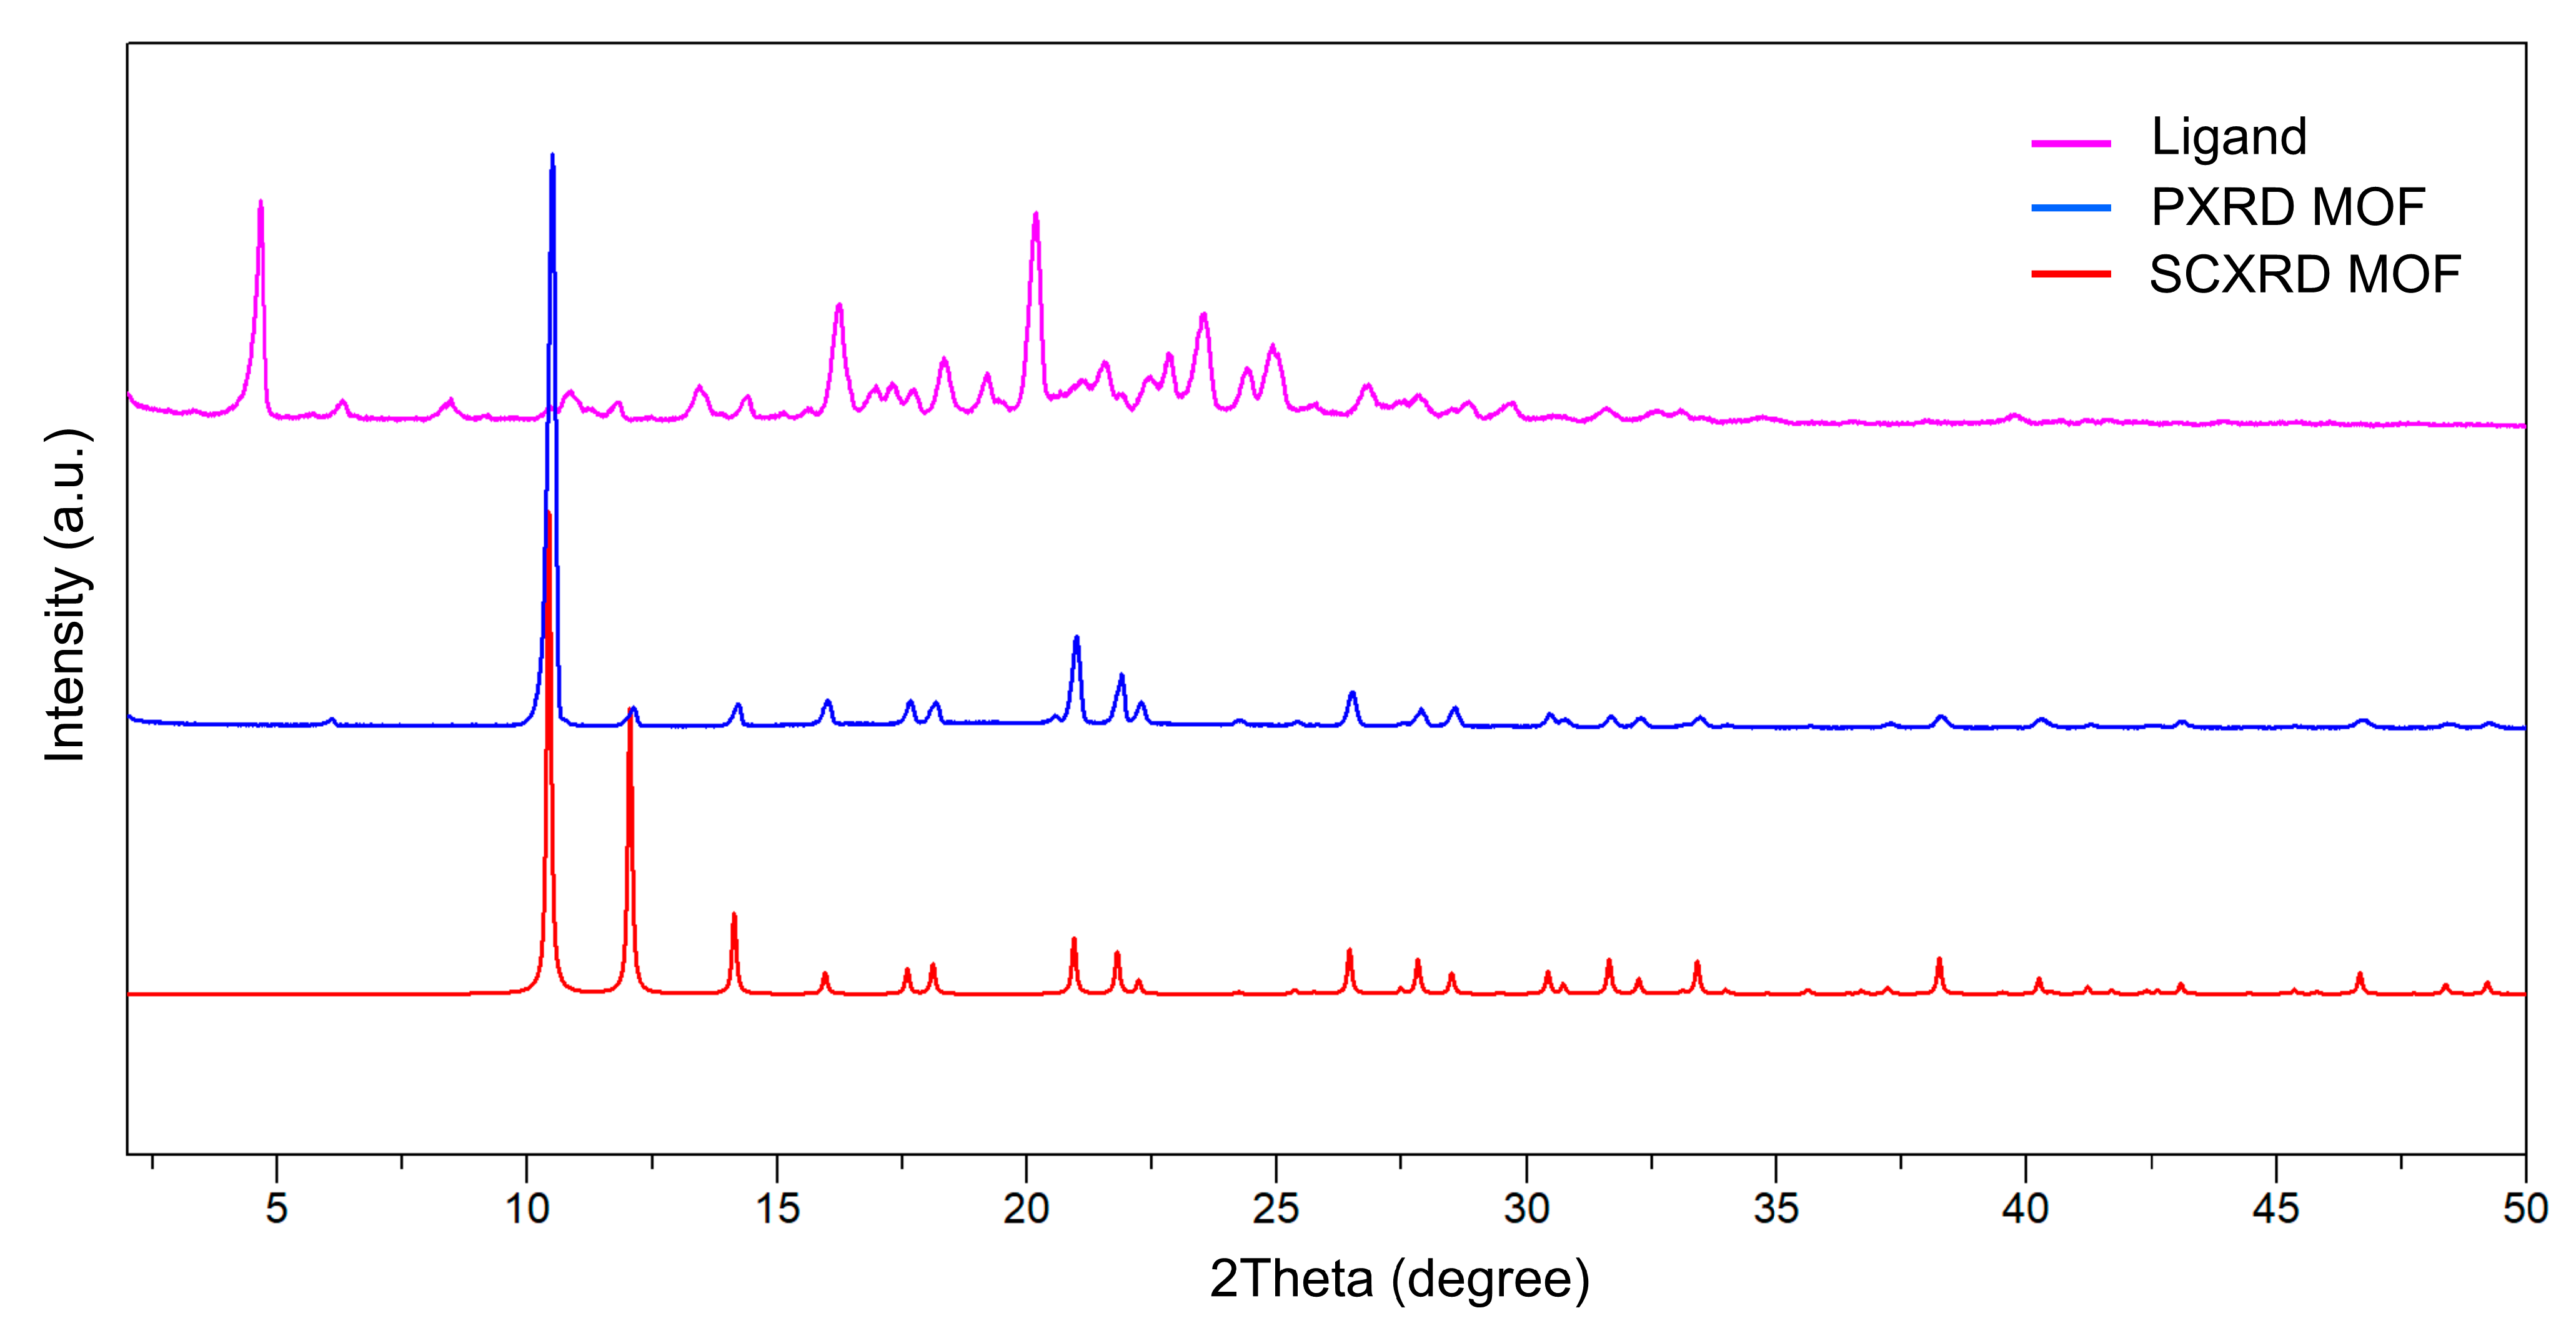
2.3.2. Powder X-Ray Diffraction (PXRD) Analysis

Powder X-ray diffraction analysis was conducted using an Empyrean Powder X-ray diffractometer (Malvern Panalytical, Almelo, The Netherlands) equipped with a copper X-ray source (λ = 1.5406 Å) and a PIXcel3D area detector. The diffraction patterns of TCPT and MOF-S1 were collected in the 2–50° 2θ range using the following operation conditions: 40 kV/30 mA, step size of 0.013°, and rotation speed of 15 rpm. The powder patterns of the bulk microcrystalline products (TCPT and MOF-S1) were compared with the powder patterns of the starting reagents and those generated from the SCXRD analysis, thus confirming the presence of desired/undesired crystalline/amorphous phases (Figure 2). Data Viewer ver. 1.9a software (Malvern Panalytical, Almelo, The Netherlands) was used for visualization of the powder patterns.

2.3.3. Nuclear Magnetic Resonance (NMR) Spectroscopy

The NMR spectra are recorded on a Bruker Avance NEO 400 spectrometer (Rheinstetten, Germany) in DMSO-d6 (Deutero GmbH, Kastellaun, Germany); the chemical shifts are quoted in ppm in δ-values against tetramethylsilane (TMS) as an internal standard and the coupling constants are calculated in Hz. The assignment of the signals is confirmed by applying two-dimensional HSQC and HMBC techniques. The spectra are processed with Topspin 3.6.3 program.
2,4,6-tris-(4-carboxyphenoxy)-1,3,5-triazine: 1H NMR 7.376 (dt, 6H, J 8.8, 2.1, CH-2+6 Ar), 7.989 (dt, 6H, J 8.8, 2.1, CH-3+5 Ar); 13C NMR 122.13 (CH-2+6 Ar), 129.07 (Cq-4 Ar), 131.42 (CH-3+5 Ar), 155.03 (Cq-1 Ar), 166.94 (C=O), and 173.20 (Cq triazine).

2.3.4. Thermogravimetric Analysis

TGA/DSC data were recorded on a BXT-STA-200 analyzer (Shanghai Glomro, Shanghai, China). A small amount (typically a few milligrams) of the sample (TCPT ligand or MOF-S1) was placed in an alumina crucible and subjected to TGA using a simultaneous TGA/DSC system. The sample was heated from room temperature to 600 °C at a constant rate of 10 °C/min under an air atmosphere. The weight loss was continuously recorded, while the DSC simultaneously monitored endothermic and exothermic transitions. This procedure enabled the identification of distinct thermal events corresponding to moisture loss, decarboxylation, cleavage of ether linkages, and complete oxidation of the organic framework.

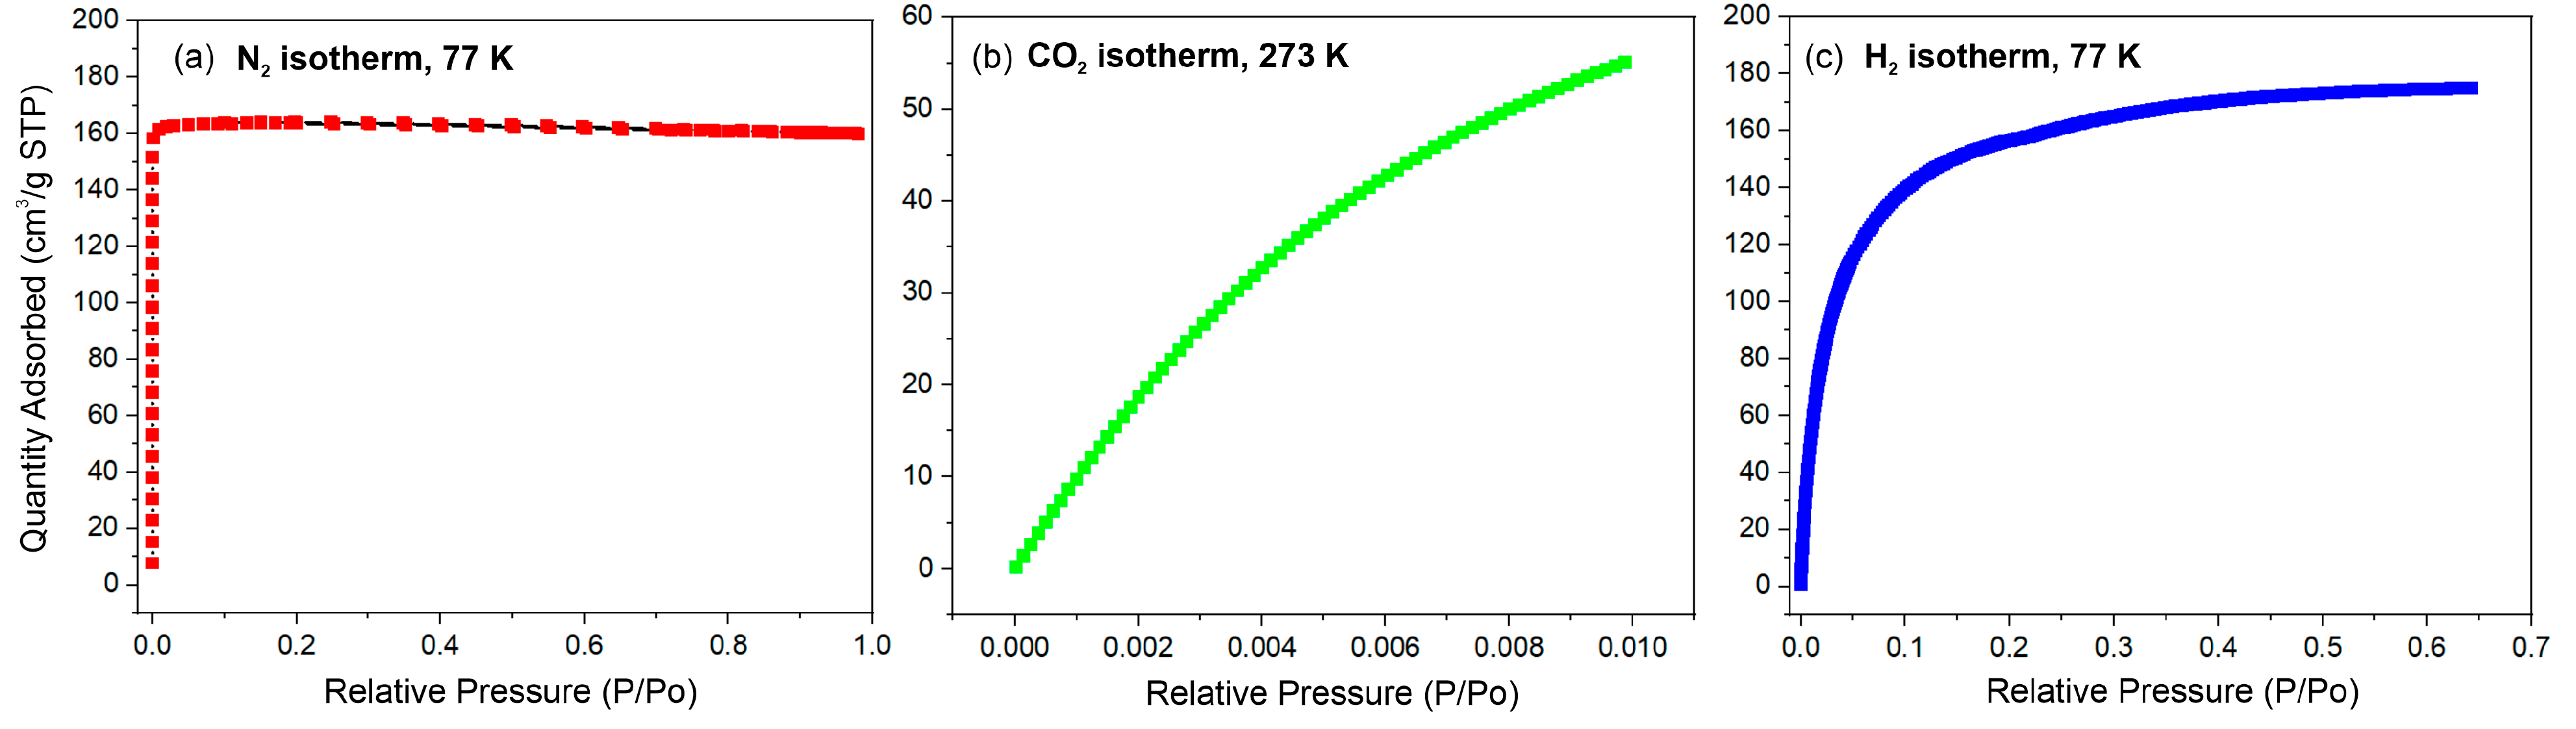
2.3.5. Specific Surface Area Analysis—N2, H2, and CO2 Physisorption

The surface properties of the title MOF-S1 were analyzed using a 3Flex surface analyzer (Micromeritics, Norcross, GA, USA) and Flex v6.02 as data acquisition and processing software. Prior to the experiment, approximately 0.2 g of MOF-S1 were degassed in situ at 240 °C for 4 h under vacuum (>1.10−5 mmHg). The physisorption experiments were conducted under liquid nitrogen (77 K) using N2 as the probe molecule. Information about the specific surface area, pore volume, and pore size distribution of MOF-S1 was obtained by analyzing the resulting N2 adsorption/desorption isotherm with various equations, algorithms, and methods. For instance, the specific surface area was calculated from the adsorption data in the P/P0 range of 0.001 to 0.05 using Langmuir method [27]. The total pore volume was estimated based on the amount adsorbed at a relative pressure of 0.96. Micropore volume was determined using the t-plot method in the 0.05–0.2 P/P0 range and the results were cross-checked with Horváth–Kawazoe (HK) algorithm [28]. Moreover, HK algorithm was used to determine the median pore width, while Dubinin–Radushkevich (DR) model provided information about the adsorption energy [29]. The CO2 and H2 physisorption experiments were performed at 273 K and 77 K and in the relative pressure ranges of 0–0.01 and 0–0.65, respectively.

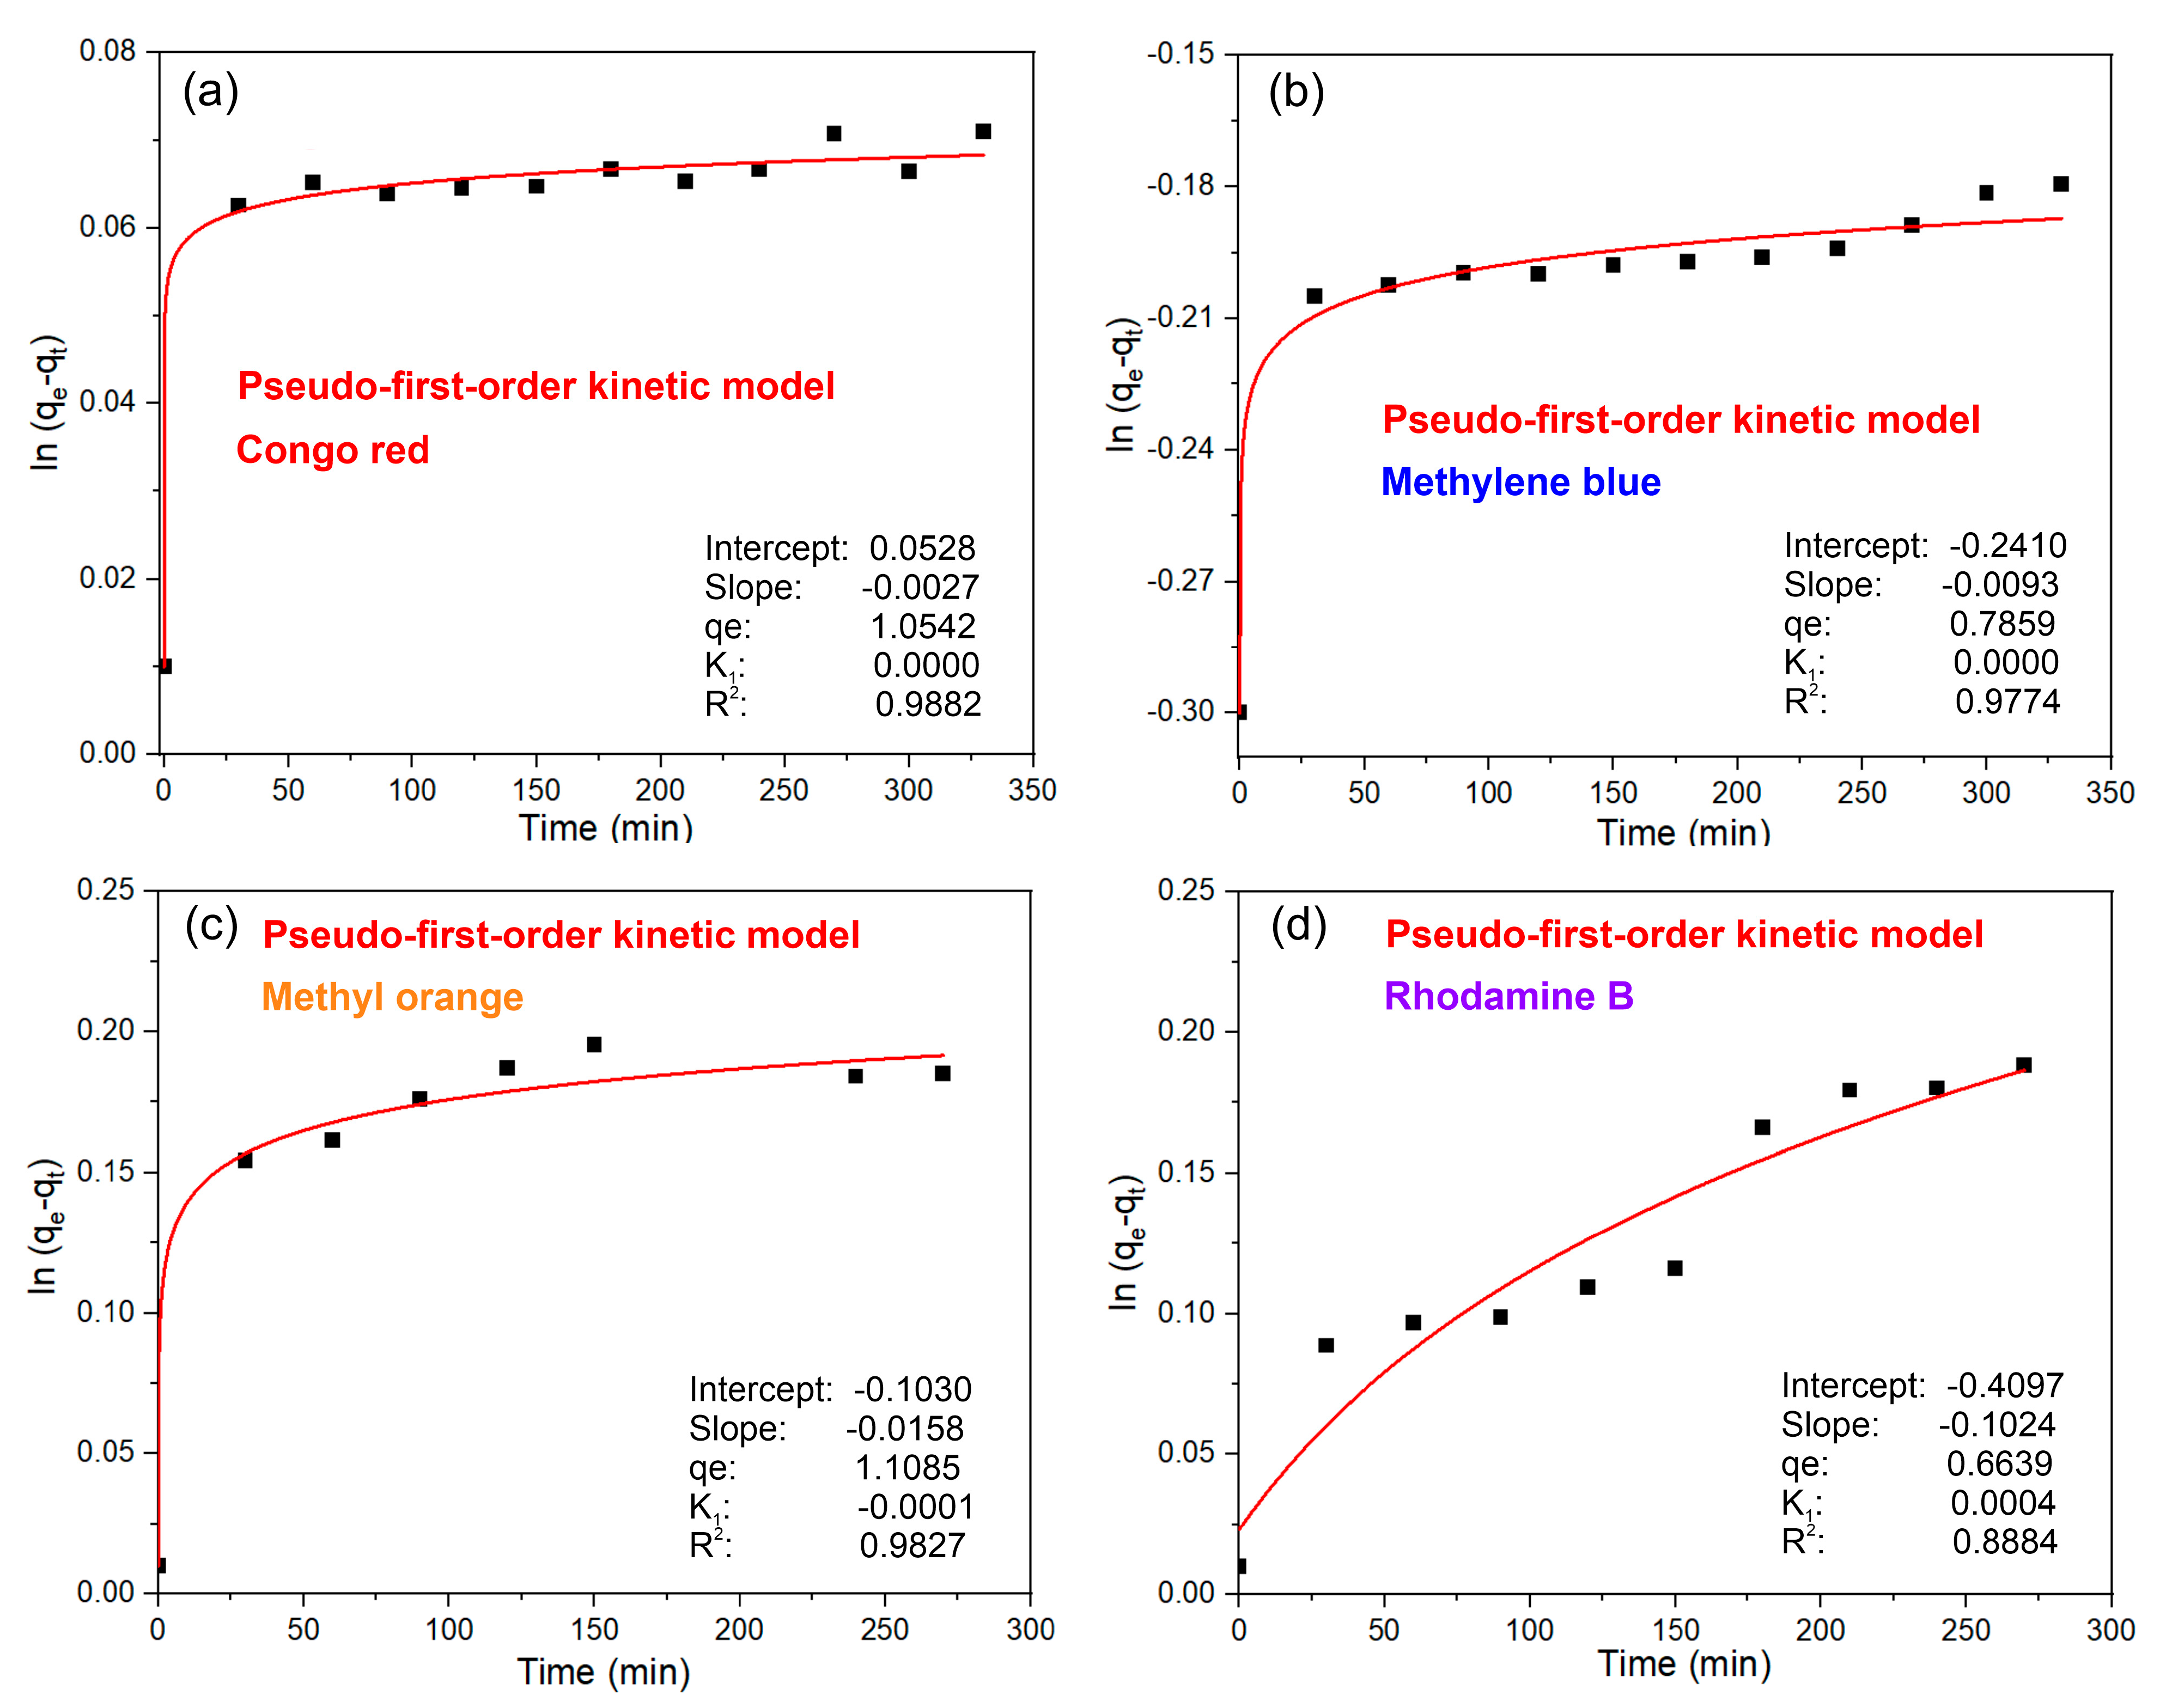
2.3.6. Adsorption of Dye Molecules on MOF-S1

The four dyes, CR, RhB, MO, and MB, mainly absorb in the wavelength ranges of 400–600, 500–600, 350–550, and 550–700 nm, with peak absorption at 498, 553, 464, and 663 nm, respectively. We tested the synthesized MOF-S1 for the adsorption of these dyes in an aqueous solution with each dye. The amount of MOF-S1 (adsorbent) used was 50 mg for all dyes. The experiments were conducted at room temperature, in the dark under continuous stirring, using 10 mL of an aqueous solution of 10 µg/mL dye. After a certain contact time (t = 30, 60, 90, 120, 150, 180, 210, … to 330 min, etc.), sample was taken from the reaction mixture, centrifuged at 14,000 rpm for 1 min, and UV–Vis absorption of the liquid supernatant was measured using a Cary 4000 spectrophotometer (Agilent, Santa Clara, CA, USA). In case of a very rapid “decolorization” after each measurement, 100 µg of dye was supplied to the stirring solution.

2.3.7. Photodegradation Studies of Dye Molecules Using MOF-S1

Photochemical degradation experiments of the dyes (CR, RhB, MO, and MB) were conducted using glass reaction vessels, each with a total volume of 25 mL. The solutions (vessels) were placed under UV irradiation with two UVC tubes (TUV 11W G11T5, Philips, North Ryde, Australia), each rated at 11 W and emitting radiation with a wavelength maximum around 254 nm. The reaction solutions were continuously stirred using magnetic stirrers to ensure uniform irradiation and homogeneous mixing. At specific time intervals, aliquots were withdrawn using single-channel pipette, and immediately centrifuged (14,000 rpm for 1 min). The absorption spectra of the supernatants were subsequently recorded, and the decolorization rate was monitored by observing changes in absorbance intensity at the dyes’ maximum absorption wavelength (λmax).

3. Results and Discussion

3.1. Physicochemical Characterization

A single-crystal analysis reveals that the studied compound MOF-S1 crystallizes in the trigonal space group P-31c with unit cell parameters a = 16.9557, b = 16.9557, and c = 6.9191 Å and exhibits a two-fold interpenetrated 3D framework topology composed of zinc paddle-wheel units ([Zn2(COO)3]) coordinated by the TCPT ligand. The structural motif of MOF-S1 closely resembles previously reported zinc-based MOFs using the same TCPT ligand [10,13,14]; however, in the studied crystal structure, there is one symmetrically independent Zn(II) center which is four-coordinated by three carboxylate O atoms from three TCPT ligands and one hydroxyl group. The two adjacent Zn(II) ions are coupled by the ligand to form a paddle-wheel building units [Zn2(COO)3], which is additionally connected by hydroxyl groups to form a five-connected node. Other notable distinctions based on solvent selection and reaction conditions are also present. For instance, Zn-TCPT MOF, as reported by Zhang et al. [13], crystallizes in the hexagonal space group P63/m, exhibiting a similar Zn node and similar two-fold interpenetration and zinc paddle-wheel units linked by –OH groups.
SNU-100, another related zinc-based MOF [14], crystallizes in a same space group (trigonal, P-31c) with different unit cell parameters and is notable for the incorporation of formate bridging groups. The layers constructed by Zn3 clusters and TCPT ligands are interconnected by formate groups rather than –OH linkages, producing distinct 3D porous channels and enhanced selective adsorption and gas separation capabilities. Further, in SNU-100, an additional HCOO group is included, and, thus, six-connected SBU nodes [Zn3(COO)6] are formed.
Another related structure, Zn-TCPT-based luminescent MOFs as reported by Xiao et al. [12], crystallizes with varied coordination environments of zinc, forming unique three-pole paddle-wheel units. These MOFs feature distinct pore geometries that enable exceptional fluorescence properties and selective molecular recognition and detection capabilities for small organic drugs and aromatic amines [30].
The structural packing influences the TCPT ligand geometry. In the commented structures, the angle between the triazine and benzene rings remains about 90°, while the C-O-C angle varies and is 109.2° in MOF-S1, 118.1° in SNU-100, and 119.6° in the P63/m Zn-TCPT MOF. In MOF-S1, half of the ligand teeth are oriented clockwise and half are oriented counterclockwise. Such an arrangement is displayed in the SNU-100 structure. In contrast, in the structure of hexagonal Zn2(TCPT)OH, all the ligand teeth are clockwise-oriented. Consequently, the pores of MOF-S1 and hexagonal Zn2(TCPT)OH are differently shaped, supposing differences in the sorption properties. Comparatively, MOF-S1 shares the zinc paddle-wheel SBU motif with the above-mentioned frameworks, though subtle structural variations induced by synthesis conditions and solvent mixtures result in significantly different physicochemical characteristics and adsorption capabilities.
Beyond structural similarities, differences in synthetic conditions—especially solvent selection, reaction temperature, and duration—significantly influence the formation and stability of specific SBUs, possibly allowing us to adjust the properties of the resulting MOFs. For instance, MOF-S1 was synthesized using a solvent mixture of DMF and H2O without acid additives, at 105 °C for over 14 h, resulting in a yield of 78% (Table 2). In contrast, the structurally similar SNU-100 was synthesized in pure DMF at 90 °C for 24 h, whereas other related structures, like Zn-TCPT and LMOF, required the presence of additional solvents (DMA, ACN, or EtOH), acidic additives (HBF4 or dilute nitric acid), and longer reaction times (48 h). Such variations in solvent composition and additives strongly affect the crystallization process and final pore architecture, which manifest as differences in stability, adsorption capabilities, and catalytic performance across these structurally related MOFs.
Collectively, MOF-S1 contributes to this growing family of TCPT-based MOFs by exhibiting excellent ultramicroporosity, adsorption performance toward organic dyes, and photocatalytic degradation capabilities, thus broadening their potential application range in environmental remediation and catalytic processes.
The surface area, porosity, and microporous characteristics of the MOF-S1 sample were analyzed using the Brunauer, Emmett, and Teller (BET) [31], Langmuir, t-Plot [32], Horváth–Kawazoe (HK) [28], and Dubinin–Radushkevich (DR) [29] models. The goal was to determine the specific surface area (SSA), micropore volume, pore size distribution, and external surface contributions to assess the material’s adsorption potential. The N2 adsorption/desorption isotherm of MOF-S1 is shown in Figure 3a. The isotherm exhibits a steep initial N2 uptake at very low P/P0 values (~0.1), followed by a flat plateau beyond this point. The steep uptake suggests strong micropore filling, while the plateau indicates complete micropore saturation with minimal additional adsorption. No hysteresis loop is observed, confirming the absence of significant mesoporosity. According to the IUPAC classification, this corresponds to a Type I(a) isotherm, characteristic of ultramicroporous materials (<0.7 nm). The CO2 and H2 adsorption isotherms of MOF-S1 are given on Figure 3b,c. MOF-S1 demonstrates a CO2 and H2 uptake of 2.4 (at 273 K) and 7.6 mmol/g (at 77 K), respectively.
Initially, the BET method was applied to estimate the specific surface area (SSA), resulting in an SSA value of ~491 m2/g (R2 = 0.995) obtained using the standard P/P0 range (0.05–0.3). However, the fit returned a negative CBET constant and a negative Y-intercept, indicating an unreliable BET result due to the incorrect fitting range selection. To address this, the fitting range was adjusted to lower P/P0 (0.02–0.15) regions, according to the Rouquerol recommendations [33], but the C-constant and Y-intercept remained negative. These results confirm that BET is unsuitable for this material due to the dominance of micropore filling at very low P/P0 values. Given the limitations of BET, the Langmuir method was used instead, as it assumes monolayer adsorption, making it more appropriate for microporous MOF materials. The Langmuir surface area was determined to be 711 m2/g (P/P0 range of 0.001 to 0.05), providing a more reliable SSA estimation (Table 3).
Furthermore, the micropore volume and micropore/external surface area were analyzed using the t-plot method based on the Harkins and Jura thickness equation [34] using the obtained Langmuir surface area. The best fit line (R2 = 0.968) was obtained in the thickness range of 0.34–0.41 nm, resulting in an estimated micropore volume of ~0.25 cm3/g and micropore surface area of ~706 m2/g (Figure 4a). The Horváth–Kawazoe model was used to verify the micropore volume obtained from the t-plot method but also to determine the micropore size distribution of the material (Figure 4b). It was found that the median micropore width is ~6.5 Å, which is consistent with the Type I(a) isotherm classification (micropore width below 7 Å). Finally, the Dubinin–Radushkevich model provided information about the adsorption energy, showing values around 58 kJ/mol, confirming the strong adsorption potential which is typical for ultramicroporous materials (Figure 4c).
The thermal stability of the TCPT ligand and MOF was evaluated up to 600 °C at a heating rate of 10 °C/min in an air atmosphere using simultaneous TGA/DSC analysis (Figure 5). The thermal decomposition of TCPT follows a multi-step pathway, characterized by four distinct thermal events, each associated with a specific weight loss (Figure 5a).
The first major thermal event occurs between 50 and 130 °C, resulting in a ~19 wt% loss and a broad endothermic effect, peaking at 100 °C with a normalized enthalpy of 54.59 J/g. This weight loss is attributed to the removal of adsorbed water and the onset of decarboxylation. Based on the molecular weight of the ligand, the 19 wt% loss suggests the decarboxylation of two –COOH groups, leading to the release of two CO2 molecules.
The second thermal event occurs between 130 and 190 °C, with an additional ~11 wt% loss and an enthalpy of 12.86 J/g. This stage corresponds to the removal of the third CO2 molecule. The higher decomposition temperature suggests that structural rearrangements stabilize the remaining –COOH group, delaying its decarboxylation.
The third major weight loss (~33 wt%) occurs between 250 and 360 °C, featuring an endothermic effect with a peak at 308 °C (enthalpy = 31.65 J/g). This stage is attributed to the cleavage of ether (-O-) linkages and the oxidation of aromatic moieties. Similar to the CO2 release pattern, the ~33 wt% loss is likely due to the breakdown of two –O-Ph fragments, followed by the stabilization of the remaining –O-Ph moiety.
The final and most intense exothermic event occurs between 400 and 600 °C, with a large enthalpy release (388.12 J/g). This stage represents the complete oxidation of the remaining organic framework, including the final ring-opening of the heterocyclic core, followed by the formation of CO, CO2, H2O, NOx, and other combustion byproducts. The near-total mass loss (~96.88%) confirms that almost all organic material is fully oxidized, leaving minimal residual char.
The TGA/DSC analysis of MOF-S1 (Figure 5b) reveals two distinct thermal events within the temperature ranges of 100–300 °C and 430–530 °C. The first thermal event, characterized by a ~15 wt% weight loss and a broad endothermic peak (178.83 J/g), is attributed to the removal of the physiosorbed or structural solvent. This is followed by a rapid decomposition and combustion of the organic components between 430 and 530 °C, resulting in a ~45 wt% mass loss. The remaining ~40 wt% is likely composed of residual organic char and zinc-based inorganic residues.

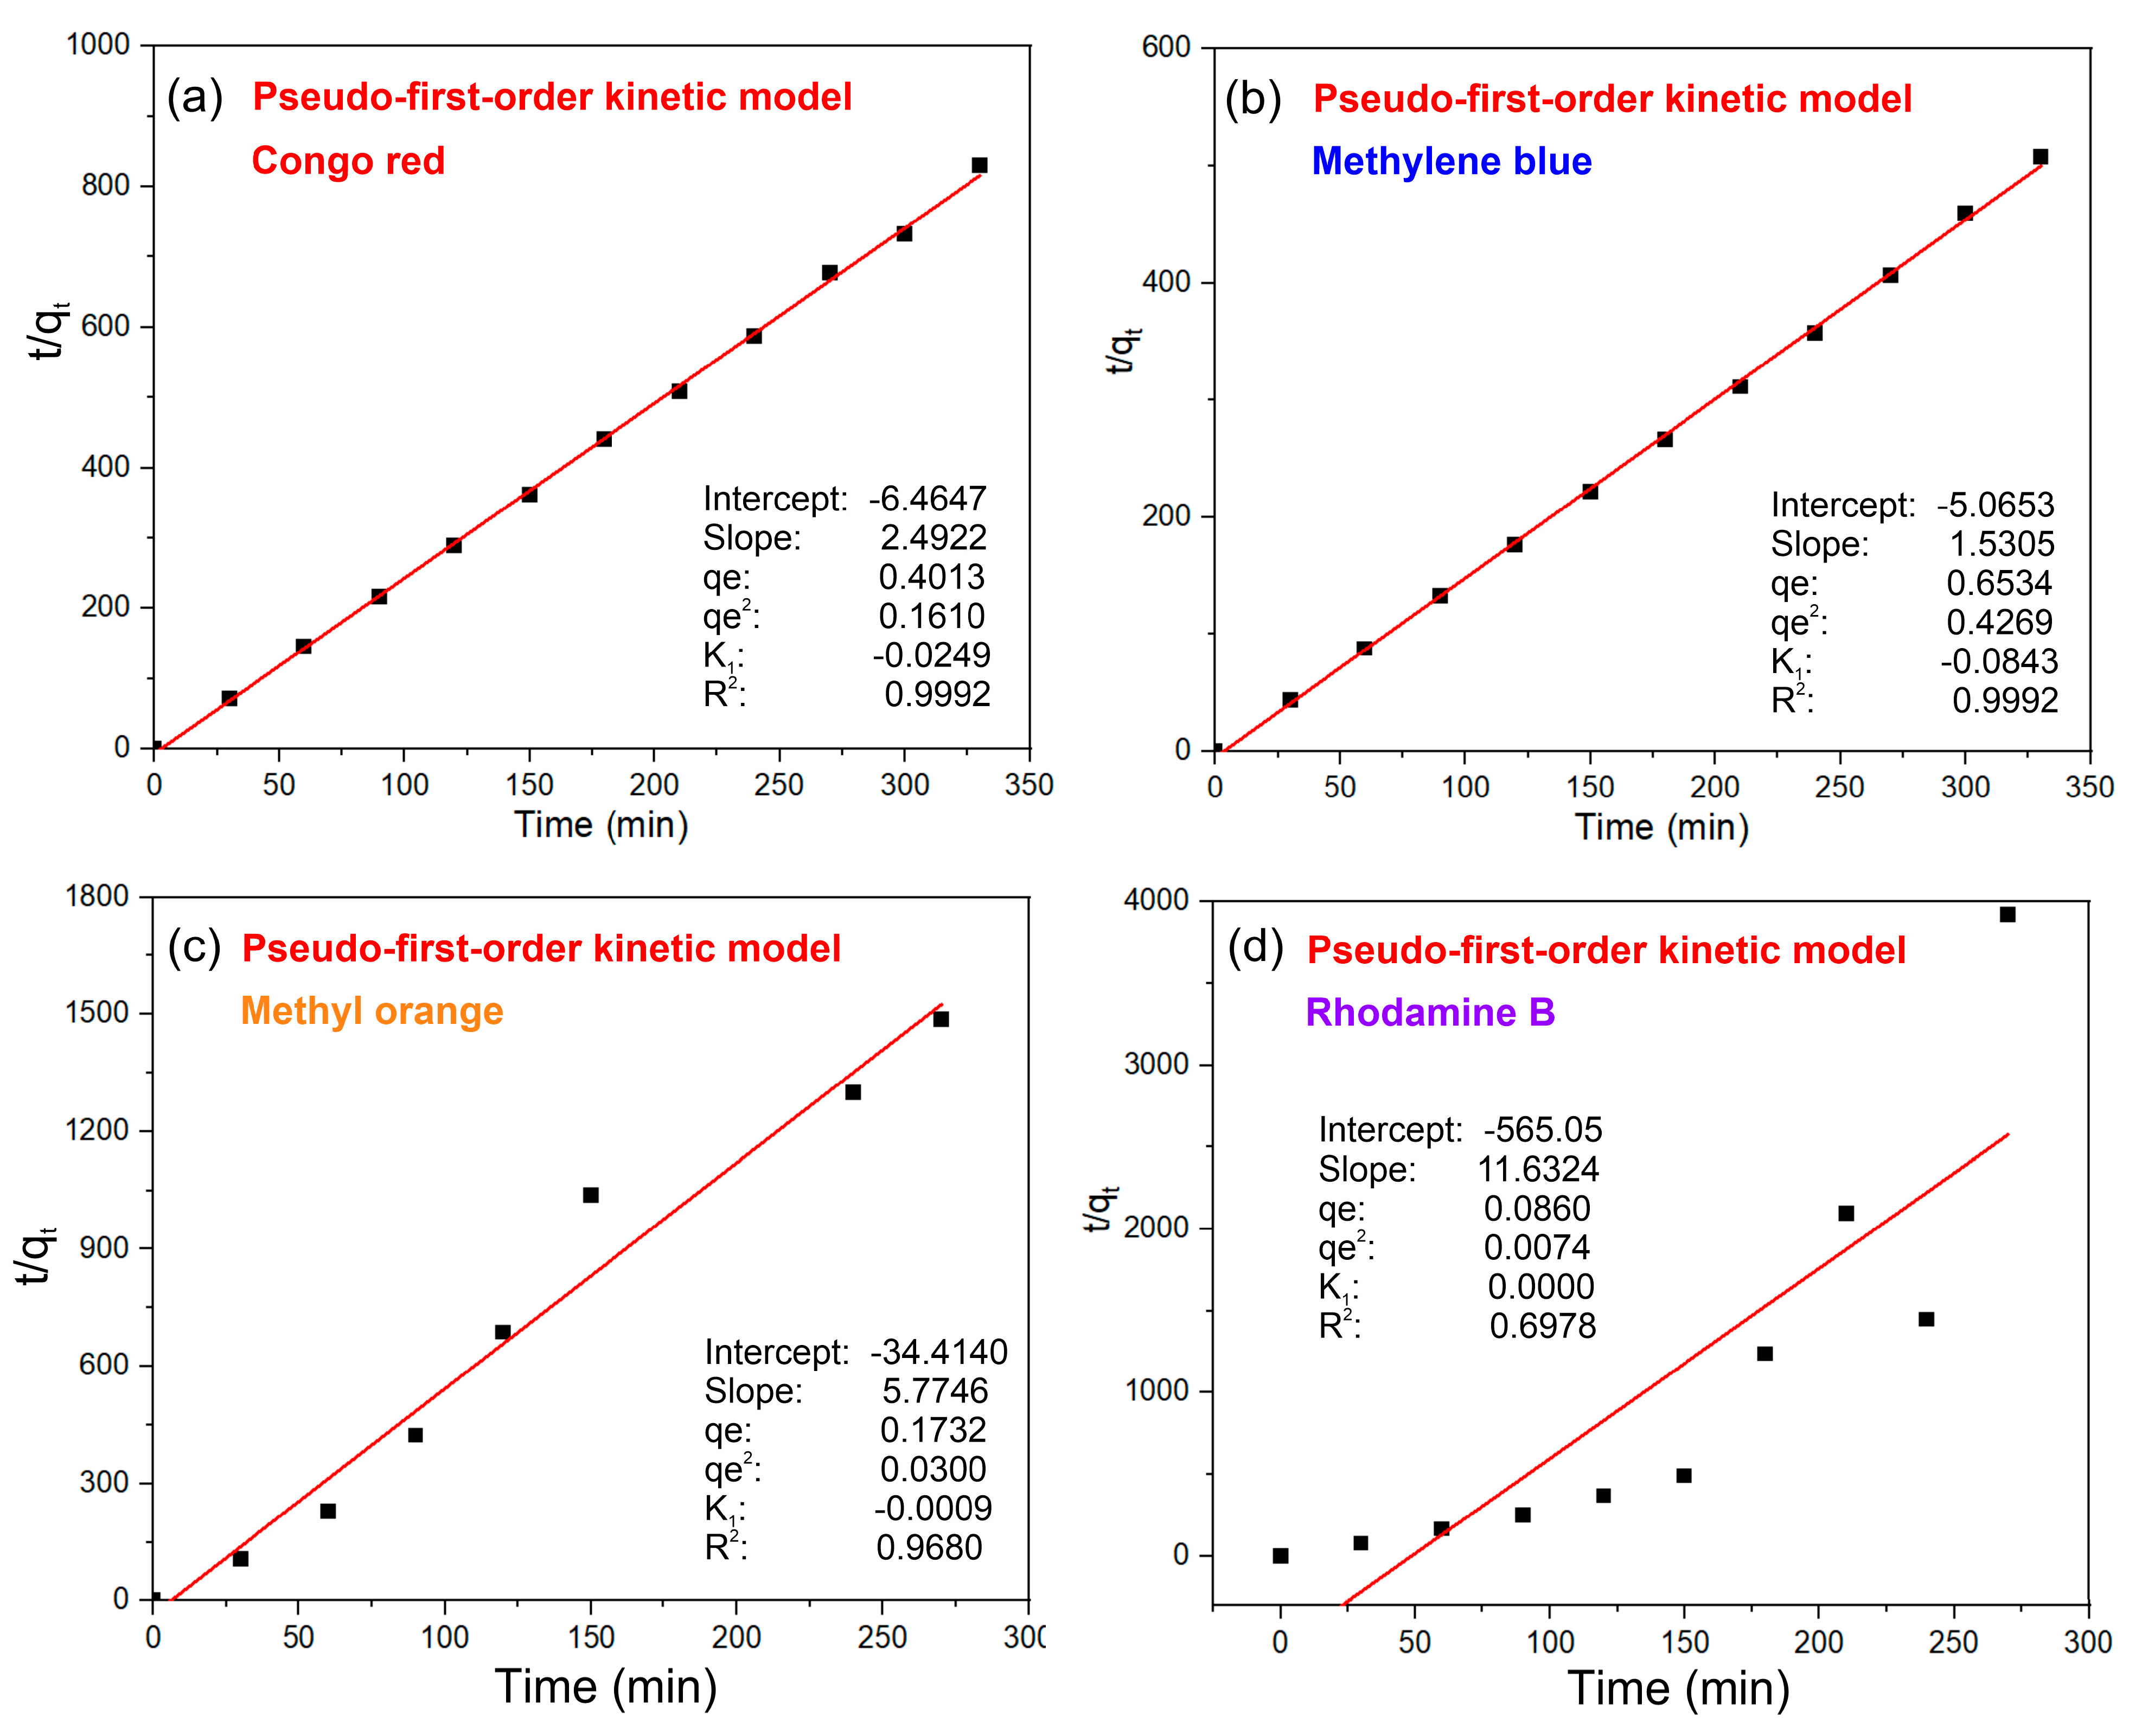
3.2. Adsorption of Dye Molecules on MOF-S1

The UV–Vis absorption spectra for CR, RhB, MO, and MB are displayed on Figure 6. The initial kinetic of absorption (0 to 30 min) are quite rapid, as, for all four dyes, the absorption values are close to zero; e.g., all or almost all the dye present in the solution is absorbed. However, in the next step, the addition of a fresh amount of dye to the solution produces two distinct patterns. For MO and RhB, with each addition of a fresh dye, the absorption value increased and, finally, reached the initial values (6 × 100 µg and 180 min for MO and 9 × 100 µg and 270 min for RhB). The subsequent addition produced absorption values higher than the initial one. For the CR and MB cases, the MOF-S1 continues to absorb the dye and only a slight variation in the absorption values is registered up to 330 min (10 × 100 µg). At this stage, we decided to stop the addition of a fresh dyes as we assumed a combination of adsorption and dye degradation occurs simultaneously. In all cases. the MOF-S1 absorption sites are occupied. although at different speeds. The difference in the kinetics may be explained by the different sizes and charges of the dye molecules, and variations in the interactions of the MOF with the functional groups of the materials—stronger or weaker interactions. In conclusion, MOF-S1 is an effective adsorbent of Congo Red, Methylene Blue, Methyl Orange, and Rhodamine B, making it suitable for wastewater treatment.

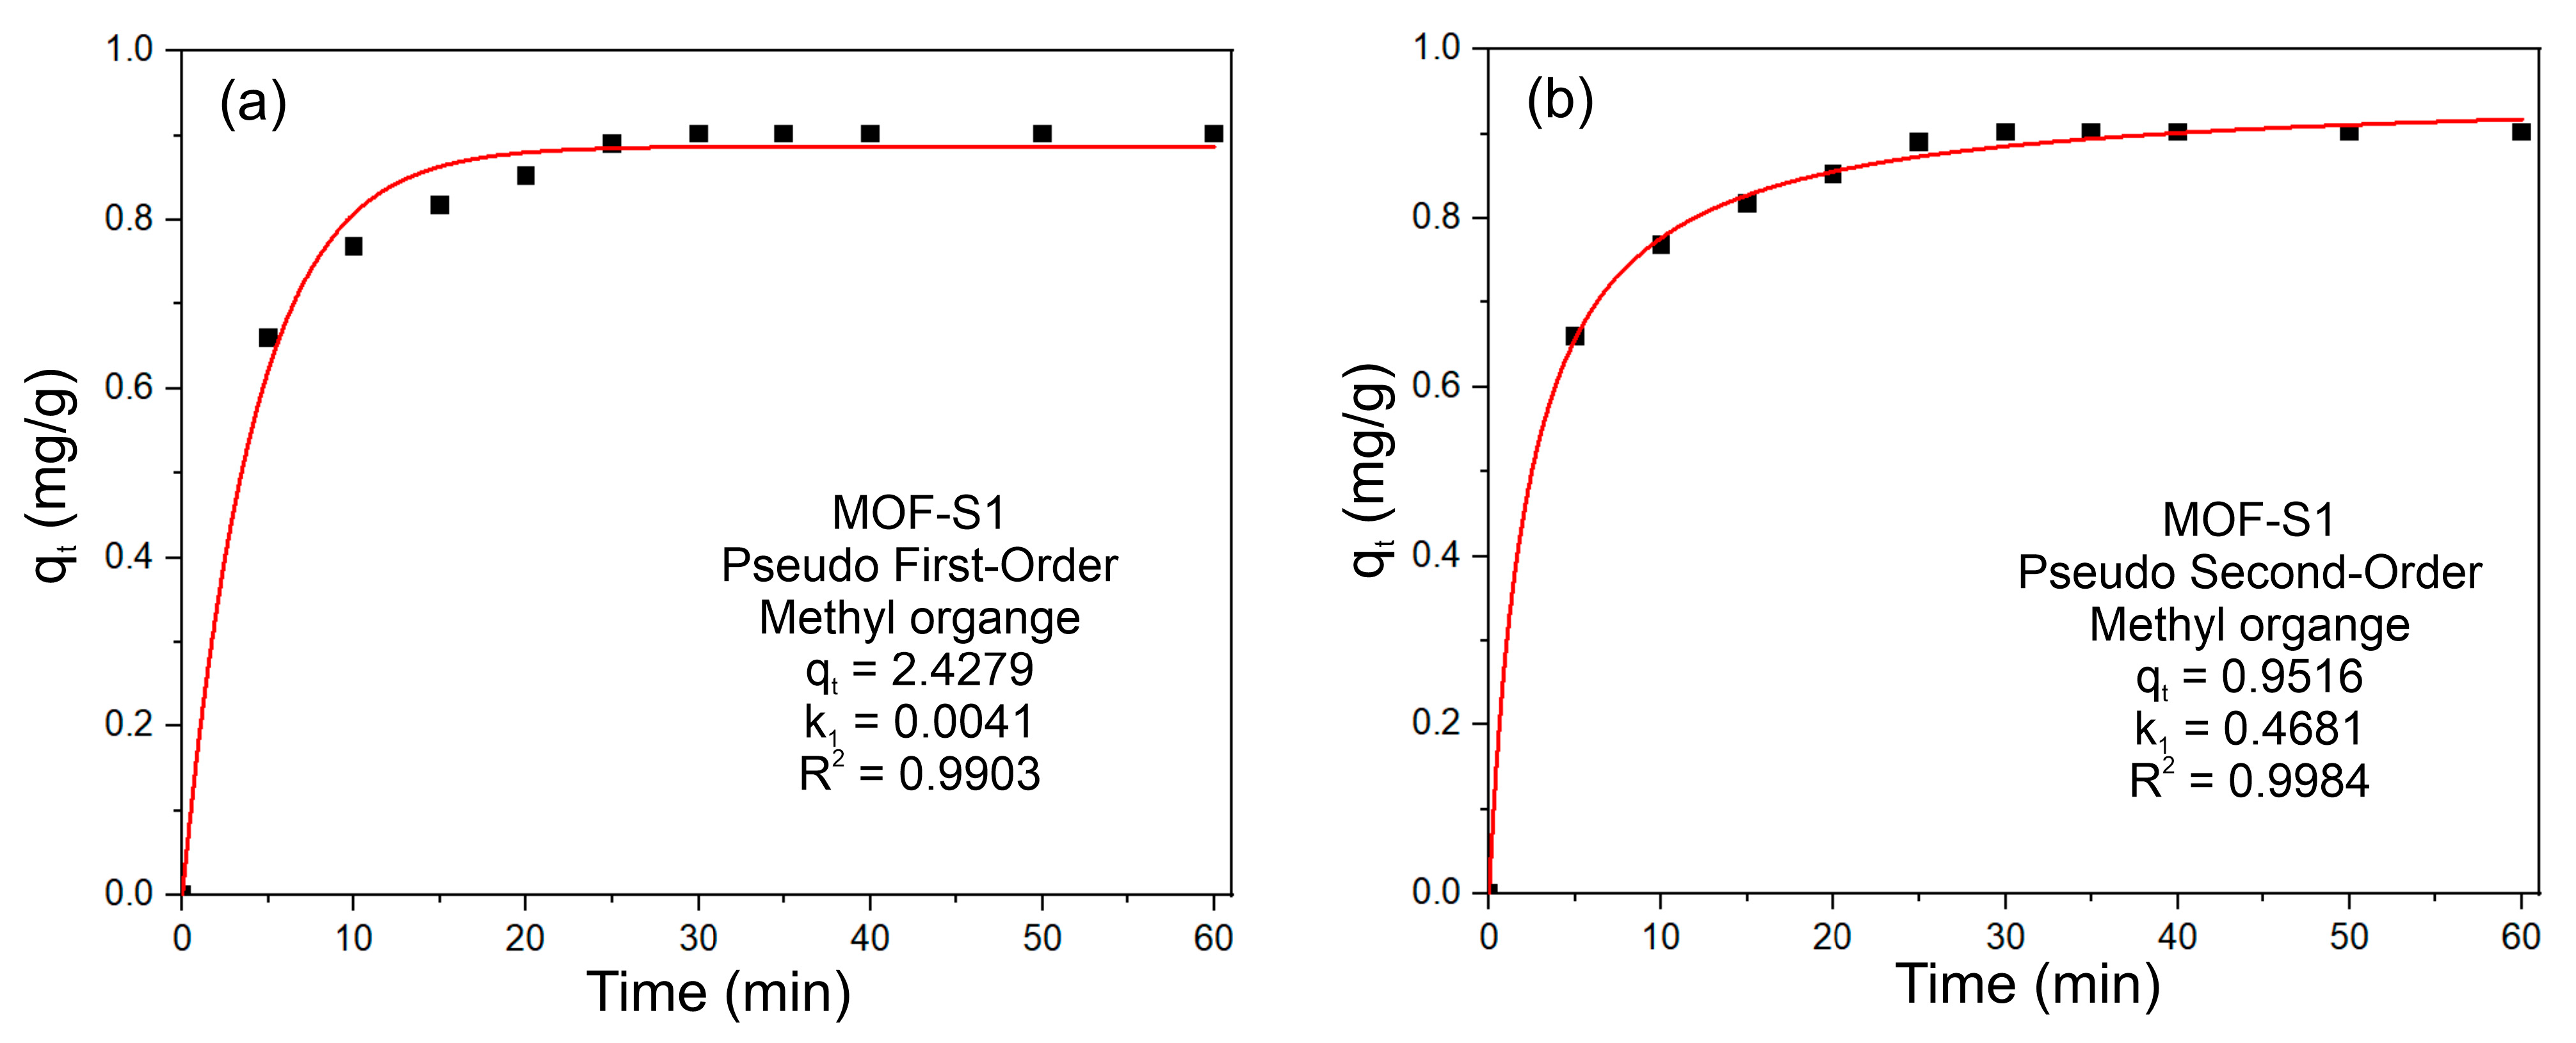
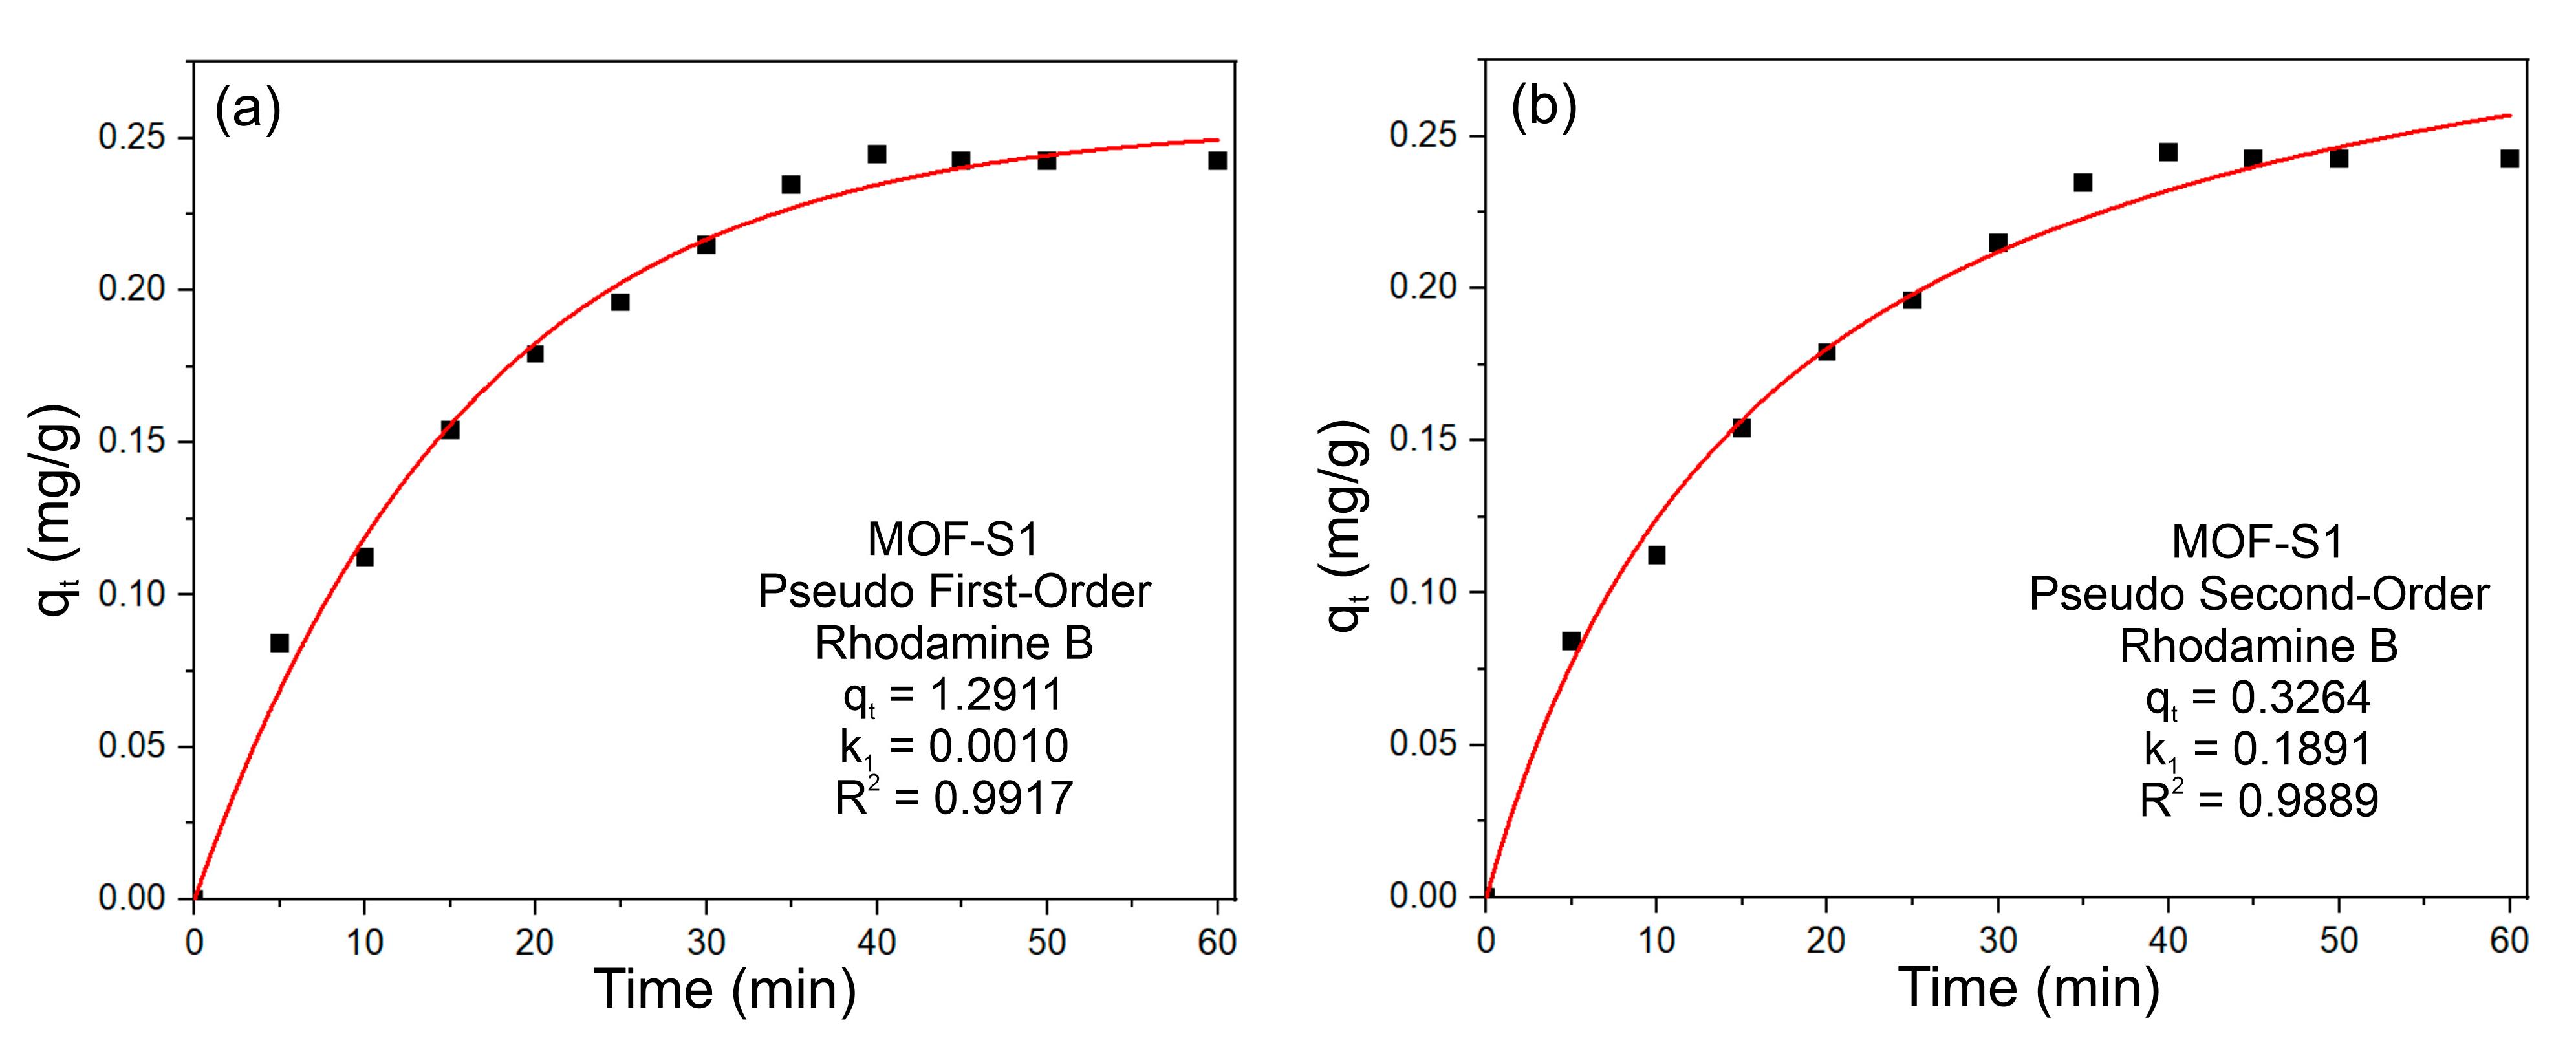
3.3. Adsorption Mechanism

The adsorption mechanism is associated with the process by which dye molecules bind to the surface of the adsorbent (in this case, MOF-S1). The adsorption rate depends on several factors, including the interaction between the adsorbent and the dye molecules, as well as the diffusion of the dye molecules to the active sites on the surface of the adsorbent.
As described, kinetic models were used to investigate the adsorption mechanism, providing information on the dynamics of the process. When using the pseudo-first-order and pseudo-second-order models, the primary goal is to determine which kinetic dependence best describes the adsorption process.
In the case of the pseudo-first-order (Figure 7) and pseudo-second-order models (Figure 8), graphs and equations [35,36] are used to calculate the kinetic constants, with the value of R2 indicating how well the model fits the experimental data. The formulae used for these models are as follows:
Pseudo-first–order
log q e q t = log q e K 1 2.303 t
where qe is the amount of adsorbed material at equilibrium, qt is the amount of adsorbed material at any given time t, and K1 is the kinetic constant of the pseudo-first-order model.
Pseudo-second-order
t q t = 1 k 2 q e 2 + t q e
where k2 is the kinetic constant of the pseudo-second-order model.
The pseudo-second-order model fit has the highest value of R2; we can conclude that the adsorption process is dominated by chemisorption, in which there is a chemical interaction between the dye molecules and the active sites on the surface of the adsorbent.
The results show that the model for Congo Red (R2 = 0.9882) and Methyl Orange (R2 = 0.9827) fit well, indicating the adsorption kinetics closely follow pseudo-first-order (PFO) behavior. The Methylene Blue (R2 = 0.9744) also shows a strong correlation with PFO. On the other hand, Rhodamine B has the lowest R2 of 0.8844), suggesting that the model fit may correspond to a different model (e.g., pseudo-second-order). Congo Red and Methyl Orange have relatively small K1 values, suggesting a slower adsorption process.
Methylene Blue shows a slightly higher K1 value, indicating faster adsorption kinetics. The qe values indicate the amount of dye adsorbed at equilibrium, with Methylene Blue showing a relatively lower qe compared to the other two dyes. The R2 values of the pseudo-second-order model fit are also very good—Congo Red (R2 = 0.9992), Methylene Blue (R2 = 0.9992), and Methyl Orange (R2 = 0.9680)—and, in the case of CR and MB, the values are better than the PFO. As for the PFO, the PSO model fit for Rhodamine B (R2 of 0.6978) is far from acceptable. This suggests Rhodamine B may follow a different kinetic model (e.g., intra-particle diffusion). Based on the model fit (e.g., PSO), we can conclude that the adsorption process is dominated by chemisorption, in which there is a chemical interaction between the dye molecules and the active sites on the surface of the MOF-S1 adsorbent. Thus, the limiting step would be the adsorption capacity of the MOF-S1.

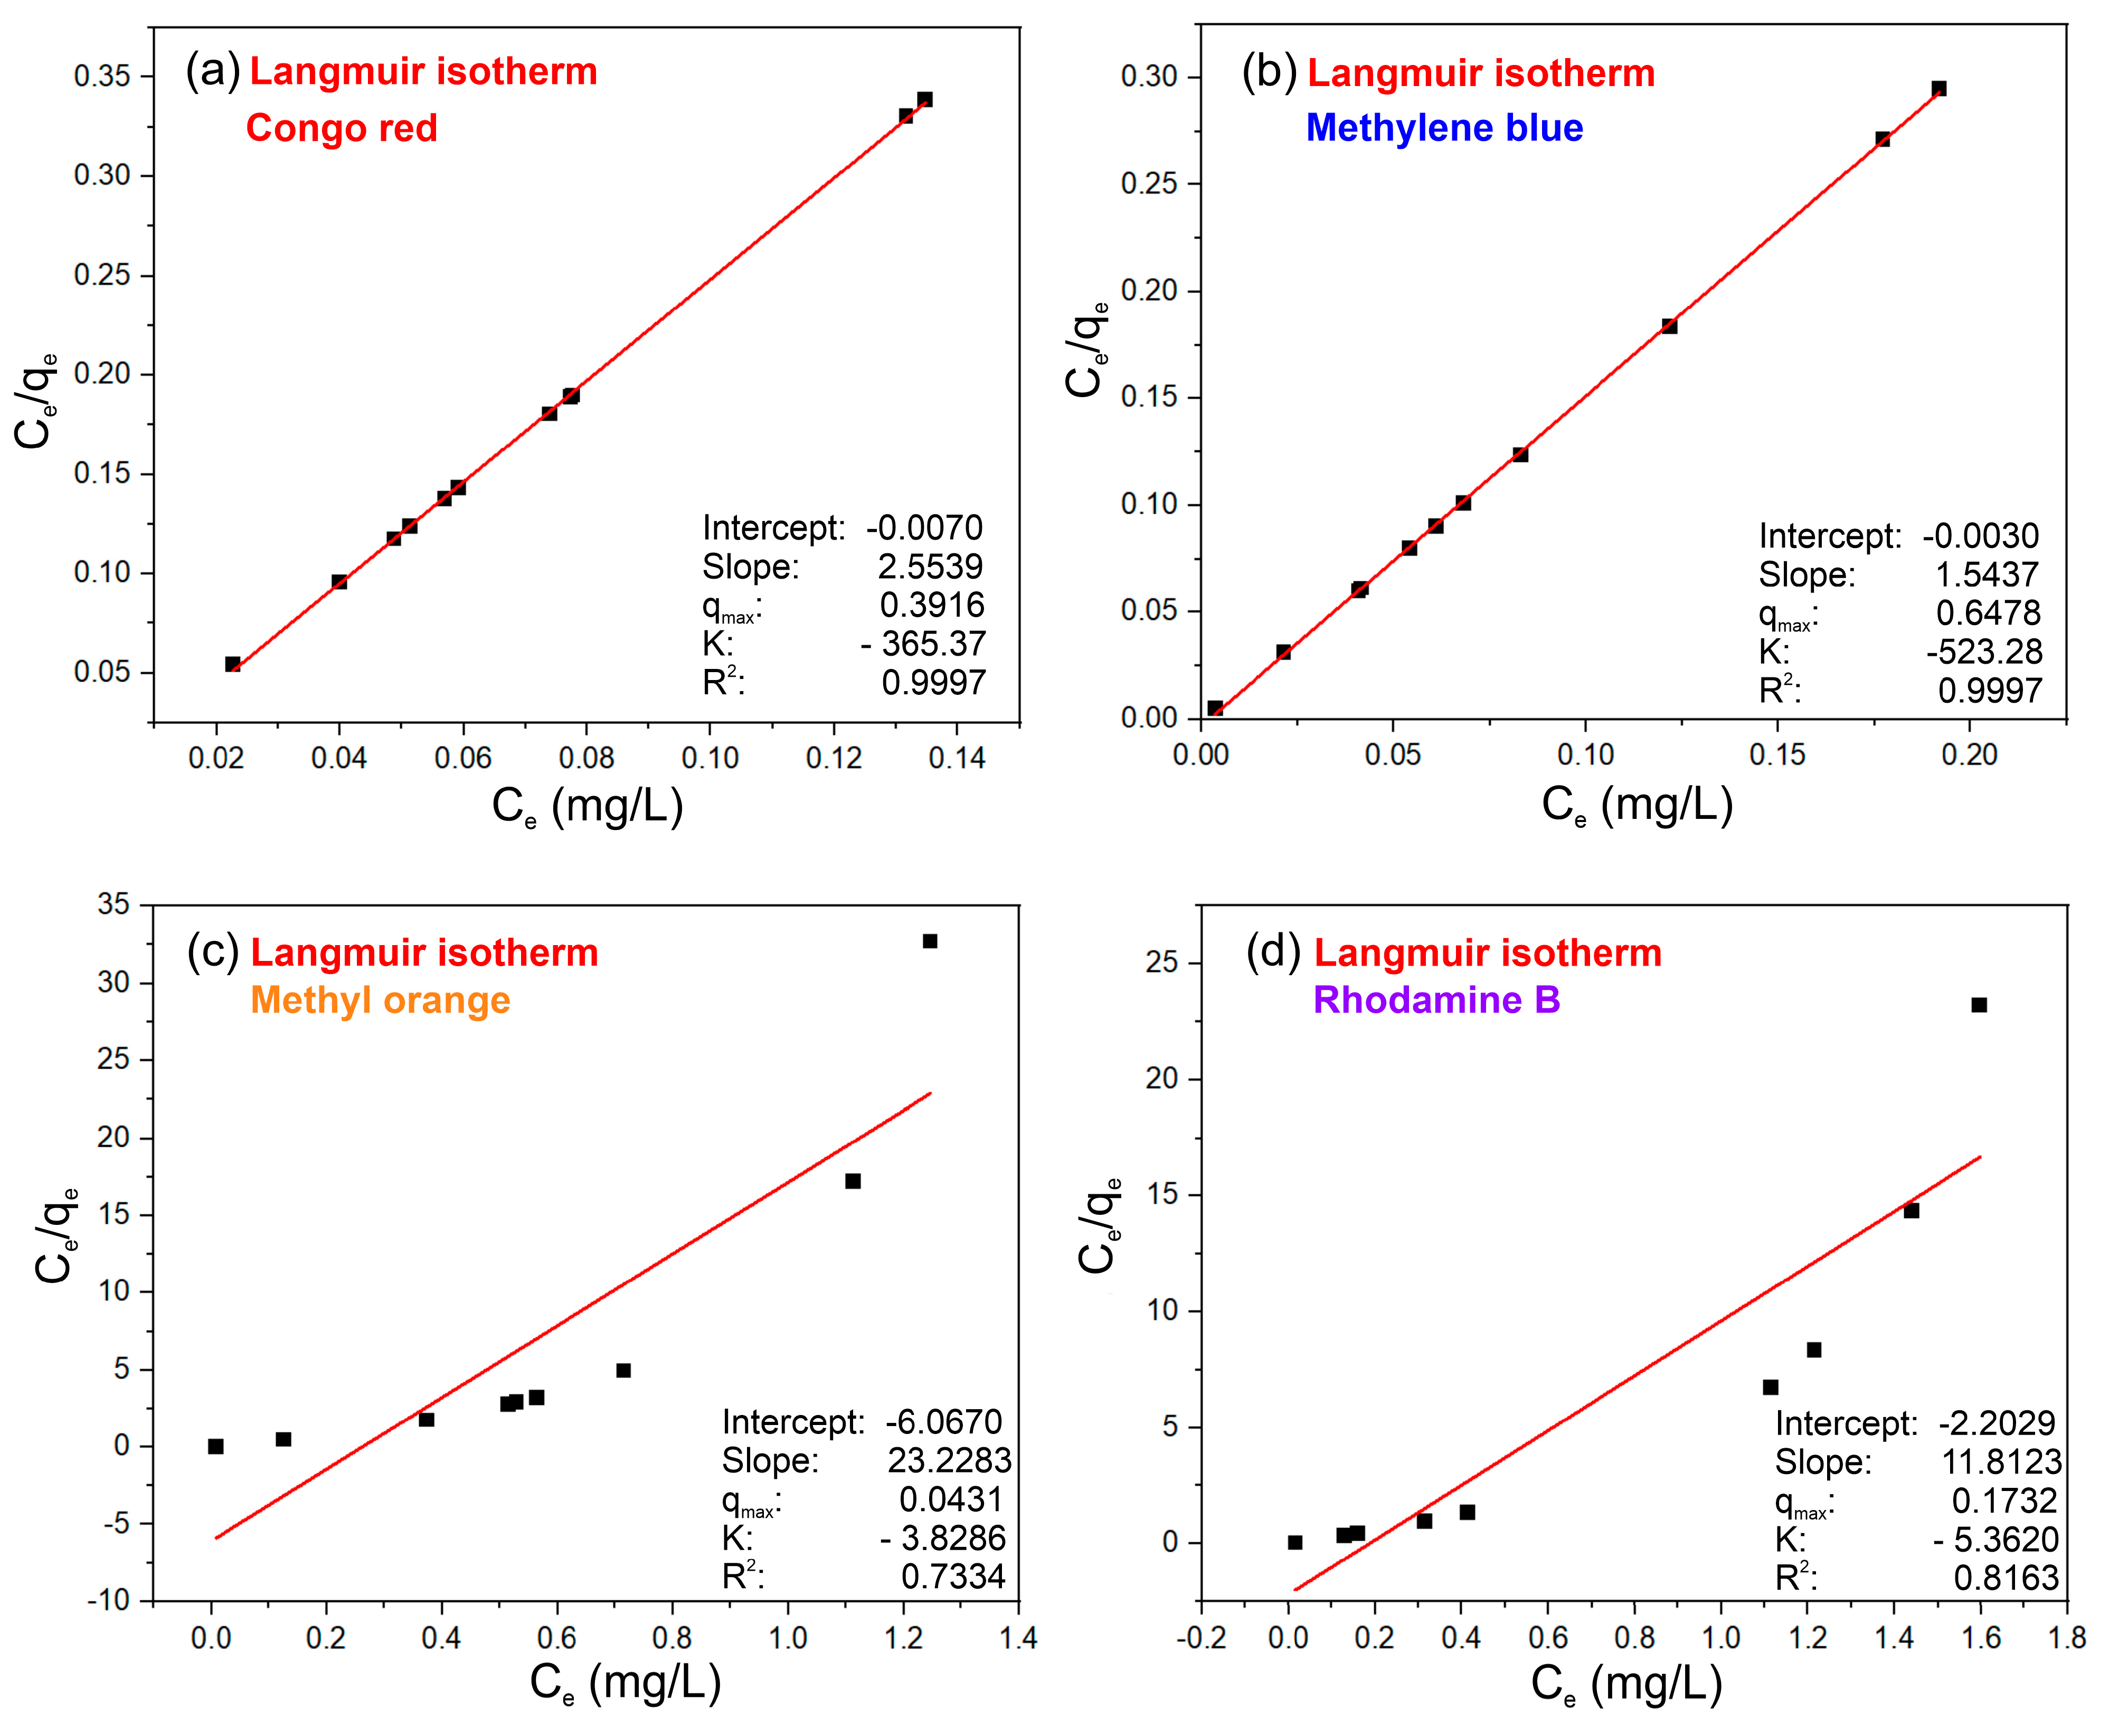
3.4. Adsorption Isotherms

The adsorption equilibria are usually described by adsorption isotherms. Here, we used the Langmuir, Freundlich, and Temkin models [37]. The calculated Langmuir parameters (KL and qmax), Freundlich parameters (Kf and 1/n), and Temkin parameters (AT and B) are presented in Figure 9, Figures S1 and S2.
The analysis of the Langmuir model shows a high R2 value (>0.99) for Congo Red and Methylene Blue, indicating that the Langmuir model is the most suitable for them. However, the Langmuir model does not describe well the adsorption of Methyl Orange (R2 = 0.7334) and Rhodamine B (R2 = 0.8163). The Freundlich model shows that Congo Red has an R2 value of 0.9027, however, lower compared to Langmuir model. Methyl Orange, Methylene Blue, and Rhodamine B have R2 values are below 0.7, making the Freundlich model inappropriate for them. The analysis of the Temkin model fits is similar to the Freundlich as it provides R2 values below 0.74. Comparing the three models, the Langmuir one provides a definitive answer for CR and MB. Regarding MO and RhB, all three tested models suggest possible interactions between the adsorbed molecules, but no definitive conclusion can be drawn.

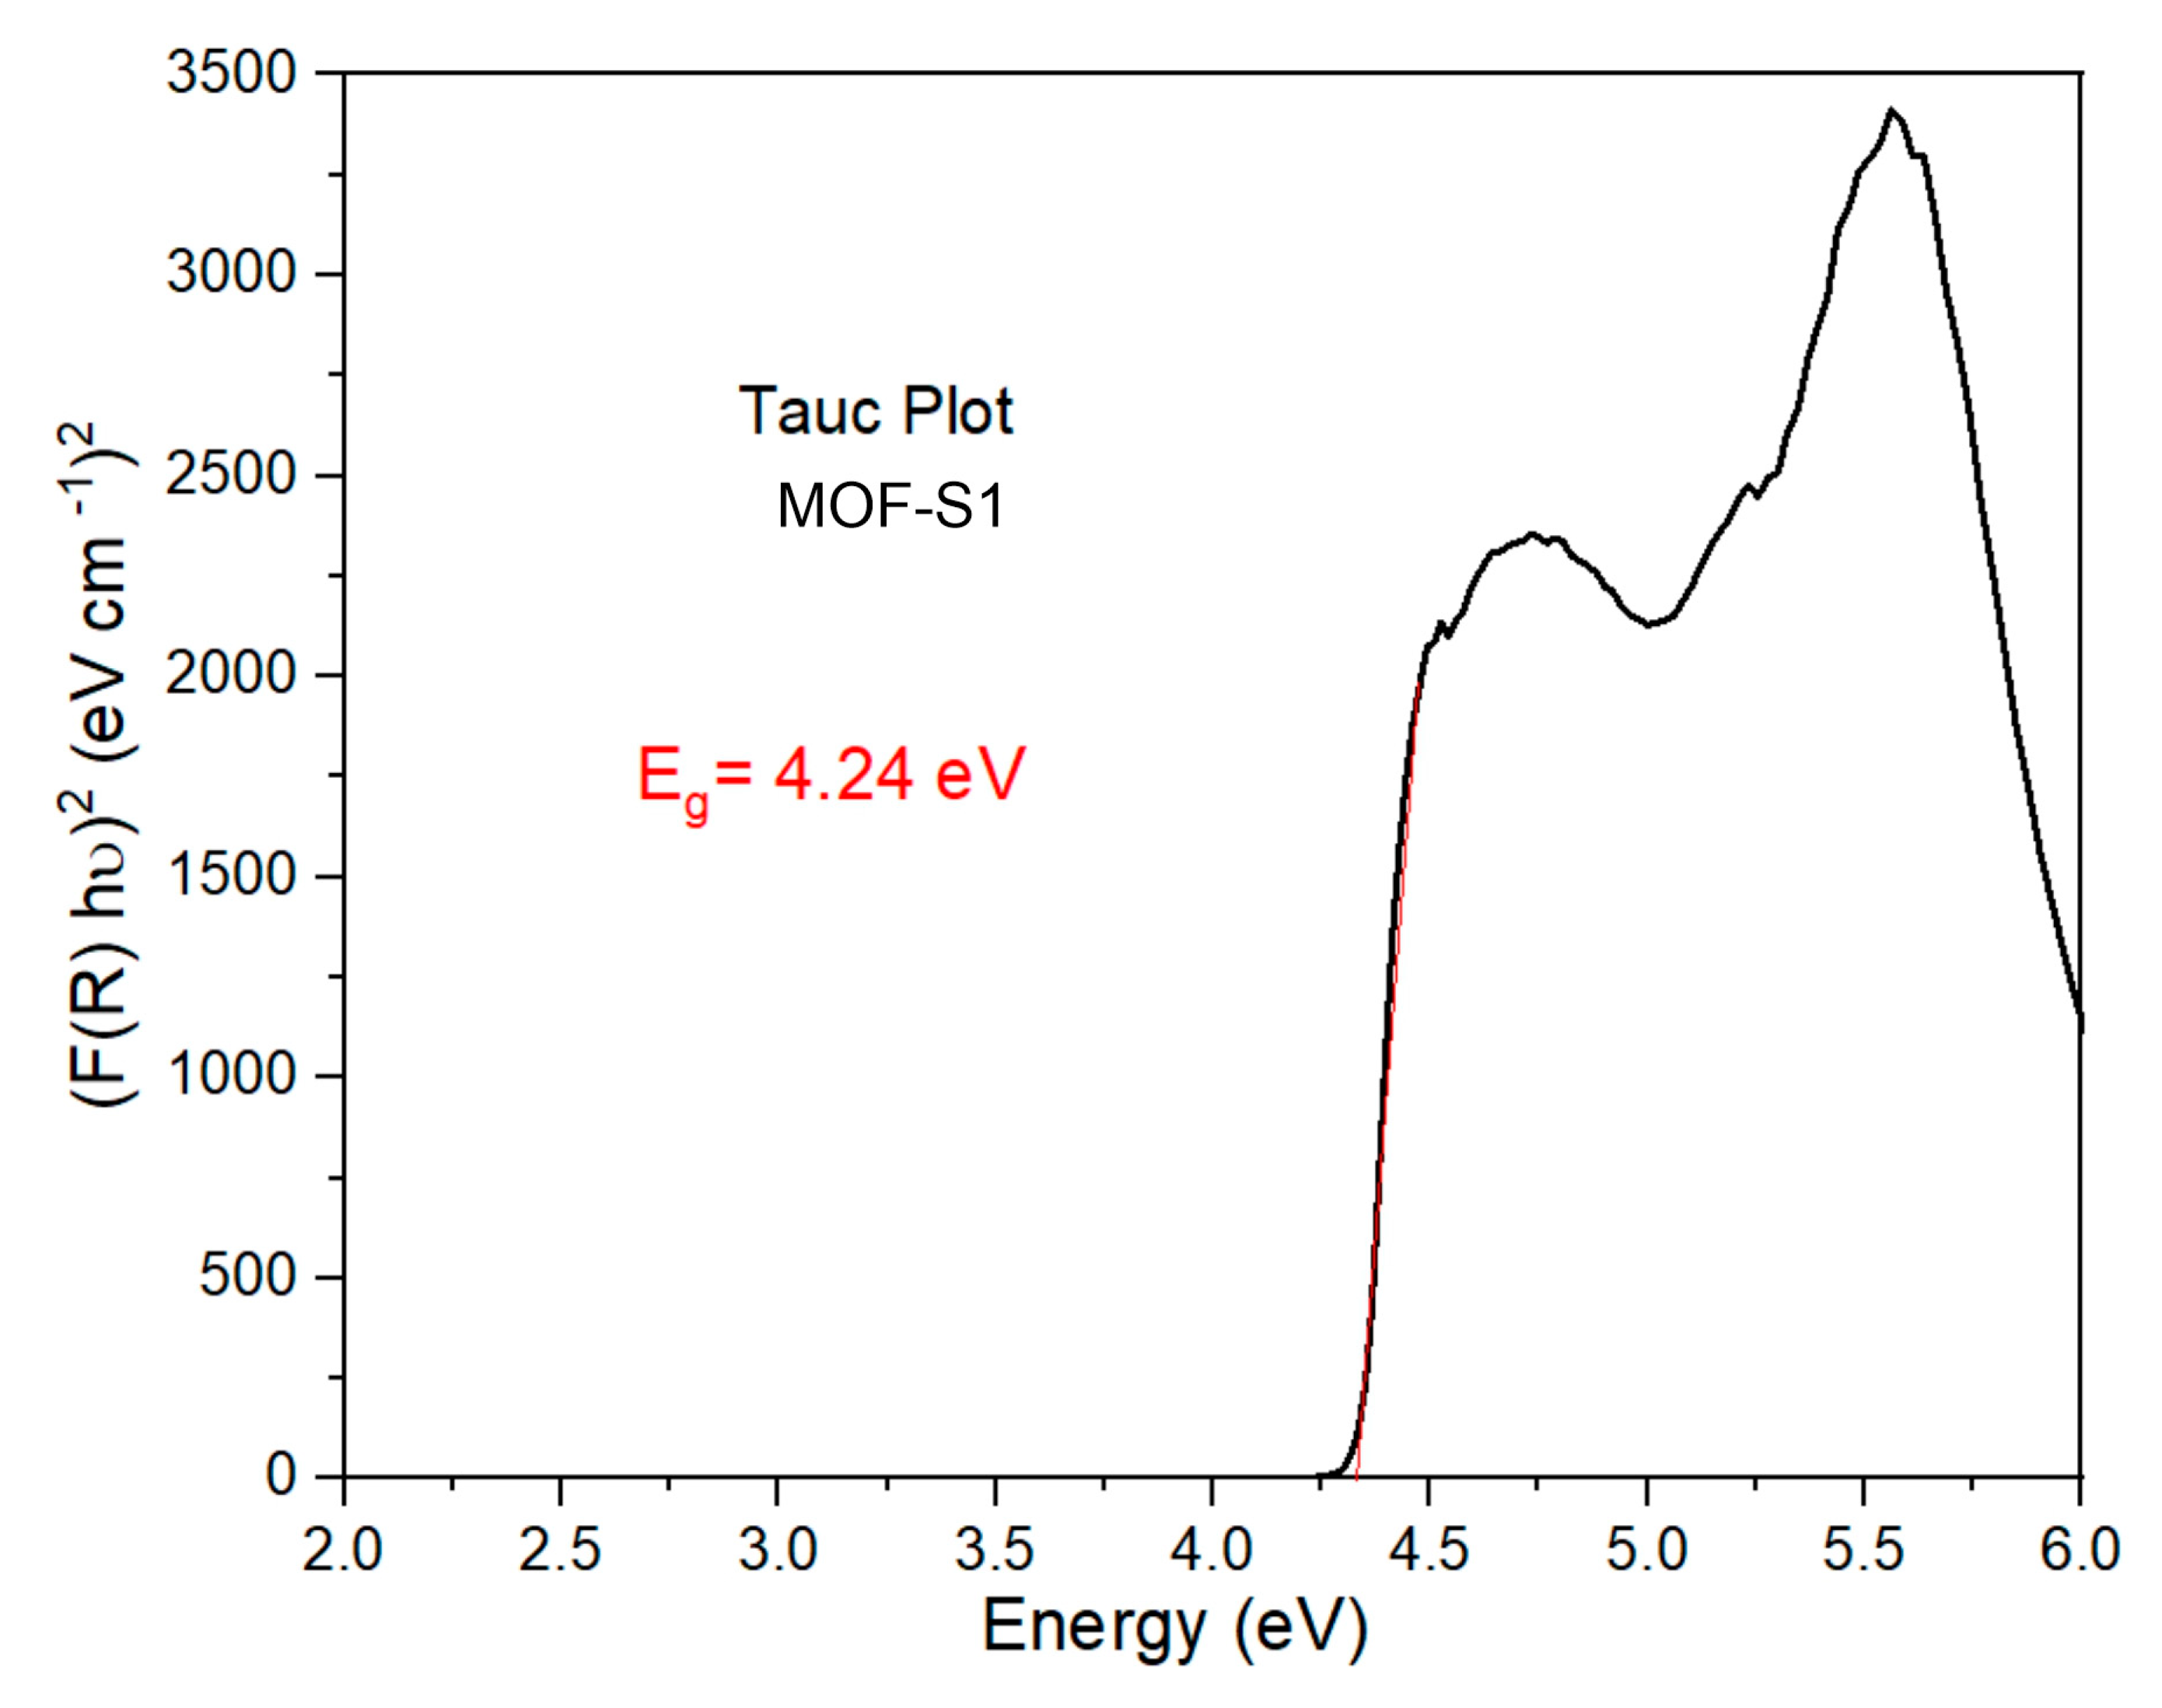
3.5. Determination of the Energy Band Gap

Diffused reflectance spectroscopy (DRS) was used to determine the bandgap of MOF-S1. The bandgap is calculated from the diffused reflectance spectrum using the Kubelka–Munk theory [38] using the following equation:
F R = ( 1 R ) 2 / 2 R
The graph is plotted between on the x-axis and [F(R)]2 on the y-axis by extrapolating the linear fitted region on the x-axis (Figure 10). The calculated band gap of 4.24 eV suggests that MOF-S1 is a wide-bandgap material, meaning it has strong insulating or semiconducting properties. Such a high band gap (~292 nm) indicates that MOF-S1 does not absorb visible light efficiently but may be useful for UV-light-related applications requiring high-energy photons, such as UV absorption, UV-photocatalysis, or optoelectronic devices.

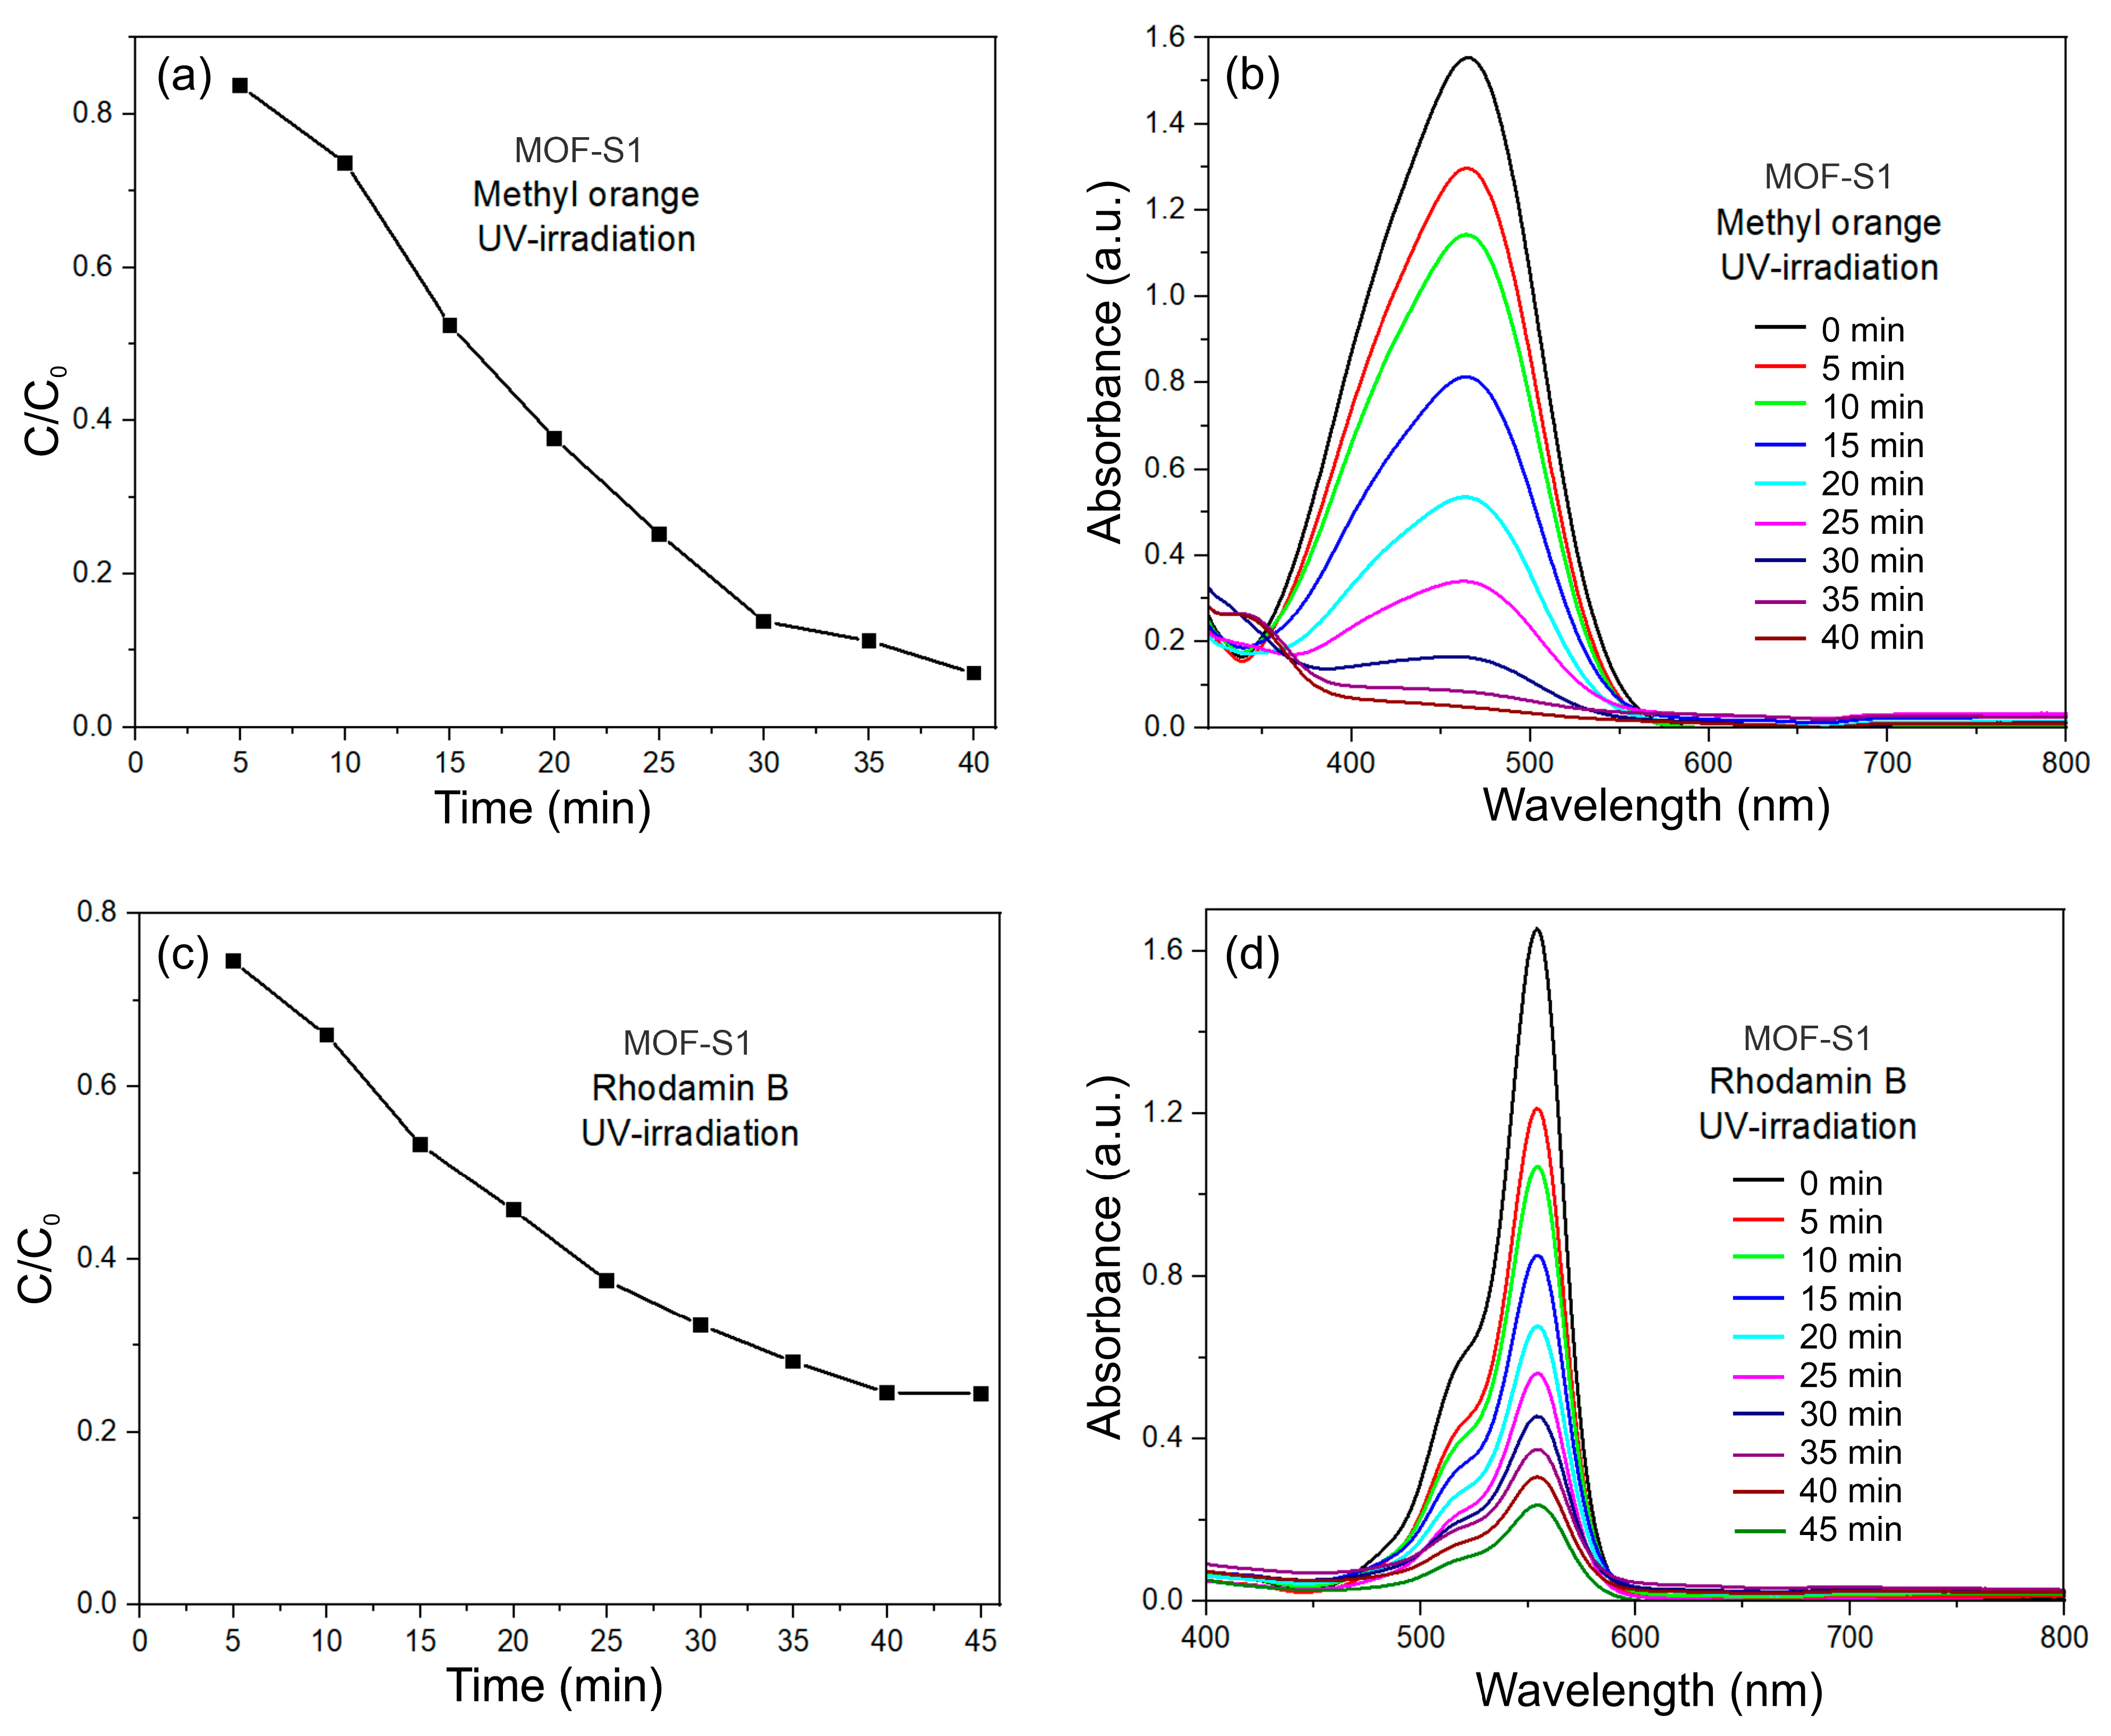
3.6. Photodegradation Studies of MO and RhB

The synthesized material was tested for its efficiency in the photodegradation of the dyes Methyl orange (MO) and Rhodamine B (RhB). The photocatalytic conversion of MO and RhB using the MOF-S1 sample as a catalyst was performed in aqueous media and under UV irradiation (λ > 300 nm). The color and absorbance of the MO and RhB dye solutions gradually decreased in the presence of an MOF-S1 (photocatalyst) and UV irradiation. Figure 11a,d show that MOF-S1 achieves a photodegradation efficiency for MO of ~93%, while the efficiency for RhB is about ~74% (Figure 11c,d).
The kinetics of the photodegradation process were studied using non-linear pseudo-first-order and pseudo-second-order models. The selection of those models was made following Tan and Hameed’s [36] suggestion that non-linear modeling is the better technique compared to linear regression as it provides more realistic kinetic parameters. Compared to the linear PFO and PSO, the advantage of non-linear modeling is the use of a single fitting parameter—the predefined objective (OF) [35,36], thus facilitating the estimation of the model parameters. The drawback of the non-linear modeling is the requirement and prior knowledge of qt, which makes these models unsuitable for modeling photodegradation systems below equilibrium. The results for the photodegradation of MO and RhB using MOF-S1 non-linear PFO and PSO are shown in Figure 12 and Figure 13.
For both dyes, the kinetics of the photodegradation process fits both non-linear PFO and PSO well with R2 values of 0.9903 vs. 0.9984 and 0.9917 and 0.9889 for MO and RhB, respectively. In the case of MO, the non-linear PSO fits slightly better, while, for RhB, the non-linear PFO provides a better fit. Having in mind high values of R2, the suggestion is that both chemosorption (involves valency forces, electron sharing, or covalent bonding, PSO) and physisorption (involves weak Van der Waals forces and hydrogen bond etc., PFO) are involved with a preference of one or the other in the function of the interaction of the surface functional groups of MOF-S1 with the dye (MO or RhB). The rate-determining step may be diffusion-controlled or chemical interaction.
To contextualize the photocatalytic efficacy of MOF-S1, specifically its degradation efficiency towards Methyl orange and Rhodamine B, the subject was compared with various MOFs reported in recent literature [39,40,41,42,43,44,45,46,47,48,49,50,51,52,53,54,55,56,57] (Table 4). MOF-S1 demonstrates high photocatalytic activity, achieving efficiencies comparable or superior to other UV-active MOFs, indicating its promising potential for dye degradation applications.

4. Conclusions

In this work, a novel metal–organic framework (MOF-S1) was successfully synthesized via a solvothermal route using 2,4,6-tris-(4-carboxyphenoxy)-1,3,5-triazine (TCPT) and zinc nitrate hexahydrate. Structural characterization by single-crystal and powder X-ray diffraction confirmed that MOF-S1 crystallizes in the trigonal space group P-31c, exhibiting a two-fold interpenetrated three-dimensional framework with a distinctive paddle-wheel secondary building unit. A surface analysis revealed that MOF-S1 is an ultramicroporous material with a high Langmuir surface area of 711 m2/g, a median pore width of approximately 6.5 Å, and significant micropore volume (~0.25 cm3/g), which favor strong adsorption interactions.
The adsorption performance of MOF-S1 was evaluated using four dye molecules (Congo Red, Methylene Blue, Methyl Orange, and Rhodamine B). The rapid initial uptake, combined with kinetic studies, suggests that the adsorption process is predominantly governed by chemisorption. Furthermore, photocatalytic experiments under UV irradiation demonstrated that MOF-S1 efficiently degrades dyes, achieving degradation efficiencies of ~93% for Methyl Orange and ~74% for Rhodamine B. A complementary diffuse reflectance spectroscopy analysis indicated a wide band gap of 4.24 eV, highlighting its potential in UV-driven applications.
Collectively, these results establish MOF-S1 as a promising candidate for wastewater treatment and UV-related photodegradation applications, warranting further investigation into its scalability and long-term operational stability. Future research may focus on the scale-up synthesis of MOF-S1—to assess its practical and economic viability for industrial applications (wastewater treatment). Another area includes the exploration of modifications of the TCPT ligand. A change in the metal center or a combination of metal ions could further enhance the selective adsorption and catalytic capabilities (reducing Eg). If the scale-up synthesis of MOF-S1 is successful, the investigating of the material’s long-term stability under varied environmental conditions is a must. Finally, producing composite materials with MOF-S1, e.g., (polymer) membranes, presents an exciting avenue to maximize its efficiency and broaden its scope of applications in environmental remediation.

Supplementary Materials

The following supporting information can be downloaded at: https://www.mdpi.com/article/10.3390/cryst15040348/s1, Figure S1: Freundlich adsorption isotherms for (a) Congo Red, (b) Methylene Blue, (c) Methyl Orange, and (d) Rhodamine B on MOF-S1; Figure S2: Temkin adsorption isotherms for (a) Congo Red, (b) Methylene Blue, (c) Methyl Orange, and (d) Rhodamine B on MOF-S1; File S1: checkCIF/PLATON report.

Author Contributions

Conceptualization, B.S. and V.K.; methodology, B.S., V.K. and M.A.; investigation, R.N., V.K., H.L., R.R. and M.A.; writing—original draft preparation, M.A., B.S., V.K., H.L. and R.R.; writing—review and editing, R.R., B.S., R.N. and V.K.; visualization, R.N., B.S., H.L. and R.R.; supervision, V.K., B.S. and R.N.; project administration, V.K. and B.S.; funding acquisition, V.K. and B.S. All authors have read and agreed to the published version of the manuscript.

Funding

This research was funded by the Bulgarian National Science Fund (BNSF), grant number KP-06-COST/3 and KP-06-COST/2.

Data Availability Statement

Data are contained within the article and Supplementary Materials.

Acknowledgments

The authors acknowledge the technical support from the project BG16RFPR002-1.014-0007, “Center for Competence PERIMED-2” and BG16RFPR002-1.014-0006 “National Centre of Excellence Mechatronics and Clean Technologies” (2024–2029).

Conflicts of Interest

The authors declare no conflicts of interest.

Abbreviations

The following abbreviations are used in this manuscript:
BETBrunauer–Emmett–Teller (method)
CRCongo Red
DMFDimethylformamide
DRDubinin–Radushkevich (model)
DRSDiffuse Reflectance Spectroscopy
DSCDifferential Scanning Calorimetry
HKHorváth–Kawazoe (method)
HMBCHeteronuclear Multiple Bond Correlation
HSQCHeteronuclear Single Quantum Correlation
MBMethylene Blue
MOMethyl Orange
NMRNuclear Magnetic Resonance
PFOPseudo-first-order (model)
PSOPseudo-second-order (model)
PXRDPowder X-ray Diffraction
RhBRhodamine B
SBUsSecondary Building Units
SCXRDSingle-Crystal X-ray Diffraction
SSASpecific Surface Area
TCPT2,4,6-Tris-(4-carboxyphenoxy)-1,3,5-triazine
TGAThermogravimetric Analysis
UVUltraviolet
Visvisible

References

  1. Ling, H.; Tian, B.; Hu, X.; Wang, W.; Zhang, J.; Liu, R.; Lu, Z.; Guo, Y.; Zhao, H. Applications of Metal–Organic Frameworks and Their Derivatives in Fuel Cells. Molecules 2025, 30, 981. [Google Scholar] [CrossRef] [PubMed]
  2. Kapoor, R.T.; Mohd, R. Chapter 20—Recent Advances in Application of Metal Organic Frameworks for Adsorption of Dye from Wastewater. In Engineered Biocomposites for Dye Adsorption; Jagaba, A.H., Kutty, S.R.M., Isa, M.H., Birniwa, A.H., Eds.; Elsevier: Amsterdam, The Netherlands, 2025. [Google Scholar] [CrossRef]
  3. Laeim, H.; Molahalli, V.; Prajongthat, P.; Pattanaporkratana, A.; Pathak, G.; Phettong, B.; Hongkarnjanakul, N.; Chattham, N. Porosity Tunable Metal-Organic Framework (Mof)-Based Composites for Energy Storage Applications: Recent Progress. Polymers 2025, 17, 130. [Google Scholar] [CrossRef]
  4. Zhu, Q.; Sun, W.; Zhou, H.; Mao, D. A Review of Lithium–Sulfur Batteries Based on Metal–Organic Frameworks: Progress and Prospects. Batteries 2025, 11, 89. [Google Scholar] [CrossRef]
  5. Liang, Y.; Zhu, J.-Z.; Jin, S.-Y.; Meng, Y.-R.; Li, S.-F.; Zuo, J.-L.; Zhang, G.; Su, J. X-Ray Luminescent Metal-Organic Frameworks: Design Strategies and Functional Applications. J. Mater. Chem. C 2025, 13, 4836–4860. [Google Scholar]
  6. Han, Z.; Yang, Y.; Rushlow, J.; Huo, J.; Liu, Z.; Hsu, Y.-C.; Yin, R.; Wang, M.; Liang, R.; Wang, K.-Y. Development of the Design and Synthesis of Metal–Organic Frameworks (Mofs)–from Large Scale Attempts, Functional Oriented Modifications, to Artificial Intelligence (Ai) Predictions. Chem. Soc. Rev. 2025, 54, 367–395. [Google Scholar]
  7. Rapeyko, A.; i Xamena, F.X.L. Zirconium-Containing Metal–Organic Frameworks (Mofs) as Catalysts for Biomass Conversion. Appl. Sci. 2025, 15, 2609. [Google Scholar] [CrossRef]
  8. Liu, M.; Wang, Y.F.; Xu, F.; Zhang, N.; Hou, C.Y.; Sun, L.X.; Xing, Y.H.; Bai, F.Y. High-Symmetry Co/Ni Triazine Polycarboxylate Diverse Frameworks Constructed by M X (Coo) Y Building Blocks: Characterization and Catalytic Performance Evaluation of P-Nitrophenol. Inorg. Chem. 2022, 61, 19951–19960. [Google Scholar]
  9. Zhao, J.; Zhang, Y.; Luo, Y.; Zheng, W.; Xu, X.; Luo, F. Amorphous Metal–Organic Frameworks: Pioneering Frontiers in Cancer Diagnostics and Therapeutics. Chem. Eng. J. 2024, 492, 152295. [Google Scholar]
  10. Yu, L.; Ullah, S.; Wang, H.; Xia, Q.; Thonhauser, T.; Li, J. High-Capacity Splitting of Mono-and Dibranched Hexane Isomers by a Robust Zinc-Based Metal–Organic Framework. Angew. Chem. Int. Ed. 2022, 61, e202211359. [Google Scholar]
  11. Sheng, J.-G.; Tang, M.; Qin, Q.; Li, D.-Q.; Chen, W.-W. Two Co(II) Coordination Polymers: Treatment Activity on Non-Small Cell Lung Cancer by Inducing the Cancer Cell Apoptosis through High-Intensity Focused Ultrasound. J. Iran. Chem. Soc. 2021, 18, 2323–2330. [Google Scholar]
  12. Xiao, Y.; You, Z.X.; Xing, Y.H.; Bai, F.Y.; Shi, Z. Three-Pole Wheel Paddle Luminescent Metal Organic Frameworks (Lmofs) Based on the Oxygen Substituted Triazine Tricarboxylic Acid Ligand: Recognition and Detection of Small Drug Molecules and Aromatic Amine Molecules. Dalton Trans. 2022, 51, 9336–9347. [Google Scholar] [PubMed]
  13. Zhang, X.; Zhang, Y.-Z.; Zhang, D.-S.; Zhu, B.; Li, J.-R. A Hydrothermally Stable Zn(II)-Based Metal–Organic Framework: Structural Modulation and Gas Adsorption. Dalton Trans. 2015, 44, 15697–15702. [Google Scholar] [CrossRef]
  14. Park, H.J.; Suh, M.P. Enhanced Isosteric Heat, Selectivity, and Uptake Capacity of CO2 Adsorption in a Metal-Organic Framework by Impregnated Metal Ions. Chem. Sci. 2013, 4, 685–690. [Google Scholar] [CrossRef]
  15. Silva, A.R.; Alexandre, J.Y.; Souza, J.E.; Neto JG, L.; de Sousa Júnior, P.G.; Rocha, M.V.; Dos Santos, J.C. The Chemistry and Applications of Metal–Organic Frameworks (Mofs) as Industrial Enzyme Immobilization Systems. Molecules 2022, 27, 4529. [Google Scholar] [CrossRef] [PubMed]
  16. Yuan, S.; Feng, L.; Wang, K.; Pang, J.; Bosch, M.; Lollar, C.; Sun, Y.; Qin, J.; Yang, X.; Zhang, P. Stable Metal–Organic Frameworks: Design, Synthesis, and Applications. Adv. Mater. 2018, 30, 1704303. [Google Scholar]
  17. Tang, C.; Li, X.; Hu, Y.; Du, X.; Wang, S.; Chen, B.; Wang, S. Porphyrin-Based Metal-Organic Framework Materials: Design, Construction, and Application in the Field of Photocatalysis. Molecules 2024, 29, 467. [Google Scholar] [CrossRef]
  18. Gandara-Loe, J.; Pastor-Perez, L.; Bobadilla, L.F.; Odriozola, J.A.; Reina, T.R. Understanding the Opportunities of Metal–Organic Frameworks (Mofs) for CO2 Capture and Gas-Phase CO2 Conversion Processes: A Comprehensive Overview. React. Chem. Eng. 2021, 6, 787–814. [Google Scholar] [CrossRef]
  19. Freund, R.; Zaremba, O.; Arnauts, G.; Ameloot, R.; Skorupskii, G.; Dincă, M.; Bavykina, A.; Gascon, J.; Ejsmont, A.; Goscianska, J.; et al. The Current Status of Mof and Cof Applications. Angew. Chem. Int. Ed. 2021, 60, 23975–24001. [Google Scholar] [CrossRef]
  20. Mahmoud, E. Evolution of the Design of Ch4 Adsorbents. Surfaces 2020, 3, 433–466. [Google Scholar] [CrossRef]
  21. Gorbounov, M.; Halloran, P.; Soltani, S.M. Hydrophobic and Hydrophilic Functional Groups and Their Impact on Physical Adsorption of CO2 in Presence of H2O: A Critical Review. J. CO2 Util. 2024, 86, 102908. [Google Scholar] [CrossRef]
  22. Kalhor, S.; Sepehrmansourie, H.; Zarei, M.; Zolfigol, M.A.; Shi, H. Application of Functionalized Zn-Based Metal–Organic Frameworks (Zn-Mofs) with Cuo in Heterocycle Synthesis Via Azide–Alkyne Cycloaddition. Inorg. Chem. 2024, 63, 4898–4914. [Google Scholar] [CrossRef] [PubMed]
  23. Lin, Z.-J.; Lü, J.; Hong, M.; Cao, R. Metal–Organic Frameworks Based on Flexible Ligands (Fl-Mofs): Structures and Applications. Chem. Soc. Rev. 2014, 43, 5867–5895. [Google Scholar]
  24. ZareKarizi, F.; Joharian, M.; Morsali, A. Pillar-Layered Mofs: Functionality, Interpenetration, Flexibility and Applications. J. Mater. Chem. A 2018, 6, 19288–19329. [Google Scholar]
  25. Sheldrick, G.M. A Short History of Shelx. Found. Crystallogr. 2008, 64, 112–122. [Google Scholar] [CrossRef]
  26. Sheldrick, G.M. Crystal Structure Refinement with Shelxl. Cryst. Struct. Commun. 2015, 71, 3–8. [Google Scholar]
  27. De Lange, M.F.; Lin, L.C.; Gascon, J.; Vlugt, T.J.; Kapteijn, F. Assessing the Surface Area of Porous Solids: Limitations, Probe Molecules, and Methods. Langmuir 2016, 32, 12664–12675. [Google Scholar]
  28. Dombrowski, R.J.; Lastoskie, C.M.; Hyduke, D.R. The Horvath–Kawazoe Method Revisited. Colloids Surf. A Physicochem. Eng. Asp. 2001, 187, 23–39. [Google Scholar]
  29. Nguyen, C.; Do, D. The Dubinin–Radushkevich Equation and the Underlying Microscopic Adsorption Description. Carbon 2001, 39, 1327–1336. [Google Scholar]
  30. Zhao, H.; Ni, J.; Zhang, J.-J.; Liu, S.-Q.; Sun, Y.-J.; Zhou, H.; Li, Y.-Q.; Duan, C.-Y. A Trichromatic Mof Composite for Multidimensional Ratiometric Luminescent Sensing. Chem. Sci. 2018, 9, 2918–2926. [Google Scholar]
  31. Walton, K.S.; Snurr, R.Q. Applicability of the Bet Method for Determining Surface Areas of Microporous Metal− Organic Frameworks. J. Am. Chem. Soc. 2007, 129, 8552–8556. [Google Scholar]
  32. Boer, J.H. Studies on Pore Systems in Catalysts: V. The T Method. J. Catal. 1964, 4, 319–323. [Google Scholar]
  33. Rouquerol, J.; Llewellyn, P.; Rouquerol, F.J.S.C. Is the Bet Equation Applicable to Microporous Adsorbents? In Studies in Surface Science and Catalysis; Elsevier: Amsterdam, The Netherlands, 2007; pp. 49–56. [Google Scholar]
  34. Jura, G.; Harkins, W.D. Surfaces of Solids. Xi. Determination of the Decrease (Π) of Free Surface Energy of a Solid by an Adsorbed Film. J. Am. Chem. Soc. 1944, 66, 1356–1362. [Google Scholar]
  35. Revellame, E.D.; Fortela, D.L.; Sharp, W.; Hernandez, R.; Zappi, M.E. Adsorption Kinetic Modeling Using Pseudo-First Order and Pseudo-Second Order Rate Laws: A Review. Clean. Eng. Technol. 2020, 1, 100032. [Google Scholar] [CrossRef]
  36. Tan, K.L.; Hameed, B.H. Insight into the Adsorption Kinetics Models for the Removal of Contaminants from Aqueous Solutions. J. Taiwan Inst. Chem. Eng. 2017, 74, 25–48. [Google Scholar]
  37. Murphy, O.P.; Vashishtha, M.; Palanisamy, P.; Kumar, K.V. A Review on the Adsorption Isotherms and Design Calculations for the Optimization of Adsorbent Mass and Contact Time. ACS Omega 2023, 8, 17407–17430. [Google Scholar] [CrossRef]
  38. Myrick, M.L.; Simcock, M.N.; Baranowski, M.; Brooke, H.; Morgan, S.L.; McCutcheon, J.N. The Kubelka-Munk Diffuse Reflectance Formula Revisited. Appl. Spectrosc. Rev. 2011, 46, 140–165. [Google Scholar] [CrossRef]
  39. Wang, C.C.; Zhang, Y.Q.; Zhu, T.; Wang, P.; Gao, S.J. Photocatalytic Degradation of Methylene Blue and Methyl Orange in a Zn(II)-Based Metal–Organic Framework. Desalination Water Treat. 2016, 57, 17844–17851. [Google Scholar]
  40. Thi, Q.V.; Tamboli, M.S.; Ta, Q.T.H.; Kolekar, G.B.; Sohn, D. A Nanostructured Mof/Reduced Graphene Oxide Hybrid for Enhanced Photocatalytic Efficiency under Solar Light. Mater. Sci. Eng. B 2020, 261, 114678. [Google Scholar]
  41. Liu, N.; Jing, C.; Li, Z.; Huang, W.; Gao, B.; You, F.; Zhang, X. Effect of Synthesis Conditions on the Photocatalytic Degradation of Rhodamine B of Mil-53 (Fe). Mater. Lett. 2019, 237, 92–95. [Google Scholar]
  42. Pu, S.; Xu, L.; Sun, L.; Du, H. Tuning the Optical Properties of the Zirconium–Uio-66 Metal–Organic Framework for Photocatalytic Degradation of Methyl Orange. Inorg. Chem. Commun. 2015, 52, 50–52. [Google Scholar]
  43. Qian, L.-L.; Wang, Z.-X.; Tian, H.-X.; Li, M.; Li, B.-L.; Li, H.-Y. Synthesis, Structure and Photocatalytic Degradation of Organic Dyes of a Copper (II) Metal–Organic Framework (Cu–Mof) with a 4-Coordinated Three-Dimensional Cdso4 Topology. Cryst. Struct. Commun. 2019, 75, 1053–1059. [Google Scholar]
  44. Wei, F.; Chen, D.; Liang, Z.; Zhao, S. Comparison Study on the Adsorption Capacity of Rhodamine B, Congo Red, and Orange II on Fe-Mofs. Nanomaterials 2018, 8, 248. [Google Scholar] [CrossRef] [PubMed]
  45. Lu, X.-Y.; Zhang, M.-L.; Ren, Y.-X.; Wang, J.-J.; Yang, X.-G. Design of Co-Mof Nanosheets for Efficient Adsorption and Photocatalytic Degradation of Organic Dyes. J. Mol. Struct. 2023, 1288, 135796. [Google Scholar]
  46. Li, Y.; Gao, C.; Jiao, J.; Cui, J.; Li, Z.; Song, Q. Selective Adsorption of Metal–Organic Framework toward Methylene Blue: Behavior and Mechanism. ACS Omega 2021, 6, 33961–33968. [Google Scholar] [PubMed]
  47. Zhou, E.-H.; Li, B.-H.; Chen, W.-X.; Luo, Z.; Liu, J.; Singh, A.; Kumar, A.; Jin, J.-C. Photocatalytic Degradation of Organic Dyes by a Stable and Biocompatible Zn(II) Mof Having Ferulic Acid: Experimental Findings and Theoretical Correlation. J. Mol. Struct. 2017, 1149, 352–356. [Google Scholar]
  48. Kitchamsetti, N.; Chakra, C.S.; De Barros, A.L.; Kim, D. Development of Mof Based Recyclable Photocatalyst for the Removal of Different Organic Dye Pollutants. Nanomaterials 2023, 13, 336. [Google Scholar] [CrossRef]
  49. Abdollahi, B.; Farshnama, S.; Asl, E.A.; Najafidoust, A.; Sarani, M. Cu (Bdc) Metal–Organic Framework (Mof)-Based Ag2cro4 Heterostructure with Enhanced Solar-Light Degradation of Organic Dyes. Inorg. Chem. Commun. 2022, 138, 109236. [Google Scholar]
  50. Zhang, X.; Wang, L.-J.; Han, Z.; Meng, X.; Wang, H.-N.; Zhou, Z.-Y.; Su, Z.-M. Degradation of Azo Dyes under Visible Light with Stable Mof Based on Tetrastyrene Imidazole Ligand. Dalton Trans. 2020, 49, 4352–4357. [Google Scholar]
  51. Zhang, C.; Ma, D.; Zhang, X.; Ma, J.; Liu, L.; Xu, X. Preparation, Structure and Photocatalysis of Metal-Organic Frameworks Derived from Aromatic Carboxylate and Imidazole-Based Ligands. J. Coord. Chem. 2016, 69, 985–995. [Google Scholar]
  52. Nguyen, V.H.; Pham, A.L.H.; Lee, T.; Nguyen, T.D. Facile Synthesis of Bismuth (III) Based Metal-Organic Framework with Difference Ligands Using Microwave Irradiation Method. Chem. Eng. Res. Des. 2022, 177, 321–330. [Google Scholar]
  53. Guesh, K.; Caiuby, C.A.D.; Mayoral, Á.; Díaz-García, M.; Díaz, I.; Sanchez-Sanchez, M. Sustainable Preparation of Mil-100 (Fe) and Its Photocatalytic Behavior in the Degradation of Methyl Orange in Water. Cryst. Growth Des. 2017, 17, 1806–1813. [Google Scholar]
  54. Ao, D.; Zhang, J.; Liu, H. Visible-Light-Driven Photocatalytic Degradation of Pollutants over Cu-Doped Nh2-Mil-125 (Ti). J. Photochem. Photobiol. A Chem. 2018, 364, 524–533. [Google Scholar]
  55. Abdi, J.; Banisharif, F.; Khataee, A. Amine-Functionalized Zr-Mof/Cnts Nanocomposite as an Efficient and Reusable Photocatalyst for Removing Organic Contaminants. J. Mol. Liq. 2021, 334, 116129. [Google Scholar]
  56. Roy, S.; Darabdhara, J.; Ahmaruzzaman, M. MoS2 Nanosheets@ Metal Organic Framework Nanocomposite for Enhanced Visible Light Degradation and Reduction of Hazardous Organic Contaminants. J. Clean. Prod. 2023, 430, 139517. [Google Scholar]
  57. Liu, J.; Zhan, H.; Wang, P.; Chen, M.; Zhu, X.; Han, J.; Fu, B. Assembling Biobr Nanoplates on Mil-125 (Ti)–Nh2 Via Group Linkage Towards Effective Dye-Contaminated Water Purification. J. Solid State Chem. 2024, 329, 124408. [Google Scholar]
Figure 1. Single-crystal X-ray diffraction (SCXRD) analysis of MOF-S1, showing the three-dimensional interpenetrating networks.
Crystals 15 00348 g001
Figure 2. Powder X-ray diffraction (PXRD) patterns of MOF-S1 compared with calculated data, demonstrating phase purity.
Crystals 15 00348 g002
Figure 3. (a) N2 adsorption/desorption isotherm at 77 K for MOF-S1, indicative of Type I(a) behavior typical of ultramicroporous materials, (b) CO2 adsorption at 277 K, and (c) H2 adsorption at 77 K.
Crystals 15 00348 g003
Figure 4. N2 adsorption data analysis for MOF-S1 using t-plot (a), Horváth–Kawazoe (b), and (c) Dubinin–Radushkevich methods.
Crystals 15 00348 g004
Figure 5. TGA/DSC analysis of (a) TCPT ligand and (b) MOF-S1, illustrating their thermal stability and decomposition profile up to 600 °C.
Crystals 15 00348 g005
Figure 6. Monitored adsorption kinetics of dyes on MOF-S1: (a) Congo Red, (b) Methylene Blue, (c) Methyl Orange, and (d) Rhodamine B under room temperature conditions and with addition of 100 µg dye at each step.
Crystals 15 00348 g006
Figure 7. Pseudo-first-order kinetic plots for the adsorption of (a) CR, (b) MB, (c) MO, and (d) RhB onto MOF-S1.
Crystals 15 00348 g007
Figure 8. Pseudo-second-order kinetic plots for the adsorption of (a) CR, (b) MB, (c) MO, and (d) RhB onto MOF-S1.
Crystals 15 00348 g008
Figure 9. Langmuir adsorption isotherms for (a) Congo Red, (b) Methylene Blue, (c) Methyl Orange, and (d) Rhodamine B on MOF-S1.
Crystals 15 00348 g009
Figure 10. Determination of the energy band gap of MOF-S1 via diffuse reflectance spectroscopy (DRS) and Kubelka–Munk analysis, yielding a value of 4.24 eV.
Crystals 15 00348 g010
Figure 11. Photocatalytic degradation performance of MOF-S1 for (a,b) Methyl Orange and (c,d) Rhodamine B under UV irradiation.
Crystals 15 00348 g011
Figure 12. Non-linear kinetic fitting for Methyl Orange photodegradation by MOF-S1: (a) pseudo-first-order and (b) pseudo-second-order models; insets display the corresponding fitting parameters.
Crystals 15 00348 g012
Figure 13. Non-linear kinetic fitting for Rhodamine B photodegradation by MOF-S1: (a) pseudo-first-order and (b) pseudo-second-order models; insets display the corresponding fitting parameters.
Crystals 15 00348 g013
Table 1. Crystal data and structure refinement for MOF-S1.
Identification CodeMOF-S1
Empirical formulaC24H14N3O10.5Zn2
Formula weight643.12
Temperature/K273.15
Crystal systemtrigonal
Space groupP-31c
a16.9557
b16.9557
c6.9191
α90
β90
γ120
Volume/Å31722.71
Z2
ρcalc g/cm31.240
μ/mm−11.440
F(000)646.0
Crystal size/mm30.3 × 0.2 × 0.1
RadiationMoKα (λ = 0.71073)
2Θ range for data collection/°6.51 to 50.896
Index ranges−20 ≤ h ≤ 20, −20 ≤ k ≤ 20, −8 ≤ l ≤ 8
Reflections collected/independent33,897/1074
Symmetry consistency and data precision indices Rint = 0.0577, Rsigma = 0.0141
Data/restraints/parameters1074/8/93
Goodness-of-fit on F21.103
Final R indices [I ≥ 2σ (I)]R1 = 0.0635, wR2 = 0.1867
Final R indices [all data]R1 = 0.0713, wR2 = 0.1945
Largest diff. peak/hole/e Å−30.79/−1.58
CCDC number2,431,147
Table 2. Comparative summary of synthetic conditions (solvent composition, additives, temperature, and reaction duration) and corresponding yields for MOF-S1 and related TCPT-based MOFs, illustrating how subtle changes in synthesis parameters significantly influence framework stability, pore architecture, and material performance.
MOFSolventAdditionTempDurationYieldReference
(°C)(h)%
S1H2O/DMF-1051478this work
0.6/10 v/v
SNU-100’DMF-9024NA[14]
DMA/ACN/H2OHBF4904843.5[13]
2/2/2 v/v/v
Zn-TCPTDMA/ACN/H2OHBF4904844[10]
LMOFDMF/EtOH/H2O-100374[12]
2.5/2.5/1 v/v/v
Table 3. Quantitative data obtained from the N2 adsorption data analysis.
SSA, m2/g, LangmuirVmicro, cm3/gVtotal, cm3/g (P/P0 = 0.96) Smicro, m2/g, t-PlotPore Width
Å, HK
Ads. E
kJ/mol, DR
CO2 Uptake at 273 K, mmol/gH2 Uptake at 77 K, mmol/g
t-PlotHK
7110.250.250.257066.558 2.47.6
Table 4. Comparative analysis of photocatalytic degradation performance of MOF-S1 with other metal–organic frameworks reported in literature.
C%LightEgtC%LightEgtRef.
Zn-MOF91.7UV3.640 [39]
MOF-5/rGO93vis3.42097vis3.420[40]
MIL-53(Fe) with H2O2 98vis2.9850[41]
UiO-66(AN)65vis2.4790 [42]
Cu–MOF 90.3 vis 2.30120[43]
Fe-MOFs 99.38vis 300[44]
Co-MOF 23.4vis1.861808.7vis1.86180[45]
Cu-BTC47 13 -[46]
{[Zn2(fer)2]∙0.5H2O}n 88UV 100[47]
MOFs (Zn, Co, Ni, Fe, and Ag)74.5vis3.0120 [48]
Ag2CrO4/Cu(BDC)(50) 50 vis 2.9240[49]
Co-MOF95vis1.9200 [50]
Zn(II)-imidazole MOF82UV4.97180 [51]
Bi-MOF 99.1vis 180[52]
MIL-100(Fe)64UV 420 [53]
NH2-MIL-125(Ti)37vis 90 [54]
UiO-66 42vis 30[55]
UiO-66-NH2 60vis 30[55]
MoS2-HKUST-1 96.4vis 30[56]
BiOBr/MIL-125-(NH2)91vis 180 [57]
MOF-S193UV4.24 74UV4.24 This work
C% = efficiency or the maximum % of removal the photocatalyst shows after adsorption, Eg/t = energy band gap (eV), and t = time (minutes).
Disclaimer/Publisher’s Note: The statements, opinions and data contained in all publications are solely those of the individual author(s) and contributor(s) and not of MDPI and/or the editor(s). MDPI and/or the editor(s) disclaim responsibility for any injury to people or property resulting from any ideas, methods, instructions or products referred to in the content.

