Article

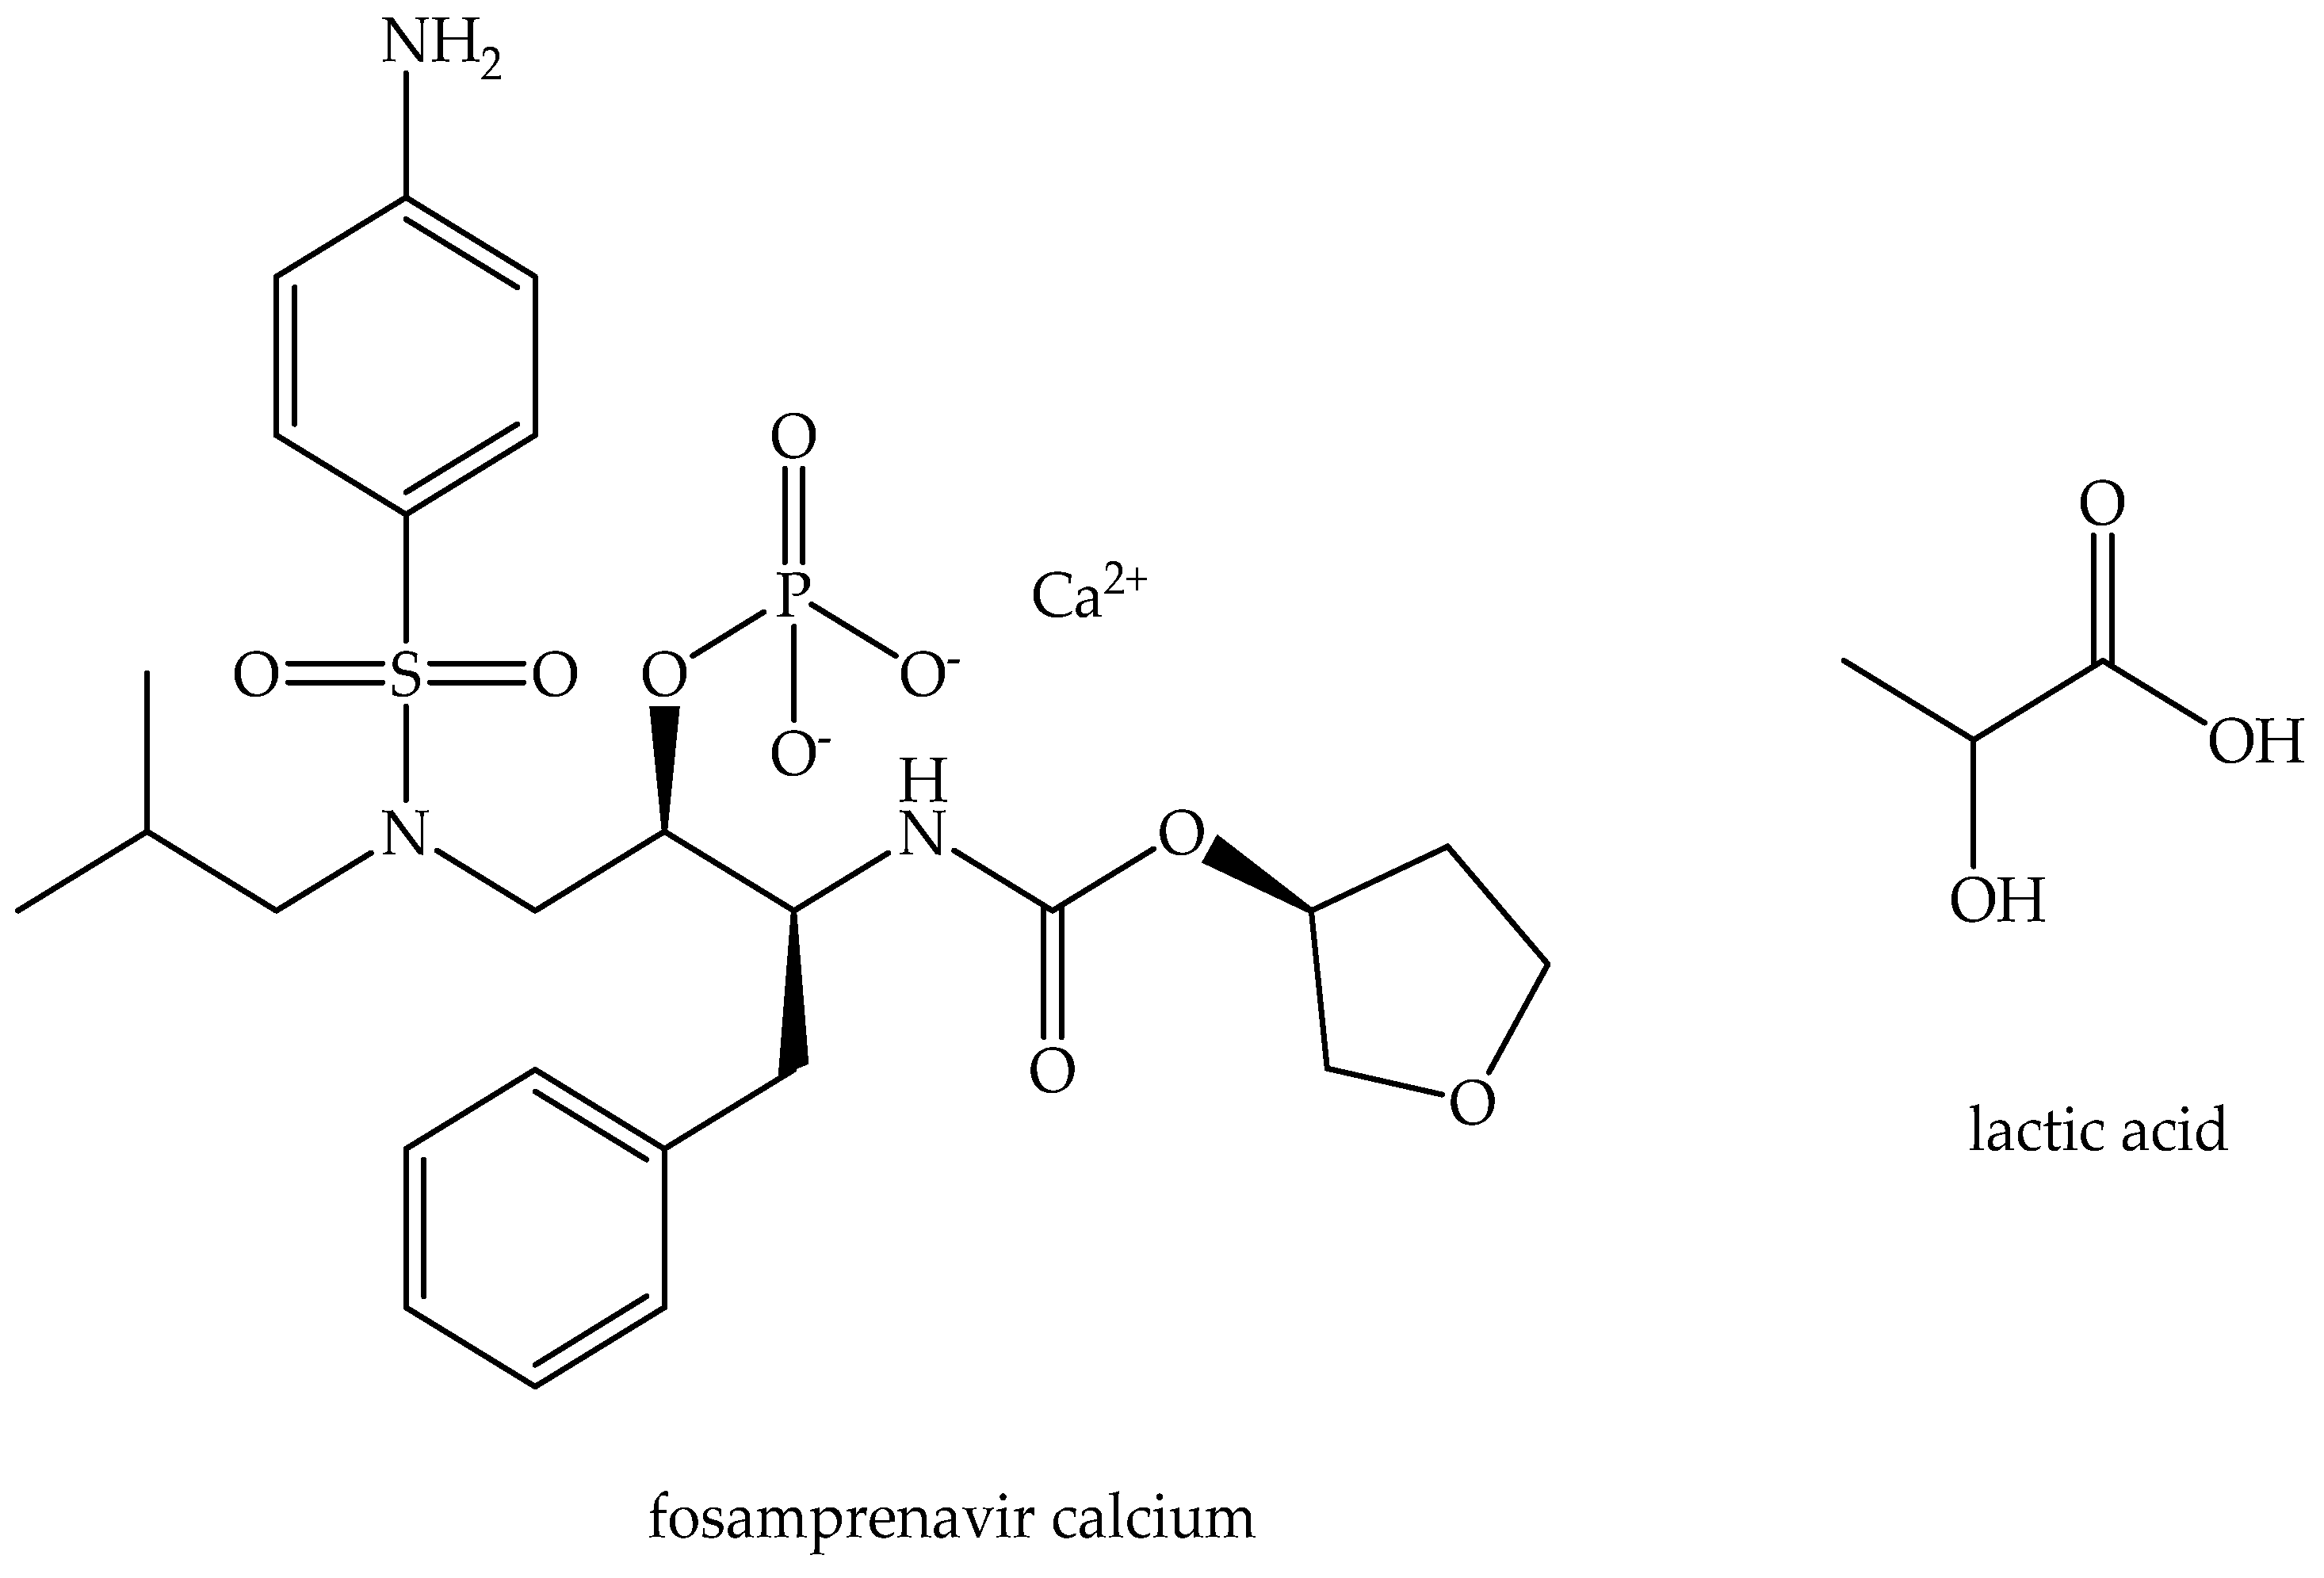
A Novel Formulation of Fosamprenavir Calcium: Therapeutic Deep Eutectic Solvent with Enhanced Properties

1
Department of Mechanical and Thermal Process Engineering, Faculty of Chemical Engineering and Technology, University of Zagreb, Trga Marka Marulića 19, 10000 Zagreb, Croatia
2
Hospira Zagreb d.o.o., Prudnička cesta 60, 10291 Prigorje Brdovečko, Croatia
*
Author to whom correspondence should be addressed.
Crystals 2025, 15(4), 350; https://doi.org/10.3390/cryst15040350
Submission received: 14 March 2025 / Revised: 4 April 2025 / Accepted: 6 April 2025 / Published: 9 April 2025
(This article belongs to the Special Issue Polymorphism in Crystals (2nd Edition))

Abstract

:
In the pharmaceutical industry, deep eutectic solvents can be used to enhance the solubility, permeability, and absorption of active pharmaceutical ingredients. In this paper, deep eutectic solvents were prepared by combining the active pharmaceutical ingredient fosamprenavir calcium with lactic acid in certain molar ratios. The aim of this study was to create a therapeutic deep eutectic solvent with the same therapeutic effect as the active pharmaceutical ingredient, but with enhanced properties. 1H NMR and FTIR spectroscopy were used to identify and characterize the chemical composition and structural changes of the prepared THEDES. Maximum solubility, the release of the active pharmaceutical ingredient from the therapeutic deep eutectic solvent, and permeability were tested. Different mathematical models were chosen to describe the kinetic behavior of the drug release.

1. Introduction

The main challenges facing the pharmaceutical industry today are related to the poor solubility of active pharmaceutical ingredient (APIs), which results in inadequate pharmacokinetics, poor bioavailability, and poor permeability [1,2]. There are a growing number of APIs in development that exhibit poor water solubility, leading to low bioavailability and limited therapeutic effect. Today, between 40% and 70% of new chemical entities (NCEs) are characterized as having low aqueous solubility (based on different estimates). Some of these NCEs are also considered to have low permeability. Such drugs belong to the Biopharmaceutics Classification System, BCS class 2 or 4 [3,4,5].
There are several approaches to solve the poor solubility problem of APIs. Today, various techniques are employed by researchers and pharmaceutical scientists to overcome the hurdles posed by poorly soluble APIs. Some of the strategies deployed to formulate poorly soluble APIs are lipid-based formulations, amorphous solid dispersions, and the application of nanotechnology or particle engineering [6,7].
However, the discovery of deep eutectic solvents (DES) has provided a potential solution for improving the properties of pharmaceutical formulations. Deep eutectic solvents are a new generation of eutectic systems, defined as mixtures of two or more components interconnected by hydrogen bonds, whose main characteristic is a lower melting point than the individual components. DESs are used in various areas of the pharmaceutical, chemical, biotechnology, and electrochemical industries. Furthermore, this type of solvent offers various advantages over traditional solvents, with biodegradability, low volatility, simple preparation without chemical reaction, and low toxicity being the main features [8,9,10].
Since most APIs have sites in their structure that can be hydrogen bond donors or acceptors, they have the ability to form a eutectic mixture called therapeutic deep eutectic solvents (THEDES), in which the solubility, permeability, and absorption properties of API can be improved. However, the large number of acceptor and donor sites makes it difficult to predict and detect the sites where hydrogen bonds are formed and any changes within such molecules [1,2,11]. Therefore, the selection of THEDES components is still based on trial and error.
Several THEDESs have been developed over the past two decades that have significantly improved medication solubility or permeability. THEDES have been used to improve the solubility and bioavailability of ibuprofen, which can reduce dosage and side effects [12]. Similar to ibuprofen, THEDES formed from ketoprofen have been demonstrated to be useful in enhancing ketoprofen characteristics [13]. The drug ethambutol, which is used to treat tuberculosis, was changed from class II to class I according to BCS by combining it with citric acid or L-arginine in THEDES. This new formulation enhanced the drug’s solubility and permeability [14]. Furthermore, research has shown advances in several antibiotics, such as the NADES formulation of ciprofloxacin, which has increased solubility and permeability [15]. The fact that they can be administered to the patient through a variety of routes, including oral, transdermal, intravenous, vaginal, and buccal routes, further supports their significant potential [16]. Despite a large amount of scientific research, regulatory frameworks for the use of THEDES in pharmaceutical items are still being created, potentially delaying their commercialization.
In this study, a THEDES was prepared combining fosamprenavir calcium (FpnCa) with lactic acid (LA) in three different molar ratios. The THEDES were characterized by 1H NMR spectra and Fourier-transformed infrared spectroscopy. The solubility and permeability of the API in the prepared THEDES were compared to the solubility and permeability of the powder FpnCa.

2. Materials and Methods

FpnCa and LA with a purity of 90% are the compounds used in this experiment. Figure 1 depicts their molecular structure. FpnCa was kindly donated by Pliva d.o.o., and LA was obtained from VWR chemicals. Both components were vacuum-dried at 60 °C for 8 h before the preparation of THEDES.

2.1. THEDES Preparation

THEDESs were prepared by mixing the API (FpnCa) with LA in different molar ratios on a magnetic stirrer at a temperature of 60 °C for approximately 4 h until clear solutions were formed. The list of prepared THEDESs and the corresponding molar ratios are shown in Table 1.

2.2. Characterization of Pure FpnCa and Prepared THEDESs

Prior to the preparation of the THEDES, the internal structure of pure FpnCa was determined by X-ray powder diffraction (XRD 6000, Shimadzu, Kyoto, Japan), with a Cu-K radiation source with a wavelength of λ = 1.54059 Å. A current of 30 mA and a voltage of 40 kV were applied, and data were gathered in the range of 2θ = 3–40°, using a step size of 0.01° and a hold time of 0.6 s.
The prepared samples were characterized by nuclear magnetic resonance spectroscopy (NMR) and Fourier transform infrared spectroscopy (FTIR). 1H NMR spectra were recorded in deuterated chloroform with tetramethylsilane (TMS) as an internal standard at room temperature.
The FTIR spectra of the pure components and the prepared THEDESs were recorded using a Perkin Elmer Spectrum One Spectrometer (Waltham, MA, USA) using an attenuated total reflection (ATR) Single Reflection ATR System, with a ZnSe crystal. Measurements were performed in the wavelength range of 400 to 4000 cm−1, at a resolution of 4 cm−1. The measured spectra are the result of four consecutive measurements.
The stability of the prepared THEDESs over time was monitored using light microscopy (BA 200, Motic, Xiamen, China) to see if any crystals had formed in the solvent.

2.3. Determination of Maximum Solubility of FpnCa

The maximum solubility was determined by gradually adding powdered FpnCa or FpnCa–LA (1:6) to 50 mL of water or acetate buffer at 25 °C with a mixing rate of 300 rpm until saturation was reached. The concentration of the dissolved FpnCa was determined by measuring the absorbance on a Shimadzu UV-1280 UV–Vis spectrophotometer at a wavelength of 262.8 nm. Absorbance spectra were recorded between 220 and 350 nm, and the maximum absorbance for all samples, both in water and in buffer, was at 262.8 nm. To create calibration diagrams, solutions of 100 ppm FpnCa in water and buffer were made, diluted, and then their absorbance was measured. The buffer solution was prepared by mixing 0.1 M glacial acetic acid and 0.1 M sodium acetate, and the pH was adjusted to 4.66.

2.4. Dissolution Test

To compare the release profiles of pure FpnCa and FpnCa from THEDES at 37 °C and 300 rpm, pure FpnCa and FpnCa–LA (1:6) were added to 150 mL of buffer to prepare a concentration of FpnCa of approximately 1200 mg/L. Sample volumes of 0.5 mL were withdrawn at predetermined times, and after each sampling 0.5 mL of buffer was returned to the reactor to keep the volume constant. The amount of FpnCa in all the samples was measured using UV/VIS spectrophotometry (UV-1280, Shimadzu, Kyoto, Japan) at a wavelength of 262.8 nm. The percentage of FpnCa released and the release profiles were determined using the volume correction tab in the Excel add-in DDSolver.

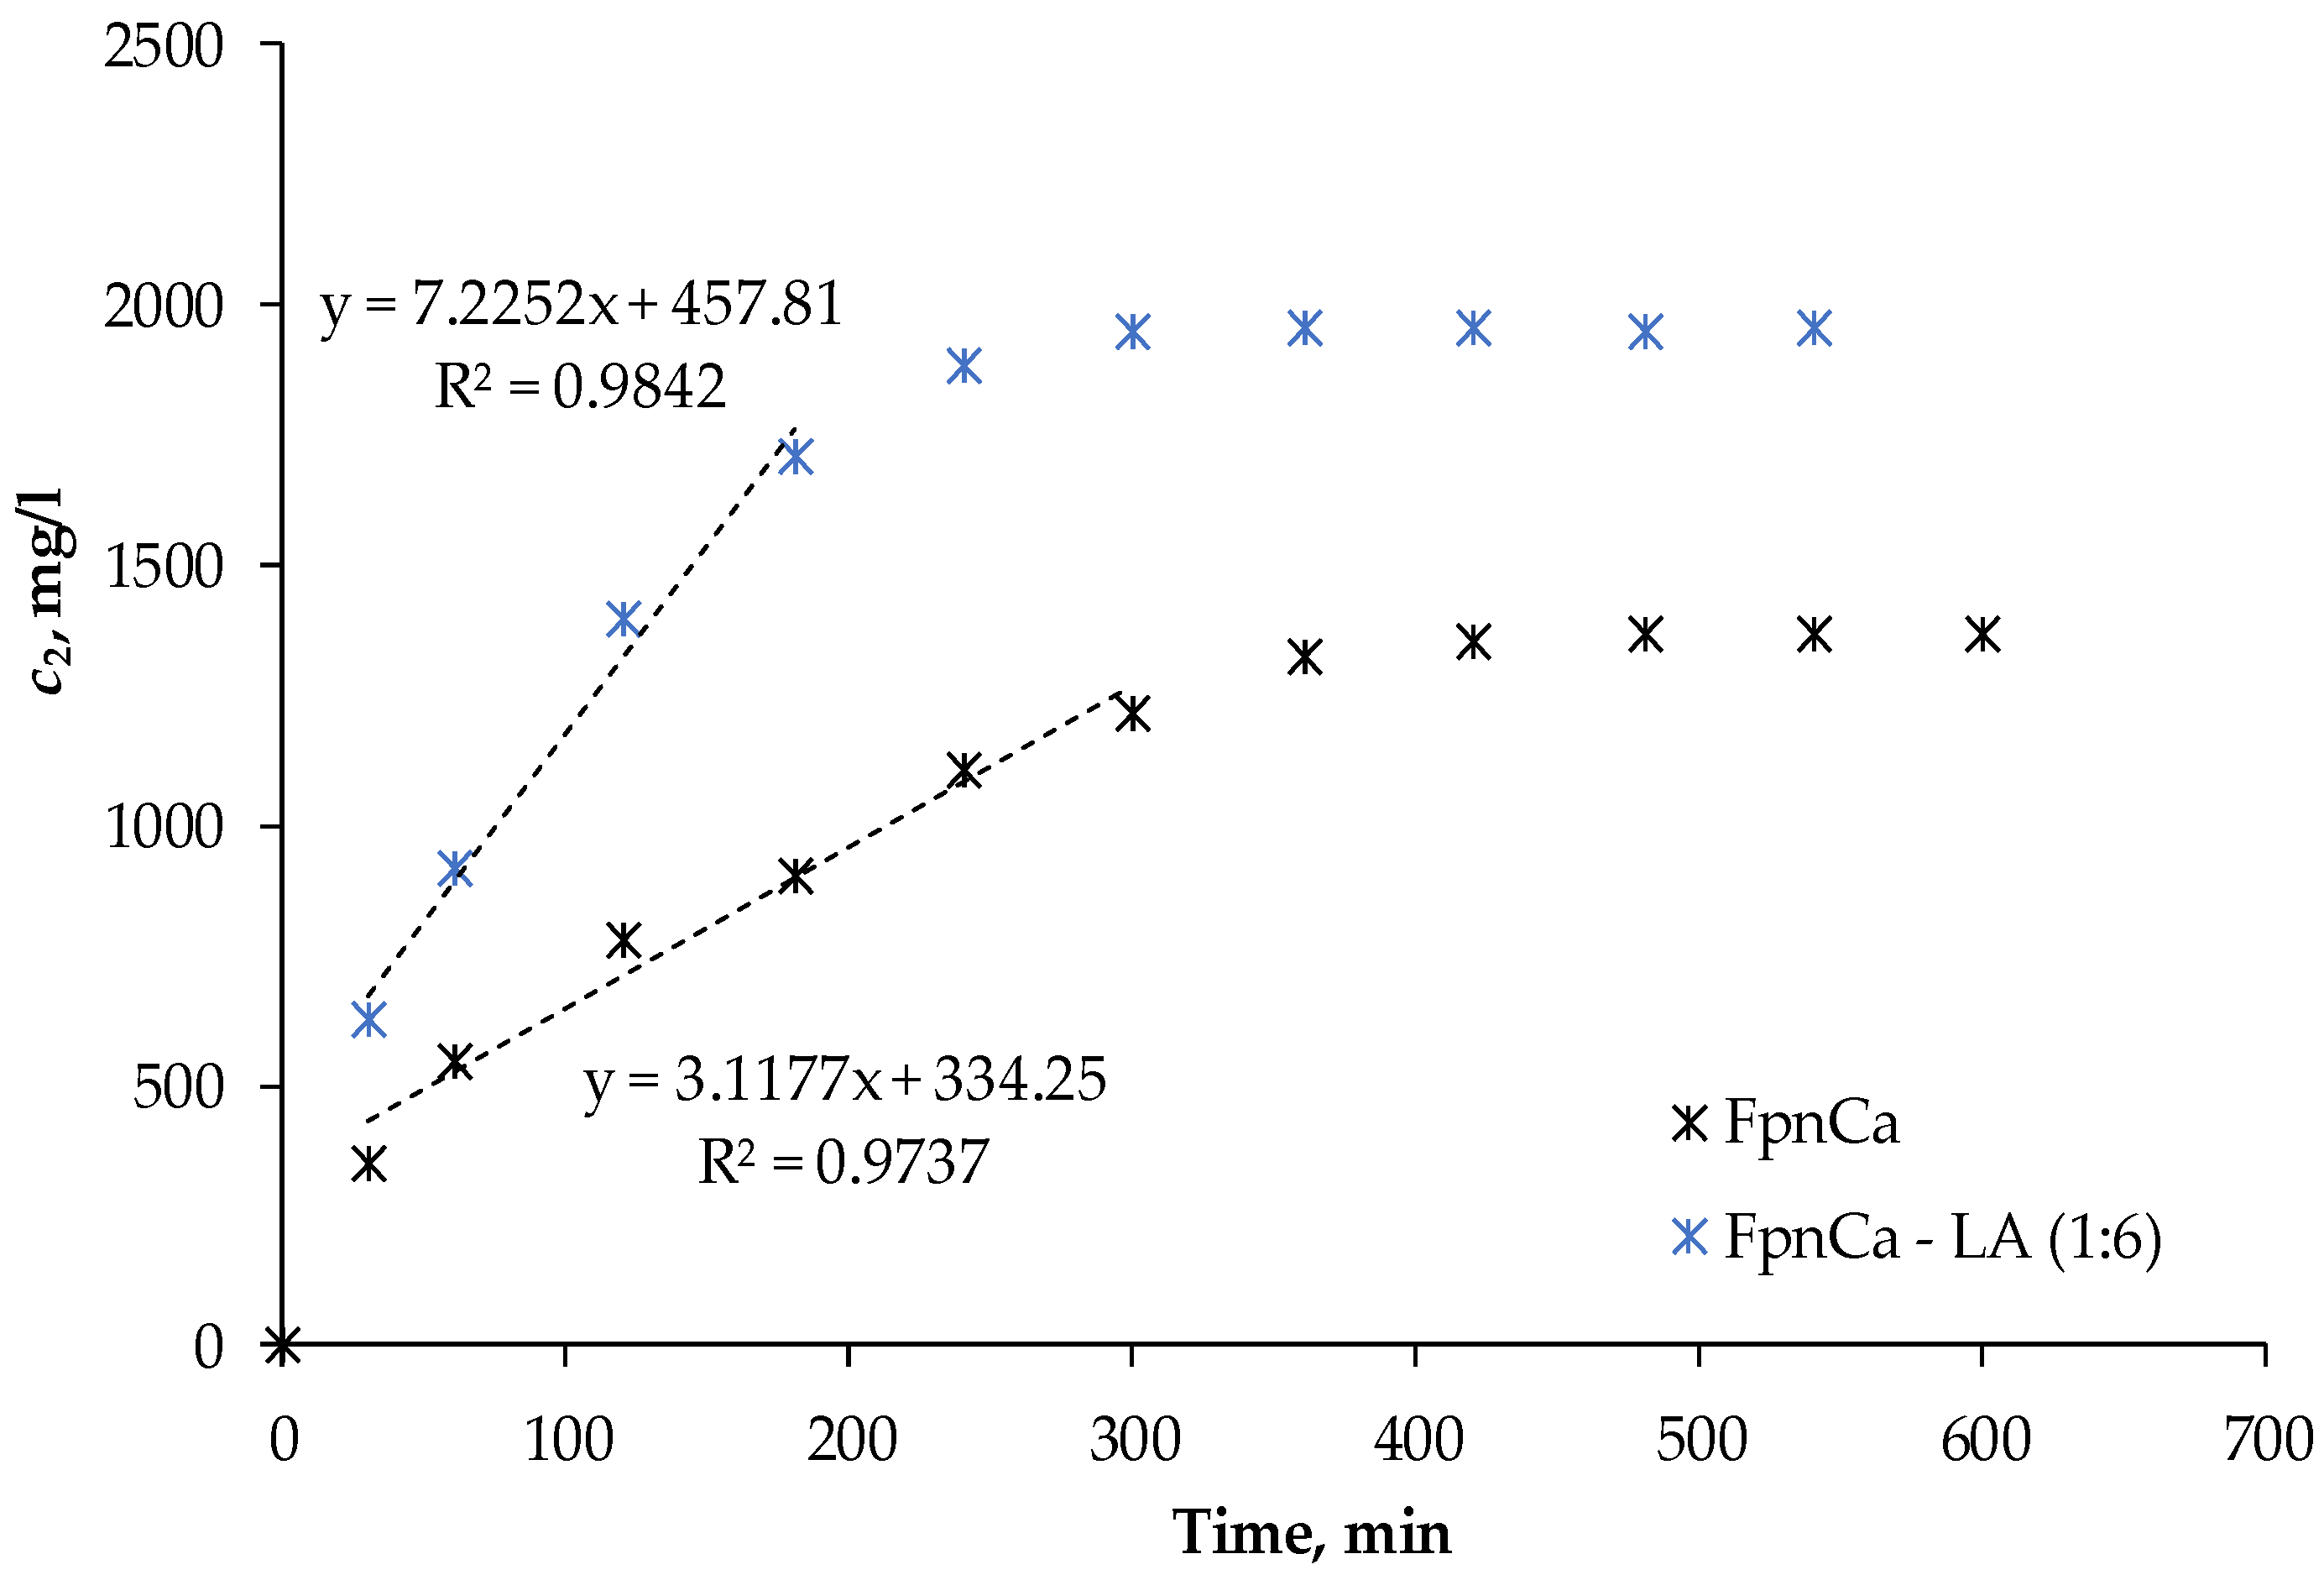
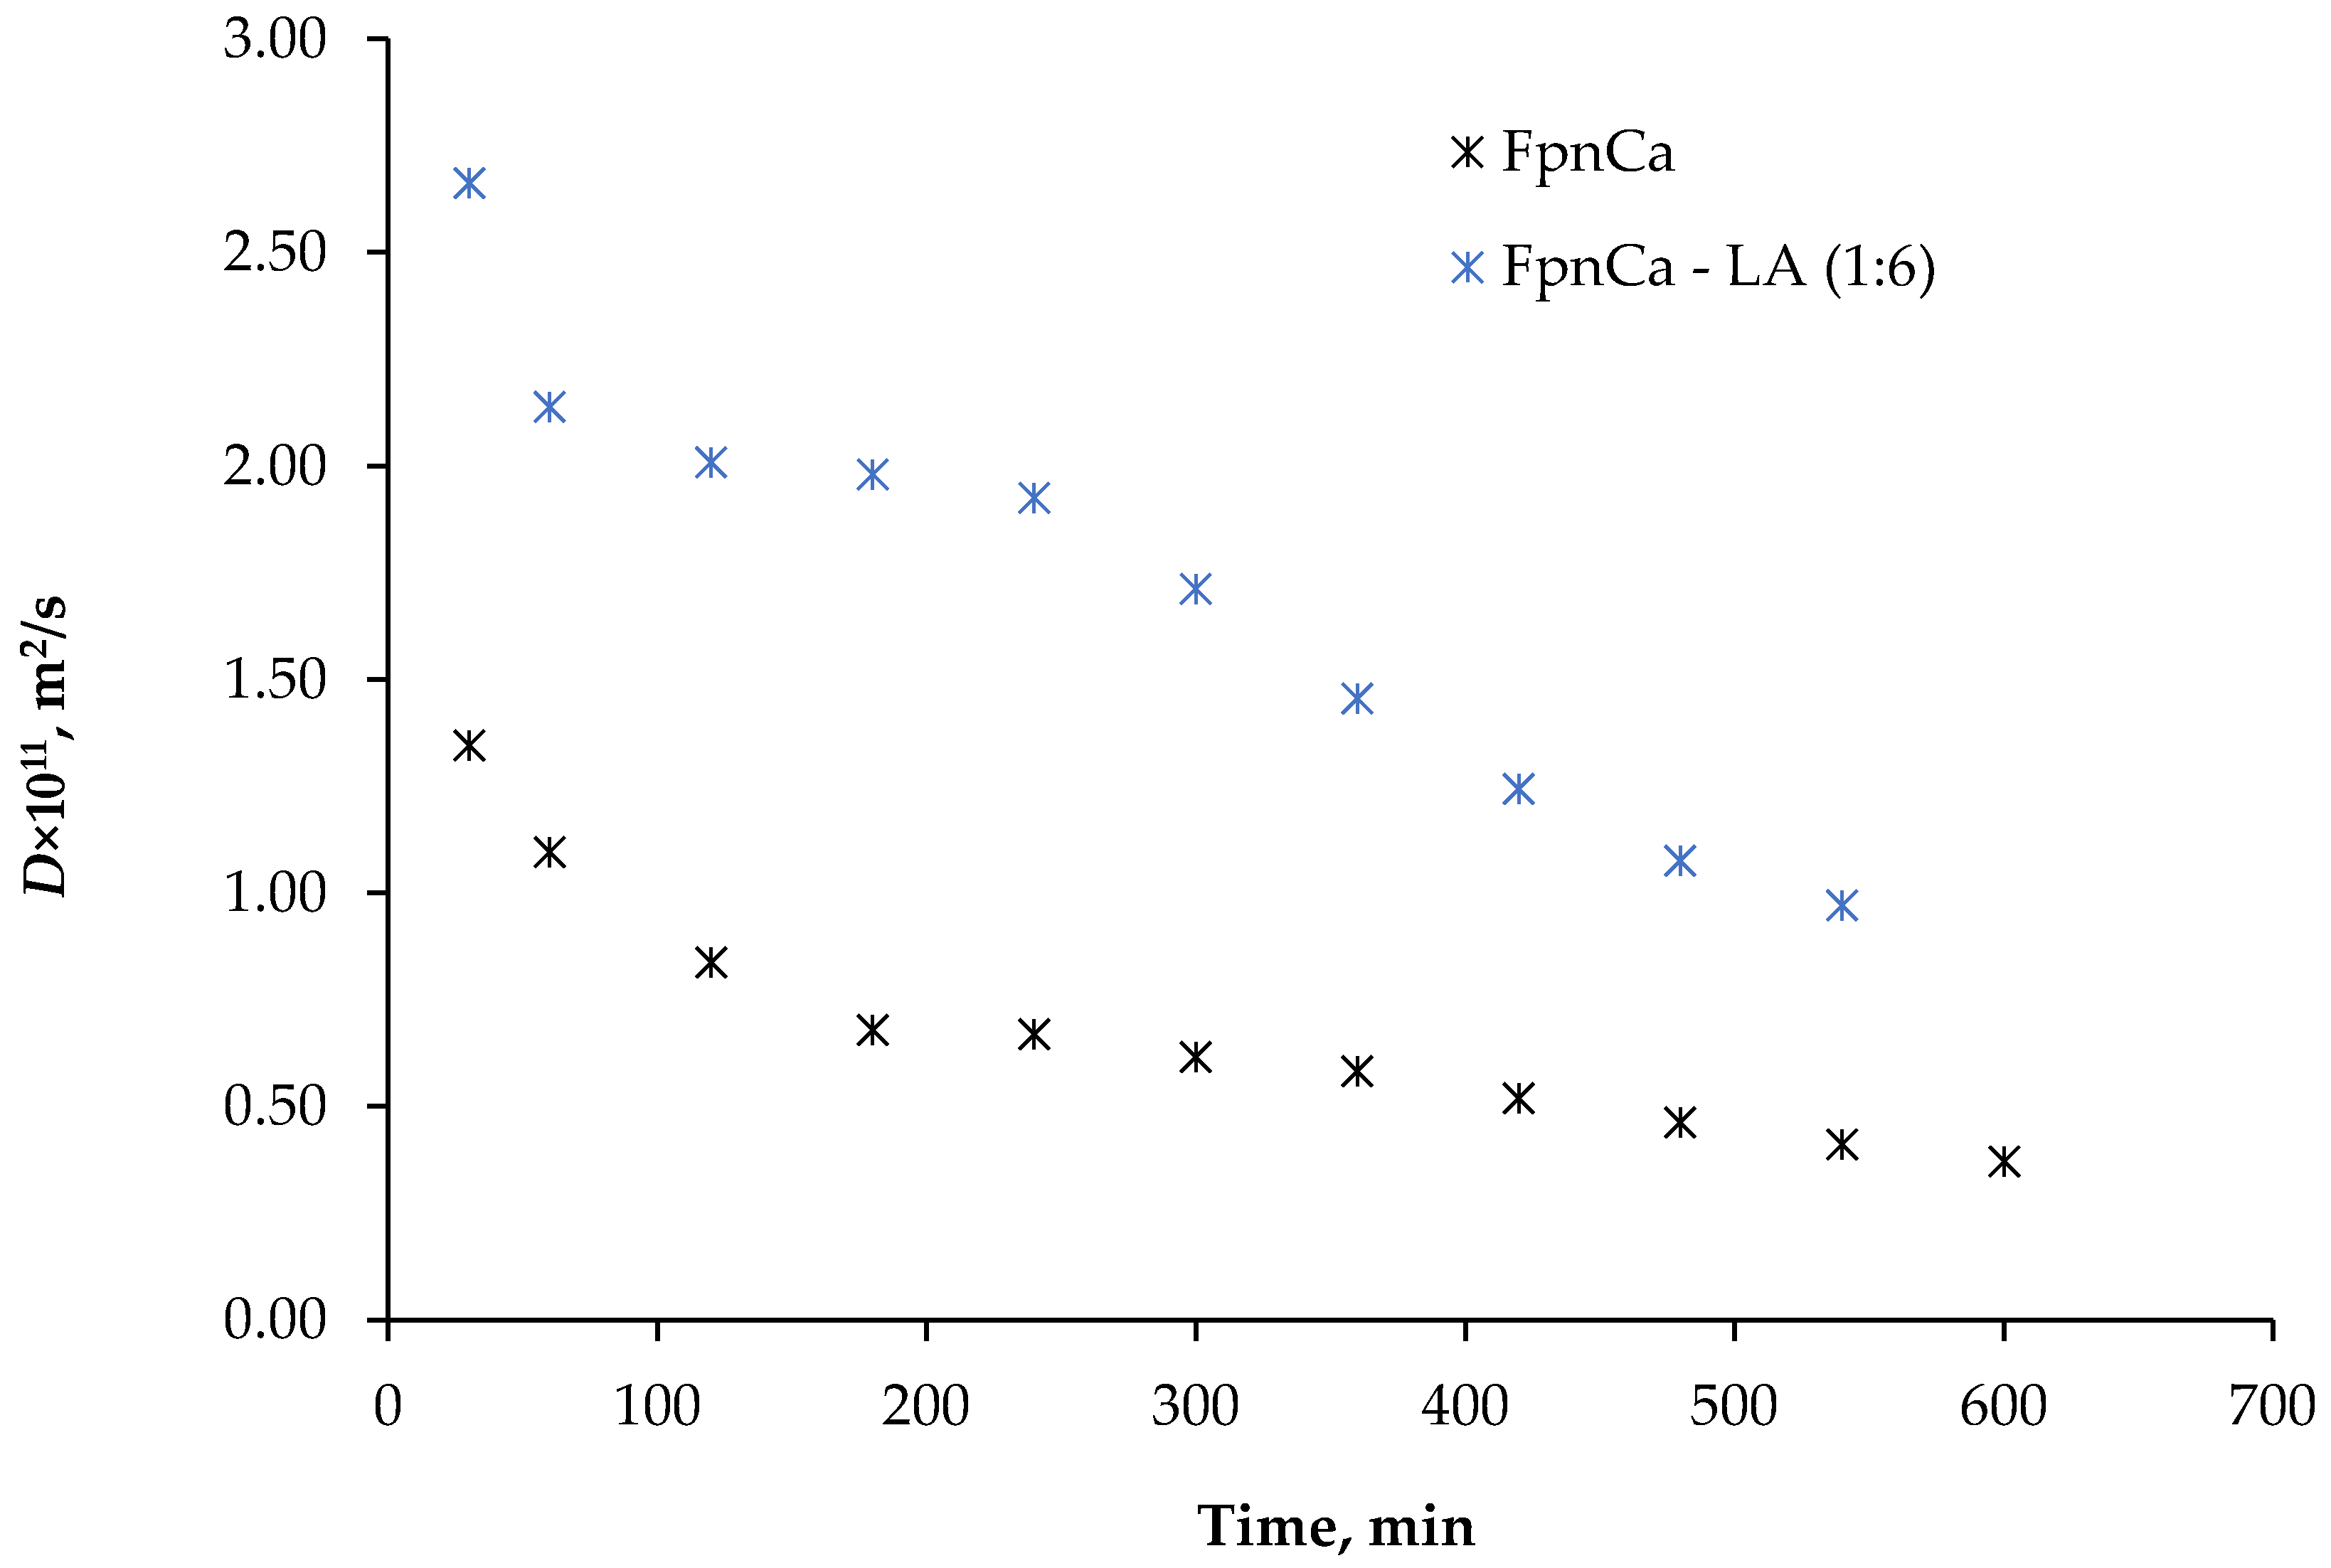
2.5. Determination of Permeability and Diffusion Coefficients

The permeability of a 2.5 cm-diameter semipermeable membrane was determined in Franz diffusion cells on an RYJ 68 device (Xiangtan Xiangyi Instrument Ltd., Xiangtan, China) at 37 °C and 300 rpm. THEDESs and pure FpnCa were applied on the membrane in two different cells. A total of 46.2 mg of FpnCa–LA (1:6) was applied to the membrane of the first cell, sufficient to fully cover the membrane. The exact amount of purified FpnCa (19.3 mg) was used on the membrane of the second cell, since FpnCa made up 41.8% of the THEDESs. A pure buffer solution was added to the third cell to replenish them after sampling. Samples of 200 μL were taken from the acceptor part of the cell every hour for 8 h using a pipette with a thin tube, and then 200 μL of buffer solution was added to maintain the same volume. Concentrations were determined on a UV–Vis spectrophotometer at a wavelength of 262.8 nm. The permeability coefficient was calculated using the following equation:
d c A d t = P A c D V A
where dcA/dt represents the change in FpnCa concentration over time in the acceptor part of the cell, or the slope of the linear part of the curve, P is the permeability, A is the membrane area through which FpnCa passes from the donor to the acceptor part of the cell, cD is the concentration in the donor part of the cell, and VA is the volume of the acceptor part of the cell. Equation (1) is derived from Fick’s first law and is valid only when the value of cD is much greater than that of cA [1]. According to the equation derived from Fick’s law, the diffusion coefficients, D, through the membrane can also be determined using the following equation:
D = V 1 V 2 V 1 + V 2 h A 1 t ln c f c i c f c t
where cf and ci represent the final and initial concentrations, ct is the concentration at a given time in the acceptor part of the cell, t is time, V1 and V2 are the volumes of the donor and acceptor parts, respectively, and h is the membrane thickness (Table 2) [1].

3. Results and Discussion

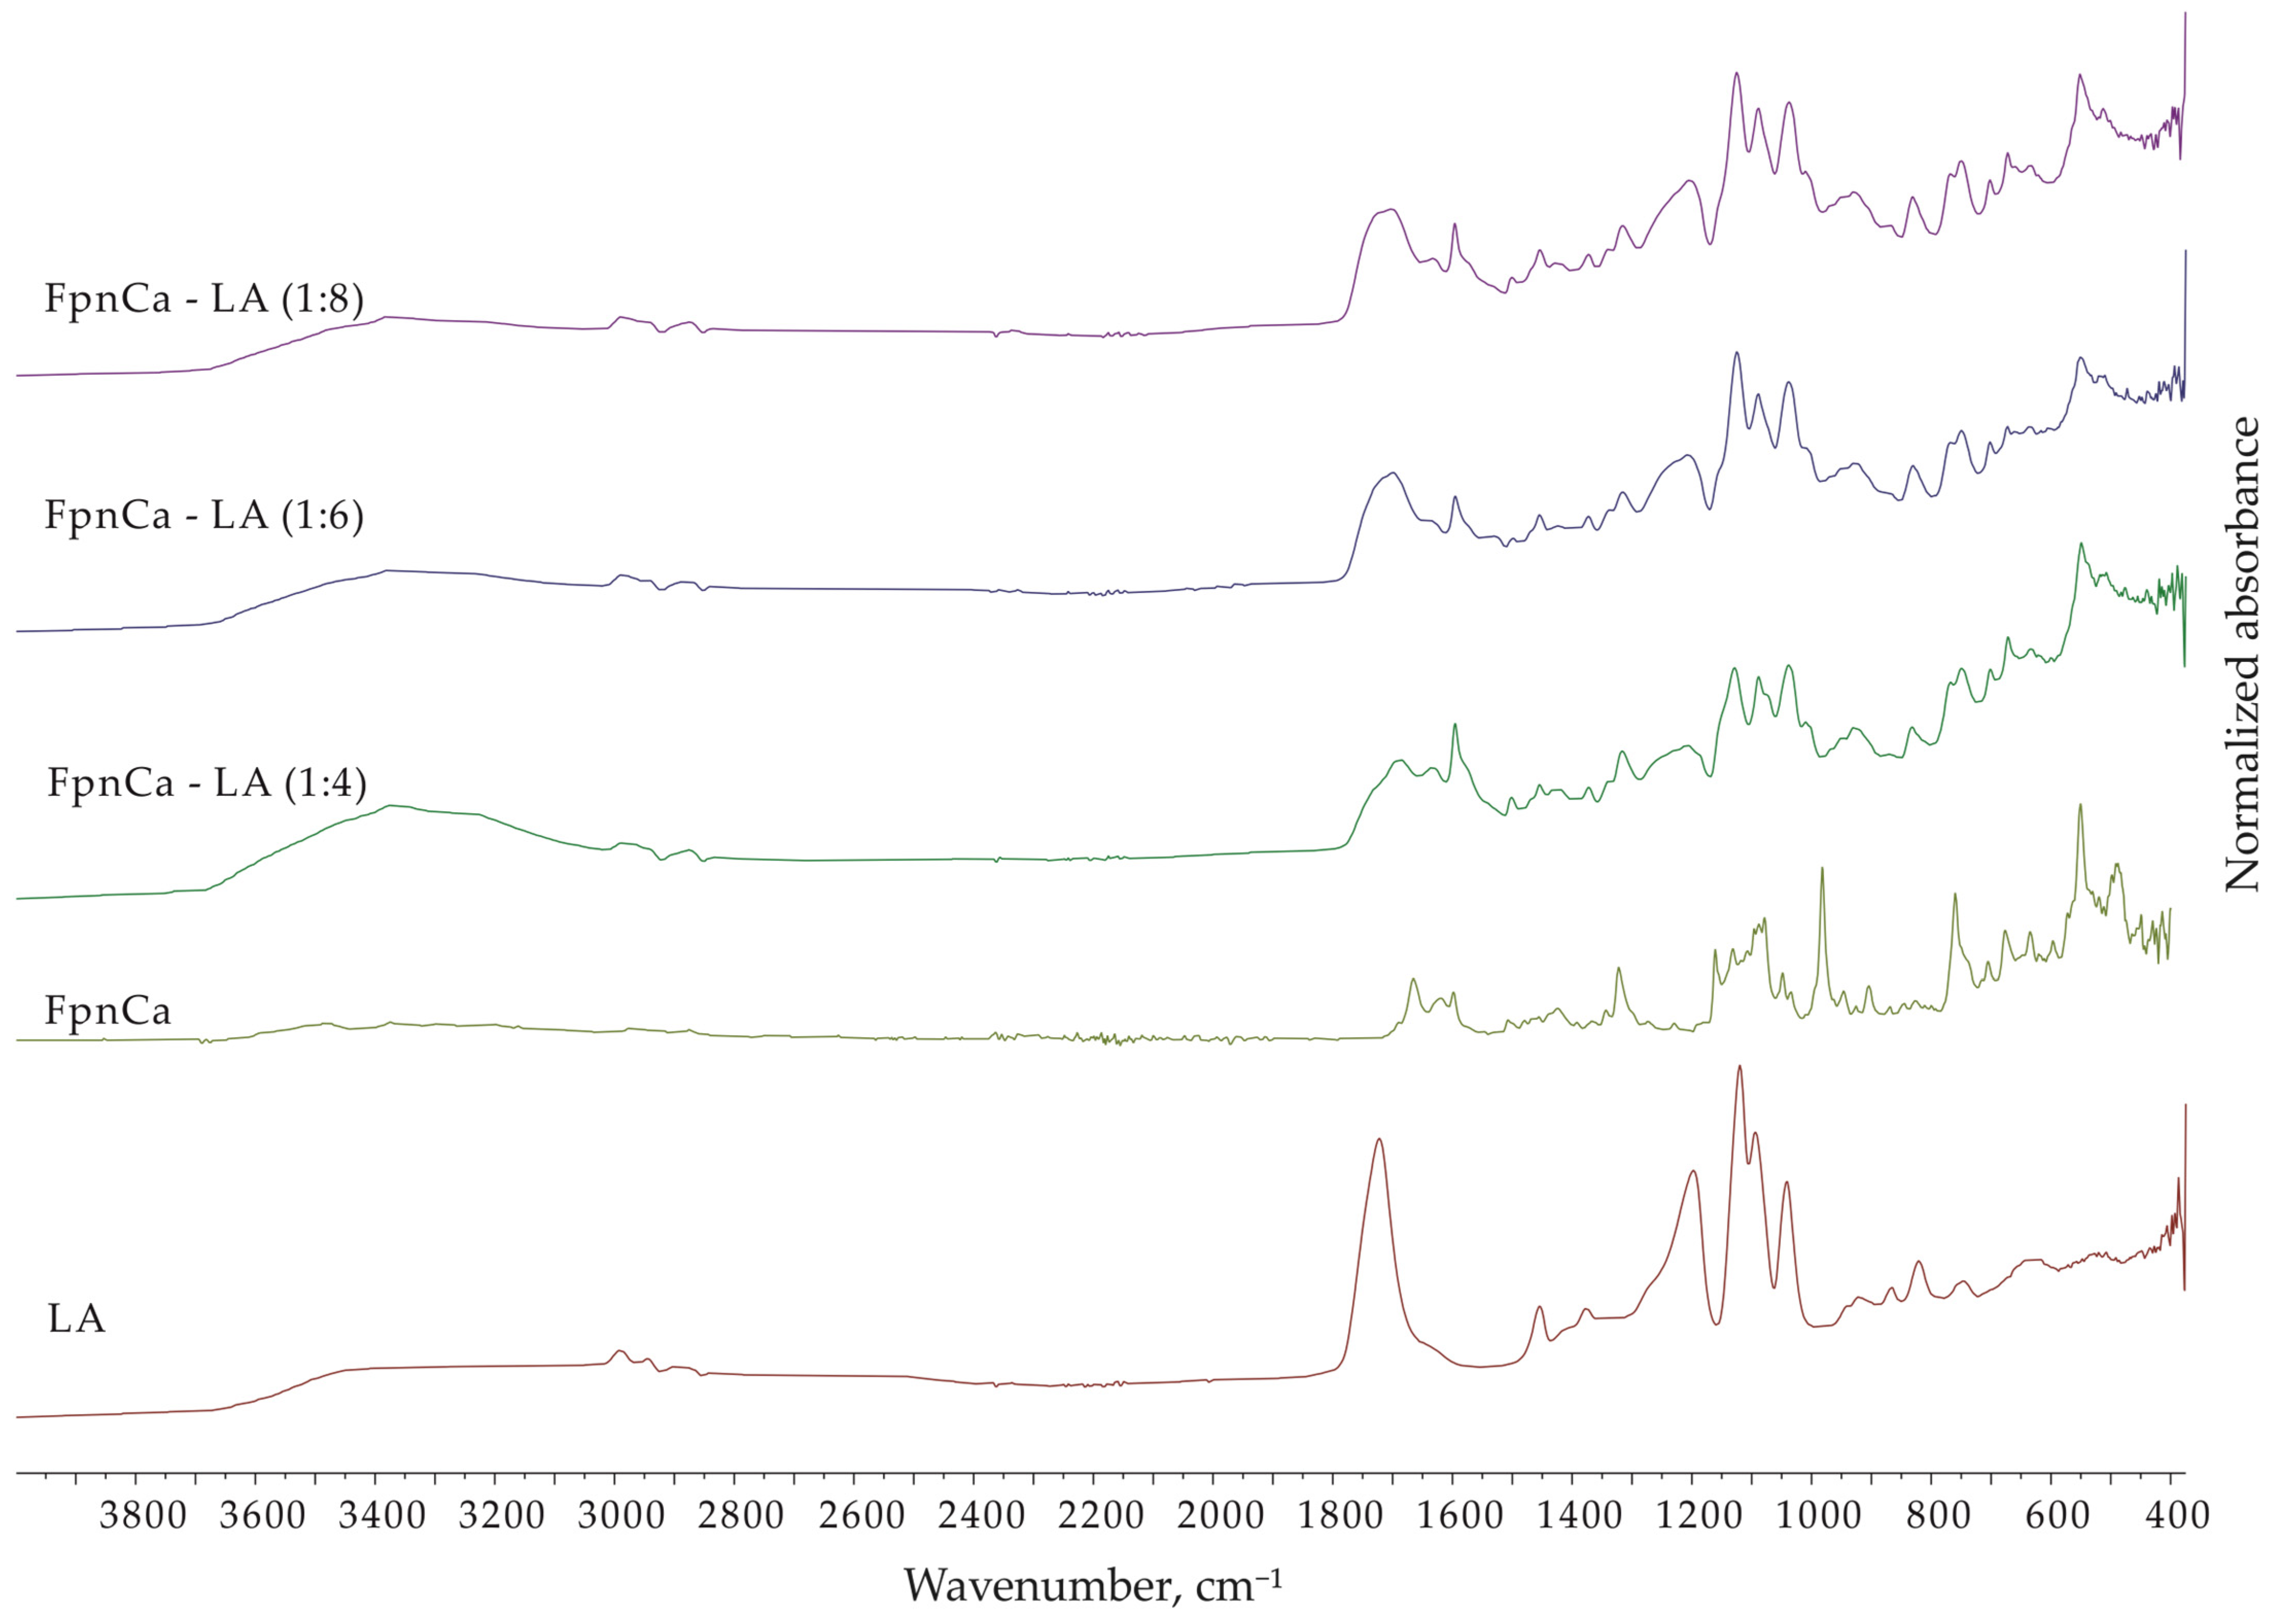
3.1. Characterization and Selection of THEDES

Since FpnCa occurs in several polymorphic forms, it was important to determine which form was used for the preparation of THEDES. The XRD pattern of crystalline FpnCa is shown in Figure 2. From the literature [17,18] it can be concluded that most of the peaks correspond to form 1 [19].
To confirm that THEDES was prepared by mixing FpnCa and LA in the defined molar ratios (1:4, 1:6, 1:8), the FTIR spectra of LA, FpnCa, and the obtained mixtures were measured.
The FTIR spectra of LA, FpnCa, and THEDES (FpnCa–LA (1:4, 1:6 and 1:8)) are shown in Figure 3 and the assignment of the absorption bands is listed in Table 3. The FTIR spectrum of THEDESs show absorption bands of functional groups that are characteristic of both LA and FpnCa. The FTIR spectra of LA also confirm that LA is present in the form of oligomers [20], while the FTIR spectrum of FpnCa corresponds to form 1 [19]. The intensity of the absorption bands of LA increases in THEDESs as the molar ratio of LA increases from 1:4 to 1:8. The disappearance of the FpnCa peak at 982.12 cm−1 in the THEDES spectrum is a clear indication that the crystalline structure of FpnCa is disturbed during its dissolution in LA. This is a common phenomenon in the formation of DES, where the components interact and form a disordered liquid or viscous mixture [21]. Since LA is a strong HBD due to its carboxylic acid and hydroxyl groups, an increase in LA concentration leads to a denser hydrogen bonding network (between LA molecules and between LA and FpnCa molecules), which can stabilize THEDESs. The extent of hydrogen bonding, indicated by the broadening of the O-H/N-H and C-O stretching peaks, increases with the FpnCa–LA ratio [22]. In addition, a higher LA concentration can further lower the melting point or increase the liquid range of the THEDES, making it more stable at ambient temperatures [23].
Several changes in the FTIR spectrum of FpnCa–LA (1:6) indicate the formation of THEDESs [21,22,26,27,28,29]:
(a)
O-H/N-H stretching region (3600–3200 cm−1): a much broader and more intense peak extending over a larger region of FpnCa–LA, which is due to the formation of extensive hydrogen bonding between the components of THEDESs (a complex network of hydrogen bonds between the O-H of LA and the N-H groups of FpnCa).
(b)
C=O stretching region (1750–1650 cm−1): FpnCa–LA shows a broadened peak at 1699.06 cm−1, indicating a combined contribution of both compounds and the influence of hydrogen bonding.
(c)
C-O stretching region (1300–1000 cm−1): FpnCa–LA shows a broadened and even more complex pattern, reflecting the combined C-O stretches and the formation of new interactions.
(d)
Aromatic region (1650–1400 cm−1): FpnCa–LA retains the AR peaks, but they are slightly broadened and altered, indicating interactions with other components.
(e)
Fingerprint region (below 1000 cm−1): FpnCa–LA shows a distinctly different pattern, confirming the formation of a new structure with different vibrational modes.
The most noticeable change is the significant broadening of the peaks in the FpnCa–LA spectrum, especially in the O-H/N-H and C-O regions. Although subtle, there are shifts and changes in the intensity of the peaks that indicate changes in the electronic environment of the functional groups. The fingerprint region is clearly different, confirming the formation of new interactions and a different structure.
In order to confirm the formation of the liquid and to determine whether residual crystals were still present in the liquid, the THEDES prepared was examined under a microscope. In all the prepared molar ratios, only air bubbles were visible in the liquid immediately after THEDES preparation (Figure 4). THEDES is mixed during the preparation process, and because of its high viscosity, air bubbles are trapped for a while.
Crystals were observed in the liquid of the FpnCa–LA (1:4) sample after one week (Figure 5). The stability of the remaining two THEDESs was maintained for a period exceeding 14 days. Additional analysis was performed in FpnCa–LA (1:6), as it exhibited comparable stability to the FpnCa–LA (1:8) sample, which had a lower concentration of API. Due to the instability observed in FpnCa–LA (1:4), lower molar ratios were not evaluated. It was anticipated that an increased quantity of API could lead to the formation of unstable THEDESs, which was confirmed by FTIR analysis.
The prepared mixture of FpnCa and LA (1:6) was further analyzed by 1H NMR spectroscopy to confirm THEDES formation. The 1H NMR spectra of THEDES and its components are shown in Figure 6. Analysis of the LA spectrum indicates that it is an oligomer [20]. The signals of both components can be seen in the THEDES spectrum. By comparing the spectra of FpnCa and LA with the spectrum of the prepared FpnCa–LA (1:6), it can be concluded that DES formation occurred. This was based on the following observations:
(a)
Shifts in the aromatic signals (7.6–6.6 ppm) in the FpnCa–LA (1:6) spectrum indicate changes in the electronic environment of the FpnCa due to the THEDES formation.
(b)
The complexity of hydroxyl/carboxylic acid (5.3–5.1 ppm), CH/CH2 (4.5–3.4 ppm) and aliphatic (2.7–0.8 ppm) regions in the DES suggests interactions between the OH and COOH groups of LA and the functional groups of FpnCa, between CH/CH2 groups of LA and FpnCa and between the aliphatic groups of LA and FpnCa, respectively.
(c)
The downfield shift of -NH2 proton (from 1.91 ppm (FpnCa) to 2.67 ppm (FpnCa–LA (1:6)) can be attributed to the formation of hydrogen bonds between LA and FpnCa.
The shifts in the aromatic region and the complex signals in the hydroxyl/carboxylic acid and CH/CH2 regions indicate the formation of a new structure due to intermolecular interactions between FpnCa and LA. Changes in the hydrogen bonding network confirm the formation of DES [1,30].

3.2. Maximal Solubility
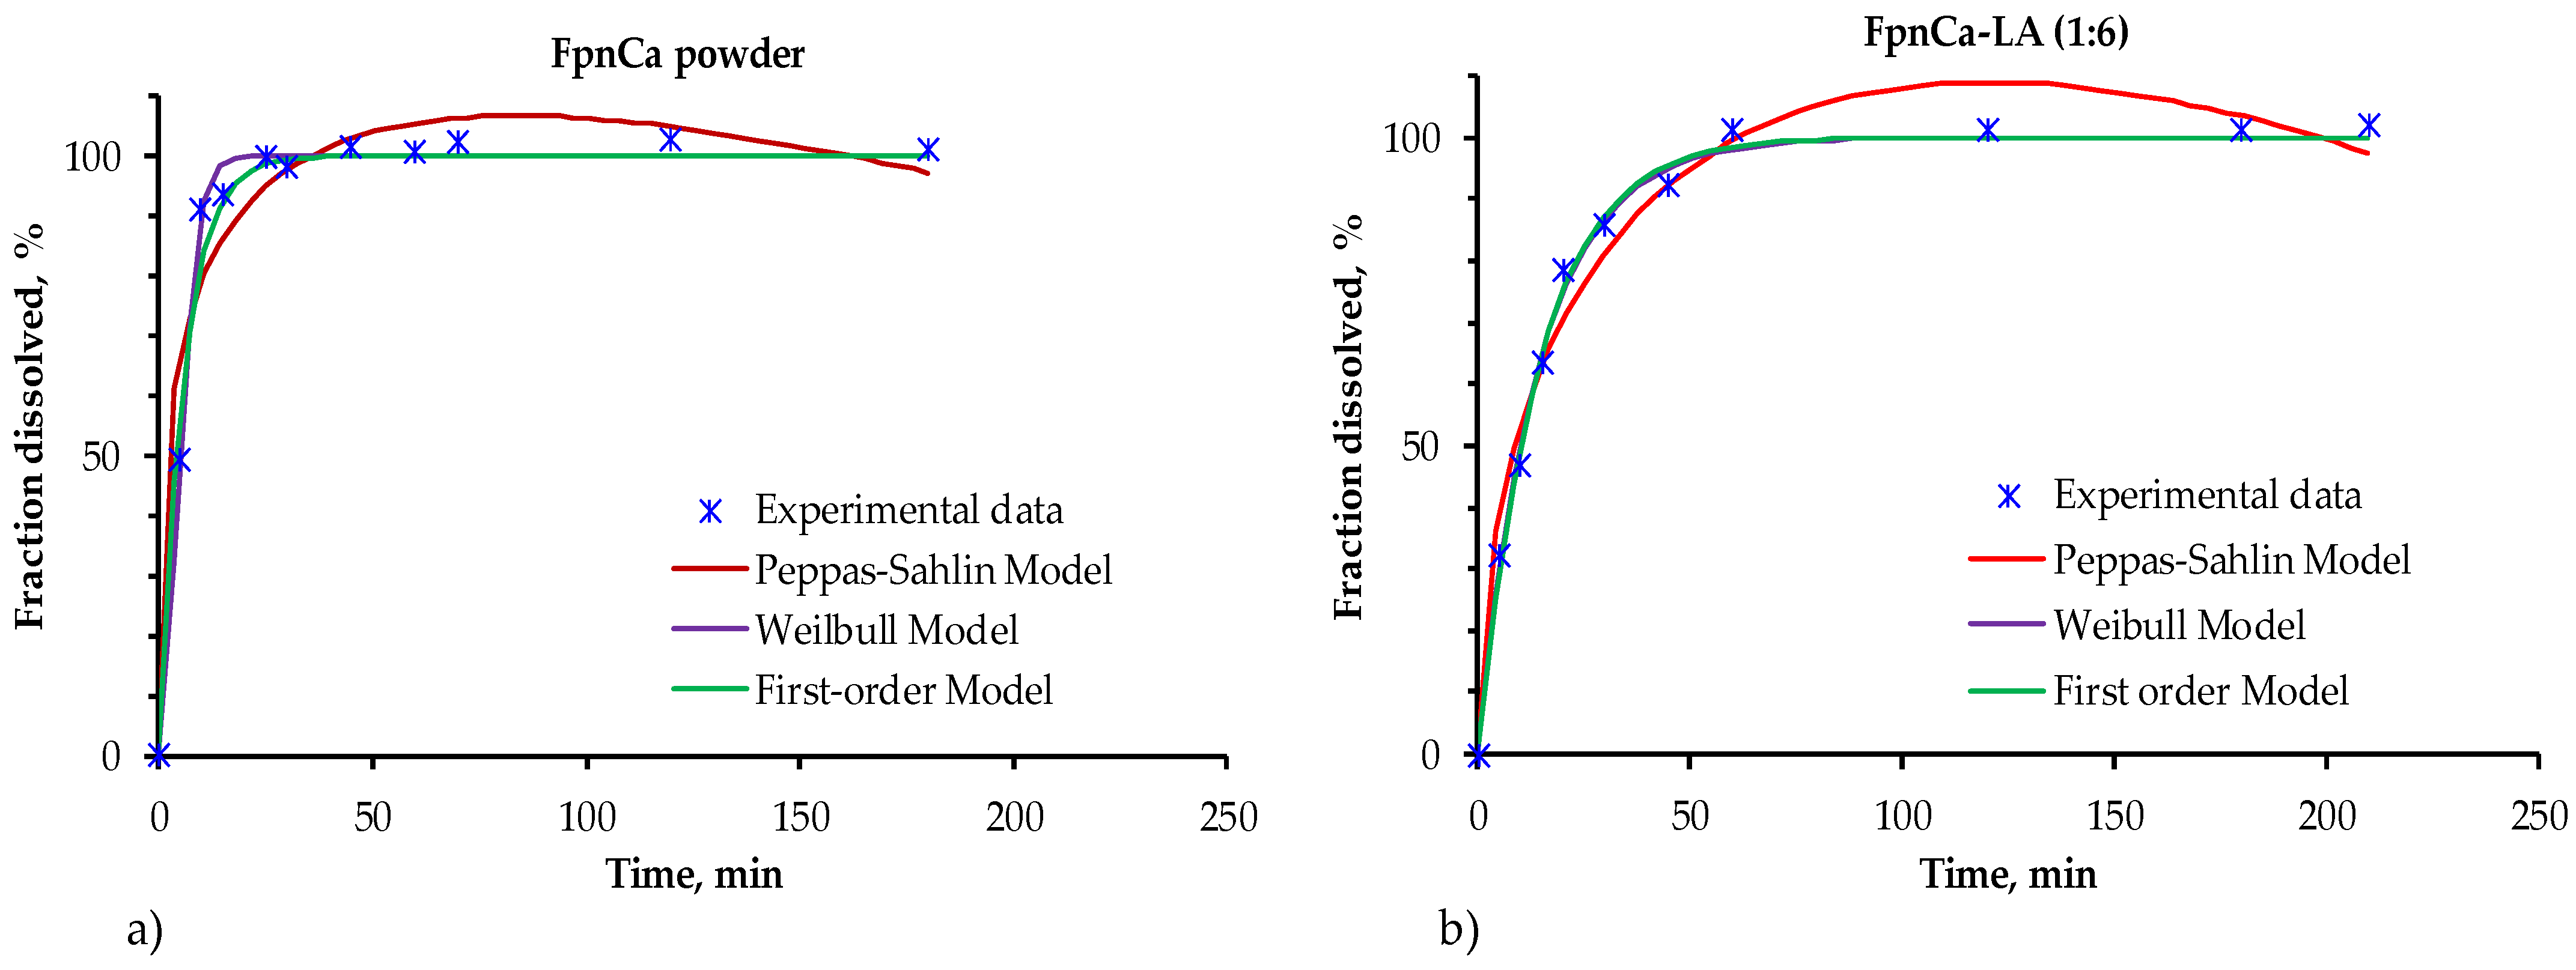
Table 4 shows that THEDES exhibits greater solubility than pure FpnCa in both media, with a solubility 3.8 times higher in water and 2.3 times higher in acetate buffer. The crystalline form of the API has a rigid, organized structure that requires high energy to dissolve. THEDESs often have a less ordered structure, which reduces the energy needed to dissolve the API [31,32]. Dissolution of FpnCa in a liquid resulted in an increase in solvent–solvent binding and a decrease in dissolution energy, improving dissolution in both media [16].

3.3. Drug Release

After confirming that no chemical reaction between FpnCa and LA had occurred, a dissolution test of pure API and API from THEDES was performed. Since the concentration of the API was relatively low (less than the maximum solubility in acetate buffer for both forms), 100% of the drug was dissolved in both cases. However, there was a change in the drug release profile (Figure 7). The pure FpnCa dissolved faster (about 45 min for 100% of the API), while the FpnCa from THEDES was completely dissolved after 60 min. A number of factors, including drug crystallinity, polymorphism, solubility, and particle size, influence how well an API dissolves [30]. Because FpnCa is bound in THEDESs by hydrogen bonds, it can be assumed that the slower dissolution of FpnCa is due to the initial time needed for hydrogen bond breakage within THEDESs. In addition, the specific surface area of THEDES is certainly smaller than that of powdered API, which has a direct effect on the dissolution rate.
Extending the duration of a drug’s activity generally yields beneficial outcomes in health treatment. An extended-release formulation reduces side effects like toxicity, multiple dosage, and elevated blood concentrations by delaying the drug’s absorption. Additionally, this prolongs the duration of the drug’s effectiveness [33].
Models with a different number of parameters were selected to describe the dissolution kinetics of API in order to test which model best describes the experimental data obtained. The one-parameter first-order model (Equation (3)), two-parameter Weibull model (Equation (4)), and three-parameter Peppas–Sahlin model (Equation (5)) were used [34,35,36].
F = 100 1 e ( k 1 t )
F = 100 1 e t β / α
F = k 1 t m + k 2 t 2 m
The models were compared using the determination coefficient value, R2 (Table 5, Table 6 and Table 7).
The one-parameter first-order model and the Weibull model describe the experimental data of drug release in both samples equally well. The first-order model describes the release of the drug from a system where the release rate is proportional to the amount of drug remaining. The Weibull model is empirical, which makes it flexible and useful for describing the release from different types of systems, even when the release mechanisms are complex or unknown. In this model, b is a shape parameter whose value indicates the release mechanism of the API. When the value of b is around 1, which is the case for pure FpnCa, then the release is according to the first-order model. When b is greater than 1, the API is released by a more complex mechanism (in the case of FpnCa–LA (1:6)) [36,37]. The Peppas–Sahlin model is the least suitable for characterizing the release kinetics of FpnCa from THEDES, as evidenced by the most significant deviation from the actual values in Figure 7. This model is commonly used to study how drugs are released from polymer materials, which is a more complicated process, and its use helps explain why it does not match the experimental data well.

3.4. Pemeability Studies

The permeability test was carried out using THEDES FpnCa–LA (1:6) and an equal amount of FpnCa powder. The concentrations in this case were higher than those used for the API dissolution test. The initial concentration in the Franz cell was determined by the amount of THEDES required to completely cover the membrane between the two cells. The same initial concentration of 2200 mg/L was used for the measurement with pure FpnCa. Figure 8 shows the change in FpnCa concentration over time for both systems. The dependence of the concentration of the solute on time is initially linear, but the rate of dissolution of FpnCa gradually decreases. In both cases, the maximum concentration in the acceptor section is not reached, but is 60.2% for FpnCa and 88.4% for FpnCa–LA (1:6). Since the maximum solubility of FpnCa–LA (1:6) is much higher (Table 4), it can be assumed that part of THEDES is retained in the donor section of the Franz cell. However, when comparing the dissolution rates of the powder and the liquid, it becomes clear that FpnCa from THEDES dissolves much faster and more strongly, as was to be expected given the higher solubility of FpnCa in liquid. A permeability analysis at higher doses shows the solubility limitation of powdered FpnCa.
According to Equation (1), the permeability coefficient was derived from the linear part of the curve (Figure 8), while the diffusion coefficient was determined from Equation (2). The permeability coefficient was calculated from the beginning part of the curve, which is characterized by significant changes in API concentration over time, while the change in concentration during the second part is negligible. The permeability of FpnCa–LA (1:6) and FpnCa differs depending on its form (Table 8). The permeability of THEDES is increased almost three times in comparison to powdered API. In the form of THEDES, however, it is much higher. The diffusion coefficient is a parameter that describes the amount of API diffused over time; a larger diffusion coefficient indicates that API diffuses through the membrane faster (Figure 9). This is due to the particular formulation of FpnCa and the formation of hydrogen bonds in the mixture with LA.
Figure 9 shows the change in the diffusion coefficient determined for FpnCa and FpnCa–LA (1:6). The diffusion coefficient increases when FpnCa is dissolved from THEDES, which is consistent with the results shown in Figure 8. The driving force decreases as the API dissolves, which leads to a decrease in the diffusion coefficient with time. The trend of changes in the diffusion coefficient varies between the components studied. Since the dissolved components are in different states of aggregation, mass transfer may occur by a different mechanism. In addition, LA was dissolved together with THEDES, which could influence mass transfer and, consequently, the diffusion coefficient values.

4. Conclusions

Due to the change in structure from powder to liquid, the solubility of FpnCa from THEDES was significantly improved compared to powdered FpnCa. In addition, the release profile of THEDES differed from that of powdered FpnCa. Both the Weibull model and the first-order model successfully predicted the release profile of THEDES and powdered FpnCa. THEDES exhibited higher permeability and diffusion coefficient than powdered FpnCa. To ensure the successful use of THEDESs for therapeutic purposes, comprehensive stability studies during storage and application need to be performed.

Author Contributions

Conceptualization, J.P.K.; methodology, J.P.K., A.S. and I.Z.; validation, J.P.K. and I.Z.; formal analysis, J.P.K. and I.Z.; investigation, J.P.K., I.Z. and P.P.; resources, J.P.K. writing—original draft preparation, J.P.K., A.S. and I.Z.; writing—review and editing, J.P.K. and A.S.; visualization, J.P.K. and A.S.; supervision, J.P.K. and A.S. All authors have read and agreed to the published version of the manuscript.

Funding

This research received no external funding.

Data Availability Statement

Data are available upon request.

Conflicts of Interest

Patricija Pelin was employed by the Hospira Zagreb d.o.o. The remaining author declare that the research was conducted in the absence of any commercial or financial relationships that could be construed as a potential conflict of interest.

References

  1. Duarte, A.R.C.; Ferreira, A.S.D.; Barreiros, S.; Cabrita, E.; Reis, R.L.; Paiva, A. A Comparison between Pure Active Pharmaceutical Ingredients and Therapeutic Deep Eutectic Solvents: Solubility and Permeability Studies. Eur. J. Pharm. Biopharm. 2017, 114, 296–304. [Google Scholar] [CrossRef] [PubMed]
  2. Pedro, S.N.; Freire, C.S.R.; Silvestre, A.J.D.; Freire, M.G. Deep Eutectic Solvents and Pharmaceuticals. Encyclopedia 2021, 1, 942–963. [Google Scholar] [CrossRef]
  3. Kumari, L.; Choudhari, Y.; Patel, P.; Gupta, G.D.; Singh, D.; Rosenholm, J.M.; Bansal, K.K.; Kurmi, B.D. Advancement in Solubilization Approaches: A Step towards Bioavailability Enhancement of Poorly Soluble Drugs. Life 2023, 13, 1099. [Google Scholar] [CrossRef]
  4. Bhalani, D.V.; Nutan, B.; Kumar, A.; Singh Chandel, A.K. Bioavailability Enhancement Techniques for Poorly Aqueous Soluble Drugs and Therapeutics. Biomedicines 2022, 10, 2055. [Google Scholar] [CrossRef] [PubMed]
  5. Singh, D.; Bedi, N.; Tiwary, A.K. Enhancing Solubility of Poorly Aqueous Soluble Drugs: Critical Appraisal of Techniques. J. Pharm. Investig. 2018, 48, 509–526. [Google Scholar] [CrossRef]
  6. Nyamba, I.; Sombié, C.B.; Yabré, M.; Zimé-Diawara, H.; Yaméogo, J.; Ouédraogo, S.; Lechanteur, A.; Semdé, R.; Evrard, B. Pharmaceutical Approaches for Enhancing Solubility and Oral Bioavailability of Poorly Soluble Drugs. Eur. J. Pharm. Biopharm. 2024, 204, 114513. [Google Scholar] [CrossRef] [PubMed]
  7. Mahmood, T.; Sarfraz, R.M.; Ismail, A.; Ali, M.; Khan, A.R. Pharmaceutical Methods for Enhancing the Dissolution of Poorly Water-Soluble Drugs. ASSAY Drug Dev. Technol. 2023, 21, 65–79. [Google Scholar] [CrossRef]
  8. Pedro, S.N.; Freire, M.G.; Freire, C.S.R.; Silvestre, A.J.D. Deep Eutectic Solvents Comprising Active Pharmaceutical Ingredients in the Development of Drug Delivery Systems. Expert Opin. Drug Deliv. 2019, 16, 497–506. [Google Scholar] [CrossRef]
  9. Smith, E.L.; Abbott, A.P.; Ryder, K.S. Deep Eutectic Solvents (DESs) and Their Applications. Chem. Rev. 2014, 114, 11060–11082. [Google Scholar] [CrossRef]
  10. Tomé, L.I.N.; Baião, V.; Da Silva, W.; Brett, C.M.A. Deep Eutectic Solvents for the Production and Application of New Materials. Appl. Mater. Today 2018, 10, 30–50. [Google Scholar] [CrossRef]
  11. Sarraguça, M.C.; Ribeiro, P.R.S.; Nunes, C.; Seabra, C.L. Solids Turn into Liquids—Liquid Eutectic Systems of Pharmaceutics to Improve Drug Solubility. Pharmaceuticals 2022, 15, 279. [Google Scholar] [CrossRef] [PubMed]
  12. Lomba, L.; Garralaga, M.P.; Werner, Á.; Giner, B.; Baptista, P.M.; Sánchez-Romero, N. Ibuprofen Solubility and Cytotoxic Study of Deep Eutectic Solvents Formed by Xylitol, Choline Chloride and Water. J. Drug Deliv. Sci. Technol. 2023, 82, 104327. [Google Scholar] [CrossRef]
  13. Pereira, J.; Miguel Castro, M.; Santos, F.; Rita Jesus, A.; Paiva, A.; Oliveira, F.; Duarte, A.R.C. Selective Terpene Based Therapeutic Deep Eutectic Systems against Colorectal Cancer. Eur. J. Pharm. 2022, 175, 13–26. [Google Scholar] [CrossRef]
  14. Santos, F.; P.S. Leitão, M.I.; C. Duarte, A.R. Properties of Therapeutic Deep Eutectic Solvents of L-Arginine and Ethambutol for Tuberculosis Treatment. Molecules 2018, 24, 55. [Google Scholar] [CrossRef] [PubMed]
  15. Pedro, S.N.; Gomes, A.T.P.C.; Oskoei, P.; Oliveira, H.; Almeida, A.; Freire, M.G.; Silvestre, A.J.D.; Freire, C.S.R. Boosting Antibiotics Performance by New Formulations with Deep Eutectic Solvents. Int. J. Pharm. 2022, 616, 121566. [Google Scholar] [CrossRef] [PubMed]
  16. Javed, S.; Mangla, B.; Sultan, M.H.; Almoshari, Y.; Sivadasan, D.; Alqahtani, S.S.; Madkhali, O.A.; Ahsan, W. Pharmaceutical Applications of Therapeutic Deep Eutectic Systems (THEDES) in Maximising Drug Delivery. Heliyon 2024, 10, e29783. [Google Scholar] [CrossRef]
  17. Bhoge, S.M.; Kshirsagar, P.; Richhariya, S.; Singh, K. Crystalline Form of Fosamprenavir Calcium. US20120208787A1, 16 August 2012. Available online: https://patents.google.com/patent/US20120208787A1/en (accessed on 11 March 2025).
  18. Bhoge, S.M.; Kshirsagar, P.; Richhariya, S.; Agrawal, A.; Singh, K. Amorphous Fosamprenavir Calcium. US20120135965A1, 31 May 2012. Available online: https://patents.google.com/patent/US20120135965A1/en (accessed on 11 March 2025).
  19. Cordeiro, C.F.; Bettio, I.; Trevisan, M.G. Studies on the Characterization and Polymorphic Stability of Fosamprenavir. An. Acad. Bras. Ciênc. 2020, 92, e20181021. [Google Scholar] [CrossRef]
  20. Widjaja, T.; Hendrianie, N.; Nurkhamidah, S.; Altway, A.; Yusuf, B.; F, F.; Rohma, A.A.Z.; Pahlevi, A. Poly Lactic Acid Production Using the Ring Opening Polymerization (ROP) Method Using Lewis Acid Surfactant Combined Iron (Fe) Catalyst (Fe(DS)3). Heliyon 2023, 9, e17985. [Google Scholar] [CrossRef]
  21. Pires, I.V.; Sakurai, Y.C.N.; Ferreira, N.R.; Moreira, S.G.C.; Da Cruz Rodrigues, A.M.; Da Silva, L.H.M. Elaboration and Characterization of Natural Deep Eutectic Solvents (NADESs): Application in the Extraction of Phenolic Compounds from Pitaya. Molecules 2022, 27, 8310. [Google Scholar] [CrossRef]
  22. Alotaibi, M.A.; Malik, T.; Naeem, A.; Khan, A.S.; Ud Din, I.; Shaharun, M.S. Exploring the Dynamic World of Ternary Deep Eutectic Solvents: Synthesis, Characterization, and Key Properties Unveiled. Heliyon 2024, 10, e40521. [Google Scholar] [CrossRef]
  23. Mu, L.; Gao, J.; Zhang, Q.; Kong, F.; Zhang, Y.; Ma, Z.; Sun, C.; Lv, S. Research Progress on Deep Eutectic Solvents and Recent Applications. Processes 2023, 11, 1986. [Google Scholar] [CrossRef]
  24. Srivastava, N.; Mishra, Y.; Mishra, V. Fosamprenavir calcium loaded dendrimers: Formulation development, evaluation and hemolytic toxicity studies. Int. J. App. Pharm. 2023, 15, 342–352. [Google Scholar] [CrossRef]
  25. Pretsch, E.; Bühlmann, P.; Badertscher, M. Structure Determination of Organic Compounds: Tables of Spectral Data; Springer: Berlin/Heidelberg, Germany, 2020. [Google Scholar] [CrossRef]
  26. Hayyan, M.; Abo-Hamad, A.; AlSaadi, M.A.; Hashim, M.A. Functionalization of Graphene Using Deep Eutectic Solvents. Nanoscale Res. Lett. 2015, 10, 324. [Google Scholar] [CrossRef] [PubMed]
  27. Banjare, M.K.; Behera, K.; Satnami, M.L.; Pandey, S.; Ghosh, K.K. Self-Assembly of a Short-Chain Ionic Liquid within Deep Eutectic Solvents. RSC Adv. 2018, 8, 7969–7979. [Google Scholar] [CrossRef] [PubMed]
  28. Ravi, T.; Masri, A.N.; Ibrahim, I.M. Choline-Based Deep Eutectic Solvent for Extractive Oxidative Desulfurization of Model Oil. E3S Web Conf. 2024, 488, 03004. [Google Scholar] [CrossRef]
  29. Ali, M.A.; Kaium, M.A.; Uddin, S.N.; Uddin, M.J.; Olawuyi, O.; Campbell, A.D.; Saint-Louis, C.J.; Halim, M.A. Elucidating the Structure, Dynamics, and Interaction of a Choline Chloride and Citric Acid Based Eutectic System by Spectroscopic and Molecular Modeling Investigations. ACS Omega 2023, 8, 38243–38251. [Google Scholar] [CrossRef]
  30. Trombino, S.; Siciliano, C.; Procopio, D.; Curcio, F.; Laganà, A.S.; Di Gioia, M.L.; Cassano, R. Deep Eutectic Solvents for Improving the Solubilization and Delivery of Dapsone. Pharmaceutics 2022, 14, 333. [Google Scholar] [CrossRef]
  31. Bongioanni, A.; Soledad Bueno, M.; Alejandra Mezzano, B.; Raquel Longhi, M.; Garnero, C. Pharmaceutical Crystals: Development, Optimization, Characterization and Biopharmaceutical Aspects. In Crystal Growth and Chirality—Technologies and Applications; Marzouki, R., Akitsu, T., Eds.; IntechOpen: London, UK, 2023. [Google Scholar] [CrossRef]
  32. Aroso, I.M.; Silva, J.C.; Mano, F.; Ferreira, A.S.D.; Dionísio, M.; Sá-Nogueira, I.; Barreiros, S.; Reis, R.L.; Paiva, A.; Duarte, A.R.C. Dissolution Enhancement of Active Pharmaceutical Ingredients by Therapeutic Deep Eutectic Systems. Eur. J. Pharm. Biopharm. 2016, 98, 57–66. [Google Scholar] [CrossRef]
  33. Reddy, D.V.; Rao, A.S. A Review on Oral Extended Release Technology. Res. J. Pharm. Technol. 2015, 8, 1454. [Google Scholar] [CrossRef]
  34. Dash, S.; Murthy, P.N.; Nath, L.; Chowdhury, P. Kinetic Modeling on Drug Release from Controlled Drug Delivery Systems. Acta. Pol. Pharm. 2010, 67, 217–223. [Google Scholar]
  35. Ramteke, K.H.; Dighe, P.A.; Kharat, A.R.; Patil, S.V. Mathematical Models of Drug Dissolution: A Review. Sch. Acad. J. Pharm. 2014, 3, 388–396. [Google Scholar]
  36. Trucillo, P. Drug Carriers: A Review on the Most Used Mathematical Models for Drug Release. Processes 2022, 10, 1094. [Google Scholar] [CrossRef]
  37. Martín-Camacho, U.D.J.; Rodríguez-Barajas, N.; Sánchez-Burgos, J.A.; Pérez-Larios, A. Weibull β Value for the Discernment of Drug Release Mechanism of PLGA Particles. Int. J. Pharm. 2023, 640, 123017. [Google Scholar] [CrossRef] [PubMed]
Figure 1. Molecular structures of THEDES compounds.
Crystals 15 00350 g001
Figure 2. XRD pattern of FpnCa used for preparation of THEDES.
Crystals 15 00350 g002
Figure 3. FTIR spectra of FpnCa, LA, and FpnCa–LA (1:4, 1:6 and 1:8).
Crystals 15 00350 g003
Figure 4. Micrographs of prepared THEDES, (a) FpnCa–LA (1:4), (b) FpnCa–LA (1:6) and (c) FpnCa–LA (1:8) at 40× magnification.
Crystals 15 00350 g004
Figure 5. Appearance of crystals in the FpnCa–LA (1:4) sample after one week.
Crystals 15 00350 g005
Figure 6. 1H NMR spectra of FpnCa, LA, and FpnCa–LA (1:6).
Crystals 15 00350 g006
Figure 7. Experimentally data release kinetics in acetate buffer of (a) FpnCa in powdered form and (b) FpnCa–LA (1:6).
Crystals 15 00350 g007
Figure 8. Change in concentration of the API in the acceptor part of the Franz cell.
Crystals 15 00350 g008
Figure 9. Changes in the diffusion coefficient, D, of FpnCa and FpnCa–LA (1:6).
Crystals 15 00350 g009
Table 1. List of prepared THEDESs.
THEDESMolar Ratio
FpnCa–LA1:4
FpnCa–LA1:6
FpnCa–LA1:8
Table 2. Data for calculating the permeability coefficient and diffusion coefficient.
A, m2h, mV2, m3
4.91 × 10−44.00 × 10−56.50 × 10⁻⁶
Table 3. FTIR [19,24,25] absorption bands assignment for FpnCa, LA, and FpnCa–LA (1:6).
Wave Number, cm−1Assignment
FpnCa3475.75O-H (water) or N-H (amino group, amide, carbamate) stretching
3374.50O-H (water) or N-H (amino group, amide, carbamate) stretching
2972.79C-H stretching (aliphatic chains in tetrahydrofuran ring and alkyl groups)
2871.84C-H stretching (aliphatic chains in tetrahydrofuran ring and alkyl groups)
1665.31C=O stretching (amide, carbamate)
1619.51C=C stretching (AR-ring) or N-H bending (amide)
1597.81C=C stretching (AR-ring) or N-H bending (amide)
1507.17C=C stretching (AR-ring) or N-H bending (amide)
1423.31C-H bending (aliphatic)
1392.68C-H bending (aliphatic)
1366.59C-H bending (aliphatic)
1343.73C-H bending (aliphatic)
1323.48C-H bending (aliphatic)
1272.44C-O; S=O (sulfonamide group); P=O (Phosphonate group) Stretching
1229.34C-O; S=O (sulfonamide group); P=O (Phosphonate group) Stretching
1161.48C-O; S=O (sulfonamide group) Stretching
1096.39C-O stretching; P-O stretching
1048.19C-O stretching; P-O stretching
982.12P-O stretching
904.50C-H bending (Ar-ring)
827.35C-H bending (Ar-ring)
759.85C-H bending (Ar-ring)
705.37C-H bending (Ar-ring)
LA3600–3000O-H stretching
2991.20C-H stretching (aliphatic)
2945.40C-H stretching (aliphatic)
1722.21C=O stretching (carbonyl groups: carboxylic acid and ester linkage)
1454.14C-H bending (aliphatic)
1376.51C-H bending (aliphatic)
1197.16C-O stretching (ester linkage, carboxylic acid, alcohol group)
1119.05C-O stretching (ester linkage, carboxylic acid, alcohol group)
1039.98C-O stretching (ester linkage, carboxylic acid, alcohol group)
919.92O-H bending (carboxylic acid)
865.44C-C stretching of the polymer backbone or C-H out of plane bends
821.09C-C stretching of the polymer backbone or C-H out of plane bends
746.35
FpnCa–LA (1:6)3362.93O-H (water, LA) or N-H (FpnCa) stretching
3252.34O-H (water, LA) or N-H (FpnCa) stretching
2984.45C-H stretching (aliphatic from both compounds)
2876.45C-H stretching (aliphatic from both compounds)
1699.06C=O stretching (both compounds)
1637.23C=C stretching (AR-ring) and N-H bending (amide)
1596.37C=C stretching (AR-ring) and N-H bending (amide)
1528.73C=C stretching (AR-ring) and N-H bending (amide)
1498.01C=C stretching (AR-ring) and N-H bending (amide)
1454.62C-H bending (aliphatic from both compounds)
1420.39C-H bending (aliphatic from both compounds)
1404.09C-H bending (aliphatic from both compounds)
1372.65C-H bending (aliphatic from both compounds)
1339.15C-H bending (aliphatic from both compounds)
1315.76C-H bending (aliphatic from both compounds)
1290.19–1170.11C-O; S=O (sulfonamide group); P=O (Phosphonate group) Stretching
1207.28C-O stretching; P-O stretching
1153.99C-O; S=O (sulfonamide group) Stretching
1124.83C-O stretching; P-O stretching
1088.19C-O stretching; P-O stretching
1038.53C-O stretching; P-O stretching
1008.87C-O stretching; P-O stretching
968.59Possible O-H bending (carboxyilic acid) and other bending modes
950.72Possible O-H bending (carboxyilic acid) and other bending modes
930.05Possible O-H bending (carboxyilic acid) and other bending modes
867.41C-H bending (Ar-ring)
830.25C-H bending (Ar-ring)
749.73C-H bending (Ar-ring)
701.51C-H bending (Ar-ring)
Table 4. Maximum solubility of sample FpnCa–LA (1:6) and FpnCa in powder form.
Maximum SolubilityIn Water, mg/LIn Buffer, mg/L
FpnCa4012860
FpnCa–LA (1:6)14906440
Table 5. Parameters and R2 values for kinetic first-order model, Equation (3).
First-Order ModelKR2
FpnCa–LA0.1700.982
FpnCa–LA (1:6)0.0630.991
Table 6. Parameters and R2 values for kinetic Weilbull model, Equation (4).
Weilbull ModelαβR2
FpnCa–LA23.0531.7150.994
FpnCa–LA (1:6)13.2580.9670.994
Table 7. Parameters and R2 values for kinetic Peppas–Shalin model, Equation (5).
Peppas–Shalin Modelk1k2mR2
FpnCa–LA48.081−5.4180.3370.928
FpnCa–LA (1:6)19.362−0.8600.5050.971
Table 8. Permeability, P, of FpnCa–LA (1:6), and FpnCa obtained from Equation (3).
FpnCa–LA (1:6)FpnCa
P, m/s4.23 × 10−71.51 × 10⁻⁷
Disclaimer/Publisher’s Note: The statements, opinions and data contained in all publications are solely those of the individual author(s) and contributor(s) and not of MDPI and/or the editor(s). MDPI and/or the editor(s) disclaim responsibility for any injury to people or property resulting from any ideas, methods, instructions or products referred to in the content.

