Article

Procedures for X-Ray Diffraction Phase Analysis: The Case of Fine Sediments from Peña Blanca, Chihuahua, Mexico

by
Carmen del Rocio Caraveo-Castro
1,
Yair Rodríguez-Guerra
1,
Luis Fuentes-Montero
2,
Andrés Isaak González-Jacquez
1,
Luis E. Fuentes-Cobas
1,* and
María Elena Montero-Cabrera
1,*
1
Centro de Investigación en Materiales Avanzados, Miguel de Cervantes 120, Complejo Industrial Chihuahua, Chihuahua 31136, Mexico
2
Diamond Light Source, Harwell Science and Innovation Campus, Didcot OX11 0DE, UK
*
Authors to whom correspondence should be addressed.
Crystals 2025, 15(2), 169; https://doi.org/10.3390/cryst15020169
Submission received: 22 December 2024 / Revised: 4 February 2025 / Accepted: 6 February 2025 / Published: 10 February 2025
(This article belongs to the Section Inorganic Crystalline Materials)

Abstract

:
In a broad project designed to examine uranium transport by surface water from Sierra Peña Blanca to Laguna del Cuervo in the Chihuahuan Desert, sediments from intermittent streams and the lagoon have been extracted and studied. Two samples were sediments from the high area of the Sierra, close to the uranium deposit “El Nopal.” Moreover, 23 core segments extracted for dating sediments were analyzed to consider changes in the fine component concentrations. The techniques of scanning electron microscopy–energy dispersive X-ray spectroscopy, XRD in a conventional diffractometer, and high-resolution synchrotron XRD analysis were applied. The crystallographic objective of the present work was to evaluate the functionality of various methodologies when applied to cases of a detailed analysis of many polyphase samples with cryptocrystals. The methods for processing the experimental data were the Rietveld method in the current multi-pattern variant of the Fullprof program and the degree of crystallinity method for the rapid estimation of the proportion of cryptocrystals in a mixture. This last technique was developed with an ad hoc software package deposited in the GitLab public repository.

1. Introduction

Sierra Peña Blanca (SPB) is in the center of the state of Chihuahua and is part of the Chihuahuan Desert. The Chihuahuan Desert [1] is the largest in North America, covering about 450,000 km2. The SPB site has about 50% of Mexico’s uranium reserves. Goodell [2] and Reyes Cortes [3] reported the mineralogical characterization of SPB in the 1980s.
The Peña Blanca uraniferous district contains 104 prospects, of which many have superficial manifestations. The uranium of SPB was explored and exploited in the 1980s. After the closure of operations, hundreds of tons of unprocessed U ore were confined to rocky stacks and exposed to weathering. Several open pit ore deposits also remained uncovered. Subject to leaching by the scarce but torrential desert rains, this uranium is transported from the mountains by intermittent tributary streams to Laguna del Cuervo. Stream sediments carry debris from igneous rocks and uranium minerals from SPB and constitute archives of the processes that these minerals have undergone [4].
The study of the transport of environmental uranium in Chihuahua to more or less populated areas is motivated by the feasible contamination and bioavailability of uranium and its radioactive decay products in these regions. Natural uranium presents the following isotopic abundances and half-lives (T½): 234U—0.0054%, T½ = 2.455 × 10⁵ y; 235U—0.7204%, T½ = 7.04 × 10⁸ y; and 238U—99.2742%, T½ = 4.468 × 10⁹ y [5]. The decay series of 238U includes the isotopes 222Rn, T½ = 3.8 days, which produces solid daughter isotopes that include 210Pb, T½ = 22.3 y. The series ends in the stable isotope 206Pb. Sediment dating isused to determine the recent history of possible elemental contamination using the radioactive isotopes 210Pb and 137Cs as tracers. The first results from the disintegration of 222Rn escaping from the 238U decay series in rocks and soils, and the second results from atmospheric nuclear explosion tests and nuclear power plant accidents [6,7]. These isotopes adsorb to atmospheric aerosols. Sediment dating assumes that atmospheric 210Pb, or unsupported 210Pbuns, precipitates by wet and dry depositions and accumulates in underwater sediments. 210Pbuns from the fallout (also called excess) is incorporated into the supported (or base) 210Pbsup resulting from the decay of 238U and its product, 226Ra, from the sediment matrix. Radioactive decay produces an exponential decrease in the activity concentration of 210Pbuns relative to the time elapsed since its deposition [6,7]. This dating procedure is generally considered applicable to the most recent 150 years. The technique involves the collection of sedimentary cores extracted from unaltered underwater areas, in which the most recent surface layer is preferably preserved. The dating of recent coastal, lacustrine, and freshwater reservoir sediments is possible if certain conditions are met [8] but is often difficult in arid areas with low rainfall regimes since aerosols are the agents that allow the nucleation of water vapor and the formation of clouds [9]. In turn, aerosols are precipitated primarily by rainfall.
The granulometry and mineral phases of the sediments reflect their mineral origin and location in the mountain range, from the top of the massif to the alluvial plain. Uranyl adsorption strongly depends on this grain size [10,11], with the smaller fractions (particle size < 2 μm) accounting for the largest proportion [12]. These properties are characteristic of the minerals in these fine fractions, which are therefore used to identify the presence of uranium and radionuclides in sediments and floodplains [13,14,15], and are investigated and used in practice to remove and immobilize them at contaminated sites [16,17,18]. The content of the fine fractions is related to the climate and the minerals that gave rise to them. Numerous studies have shown that 210Pb is preferentially bound to fine-grained particles [19,20,21]. These fine and cryptocrystalline phases also transport the long-lived radon-progeny isotopes 210Pb, 210Bi, and 210Po [22]. In dating recent sediments by 210Pbuns activity concentrations, it is advisable to normalize them to the concentrations of the finer fractions in each segment, and there are several procedures to follow [23]. In this context, it is important to characterize the content of very fine or cryptocrystalline phases because these particles are transported by the wind [10].
X-ray diffraction (XRD) is one of the most widely used techniques in mineralogy. The method allows a crystal structure determination and qualitative and quantitative phase analyses [24]. The Rietveld method (RM) [25] is frequently used. It consists of fitting the structural parameters of the phases present and of the experiment to the complete profile of the powder diffractogram. A quantitative phase analysis by the RM requires the crystal structures of all phases within the sample to be known [26]. Phase identification is performed with the help of crystallographic and diffraction databases [27,28,29,30] and by the application of search-match programs [31]. The introduction of artificial intelligence tools in this field is a tendency nowadays [32,33,34]. Widely used RM programs are, among others, Fullprof [35], MAUD [36], TOPAS [37], BGMN [38], and GSAS [39].
Some possible sample characteristics that make quantification difficult are texture, the mixture of crystalline and amorphous or cryptocrystalline phases, and unknown or variable crystal structures. Results from XRD, scanning electron microscopy–energy dispersive X-ray spectroscopy (SEM-EDS), and elemental analysis by X-ray fluorescence or ICP are often combined to validate the chemical composition of the samples.
Madsen et al. [40] reviewed different XRD methods applicable to a mixture of crystalline polymorphs and amorphous material with equal or similar chemical composition. They mention the following techniques:
  • Internal standard [41];
  • External standard [42,43];
  • Linear calibration model method [44];
  • PONKCS (Partial or No Known Crystal Structure) [45];
  • Degree of crystallinity (DoC) [46];
  • Full structure [40].
The PONKCS method [47] allows the quantification of the crystalline phases and the amorphous contribution. XRD and RM are successfully used in the study of minerals, with a large contribution from cryptocrystalline phases, such as bentonites [40]. Geochemical studies involving fine mineral fractions [48,49], with their cryptocrystalline components, address a complex mixture of clays, feldspars, quartz, and calcite.
The present investigation has a geological and a crystallographic objective.
The geological objective has been to characterize representative uranium-free samples during ongoing research on uranium transport by surface water to Laguna del Cuervo. Two samples (“Nopal” and “Tigre”) are sediments from the high area of the Sierra, close to the uranium deposit. Twenty-three segments of a sedimentary core were analyzed to study 150 years of history of the eventual uranium contamination of sediments. The crystallographic objective is to fine-tune and evaluate the functionality of various methodologies when applied to cases of the detailed analysis and rapid characterization of many polyphase samples with cryptocrystals. The experiments performed are conventional diffraction in a laboratory diffractometer and high-resolution diffraction in a synchrotron. The methods for processing the experimental data are the Rietveld method in the current multi-pattern variant of the Fullprof program and the degree of crystallinity method for the rapid estimation of the proportion of cryptocrystals in a mixture. This last technique was developed with an ad hoc software package deposited in the public repository GitLab.

2. Materials and Methods

2.1. Sampling

Sediment samples Nopal and Tigre were gathered at streams close to the Nopal 1 uranium deposits at SPB. Sampling followed regulations [50], using a 50 cm square frame, avoiding large stones, and collecting about 5 kg per sample in labeled polypropylene bags. The sediments were classified by granulometry into coarse sand, fine sand, silt, and clay [51]. Vibrational meshing was used at 15 min intervals. Sediments passing through the 200 mesh (0.074 mm) were classified as fine silt + clay.
The sedimentary core was obtained at coordinates 29.25° N and 105.9° W on 24 March 2020. It was extracted manually using a 4-inch-diameter thick-walled PVC pipe with a steel top guard to a depth of 60 cm from the surface. The sampling recommendations of [52] were followed. The core was divided into 2.5 cm fractions, resulting in 23 core segments. Each fraction was classified in descending order. The part of each segment subjected to elemental analysis, electron microscopy, and XRD phase analysis was dried and manually ground in an agate mortar.

2.2. Procedures for Dating with 210Pb and 137Cs

The dating of recent sediments is carried out on the experimental basis of determining the activity concentration of the isotope 210Pbuns in the core segments. Radioactivity measurements allow the determination of 137Cs and 210Pbtotal. The value of 210Pbuns is calculated from the determination of 210Pbsup, assuming the secular equilibrium (equality of activities) between the members of the series from 226Ra to 210Pbsup in the samples. Secular equilibrium is obtained if the escape of 222Rn gas from the container of the sample to be measured is prevented and approximately 8–10 half-lives of 222Rn elapse.
In this work, the activity concentrations of 210Pb and 137Cs were determined by high-resolution gamma spectrometry on a Canberra HPGe detector XtRa, model GX1020, with a carbon composite window. The measurements were carried out using a Canberra Multiport II analyzer and the Genie 2000 software version 3.2.1 to record the spectra. The gamma spectral analysis was achieved using bGamma software, version 1.6.2, 2024, BrightSpec N.C., Niel, Belgium.
The activities of 214Pb and 214Bi were determined, assuming equilibrium with 226Ra. The intense 226Ra line that appears in spectra frequently is not used to determine its activity directly since it inevitably overlaps with the most intense 235U line in the sample. To ensure secular equilibrium, 7 cm diameter Teflon cylindrical vials sealed with parafilm were used, and at least 30 days were allowed to measure the spectrum. In the gamma spectrometer, measurements were then carried out for periods between 7 and 11 days. To ensure good geometry concerning the detector, 1 cm of sedimentary material was filled into each vial; all samples met this condition.
The calibration of the detector efficiency with the described cylindrical geometry and a model SiO2 matrix was performed by transferring an experimental efficiency of a monoenergetic isotope point source (Eckert & Ziegler Isotope Products, Valencia, CA, USA) for the energy range from 46.54 keV (210Pb) to 1836.06 keV (88Y) with the EGSnrc simulation code [53,54] by the Monte Carlo method [55]. The simulation included the correction of the intensities by the real coincidences of the isotopes contained in the point source and those in the transitions of the isotopes of the 238U series of interest. Replicate analyses of the certified reference material IAEA-375 [56,57] (soil) provided consistent results within the 2σ uncertainty of the reported activities for lines 46.7 keV (210Pb), 351.9 keV (214Pb), 609.3 keV (214Bi), and 1764 keV (214Bi).
The activity concentrations were determined for the isotopes 210Pb (46.7 keV), 214Pb (351.9 keV), 214Bi (609.3 keV), and 137Cs (661.6 keV). The activity of 226Ra was calculated from the average of the equilibrium isotopes 214Pb and 214Bi. The MDA (minimum detectable activity [58]) of 137Cs for the geometry and matrix used, measured between 7 and 11 days, was 8.5 × 10⁻⁵ Bq/kg.
To consider the limit period of dating by 210Pbuns, it must be several times higher than its detection limit, which is affected by the fact that it is the difference between the measured concentrations of 210Pbtotal and 210Pbsup [7]. The maximum estimate for dating of 150 years assumes high activities that are difficult to record in arid environments. 137Cs is of great importance because it is an anthropogenic contaminant produced by the fission of 235U, which is considered to provide historical “markers” for dating recent sediments. In unmixed sediments, 137Cs could not be detected before the nuclear explosions of 1945. The first nuclear explosion test occurred in Alamogordo, 500 km north of the Sierra Peña Blanca and Laguna del Cuervo.

2.3. General Characterization of Samples

An inductively coupled plasma atomic emission spectroscopy (ICP-OES) elemental chemical analysis was used to determine the presence of several elements common in the SPB rocks (Al, Ca, Fe, K, Mg, Mn, Na, Si, and Ti). It was applied to the 23 segment samples of the sediment core collected at the flood plain. The samples were chemically digested, and the analysis was run on an ICP-OES Thermo Jarrell Ash, IRIS AP/Duo.
Secondary and backscattering electron images of sedimentary core samples were obtained using a Hitachi SU3500 scanning electron microscope, with 15 kV and 20 kV operating voltages, respectively. The qualitative and semi-quantitative elemental analyses were performed in EDS mode with an OXFORD Model X-MAX spectrometer. Backscattering electron images of samples Nopal and Tigre were obtained with the SEM field emission JEOL JSM7401F.

2.4. XRD Characterization of Samples

Samples from the Nopal and Tigre sites were measured using conventional (Lab) and high-resolution (Sync) diffraction. The 23 samples from Laguna del Cuervo were examined using Lab diffraction. Conventional patterns were measured in a PANalytical X’Pert Pro diffractometer in Bragg–Brentano geometry, with a PIXcel3D detector using filtered CuKα radiation, measuring the interval 2θ = [2.5, 60°] and step Δ(2θ) = 0.0130°. High-resolution XRD patterns was observed at the MCX beamline of Sincrotrone Elettra Trieste, with a flat sample geometry, wavelength λ = 0.8265616 Å, measuring interval 2θ = [2.0, 40°], and step Δ(2θ) = 0.01°. The instrumental resolution data for both groups of experiments were measured with LaB6 standards. Sync diffraction patterns were converted to the CuKα wavelength (script deposited in GitLab) to facilitate diverse comparisons.
Diffraction data of the Nopal and Tigre samples were interpreted via Rietveld refinement. Qualitative phase identification was performed with the Match program. Crystal structures were found in the Crystal Open Database [27]. Quantification of phases’ concentrations, small variations in lattice parameters, and deviations from crystal perfection (nanometric crystal sizes and heterogeneity of cell dimensions) were obtained by applying the Rietveld program Fullprof.
The study of the 23 samples from Laguna del Cuervo was carried out in two parallel ways.
Rietveld formal analysis: The multi-pattern variant of Fullprof was applied. This method allows the reinforcement of the systematic nature of the scan through the set of considered samples, keeping specific parameters constant and refining selectively in each sample. The method leads to the detailed characterization of each sample, including a quantitative analysis of all the phases present. The time required to complete this type of analysis is in the order of hours; in complicated cases, it can take days.
Rapid estimation of the concentration of cryptocrystals in clays: Determining this % is an important claim of the geological component of the investigation. To satisfy this, a rapid, computerized procedure was developed. The technique is a variant of the above-mentioned method for determining the DoC. It is based on approximating the concentration of cryptocrystalline material to the ratio between the respective areas above the background in the XRD pattern. Symbolically,
c r y p t o c r y s t a l l i n e   m a t e r i a l   c o n c e n t r a t i o n a r e a c r y p t o a r e a c r y p t o + c r y s t a l
A combined [Rietveld + DoC] system for sediment analysis has been developed in our laboratory. The program ANALIA (ANALytical Integration Application), written in mixed programming languages [Python + the renowned program FullProf], performs data processing. ANALIA is an open-source code; it has been deposited in the GitLab public repository and is described in the Results section.

3. Results

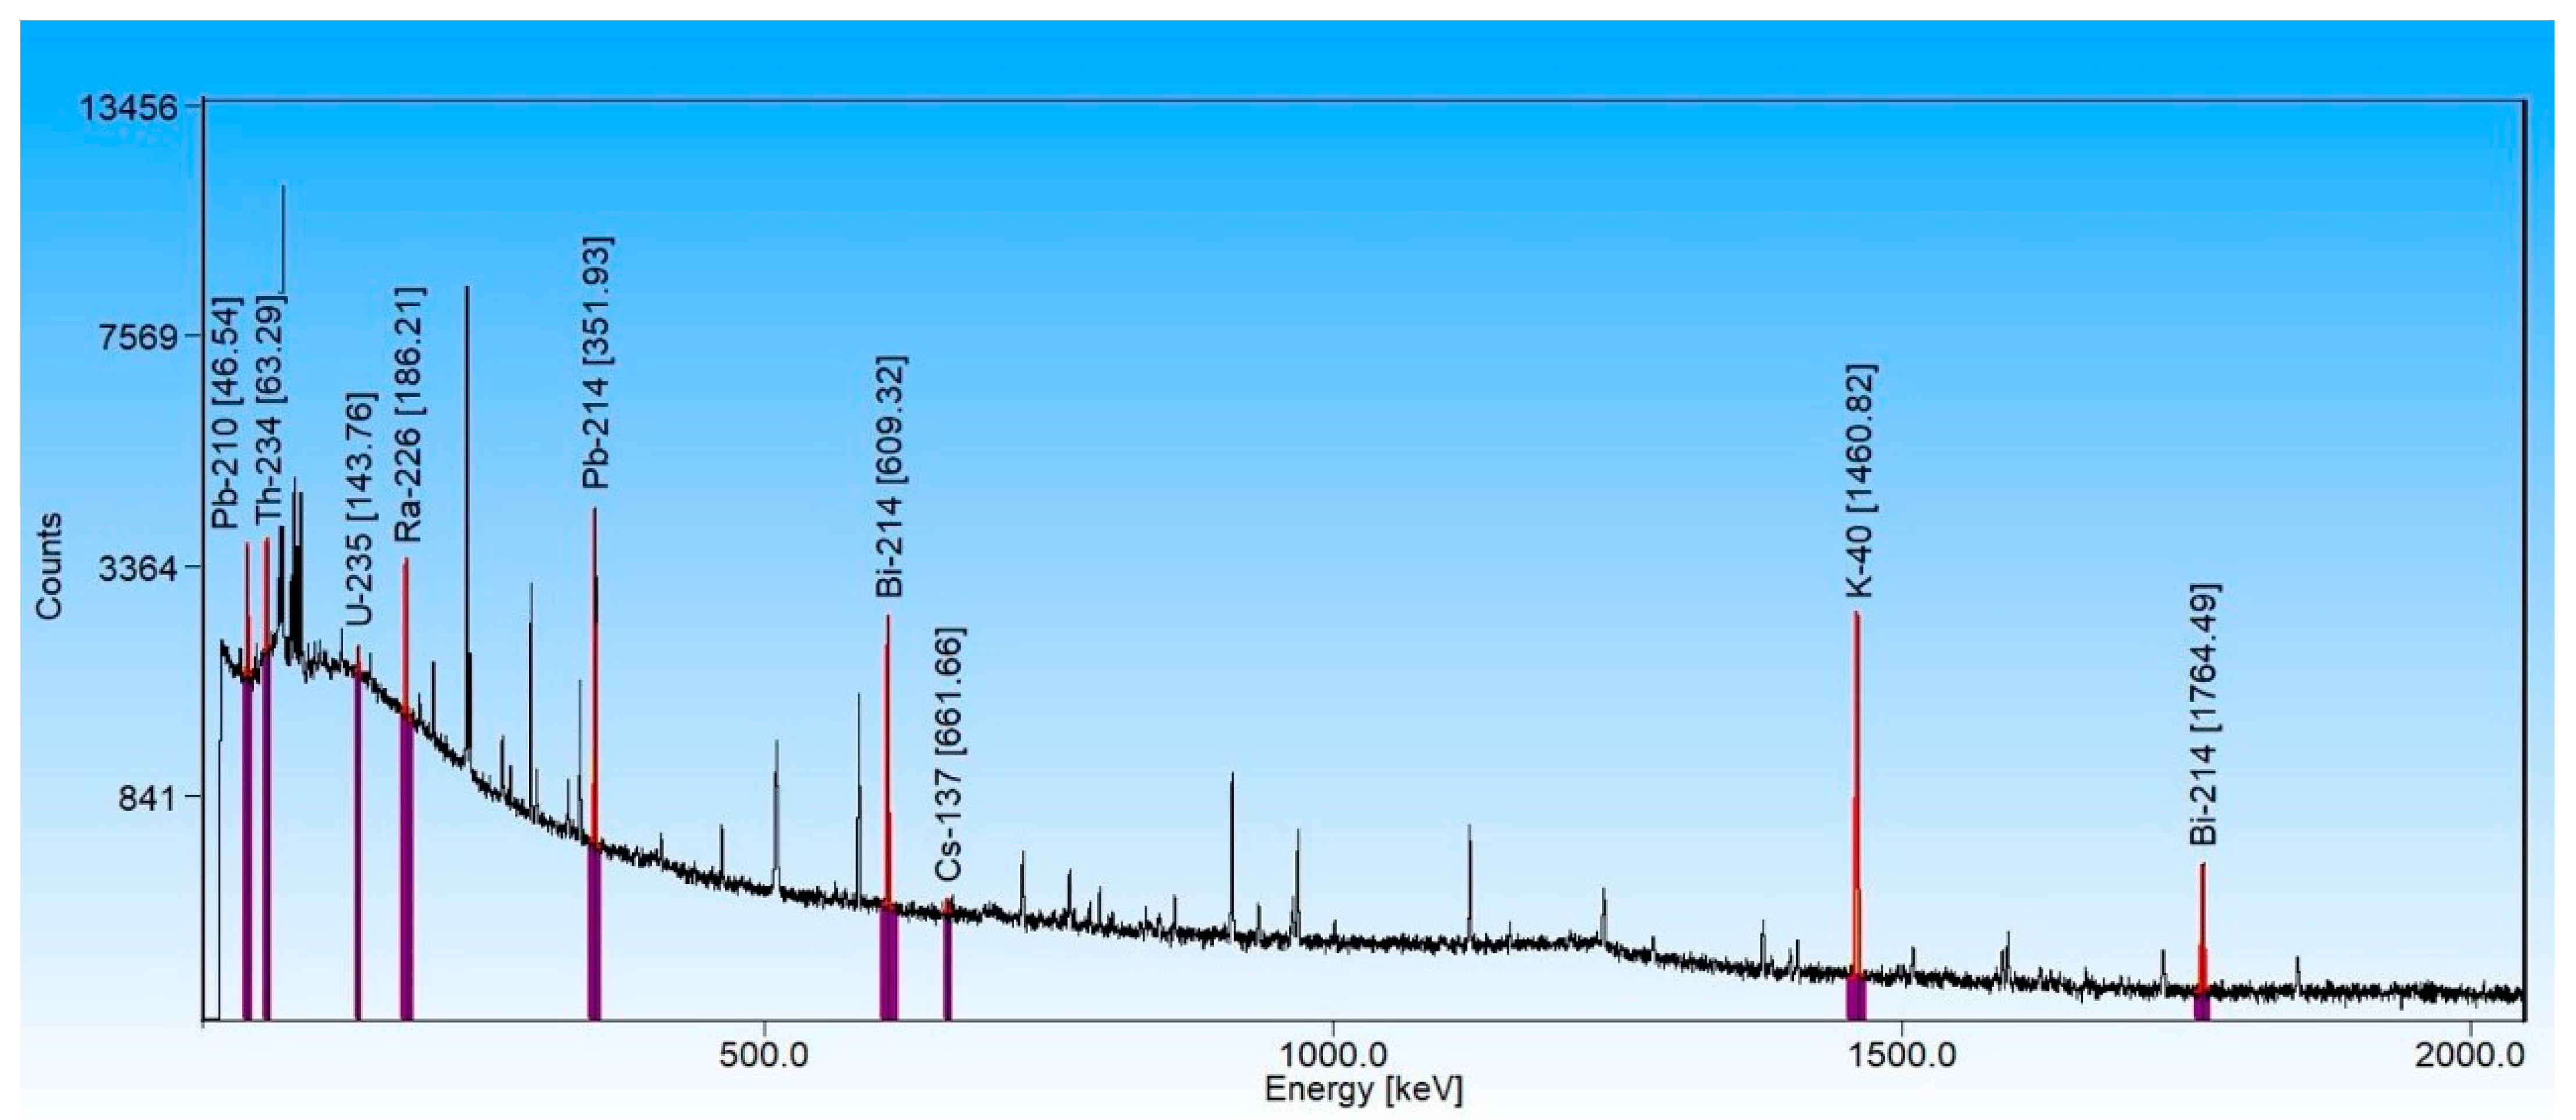
3.1. High-Resolution Gamma Spectrometry of the Sediments

In the high-resolution gamma spectra, the lines of the radioisotopes 226Ra, 214Pb, and 214Bi in equilibrium with 238U and the 210Pb total can be identified (see Figure 1).
Gamma spectrometry results from the 23 segments show 210Pbuns activity concentrations that decrease (with fluctuations) up to segment 12 (an approximately 30 cm depth). At greater depths, the values fluctuate around a constant, indicating the limit of the 210Pbuns determination. 137Cs activity concentrations are below the detection limit from segment 12 onwards (see Section 2.2). This result indicates that the accumulation of sediments corresponding to a depth of 27.5–30 cm downwards necessarily occurred before 1945. 75 years and can be dated in approximately the first half of the sediment column. Considering an exponential decrease in the 210Pbuns concentration implies that the last dated segments correspond to increasingly longer time intervals. Radioactive methods cannot date from segment 13 onwards. Based on fluctuations in the concentrations of cryptocrystalline sediments in the segments, an estimate could be made of periods of drought and rain that are more or less long, for which national information is available [59]. Considering the absence of systematic information from meteorological stations in the sampling area for dates prior to 1960, this estimate will provide information on droughts in Chihuahua before 1945.

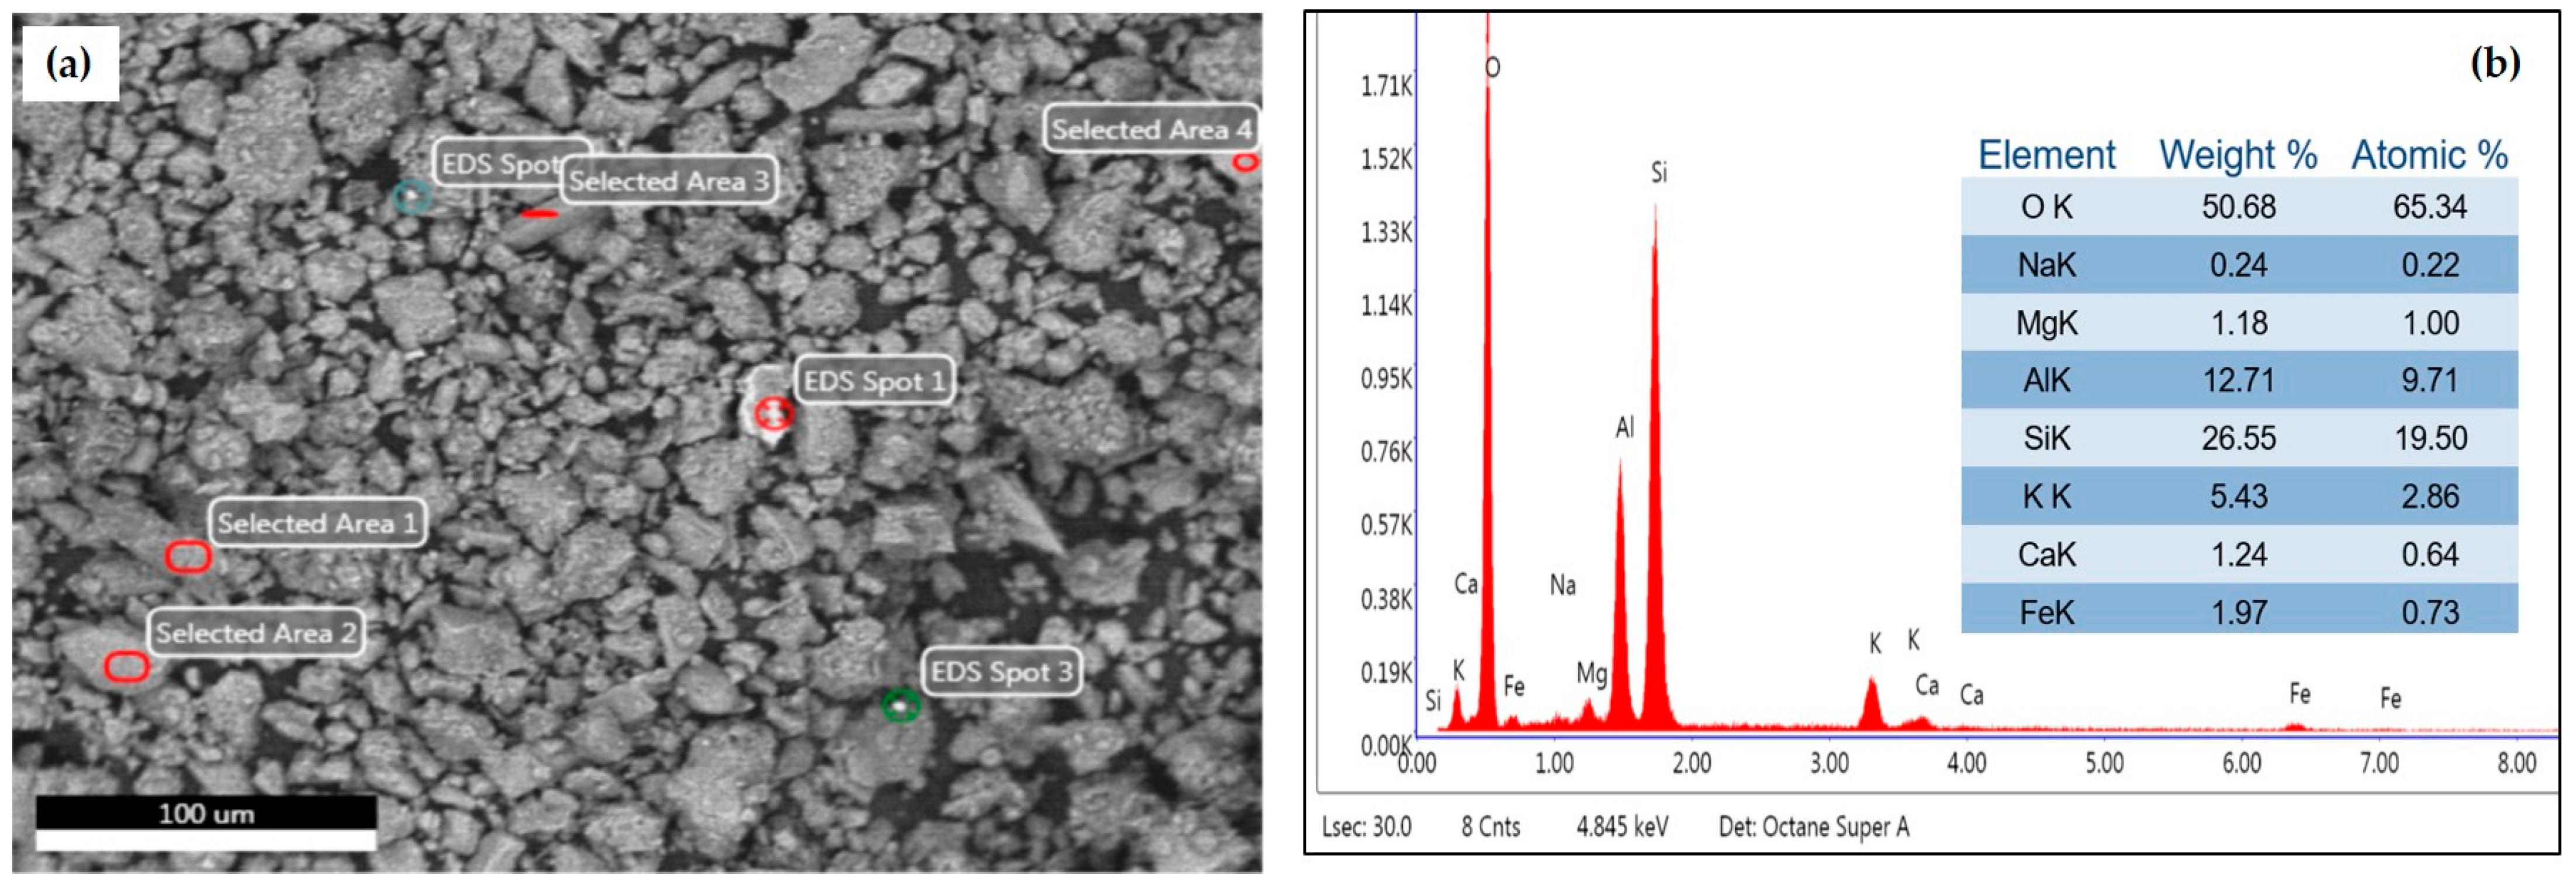
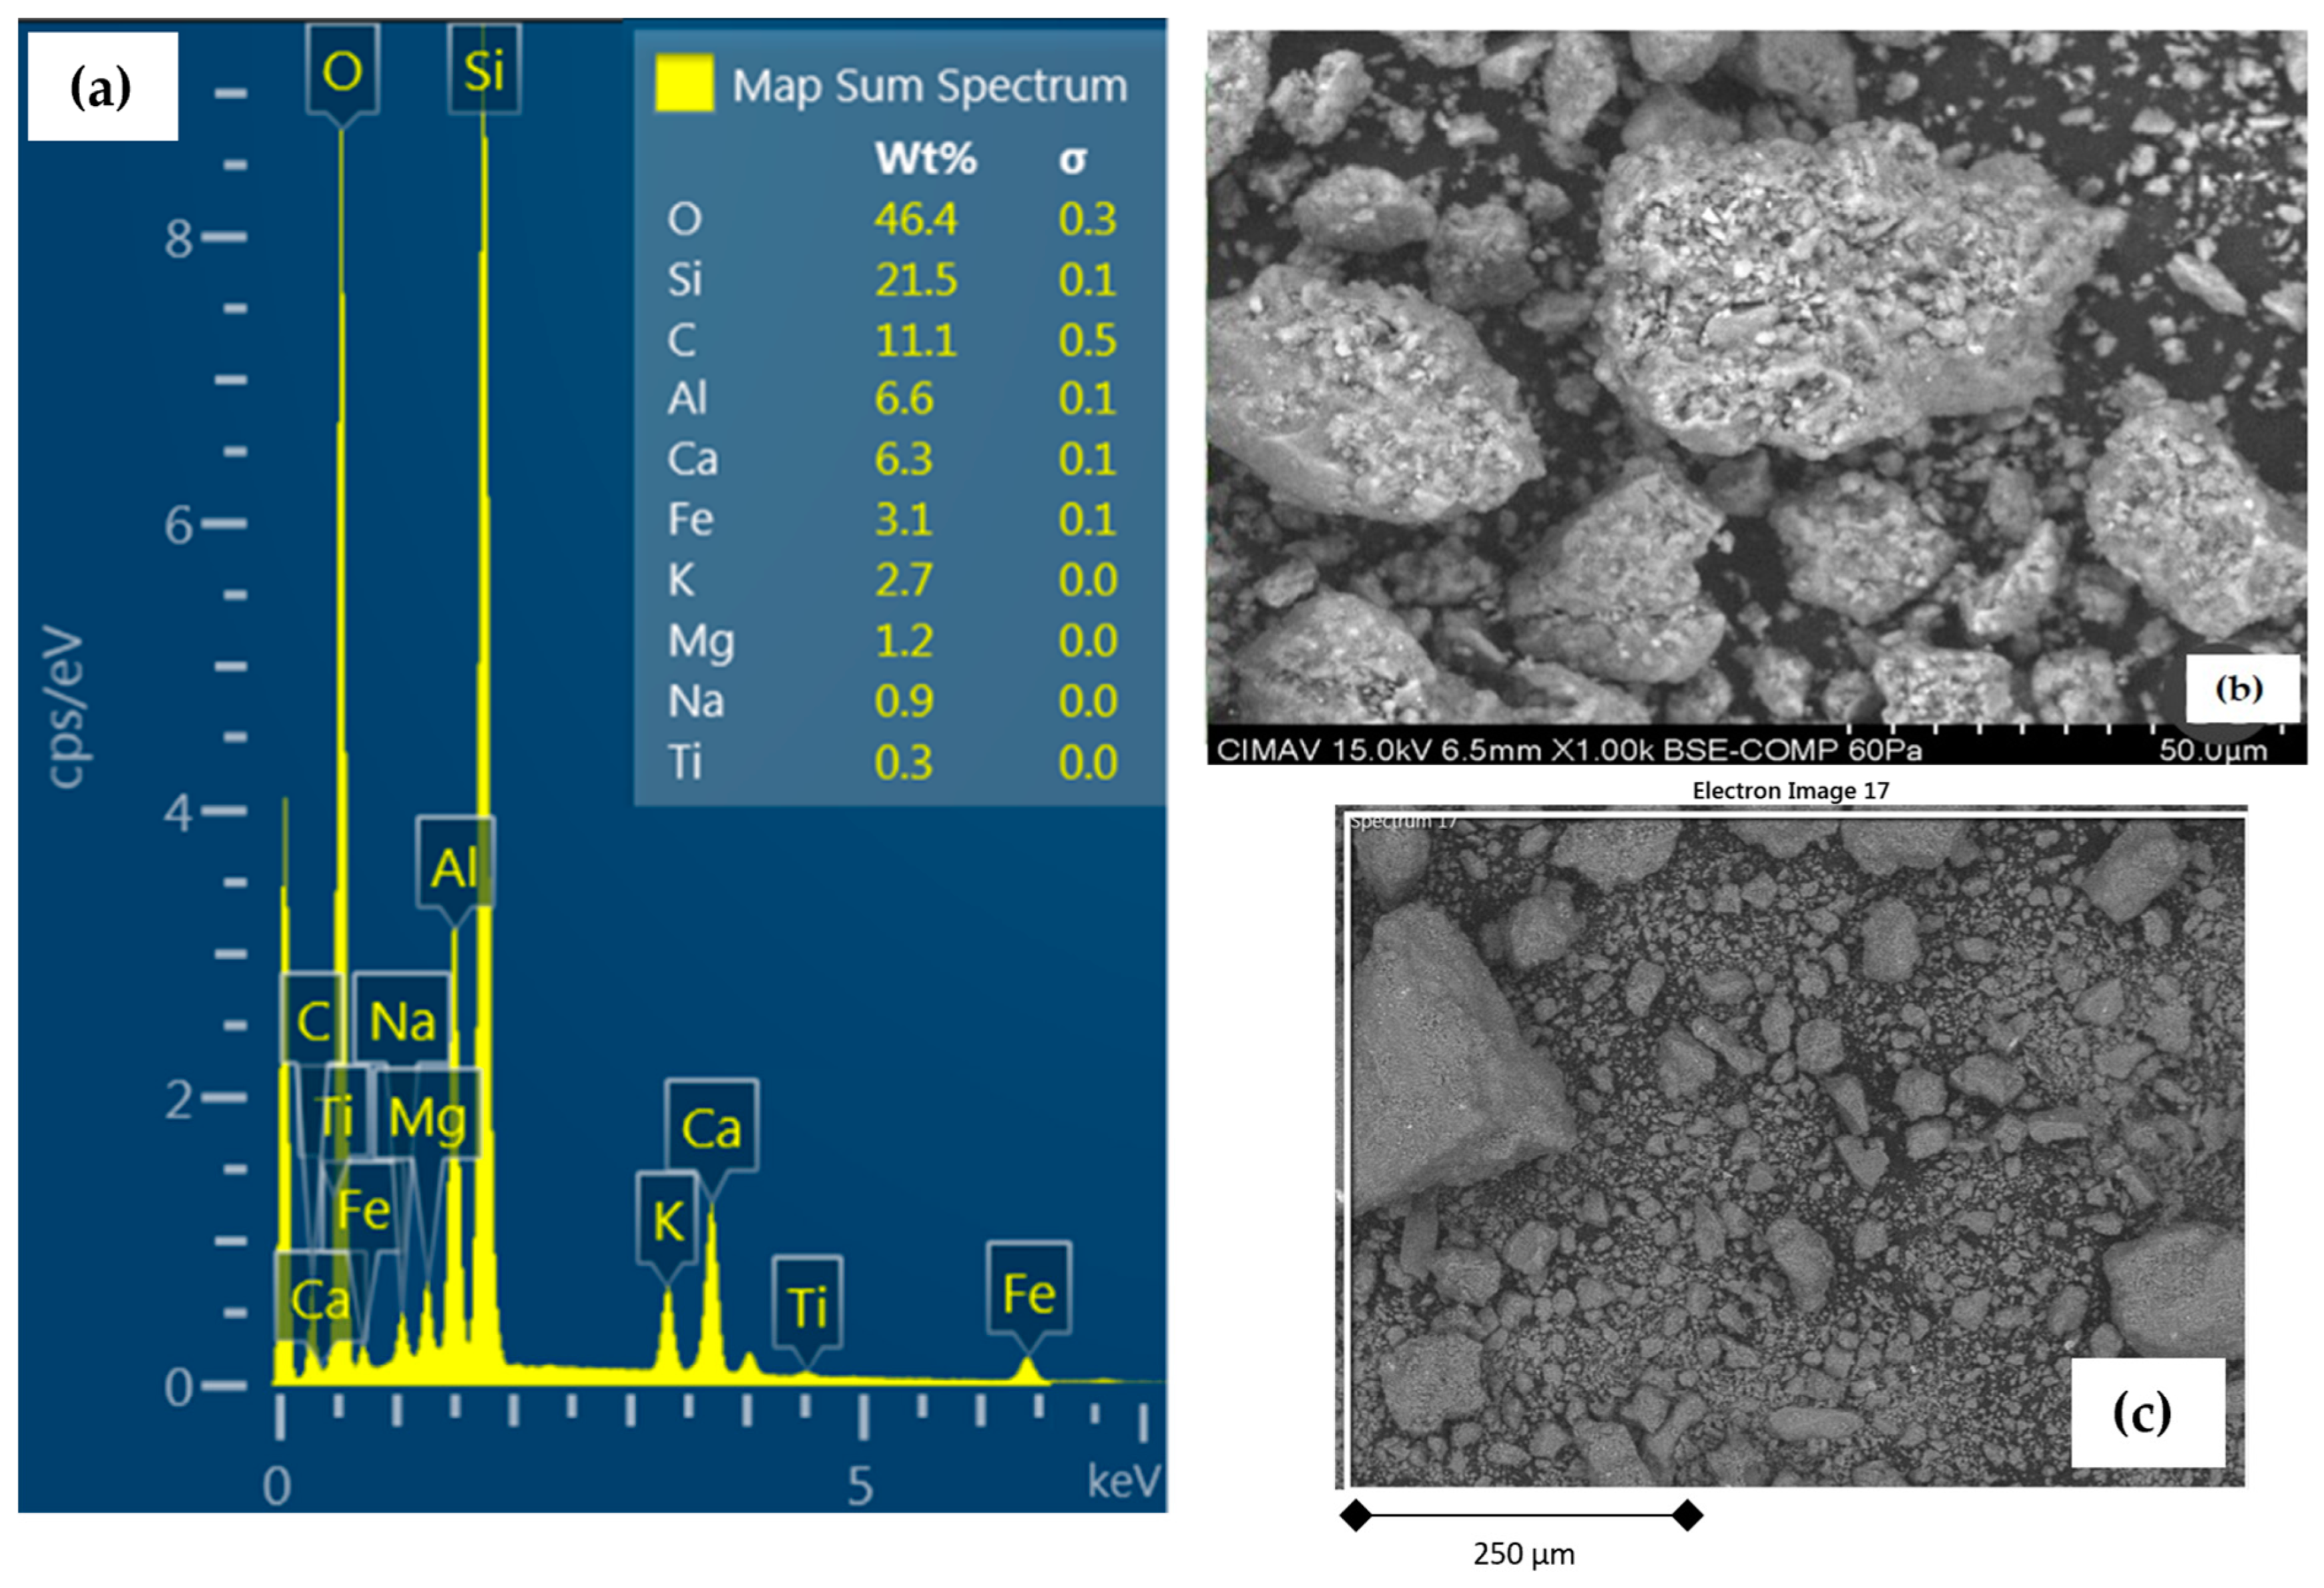
3.2. General Characterization of Study Samples

The Nopal and Tigre fine silt + clay samples were characterized by scanning electron microscopy. Figure 2 and Figure 3 present backscattered electron images and concentrations from the energy-dispersive X-ray spectroscopy analysis.
The EDS of samples from Nopal and Tigre reflect high contents of Si and O, typical of quartz, as well as lower proportions of other elements of the minerals that form igneous rocks, such as Al, Ca, Na, Mg, and K, typical of calcite and feldspars (orthoclase and albite) and of their alteration products, such as clays (kaolinite and montmorillonite).
Samples from the 23 core segments were characterized by scanning electron microscopy, and a major element analysis was performed using ICP-OES. Results for each ICP-OES segment are shown in Appendix A. Backscattered electron images and EDS elemental concentrations for segment #22 are presented in Figure 4.
As expected from the origin of the sediments of the 23 segments, the elemental composition is very similar to each other and like that of the Nopal and Tigre samples. The sample’s EDS reflects concentrations of the same order of the averages within the dispersions of Table A1. These averages are presented in Table 1.
Looking closely at Figure 3b, it can be seen that around and on the coarse grains, grains of dimensions ~1 µm appear. Apparently, these grains have an average atomic number slightly larger than the coarse grains, which could correspond to clays that contain solid solutions of elements heavier than Si, Al, and Na.

3.3. Reliability of the Proposed XRD Phase Analysis

To evaluate the reliability of the proposed XRD procedures, a verification measurement was performed on a calibrated test sample with a composition similar to that of the mineral samples studied in the research.
The calibrated mixture’s starting materials of known purity were quartz, calcite, microcline, albite, kaolinite, and montmorillonite. The Supplementary Information section presents the certifications and analyses that support the compositions used in the calibration. The Rietveld analysis of the test sample is shown in Figure 5 and Table 2. The DoC estimation of the montmorillonite content is presented in Figure 6.

3.4. XRD Results

The results from the samples Nopal and Tigre are summarized in Table 3 and Figure 7 and Figure 8. Some key results are mentioned below. The phase compositions are consistent with the elemental analysis results. The calcite concentration is almost double in Tigre. The concentration differences between members of the kaolin group and between feldspars are not overwhelming if the sums [kaolinite + halloysite] and [orthoclase + albite] are considered. The presence of magnetite is at the detection limit due to strong peak overlapping. The concentration of montmorillonite is, to some extent, larger in Nopal. From the point of view of the study of fine sediments, the broadening of the Mnt 001 peak (2θ ≈ 6°), especially in the Tigre sample, is striking. The crystallites of montmorillonite are very poorly crystallized in Tigre.
The second part of the diffraction work focuses on establishing a rapid DoC-type method to characterize the cryptocrystalline content in sediments and comparing its results with those of a complete Rietveld analysis. A useful product obtained in this component of the research is the freely available ANALIA program deposited in GitLab. The link to access this program, with application examples, is the following:
A run of ANALIA scans a series of measured diffractograms and automatically performs the following tasks:
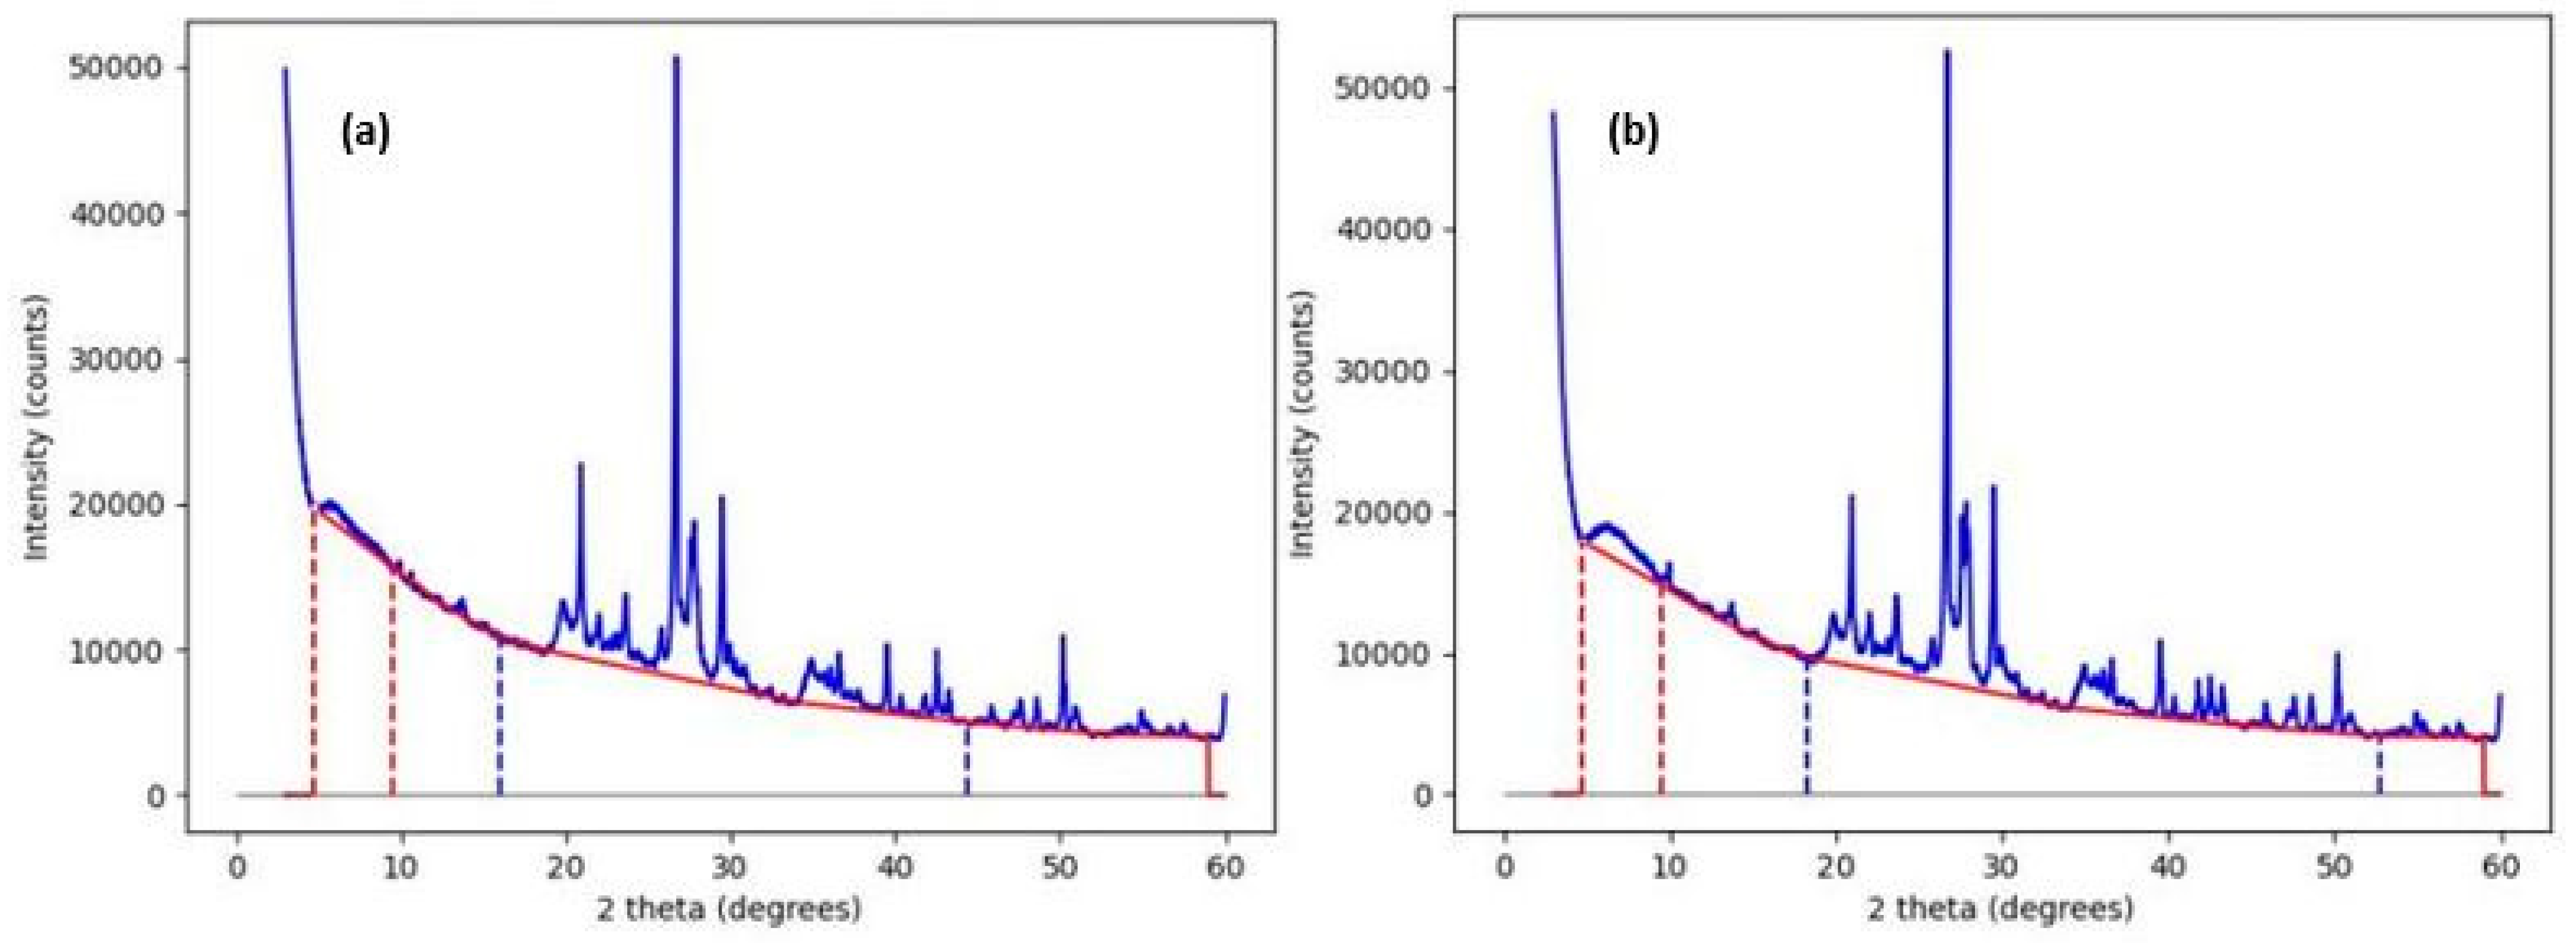
  • Smooth and represent a suitable background;
  • Calculate the net areas corresponding to poorly and well-crystallized phases;
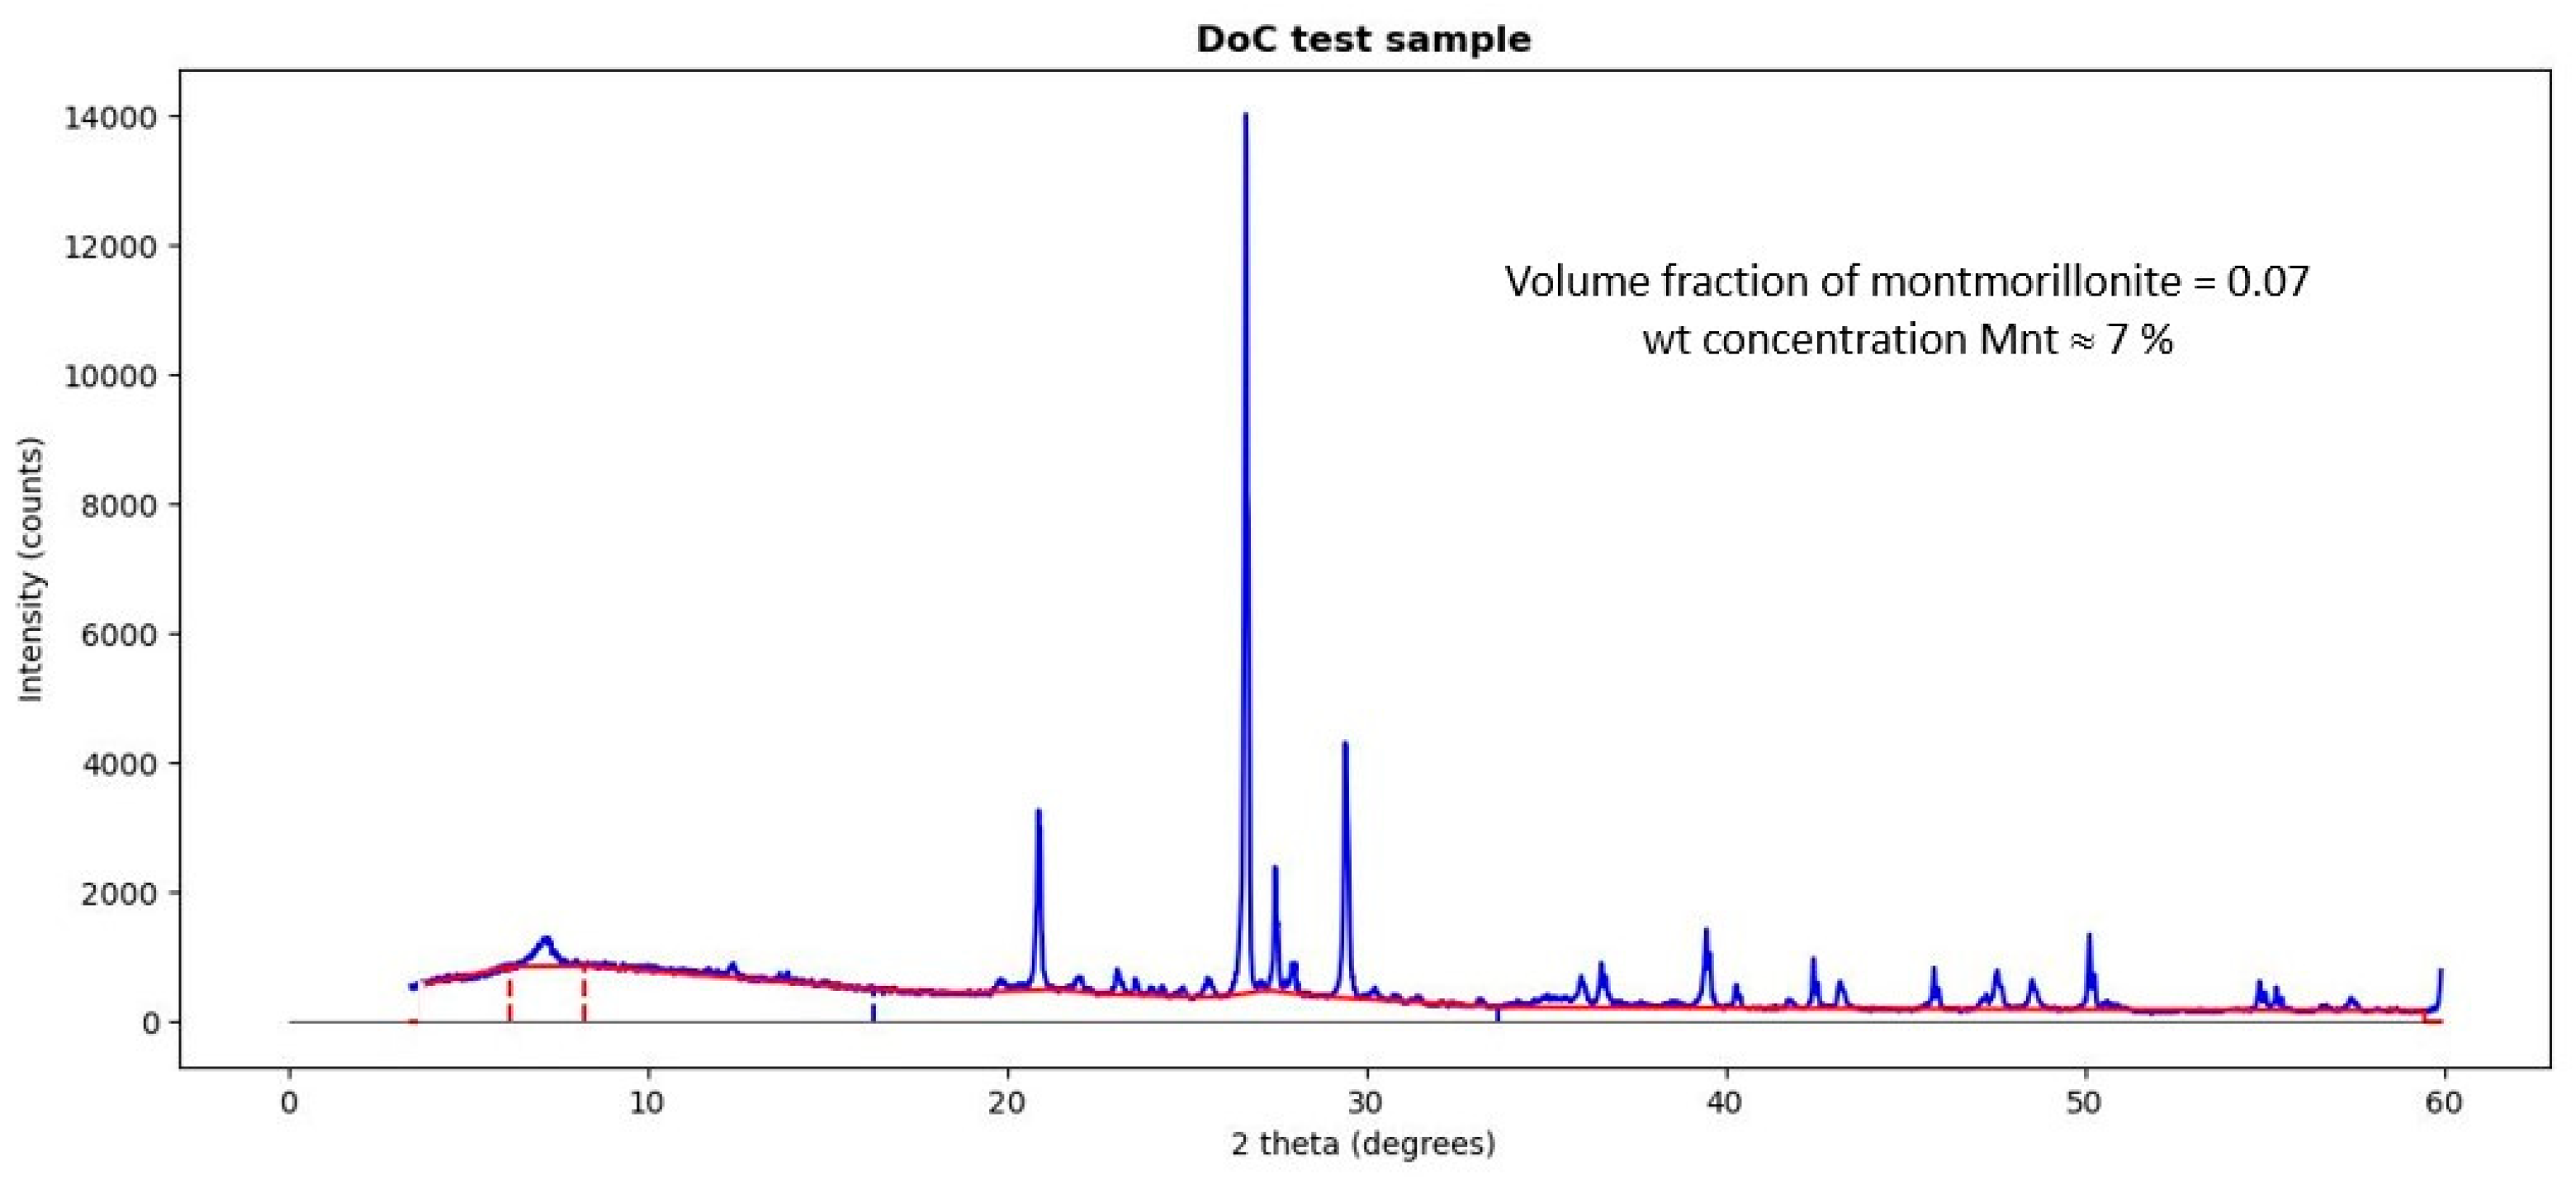
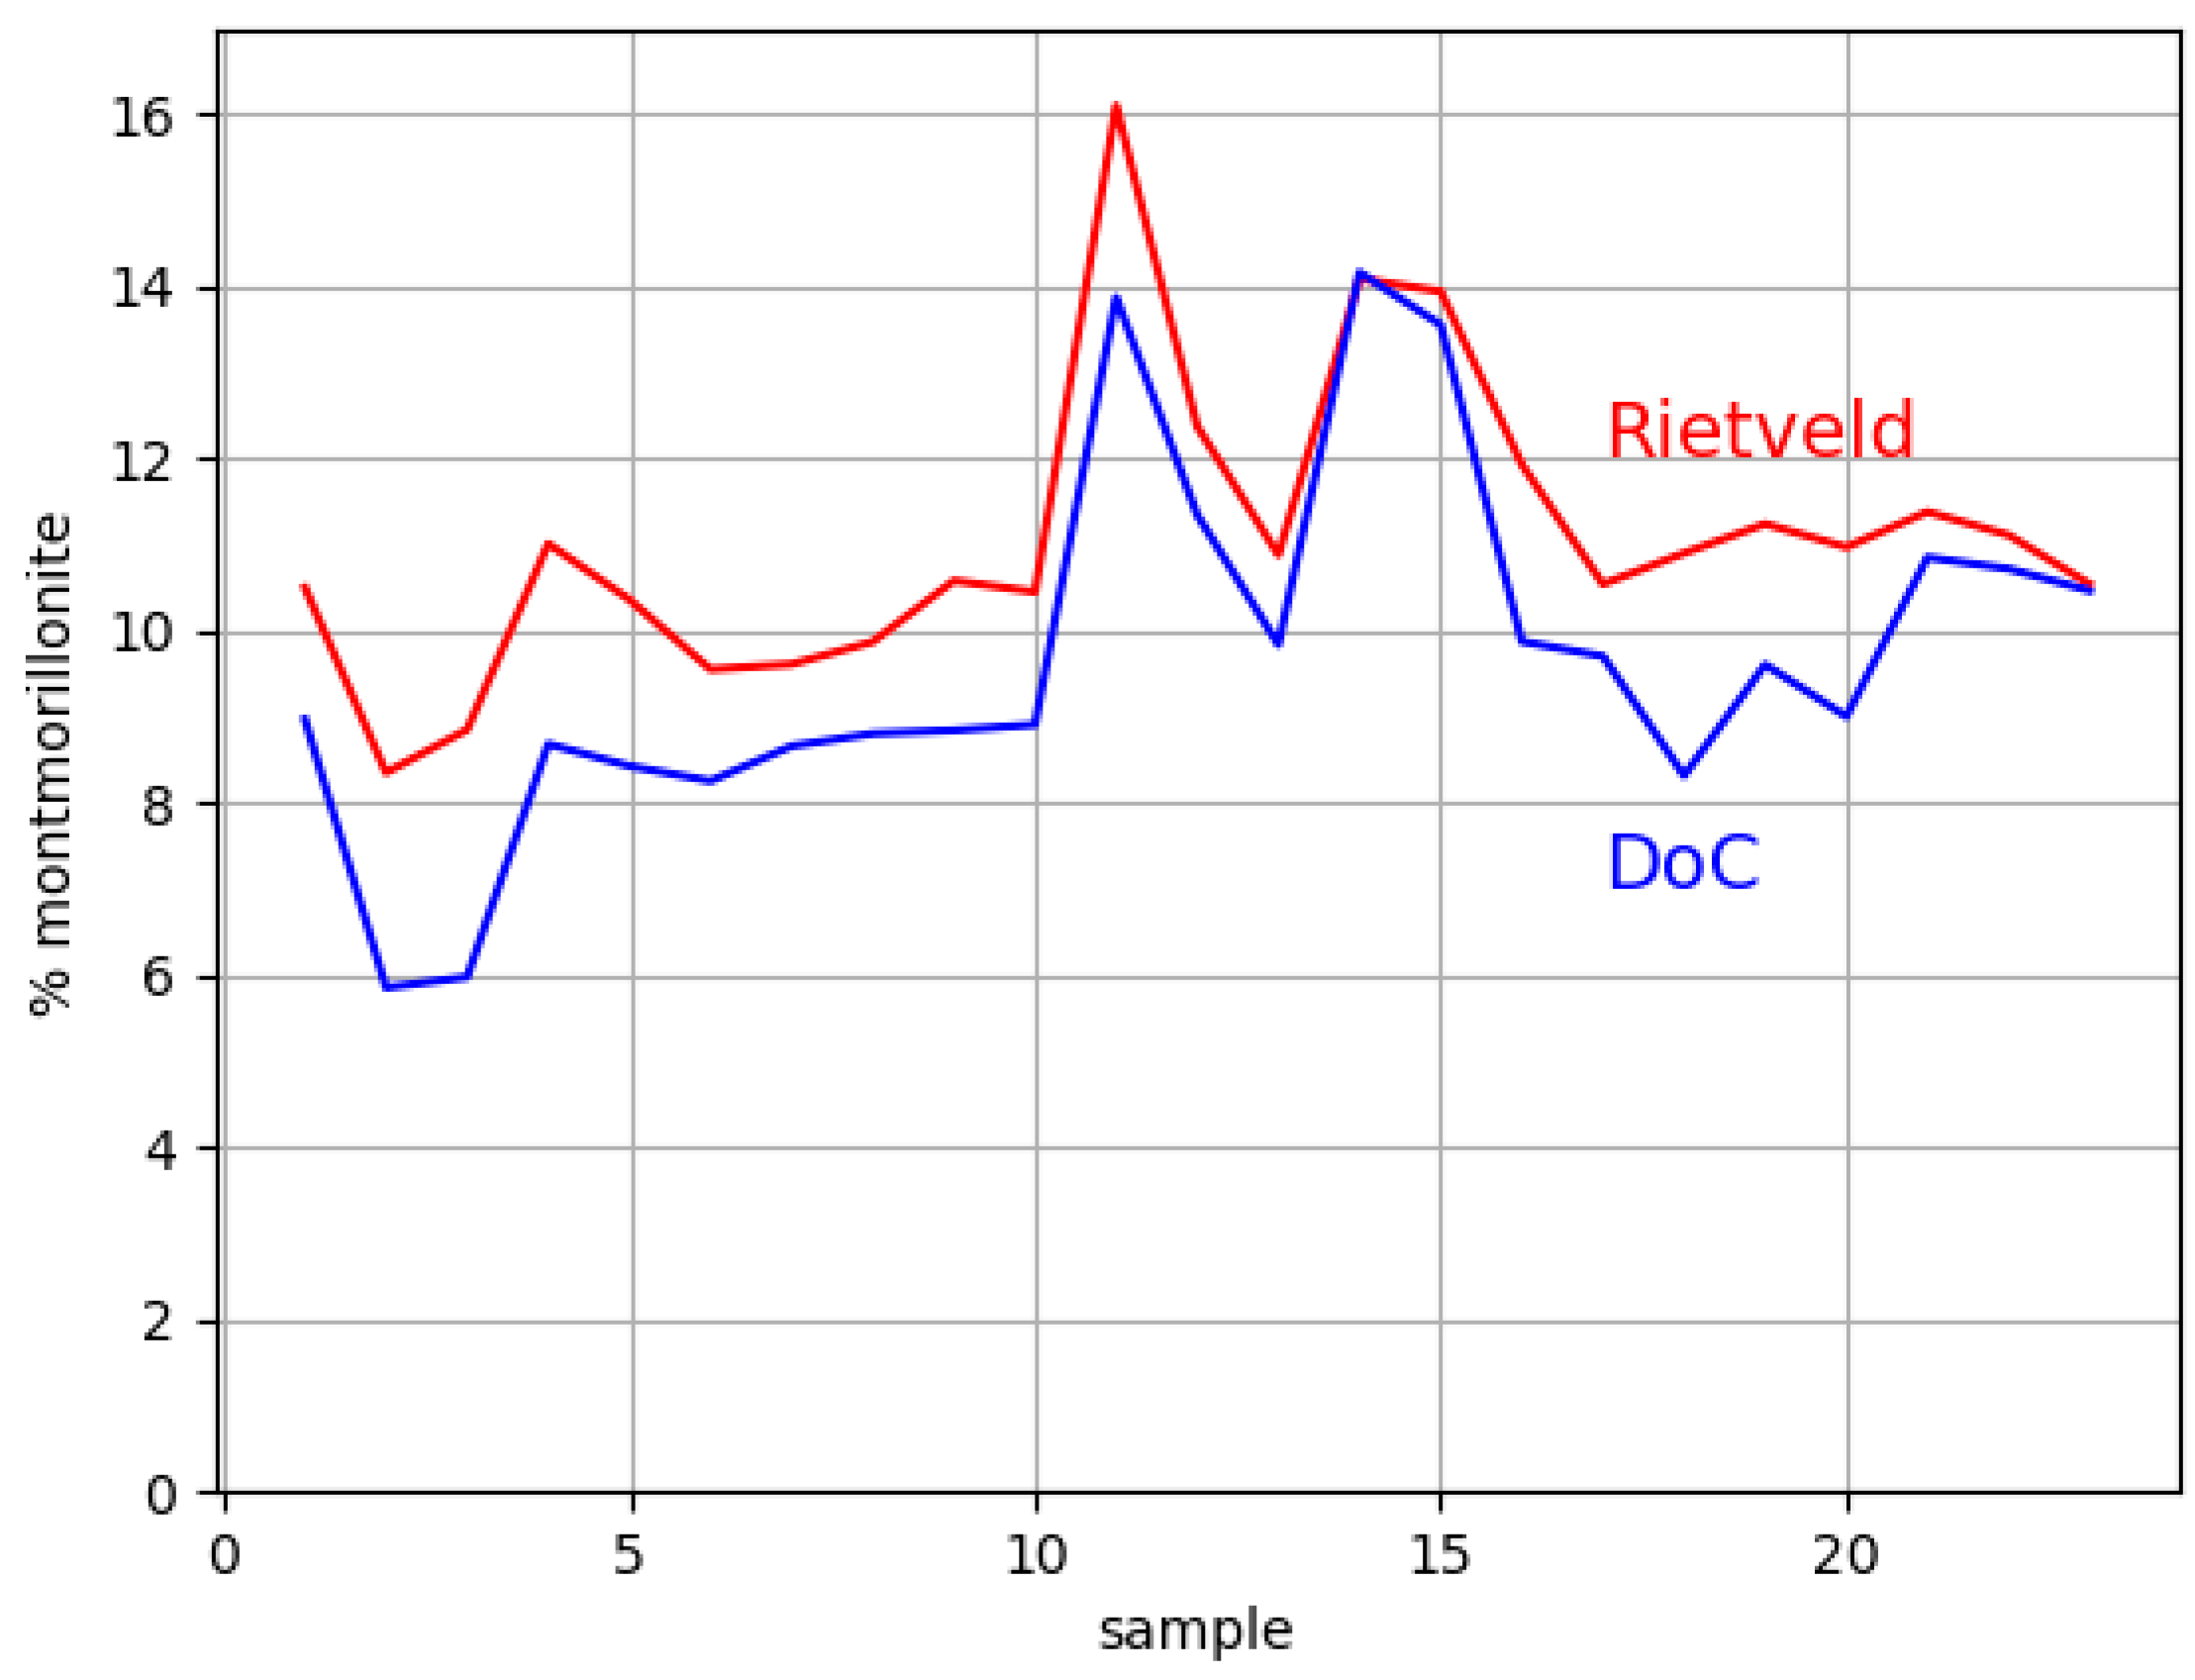
  • Estimate the cryptocrystalline concentration rapid via DoC;
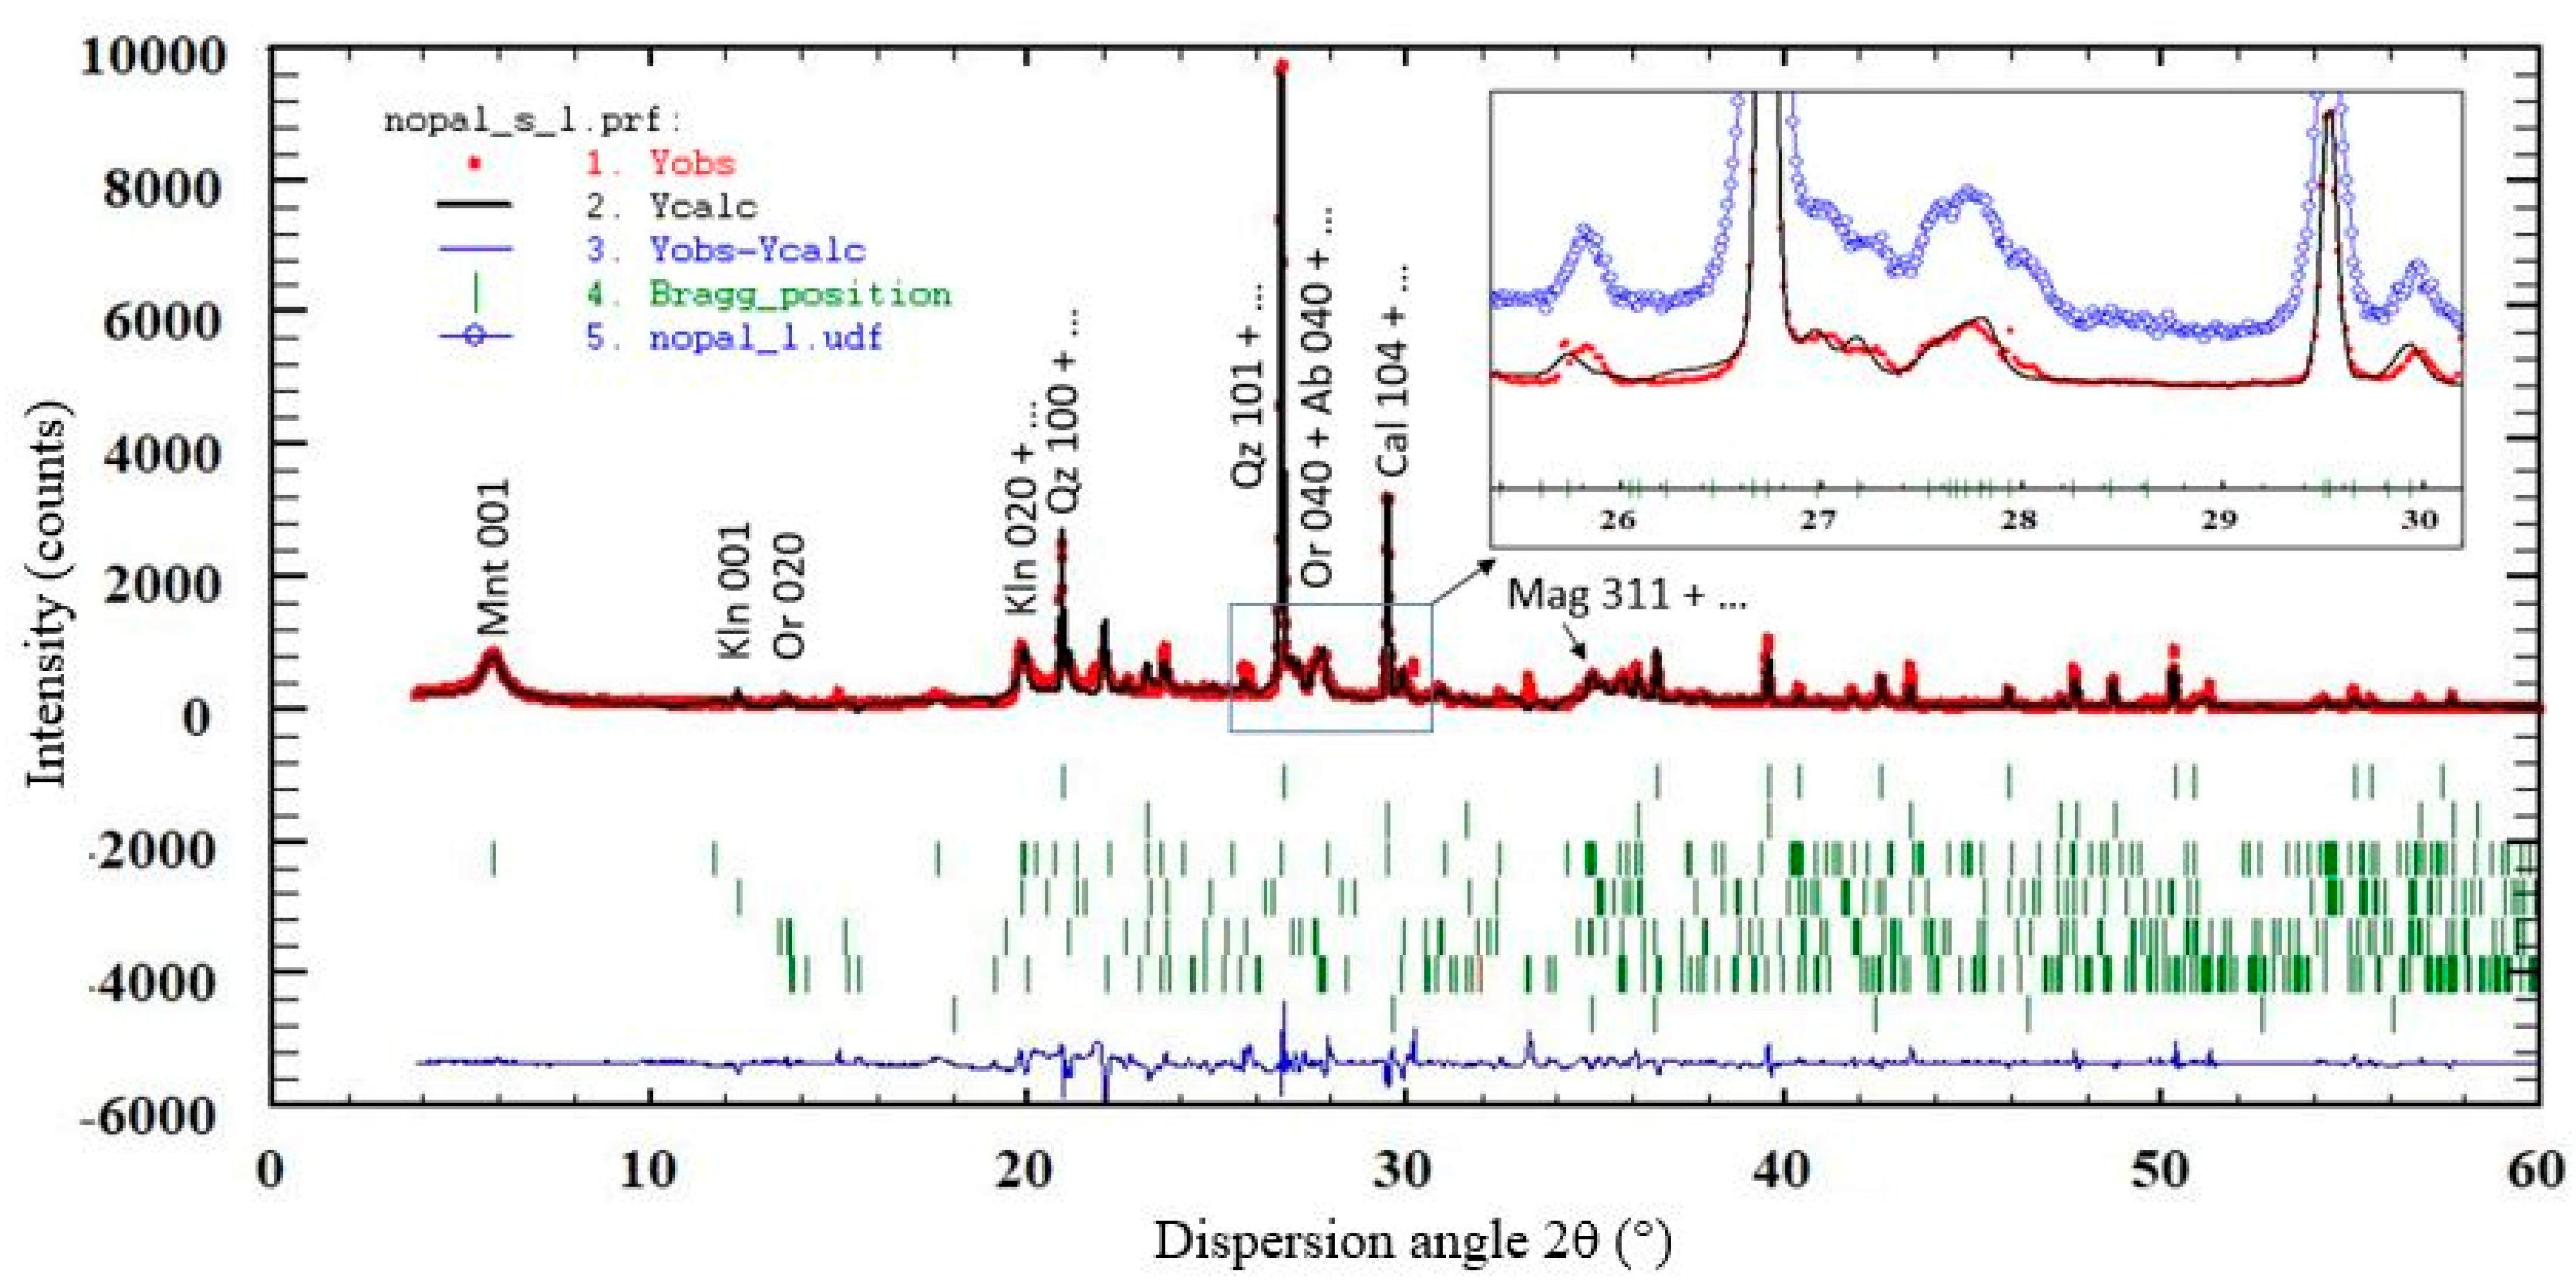
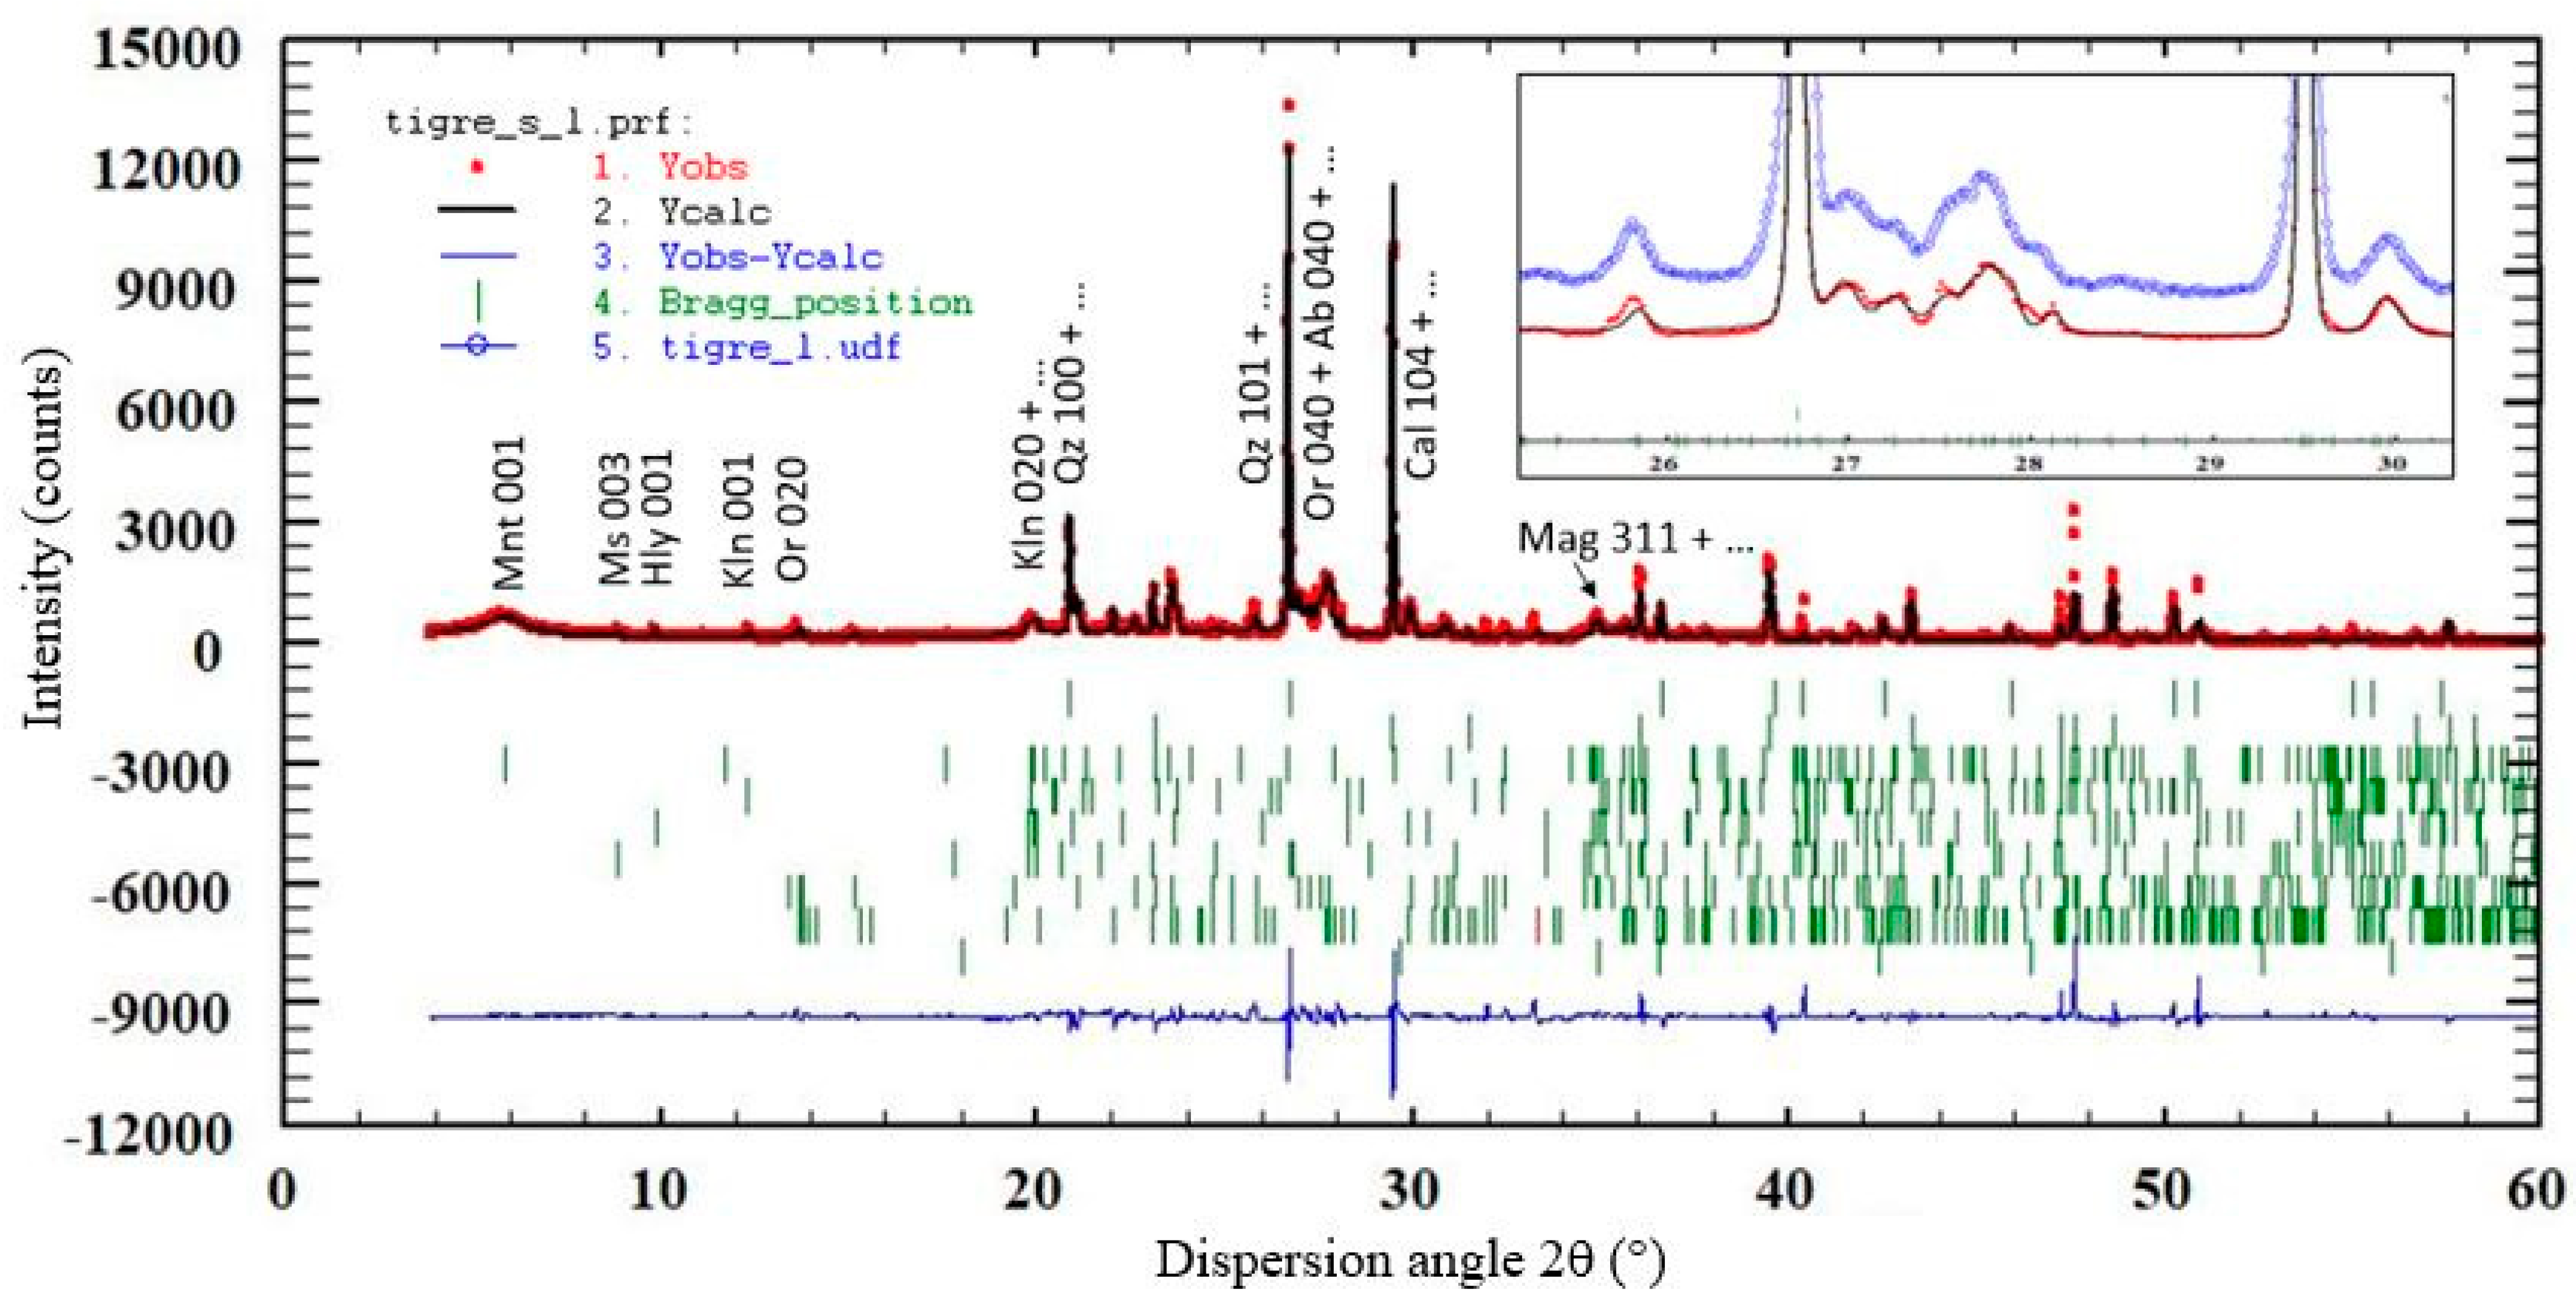
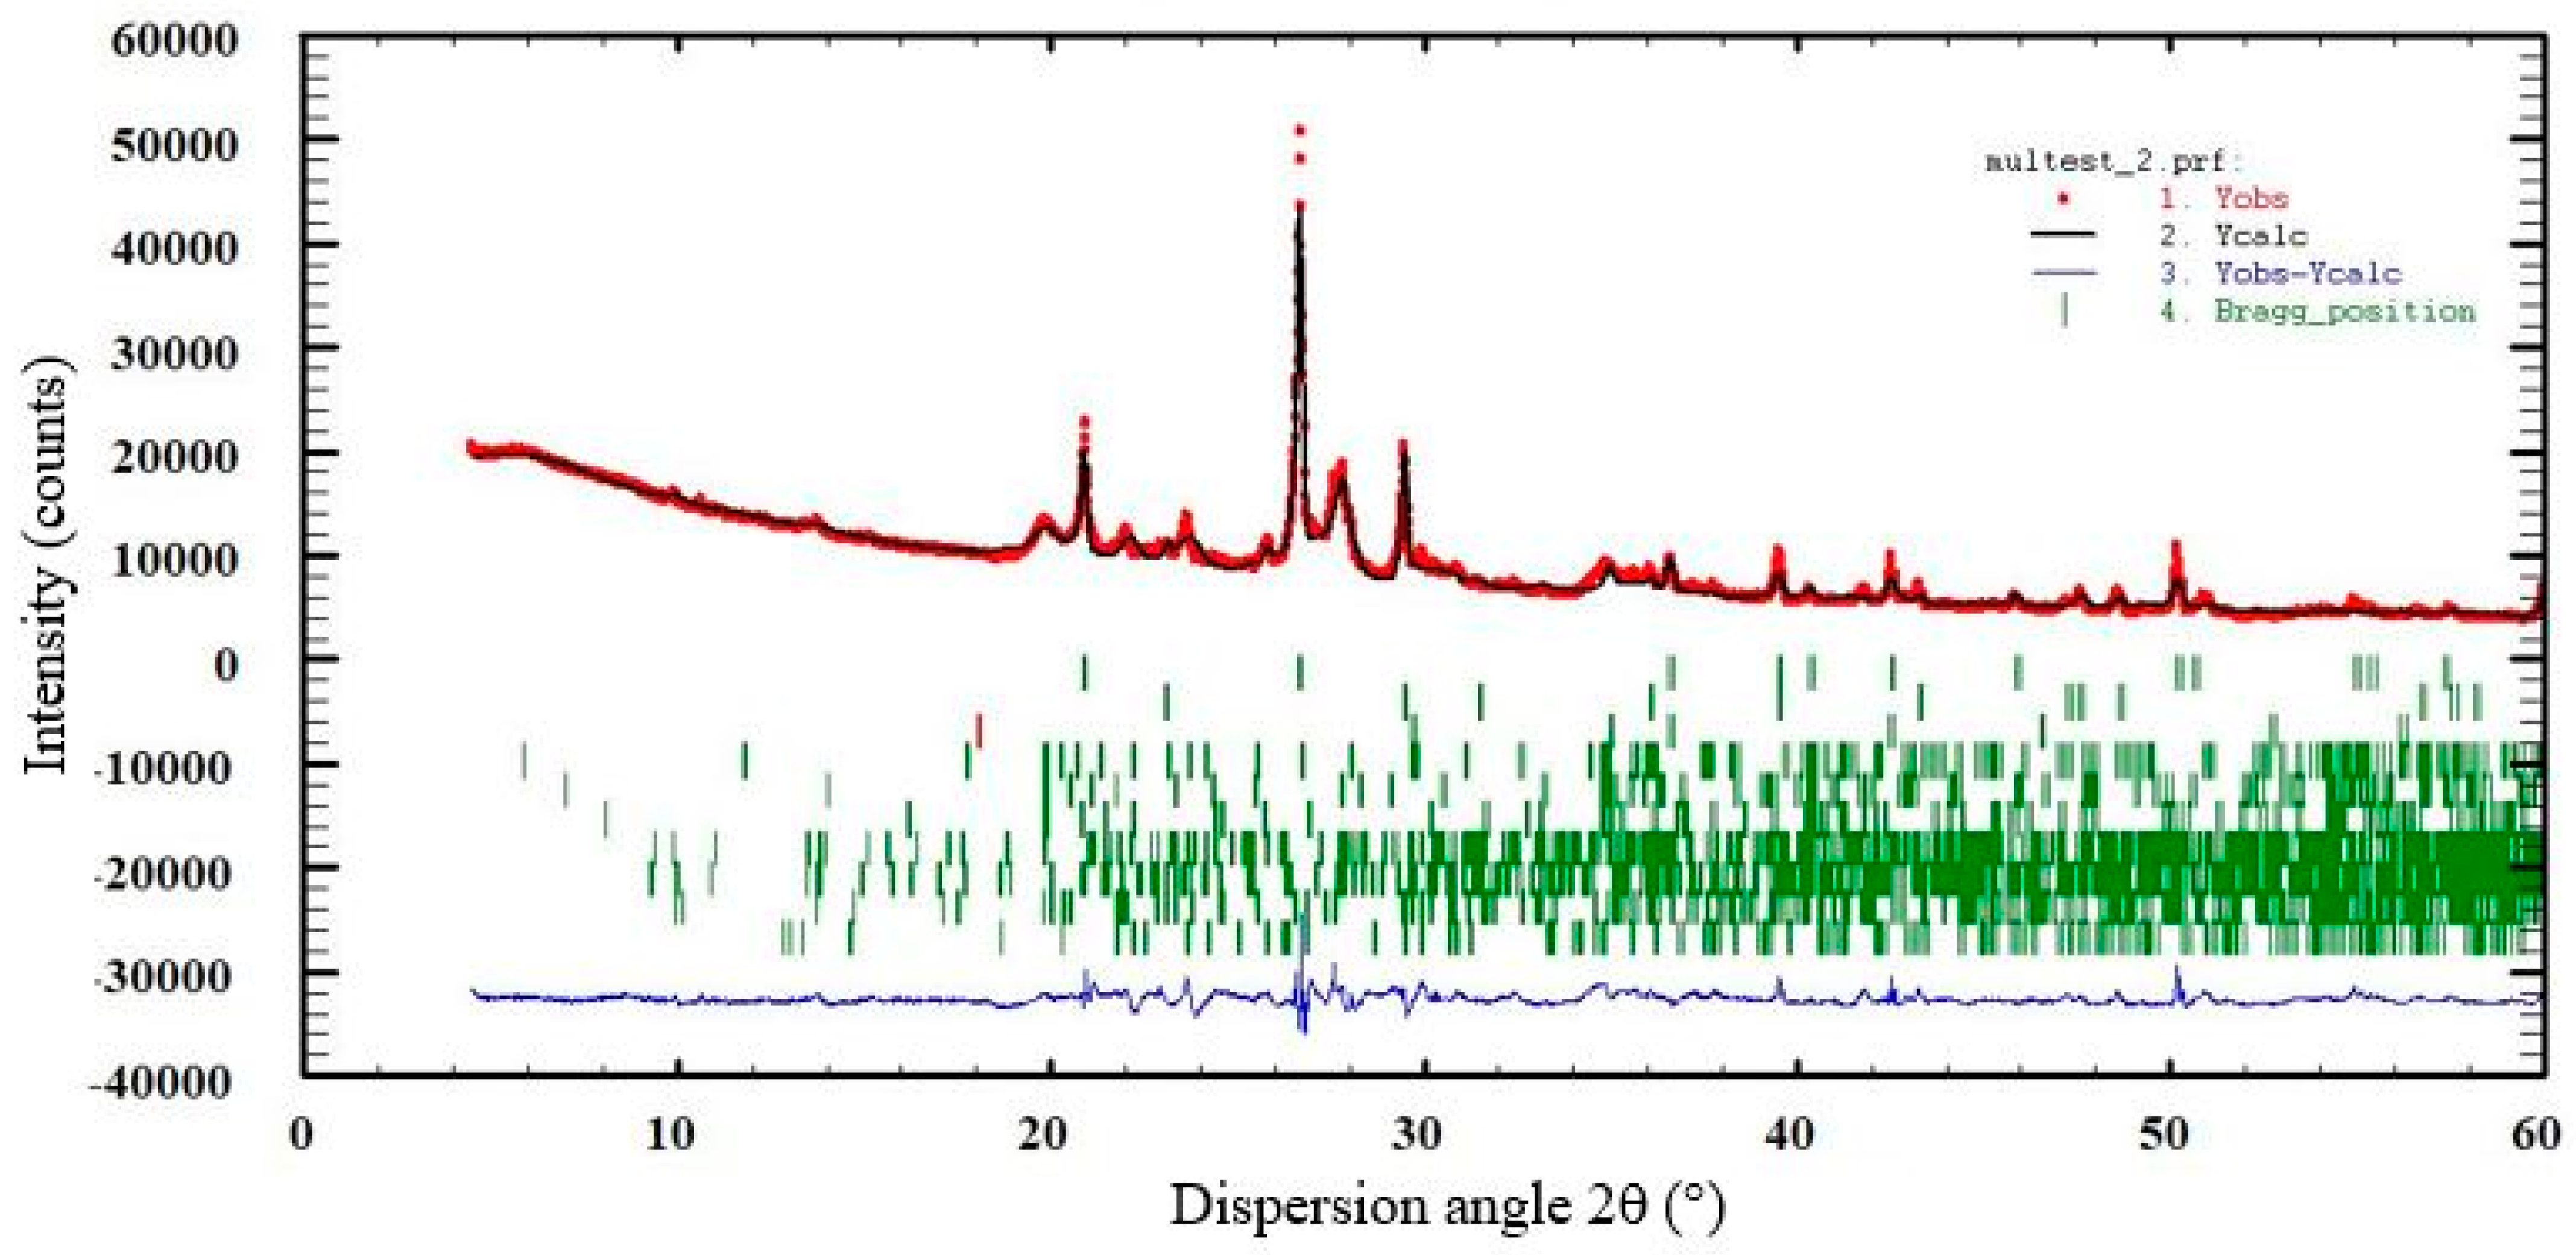
  • Present diffraction and analytical results;
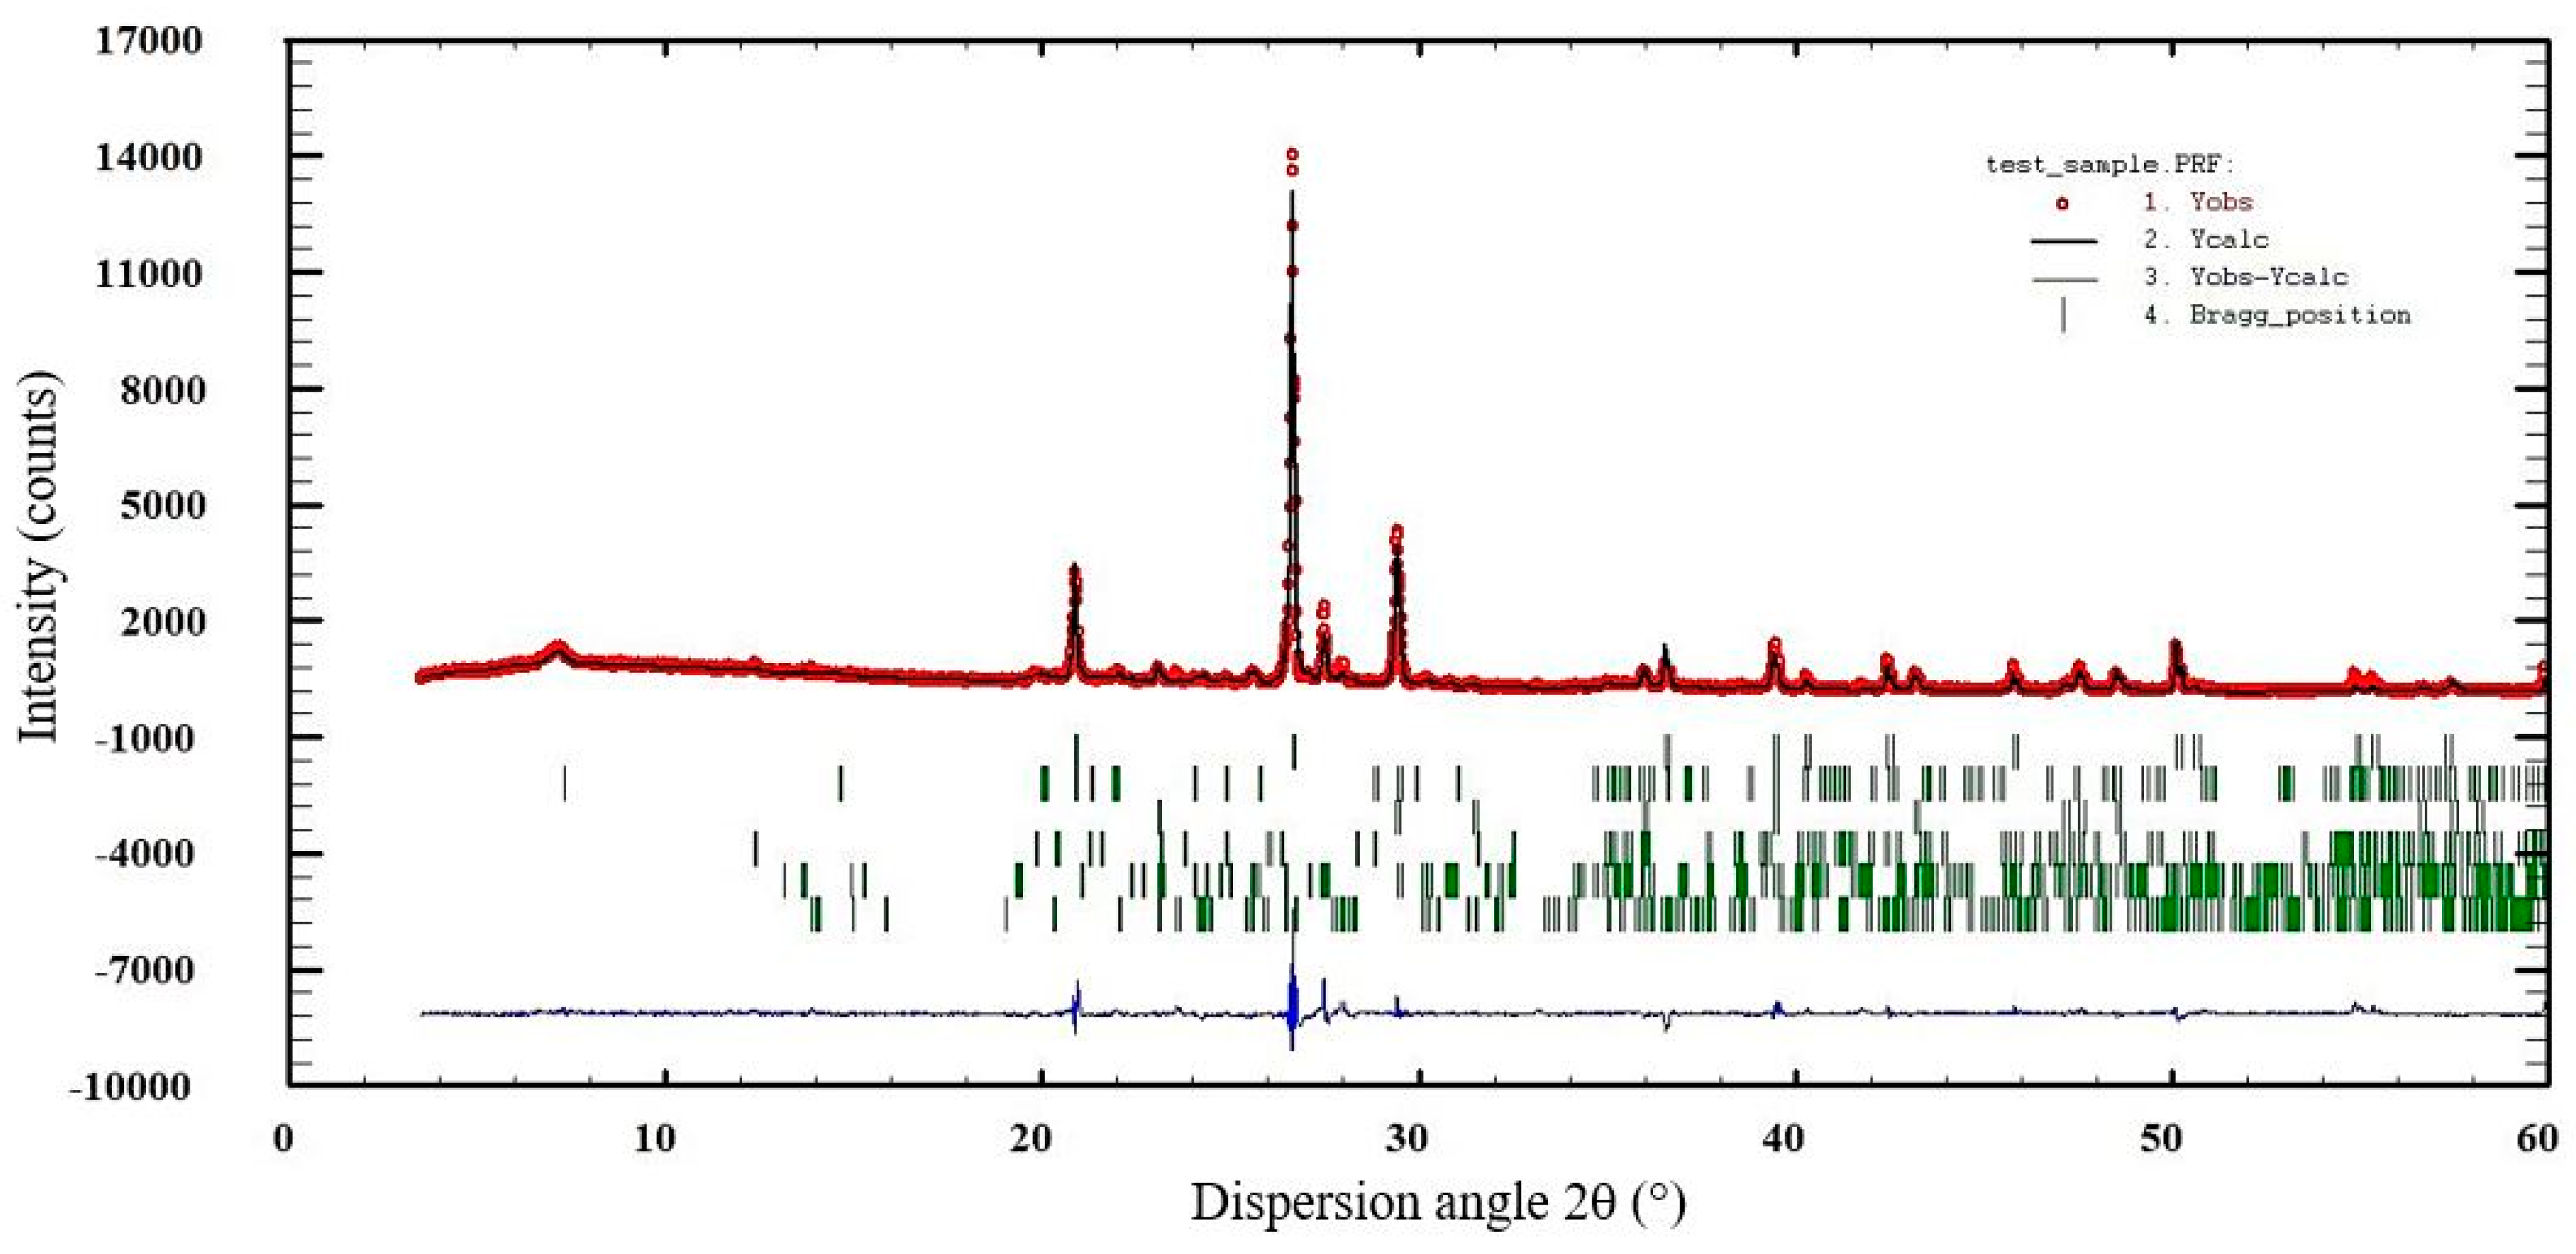
  • Apply the Rietveld multi-pattern refinement with the program Fullprof;
  • Compare the DoC and Rietveld results.
The system of procedures described here has been applied to the series of 23 samples from Laguna del Cuervo. All diffractograms, data, and the Python codes necessary to reproduce the results to be described are accessible at the GitLab link shown above.
Figure 9, Figure 10 and Figure 11 are representative examples of the study carried out on the Laguna del Cuervo series. Figure 9a and Figure 10 show the XRD patterns of sample 2, which contains a little cryptocrystalline montmorillonite. Figure 9b and Figure 11 refer to sample 22, which has a higher montmorillonite content. The considered diffractograms appear in Figure 9, as shown by the way ANALIA treats them. Figure 10 and Figure 11 show the experimental XRD patterns superposed with the corresponding Rietveld-modeled ones.
The Supplementary Materials show the diffractograms of repetitions of samples 2 and 22, representative of the work, regarding the experiments’ repeatability. The graphs show the same characteristics.
Figure 12 shows the results of the cryptocrystalline montmorillonite concentrations obtained by the two methods considered. The trends coincide, although the values are different to some extent. Table A2 in Appendix A presents the numerical outputs of the two analyses in detail. Fullprof gives all the detected phases, and DoC only gives the cryptocrystalline fraction.
Why does DoC give slightly lower values? First, DoC gives different values because it does not consider all the XRD physics. An essential factor is that the calculations given here compare one peak (the most intense one) of the montmorillonite with a set of peaks of the mixture. This set includes contributions from montmorillonite itself.

4. Discussion

The diffraction results obtained give rise to the following comments.
In a mixture of phases, the intensity of a diffraction peak of a given phase depends on the volume fraction of this phase, amid other factors (the structure factor, the sample absorption coefficient, etc.). The Rietveld programs take advantage of several peaks and calculate the weight concentrations of the characterized phases, which are the concentrations that are generally reported. The physical idea of the DoC method, proposed as a quick approximation to a Rietveld refinement, is to link the ratio between selected intensities with the ratio between volume fractions. The difference between the volume fraction and weight fraction depends on the difference between the densities of the considered phases. As a characteristic case of contrast, compare montmorillonite (ρ ≈ 2.3–2.5 g/cm3) and magnetite (ρ = 5.2 g/cm3). The densities of the aluminosilicates studied in the present investigation and of calcite are in the range ρ = (2.5 ± 0.2) g/cm3. For the materials in the present study, taking the volume fractions as weight fractions is an acceptable approximation.
Several possible causes of systematic errors have been identified that can affect the accuracy of the Rietveld analyses.
The modeled crystal structure may differ from that of the phase to be represented. This is not serious in quartz, as natural quartz is close to stoichiometric. But in other minerals that are solid solutions, for example feldspars, the difference between the experimental sample and the accessible models can be significant. In our research, we have selected the models chemically and structurally closest to our samples from the information available in databases.
Microabsorption: This has a significant effect when the absorption coefficients of the present phases differ considerably. The phases clearly detected in our samples are quartz, montmorillonite, calcite, kaolinite, and various feldspars. The mass absorption coefficients for all these phases (examined with CuKα radiation) are 50~80 cm2/g. Magnetite (for CuKα) has a mass absorption coefficient of 205 cm2/g, quite different from our aluminosilicates. Fortunately, in our samples, magnetite (or other iron compounds) is not present in any significant amount. Our experiments do not suffer from inaccuracies due to microabsorption.
Texture: One of the main disadvantages of traditional one-peak-per-phase XRD methods is the effect of the preferred orientation (texture). It is advisable to reduce the particle size to eliminate the shape anisotropy of the crystallites. If the presence of texture is unavoidable, careful Rietveld processing can help. (Here is an example of possible difficulties caused by texture. In the Fullprof program, representing the texture by an inverse pole figure modeled as a Gaussian bell curve (NOR parameter = 0) leads to physically incorrect results. The March–Dollase distribution (NOR = 1) must be used). In our work with fine powders, using the Fullprof program, we systematically used the March–Dollase algorithm. The results (Pref1 ≈ 1.0) indicated non-intense textures.
Microstrain of chemical origin (microheterogeneity of the atomic content and unit cell dimensions): Our XRD peaks, especially those produced by montmorillonite, show broadening due to the small crystallite size and microstrain. Due to the complexity of the diffractograms, we have not attempted to separate these effects (say, by the well-known Thomson–Cox–Hastings method). In our Rietveld analyses, we represent the variations in composition and cell dimensions by superimposing intensity bells associated with slightly different crystals.
Extinction, non-validity of the kinematic theory of XRD: This problem is notably recognized in quartz-containing rocks. Our quartz powders are made of small crystals, and so this difficulty does not affect us.
The link to GitLab contains the programs suggested here. A guide for obtaining and processing diffractometric data is also provided.
How much is gained in a synchrotron XRD phase analysis compared to laboratory measurements? Quite a lot is gained in terms of detecting minor phases and characterizing well-crystallized phases. This point is interesting in the comparison of Figure 7 and Figure 8. A curious contrast can be seen between the experimental resolution gains in the feldspar groups of peaks (Or 040 + Ab 040) near 2θ ≈ 27°. The resolution gain is visible in the Tigre sample, but in the Nopal sample, it is not noticeable. The feldspars from Nopal present a lower degree of crystallinity than those from Tigre. It is striking that the opposite occurs with montmorillonite: the broader 001 peak (lower crystallinity) is observed in Tigre, not in Nopal.
The Sierra Peña Blanca presents a general uniformity in its felsic composition and characteristic rhyolitic tuffs. However, a subtle difference was found in the less abundant chemical species in the two different localities. The source of the El Tigre stream is in the vicinity of the Puerto III and Margaritas mines. In contrast, the sample collected near the Nopal mine presents a slightly greater abundance of the montmorillonite species than that collected in the El Tigre stream. The much higher kaolinite content in the Nopal sample than in the Tigre sample is very significant. Both differences are evidence that the geochemical processes associated with uranium mineralization in Nopal I are linked to the presence of the two clay species [61,62]. These are consequently dispersed as fine sediments from the mineralized zone through erosive processes. In contrast, the broadening of the Mnt 001 peaks is associated with the sampling points of the two samples. The Nopal sample was extracted from a point higher in the Sierra than the Tigre sample, and therefore, the degradation of montmorillonite is greater in the lower altitude sample.
An important detail that differentiates the XRD patterns of the samples from Laguna del Cuervo from those from Nopal and Tigre is that the Mnt 001 peaks in Nopal and Tigre are approximately symmetrical bell-shaped, and those from Laguna del Cuervo are noticeably asymmetrical, with a tendency to be plateau-shaped. This is common in clay samples, which are formed by particles with different amounts of water and various atoms in solution. In the literature [63], the Mnt 001 peak is modeled as a superposition of three (or more) contributions (illite, smectite, and montmorillonite). In the present work, for the Rietveld analysis, Mnt1, Mnt2, and Mnt3 (with suitable lattice parameters) are modeled, and satisfactory results are obtained. For the DoC, a relatively wide range of the dispersion angle corresponding to the cryptocrystalline contribution is selected so that the complete plateau is considered in the calculation.
In Chihuahua, the wind regime modeled for 30 years at coordinates 29.250 N–105.900 W [64] indicates moderate to strong winds, blowing with v > 2 km/h to 10–20 km/h from S–SE during the summer and with v > 20 km/h to 40–50 km/h from W–WNW in winter. Appendix B presents an image of the dust devils common in winter in Chihuahua.
Rainfall in the sampling area can be estimated from the six meteorological stations [59] surrounding the sampling point for the last 60 years. The values corresponding to the ten most recent segments (from 1961 to 2020) indicate rainfall between 190 and 280 mm per year in six segments and between 385 and 512 mm in four segments.
The sedimentary column studied spans at least 150 years [65]. Due to the annual aeolian transport of the finest sediments [66,67,68], the quantities of montmorillonite deposited at the sampling site may be considered constant. However, when the heavy rains characteristic of deserts occur [69,70], they carry sediments of larger diameter and modify the relative concentration of the sediments carried by the wind on these days. If a rough approximation is made of the possible annual intervals for segments 1–12, it is observed that the dates of the segments of the sedimentary column with maximum and minimum montmorillonite concentrations agree approximately with the recent history of droughts and rainy periods in direct data on precipitation [71,72] and the streamflow of neighboring dams [73,74]. Therefore, the differences between the segments in the montmorillonite content could be attributed to the droughts and rainy periods to which each segment corresponds. Based on fluctuations in the concentrations of cryptocrystalline sediments in the segments, an estimate could be made of periods of drought and rain that are more or less long, for which national information is available [59]. Considering the absence of systematic information from meteorological stations in the sampling area for dates before 1960, this estimate will provide information on droughts in Chihuahua before 1945.
Recent research in the Sierra Peña Blanca suggests that uranium ore carried by sediments from the main streams that are part of the drainage pattern of open-pit mines is practically not dissolved but is fragmented by the mechanical action caused by torrential rains and is transported by gravity through surface water [75,76]. Among the more than 60 sediment samples taken from streams, 3 from the floodplain, and the 23 core segments of the present work, only one sample has presented concentrations of uranium that was dissolved and then adsorbed in mud [77].
Numerous investigations deal with uranium adsorption by the montmorillonite and kaolinite phases present in the sediments [17,78,79,80,81,82,83,84,85]. However, due to recent results in the Sierra Peña Blanca, the dissolution of minerals and subsequent adsorption of uranyl ions on the montmorillonite of the sediments have not been favored, although they cannot be completely ruled out in the future [76].

5. Conclusions

The investigation of uranium transport in sediments from the SPB to the floodplain presented the need to propose differentiated phase analysis procedures for when the concentrations of cryptocrystalline phases need to be obtained experimentally in many samples of similar origin. This is the case, for example, in the recent dating of segments of a sedimentary core. The work investigated the repeatability of sediment sample preparation to obtain reliable XRD patterns. It also demonstrated the accuracy of Rietveld and DoC analyses for the desired purpose.
The present study illustrates the scope and costs (in time and resources) of the different methods applied. The Rietveld method is the current king, solving almost everything from a quantitative phase analysis to structural and microstructural characterization. The Rietveld method requires time, expertise, and patience. The computerized DoC procedure described in this paper may be sufficient for estimating the proportion of amorphous or cryptocrystalline material in sediments that are to be dated because they carry radioisotopes. It is rapid and leads to technically satisfactory results.

Supplementary Materials

The following supporting information can be downloaded at: https://www.mdpi.com/article/10.3390/cryst15020169/s1: Crystals 3415210 Suppl Info.rar. Supplementary Information S1.pdf: Reproducibility of samples M2 and M22; Identification of some components of the test sample. Supplementary Information S2.pdf: Certified Reference Materials Data for NIST 1c Argillaceous Limestone, NIST 97b Flint Clay, and NCS DC61102 (GBW03116) Potassium Feldspar.

Author Contributions

Conceptualization, L.E.F.-C. and M.E.M.-C.; methodology, C.d.R.C.-C., Y.R.-G., M.E.M.-C. and L.E.F.-C.; software, L.F.-M.; validation, A.I.G.-J. and L.F.-M.; formal analysis, C.d.R.C.-C. and L.E.F.-C.; investigation, C.d.R.C.-C., Y.R.-G., A.I.G.-J. and L.E.F.-C.; writing—original draft preparation, C.d.R.C.-C., Y.R.-G., L.E.F.-C. and M.E.M.-C.; writing—review and editing, L.E.F.-C. and M.E.M.-C.; project administration, M.E.M.-C.; funding acquisition, M.E.M.-C. All authors have read and agreed to the published version of the manuscript.

Funding

This research was funded by the CONAHCYT research project CF/2019 10853.

Institutional Review Board Statement

Not applicable.

Informed Consent Statement

Not applicable.

Data Availability Statement

Data are contained within the article, and the associated materials are in the Appendix A and Appendix B and GitLab.

Acknowledgments

The authors thank CONAHCYT for funding the CF/2019 10853 project. The high-resolution XRD measurements were conducted as part of proposal 20215805 at Elettra Sincrotrone Trieste. We sincerely appreciate their assistance.

Conflicts of Interest

The authors declare that the research was conducted in the absence of any commercial or financial relationships that could be construed as a potential conflict of interest.

Abbreviations

The following abbreviations are used in this manuscript:
SPBSierra Peña Blanca
XRDX-ray diffraction
ICP-OESInductively coupled plasma atomic emission spectroscopy
CIMAVCentro de Investigación en Materiales Avanzados
DoCDegree of crystallinity
PONKCSPartial or No Known Crystal Structure
SEMScanning electron microscopy
EDSEnergy dispersive X-ray spectroscopy
RMRietveld method
AbAlbite
AnAnorthite
CalCalcite
HlyHalloysite
KlnKaolinite
MagMagnetite
MntMontmorillonite
MsMuscovite
OrOrthoclase
QzQuartz
SaSanidine
DLDetection limit

Appendix A

Table A1. Concentrations (weight %) of the major elements analyzed by ICP-OES.
SampleAlCaFeKMgNaSiTi
17.393.942.442.961.151.1820.720.16
26.913.652.232.861.031.1420.480.15
37.073.732.302.911.081.2019.740.15
47.143.832.342.981.061.2420.970.16
56.903.772.372.831.031.2818.930.16
65.072.822.182.720.661.0723.340.21
76.233.712.332.930.881.4923.260.18
86.453.742.372.960.931.3723.500.18
95.546.332.632.491.291.4818.920.19
106.323.772.382.960.861.3423.220.18
116.343.932.282.960.861.4122.890.18
124.652.742.272.920.631.2123.510.21
136.223.602.182.930.881.4023.390.17
146.624.172.262.890.861.3723.790.17
155.953.682.162.880.791.3823.430.15
166.724.232.212.930.961.4823.010.14
177.144.372.303.060.961.5324.050.16
185.152.742.122.830.881.3622.960.15
194.922.782.162.800.851.2923.300.16
206.584.302.252.940.911.4624.110.15
216.574.372.182.850.861.4524.450.16
226.253.902.072.840.811.4723.640.16
236.323.832.112.850.851.5124.120.17
Table A2. Phase concentrations in weight % of the 23 segments from the sedimentary core sample. Minerals are denoted by IMA symbols [60].
SampleMnt-DoCQzCalMagMnt-1Mnt-2Mnt-3Mnt-TotalAnKlnSa
19.033.4210.350.591.517.771.2210.541.493.120.53
25.931.9111.460.672.6750.688.3542.614.430.57
36.032.0110.920.614.261.263.338.8542.314.760.54
48.731.111.160.632.396.342.2811.0140.634.930.55
58.432.5910.620.631.766.262.3410.3641.783.370.66
68.332.1511.240.71.866.281.419.5541.554.210.6
78.730.6310.220.941.926.70.999.6144.53.690.42
88.830.1410.790.771.637.360.889.8744.343.660.43
98.830.1211.410.651.439.15010.5842.963.80.49
108.929.1811.280.430.749.130.5810.4544.913.280.46
1113.927.249.870.711.3711.952.7816.141.853.770.45
1211.327.9611.790.641.369.851.1612.3743.053.60.59
139.834.412.30.51.099.080.7110.8837.943.40.58
1414.232.6512.560.731.711.071.3214.0935.883.640.45
1513.628.8112.370.571.4810.392.0713.9440.233.60.48
169.928.2312.50.51.249.980.7111.9342.393.860.59
179.730.4111.580.421.029.130.3910.5443.053.460.54
188.329.0512.670.491.59.130.2710.942.264.170.47
199.629.712.810.481.279.040.9311.2441.214.080.49
209.027.0913.40.521.888.950.1410.9743.563.910.54
2110.927.2213.360.481.289.880.2211.3843.773.240.56
2210.727.9311.910.481.539.30.2811.1145.023.140.42
2310.529.3711.610.351.069.10.3810.5445.122.580.44

Appendix B

Figure A1. Dust devil along the Ciudad Juarez–Chihuahua highway, November 2024.
Crystals 15 00169 g0a1

References

  1. Schmidt, R.H. A climatic delineation of the ‘real’ Chihuahuan Desert. J. Arid. Environ. 1979, 2, 243–250. [Google Scholar] [CrossRef]
  2. Goodell, P.C. Chihuahua city uranium province, Chihuahua Mex. In Proceedings of the Technical Committee Meeting on Uranium Deposits in Volcanic Rocks, El Paso, TX, USA, 2–5 April 1984; pp. 97–124. [Google Scholar]
  3. Reyes Cortes, M. Deposito de molibdeno asociado con uranio en Peña Blanca, Mexico. In Proceedings of the Technical Committee Meeting on Uranium Deposits in Volcanic Rocks, El Paso, TX, USA, 2–5 April 1984; pp. 161–174. [Google Scholar]
  4. Allen, P.A. From landscapes into geological history. Nature 2008, 451, 274–276. [Google Scholar] [CrossRef]
  5. Tuli, J.K. Nuclear Wallet Cards; Brookhaven National Laboratory: Upton, NY, USA, 2011. [Google Scholar]
  6. Appleby, P.G.; Oldfield, F. The calculation of lead-210 dates assuming a constant rate of supply of unsupported 210Pb to the sediment. CATENA 1978, 5, 1–8. [Google Scholar] [CrossRef]
  7. Sanchez-Cabeza, J.A.; Ruiz-Fernández, A.C. 210Pb sediment radiochronology: An integrated formulation and classification of dating models. Geochim. Cosmochim. Acta 2012, 82, 183–200. [Google Scholar] [CrossRef]
  8. Appleby, P.G.; Oldfieldz, F. The assessment of 210Pb data from sites with varying sediment accumulation rates. Hydrobiologia 1983, 103, 29–35. [Google Scholar] [CrossRef]
  9. Atkins, P.; De Paula, J. Physical Chemistry; Macmillan: New York, NY, USA, 2006; Volume 1. [Google Scholar]
  10. Shang, J.; Liu, C.; Wang, Z.; Zachara, J.M. Effect of Grain Size on Uranium (VI) Surface Complexation Kinetics and Adsorption Additivity. Environ. Sci. Technol. 2011, 45, 6025–6031. [Google Scholar] [CrossRef]
  11. Baqer, Y.; Thornton, S.; Stewart, D.I.; Norris, S.; Chen, X. Analysis of Uranium Sorption in a Laboratory Column Experiment Using a Reactive Transport and Surface Complexation Model. Transport Porous Media 2023, 149, 423–452. [Google Scholar] [CrossRef]
  12. McKinley, J.P.; Zachara, J.M.; Smith, S.C.; Turner, G.D. The influence of uranyl hydrolysis and multiple site-binding reactions on adsorption of U (VI) to montmorillonite. Clays Clay Miner. 1995, 43, 586–598. [Google Scholar] [CrossRef]
  13. Singleton, A.A.; Schmidt, A.H.; Bierman, P.R.; Rood, D.H.; Neilson, T.B.; Greene, E.S.; Bower, J.A.; Perdrial, N. Effects of grain size, mineralogy, and acid-extractable grain coatings on the distribution of the fallout radionuclides 7Be, 10Be, 137Cs, and 210Pb in river sediment. Geochim. Cosmochim. Acta 2017, 197, 71–86. [Google Scholar] [CrossRef]
  14. Bobos, I.; Madruga, M.J.; Reis, M.; Esteves, J.; Guimarães, V. Clay mineralogy insights and assessment of the natural (228Ra, 226Ra, 210Pb, 40K) and anthropogenic (137Cs) radionuclides dispersion in the estuarine and lagoon systems along the Atlantic coast of Portugal. CATENA 2021, 206, 105532. [Google Scholar] [CrossRef]
  15. Muñoz-Arcos, E.G.; Millward, G.E.; Clason, C.C.; Bravo-Linares, C.M.; Blake, W.H. Fine sediment-associated contaminants in gravel bed rivers: Evaluating storage times and turnover using fallout radionuclides (FRNs). Sci. Total Environ. 2025, 959, 178177. [Google Scholar] [CrossRef]
  16. Singh, B.K.; Um, W. Application of clay materials for sorption of radionuclides from waste solutions. Minerals 2023, 13, 239. [Google Scholar] [CrossRef]
  17. Zhang, B.; Gao, B.; Ma, W.; Wang, S.; Qi, W.; Wu, J.; Wang, R.; Zhou, Y.; Liu, Y. Different behavior of uranium (VI) on two clay minerals: Montmorillonite and kaolinite. J. Radioanal. Nucl. Chem. 2023, 332, 4029–4046. [Google Scholar] [CrossRef]
  18. Zhang, Y. Progress and perspectives on hexavalent uranium waste forms for the immobilization of uranium-rich radioactive wastes. Mater. Chem. Phys. 2024, 324, 129714. [Google Scholar] [CrossRef]
  19. Zhang, Y.; Xu, B. Fidelity of the 210Pb dating method, a subaquatic sediment perspective. Sci. Total Environ. 2023, 871, 161972. [Google Scholar] [CrossRef] [PubMed]
  20. Aba, A.; Al-Dousari, A.M.; Ismaeel, A. Depositional characteristics of 7Be and 210Pb in Kuwaiti dust. J. Radioanal. Nucl. Chem. 2016, 307, 15–23. [Google Scholar] [CrossRef]
  21. Sun, X.; Fan, D.; Liao, H.; Liu, M.; Tian, Y.; Zhang, X.; Yang, Z. Variation in sedimentary 210Pb over the last 60 years in the Yangtze River Estuary: New insight to the sedimentary processes. Mar. Geol. 2020, 427, 106240. [Google Scholar] [CrossRef]
  22. Baskaran, M. Applications of Radon Progeny in Atmospheric Studies. In Radon: A Tracer for Geological, Geophysical and Geochemical Studies; Springer International Publishing: Cham, Switzerland, 2016; pp. 85–117. [Google Scholar] [CrossRef]
  23. Barsanti, M.; Garcia-Tenorio, R.; Schirone, A.; Rozmaric, M.; Ruiz-Fernández, A.C.; Sanchez-Cabeza, J.A.; Delbono, I.; Conte, F.; De Oliveira Godoy, J.M.; Heijnis, H.; et al. Challenges and limitations of the 210Pb sediment dating method: Results from an IAEA modelling interlaboratory comparison exercise. Quat. Geochronol. 2020, 59, 101093. [Google Scholar] [CrossRef]
  24. Cullity, B.D.; Stock, S.R. Elements of X-Ray Diffraction; Prentice Hall: Upper Saddle River, NJ, USA, 2001; p. 664. [Google Scholar]
  25. Rietveld, H. A profile refinement method for nuclear and magnetic structures. J. Appl. Crystallogr. 1969, 2, 65–71. [Google Scholar] [CrossRef]
  26. McCusker, L.; Von Dreele, R.; Cox, D.; Louër, D.; Scardi, P. Rietveld refinement guidelines. J. Appl. Crystallogr. 1999, 32, 36–50. [Google Scholar] [CrossRef]
  27. Gražulis, S.; Merkys, A.; Vaitkus, A. Crystallography Open Database (COD). In Handbook of Materials Modeling: Methods: Theory and Modeling; Andreoni, W., Yip, S., Eds.; Springer International Publishing: Cham, Switzerland, 2020; pp. 1863–1881. [Google Scholar] [CrossRef]
  28. Kabekkodu, S.N.; Dosen, A.; Blanton, T.N. PDF-5+: A comprehensive powder diffraction file™ for materials characterization. Powder Diffr. 2024, 39, 47–59. [Google Scholar] [CrossRef]
  29. Zagorac, D.; Müller, H.; Ruehl, S.; Zagorac, J.; Rehme, S. Recent developments in the Inorganic Crystal Structure Database: Theoretical crystal structure data and related features. J. Appl. Crystallogr. 2019, 52, 918–925. [Google Scholar] [CrossRef]
  30. Downs, R.T.; Hall-Wallace, M. The American Mineralogist crystal structure database. Am. Mineral. 2003, 88, 247–250. [Google Scholar]
  31. Putz, H.; Brandenburg, K. Match!-Phase Analysis Using Powder Diffraction; Crystal Impact: Bonn, Germany, 2024. [Google Scholar]
  32. Suzuki, Y. Automated Data Analysis for Powder X-Ray Diffraction Using Machine Learning. Synchrotron Radiat. News 2022, 35, 9–15. [Google Scholar] [CrossRef]
  33. Lee, J.-W.; Park, W.B.; Lee, J.H.; Singh, S.P.; Sohn, K.-S. A deep-learning technique for phase identification in multiphase inorganic compounds using synthetic XRD powder patterns. Nat. Commun. 2020, 11, 86. [Google Scholar] [CrossRef] [PubMed]
  34. Surdu, V.-A.; Győrgy, R. X-ray Diffraction Data Analysis by Machine Learning Methods—A Review. Appl. Sci. 2023, 13, 9992. [Google Scholar] [CrossRef]
  35. Rodríguez-Carvajal, J. Recent developments of the program FULLPROF. Comm. Powder Diffr. Newsl. 2001, 26, 12–19. [Google Scholar]
  36. Lutterotti, L.; Pilliere, H.; Fontugne, C.; Boullay, P.; Chateigner, D. Full-profile search-match by the Rietveld method. J. Appl. Crystallogr. 2019, 52, 587–598. [Google Scholar] [CrossRef] [PubMed]
  37. Coelho, A. TOPAS and TOPAS-Academic: An optimization program integrating computer algebra and crystallographic objects written in C++. J. Appl. Crystallogr. 2018, 51, 210–218. [Google Scholar] [CrossRef]
  38. Bergmann, J.; Friedel, P.; Kleeberg, R. BGMN-a New Fundamental Parameters Based Rietveld Program for Laboratory X-ray Sources, it’s Use in Quantitative Analysis and Structure Investigations. IUCr Comm. Powder Diffr. Newsl. 1998, 20, 5–8. [Google Scholar]
  39. Toby, B.H.; Von Dreele, R.B. GSAS-II: The genesis of a modern open-source all purpose crystallography software package. J. Appl. Crystallogr. 2013, 46, 544–549. [Google Scholar] [CrossRef]
  40. Madsen, I.C.; Scarlett, N.V.; Kern, A. Description and survey of methodologies for the determination of amorphous content via X-ray powder diffraction. ZKri 2011, 226, 944–955. [Google Scholar] [CrossRef]
  41. Clark, G.L.; Reynolds, D.H. Quantitative analysis of mine dusts: An X-Ray diffraction method. Ind. Eng. Chem. Anal. Ed. 1936, 8, 36–40. [Google Scholar] [CrossRef]
  42. Butler, B.M.; Hillier, S. Automated Full-Pattern Summation of X-Ray Powder Diffraction Data for High-Throughput Quantification of Clay-Bearing Mixtures. Clays Clay Miner. 2021, 69, 38–51. [Google Scholar] [CrossRef]
  43. O’Connor, B.H.; Raven, M.D. Application of the Rietveld refinement procedure in assaying powdered mixtures. Powder Diffr. 1988, 3, 2–6. [Google Scholar] [CrossRef]
  44. Klug, H.P.; Alexander, L.E. X-Ray Diffraction Procedures: For Polycrystalline and Amorphous Materials; Wiley: Hoboken, NJ, USA, 1974; p. 966. [Google Scholar]
  45. Scarlett, N.V.; Madsen, I.C. Quantification of phases with partial or no known crystal structures. Powder Diffr. 2006, 21, 278–284. [Google Scholar] [CrossRef]
  46. Riello, P. Quantitative analysis of amorphous fraction in the study of the microstructure of semi-crystalline materials. In Diffraction Analysis of the Microstructure of Materials; Springer: Berlin, Germany, 2004; pp. 167–184. [Google Scholar] [CrossRef]
  47. Mejdi, M.; Wilson, W.; Saillio, M.; Chaussadent, T.; Divet, L.; Tagnit-Hamou, A. Quantifying glass powder reaction in blended-cement pastes with the Rietveld-PONKCS method. Cem. Concr. Res. 2020, 130, 105999. [Google Scholar] [CrossRef]
  48. Kanzari, A.; Gérard, M.; Boekhout, F.; Galoisy, L.; Calas, G.; Descostes, M. Impact of incipient weathering on uranium migration in granitic waste rock piles from former U mines (Limousin, France). J. Geochem. Explor. 2017, 183, 114–126. [Google Scholar] [CrossRef]
  49. Maestracci, B.; Delchini, S.; Chateigner, D.; Pilliere, H.; Lutterotti, L.; Borovin, E. Simultaneous combined XRF-XRD analysis of geological sample: New methodological approach for on-site analysis on New-Caledonian Ni-rich harzburgite. J. Geochem. Explor. 2023, 252, 107250. [Google Scholar] [CrossRef]
  50. ISO-18400-102; Soil Quality- Sampling-Part 102: Selection and Application of Sampling Techniques. International Organization for Standardization: Geneva, Switzerland, 2017; p. 71.
  51. Switzer, A.D. Measuring and Analyzing Particle Size in a Geomorphic Context. Treatise Geomorphol. 2013, 14, 224–242. [Google Scholar]
  52. Sanchez-Cabeza, J.-A.; Díaz-Asencio, M.; Ruiz-Fernández, A.C. (Eds.) Radiocronología de Sedimentos Costeros Utilizando 210Pb: Modelos, Validación y Aplicaciones; IAEA: Vienna, Austria, 2012. [Google Scholar]
  53. Kawrakow, I.; Mainegra-Hing, E.; Rogers, D. EGSnrcMP: The Multi-Platform Environment for EGSnrc; National Research Council of Canada: Ottawa, ON, Canada, 2006. [Google Scholar]
  54. Rogers, D.W.; Kawrakow, I.; Seuntjens, J.; Walters, B.; Mainegra-Hing, E. NRC User Codes for EGSnrc; NRCC Report PIRS-702 (Rev. B); NRC: Ottawa, ON, Canada, 2003. [Google Scholar]
  55. Venegas-Argumedo, Y.; Montero-Cabrera, M. True coincidence summing corrections for an extended energy range HPGe detector. In Proceedings of the AIP Conference Proceedings, Ciudad Juárez, Mexico, 4–6 March 2015. [Google Scholar]
  56. Strachnov, V.; LaRosa, J.; Dekner, R.; Zeisler, R.; Fajgelj, A. Report on the Intercomparison Run IAEA-375: Determination of Radionuclides in Soil Sample IAEA-375; International Atomic Energy Agency, Agency’s Laboratories: Vienna, Austria, 1996. [Google Scholar]
  57. IAEA. Reference Sheet–Reference Material IAEA-375, Radionuclides and Trace Elements in Soil; Analytical Quality Control Services (AQCS); Agency’s Laboratories, International Atomic Energy Agency: Seibersdorf, Austria, 2000; p. 4. [Google Scholar]
  58. Currie, L.A. Limits for qualitative detection and quantitative determination. Application to radiochemistry. Anal. Chem. 1968, 40, 586–593. [Google Scholar] [CrossRef]
  59. Nacional, S.M. Información Estadística Climatológica. Available online: https://smn.conagua.gob.mx/es/climatologia/informacion-climatologica/informacion-estadistica-climatologica (accessed on 10 October 2024).
  60. Warr, L.N. IMA–CNMNC approved mineral symbols. MinM 2021, 85, 291–320. [Google Scholar] [CrossRef]
  61. Aniel, B.; Leroy, J.M. The reduced uraniferous mineralizations associated with the volcanic rocks of the Sierra Pena Blanca (Chihuahua, Mexico). Am. Mineral. 1985, 70, 1290–1297. [Google Scholar]
  62. George-Aniel, B.; Poty, B.; Leroy, J. Uranium deposits of the Sierra Peña Blanca: Three examples of mechanisms of ore deposit formation in a volcanic environment. In Proceedings of the Technical Committee Meeting on Uranium Deposits in Volcanic Rocks, El Paso, TX, USA, 2–5 April 1984; pp. 490–498. [Google Scholar]
  63. Barré, P.; Montagnier, C.; Chenu, C.; Abbadie, L.; Velde, B. Clay minerals as a soil potassium reservoir: Observation and quantification through X-ray diffraction. Plant Soil 2008, 302, 213–220. [Google Scholar] [CrossRef]
  64. Meteoblue. Simulated Historical Climate & Weather Data for 29.25° N, 105.9° W. Available online: https://www.meteoblue.com/en/weather/historyclimate/climatemodelled/29.25N-105.9E1179_America%2FChihuahua (accessed on 18 December 2024).
  65. Caraveo-Castro, C.d.R.; Montero-Cabrera, M.E.; Méndez-García, C.G.; Cabral-Lares, R.M.; Castillo-Sandoval, I. Mineralogical characterization and uranium radioactivity of recent sediments from the Laguna del Cuervo, Chihuahua. In Proceedings of the 1st National Congress of the Mexican Society of Synchrotron Light & 1st International Congress of Synchrotron Light Techniques, Leon, Guanajuato, Mexico, 21–26 June 2021. [Google Scholar]
  66. Ma, L.; Wu, J.; Abuduwaili, J.; Liu, W. Aeolian particle transport inferred using a ~150-year sediment record from Sayram Lake, arid northwest China. J. Limnol. 2015, 74, 584–593. [Google Scholar] [CrossRef]
  67. Vandenberghe, J.; Sun, Y.; Wang, X.; Abels, H.A.; Liu, X. Grain-size characterization of reworked fine-grained aeolian deposits. Earth-Sci. Rev. 2018, 177, 43–52. [Google Scholar] [CrossRef]
  68. Vandenberghe, J. Grain size of fine-grained windblown sediment: A powerful proxy for process identification. Earth-Sci. Rev. 2013, 121, 18–30. [Google Scholar] [CrossRef]
  69. Shi, H.; Yue, D.; Zhao, J.; Wang, X. Research on flood sediments and rainstorm events in Huangtuwa, Northern Shaanxi. Front. Environ. Sci. 2023, 11, 1180730. [Google Scholar] [CrossRef]
  70. Wennrich, V.; Böhm, C.; Brill, D.; Carballeira, R.; Hoffmeister, D.; Jaeschke, A.; Kerber, F.; Maldonado, A.; May, S.M.; Olivares, L.; et al. Late Pleistocene to modern precipitation changes at the Paranal clay pan, central Atacama Desert. Glob. Planet. Change 2024, 233, 104349. [Google Scholar] [CrossRef]
  71. Núñez-López, D.; Muñoz-Robles, C.A.; Reyes-Gómez, V.M.; Velasco-Velasco, I.; Gadsden-Esparza, H. Characterization of drought at different time scales in Chihuahua, México. Agrociencia 2007, 41, 253–262. [Google Scholar]
  72. Esquivel, E. Lluvia y sequía en el norte de México. Un. Análisis Precipitación Histórica En. Chihuahua. Gac. Ecológica 2002, 65, 43–52. [Google Scholar]
  73. Renteria-Villalobos, M.; Hanson, R.T.; Eastoe, C. Evaluation of climate variability on sustainability for transboundary water supply in Chihuahua, Mexico. J. Hydrol. Reg. Stud. 2022, 44, 101207. [Google Scholar] [CrossRef]
  74. Ortega-Gaucin, D. Hydrological drought characterization in the Rio Grande basin, Mexico. Terra Latinoam. 2013, 31, 167–180. [Google Scholar]
  75. Perez-Reyes, V.; Cabral Lares, R.M.; Canche Tello, J.G.; Faudoa Gómez, F.G.; Rodríguez Guerra, Y.; Hernández Herrera, C.; Reyes Cortés, I.A.; Loredo Portales, R.; Hernández Cruz, D.; Esparza Ponce, H.E.; et al. Experimental Modeling and Synchrotron Light analysis of uranium transport by surface water in sediments of Peña Blanca-Laguna del Cuervo, Chihuahua. Supl. Rev. Mex. Física 2024, 5, 011203. [Google Scholar] [CrossRef]
  76. Pérez-Reyes, V.; Cabral-Lares, R.M.; Canche-Tello, J.G.; Rentería-Villalobos, M.; González-Sánchez, G.; Carmona-Lara, B.P.; Hernández-Herrera, C.; Faudoa-Gómez, F.; Rodríguez-Guerra, Y.; Vázquez-Olvera, G.; et al. Uranium Mineral Transport in the Peña Blanca Desert: Dissolution or Fragmentation? Simulation in Sediment Column Systems. Appl. Sci. 2025, 15, 609. [Google Scholar] [CrossRef]
  77. Pérez-Reyes, V.; Cabral-Lares, R.M.; Méndez-García, C.G.; Caraveo-Castro, C.d.R.; Reyes-Cortés, I.A.; Carrillo-Flores, J.; Montero-Cabrera, M.E. Transport and concentration of uranium isotopes in the Laguna del Cuervo, Chihuahua, Mexico. Supl. Rev. Mex. Física 2022, 3, 010606. [Google Scholar] [CrossRef]
  78. Akçay, H. Aqueous speciation and pH effect on the sorption behavior of uranium by montmorillonite. J. Radioanal. Nucl. Chem. 1998, 237, 133–137. [Google Scholar] [CrossRef]
  79. Bachmaf, S.; Merkel, B.J. Sorption of uranium (VI) at the clay mineral–water interface. Environ. Earth Sci. 2011, 63, 925–934. [Google Scholar] [CrossRef]
  80. Catalano, J.G.; Brown, G.E. Uranyl adsorption onto montmorillonite: Evaluation of binding sites and carbonate complexation. Geochim. Cosmochim. Acta 2005, 69, 2995–3005. [Google Scholar] [CrossRef]
  81. Dent, A.J.; Ramsay, J.D.F.; Swanton, S.W. An EXAFS study of uranyl ion in solution and sorbed onto silica and montmorillonite clay colloids. J. Colloid Interface Sci. 1992, 150, 45–60. [Google Scholar] [CrossRef]
  82. Hennig, C.; Reich, T.; Dähn, R.; Scheidegger, A.M. Structure of uranium sorption complexes at montmorillonite edge sites. Radiochim. Acta 2002, 90, 653–657. [Google Scholar] [CrossRef]
  83. Schindler, M.; Legrand, C.A.; Hochella, M.F. Alteration, adsorption and nucleation processes on clay–water interfaces: Mechanisms for the retention of uranium by altered clay surfaces on the nanometer scale. Geochim. Cosmochim. Acta 2015, 153, 15–36. [Google Scholar] [CrossRef]
  84. Sylwester, E.R.; Hudson, E.A.; Allen, P.G. The structure of uranium (VI) sorption complexes on silica, alumina, and montmorillonite. Geochim. Cosmochim. Acta 2000, 64, 2431–2438. [Google Scholar] [CrossRef]
  85. Yu, S.; Ma, J.; Shi, Y.; Du, Z.; Zhao, Y.; Tuo, X.; Leng, Y. Uranium (VI) adsorption on montmorillonite colloid. J. Radioanal. Nucl. Chem. 2020, 324, 541–549. [Google Scholar] [CrossRef]
Figure 1. Spectrum of the sediment corresponding to segment 9 (20–22.5 cm depth). The identification of the isotope corresponding to each gamma ray energy is shown on the spectrum line. The purple bars below the peaks represent the regions of interest (ROI) for each fitting. The red lines represent the fitting by Gaussian least squares. It can be observed that the 137Cs line is close to the detection limit. The measurement time was 604,800 s with the XtRa detector model GX1020.
Crystals 15 00169 g001
Figure 2. SEM analysis of the Nopal sample. (a) Backscattered electron image; (b) EDS analysis.
Crystals 15 00169 g002
Figure 3. SEM analysis of the Tigre sample. (a) Backscattered electron image; (b) EDS analysis.
Crystals 15 00169 g003
Figure 4. SEM analysis of segment #22 from the sedimentary core. (a) EDS analysis in wt. %. (b) Backscattered electron image with the compositional difference. (c) Low-magnification backscattered electron image.
Crystals 15 00169 g004
Figure 5. Experimental and Rietveld-modeled XRD patterns of a multiphase test sample to evaluate the proposed quantitative phase analysis. R factors: Rp = 5.97 and Rwp = 10.3.
Crystals 15 00169 g005
Figure 6. DoC approximation of the montmorillonite concentration in a calibrated test sample. The red dashed vertical lines indicate the integration limits for the cryptocrystalline fraction. The blue ones indicate the respective limits for the well-crystallized fraction. The DoC result, 7%, is 1% lower than that of the Rietveld method, which in turn is 1% lower than the actual value.
Crystals 15 00169 g006
Figure 7. XRD pattern of the Nopal sample. The main plot describes the pattern measured at the synchrotron, which is converted to the CuKα wavelength. The inset is a zoom of the interval associated primarily with feldspars. It includes, in blue, a segment of the conventional XRD experiment.
Crystals 15 00169 g007
Figure 8. High-resolution XRD pattern of the Tigre sample. The zoomed image in the inset plays a role equivalent to the one in Figure 4. Some interesting details to be noticed are the good detection of minor phases (2θ ≈ 10°) and better separation of peaks from feldspars (2θ ≈ 27°) in the synchrotron experiment.
Crystals 15 00169 g008
Figure 9. DoC analyses of (a) sample 2 (low montmorillonite content) and (b) sample 22 (relatively rich in montmorillonite). The red dashed vertical lines indicate the integration limits for the cryptocrystalline fraction. The blue ones indicate the respective limits for the well-crystallized fraction.
Crystals 15 00169 g009
Figure 10. Rietveld analysis of sample 2, obtained with the Fullprof multi-pattern program, called from the ANALIA code.
Crystals 15 00169 g010
Figure 11. Rietveld analysis of sample 22, obtained with the Fullprof multi-pattern program, called from the ANALIA code. A higher proportion of cryptocrystalline montmorillonite is detected.
Crystals 15 00169 g011
Figure 12. Comparison of the results obtained by Rietveld refinement and those obtained by DoC for the concentration of cryptocrystalline montmorillonite in the 23 samples from Laguna del Cuervo.
Crystals 15 00169 g012
Table 1. Average concentrations of the major elements in weight % of the sedimentary core samples. Dispersions are shown in parentheses.
AlCaFeKMgNaSiTi
6.3 (0.8)3.9 (0.7)2.27 (0.12)2.88 (0.11)0.9 (0.1)1.35 (0.13)23 (2)0.17 (0.02)
Table 2. Phase concentrations, in wt. %, of the calibrated test sample. Standard deviations, reported by the Fullprof program, are given in parentheses.
PhaseExperimentally MixedXRD Rietveld
Quartz 34.436.6 (0.6)
Calcite16.515.6 (0.3)
Montmorillonite9.28.5 + (0.3)
Kaolinite8.49.1 (0.3)
Microcline16.017.1 (0.3)
Albite13.813.0 (0.3)
Analbite1.4DL
Cristobalite0.3 (DL)0
Table 3. Phase concentrations in weight % of the samples Nopal and Tigre. Standard deviations are shown in parentheses. IMA mineral symbols [60] are also given in parentheses.
PhaseNopalTigre
Quartz (Qz)35.13 (1.74)24.87 (1.32)
Calcite (Cal)14.81 (1.24)25.56 (1.63)
Montmorillonite (Mnt)10.89 (0.55)9.37 (0.42)
Kaolinite (Kln)13.88 (0.83)2.92 (0.55)
Halloysite (Hly)-4.57 (0.54)
Muscovite (Ms)-2.6 (0.1)
Orthoclase (Or)13.76 (0.83)24.89 (0.88)
Albite (Ab)10.45 (0.78)4.81 (0.46)
Magnetite (Mag)~1 (DL)~1 (DL)
Disclaimer/Publisher’s Note: The statements, opinions and data contained in all publications are solely those of the individual author(s) and contributor(s) and not of MDPI and/or the editor(s). MDPI and/or the editor(s) disclaim responsibility for any injury to people or property resulting from any ideas, methods, instructions or products referred to in the content.

