Abstract
Due to its higher energy and smaller heating area, laser joining technology is widely used in aluminum alloy welding and other industrial fields, which meets the solder sealing requirements for electronic packaging. According to experiments, cracks were prone to occur at the corners and spot-welding positions near the weld. In this paper, the depth and width of the melt pool were measured experimentally, and the results were used to calibrate and validate the heat source model. An empirical relationship between heat source parameters and melt pool morphology is presented. The heat source model of laser deep penetration welding was established under the same experimental conditions. And the results were in agreement with the experimental results. The finite element method was used to numerically simulate the welding process of a 50%SiAl shell and a 27%SiAl cover plate. The effects of different spot-welding sequences and numbers on the residual stress and cracking possibility of laser welded samples were analyzed. The results show that under sequential spot-welding, when the amount of spot-welding is increased, the stress peak value decreases. Compared with sequential spot welding and side-by-side spot welding, the spot-welding sequence of diagonal points first, and then side-by-side spot welding, can effectively reduce the residual stress. This research enables us to provide some guidelines in terms of studying the reliability issues of microwave devices.
1. Introduction
In recent years, silicon-aluminum (AlSi) alloys have been widely used as packaging materials in microwave electronic devices. The coefficient of thermal expansion (CTE) of the silicon-aluminum alloy material is closer to that of the silicon substrate in an electronic device. Moreover, the silicon aluminum alloy material also has a high thermal conductivity, which is similar to that of the aluminum alloy. Silicon aluminum alloys present different properties with different silicon content [1,2]. It was found that by changing the ratio of Al to Si in AlSi alloy, the alloy materials with a density of 2300~2700 kg/m3, a thermal expansion coefficient of 7.5~17 × 10−6/K and a thermal conductivity greater than 100 W/(m·K) can be obtained. As the Si content of high silicon aluminum alloy reaches 27~70% with the continuous increase in silicon content, the microstructure of primary silicon and eutectic silicon is coarser, which will lead to poor toughness and plasticity of the material, and means that it will be difficult to process. Therefore, with the rapid development of electronic packaging technology, reliability issues for joining technology in those microwave devices arise. The joining of three kinds of high-energy density heat sources, such as laser welding, plasma arc welding, and electron beam welding, have been rapidly developed and applied in the field of joining technology. Due to the thermal and mechanical reliability requirements for microwave devices, it is not suitable to use high temperature weld joining methods such as arc welding and other welding methods. The laser joining technology has higher energy and a smaller heating area [3], and its heat input can be controlled at a lower temperature, which is quite suitable for the joining of the microwave devices. Otherwise, it has been widely used in the welding of aluminum alloys, magnesium alloys, and other thin plate materials [4].
Many studies have been presented on the analysis of the reliability of laser joining. Numerical simulation is an indispensable and important research method, including the numerical simulation of thermal diffusion [5,6], thermomechanical coupling [7,8], fluid dynamics [9], and magneto-hydrodynamics [10,11,12]. Torkamany et al. [13] used annular laser welds to weld austenitic stainless steel AISI 304L and mild steel DIN1.1010 dissimilar materials. They found the following reasons for the asymmetry of the solder joints: laser welding is a single-sided non-contact welding method, different materials have different absorption rates of laser light, and the thermal conductivity of the base metal is also different. Kou [14] studied the mechanism of solidification cracking and liquefaction cracking through metallurgical analysis. They believed that the composition and solid fraction of the weld and heat affected zone are the key to thermal cracking. To better understand the mechanism of hot crack formation during the laser welding of austenitic steel grades, Bakir et al. [15] conducted a finite element analysis on the occurrence of under controlled tensile weldability (CTW) test conditions. The phenomenon of solidification cracks was also experimentally and numerically investigated in their work. Lin et al. [16] analyzed the fracture mechanism of solder joints when lap joints were subjected to tensile and shear loads through experiments and two-dimensional elastic theory. They found that the necking occurred near the edge of the weld. Gatzen et al. [17] established a computational fluid dynamics model to simulate the flow of welding melt. The simulation results of element distribution of filler wire material under different frequencies of coaxial magnetic fields were compared with the experimental results under the same parameters, and the influencing factors on the change of filler distribution were analyzed.
In addition, with the continuous development of laser welding technology, the laser beam welding of aluminum alloys has drawn considerable attention where pulsed laser joining is widely used [18]. The literature has shown that solidification cracking in the laser joining of aluminum alloys is significantly reduced by appropriate filler metals, dual laser beam welding techniques [9,19], and dual pulse laser welding techniques [20]. Indhu et al. [6] investigated dual-phase steel and (DP600) laser welded aluminum alloys (AA6061) by experimental and computational modeling. The effect of heat input on joint microstructural evolutions and strength was analyzed. Yin et al. [21] studied the laser ablation process of aluminum alloy 6061 before and after silicon dioxide coating through experiments and numerical simulations. The thermal diffusion of laser flux and the effect of silica coating on the thermal diffusion and ablation depth of AA6061 was analyzed. Wang et al. [22] established a 3D thermochemical finite element model for the laser welding of aluminum alloy fibers considering the cylindrical volume heat source, temperature-dependent material properties, solidification shrinkage, and stress relaxation in the weld pool. The solidification cracking behavior of 6013 aluminum alloy fibers during laser welding was studied. Amirreza et al. [23] established a three-dimensional thermochemical coupled finite element model. The temperature distribution, residual stress, and deformation distribution of the reinforced aluminum alloy Al6061-T6 plate during welding was studied. The distributions of residual stress and distortion were calculated and analyzed. Similarly, in the process of deep penetration welding, the stable keyhole movement is maintained through pulse shaping and modulation of an appropriate frequency, which reduces the porosity of aluminum alloy laser welding. Due to the cost of the experiments, a numerical simulation will provide a more convenient and versatile way to study the joining process effects on the reliability issues.
The aim of this paper is to study reliability issues and joining processes optimization for the packaging of AlSi alloy microwave devices with laser joining. In pursuit of this objective, a heat source model of laser deep penetration welding was established. The finite element method was used to numerically simulate the welding process of a 50%SiAl shell and a 27%SiAl cover plate. A 50%SiAl material was selected as the shell for better thermal matching with the substrate and chip. The 27%SiAl material was selected as the cover plate in order to better match with the laser sealing joining process. Based on computations, the effects of different spot-welding sequences and numbers on the residual stress and cracking possibility of laser joined samples were analyzed based on numerical simulation. The method presented in this paper can provide some practical guidelines on analyzing the reliability issues in laser joining processes in microwave device packaging. This study also sheds light on the reliability issues analysis of microwave devices.
2. Experimental Methodologies
As shown in Figure 1, in the welding experiment, the sample was placed on a thick plate of high-strength steel, and it was pressed with a steel block. The high-power Yb laser beam source in the experiment is a YAG pulse laser. The laser peak power range is 2200~2500 W, and a pulsed laser beam with a pulse width of 3~3.5 ms and a frequency of 15~18 Hz was emitted. The welding process was carried out under the condition of accelerated heat dissipation in N2 gas, and the moving speed of the laser beam is around 200~240 mm/min. The laser power was adjusted to ensure the same depth of penetration for each welding speed for better comparability. In order to be consistent with the experimental results, in this simulation a constant heat source input average power of 100~120 W was set.
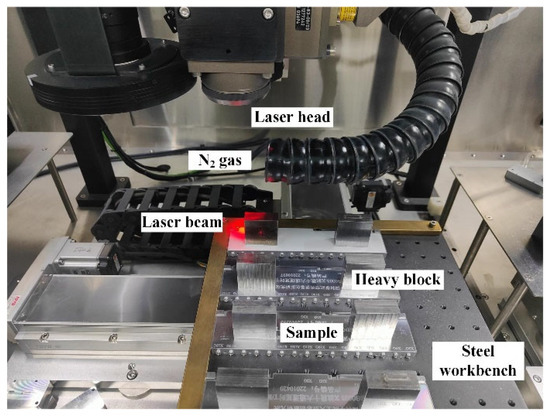
Figure 1.
Experimental apparatus for laser joining in the present study.
From a thermodynamic point of view [15], the critical strain and the strain rate (εmin, dε/dT) are necessary conditions for hot crack formation. Critical strains and strain rates that occur during welding can cause material separation. There is a phase between the beginning and the end of solidification where the material exhibits both ductile and brittle behavior [24]. In this case, when all materials have solidified, it is the end of solidification. At this time, the temperature is the solidification temperature of the material, which may be far beyond the temperature of a certain point in time. This is how it exhibits solid behavior on a macroscopic scale. Essentially, thermal stress is the main cause of thermal cracking [25]. Therefore, the analysis of residual stress is essential to the study of welding cracks.
Due to the requirements of the joining sequences and the joining processes, discrete spot-welding is performed to secure the weldment before the continual welding. According to the welding results of the experiment, cracks were prone to form at the corners and spot-welding positions near the welding regions, as shown in Figure 2. The size of fusion surface is a decisive factor for mechanical properties, concentrated strain and subsequent necking of laser spot welding. That is to say, too small spot-welding position, there is a problem of stress concentration. In order to solve the problems caused by spot welding, it is necessary to simulate various sequence and quantity of spot welding, and then compare and analyze the best spot- welding scheme.

Figure 2.
Sample and crack-prone locations.
3. Finite Element Methods
3.1. Finite Element Modelling
3.1.1. Model Geometry and Material Properties
The material was assumed to obey the elastic-plastic laws following isotopic hardening. The purpose of this study is to analyze and solve the failure problem caused by thermal stress without considering the phase transition. Based on the laws of thermodynamics, a thermodynamic model of the microwave device box was established. In the simulation of laser joining, the cover plate and the shell were placed in overlapping form. The overlapping size (thickness of the contact region) between the areas of the cover plate and the shell is 0.4 mm. By adjusting the parameters of the laser heat source and moving the laser spot, fusion welding was performed on the gap track between the cover plate and the shell to ensure the airtight nature of the internal cavity. The combined heat source of the Gaussian surface heat source and the volume heat source was used to apply a power load to the sample to complete the numerical simulation of laser joining. The ranges of heat source parameters are: a heat source effective power Q = 100~120 W; a surface heat source effective radius of r0 = 0.1~0.8 mm (rs = rv = r0), a surface heat source concentration coefficient of a = 0.5, a body heat source effective height of H = 0.4~0.8 mm, a body heat source attenuation coefficient of b = 0.15, and a moving speed of v = 200~240 mm/min. Thermal and residual stresses in the weld zone were analyzed and characterized. The effect of the sequence and number of spot-weldings on the welding results was investigated to understand their effects on stress distribution and its effect on crack formation. A better spot-welding sequence was verified to improve the welding success rate of the weldment.
A three-dimensional finite element model with the same geometry parameters as the experimental sample was established, as shown in Figure 3. It consists of a 50%SiAl shell with a size of 61.5 × 40.4 × 7.9 mm and a 27%SiAl cover at a size of 59.9 × 38.8 × 1 mm. The material parameters are shown in Table 1. The thickness of the side wall of the shell is 0.8 mm, and the minimum width of the groove in the shell is 0.4 mm. At the connection between the shell and the cover plate, a life-and-death element with a thickness of 0.8 mm was set in the weld area to simulate the weld formed during the welding process.
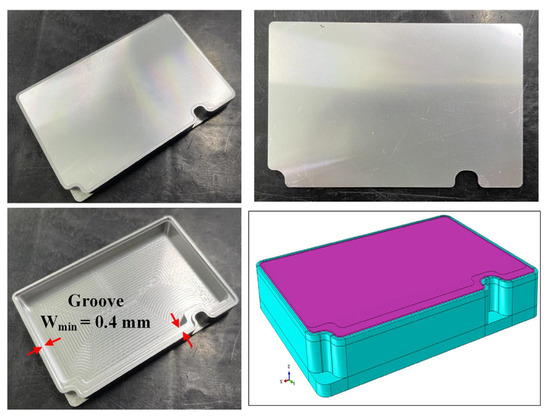
Figure 3.
Experimental sample and 3D finite element model.

Table 1.
Material Properties adopted in the simulation.
3.1.2. Finite Element Model and Mesh
A three-dimensional finite element model was established. However, there are small features such as small edges and sharp corners in the model constructed according to the scale of the experimental sample. These small features, which affect the mesh quality, will easily reduce the computational accuracy and convergence. Considering that these locations are not critical areas for the study, the non-critical areas were removed to simplify the model, as shown in Figure 4. The mesh at the weld is uniformly refined (0.2 mm). We gradually increased the size of the mesh to transition away from the weld area. The size of the weld is 0.8 mm, which is formed when two silicon aluminum alloy materials are butted together. Before welding, the spot-welding positions were evenly distributed on all four sides of the weld to secure the shell to the cover.
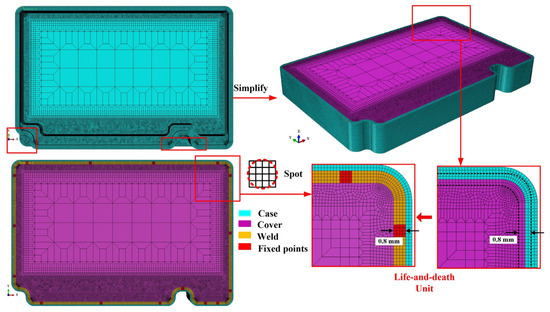
Figure 4.
Reserved points and grids for spot welding.
The simulation process of welding was analyzed by indirect geothermal coupling. The thermal analysis results are considered as the loading for the mechanical analysis. The nodal temperatures calculated in each step of the transient thermal analysis were used as hot body loads in the nonlinear mechanical analysis to calculate residual stresses and deformations. The initial condition is the ambient temperature of the workpiece, which was set to 20 °C. The convective heat transfer coefficient between the workpiece and the air was set to 30 W/m2·°C. Three corner fixed constraints were added to the lower surface of the model: Ux = Uy = Uz = 0, Uy = Uz = 0 and Uz = 0. In order to find a numerical method that can simulate the welding process and select parameters, the general idea is shown in Figure 5.
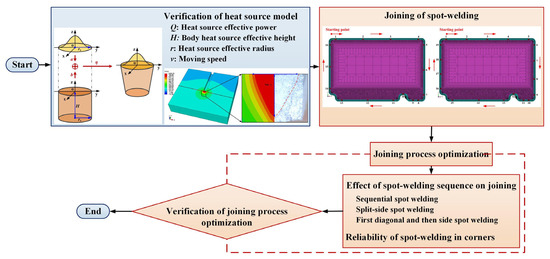
Figure 5.
The overall framework of the research work.
3.1.3. Governing Equations and Boundary Conditions
In this study, a three-dimensional thermomechanical coupling model was used to simulate the welding process of microwave devices. With the moving and loading of the simulated laser heat source on the surface of the device, the heat is transferred from the high temperature region to the low temperature region, and the temperature tends to be uniformly distributed. In numerical modelling, the process of heat transfer is controlled by the following equation [26]:
where T is the current temperature, Q is the internal heat generation (W/m3), and ρ, Cp, kx, ky, and kz are the density of the material (kg/m3), the specific heat (J/(kg·°C)), and the thermal conductivity (W/(m·°C)) of the x, y, and z directions, respectively.
Besides the heat transfer inside the welded device, the heat is also dissipated to the environment during the whole welding and cooling process, where heat is convectively exchanged and heat radiates with the air. In terms of boundary conditions for the heat dissipation, the convective heat transfer and heat radiation with the ambient environment based on Newton’s law was considered on all open surfaces [27,28]:
where qc is the heat dissipation, hc is the heat transfer coefficient (W/(m2·K)), δr = 5.67 × 10⁻⁸ W/(m2·K−4)is the Stefan-Boltzmann coefficient (W/m2K4), εr = 0.8 is the emissivity coefficient, T is the geometry temperature, and T0 is the ambient temperature (20 °C).
Based on the above governing heat transfer equations, a nonlinear and non-uniformly distributed temperature field can be obtained. They are included in the mechanical analysis as thermal strain increments, and cause the localized expansion and contraction of the material [29]. The following mechanical equilibrium and intrinsic composition equations are used for structural analysis [30,31]:
where σij,j, ρ and bj are the stress tensor, the material density, and the volume force.
where dσ, dε, dT, [Dep] and [Cth] are the stress increment, the strain increment, the temperature increment, the elastoplastic matrix, and the thermal stiffness matrix, respectively.
where εe, εp and εth are the elastic strain, plastic strain and thermal strain; [De] and [Dp] are the elastic stiffness matrix and the plastic stiffness matrix, respectively. In the study, large strain theory [32,33] was used to deal with possible geometric nonlinearities during the simulation.
3.2. Calibration of Heat Source Model
3.2.1. Heat Source Model
During laser joining, the laser beam contacts the metal material, transferring its heat by thermal conduction to the surface of the workpiece and deeper space below the surface. Under the action of the laser heat source, the material melts, evaporates, and penetrates the thickness of the workpiece to form a long and narrow cavity. As the laser joining continues, the small hole moves along the seam between the two workpieces to form a welding zone. In the process of laser joining fusion, a good welding effect can be obtained by controlling the relation between the shape parameters of the molten pool and the welding process. In this paper, a model using a combination of two types of heat sources, i.e., a surface heat source and a body heat source as shown in Figure 6, was used to simulate the shape of the weld pool, which has been confirmed as agreeing with the actual weld fusion line. Among them, the surface heat source is a Gaussian heat flow distribution surface heat source model, and the body heat source is a cylindrical heat source with increasing peak heat flow [27]. The surface heat source controls the shape of the surface weld pool, and the body heat source controls the deep weld caused by the keyhole effect. According to the distribution of the molten pool morphology obtained by the welding experiment, the energy distribution was conducted, and a reasonable heat source model was combined [34].
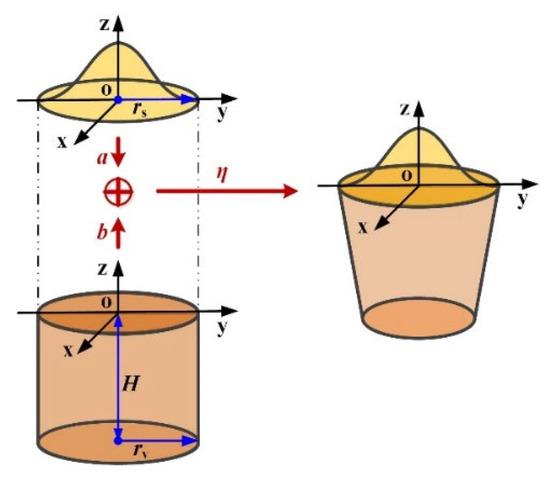
Figure 6.
Heat source model.
The model adopted in this paper is a combination of the Gaussian surface heat source and a cylinder heat source, which are described respectively as:
- (1)
- Heat flux density distribution of Gaussian surface heat source model,
- (2)
- Heat flux density distribution of the cylinder heat source model,
The Gaussian surface heat source and the cylinder heat source are combined into a new combined heat source to simulate deep penetration welding,
where η = 0.99 is the effective absorption coefficient of the heat source.
In the context of the temperature variable, the time and spatially varying heat source is applied at the top boundary of the domain to represent the heat flux from the incident laser beam [35]. During the simulation, the obtained historical thermal variables are used as a predefined field in the mechanical model. The clamping conditions are simulated using fixed constraints. According to the elastic-plastic theory of isotropic hardening [36,37], the material parameters are defined. The focus of this work is to determine the reliability issues during the joining process.
3.2.2. Influence of Heat Source Parameters on Molten Pool Size
A geometric model for heat source model calibration was established, which consists of two materials: 50%SiAl and 27%SiAl. The size of the geometric model was 19.6 × 18 × 4 mm, as shown in Figure 7. The life and death unit of 1 × 1 × 18 mm was used to simulate the weldment formation zone. During the numerical simulation of thermal diffusion, multiple constraints needed to be imposed, including the initial conditions and the boundary conditions. The initial condition is the ambient temperature of the workpiece, which was set to 20 °C. The convective heat transfer coefficient between the workpiece and the air was set to 30 W/m2·°C. The left and right sides of the model were fixed with constraints, and the right side was released after the welding was complete.
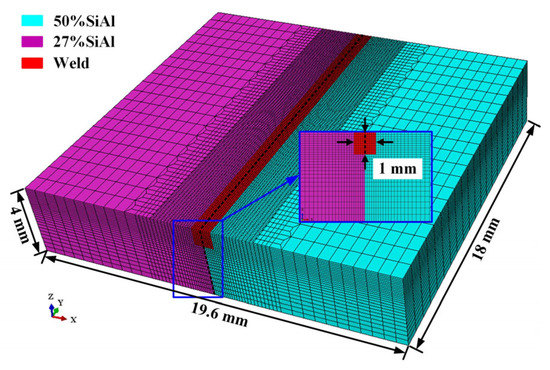
Figure 7.
Geometry model for heat source model calibration.
Before the simulation, the heat source model needed to be calibrated. Heat source parameters Q, H, r and v were adjusted according to equations (6) ~ (8). Specifically, when other parameters are unchanged, only one parameter is changed and the corresponding result of the parameter is compared to get the best value. By calculating the welding temperature field of the model, the weld pool size (width and depth) was matched with the actual welding area. The finite element simulation was carried out with different heat source parameter ranges, the distribution of the melt pool was analyzed, and the depth and width of the melt pool were measured. The ranges of heat source parameters are: heat source effective power Q = 100~120 W; surface heat source effective radius r0 = 0.1~0.8 mm (rs = rv = r0), surface heat source concentration coefficient a = 0.5, body heat source effective height H = 0.4~0.8 mm, body heat source attenuation coefficient b = 0.15, and moving speed v = 200~240 mm/min. As shown in Figure 7, in the case of the average laser power Q = 110 W and the moving speed v = 240 mm/min, the effective radius and depth of the heat source model were parametrically analyzed. It should be noted that while ensuring normal welding in the experiment, the laser temperature should be controlled so as not to be too high to avoid high temperature damage to the sample. Figure 8a is the temperature distribution curve of the upper model surface in the vertical welding direction, and the variation of the width of the molten pool with the parameters can be displayed. Figure 8b is a temperature distribution curve in the z-direction of the model depth, and the variation of the depth of the molten pool with the parameters can be displayed. Comparing the changes of the curve, we found that the parameters r0 and H that meet the experimental requirements of the molten pool width and depth range (0.8~1 mm) are 0.1, 0.2, and 0.6, 0.8, respectively. Comparing the maximum temperature of the curve, the parameters of r0 = 0.2 mm, H = 0.6 and r0 = 0.2 mm, H = 0.8 mm are better. Among them, a deeper molten pool can be obtained when r0 = 0.2 mm and H = 0.8 mm.
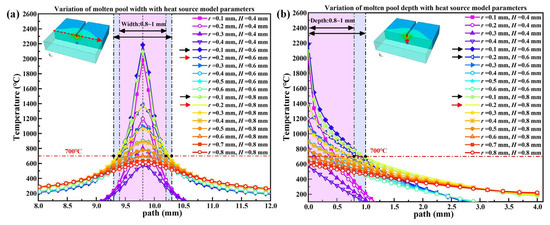
Figure 8.
Influence of heat source effective radius and effective depth on molten pool depth and width; (a) Variation of molten pool width with heat source parameters; (b) Variation of molten pool depth with heat source parameters.
We also performed simulations with varying average laser power Q to calibrate the heat source model, as shown in Figure 9a, b. Other heat source parameters are: r0 = 0.2 mm, H = 0.6 mm, and v = 240 mm/min. Figure 9a is the temperature distribution curve of the upper model surface perpendicular to the welding direction, which can show the variation of the weld pool width with the average laser power Q. Comparing the changes of the curves, we found that the parameters of Q that meet the experimental requirements are 105 W, 110 W, 115 W and 120 W. Figure 9b is a temperature distribution curve in the z-direction of the model depth, and the variation of the depth of the molten pool with the average laser power P can be displayed. When comparing the changes of the curve, we found that Q = 120 W meets the experimental requirements. Similarly, when r0 = 0.2 mm, H = 0.6 mm, and Q = 120 W, the size of the molten pool varies with the laser moving speed as shown in Figure 9c, d. Comparing the changes of the curve, we found that the parameters v = 240 mm/min meets the experimental requirements, which is consistent with the previous results.
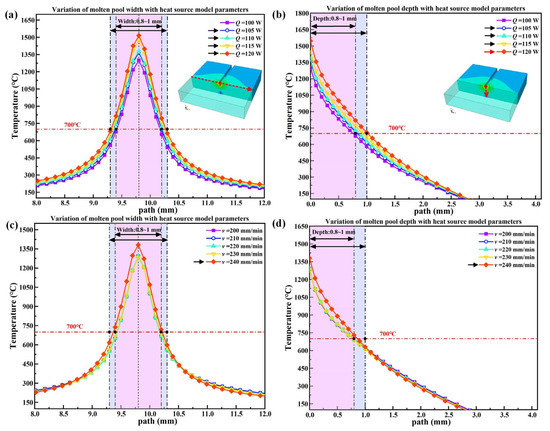
Figure 9.
The influence of heat source average input power and moving speed on molten pool depth and width; (a) Variation of molten pool width with Q; (b) Variation of molten pool depth with Q; (c) Variation of molten pool width with v; (d) Variation of molten pool depth with v.
After model validation, the parameters of the heat source model were determined. The effective power of the heat source was Q = 120 W, the effective radius was r0 = 0.2 mm, the effective height of the body heat source was H = 0.6 mm, and the moving speed was v = 240 mm/min. After the initial numerical simulation of loading the heat source, the temperature on the surface and inside of the weld changes rapidly. The highest temperature field is located in the molten pool area, and it is mainly distributed inside the small region of the molten pool. With the movement of the welding heat source over time, the overall temperature of molten pool l continues to rise, and the maximum temperature exceeds the temperature value of the melting point of the material. The high temperature area moves with the movement of the heat source, and the shape of the molten pool also moves forward, and the temperature field area and the shape of the molten pool also increase. The simulation results are shown in Figure 10. The peak temperature reaches 1440 °C, and the thermal diffusion is obvious in the cross section. According to the liquid phase parameters of the silicon-aluminum alloy, the morphology of the molten pool is simulated in the hot temperature region above 700 °C. The width and depth of the molten pool are about 1 mm. The temperature distribution curve perpendicular to the welding direction on the cross-section at this moment is intercepted, which is consistent with the expected temperature distribution in the experiment. This verification idea refers to the work of Wang et al. [22].
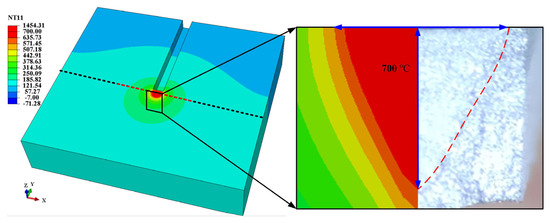
Figure 10.
Comparison between molten pool shape and weld shape.
4. Results and Discussion
4.1. Joining of Spot-Welding
A low plastic embrittlement crack is the crack that occurs when the joining joint is cooled near room temperature and the cumulative shrinkage strain caused by the volume shrinkage exceeds the plastic reserve of the material. The Si content of the high silicon aluminum alloy shell is as high as 50%, and the toughness and plasticity are very poor. Therefore, the residual stress in the weld area should be paid attention to, especially the pre-spot-welding fixed position. Before formal joining, the cover plate and the case are fixed together by scattered spot welding to prevent slippage between them. The spot-welding positions were evenly distributed at the four sides of the welding seam, and the number was set to 16 and 19, respectively, as shown in Figure 11. The sequence of spot welding is done using sequential welding, which is denoted as A (from point 1 to point 16), and D (from point 1 to point 19), respectively. Sequential welding was then performed along the weld seam from the starting point.
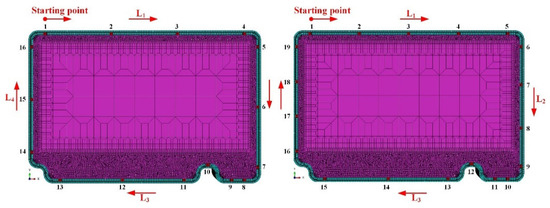
Figure 11.
Sequence of spot-welding.
After the complement of welding, the temperature drops to room temperature (20 °C). At this time, there are still residual stresses in the device. The residual stresses at the weld are shown in Figure 12, with the stress concentrated at and near the spot-welding location. This is consistent with the experimental results, which also indicate that these locations are prone to cracking. The reason for the residual stress peaks at the spot-welding position is that, starting from the initial temperature of 20 °C, there will be certain energy transmission and residue in the spot-welding area because the laser spot has a certain heating area. Later, when sequential laser welding is performed, the temperature at the center of the weld increases gradually as the welding progresses. After the welding is completed, the residual stress peaks appear at the spot-welding positions due to the superposition of stress. However, compared the stress cloud, it is difficult to find the difference between the welding results of the two spot-welding numbers. Along the welding direction, the residual principal stress distribution curve in the weld area was extracted, as shown in Figure 13. It can be seen that the stress peaks occur at the spot-welding positions. In the 16 and 19 spot-welding results, the maximum stress peak is located near the corner. The upper envelope of the stress curve is taken to compare the welding results of the two spot-welding. Compared Figure 13a, b, it can be seen that under sequential spot welding, the stress peaks vary when the number of spot-welding increases. On the first weld line L1, the stress peaks were reduced with the addition of a spot-welding. On the second weld line L2, the stress peaks increased with the addition of a spot-welding, and the four peaks were similar in size. On the third weld line L3, the number of spot-welding was not increased, and the stresses were more uniform and slightly fewer at the other locations, except for the two corners where the stress peaks increased. On the fourth weld line L4, a spot-welding is added and the change of peak stress is not significant. It can be seen that increasing the number of spot-welding for the first weld can reduce the stress peak under sequential spot welding. This may be because the increased fixed point shares the stress effect. Therefore, the idea of the following work is to carry out a joining comparison under the two spot welding numbers to further verify this hypothesis.

Figure 12.
Residual stress in the weld after welding under sequential spot-welding; (a) 16 points; (b) 19 points.
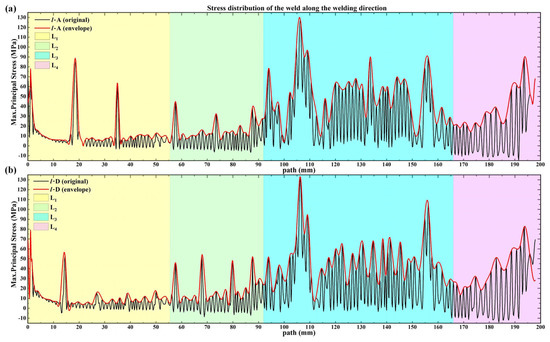
Figure 13.
Residual stress distribution along the weld direction after welding under sequential spot-welding sequence; (a) 16 points; (b) 19 points.
4.2. Joining Process Optimization
4.2.1. Effect of Spot-Welding Sequence on Joining
There are three spot welding sequences for the two types of spot-welding models: sequential spot welding, side-by-side spot welding, and diagonal spot welding first, and then side-by-side spot welding, as shown in Figure 14. Similarly, the upper envelope of the stress curve is plotted to compare the welding results under different welding sequences. The three spot-welding sequences of 16/19 points are defined as: sequential spot welding, respectively represented as A and D; Sub-side spot welding (The order goes: the first long side, the second long side, the first short side, and the second short side), respectively represented as B and E; Diagonal spot welding (the point 1 and 8/10; the point of 4/5 and 13/15), then side spot welding (where the laser connects the diagonal points, respectively represented as C and F. It can be seen that there is a stress peak at the spot-welding position, and the largest peak is located near the corner in the three orders of the results of 16 and 19 spot-welding. In Figure 12a, b, the stress peaks are slightly reduced in the side-by-side spot welding B and in the diagonal spot welding, followed by side-by-side spot welding methods compared to the sequential spot-welding A. However, the reduction of the stress peak at the corner is not significant, and even increases. This requires further research with regard to the residual stress at the inflection point.
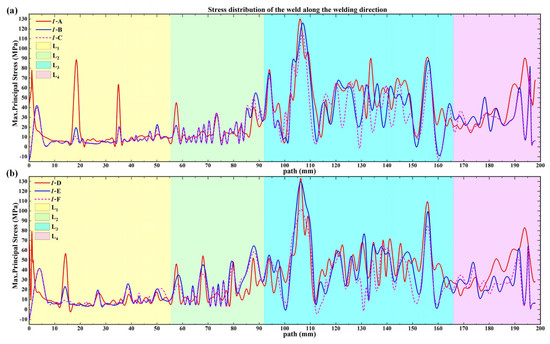
Figure 14.
The residual principal stress distribution along the direction of the weld after welding under the three spot welding sequences; (a) 16 points; (b) 19 points.
To facilitate the comparison of the stresses at the spot-welding locations, the principal stresses at the spot-welding locations are extracted in the vertical welding direction, as shown in Figure 15. Among them, Figure 15a, b shows sequential spot welding under two numbers (16 and 19 points), respectively. Figure 15c, d shows the side-by-side spot welding at two numbers (16 and 19 points), respectively. Figure 15e, f shows the diagonal and then split-side spot welding for two numbers (16 and 19 points), respectively. From the edge to the inside, the residual stress in the vertical direction of the weld is tensile stress and is symmetrically distributed. At the midpoint of the heat input section, the tensile stress reached a maximum value. As the width increased, the tensile stress gradually decreased, transforms into compressive stress, and finally tends to be stable. We compared the residual stress curves at 16 spot-welding positions for three spot welding sequences. As can be seen in Figure 15a, the residual stress of the weldment after spot welding in sequence A is relatively high, and the stress value at each spot-welding position is relatively large. The stress value at point 10 (at the corner) is the largest, about 195.42 MPa. In Figure 15c, the residual stress of the weldment after spot welding on the B side is reduced. The stress value at point 10 (at the corner) is the largest, at about 132.39 MPa. In Figure 15e, in the method of spot welding first diagonally and then side by side, the residual stress value of the weldment except at the inflection point is reduced more significantly. The highest residual stress is 123.04 MPa. The stress value at the inflection point is higher than the residual stress of the side spot-welding. In Figure 15b, d, f, the number of spot-weldings increased to 19. The variation of residual stress under D sequence spot-welding is consistent with that of 16 points, and the highest residual stress is 199.09 MPa. However, the residual stress of E side-by-side spot welding did not decrease significantly. In the F method of diagonal spot welding first and then side-by-side spot welding, the residual stress value of the weldment, except for the inflection point, decreased more significantly. The stress value at the inflection point is higher than the residual stress of the side-by-side spot welding.
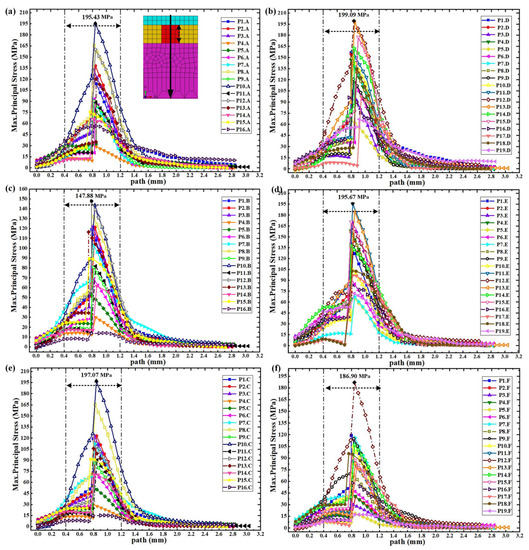
Figure 15.
Principal stress distribution in the vertical weld direction after two kinds of spot welding under three spot welding sequences; (a,b) Sequential spot welding; (c,d) Side-by-side spot welding; (e,f) Diagonal spot welding first and then -by-side spot welding.
In Figure 16, the residual stress variation curve with time is plotted at the spot-welding location near the corner. It can be seen that with sequential spot welding, the stress values are higher at the spot-welding located at the corner of L3 and at the end of L4. Comparing the stress values of the two spot-welding numbers under the three spot welding sequences, it can be seen that the stress values are significantly reduced under the spot-welding sequence of diagonal first and then split side. It is obvious that the stress values at the spot-welding located at the corner of L3 and at the end of L4 decrease significantly.
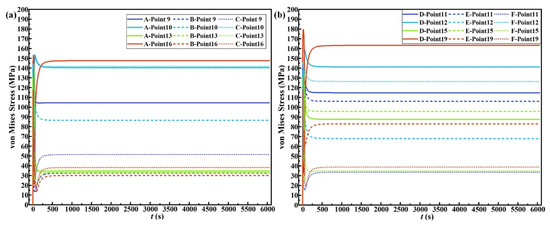
Figure 16.
Stress variation curve with time at the spot-welding position near the corner under three kinds of spot-welding sequences; (a) 16 points; (b) 19 points.
4.2.2. Reliability of Spot-Welding in Corners
It can be seen from the previous analysis results that in comparing the residual stress distribution of the 16 and 19 spot welding models under several spot-welding sequences, the spot-welding sequence of the diagonal first and then the side is better. In this spot-welding sequence, the residual stress level at the spot-welding position after welding is lower. As shown in Figure 17a–c, in order to scientifically analyze the influence of spot-welding at this position on residual stress, three spot welding methods were selected for study at this position and its vicinity.
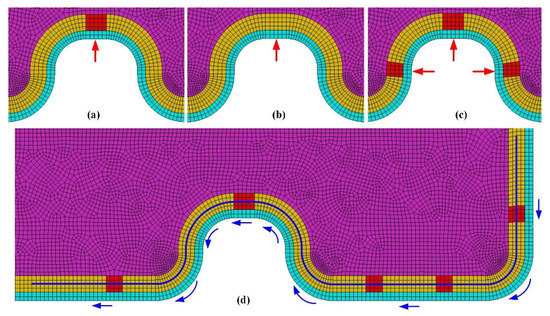
Figure 17.
Three spot welding methods at the corner and the path in the direction of the weld near this location; (a) One spot weld around the corner; (b) No spot weld around the corner; (c) Three spot welds at the corner; (d) Weld path around the corner.
Figure 18 shows the temperature change curve at the corner with time. It can be seen that the temperature accumulation process of the welding at the corner is basically the same under the three methods. The temperature peak of the C2 (F2) curve of adding spot-welding on both sides of this point is the highest, while the temperature peak of the C (F) curve of adding a spot-welding here is slightly lower. The temperature peak of the C1 (F1) curve without adding a spot-welding there is obviously the lowest. This means that the heat accumulated there has been reduced. Since the cracks of the sample are prone to appear at the corners and their vicinity, the residual stress values along the path along the weld seam were presented as shown in Figure 17d. From Figure 19, the upper envelope curves of the stresses under the three spot welding sequences are compared where the filled areas in blue and green represent smaller stress values for C1(F1) than the other two methods. The filled area in orange which represents the stress value of C1(F1) is greater than the other two methods. The orange area is obviously smaller than the area of the other two colors. This means that the residual stress at the peak of the C1 (F1) curve without adding spot-welding is obviously the lowest, which is consistent with the results shown in Figure 18. This can effectively reduce the residual stress in the corner and its vicinity, and reduce the occurrence of cracking. This is consistent with the energy accumulation and residue of the laser welding described above.
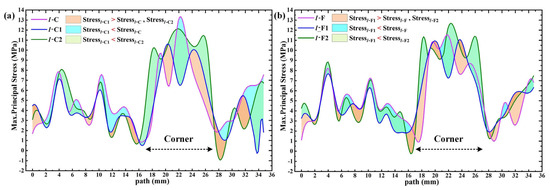
Figure 18.
Residual principal stress distribution curve near the corner; (a) 16 points; (b) 19 points.
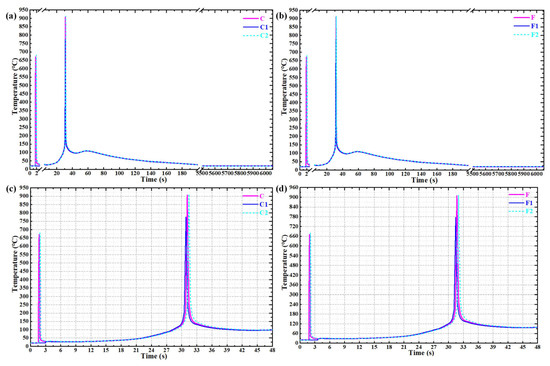
Figure 19.
Temperature curve at the corner with time; (a) 16 points; (b) 19 points; (c) and (d) are enlarged views of temperature peaks in (a) and (b), respectively.
4.2.3. Verification of Joining Process Optimization
It can be seen that the stress value located at the corner of L3 is significantly reduced under the spot-welding sequence of C1, as shown in Figure 19. In order to verify the same effect of stress reduction on other corners on the weld under the welding sequence of C1, the stress variation curve with time for the spot-welding located at the corners was plotted, as shown in Figure 20. Comparing the stress values of the two spot-welding numbers under the three spot welding sequences, it can be seen that the stress values are significantly reduced under the spot-welding sequence of C1 (F1). In Figure 20a, the stress value of the spot-welding at the corner on L3 is significantly reduced in C1 compared to C, and is close to that of C2. In Figure 20b, F2 shows a significant reduction in stress values for spot-welding at the corners when compared to F and F1. In summary, the profitability of spot-welding at the corners on each side is significantly reduced under the C1 (F1) spot-welding sequence.
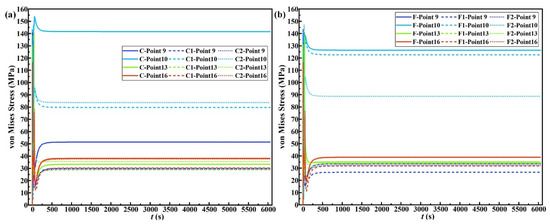
Figure 20.
Stress variation curves with time for spot-welding positions near the corners in three cases; (a) 16 points; (b) 19 points.
The principal stresses at the spot-welding positions in the vertical welding direction are plotted for two numbers of spot-welding under the sequence of C1 and F1, as shown in Figure 21. From the edge to the inside, the residual stress in the vertical direction of the weld is tensile stress, and is symmetrically distributed. At the midpoint of the heat input section, the tensile stress reached a maximum value. As the width increases, the tensile stress gradually decreases and even transforms into compressive stress, and finally tends to be stable. In Figure 21a, in the sequence of C1, the spot-welding at the inflection point is removed, and it is obvious that the residual stresses at all of the 16 spot-weldings are lower than the three spot welding sequences in Figure 15. In addition, the maximum residual stress is 130.26 MPa, which is 33.34% lower than that of the sequential spot-welding method. In Figure 21b, in the sequence of F1, the spot-welding at the inflection point is removed, and it is obvious that the residual stresses at all of the 19 spot-weldings are lower than the three spot welding sequences in Figure 15, which is consistent with the 16 spot-weldings. The maximum residual stress is 150.56 MPa, which is 24.36% lower than that of the sequential spot welding.
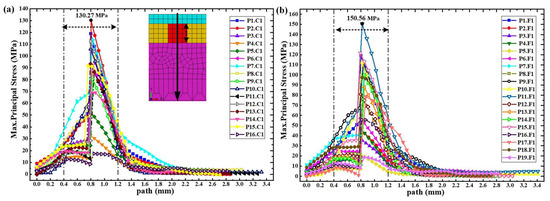
Figure 21.
Principal stress distribution in the direction of the vertical weld after welding under diagonal spot welding first and then side spot welding (no solder joints at the corners); (a) 16 points; (b) 19 points.
5. Conclusions
In this paper, the depth and width of the molten pool are measured experimentally, and the results are used to calibrate and validate the heat source model. Reasonable heat source parameters were obtained for finite element simulation and the numerical simulation of the welding process. Before welding, scattered spot-welding was performed to fix the weldment, which can avoid the dislocation between the cover plate and the shell of the silicon-aluminum alloy microwave device. The effects of different spot-welding sequences and numbers on the residual stress and cracking possibility of the laser-joined samples were analyzed. The conclusions are summarized as follows:
- (1)
- The residual stress along the welding direction after laser joining presents a stress peak at the spot-welding position. In the three sequential welding results of 16 and 19 points, the largest peaks are located near the corners. Under sequential spot welding, the stress peak value on the L3 was reduced after increasing the number of spot-weldings.
- (2)
- Compared with sequential spot welding, the stress peak value was slightly reduced under the side-by-side spot welding sequence. In the spot-welding sequence of C(F), the residual stress of the weldment decreases except for the value at the inflection point; however, the residual stress value at the inflection points increases.
- (3)
- After the spot-welding at the corner is removed in C1(F1), it is obvious that the residual stress at all spot-welding positions is lower than that of the other spot-welding sequences.
Author Contributions
Conceptualization, S.W., Y.D., Y.H. and F.Q.; methodology, S.W., G.S., L.Z., Y.D., Y.H. and F.Q; software, L.Z., Y.D.; validation, S.W., G.S., L.Z. and Y.D.; formal analysis, S.W., G.S., L.Z.; investigation, S.W., G.S., L.Z., Y.D., T.H., Y.H., P.C. and F.Q.; resources, Y.H. and F.Q.; data curation, S.W., G.S., L.Z., Y.D.; writing—original draft preparation, S.W., G.S., L.Z., Y.D.; writing—review and editing, S.W., L.Z., Y.D., Y.H. and F.Q; visualization, S.W., L.Z.; supervision, Y.H. and F.Q.; project administration, Y.D., Y.H. and F.Q; funding acquisition, Y.D., Y.H. and F.Q. All authors have read and agreed to the published version of the manuscript.
Funding
This research was funded by Cooperation Project between AIRCAS and BJUT.
Data Availability Statement
Data will be available on request.
Conflicts of Interest
The authors declare that they have no conflict of interest.
References
- Hou, J.C.; Li, R.F.; Xu, C.; Li, T.T.; Shi, Z.X. A comparative study on microstructure and properties of pulsed laser welding and continuous laser welding of Al-25Si-4Cu-Mg high silicon aluminum alloy. J. Manuf. Process. 2021, 68, 657–667. [Google Scholar] [CrossRef]
- Aversa, A.; Marchese, G.; Manfredi, D.; Lorusso, M.; Calignano, F.; Biamino, S.; Lombardi, M.; Fino, P.; Pavese, M. Laser powder bed fusion of a high strength Al-SiZn-Mg-Cu alloy. Metals 2018, 8, 300. [Google Scholar] [CrossRef]
- Kashaev, N.; Ventzke, V.; Çam, G. Prospects of laser beam welding and friction stir welding processes for aluminum airframe structural applications. J. Manuf. Process. 2018, 36, 571–600. [Google Scholar] [CrossRef]
- Zhang, P.; Jia, Z.; Yu, Z.; Shi, H.; Li, S.; Wu, D.; Yan, H.; Ye, X.; Chen, J.; Wang, F.; et al. A review on the effect of laser pulse shaping on the microstructure and hot cracking behavior in the welding of alloys. Opt. Laser Technol. 2021, 140, 107094. [Google Scholar] [CrossRef]
- Gu, X.; Cui, M.; Chen, J.; Sun, D.; Gu, X.; Liu, L. Laser welding of 6082 aluminum alloy to TC4 titanium alloy via pure niobium as a transition layer. J. Mater. Res. Technol. 2021, 13, 2202–2209. [Google Scholar] [CrossRef]
- Penzes, M.; Dudit, S.; Monsieur, F.; Silvestri, L.; Nallet, F.; Lewis, D.; Perdu, P. Simulation of the thermal stress induced by CW 1340 nm laser on 28 nm advanced technologies. Microelectron. Reliab. 2017, 76–77, 227–232. [Google Scholar] [CrossRef]
- Indhu, R.; Soundarapandian, S.; Vijayaraghavan, L. Yb: YAG laser welding of dual phase steel to aluminium alloy. J. Mater. Process. Technol. 2018, 262, 411–421. [Google Scholar]
- Deshayes, Y.; Bechou, L.; Delétage, J.Y.; Verdier, F.; Danto, Y.; Laffitte, D.; Goudard, J.L. Three-dimensional FEM simulations of thermomechanical stresses in 1.55 μm Laser modules. Microelectron. Reliab. 2003, 43, 1125–1136. [Google Scholar] [CrossRef]
- Wang, X.; Wang, H.P.; Lu, F.; Carlson, B.E.; Wu, Y. Analysis of solidification cracking susceptibility in side-by-side dual-beam laser welding of aluminum alloys. Int. J. Adv. Manuf. Technol. 2014, 73, 73–85. [Google Scholar] [CrossRef]
- Chen, J.; Wei, Y.; Zhan, X.; Li, Y.; Ou, W.; Zhang, T. Melt flow and thermal transfer during magnetically supported laser beam welding of thick aluminum alloy plates. J. Mater. Process. Technol. 2017, 254, 325–337. [Google Scholar] [CrossRef]
- Chen, J.; Wei, Y.; Zhan, X.; Gu, C.; Zhao, X. Thermoelectric currents and thermoelectric-magnetic effects in full-penetration laser beam welding of aluminum alloy with magnetic field support. Int. J. Heat Mass Transf. 2018, 127, 332–344. [Google Scholar] [CrossRef]
- Sonawane, A.; Roux, G.; Blandin, J.J.; Despres, A.; Martin, G. Cracking mechanism and its sensitivity to processing conditions during laser powder bed fusion of a structural aluminum alloy. Materialia 2021, 15, 100976. [Google Scholar] [CrossRef]
- Torkamany, M.J.; Sabbaghzadeh, J.; Hamedi, M.J. Effect of laser welding mode on the microstructure and mechanical performance of dissimilar laser spot welds between low carbon and austenitic stainless steels. Mater. Des. 2012, 34, 666–672. [Google Scholar] [CrossRef]
- Lei, Z.; Wu, S.; Cao, B.; Li, B.; Liang, J.; Hu, X.; Chen, Y. Role of thermal fluid dynamics in alloying element distribution and weld porosity in powder feeding-based laser welding of Al alloy. Appl. Therm. Eng. 2020, 171, 115081. [Google Scholar] [CrossRef]
- Prokhorov, N.N.; Gavrilyuk, M.N. Strain behavior of metals during solidification after welding. Svar. Proizv. 1971, 18, 5–9. [Google Scholar]
- Lin, P.-C.; Lin, S.-H.; Pan, J. Modeling of failure near spot welds in lap-shear specimens based on a plane stress rigid inclusion analysis. Eng. Fract. Mech. 2006, 73, 2229–2249. [Google Scholar] [CrossRef]
- Gatzen, M.; Tang, Z.; Vollertsen, F. Effect of electromagnetic Stirring on the Element Distribution in Laser Beam Welding of Aluminium with Filler Wire. Phys. Procedia 2011, 12, 56–65. [Google Scholar] [CrossRef]
- Yan, H.D.; Mei, Y.H.; Li, X.; Zhang, P.; Lu, G.Q. Degradation of high-power single emitter laser modules using nanosilver paste in continuous pulse conditions. Microelectron. Reliab. 2015, 55, 2532–2541. [Google Scholar] [CrossRef]
- Coniglio, N.; Patry, M. Measuring laser weldability of aluminum alloys using controlled restraint weldability test. Sci. Technol. Weld. Join. 2013, 18, 573–580. [Google Scholar] [CrossRef]
- Von Witzendorff, P.; Hermsdorf, J.; Kaierle, S.; Suttmann, O.; Overmeyer, L. Double pulse laser welding of 6082 aluminum alloys. Sci. Technol. Weld. Join. 2015, 20, 42–47. [Google Scholar] [CrossRef]
- Yin, J.; Cao, Y.; Cui, Y.; Lu, L.; Yan, Y.; Chen, J. Nd: YAG laser ablation of aluminum alloy 6061 before and after silicon dioxide coating. J. Alloy Compd. 2021, 877, 160329. [Google Scholar] [CrossRef]
- Wang, X.J.; Lu, F.G.; Wang, H.P.; Cui, H.C.; Tang, X.H.; Wu, Y.X. Experimental and numerical analysis of solidification cracking behaviour in fibre laser welding of 6013 aluminium alloy. Sci. Technol. Weld. Join. 2015, 20, 58–67. [Google Scholar] [CrossRef]
- Amirreza, K.; Armin, R.D. Effects of welding parameters and welding sequence on residual stress and distortion in Al6061-T6 aluminum alloy for T-shaped welded joint. Trans. Nonferrous Met. Soc. China 2020, 30, 76–89. [Google Scholar]
- Kadoi, K.; Fujinaga, A.; Yamamoto, M.; Shinozaki, K. The effect of welding conditions on solidification cracking susceptibility of type 310S stainless steel during laser welding using an in-situ observation technique. Weld. World 2013, 57, 383–390. [Google Scholar] [CrossRef]
- Bakir, N.; Gumenyuk, A.; Rethmeier, M. Numerical simulation of solidification crack formation during laser beam welding of austenitic stainless steels under external load. Weld. World 2016, 60, 1001–1008. [Google Scholar] [CrossRef]
- Zhang, Z.; Huang, Y.; Kasinathan, A.R.; Shahabad, S.I.; Ali, U.; Mahmoodkhani, Y.; Toyserkani, E. 3-dimensional heat transfer modeling for laser powder-bed fusion additive manufacturing with volumetric heat sources based on varied thermal conductivity and absorptivity. Opt. Laser Technol. 2019, 109, 297–312. [Google Scholar] [CrossRef]
- Shahabad, S.I.; Zhang, Z.; Keshavarzkermani, A.; Ali, U.; Mahmoodkhani, Y.; Esmaeilizadeh, R.; Bonakdar, A.; Toyserkani, E. Heat source model calibration for thermal analysis of laser powder-bed fusion. Int. J. Adv. Manuf. Technol. 2020, 106, 1–13. [Google Scholar] [CrossRef]
- Liu, Y.; Yu, Y.F.; Wang, P.; Fang, H.Y.; Ma, N. Analysis and mitigation of the bending deformation in girth-welded slender pipes with numerical modelling and experimental measurement. J. Manuf. Process. 2022, 78, 278–287. [Google Scholar] [CrossRef]
- Dai, P.Y.; Wang, Y.F.; Li, S.; Lu, S.J.; Feng, G.J.; Deng, D. FEM analysis of residual stress induced by repair welding in sus304 stainless steel pipe butt-welded joint. J. Manuf. Process. 2020, 58, 975–983. [Google Scholar] [CrossRef]
- Sattari-Far, I.; Farahani, M.R. Effect of the weld groove shape and pass number on residual stresses in butt-welded pipes. Int. J. Press. Vessel. Pip. 2009, 86, 723–731. [Google Scholar] [CrossRef]
- Ji, W.; Zhang, P.; Luo, K. Investigation of welding temperature field and residual stresses of corrugated steel web girders. Structures 2022, 44, 1416–1428. [Google Scholar] [CrossRef]
- Deng, D.; Murakawa, H. Prediction of welding distortion and residual stress in a thin plate butt-welded joint. Comput. Mater. Sci. 2008, 43, 353–365. [Google Scholar] [CrossRef]
- Deng, D.; Murakawa, H.; Shibahara, M. Investigations on welding distortion in an asymmetrical curved block by means of numerical simulation technology and experimental method. Comput. Mater. Sci. 2010, 48, 187–194. [Google Scholar] [CrossRef]
- Tian, S.; Chen, W.; Wu, Y.; Zhao, Y.; Zhan, X. The effect of temperature alternating load on residual stresses for Al-Li alloy T-joints welded by dual laser beam bilateral synchronous welding. Int. J. Adv. Manuf. Technol. 2020, 107, 1–13. [Google Scholar] [CrossRef]
- Kunwar, A.; Shang, S.; Råback, P.; Wang, Y.; Givernaud, J.; Chen, J.; Ma, H.; Song, X.; Zhao, N. Heat and mass transfer effects of laser soldering on growth behavior of interfacial intermetallic compounds in Sn/Cu and Sn-3.5Ag0.5/Cu joints. Microelectron. Reliab. 2018, 80, 55–67. [Google Scholar] [CrossRef]
- Gao, H.; Agarwal, G.; Amirthalingam, M.; Hermans, M.J.M.; Richardson, I.M. Investigation on hot cracking during laser welding by means of experimental and numerical methods. Weld. World: J. Int. Inst. Weld. 2018, 62, 71–78. [Google Scholar] [CrossRef]
- Gao, Z.G. Numerical modeling to understand liquation cracking propensity during laser and laser hybrid welding (I). Int. J. Adv. Manuf. Technol. 2012, 63, 291–303. [Google Scholar] [CrossRef]
Disclaimer/Publisher’s Note: The statements, opinions and data contained in all publications are solely those of the individual author(s) and contributor(s) and not of MDPI and/or the editor(s). MDPI and/or the editor(s) disclaim responsibility for any injury to people or property resulting from any ideas, methods, instructions or products referred to in the content. |
© 2023 by the authors. Licensee MDPI, Basel, Switzerland. This article is an open access article distributed under the terms and conditions of the Creative Commons Attribution (CC BY) license (https://creativecommons.org/licenses/by/4.0/).