Article

Simplified Approach to Characterize the Cooling Crystallization in a Modular Mini-Plant

Laboratory of Equipment Design, Department of Biochemical and Chemical Engineering, TU Dortmund University, Emil-Figge-Straße 68, 44227 Dortmund, Germany
*
Author to whom correspondence should be addressed.
Crystals 2023, 13(1), 147; https://doi.org/10.3390/cryst13010147
Submission received: 20 December 2022 / Revised: 31 December 2022 / Accepted: 11 January 2023 / Published: 14 January 2023
(This article belongs to the Section Industrial Crystallization)

Abstract

:
The characterization of new process equipment often includes tedious experiments, particularly for (cooling) crystallization. This can be cost-intensive and time-consuming when the actual equipment has to be continuously operated to gain new insights. For multi-purpose plants that frequently change the process substance system, this can be especially laborious. In order to accelerate the generation of characterization data for the quasi-continuous filter belt crystallizer (QCFBC), a Peltier-element-driven, simplified experimental benchtop setup is validated in this work using a sucrose/water model substance system. It was shown that the operation conditions during the cooling crystallization on the continuously operated plant can be appropriately emulated; therefore, an actual operation of the entire mini-plant for characterization experiments is no longer necessary.

1. Introduction

Crystallization is one of the main process steps in producing active pharmaceutical ingredients (APIs) and is part of more than 90% of production routes, either for purification or solely as a solid-formation step [1,2]. Concerning crystalline APIs, the process conditions during the solid formation—the crystallization—have a substantial influence on the properties of the final product [3,4], which justifies the extensive research in this process domain [3,5,6,7]. Due to this, a large variety of processes, concepts, and apparatuses have emerged, which recently experienced a paradigm shift toward modular, small-scale, and continuous plants and processes [3,4,8,9]. For various reasons, such as scalability, consistency, controllability, lower demand for manual work, and energy efficiency, continuous processes are on the rise, and technological maturity is advancing [4,8,10,11,12,13].
Unlike in the bulk crystallization industry, batch-wise production of crystalline goods is still preferred in the fine chemical and pharmaceutical industry [8,11,13]. Small production volumes and lack of readily available small-scale and continuous solutions for solids processing, such as crystallization and solid–liquid separation, especially the integration of both, are scarce [3]. Therefore, small-scale crystallization processes and respective equipment concepts are topics of current research, with a particular focus on tubular [4,14,15,16] and continuous stirred tank concepts [6,17]. Moreover, crystallization apparatus concepts, such as the Taylor Couette crystallizer [18,19] and oscillatory baffle crystallizer [20], are frequently investigated. Comprehensive reviews on continuous and small-scale crystallization can be found in [4,11,21]. Present challenges are the coupling of solid formation in suspension and the subsequent solid–liquid separation step, as well as the following washing and drying step necessary for the final product formation. Although recently discussed by Steenweg et al. [22] and [8,23,24,25], an integration of process steps to form an end-to-end system from solution to dry crystalline product is still only investigated in a small number of publications.
Hohmann et al. developed a production system in an industrial setting that integrated tubular continuous cooling crystallization with a subsequent belt filter for solid–liquid separation [15]. The characterization and possible connection strategies of a novel continuous filtration carousel, developed by Alconbury Weston Ltd. (Stoke on Trent, England), (CFC) to continuous crystallization apparatuses have been investigated by Acevedo et al., Liu et al., Domokos et al., and Nagy et al. [23,24,26,27]. Another related approach is the continuous rotary plate filter (CRPF) that can be used for continuous solid–liquid separation and washing [28]. Recently, the CRPF was integrated into an end-to-end production process with a preceding reactive crystallization step [5,29]. Further processing such as washing and drying is treated in even fewer numbers. Steenweg et al. were able to connect a tubular crystallization apparatus to a novel continuous vacuum screw filter (CVSF) [30]. The CVSF in particular is capable of solid–liquid separation, washing, and drying. A final free-flowing crystalline product with residual moisture of down to 1% could be continuously obtained [22].
The advances in continuous processing go hand in hand with those of modular equipment and concepts. Frequently changing needs and requirements demand for flexible and even multi-purpose production [31,32]. The quasi-continuous filter belt crystallizer (QCFBC) used to generate the data presented in this contribution has been described by Dobler et al., while the cooling crystallization step has been thoroughly characterized by Höving et al. [33,34]. In this concept, the process steps cooling crystallization, filtration, washing, and drying are integrated into a single plant via flexible and interchangeable functional modules. These allow for the production of a dry product filter cake starting with a product solution on a single plant.
The cooling crystallization is not only a highly complex step of the previously discussed process, but it also influences all subsequent unit operations and, therefore, has high impact on the final product’s properties. Consequently, a lot of research effort has to be invested to identify suitable crystallization conditions for a substance system and the respective process of interest.
For highly integrated apparatuses with unit operations that are coupled to a great extent, as for the apparatus discussed here, the investigation of the individual process steps can be complicated. In this contribution, a method is presented that enables crystallization characterization studies with the help of a benchtop construction equipped with Peltier elements instead of the complete plant. Using the model sucrose/water substance system, it is hypothesized that the single module of the benchtop setup can substitute the four temperature modules of the QCFBC used for the cooling crystallization in terms of characterization experiments. In particular, the resulting temperature profile of the suspension during the cooling crystallization process should be in an adequately conforming range together with the quality attributes, such as particle size distribution (PSD) and yield.
With this approach, the operational effort of the apparatus can be substantially decreased, while the process development is accelerated at the same time.
The investigated apparatus (cf. Figure 1) has been characterized in [34] with regard to the cooling crystallization using continuous temperature profiles. The concept of the plant is the production of crystalline product in a “quasi-continuous” manner starting with product solution. Thus, the unit operation crystallization, solid–liquid separation, and drying are combined on a single plant. Using several process medium container and modules on the plant, benefits from continuous and batch processing are united. The modules that cover the mentioned unit operations are positioned below the filter belt and can be flexibly interchanged due to the same footprint. Further, the number of modules can be custom tailored to individual needs to further increase flexibility.
As mentioned above, the cooling crystallization step has the most crucial impact on the product crystals and, additionally, requires the most process design effort of the covered unit operations. In order to decrease the development time for the operation strategy of a novel substance system on the plant, a new functionally reduced benchtop setup has been created. In this setup, the operator can focus on the cooling crystallization instead of having to operate the full downstream process. It is proposed that using the benchtop setup with a single temperature module (cf. Figure 1b) instead of four (cf. Figure 1a) yields the same product crystal properties.

2. Materials and Methods

This chapter introduces both cooling crystallizer setups, the lab-scale plant, and the setup with a single container (benchtop setup). Modifications of the plant are covered shortly with regard to the presented setup in [34]. Differences are highlighted between the used experimental conditions of the devices. The model sucrose/water substance system is introduced, and the analytical strategies are presented.

2.1. Substance System

As a model substance system, sucrose (Südzucker AG, Mannheim, Germany) dissolved in deionized water (<10 µS· cm 1 ) was selected in order to stay consistent with the investigations from [34] and [33]. For calculations of the solubility line, the correlation from Vavrinecz [35] was used:
w * [ g s u c c g s o l ] = 64.47 + 8.222 · 10 2 · T + 1.617 · 10 3 · T 2 1.558 · 10 6 · T 3 4.63 · 10 8 · T 4 , T [ 20 ; 70 ] in C
This correlation was already successfully employed by Löbnitz [36], Dobler et al. [33], and Sonnenschein et al. [37] with good correlations to experimental results. The viscosity of the saturated sucrose solution is highly temperature-dependent and ranges between 91.4 mPa·s at T * = 60 °C and 207.8 mPa·s at T * = 20 °C in the discussed application. An empiric correlation can be found in [38]. The sucrose solution, saturated at 60 °C, was freshly prepared, stirred overnight, and kept at 10 K above the desired temperature. The solution was temperature-controlled (ministat 125, Huber Kältemaschinenbau AG, Offenburg, Germany) in a 1 L, double-jacketed, and stirred glass tank.
The experiments were seeded with manually pestled seed crystals from the sieve fraction 63 µm–90 µm (TestSieve Retsch, RETSCH GmbH, Haan, Germany). For the seed crystal mass, 0.025 g·g E C M 1 was used with the excess crystal mass ( E C M ) calculated with the mass of the mother liquor m ML , the water content x aq , the initial loading X s , start , and the final loading in thermodynamic equilibrium X s , end eq . according to:
E C M = ( X s , start X s , end eq . ) · m ML · x aq ,
The seed crystal mass was therefore calculated to be m SC = 0.564 g for each of the batch experiments.

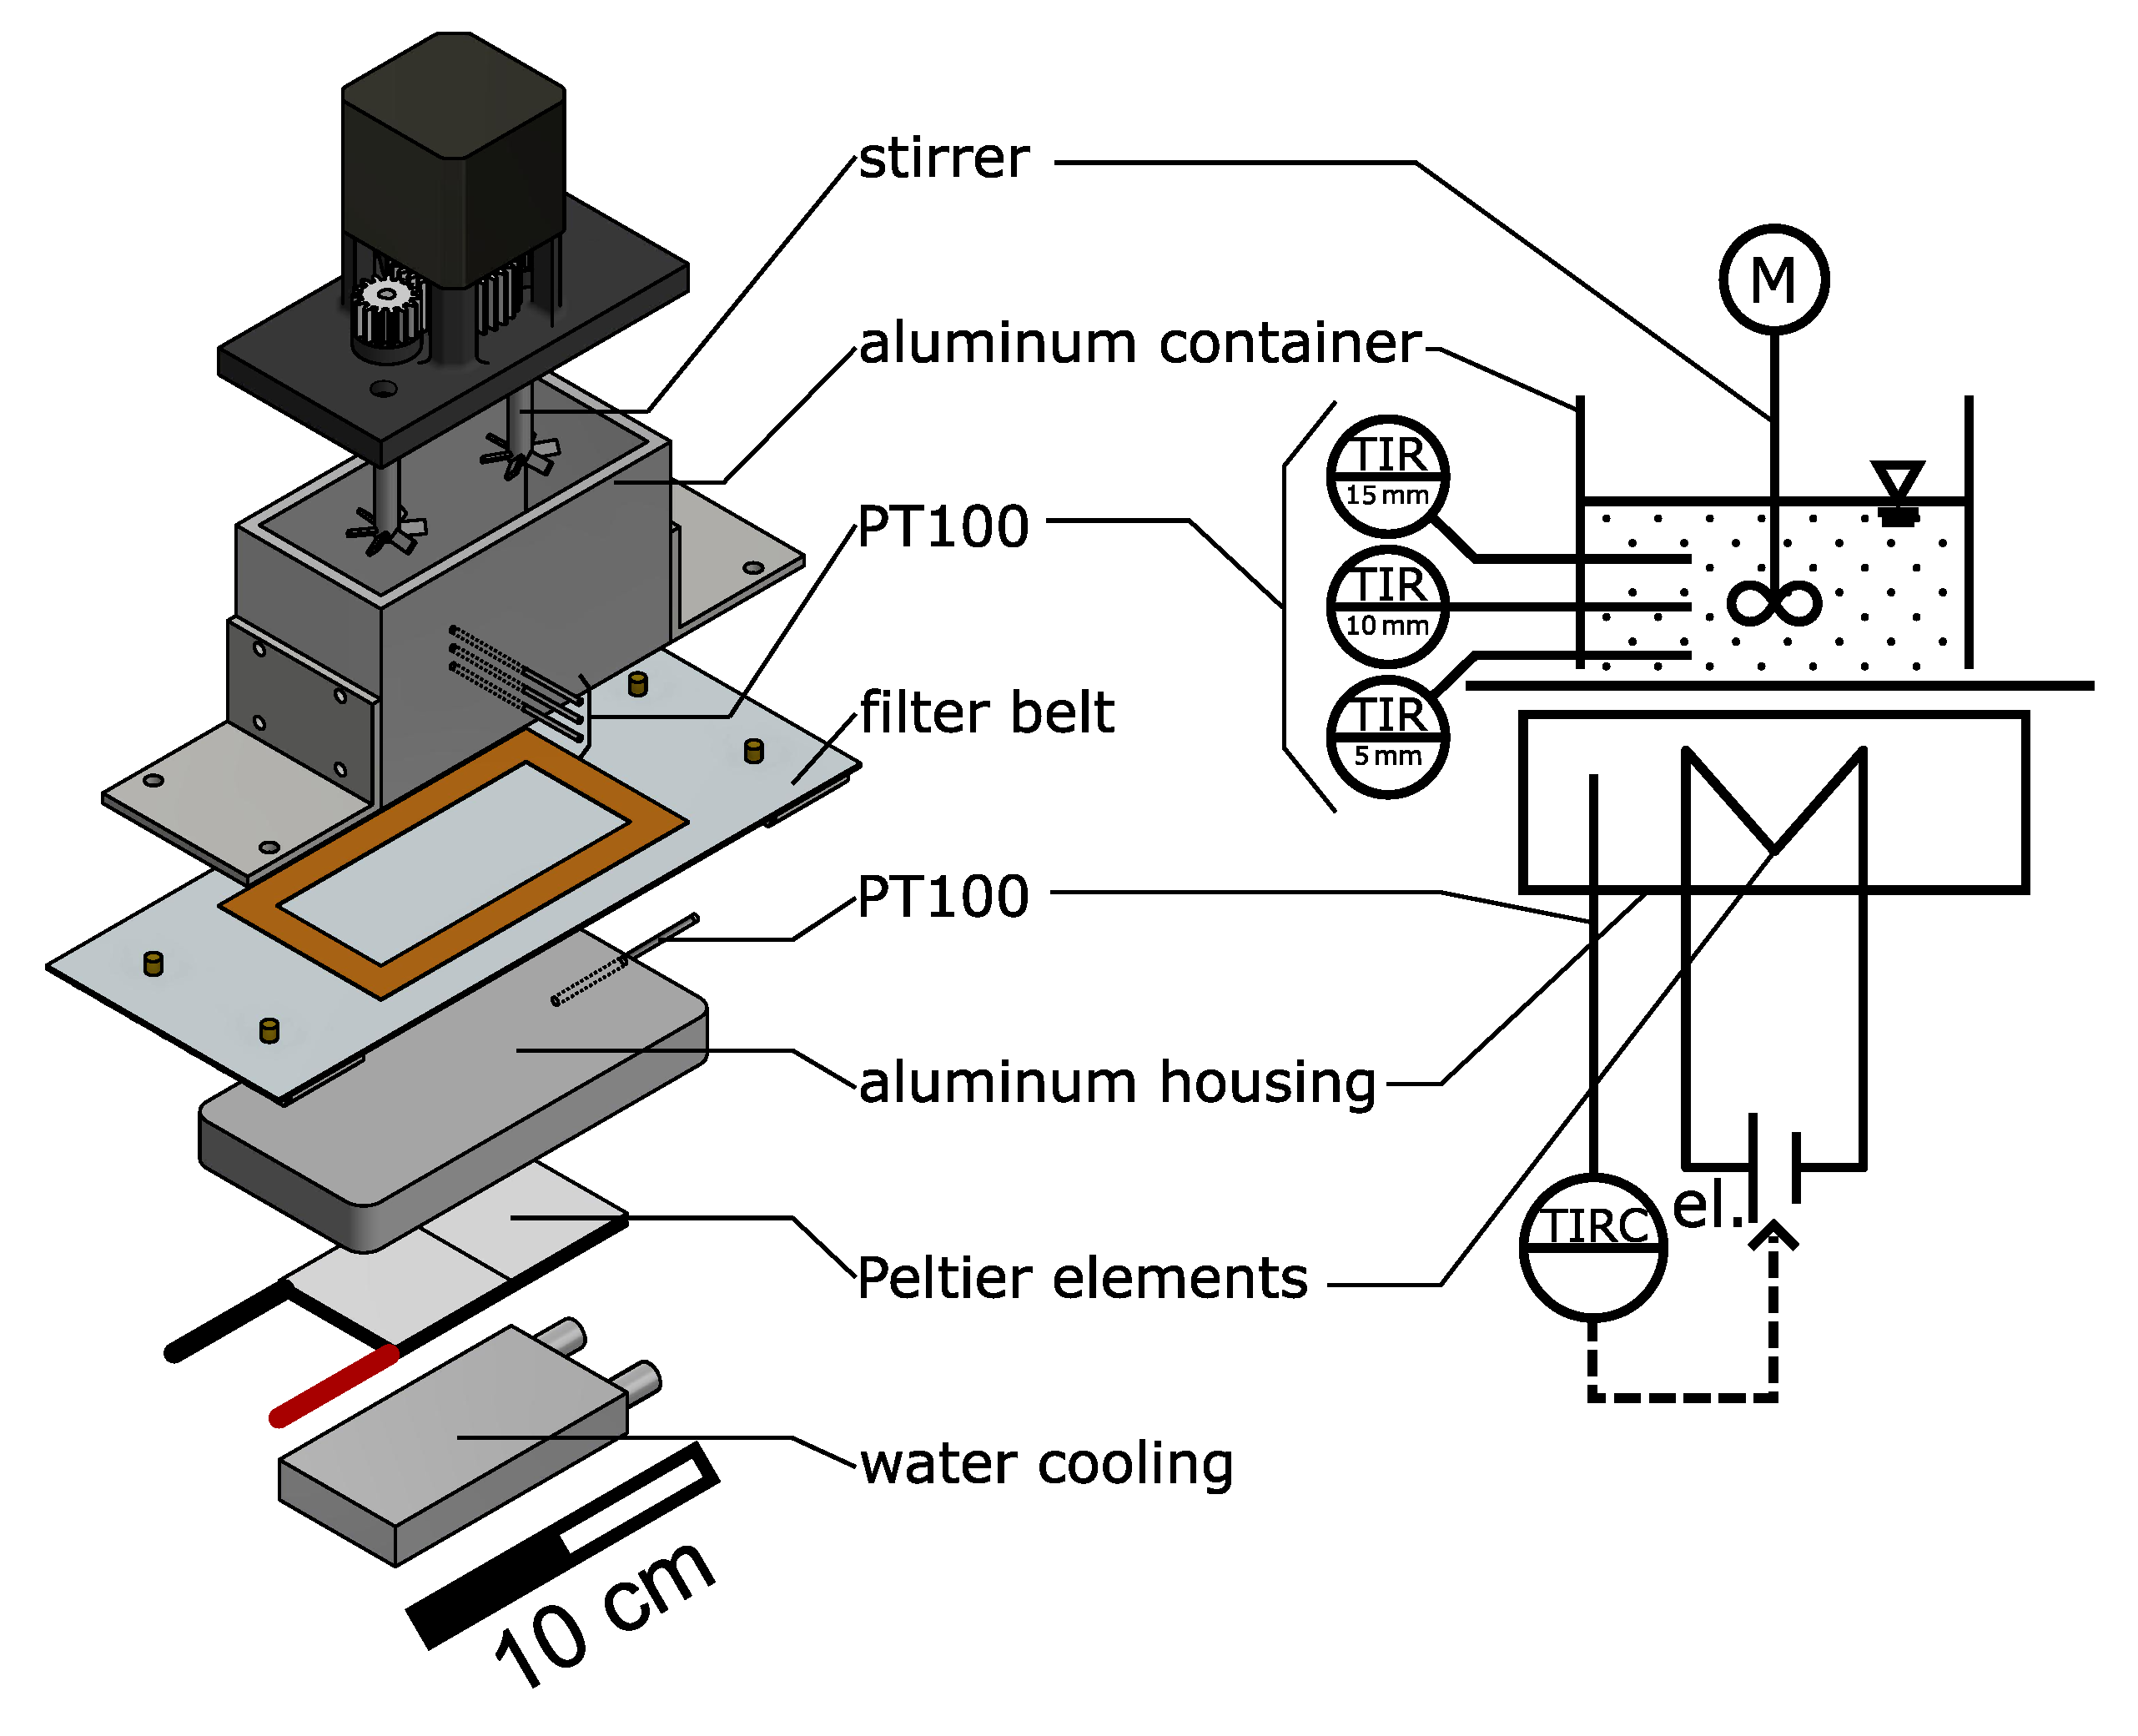
2.2. Process Container

The process container that was used can be seen in Figure 2. It was made from an extruded aluminum rectangular tube. The outer dimensions are 100 mm × 50 mm with a wall thickness of 4 mm. It directly fits onto the sealing (orange rectangle in Figure 2) (orange rubber liquid, mibenco GmbH, Karlstein am Main, Germany) that was applied to the filter material (SEFAR TETEX® MONO 07-76-SK 022, Sefar AG, Heiden, Switzerland). The container is equipped with a 3D-printed lid that integrates transmission gears (3D-printed), a motor (Nema 17, Nanotec Electronics GmbH & Co KG, Wertheim, Germany), and two stirrers that reach into the process medium. The stirrers (6 blades, pitch blade stirrer, 45°, 19 mm outer diameter, 6 mm shaft) are also 3D-printed and covered with liquid rubber to smooth out any roughness caused by the printing. The stirrers are designed and installed according to DIN 28131 [39] for a round stirred vessel with an inner diameter of D equi . = 56.42 mm, which was calculated from the equivalent area of a 50 mm × 50 mm square. Additionally, a second lid was designed equivalent to the one before but without stirrers to conduct experiments without stirring the suspension. Three temperature sensors (Pt-B-100-2, Rössel Messtechnik GmbH, Dresden, Germany) are introduced from one of the long sides into the container, positioned directly in the middle looking at it from the top, at 5 mm, 10 mm, and 15 mm above the filter medium to measure the temperature at three different heights. Each of the three sensors reaches 27.5 mm into the container so that the active sensor length (10 mm tip, where the Pt-wire is located) is in the center. All temperature sensors were individually calibrated using an ice bath made from deionized water (<10 µS· cm 1 ). The calibration for each of the sensors was stored in the process automation system. Additional solid formation at the sensors was not observed during all of the experiments. The filter medium and container are positioned on top of the temperature module, also made from aluminum, that holds the Peltier elements or heating mats, as described in [33]. Here, a temperature sensor (Pt-B-100-1, Rössel Messtechnik GmbH, Dresden, Germany) is also integrated to control and monitor the temperature of the module (see Figure 2).
The stirrer ( d stir . = 19 mm) was operated at N = 600 rpm, resulting in a stirrer Reynolds number between R e stir . , T * = 20 C = 27.29 and R e stir . , T * = 60 C = 62.01, which highly depends on the temperature due to viscosity η and density ρ of the sucrose solution:
R e stir . = N · d stir . · ρ η

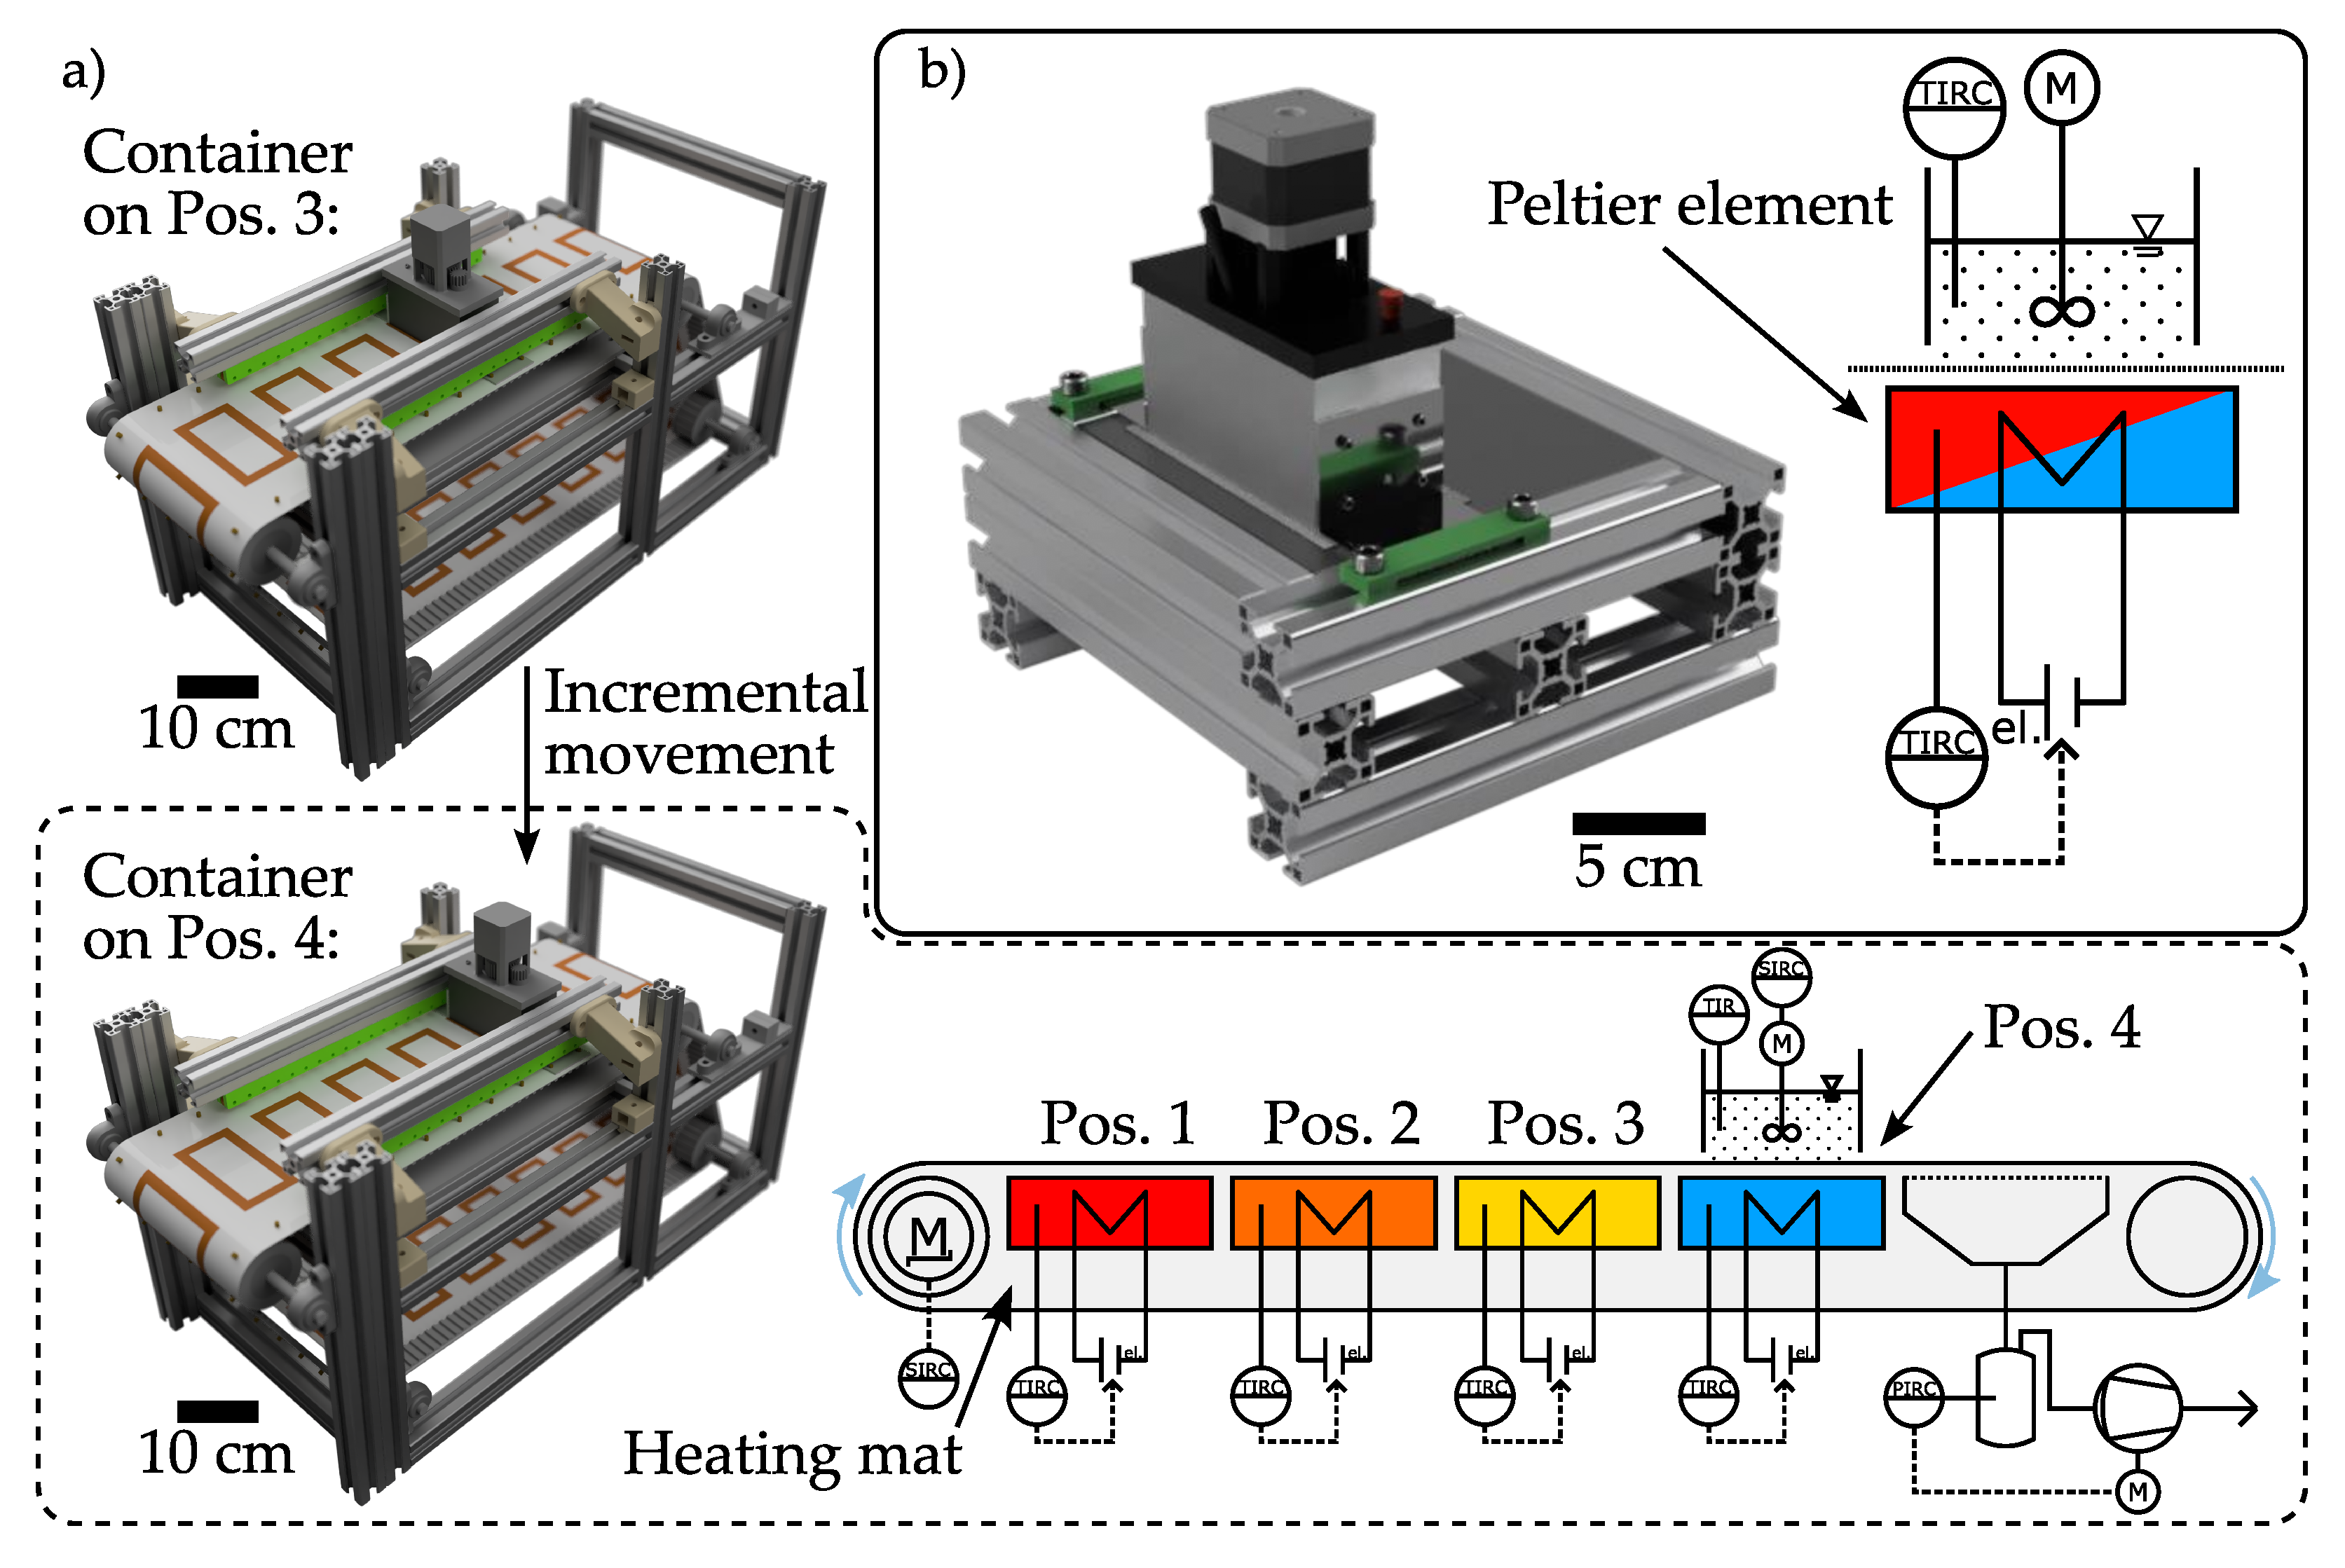
2.3. Quasi-Continuous Filter Belt Crystallizer: Mini-Plant

The working principle of the lab-scale apparatus can be found in one of our previous publications [34]. Slight modifications have been carried out on the device to resemble the original operation principle described by Dobler et al. [33] and Löbnitz [36]. As seen in Figure 1a, the first three temperature modules under Pos. 1 to Pos. 3 are operated by heating mats (40 mm × 80 mm, Thermo TECH, Rohrbach, Germany). Only the temperature module under Pos. 4 is operated by a Peltier element (40 mm × 40 mm × 4 mm, TEC1 127 05, Thermonamic Electronics Corp., Ltd., Nanchang, China) in a cooling mode to reach 20 °C, which is below room temperature (RT) and therefore cannot be reached by supplying heat. Subsequently, an operation mode with constant temperatures at each of the modules was selected [33]. This means that during the crystallization process, the temperature of the modules below the containers is PID-controlled instead of controlling the suspension temperature, as described in [34]. Automation of the plant was realized with the lab automation system LabManager® with the corresponding software LabVision® (HiTec Zang GmbH, Herzogenrath, Germany). The process container moves incrementally forward, transported by the motor-driven filter belt, every 5 min or 20 min ( t c ) across the temperature modules. The crystallization process time t cryst . (= 4 · t c ) is therefore either 20 min or 80 min. The last module on the plant is a filtration module that is connected to a vacuum pump (PC3001 VARIO pro , VACUUBRAND GmbH & Co KG, Wertheim, Germany) in order to separate the product crystals from the mother liquor.

2.4. Simplified Benchtop Setup

The benchtop setup is a reduced construction derived from the original one (see Figure 1a vs. Figure 1b). All relevant dimensions and components, such as container size, module size, stirrer, temperature sensors, and filter stayed the same. Resorting to the modular principle of the apparatus, only the number of modules was reduced to a single temperature and filtration module. The process container is not moved by the filter belt anymore but has to be moved by hand, reducing automation effort and increasing manual labor. A piece of the filter of the same material with the necessary size (12 cm × 7 cm) was used instead of a full filter belt. The temperature control is managed by an Arduino Uno microcomputer (Arduino S.r.l., Monza, Italy) instead of the LabManager®.
The difference in highest relevance is the operation of the temperature module solely by Peltier elements instead of heating mats in order to actively supply and withdraw heat. The Arduino has an individual PID-controller installed for the heating and cooling mode via controller gain scheduling. This is necessary due to the change in the action of the controller between heating and cooling.
The working principles and their differences regarding the temperature control outcome can be seen in Figure 3. The dotted line shows the target temperature of the modules. The black line shows the temperature measured inside of the individual modules that the process container was positioned on, and the blue and red lines show the temperature of the stirred suspension. For demonstration purposes, a cycle time of t c = 5 min was selected. In Figure 3a, showing the temperature profile on the mini-plant, each of the temperature steps represents a new module. In Figure 3b, the temperature profile of the benchtop setups is plotted. Here, the container does not move, and the target temperature of the module is reached by utilizing the heating and cooling modes of the Peltier element. Red and blue colorization of the background represents each of the modes, respectively.
Information on the controller hardware, the Arduino program, the wiring diagram, and additional information on the benchtop setup can be found in the supporting information in Figures S1–S6.

2.5. Experimental Procedure

As mentioned before, sucrose solution, saturated at 60 °C, was prepared the day before the experiments and held 5 K above the saturation temperature overnight. Right before the experiments, the necessary volume of 77.28 mL (corresponds to 20 mm filling level) was introduced to the container, and the temperature of the suspension was controlled to stay at 59 °C on a preliminary temperature module for 10 min with the stirrers turned on. This slight supersaturation was set to prevent the dissolution of the seed crystals. After the manual addition of m SC = 0.564 g of the selected seed crystal sieve fraction, the suspension was mixed for another 60 s. The cooling crystallization process was then started on either of the setups. In addition to varying the experimental setup, the cycle time t c has also been investigated on two different levels, namely 5 min and 20 min. Additionally, since in previous works both modes—unstirred [33] and stirred [34]—have been used during crystallization, this effect has also been investigated.
During the crystallization experiments, samples of 2 mL have been drawn from the suspension with a 1 mL single-use pipette (VWR International, Radnor, PA, USA) to analyze for the PSD and the yield. For the stirred experiments, three samples have been taken, one right at the start of the experiments, one at 2 · t c , and one at the end of the crystallization process at 4 · t c . To not disturb the suspension during the unstirred crystallization experiments, here, samples were only taken at t = 0 and 4 · t c . At 4 · t c , the suspension was stirred for 60 s before sampling.
After crystallization, the process container with the cooled suspension is moved to the filtration module, by hand for the benchtop setup and automatically for the mini-plant. Here, a pressure of 650 mbar was applied, and the suspension was separated from the solid product for 20 min for all experimental settings. The filter cake was separated from the filter medium and placed in a vacuum oven (Memmert VO400, Memmert GmbH & Co. KG, Schwabach, Germany) at 60 °C and 200 mbar to dry. The drying process was considered complete as soon as the weight of the cake did not change more than 0.001 g over the time span of 3 days, but not before 14 days.
All shown data-points stem from quadruple experiments that have been randomly executed.

2.6. Analytics

The previously mentioned samples have been analyzed for their volumetric PSD of the containing crystals. In order to do so, the LUMi Reader® PSA453 (LUM GmbH, Berlin, Germany) that uses a sedimentation method was used. According to the filtration and washing method from [34], the samples were treated in order to wash away the remaining mother liquor, and the remainder was suspended in ethanol for easier analysis and preservation purposes. The created suspension is then analyzed for the PSD via the modified method from [34] originating from [40].
As described before, the filtration step on the two setups separates the mother liquor from the filter cake. The filtrate and mother liquor samples were collected in Petri dishes to be weighted directly after the experiment and in a dry state (XA 205 Dual Range, Mettler Toledo, Columbus, OH, USA). From the dry and wet masses of the filtrate samples, the loading can be calculated using
X i = m succ . m water = m dish , dry m dish , empty m dish , wet m dish , dry ,
to be further used to calculate the relative yield:
Y filtrate , rel . = m ML · x aq . · ( X start X end ) E C M · 100 %
As a second method, the yield can also be calculated via the masses of the filter cake. Firstly, one can calculate the mass of sucrose that was still dissolved and remained inside the filter cake m FC , ML using the mass of the water that evaporated m evap . in the drying oven:
m FC , ML = m evap . · X end
With the mass of the dried filter cake, the mass of the sucrose that remained in the mother liquor, and the mass of the seed crystals, the mass of the product crystals can be calculated according to:
m prod . = m FC m SC m FC , ML
Finally, from the calculated masses and the E C M the relative yield, Y rel . can be calculated according to
Y FC , rel . = m prod . E C M · 100 %
Therefore, the yield of the crystallization process was calculated via two different methods. Standard deviations were calculated from quadruple experiments.

3. Results and Discussion

The next chapter discusses the results of the comparison between the two setups. The resulting temperature profile during the cooling crystallization, the relative yield, and the PSDs are considered. It should be noted that the color code is consistent throughout the chapter. Yellow is for stirred experiments and blue for unstirred experiments. Different shades of blue represent the temperatures measured at the three different heights. Grey/black represents the mini-plant experiments and red the experiments on the benchtop setup.

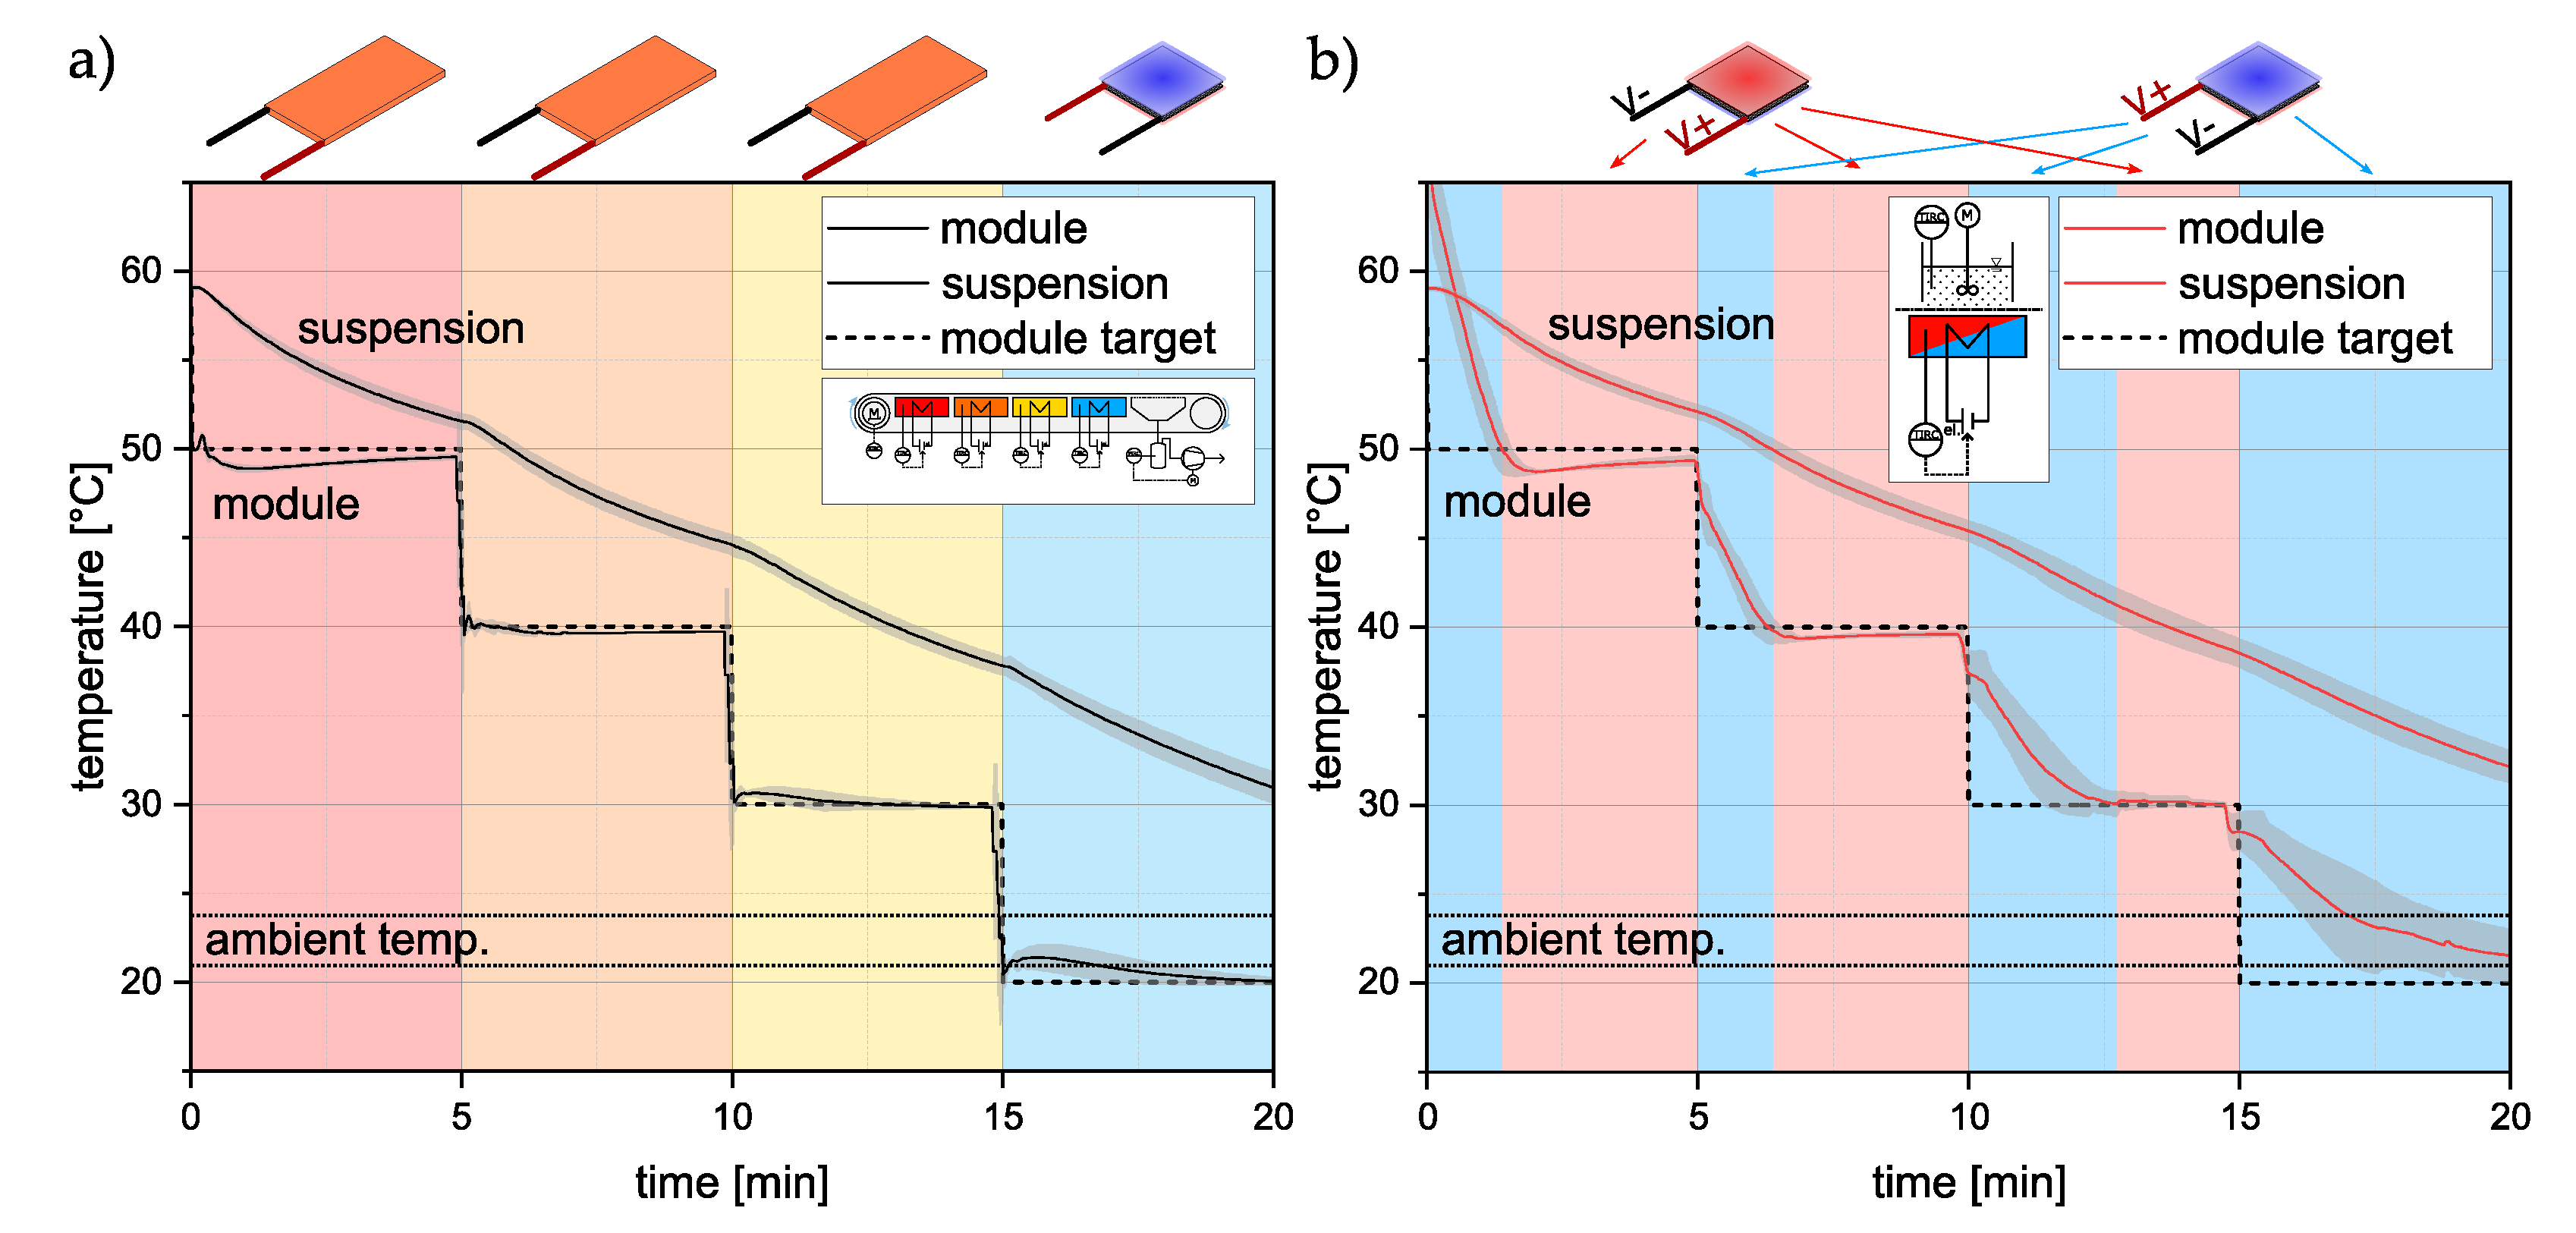
3.1. Temperature Profiles

Looking at the cooling crystallization processes, the temperature profile during the crystallization is one of the most crucial manipulators to be considered. The saturation state of the system, and, therefore, crystal growth and nucleation, largely depend on it. Therefore, when reproducing an experimental setting for cooling crystallization, one has to ensure that the temperature curves are as similar as possible.
In the following, the temperature profiles of the experiments will be discussed. According to the previously mentioned varied experimental settings, the resulting diagrams are plotted in Figure 4. It is divided between stirred and unstirred experiments as well as t c = 5 min and t c = 20 min. The dotted lines are the constant target temperatures for each of the modules proposed by [33] and, therefore, a step function with −10 K steps every t c starting at 50 °C and finishing at 20 °C. Looking at Figure 4a,b, the temperature resembles a classical controller step response even with undershoots for the first two steps. The target module temperature is hardly met due to the thermal inertia of the temperature module and, therefore, also the process medium. For a longer process time, as shown in Figure 4c,d, this effect is still observable, but less strong. On the one hand, with an increased t c , the timescale becomes different; on the other hand, the temperature difference at the change in temperature levels is smaller. This is due to heat losses of the suspension to the environment, which additionally decreases the time the controller needs to meet the target temperature. For the experiments on the mini-plant, where the process container is actually physically moved from one temperature module to another, the target module temperature is well met since the subsequent module was already set to the desired temperature. The time period of 8 s needed to transport the container from one module to the next is neglected.
Looking at the stirred experiments ((a) and (c)), it becomes apparent that using a longer t c enables for better reproduction of the suspension temperature on the mini-plant with the benchtop setup. The same holds for ((b) and (d)). As for the difference in the module temperatures between the stirred and unstirred operation modes, there is no significant deviation to be seen (comparing (a) to (b) and (c) to (d).
When coming to the temperature profiles of the suspensions, several things are striking. For both setups, the suspension temperatures resulting from t c = 20 min are substantially lower than for the experiments where t c = 20 min. The longer residence time of the suspension on each of the modules causes the temperature to decrease to a lower level. For the stirred experiments, this causes a total temperature difference after the crystallization of about 8.5 K. For the unstirred experiments, this is even more distinct. Here, the three temperature profiles measured at 5 mm, 10 mm, and 15 mm can be seen in Figure 4b,d. Higher temperatures of the suspension correspond to a higher position in the suspension, except for at the beginning for t c = 5 min and around the changes in modules for t c = 20 min. Heat conduction strongly depends on the path that needs to be traveled, which causes the suspension to cool down faster, where the temperature module is closest and causes the different temperature levels. The temperature of the stirred systems is always lower compared to the three temperatures of the corresponding unstirred system. Due to the energy input by the stirrers, the heat convection is increased causing the system to decrease to a lower temperature than the unstirred system, assuming that the temperature function of the suspension depending on the height is constant for every xy-plane.
For the crystallization, the crystal growth process in particular, the temperature of the suspension is of high relevance. Therefore, the benchtop setup needs to be able to reproduce the temperatures of the mini-plant as accurately as possible to serve the intended purpose. The suspension temperatures of both apparatuses can already be seen in Figure 4; however, to gain further insights, the respective temperatures were plotted against each other, which is shown in Figure 5. Against common consensus, the ordinate and abscissa have decreasing temperature values from left to right and bottom to top, respectively. This makes the interpretation of the diagrams more intuitive since they can be read as common parity plots, where the optimal outcome would be the bisectrix x = y . Guidelines that mark a deviation of ±1 K are added to increase clarity.
As before, the recorded temperatures are plotted in the diagrams with different shades of blue as the background. From the linear equation shown at the bottom right of each of the diagrams in Figure 5a–h, the deviation from the ideal case with x = y can be seen. Here, the slope is 1, and the intercept is 0. In general, the agreement of the temperatures is high. The ±1 K guidelines are cut only once by the stirred case with t c = 5 min (Figure 5g). Local deviations are especially prominent right after the change in the temperature module, i.e., the change in the temperature level. This stems from the differences in the module temperatures right after each t c caused by the limited cooling rate of the Peltier elements.
To be able to compare the different operation modes, the average errors of the temperature profiles generated on the benchtop setup with regards to the profiles on the actual mini-plant have been plotted in Figure 6. Here, one can see that the highest deviation occurs for the stirred experiments, where the environmental influence is expected to be the greatest. Since the temperature sensors are positioned exactly in the middle of the container, the environmental influence is less prominent. Small fluctuations from the temperature module due to the controller have the highest influence on the temperatures measured closer to the bottom of the vessel, which can also be seen in Figure 6. The relatively high standard deviation of the here-presented data is due to the fact that an error between benchtop and mini-plant is computed, resulting in low errors with (relatively) high standard deviations. Overall, the deviations shown in Figure 5 and Figure 6 are in a reasonable range to assume equivalent operation.
As mentioned, the suspension temperature is one of the most important parameters for the cooling crystallization. It influences the supersaturation and, therefore, influences critical quality attributes of the crystalline product, such as the crystal size and the CSD. Further, the yield of the process is substantially influenced. Therefore, it is necessary to reproduce the temperatures on the mini-plant, which is sufficiently shown in Figure 5.

3.2. Product Properties

Critical product and process properties in cooling crystallization are the product crystal size distribution and the relative yield. High yields increase the process efficiency and large product crystals with a narrow CSD simplify subsequent unit operations. Therefore, both are investigated in the following. Microscopic images of the crystals can be found in the supporting information Figure S7.

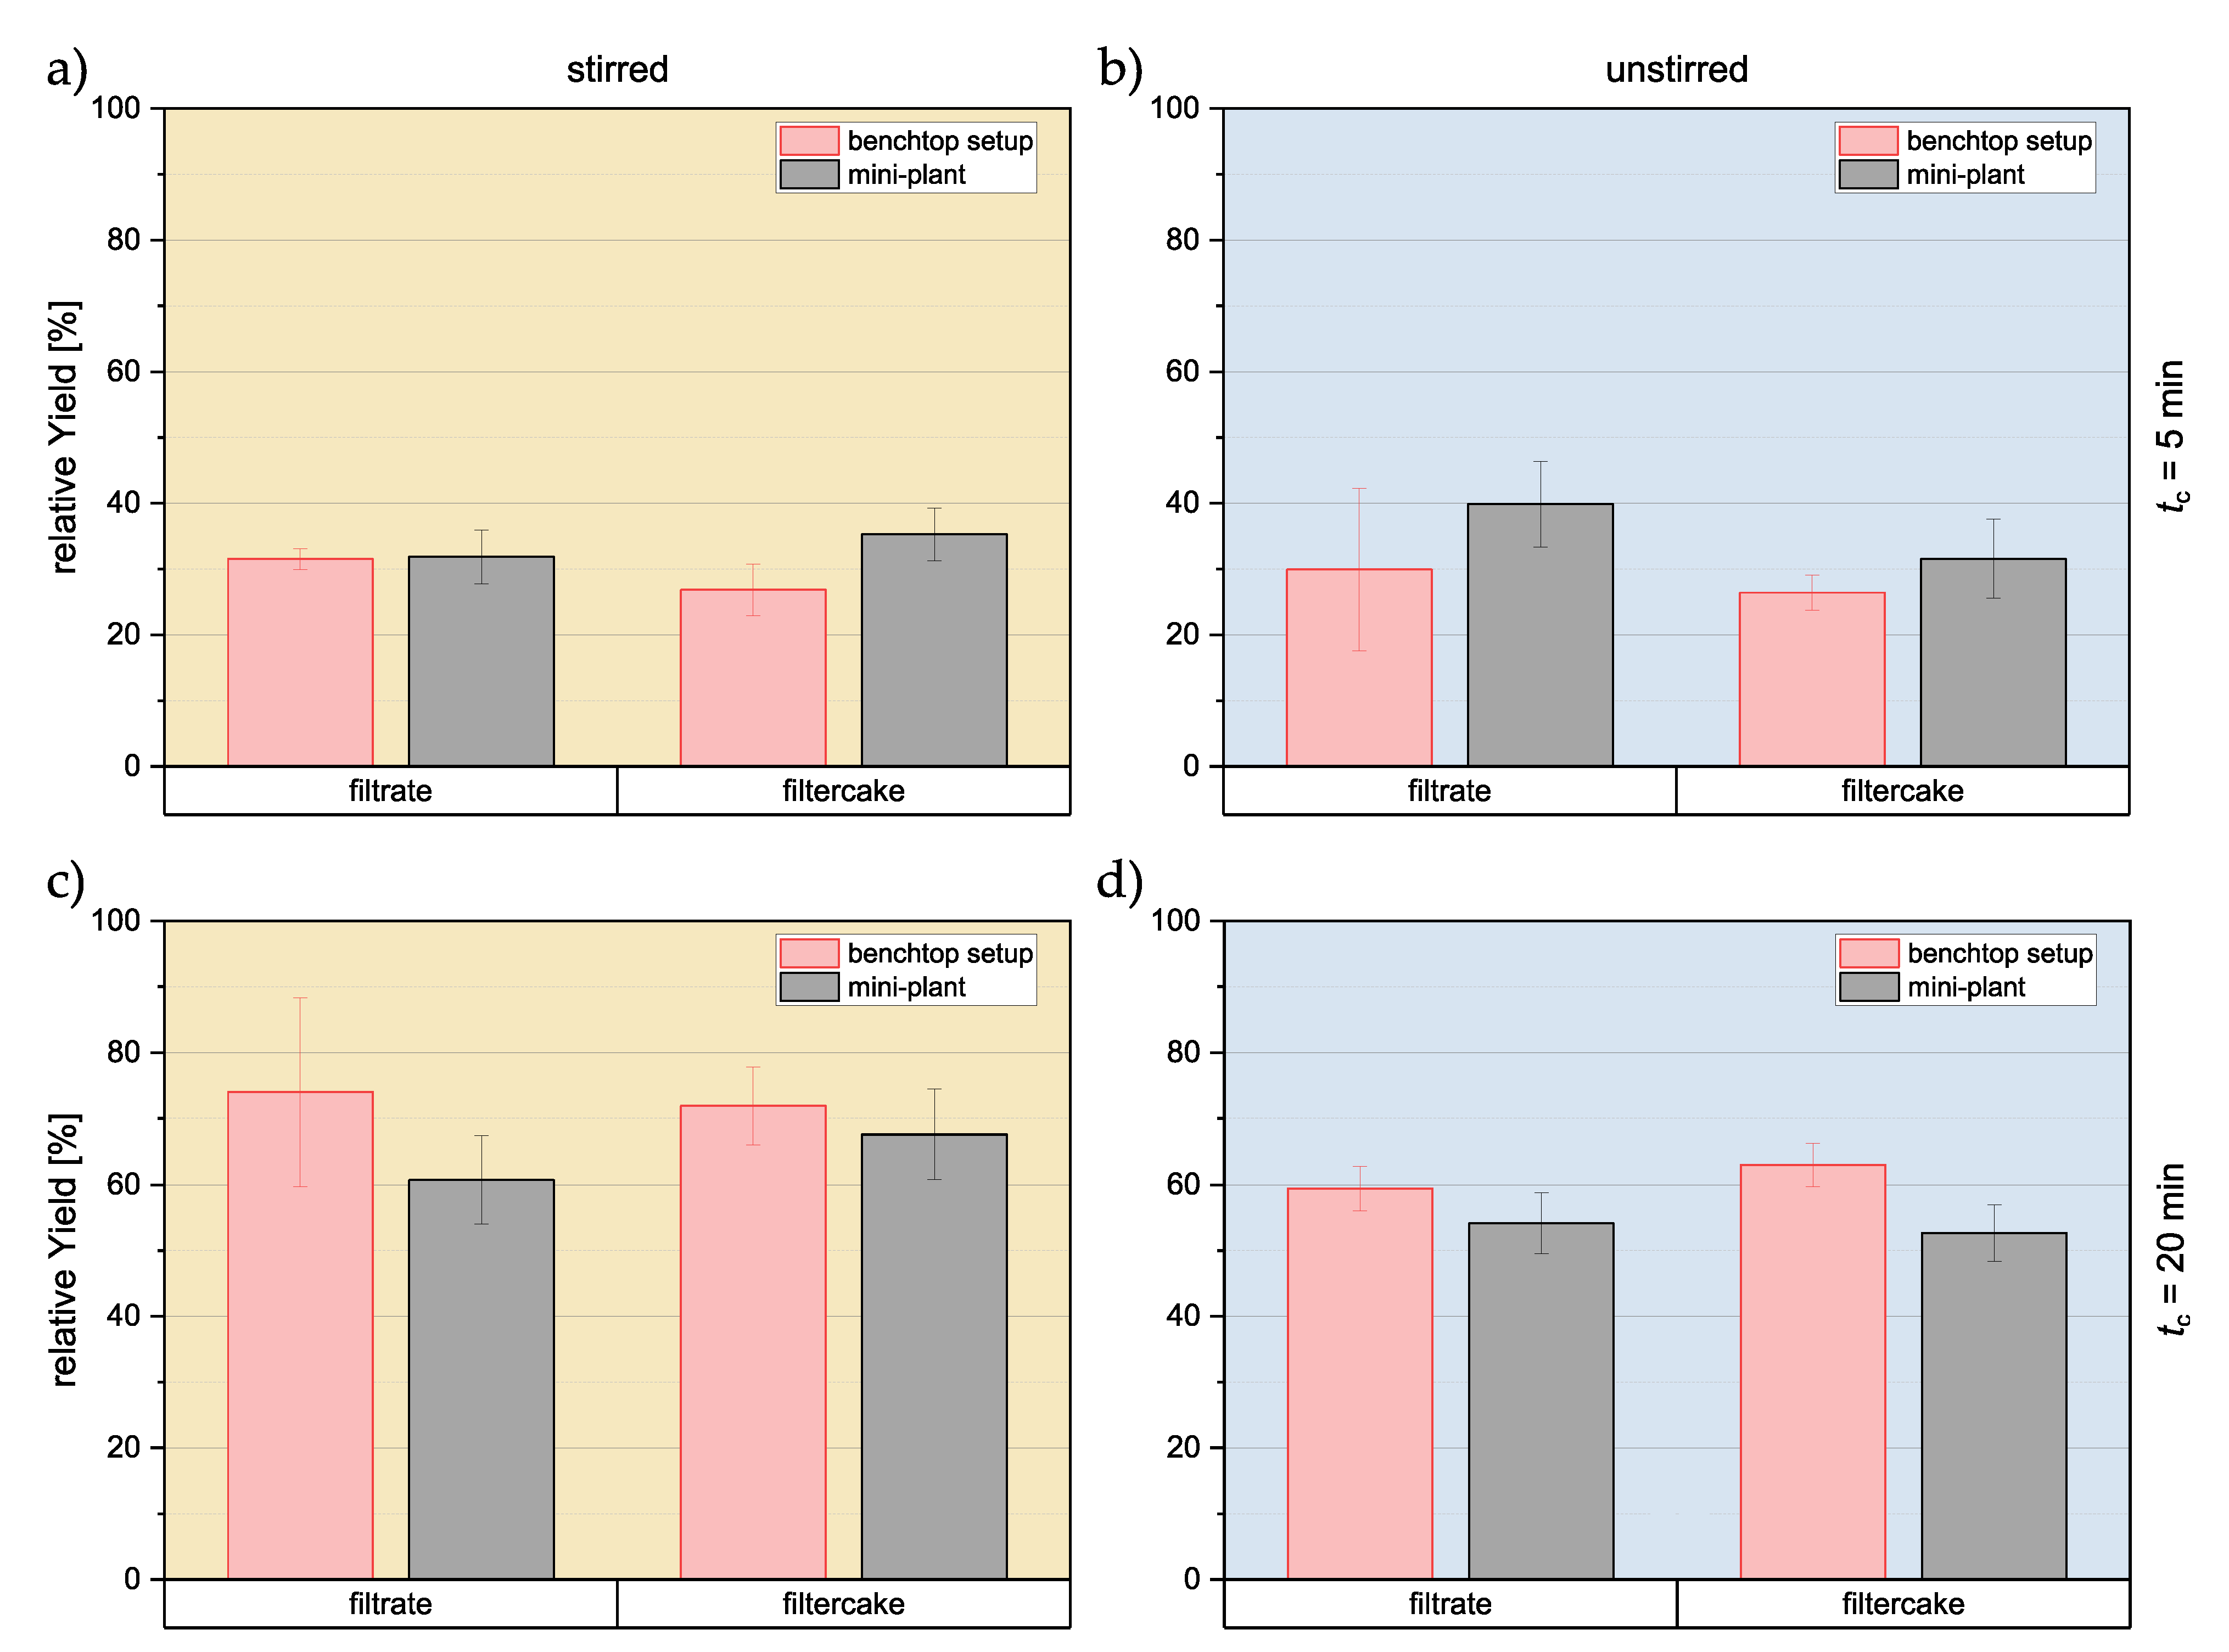
3.2.1. Relative Yield

Product crystal size, their size distribution, and the yield are part of the most important product and process properties. Therefore, they are also considered in this contribution. As described before, there were two different methods applied to determine the yield, one using the filter cake, the other one using the concentration of the mother liquor after the crystallization process. The results can be seen in Figure 7. Again, the color code holds for stirred, unstirred, and benchtop or mini-plant. The standard deviations for each of the individual experimental setting lay within expected fluctuations from manual execution and analysis.
As expected, a longer overall process time with longer t c leads to increased relative yields. On the one hand, the final temperature reaches lower levels for t c = 20 min; on the other hand, the system has more time to reach a thermodynamic equilibrium and reduce the supersaturation. A difference in stirred and unstirred experiments cannot be clearly observed for t c = 5 min, whereas the stirring increases the relative yield for the longer experiments from 57% ± 3.9% to 68% ± 8.4%. The high viscosity of the model substance system causes the crystals to stay in the suspension rather than sinking to the bottom for a relatively long time. A single (spherical) crystal with a diameter of 100 µm in a saturated sucrose solution at 60 °C would have a sinking velocity of 0.736 mm·min 1 according to [41] and Stokes’ equation:
ν sink = ρ d ρ c 18 · η · g · D 2 ,
with the density ρ i of the disperse and the continuous phase, the viscosity of the continuous phase η , the particle diameter D, and the gravity constant g. The effect of the agitation of the suspension becomes more relevant the longer the experiments last, which explains the observed behavior. According to the calculation before, in the experimental setting with t c = 20 min, a large number of the crystals from the suspension have been sedimented. This reduces the mass transfer from the solution to the crystal surface and consequently reduces the relative yield.
Furthermore, agitation of the process medium leads to overall lower temperatures of the suspension (comp. Figure 4c,d) and therefore an increased supersaturation to overcome increasing the driving force towards solid material buildup.
For all the conducted experiments, the yield of both measurements methods, using filter cake and filtrate, respectively, leads to almost the same results. Within the experiments with the same settings, the results are within each other’s standard deviation, and no striking deviation can be observed.

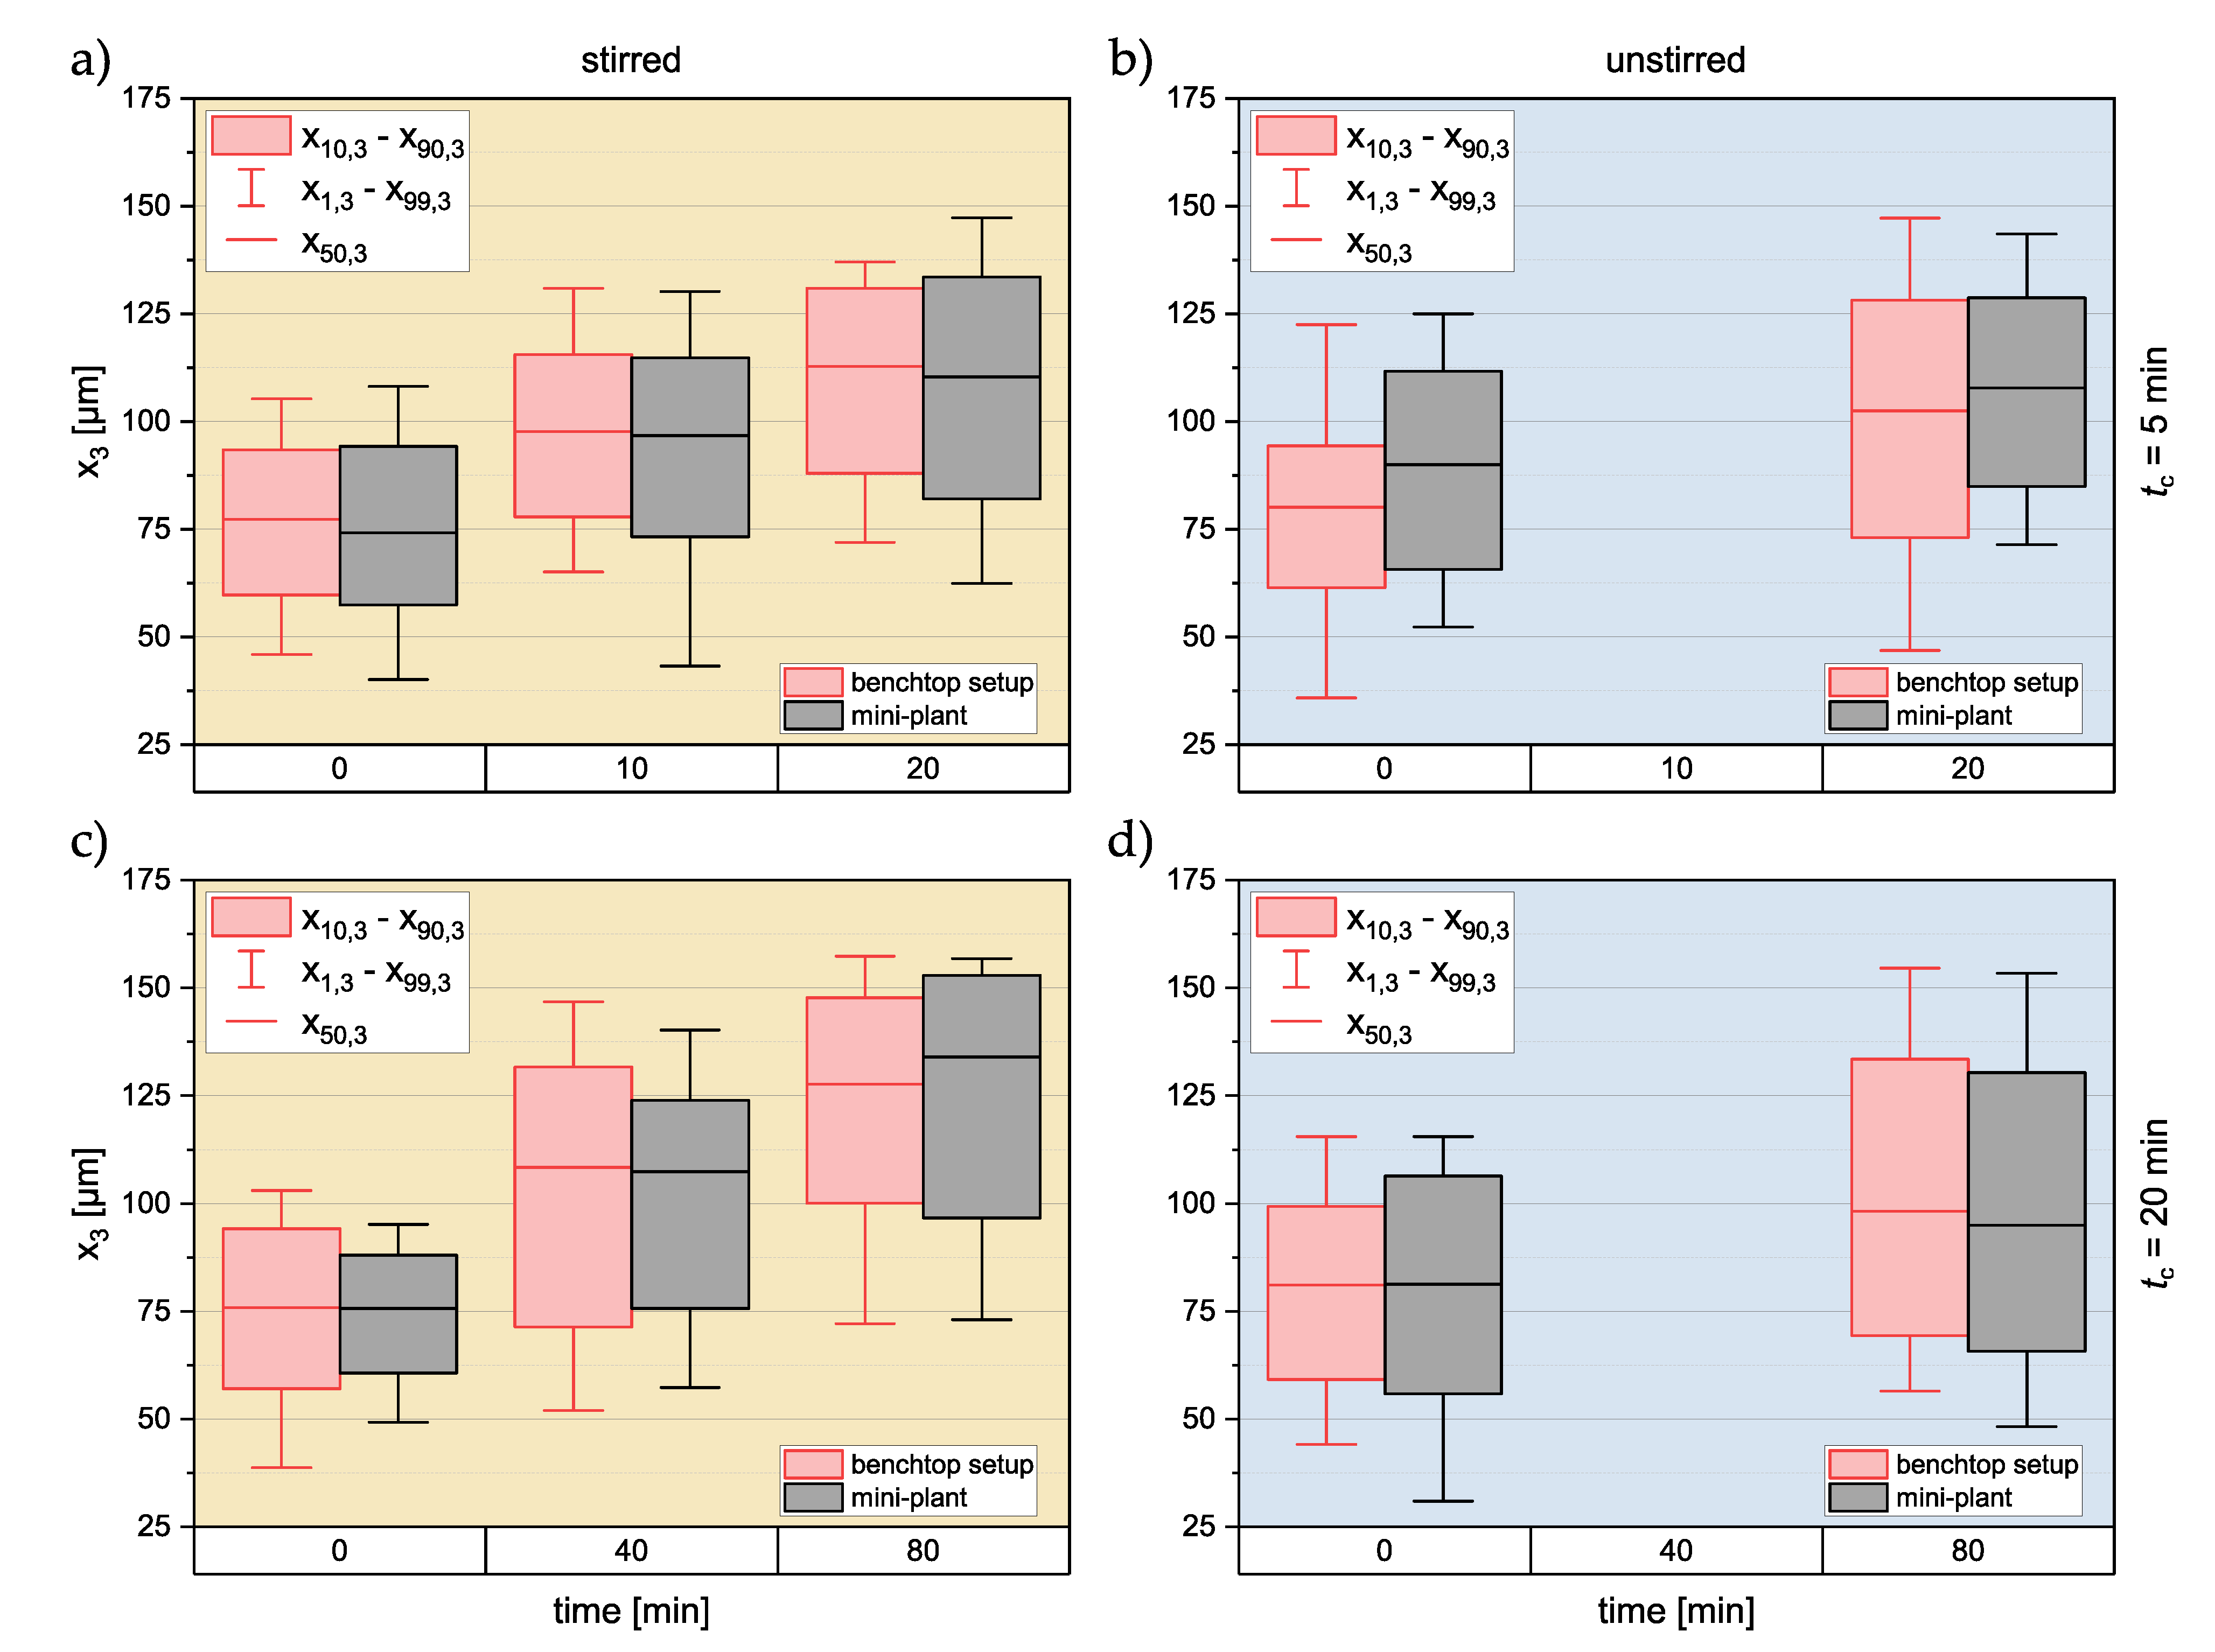
3.2.2. Crystal Size Distribution

The CSDs during the different experimental settings have been investigated, and boxplots set up accordingly can be found in Figure 8. Again, the color code holds. For the stirred experiments, three samples have been taken during the process. For the unstirred experiments, a sample was only taken at the beginning and at the end. On the one hand, it cannot be assured that a reproducible sample is taken due to the unstirred system; on the other hand, taking the sample itself might disturb the suspension in an hardly predictable manner.
For all of the experiments, one can clearly see that the seeded crystals are growing throughout the process. At 0 min, the diagrams show the seed crystals’ distribution from the samples taken from the suspension container immediately after they were mixed. The determined distributions fit to the sieve crystal fraction of 63 µm–90 µm. For the stirred experiments, the crystals grow to larger product crystals. Furthermore, the CSD broadens along the process time for t c = 20 min in Figure 8a and t c = 5 min in Figure 8b, as is common for linear temperature profiles in cooling crystallization. For t c = 20 min, the product crystals are larger than for t c = 5 min with x 50 , 3 = 127.58 µm ± 16.10 µm (benchtop) and x 50 , 3 = 133.85 µm ± 18.89 µm (mini-plant). This can clearly be explained by the longer process time as it has already been observed for the yields before.
With a comparable yield, the stirred and unstirred experiments with t c = 5 min in Figure 8a,b also yield comparable results regarding the crystal sizes. As discussed before, the short process time does not leave enough time for the most crystals to sediment before the experiment was finished. Therefore, the crystal growth was less inhibited since mass transport to the crystals in suspension was still possible. In contrast to these are the results that have been made for the unstirred suspension where t c = 20 min. The distributions here are the widest recorded, and the x 50 , 3 is even smaller than the ones observed for t c = 20 min. Here, the process time was long enough for a large number of crystals to sediment to the bottom of the container. Mass transfer from the solution to the sedimented crystals is inhibited, and the supersaturation of the system is decreased by spontaneous nucleation.
Although the distributions achieved on the mini-plant (grey) and the benchtop setup (red) are slightly deviating, when comparing both setups (see Figure 8), there is no significant trend observable. As the relative yield and deviations can only be observed in the module temperature, which is due to the different experimental setups, it is assumed that both setups yield the same results for the same settings regarding the product properties.

3.3. Quasi-Continuous Operation and Processing

To our knowledge, the operation principle of the continuous plant, as it has been presented previously [34] and by Dobler et al. [33], is unique and has not been described in the literature before. Regarding the cooling crystallization step, the resulting temperature profile in each of the process containers depends on the constant temperature levels of the temperature modules. The number of temperature modules and the residence time on each of the modules t c is of equal importance for the temperature profile. In this contribution, only a fraction of these parameters have been investigated. Additionally, it should not be forgotten that for the subsequent process steps, namely, solid–liquid separation, drying, and filter cake washing, the same t c needs to be considered. Here, filter cake and product properties such as residual moisture can be manipulated. For a complete process layout, the parameters of all subsequent unit operations need to be considered instead of focusing on the cooling crystallization.
As indicated before, the processing on the quasi-continuous plant aims toward crystalline products in the pharmaceutical and fine chemical industry. The substances of interest need to be water-soluble and a cooling crystallization as a purification or isolation step needs to be feasible. Water as solvent is only important due to non-existing EX requirements. Other solvents can be used in smaller amounts with a sufficient venting system and air exchange rates. As of now, the substances that have been successfully crystallized besides sucrose/water are scarce. Ascorbic acid/water was additionally investigated by Sonnenschein et al. in terms of a modeling approach with a few validation experiments [37]. Currently, other organic acids are under investigation.
This contribution supports overcoming this backlog and paving the way for faster process development since each substance system has to be looked at individually.

4. Conclusions and Outlook

As the cooling crystallization on the quasi-continuous filter belt crystallizer has been described and characterized in [33,34,37], the cooling crystallization was found to be the most complex of the subsequent and integrated process steps. Therefore, especially when new substance systems are introduced to the plant, most investigation capacities are directed towards the crystallization step. Additionally, as the first step on the integrated plant, it influences the subsequent unit operations, such as filtration and drying. Hence, a benchtop setup, using the modularized equipment and a temperature module equipped with Peltier elements, was built to reduce operational effort. Instead of having to operate the automated mini-plant subsequent unit operations, the cooling crystallization can be investigated individually. The movement of parts such as the filter belt and the process container does not have to be managed anymore since the benchtop setup is static but still representative of the steps on the filter belt. Overall, the complexity of the plant and the necessary operational effort was reduced, and faster characterization studies were enabled.
To validate the functionality of the benchtop setup, it was benchmarked against the existing and previously characterized mini-plant with the model sucrose/water substance system. With regards to relative yield, product size distribution, and suspension temperature profiles, the benchtop setup has good agreement with the results achieved on the mini-plant. Solely, the module temperature is slightly deviating due to the use of Peltier elements with no observable impact on the crystallization itself.
Future work will be directed towards investigating new substance systems on the benchtop setups to later transfer them to the mini-plant, resulting in less operational and investigative effort, while achieving the same results as if the mini-plant was operated.

Supplementary Materials

The following supporting information can be downloaded at: https://www.mdpi.com/article/10.3390/cryst13010147/s1.

Author Contributions

Conceptualization, S.H.; methodology, S.H.; software, S.H., P.B. and P.S.; formal analysis, S.H. and P.B.; investigation, S.H. and P.B.; data curation, S.H.; writing—original draft preparation, S.H.; writing—review and editing, S.H. and N.K.; visualization, S.H.; supervision, S.H. and N.K.; project administration, N.K.; funding acquisition, N.K. All authors have read and agreed to the published version of the manuscript.

Funding

This research was funded by the German Federal Ministry of Economic Affairs and Climate Action (BMWK) and the Project Management Jülich (PtJ) as part of the ENPRO2.0 initiative (Ref. no. 03ET1652F).

Institutional Review Board Statement

Not applicable.

Informed Consent Statement

Not applicable.

Data Availability Statement

Not applicable.

Acknowledgments

The authors would like to thank Carsten Schrömges for technical support and Mira Schmalenberg for detailed discussion.

Conflicts of Interest

The authors declare no conflict of interest.

Abbreviations

The following abbreviations are used in this manuscript:
APIActive Pharmaceutical Ingredient
CSDCrystal Size Distribution
CVSFContinuous Vacuum Screw Filter
E C M Excess Crystal Mass
EXExplosion Protection
η Dynamic Viscosity [kg·(m·s) 1 ]
D i Diameter [m]
gGravity Constant [m·s 2 ]
m i Mass [kg]
MSMPRMixed Suspension Mixed Product Removal
ρ Density [kg·m 3 ]
w * [kg·kg 1 ]
QCFBCQuasi Continuous Filter Belt Crystallizer
TTemperatur [°C]
T * Saturation Temperature [°C]
t c Cycle Time [min]
x aq Water Content [kg·kg 1 ]
x i crystal diameter [µm]
Y i Yield [%]

References

  1. Mersmann, A. Crystallization Technology Handbook; Marcel Dekker Inc.: Hoboken, NJ, USA, 2001. [Google Scholar]
  2. Wong, S.Y.; Tatusko, A.P.; Trout, B.L.; Myerson, A.S. Development of Continuous Crystallization Processes Using a Single-Stage Mixed-Suspension, Mixed-Product Removal Crystallizer with Recycle. Cryst. Growth Des. 2012, 12, 5701–5707. [Google Scholar] [CrossRef]
  3. Cote, A.; Erdemir, D.; Girard, K.P.; Green, D.A.; Lovette, M.A.; Sirota, E.; Nere, N.K. Perspectives on the Current State, Challenges, and Opportunities in Pharmaceutical Crystallization Process Development. Cryst. Growth Des. 2020, 20, 7568–7581. [Google Scholar] [CrossRef]
  4. Orehek, J.; Teslić, D.; Likozar, B. Continuous Crystallization Processes in Pharmaceutical Manufacturing: A Review. Org. Process. Res. Dev. 2021, 25, 16–42. [Google Scholar] [CrossRef]
  5. Testa, C.J.; Shvedova, K.; Hu, C.; Wu, W.; Born, S.C.; Takizawa, B.; Mascia, S. Heterogeneous Crystallization as a Process Intensification Technology in an Integrated Continuous Manufacturing Process for Pharmaceuticals. Org. Process. Res. Dev. 2021, 25, 225–238. [Google Scholar] [CrossRef]
  6. Wood, B.; Girard, K.P.; Polster, C.S.; Croker, D.M. Progress to Date in the Design and Operation of Continuous Crystallization Processes for Pharmaceutical Applications. Org. Process. Res. Dev. 2019, 23, 122–144. [Google Scholar] [CrossRef]
  7. Zhang, D.; Xu, S.; Du, S.; Wang, J.; Gong, J. Progress of Pharmaceutical Continuous Crystallization. Engineering 2017, 3, 354–364. [Google Scholar] [CrossRef]
  8. Domokos, A.; Nagy, B.; Szilágyi, B.; Marosi, G.; Nagy, Z.K. Integrated Continuous Pharmaceutical Technologies—A Review. Org. Process. Res. Dev. 2021, 25, 721–739. [Google Scholar] [CrossRef]
  9. Eren, A.; Civati, F.; Ma, W.; Gamekkanda, J.C.; Myerson, A.S. Continuous crystallization and its potential use in drug substance Manufacture: A review. J. Cryst. Growth 2023, 601, 126958. [Google Scholar] [CrossRef]
  10. Chen, J.; Sarma, B.; Evans, J.M.B.; Myerson, A.S. Pharmaceutical Crystallization. Cryst. Growth Des. 2011, 11, 887–895. [Google Scholar] [CrossRef] [Green Version]
  11. Hofmann, G. Kristallisation in der Industriellen Praxis, 1st ed.; Wiley-VCH: Weinheim, Germany, 2004. [Google Scholar]
  12. Lee, S.L.; O’Connor, T.F.; Yang, X.; Cruz, C.N.; Chatterjee, S.; Madurawe, R.D.; Moore, C.M.V.; Yu, L.X.; Woodcock, J. Modernizing Pharmaceutical Manufacturing: From Batch to Continuous Production. J. Pharm. Innov. 2015, 10, 191–199. [Google Scholar] [CrossRef]
  13. Myerson, A.S. Handbook of Industrial Crystallization, 2nd ed.; Butterworth-Heinemann: Boston, MA, USA, 2002. [Google Scholar]
  14. Schmalenberg, M.; Kreis, S.; Weick, L.K.; Haas, C.; Sallamon, F.; Kockmann, N. Continuous Cooling Crystallization in a Coiled Flow Inverter Crystallizer Technology—Design, Characterization, and Hurdles. Processes 2021, 9, 1537. [Google Scholar] [CrossRef]
  15. Hohmann, L.; Löbnitz, L.; Menke, C.; Santhirakumaran, B.; Stier, P.; Stenger, F.; Dufour, F.; Wiese, G.; zur Horst-Meyer, S.; Kusserow, B.; et al. Continuous Downstream Processing of Amino Acids in a Modular Miniplant. Chem. Eng. Technol. 2018, 41, 1152–1164. [Google Scholar] [CrossRef]
  16. Besenhard, M.O.; Neugebauer, P.; Scheibelhofer, O.; Khinast, J.G. Crystal Engineering in Continuous Plug-Flow Crystallizers. Cryst. Growth Des. 2017, 17, 6432–6444. [Google Scholar] [CrossRef] [PubMed]
  17. Lührmann, M.C.; Timmermann, J.; Schembecker, G.; Wohlgemuth, K. Enhanced Product Quality Control through Separation of Crystallization Phenomena in a Four-Stage MSMPR Cascade. Cryst. Growth Des. 2018, 18, 7323–7334. [Google Scholar] [CrossRef]
  18. Nguyen, A.T.; Kim, J.M.; Chang, S.M.; Kim, W.S. Taylor Vortex Effect on Phase Transformation of Guanosine 5-Monophosphate in Drowning-Out Crystallization. Ind. Eng. Chem. Res. 2010, 49, 4865–4872. [Google Scholar] [CrossRef]
  19. Kim, J.E.; Kim, W.S. Synthesis of Core–Shell Particles of Nickel–Manganese–Cobalt Hydroxides in a Continuous Couette-Taylor Crystallizer. Cryst. Growth Des. 2017, 17, 3677–3686. [Google Scholar] [CrossRef]
  20. Briggs, N.E.B.; Schacht, U.; Raval, V.; McGlone, T.; Sefcik, J.; Florence, A.J. Seeded Crystallization of β-l-Glutamic Acid in a Continuous Oscillatory Baffled Crystallizer. Org. Process. Res. Dev. 2015, 19, 1903–1911. [Google Scholar] [CrossRef] [Green Version]
  21. Wang, T.; Lu, H.; Wang, J.; Xiao, Y.; Zhou, Y.; Bao, Y.; Hao, H. Recent progress of continuous crystallization. J. Ind. Eng. Chem. 2017, 54, 14–29. [Google Scholar] [CrossRef]
  22. Steenweg, C.; Kufner, A.C.; Habicht, J.; Wohlgemuth, K. Towards Continuous Primary Manufacturing Processes—Particle Design through Combined Crystallization and Particle Isolation. Processes 2021, 9, 2187. [Google Scholar] [CrossRef]
  23. Acevedo, D.; Peña, R.; Yang, Y.; Barton, A.; Firth, P.; Nagy, Z.K. Evaluation of mixed suspension mixed product removal crystallization processes coupled with a continuous filtration system. Chem. Eng. Process. Process. Intensif. 2016, 108, 212–219. [Google Scholar] [CrossRef]
  24. Liu, Y.C.; Domokos, A.; Coleman, S.; Firth, P.; Nagy, Z.K. Development of Continuous Filtration in a Novel Continuous Filtration Carousel Integrated with Continuous Crystallization. Org. Process. Res. Dev. 2019, 23, 2655–2665. [Google Scholar] [CrossRef]
  25. Ottoboni, S.; Price, C.J.; Steven, C.; Meehan, E.; Barton, A.; Firth, P.; Mitchell, A.; Tahir, F. Development of a Novel Continuous Filtration Unit for Pharmaceutical Process Development and Manufacturing. J. Pharm. Sci. 2019, 108, 372–381. [Google Scholar] [CrossRef] [PubMed] [Green Version]
  26. Domokos, A.; Nagy, B.; Gyürkés, M.; Farkas, A.; Tacsi, K.; Pataki, H.; Liu, Y.C.; Balogh, A.; Firth, P.; Szilágyi, B.; et al. End-to-end continuous manufacturing of conventional compressed tablets: From flow synthesis to tableting through integrated crystallization and filtration. Int. J. Pharm. 2020, 581, 119297. [Google Scholar] [CrossRef] [PubMed]
  27. Nagy, B.; Szilágyi, B.; Domokos, A.; Tacsi, K.; Pataki, H.; Marosi, G.; Nagy, Z.K.; Nagy, Z.K. Modeling of pharmaceutical filtration and continuous integrated crystallization-filtration processes. Chem. Eng. J. 2021, 413, 127566. [Google Scholar] [CrossRef]
  28. Mascia, S.; Heider, P.L.; Zhang, H.; Lakerveld, R.; Benyahia, B.; Barton, P.I.; Braatz, R.D.; Cooney, C.L.; Evans, J.M.B.; Jamison, T.F.; et al. End-to-End Continuous Manufacturing of Pharmaceuticals: Integrated Synthesis, Purification, and Final Dosage Formation. Angew. Chem. Int. Ed. 2013, 52, 12359–12363. [Google Scholar] [CrossRef]
  29. Hu, C.; Testa, C.J.; Born, S.C.; Wu, W.; Shvedova, K.; Sayin, R.; Halkude, B.S.; Casati, F.; Ramnath, A.; Hermant, P.; et al. E-factor analysis of a pilot plant for end-to-end integrated continuous manufacturing (ICM) of pharmaceuticals. Green Chem. 2020, 22, 4350–4356. [Google Scholar] [CrossRef]
  30. Steenweg, C.; Seifert, A.I.; Schembecker, G.; Wohlgemuth, K. Characterization of a Modular Continuous Vacuum Screw Filter for Small-Scale Solid–Liquid Separation of Suspensions. Org. Process. Res. Dev. 2021, 25, 926–940. [Google Scholar] [CrossRef]
  31. Baldea, M.; Edgar, T.F.; Stanley, B.L.; Kiss, A.A. Modular manufacturing processes: Status, challenges, and opportunities. AIChE J. 2017, 63, 4262–4272. [Google Scholar] [CrossRef] [Green Version]
  32. Lier, S.; Paul, S.; Ferdinand, D.; Grünewald, M. Modulare Verfahrenstechnik: Apparateentwicklung für wandlungsfähige Produktionssysteme. Chem. Ing. Tech. 2016, 88, 1444–1454. [Google Scholar] [CrossRef]
  33. Dobler, T.; Buchheiser, S.; Gleiß, M.; Nirschl, H. Development and Commissioning of a Small-Scale, Modular and Integrated Plant for the Quasi-Continuous Production of Crystalline Particles. Processes 2021, 9, 663. [Google Scholar] [CrossRef]
  34. Höving, S.; Oldach, B.; Kockmann, N. Cooling Crystallization with Complex Temperature Profiles on a Quasi-Continuous and Modular Plant. Processes 2022, 10, 1047. [Google Scholar] [CrossRef]
  35. Wilson, A.J.C. Atlas der Zuckerkristalle—Atlas of Sugar Crystals by G. Vavrinecz. Acta Crystallogr. 1966, 20, 152. [Google Scholar] [CrossRef] [Green Version]
  36. Löbnitz, L. Auslegung des Separationsprozesses und Entwicklung neuer Verfahrenskonzepte zur Integrierten Produktion und Separation Kristalliner Aminosäuren; Karlsruher Institut für Technologie: Karlsruhe, Germany, 2020. [Google Scholar]
  37. Sonnenschein, J.; Hermes, M.; Höving, S.; Kockmann, N.; Wohlgemuth, K. Population balance modeling of unstirred cooling crystallization on an integrated belt filter. Comput. Chem. Eng. 2022, 167, 108024. [Google Scholar] [CrossRef]
  38. Pot, A. Industrial Sucrose Crystallisation: A Study on the Development of Crystal Size Distributions in Continuous and Batch Sucrose Suspension Crystallisers. Ph.D. Thesis, Delft University of Technology, Delft, The Netherlands, 1983. [Google Scholar]
  39. Deutsches Institut für Normung. Agitators and Baffles for Agitator Vessels; Types, Terms and Main Dimensions; Deutsches Institut für Normung: Berlin, Germany, 1992. [Google Scholar]
  40. Hohmann, L.; Greinert, T.; Mierka, O.; Turek, S.; Schembecker, G.; Bayraktar, E.; Wohlgemuth, K.; Kockmann, N. Analysis of Crystal Size Dispersion Effects in a Continuous Coiled Tubular Crystallizer: Experiments and Modeling. Cryst. Growth Des. 2018, 18, 1459–1473. [Google Scholar] [CrossRef]
  41. Schneider, F.; Schliephake, D.; Klimmek, A. Über die Viskosität von reinen Saccharoselösungen. Zucker 1963, 16, 465–473. [Google Scholar]
Figure 1. Functional principle of the continuous mini-pant (a) and the benchtop setup (b). The incremental movement of the process medium container is illustrated. The dotted line circles around the CAD and the P&ID of apparatus with the container positioned on the last temperature module.
Crystals 13 00147 g001
Figure 2. CAD representation and P&ID of the process container with temperature control. Temperature sensors reach into the process medium at three different heights. Adapted from [34].
Crystals 13 00147 g002
Figure 3. Different temperature approaches of the two setups. The control of the mini-plant is carried out with heating mats and an incrementally moving container that passes four temperature modules of constant temperature (a). In (b), a representation of the control with the help of Peltier elements in a single module can be found. Each of the experiments was performed in a fourfold manner. The standard deviations are indicated.
Crystals 13 00147 g003
Figure 4. Temperature profiles of the suspension on the mini-plant (black) and benchtop setup (red): stirred and t c = 5 min in (a); unstirred and t c = 5 min in (b); stirred and t c = 20 min in (c); unstirred and t c = 20 min in (d). Each of the experiments was performed in a fourfold manner. The standard deviation is shown as a transparent tube around the corresponding curve.
Crystals 13 00147 g004
Figure 5. Parity plots of the temperature profiles on the mini-plant plotted against the profiles of the benchtop setup. Since the temperature of the process is decreasing over time, the axes values are decreasing from left to right and bottom to top, respectively. The dotted lines are ±1 K from x = y . Each of the experiments was performed in a fourfold manner. The standard deviations are indicated.
Crystals 13 00147 g005
Figure 6. Average error of the temperature profiles achieved from the benchtop plant with regards to the quasi-continuous mini-plant. The black lines represent the standard deviation. Each of the experiments was performed in a fourfold manner. The standard deviations are indicated.
Crystals 13 00147 g006
Figure 7. Representation of the yield achieved from the different experimental settings and two evaluation methods: stirred and t c = 5 min in (a); unstirred and t c = 5 min in (b); stirred and t c = 20 min in (c); unstirred and t c = 20 min in (d). Each of the experiments was performed in a fourfold manner. The standard deviations are indicated.
Crystals 13 00147 g007
Figure 8. Visualization of the behavior of the CSD along the experiments: stirred and t c = 5 min in (a); unstirred and t c = 5 min in (b); stirred and t c = 20 min in (c); unstirred and t c = 20 min in (d). Each of the experiments was performed in a fourfold manner. To not disturb the process, medium samples have been taken at the beginning and the end of the unstirred experiments.
Crystals 13 00147 g008
Disclaimer/Publisher’s Note: The statements, opinions and data contained in all publications are solely those of the individual author(s) and contributor(s) and not of MDPI and/or the editor(s). MDPI and/or the editor(s) disclaim responsibility for any injury to people or property resulting from any ideas, methods, instructions or products referred to in the content.

