Abstract
AgGaGeS4 is an emerging material with promising nonlinear properties in the near- and mid-infrared spectral ranges. Here, the experimental phonon spectra of AgGaGeS4 single crystals synthesized by a modified Bridgman method are presented. The infrared absorption spectra are reported. They are obtained from the fitting of reflectivity to a model dielectric function comprising a series of harmonic phonon oscillators. In the Raman spectra, several modes are registered, which were not detected in previous works. The analysis of the experimental vibrational bands is performed on the basis of a comparison with reported data on structurally related binary, ternary, and quaternary metal chalcogenides. The temperature dependence of the Raman spectra between room temperature and 15 K is also investigated.
1. Introduction
In recent years there has been a growing interest in the applications of near- and mid-infrared optical devices such as sensors, thermal imagers, rangefinders, medical equipment, and recording and information processing devices. Until now, several commercially available nonlinear materials (AgGaS2, AgGaSe2, CdGeAs2, and ZnGeP2) have been typically utilized for these purposes [1,2,3,4,5,6]. However, these compounds no longer completely meet all requirements of a new generation of devices for modern applications. For example, despite their high efficiency of nonlinear conversion, AgGaS2 and AgGaSe2 compounds exhibit a relatively small radiation damage threshold, while ZnGeP2 shows quite strong two-photon absorption in the spectral range of around 2 μm. CdGeAs2 is expected to become an excellent frequency conversion material owing to its large nonlinear optical coefficient, but it is difficult to grow as single crystals of the required size and quality to find a suitable pump laser source due to the small (mid infrared) bandgap. These deficiencies of traditional compounds have stimulated the search for new materials with better-suited properties. One of the materials that has attracted the attention of researchers is orthorhombic AgGaGeS4, which can alternatively be described as a AgGaS2–GeS2 solid solution [7,8,9,10,11,12,13,14,15,16,17]. Even though this compound was first synthesized in 1980s [7], its thorough investigation was initiated only much later [8,9,10,11,12,13,14,15,16,17]. As a novel nonlinear optical crystal, AgGaGeS4 possesses a quite large nonlinear optical coefficient (d31 = 15 pm/V), a wide transmission range (0.5–11.5 μm), and a high laser damage threshold (50 MW⋅cm−2 at 1.064 μm, τ = 10 ns); it is also environmentally friendly [8,9,10,11,12,13,14,15,16]. However, in addition to these obvious benefits, there are a number of issues that must be overcome for its commercial use. One of these issues is structural heterogeneity.
Currently, several methods are used to obtain AgGaGeS4 crystals [15,16,17,18,19,20]. However, all of them produce polycrystalline rather than single-crystal samples, which might limit their practical applications. The challenge of producing single crystals is complicated by the fact that the single crystals must be obtained at a certain component composition (ratio) of AgGaS2 and GeS2, optimal for a high radiation damage threshold and nonlinear optical coefficients. Even though AgGaGeS4 crystals have been known for several decades, there are only a very limited number of Raman scattering studies [12,18] and, to the best of our knowledge, no reports of far-infrared phonon spectra of this material.
In this report, we investigate single crystals of AgGaGeS4, synthesized using a modified Bridgman method as reported earlier [10,15,16,17]. We performed experimental studies of phonon spectra using Raman and infrared reflection spectroscopies, supported by first-principles density functional theory (DFT) calculations. Particularly, earlier Raman studies are extended here by polarization-dependent, low-temperature, and low-frequency (below 100 cm−1) measurements. We also report and analyze the results of infrared reflection spectroscopy in the phonon frequency range.
2. Experiment
The AgGaGeS4 crystals studied were obtained using a modified Bridgman method (Figure 1); the details of the synthesis and structural studies by X-ray diffractometry were reported in detail previously [10,15,16,17].
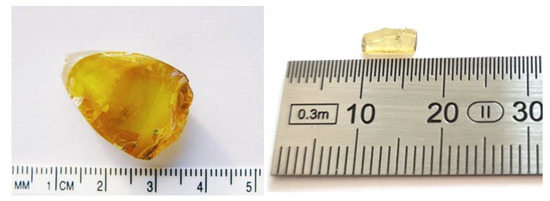
Figure 1.
AgGaGeS4 single crystal, synthesized using a modified Bridgman method (left); a cut and polished sample from the center of the boule used for spectroscopic studies (right).
Raman scattering spectra were obtained using a triple-monochromator Raman spectrometer DILOR XY with λexc = 514.5 nm of an Ar+ laser (in a macroscopic configuration, laser spot diameter ~300 μm) and using a Xplora micro-Raman system with λexc = 532, 638, or 785 nm solid-state lasers, at a spectral resolution of about 2 cm−1 and laser power below 1 mW; temperature-dependent measurements were performed in a closed-cycle He cryostat (Oxford Instruments, Abington, UK).
Unpolarized infrared spectra were obtained using a Bruker 80v FTIR spectrometer in reflectance mode. A Au film was used as a mirror reference. The angle of incidence was set to 45°. The spectral dependence of the dielectric function was extracted via fitting of the reflectance to a model dielectric function, comprising a series of harmonic phonon oscillators.
Theoretical calculations of the electronic ground state of “ordered” AgGaGeS4 were performed within the generalized gradient approximation of the density functional theory, as implemented in the CASTEP code [21] and successfully employed for numerous compound semiconductor crystals [22,23,24,25,26,27,28].
3. Results and Discussion
On the basis of the previous successful application of the density functional theory (DFT) lattice dynamics calculations to a wide variety of quaternary metal chalcogenides [22,23,24,25,26,27,28], which showed a very good correlation with the experimental phonon spectra, we attempted the same calculations to AgGaGeS4. Here, however, an important note has to be made with respect to some specific details of the AgGaGeS4 crystallographic structure, shown in Figure 2. Experimental structural investigations clearly showed that Ag and S atoms occupy general position sites (16b) within the Fdd2 (no. 43) space group of AgGaGeS4 [15]. Cations Ga and Ge, however, occupy 16b and 8a positions, and both of these specific positions reveal “mixed occupancy”: 0.5 Ga + 0.5 Ge. Moreover, some Ag deficiency was also established experimentally [29]. These structural features complicate DFT calculations and do not allow the “standard” lattice dynamics DFT calculations [21] to be performed.
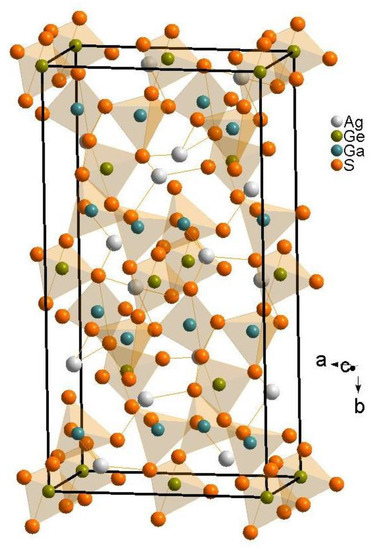
Figure 2.
Crystallographic unit cell of AgGaGeS4 under the assumption of fixed occupancy of cations through the lattice, with Ga and Ge occupying 8a and 16b crystallographic sites, respectively.
It is obvious that the main structural building units are GaS4, GeS4, and distorted AgS4 tetrahedra [15]. The unit cell of the material is rather large as it contains 12 formula units (Z = 12). It is known, however, that a smaller primitive cell is sufficient to perform the classification of the vibrational modes. Group theoretical site symmetry analysis of the Brillouin zone-center normal vibrations of AgGaGeS4 within the point group C2v yields the following:
Γtot = 16A1 + 16A2 + 17B1 + 17B2;
Γac = A1 + B1 + B2;
ΓIR = 15A1(z) + 16B1(x) + 16B2(y);
ΓR = 15A1(xx,yy,zz) + 16A2(xy) + 16B1(xz) + 16B2(yz).
Here, the selection rules for infrared (IR) and Raman (R) spectra are indicated in brackets. As the space group is non-centrosymmetric, A1, B1, and B2 phonons are active in both Raman and infrared spectra, while A2 modes are accessible in Raman spectra only.
Figure 3 shows the polarization-dependent Raman spectra obtained at T = 300 K. The spectra were deconvoluted using Lorentzian line shapes in order to the extract phonon line parameters (position and width). All spectra show the most intense characteristic band at 322 cm−1 and a slightly weaker one at 359 cm−1. There are also a number of lines in the spectra at lower frequencies, below 50 cm−1, which are registered for AgGeGaS4 for the first time in this work (because this low-frequency range was not covered in other studies [18,19,20]). The performed polarized measurements allowed us to separate fully symmetric A1 modes, active in parallel scattering polarizations, particularly (xx), from A2 modes, which are active in the crossed-polarized scattering geometry (xy).
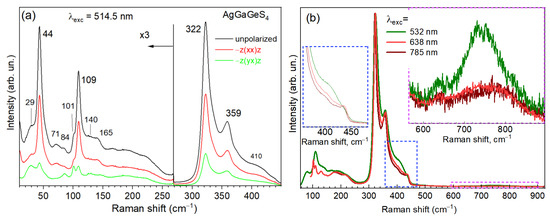
Figure 3.
(a) Polarization-dependent Raman spectra of AgGaGeS4 obtained at T = 300 K and λexc = 514.5 nm. (b) The effect of λexc on the first- and second-order (in the inset on the right side) Raman spectra.
Table 1 summarizes the frequency position of all Raman and IR modes observed experimentally for AgGeGaS4 in the present work and also lists experimental Raman data from [18], which were registered only above 100 cm−1. As can be seen from a comparison of the presented sets of frequencies, our study not only extends the range of detected phonon modes to the low-frequency range, but also reveals several new modes in the range studied in [18], particularly at 165, 177, 180, 206, and 211 cm−1 (see Table 1).

Table 1.
Experimental phonon frequencies of AgGaGeS4 from this study in comparison with experimental results on related sulfides from other works. Note that polarized Raman measurements probe A1(LO) and A2 phonons, while unpolarized IR reflectivity measurements are sensitive to A1, B1, and B2 phonons. The most intense experimental modes are marked in bold.
In view of the principal difficulties with performing DFT calculations of an appropriate crystal structure for the AgGeGaS4 compound, we see it as most reasonable to analyze its phonon spectrum through a comparison with the experimental phonon frequencies of related binary and ternary metal sulfides, which comprise the same structural blocks consisting of S and Ag or Ga or Ge. This is the reason for presenting in Table 1 the corresponding sets of experimentally observed phonon frequencies of AgGaS2 [29,30,31], Pb2GeS4 [26,32], Ag2S [33], and GeS2 [32,33]. A comparative analysis of the vibrations in the latter compounds with those observed for AgGeGaS4 allows several conclusions to be made.
First of all, we make a reasonable assumption that the frequencies of the same vibrations (of the same structural blocks) in different compounds (listed in Table 1) should not differ by more than several percent. Within this expected “tolerance”, for 20 of 24 modes of AgGeGaS4, a corresponding frequency can be found in the spectra of compounds collected for comparison. Most of the AgGeGaS4 modes are apparently related to vibrations of the GeS4 tetrahedra (modes at 71, 79, 109, 127, 146, 177, 180, 206, 336, 359, and 365 cm−1), because they correlate with corresponding frequencies of Pb2GeS4 and GeS2. The AgGeGaS4 modes at 84, 126, 211, 322, and 336 cm−1 are most likely related to vibrations in the GaS4 tetrahedra, as they are also present in the AgGaS2 spectrum. The vibration at 44 cm−1 could be related to Ag–S vibrations, because this peak is present in the spectrum of Ag2S.
From the comparison of the (normalized) first-order and second-order Raman spectra measured at different λexc (Figure 3), one can conclude that the stronger relative intensity of features around 640 and 740 cm−1 at resonant excitation by λexc = 532 nm (Figure 3b, inset) can be related to enhanced second-order scattering of the 322 and 359 cm−1 modes. This additionally confirms the assignment of the latter to LO modes [22,23,24,25,26,27]. In a similar way the slight increase in scattering intensity in the range of 400–430 cm−1 can be interpreted as an enhancement of combinational modes involving the 322 and 359 cm−1 LO modes and lower-frequency LO vibrations, i.e., 44 and 109 cm−1 (Table 1).
Given that the temperature-dependent properties of AgGaGeS4 crystals are an object of interest [12,20], we performed temperature-dependent Raman scattering measurements from T = 15 K to 265 K in 10 K increments (Figure 4). As the temperature decreases, there is a smooth shift of modes toward higher frequencies (up to 4 cm−1 for the highest-frequency modes) due to the lattice anharmonicity (phonon–phonon interactions) [34]. No additional features appear in the spectra. Notably, the low-frequency modes (below 110 cm−1) reveal much smaller shifts, which is related to the reduced number of phonon scattering (decay) channels.
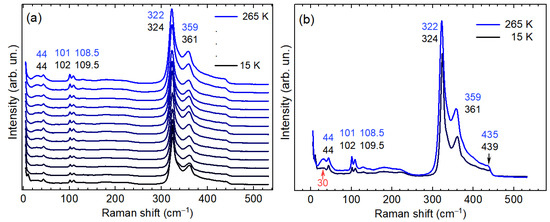
Figure 4.
(a) Temperature-dependent Raman spectra of AgGaGeS4 (λexc = 514.5 nm) in the range of 15 K to 265 K. (b) The spectra for 15 K to 265 K shown in more detail.
Lastly, the infrared reflectance spectrum of the AgGaGeS4 single crystal shown in Figure 5 reveals several spectral features with the most intense ones above 300 cm−1. In order to extract information on the spectral dependence of dielectric function, we performed fitting of reflectance to a model dielectric function in the form of a series of harmonic phonon oscillators:
where is the high-frequency dielectric constant, while ωTk, γTk, and STk are the oscillator mode frequency, its strength, and its damping, respectively. The software package from [35] was utilized. It is known that the maxima in the spectrum of the imaginary part of dielectric function Im(ε) correspond to transverse optical (TO) mode frequencies (marked in black in the lower panel of Figure 5), while maxima of the loss function Im(−1/ε) define the position of longitudinal optical (LO) modes. All obtained numerical data are listed in Table 1.
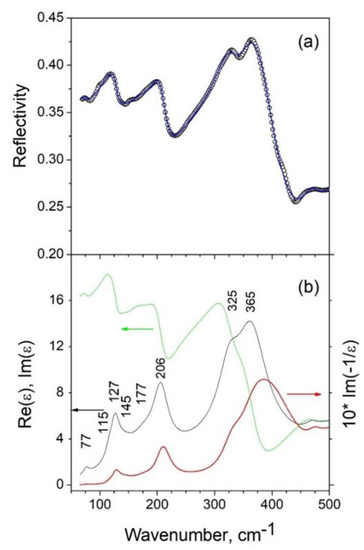
Figure 5.
(a) Room-temperature experimental (open points) and simulated (blue solid line) IR reflectivity spectra of AgGaGeS4. (b) Spectral dependence of the real and imaginary parts of the dielectric function (green and black lines, respectively) and the loss function (red line) obtained via modeling of the dielectric function and fitting the reflectance.
4. Conclusions
We report the results of an experimental investigation of polarized Raman and infrared vibrational spectra of AgGaGeS4 single crystals. The analysis of the main features in the experimental vibrational spectra was performed by comparing them with reported data on structurally related binary, ternary, and quaternary metal chalcogenides. For the first time, experimental Raman spectra were obtained for the spectral region (<100 cm−1), and the bands registered there were assigned to the corresponding vibrational modes. Several new modes were found in the range studied earlier, particularly at 165, 177, 180, 206, and 211 cm−1. Optical properties in the infrared spectral range were determined by fitting experimental reflectivity spectra to a model dielectric function, comprising a series of phonon oscillators. It was established that the majority of the observed modes are related to vibrations of GeS4 tetrahedra, several modes are most likely related to GaS4 tetrahedra, and only the mode at 44 cm−1 is largely due to vibrations involving Ag. Upon a temperature decrease to 15 K, a smooth shift of modes toward higher frequencies was observed (up to 4 cm−1 for the highest-frequency modes) due to the lattice anharmonicity (phonon–phonon interactions).
Author Contributions
Conceptualization, M.V. and V.Y.; methodology, M.V. and L.P.; investigation, L.H., D.S., S.A.K. and Y.H.; synthesis, L.P. and Y.K.; writing—original draft preparation, A.P.L., M.V. and V.D.; writing—review and editing, D.R.T.Z., S.A.K. and M.V.; project administration, V.Y. and V.D.; funding acquisition, D.R.T.Z. and V.Y. All authors have read and agreed to the published version of the manuscript.
Funding
M.V., V.Y., and V.D. acknowledge financial support from the project “The investigation of the features of cationic substitution in nanocrystals of quaternary metal chalcogenides—materials of a new generation of thin-film photovoltaics” (NAS of Ukraine, project no. 7/21-H).
Acknowledgments
V.D. acknowledges the funding of his research stays at TU Chemnitz by the Visiting Scholar Program of TUC. Y.H. acknowledges funding by the Alexander von Humboldt Foundation. The authors also acknowledge O. Selyshchev for help with IR measurements. Lastly, S.A.K. thanks the Amada Foundation (grant no. AF-2019225-B3).
Conflicts of Interest
The authors declare no conflict of interest.
References
- Chung, I.; Kanatzidis, M.G. Metal chalcogenides: A rich source of nonlinear optical materials. Chem. Mater. 2014, 26, 849–869. [Google Scholar] [CrossRef]
- Huang, W.; Zhao, B.; Zhu, S.; He, Z.; Chen, B.; Yu, Y. Vibrational modes of chalcopyrite CdGeAs2 crystal. Mater. Res. Bull. 2016, 81, 107–113. [Google Scholar] [CrossRef]
- He, Z.; Zhao, B.; Zhu, S.; Li, J.; Zhang, Y.; Du, W.; Huang, W.; Chen, B. Preparation and characterization of CdGeAs2 crystal by modified vertical Bridgman method. J. Cryst. Growth 2011, 314, 349–352. [Google Scholar] [CrossRef]
- Verozubova, G.A.; Okunev, A.O.; Gribenyukov, A.I.; Trofimiv, A.Y.; Trukhanov, E.M.; Kolesnikov, A.V. Growth and defect structure of ZnGeP2 crystals. J. Cryst. Growth 2010, 312, 1122–1126. [Google Scholar] [CrossRef]
- Xie, J.J.; Guo, J.; Zhang, L.M.; Li, D.J.; Yang, G.L. Optical properties of non-linear crystal grown from the melt GaSe-AgGaSe2. Opt. Commun. 2013, 287, 145–149. [Google Scholar] [CrossRef]
- Anandha Babu, G.; Subramaniyan Raja, R.; Karunagaran, N. Growth improvement of AgGaSe2 single crystal using the vertical Bridgman technique with steady ampoule rotation and its characterization. J. Cryst. Growth 2012, 338, 42–46. [Google Scholar] [CrossRef]
- Pobedimskaya, E.A.; Alimova, L.L.; Belov, V.N.; Badikov, V.V. Crystal structures of silver germanogallium sulfide and GeS2. Sov. Phys. Dokl. 1981, 26, 259. [Google Scholar]
- Andreev, Y.M.; Geiko, P.P.; Badikov, V.V.; Panyutin, V.L.; Shevyrdayeva, G.S.; Ivaschenko, M.V.; Karapuzikov, A.I.; Sherstov., I.V. Parametric frequency converters with LiInSe2, AgGaGeS4, HgGa2S4 and Hg0.65Cd0.35Ga2S4 crystals. Ninth Jt. Int. Symp. Atmos. Ocean Opt. Atmos. Phys. 2003, 5027 pt II, 120–127. [Google Scholar]
- Petrov, V.; Badikov, V.; Shevyrdyaeva, G.; Panyutin, V.; Chizhikov, V. Phase-matching properties and optical parametric amplification in single crystals of AgGaGeS4. Opt. Mater. 2004, 26, 217–222. [Google Scholar] [CrossRef]
- Yurchenko, O.M.; Olekseyuk, I.D.; Parasyuk, O.V.; Pankevich, V.Z. Single crystal growth and properties of AgGaGeS4. J. Cryst. Growth 2005, 275, E1983–E1985. [Google Scholar] [CrossRef]
- Miyata, K.; Petrov, V.; Kato, K. Phase-matching properties for AgGaGeS4. Appl. Opt. 2007, 46, 5728–5731. [Google Scholar] [CrossRef] [PubMed]
- Huang, W.; He, Z.; Zhu, S.; Zhao, B.; Chen, B.; Zhu, S. Polycrystal Synthesis, Crystal Growth, Structure, and Optical Properties of AgGaGenS2(n+1) (n = 2, 3, 4, and 5) Single Crystals for Mid-IR Laser Applications. Inorg. Chem. 2019, 58, 5865–5874. [Google Scholar] [CrossRef] [PubMed]
- Rame, J.; Viana, B.; Clement, Q.; Melkonian, J.M.; Petit, J. Control of Melt Decomposition for the Growth of High Quality AgGaGe4 Single Crystals for Mid-IR Laser Applications. Cryst. Growth Des. 2014, 14, 5554–5560. [Google Scholar] [CrossRef]
- Andreev, Y.; Geiko, P.P.; Badikov, V.V.; Bhar, G.C. Nonlinear Optical Properties of Defect Tetrahedral Crystals HgGa2S4 and AgGaGeS4 and Mixed Chalcopyrite Crystal Cd0.4Hg0.6Ga2S4. Nonlinear Opt. 2002, 1, 19–27. [Google Scholar] [CrossRef]
- Vu, T.V.; Dat, V.D.; Lavrentyev, A.A.; Gabrelian, B.V.; Hieu, N.N.; Myronchuk, G.L.; Khyzhun, O.Y. Electronic and optical properties of thiogermanate AgGaGeS4: Theory and experiment. RSC Adv. 2023, 13, 881–887. [Google Scholar] [CrossRef]
- Myronchuk, G.L.; Lakshminarayana, G.; Kityk, I.V.; Fedorchuk, A.O.; Vlokh, R.O.; Kozer, V.R.; Parasyuk, O.V.; Piasecki, M. AgGaGeS4 crystal as promising optoelectronic material. Chalcogenide Lett. 2018, 15, 151–156. [Google Scholar]
- Khyzhun, O.Y.; Parasyuk, O.V.; Fedorchuk, A.O. Single crystal growth and electronic structure of thiogermanate AgGaGeS4, a novel nonlinear optical material. Adv. Alloy. Compd. 2014, 1, 15–29. [Google Scholar]
- Huang, W.; He, Z.; Zhao, B.; Zhu, S.; Chen, B.J. Crystal growth, structure, and optical properties of new quaternary chalcogenide nonlinear optical crystal AgGaGeS4. J. Alloy. Compd. 2019, 796, 138–145. [Google Scholar] [CrossRef]
- Huang, W.; He, Z.; Zhao, B.; Zhu, S.; Chen, B.; Wu, Y. Effect of thermal annealing treatment and defect analysis on AgGaGeS4 single crystals. Inorg. Chem. 2019, 58, 10846–10855. [Google Scholar] [CrossRef]
- Wu, J.; Huang, W.; Liu, H.G.; He, Z.; Chen, B.; Zhu, S.; Zhao, B.; Lei, Y.; Zhou, X. Investigation of the thermal properties and crystal growth of the nonlinear optical crystals AgGaS2 and AgGaGeS4. Cryst. Growth Des. 2020, 20, 3140–3153. [Google Scholar] [CrossRef]
- Clark, S.J.; Segall, M.D.; Pickard, C.J.; Hasnip, P.J.; Probert, M.J.; Refson, K.Z.; Payne, M.C. First principles methods using CASTEP. Z. Kristallogr. 2005, 220, 567. [Google Scholar] [CrossRef]
- Litvinchuk, A.P.; Dzhagan, V.M.; Yukhymchuk, V.O.; Valakh, M.Y.; Babichuk, I.S.; Parasyuk, O.V.; Piskach, L.V.; Gordan, O.D.; Zahn, D.R.T. Electronic structure, optical properties, and lattice dynamics of orthorhombic Cu2CdGeS4 and Cu2CdSiS4 semiconductors. Phys. Rev. B 2014, 90, 165201. [Google Scholar] [CrossRef]
- Litvinchuk, A.P. Optical properties and lattice dynamics of Cu2ZnGeSe4 quaternary semiconductor: A density-functional study. Phys. Status Solidi B 2016, 253, 323–328. [Google Scholar] [CrossRef]
- Valakh, M.Y.; Litvinchuk, A.P.; Dzhagan, V.M.; Yukhymchuk, V.O.; Havryliuk, Y.O.; Guc, M.; Bodnar, I.V.; Izquierdo-Roca, V.; Pérez-Rodríguez, A.; Zahn, D.R.T. Optical properties of quaternary kesterite-type Cu2Zn(Sn1-xGex)S4 crystalline alloys: Raman scattering, photoluminescence and first-principle calculations. RSC Adv. 2016, 6, 67756–67763. [Google Scholar] [CrossRef]
- Guc, M.; Litvinchuk, A.P.; Levcenko, S.; Valakh, M.Y.; Bodnar, I.V.; Dzhagan, V.M.; Izquierdo-Roca, V.; Arushanov, E.; Pérez-Rodríguez, A. Optical phonons in the kesterite Cu2ZnGeS4 semiconductor: Polarized Raman spectroscopy and first-principle calculations. RSC Adv. 2016, 6, 13278–13285. [Google Scholar] [CrossRef]
- Valakh, M.Y.; Dzhagan, V.M.; Mazur, N.V.; Havryliuk, Y.O.; Yukhymchuk, V.O.; Piskach, L.V.; Kogut, Y.M.; Zahn, D.R.T.; Litvinchuk, A.P. Raman and Infrared Phonon Spectra of Novel Nonlinear Optical Materials PbGa2GeS6 and PbGa2GeSe6: Experiment and Theory. Phys. Status Solidi B 2020, 257, 1900700. [Google Scholar] [CrossRef]
- Valakh, M.Y.; Litvinchuk, A.P.; Dzhagan, V.M.; Yukhymchuk, V.O.; Yaremko, A.M.; Romanyuk, Y.A.; Guc, M.; Bodnar, I.V.; Pérez-Rodríguez, A.; Zahn, D.R.T. Fermi resonance in phonon spectra of quaternary chalcogenides of the type Cu2ZnGeS4. J. Phys.: Cond. Matter 2016, 28, 065401. [Google Scholar] [CrossRef]
- Dzhagan, V.; Kapush, O.; Mazur, N.; Havryliuk, Y.; Danylenko, M.I.; Budzulyak, S.; Yukhymchuk, V.; Valakh, M.; Litvinchuk, A.; Zahn, D.R.T. Colloidal Cu-Zn-Sn-Te nanocrystals: Aqueous synthesis and Raman spectroscopy study. Nanomaterials 2021, 11, 2923. [Google Scholar] [CrossRef]
- Lockwood, D.J.; Montgomery, H. Raman spectrum of AgGaS2. J. Phys. C Solid State Phys. 1975, 8, 3241–3250. [Google Scholar] [CrossRef]
- Tyuterev, V.G.; Skachkov, S.I. On the lattice dynamics of AgGaS2. Il Nuovo Cim. D 1992, 14, 1091–1095. [Google Scholar] [CrossRef]
- Carlone, C.; Olego, D.; Jayaraman, A.; Cardona, M. Pressure dependence of the Raman modes and pressure-induced phase changes in CuGaS2 and AgGaS2. Phys. Rev. B 1980, 22, 3877–3885. [Google Scholar] [CrossRef]
- Bletskan, D.I.; Voroshilov, Y.V.; Durdinets, L.M.; Migalko, P.P.; Stefanovich, V.A.; Kabatsii, V.N. Crystal structure and specific features of formation of vibrational spectra of Pb2GeS4. Crystallogr. Rep. 2003, 48, 573–575. [Google Scholar] [CrossRef]
- Alekperov, O.; Jahangirli, Z.; Paucar, R. First-principles lattice dynamics and Raman scattering in ionic conductor β-Ag2S. Phys. Status Solidi B 2016, 253, 2049–2055. [Google Scholar] [CrossRef]
- Ipatova, I.P.; Maradudin, A.A.; Wallis, R.F. Temperature dependence of the width of the fundamental lattice-vibration absorption peak in ionic crystals. II. Approximate numerical results. Phys. Rev. 1967, 155, 882–895. [Google Scholar]
- Theiss, W. Hard- and Software. Available online: htpps://wtheiss.com (accessed on 24 June 2022).
Disclaimer/Publisher’s Note: The statements, opinions and data contained in all publications are solely those of the individual author(s) and contributor(s) and not of MDPI and/or the editor(s). MDPI and/or the editor(s) disclaim responsibility for any injury to people or property resulting from any ideas, methods, instructions or products referred to in the content. |
© 2023 by the authors. Licensee MDPI, Basel, Switzerland. This article is an open access article distributed under the terms and conditions of the Creative Commons Attribution (CC BY) license (https://creativecommons.org/licenses/by/4.0/).