
Grain-Size-Induced Collapse of Variable Range Hopping and Promotion of Ferromagnetism in Manganite La0.5Ca0.5MnO3


 , ,
, ,  ,
,  , ,
, , 
Abstract
1. Introduction
2. Materials and Methods
3. Results
3.1. Structural Properties
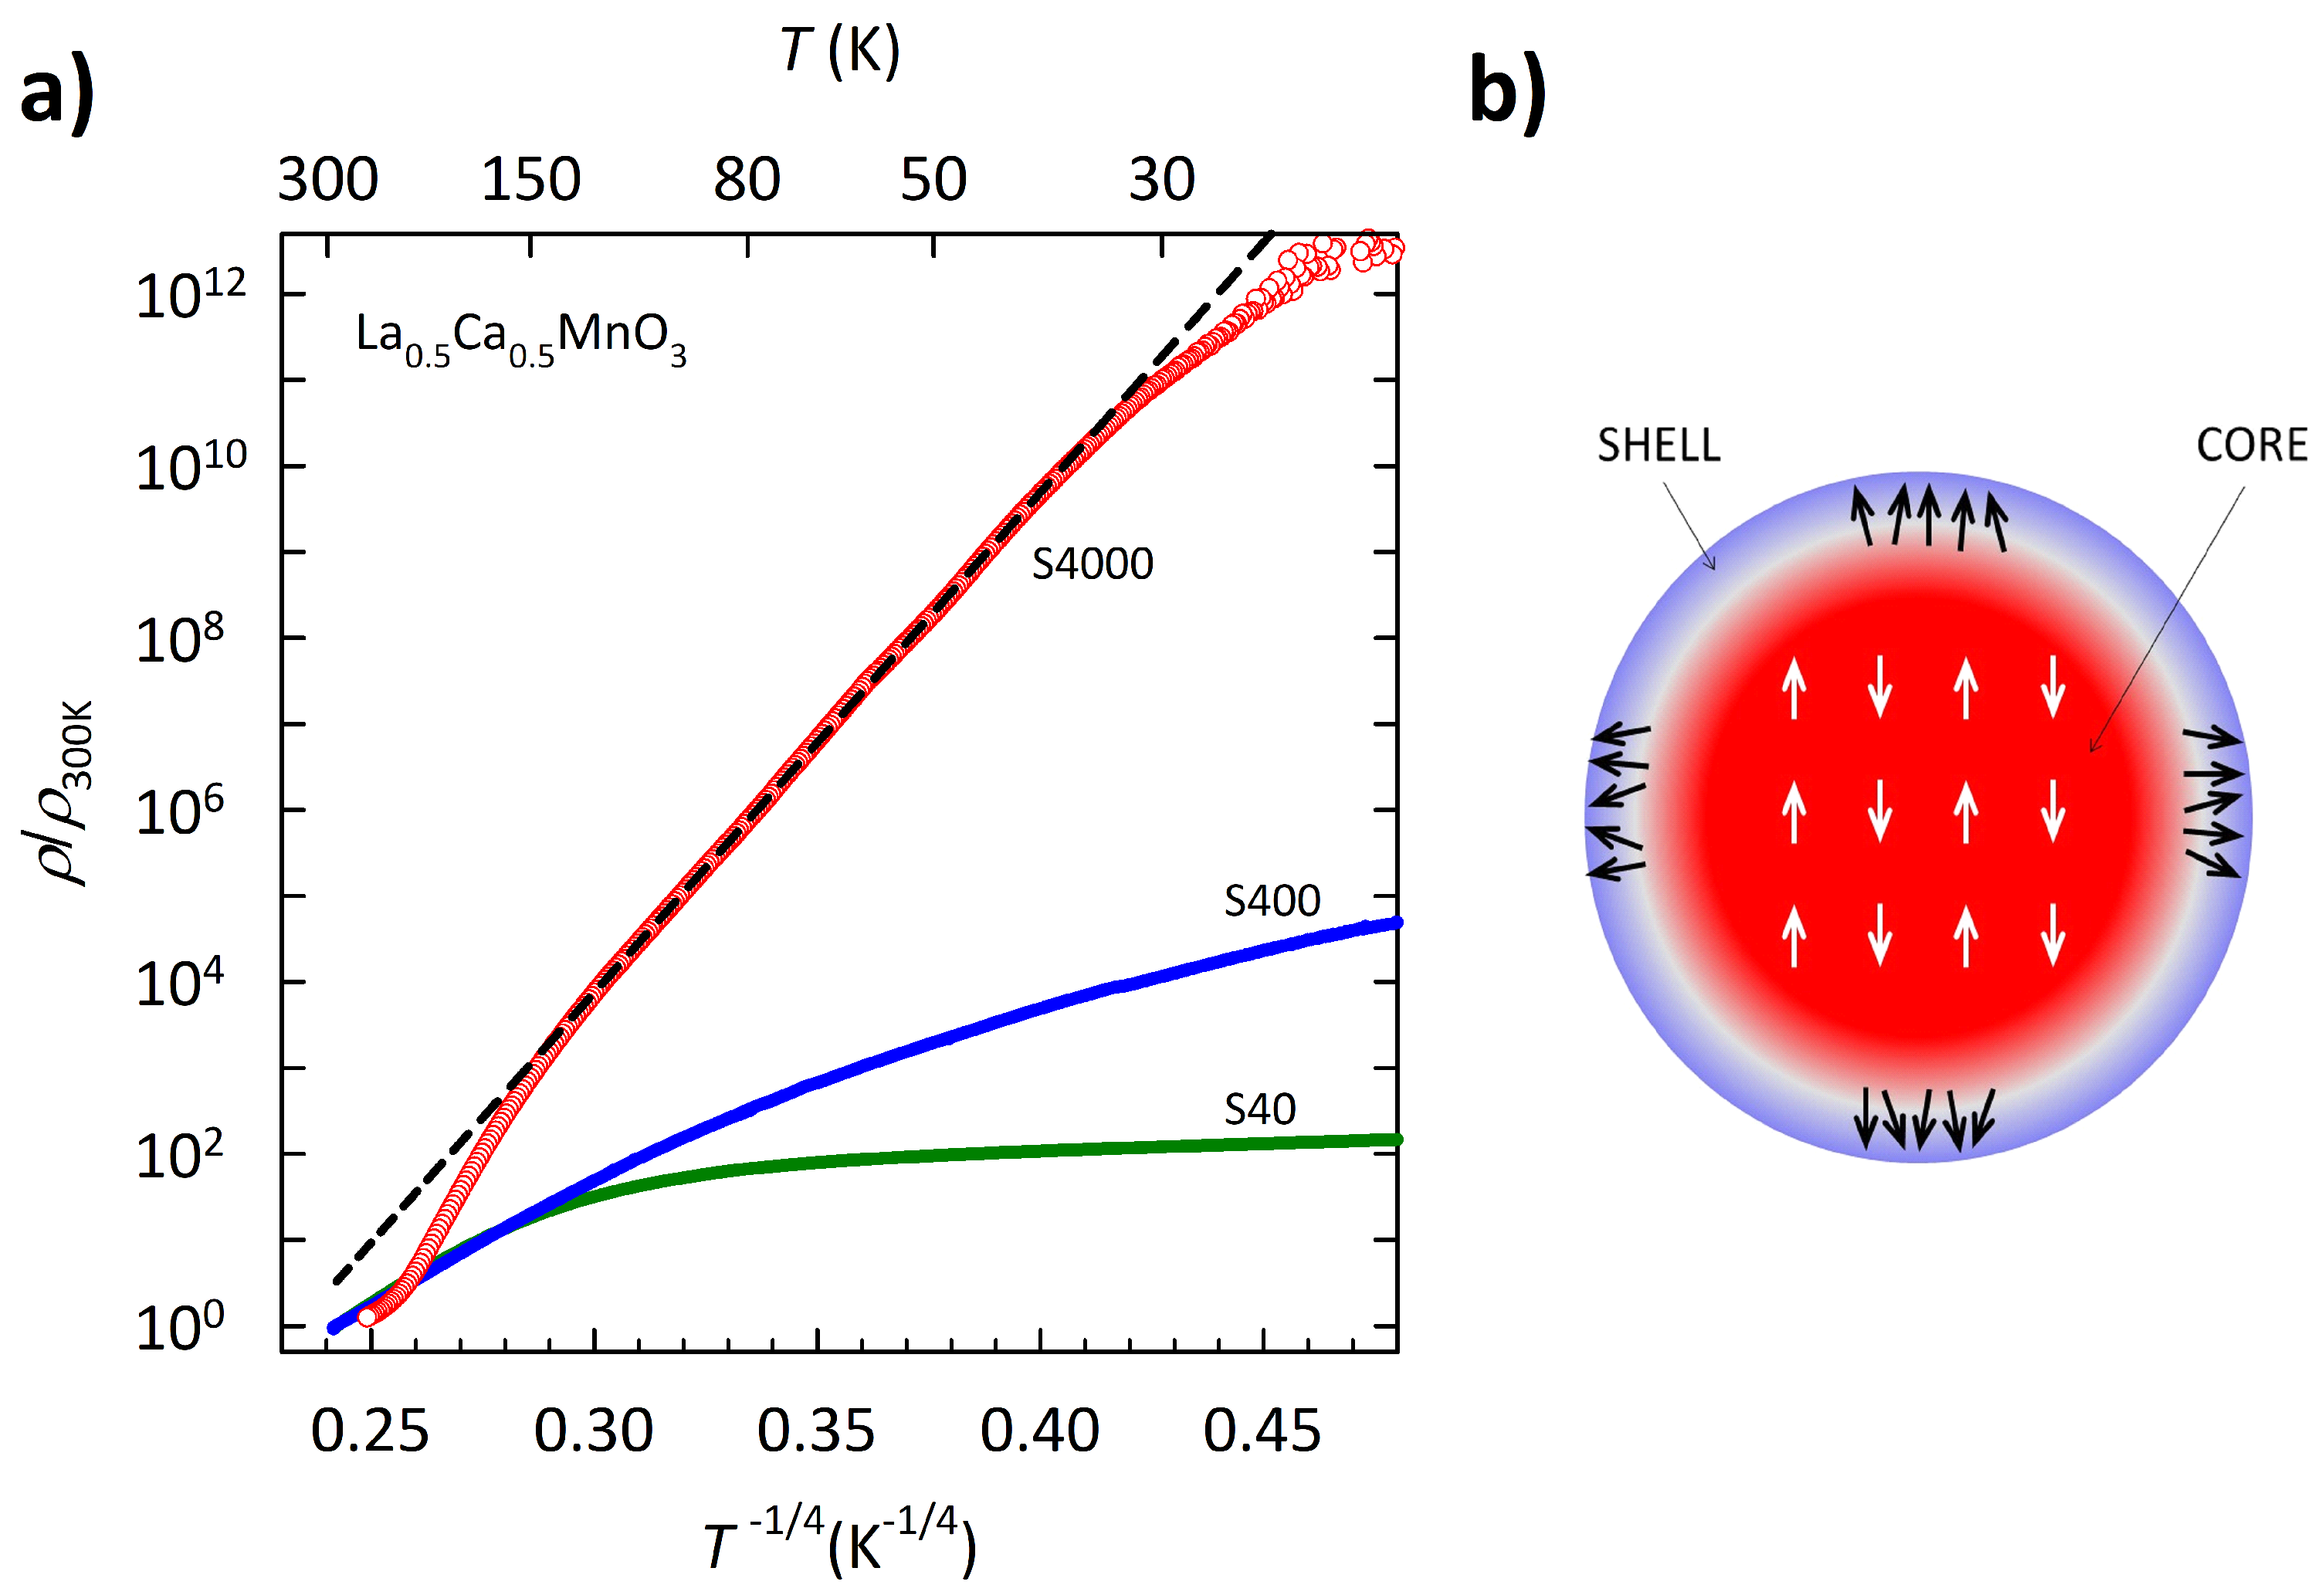
3.2. DC Resistivity
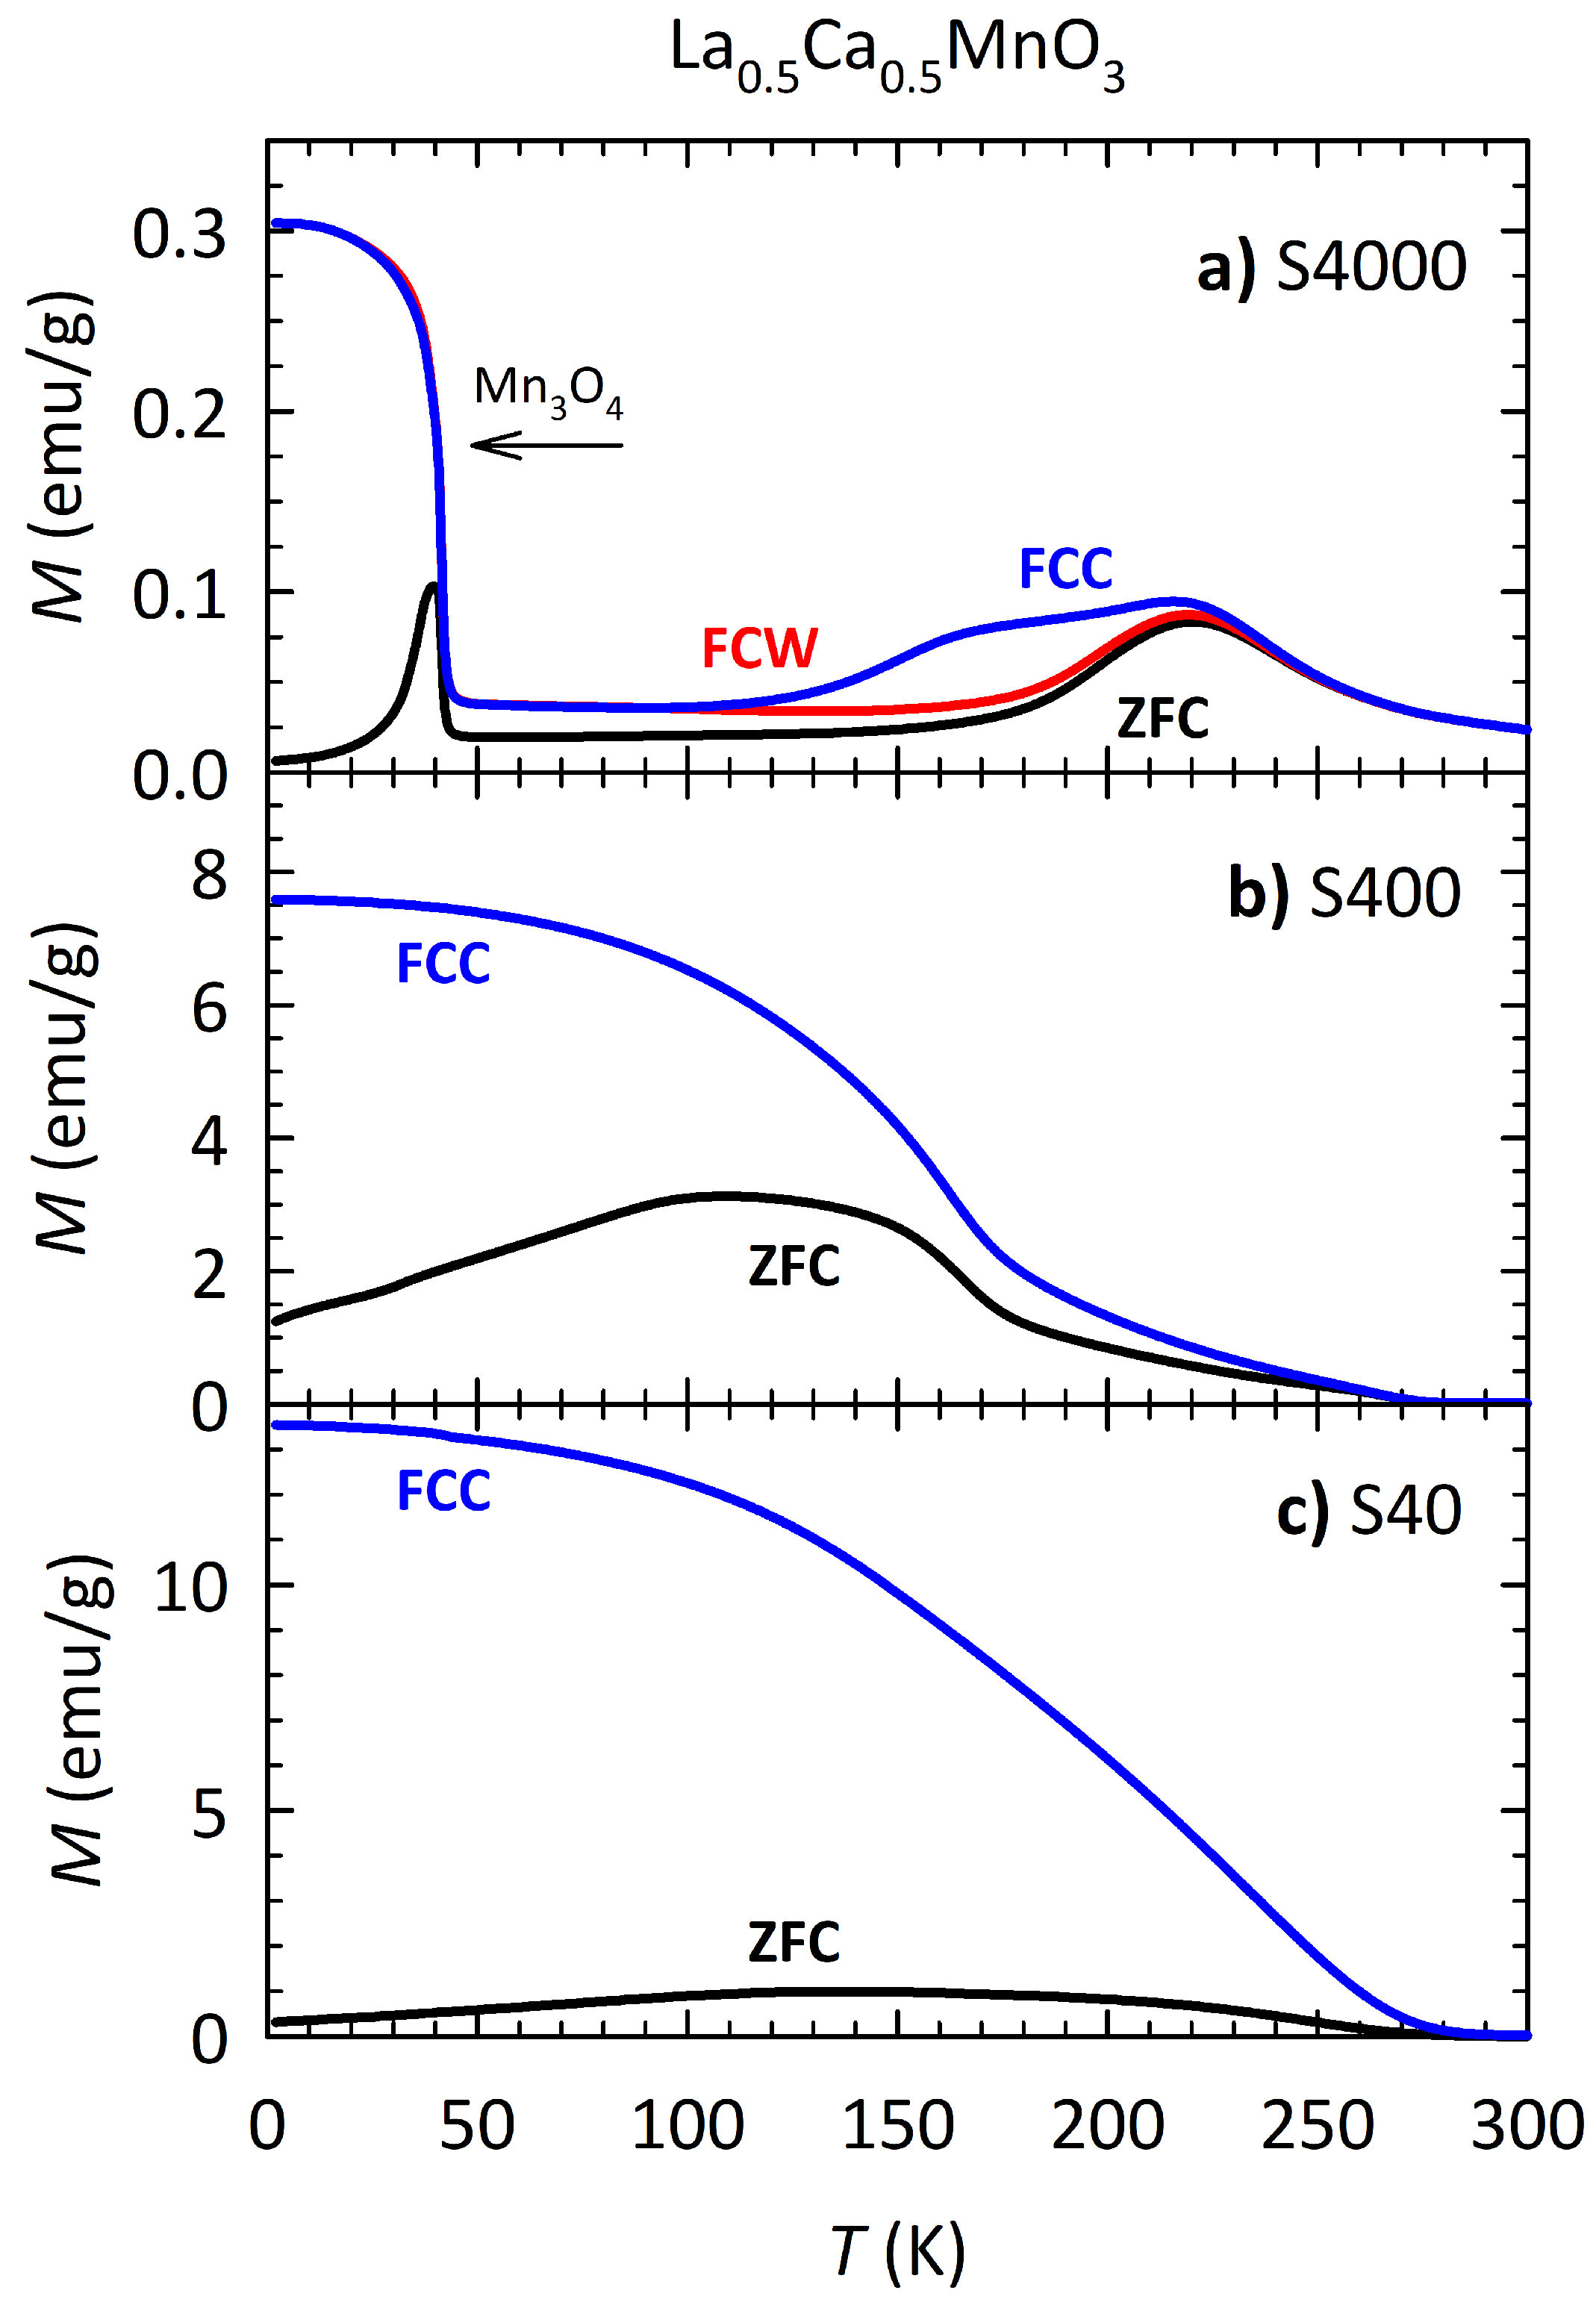
3.3. Magnetization
4. Discussion
5. Conclusions
Author Contributions
Funding
Institutional Review Board Statement
Informed Consent Statement
Data Availability Statement
Acknowledgments
Conflicts of Interest
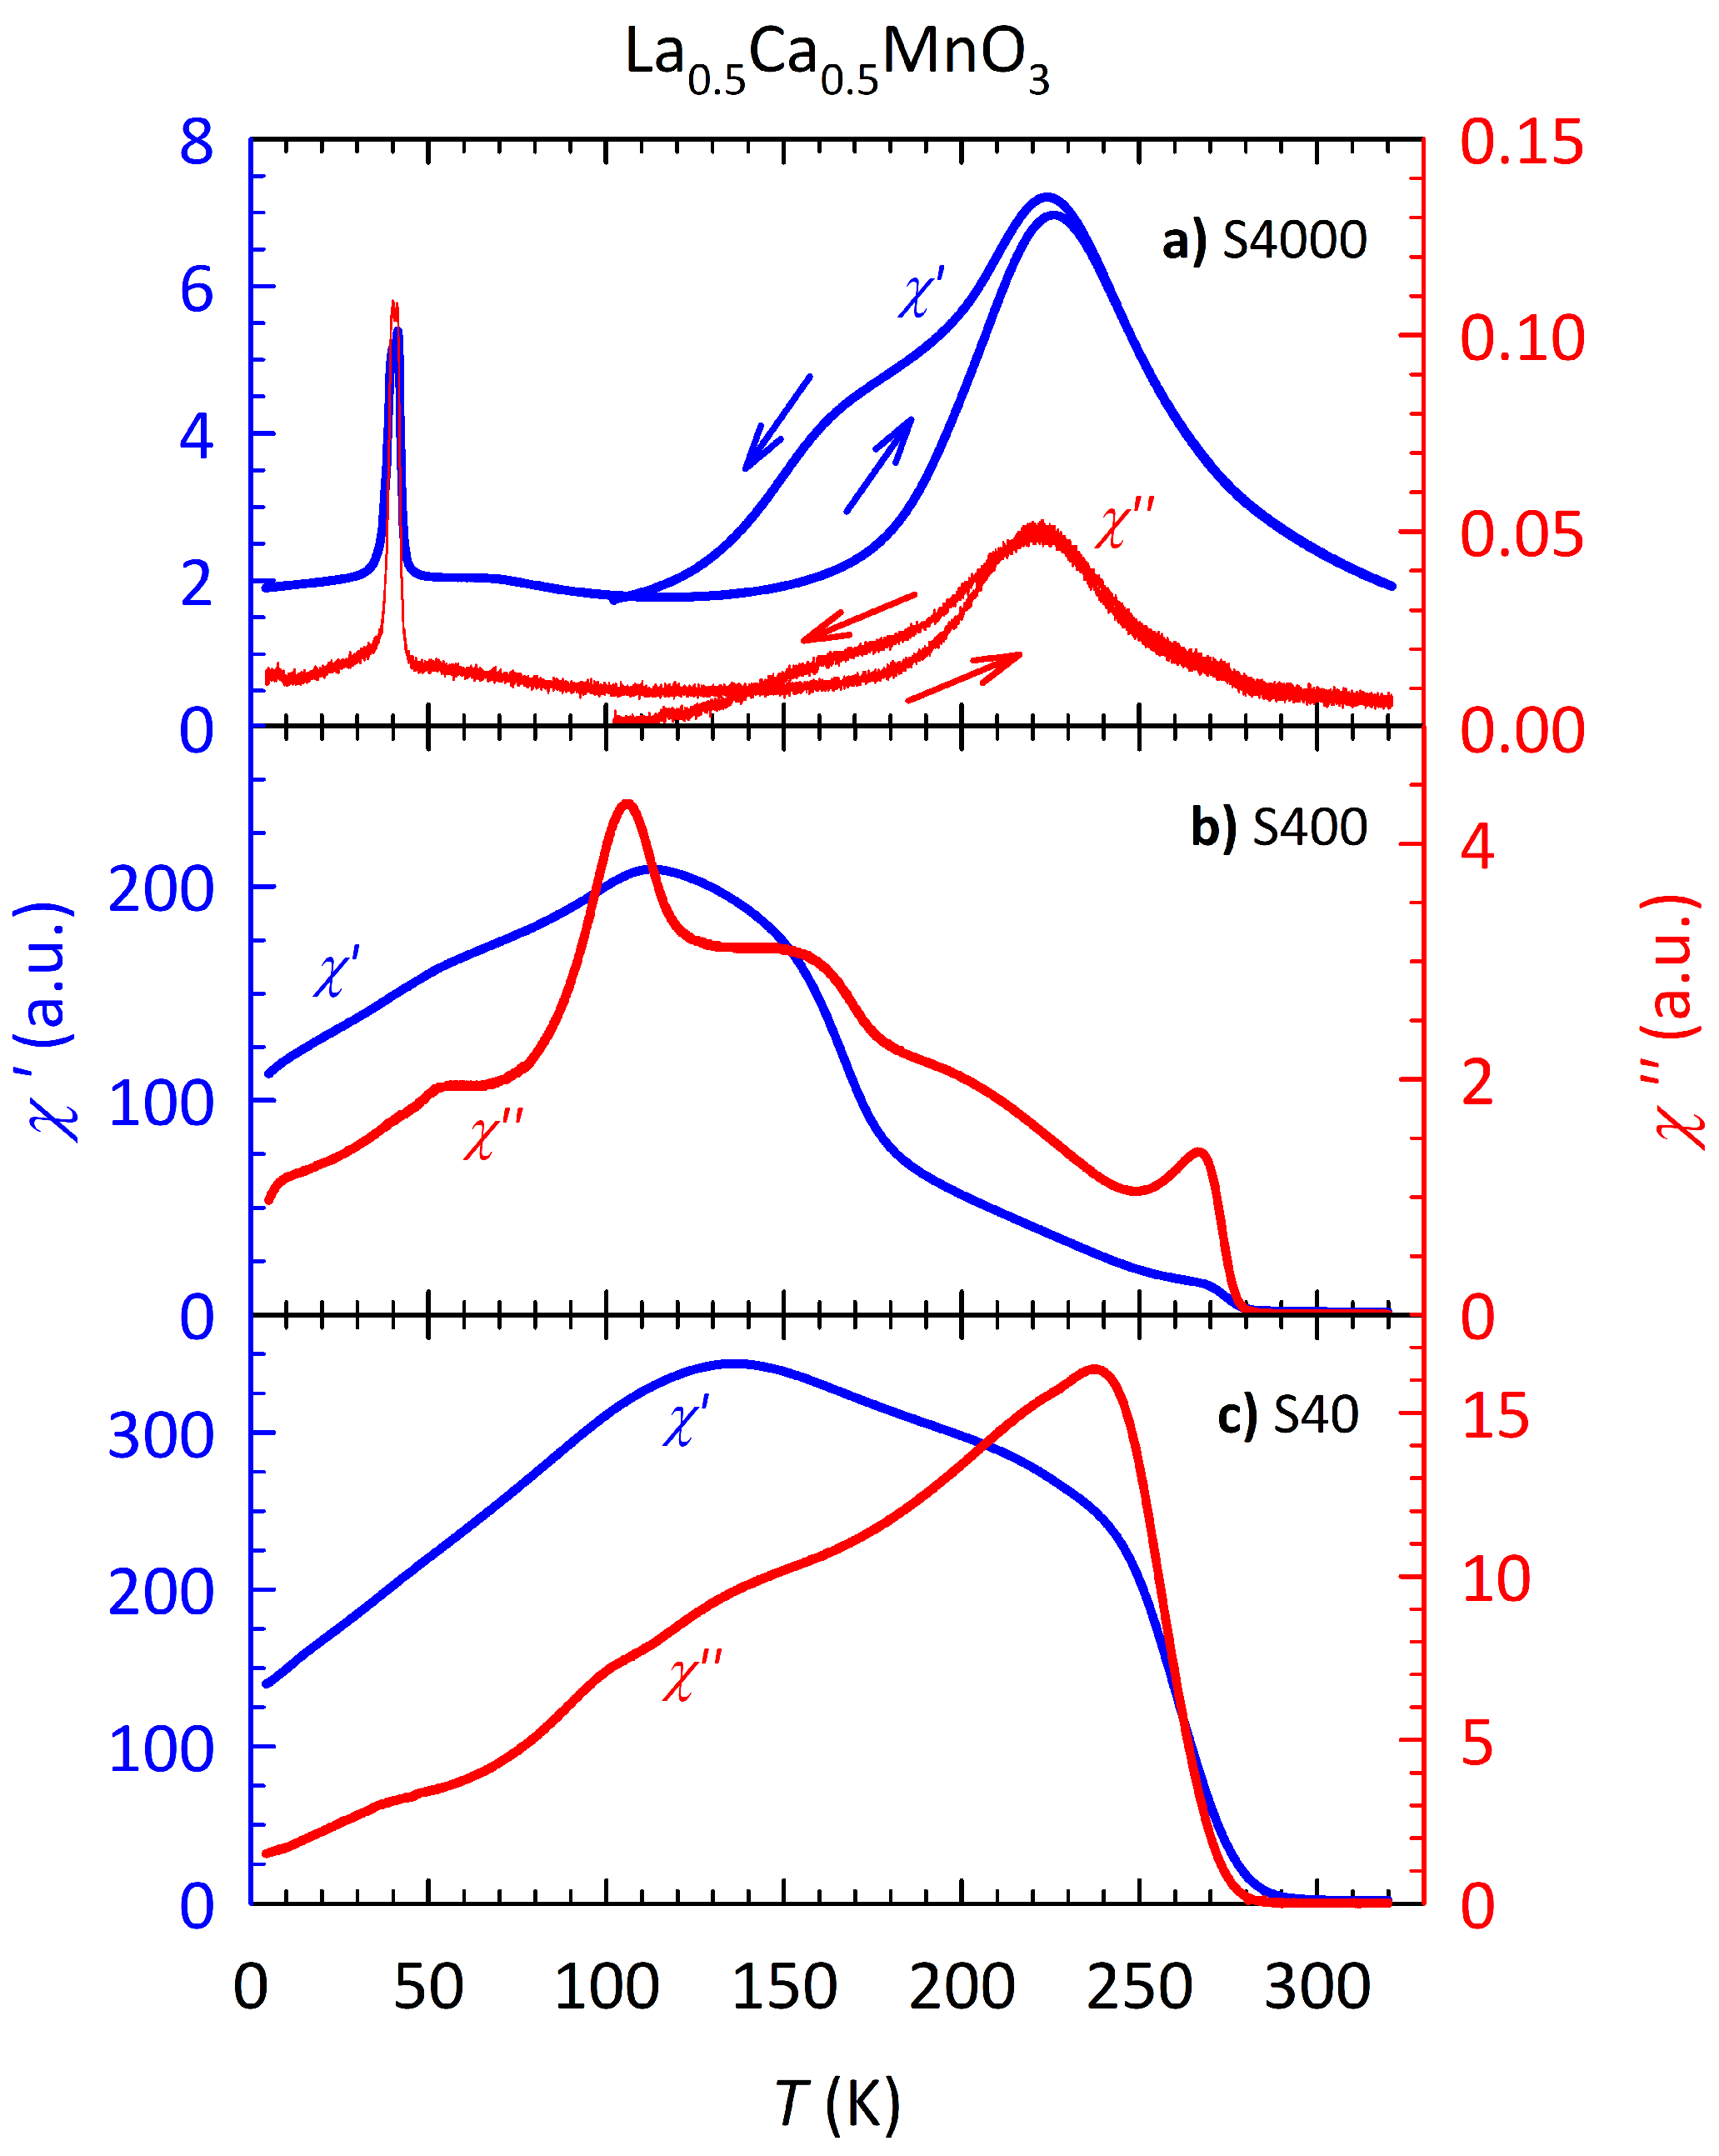
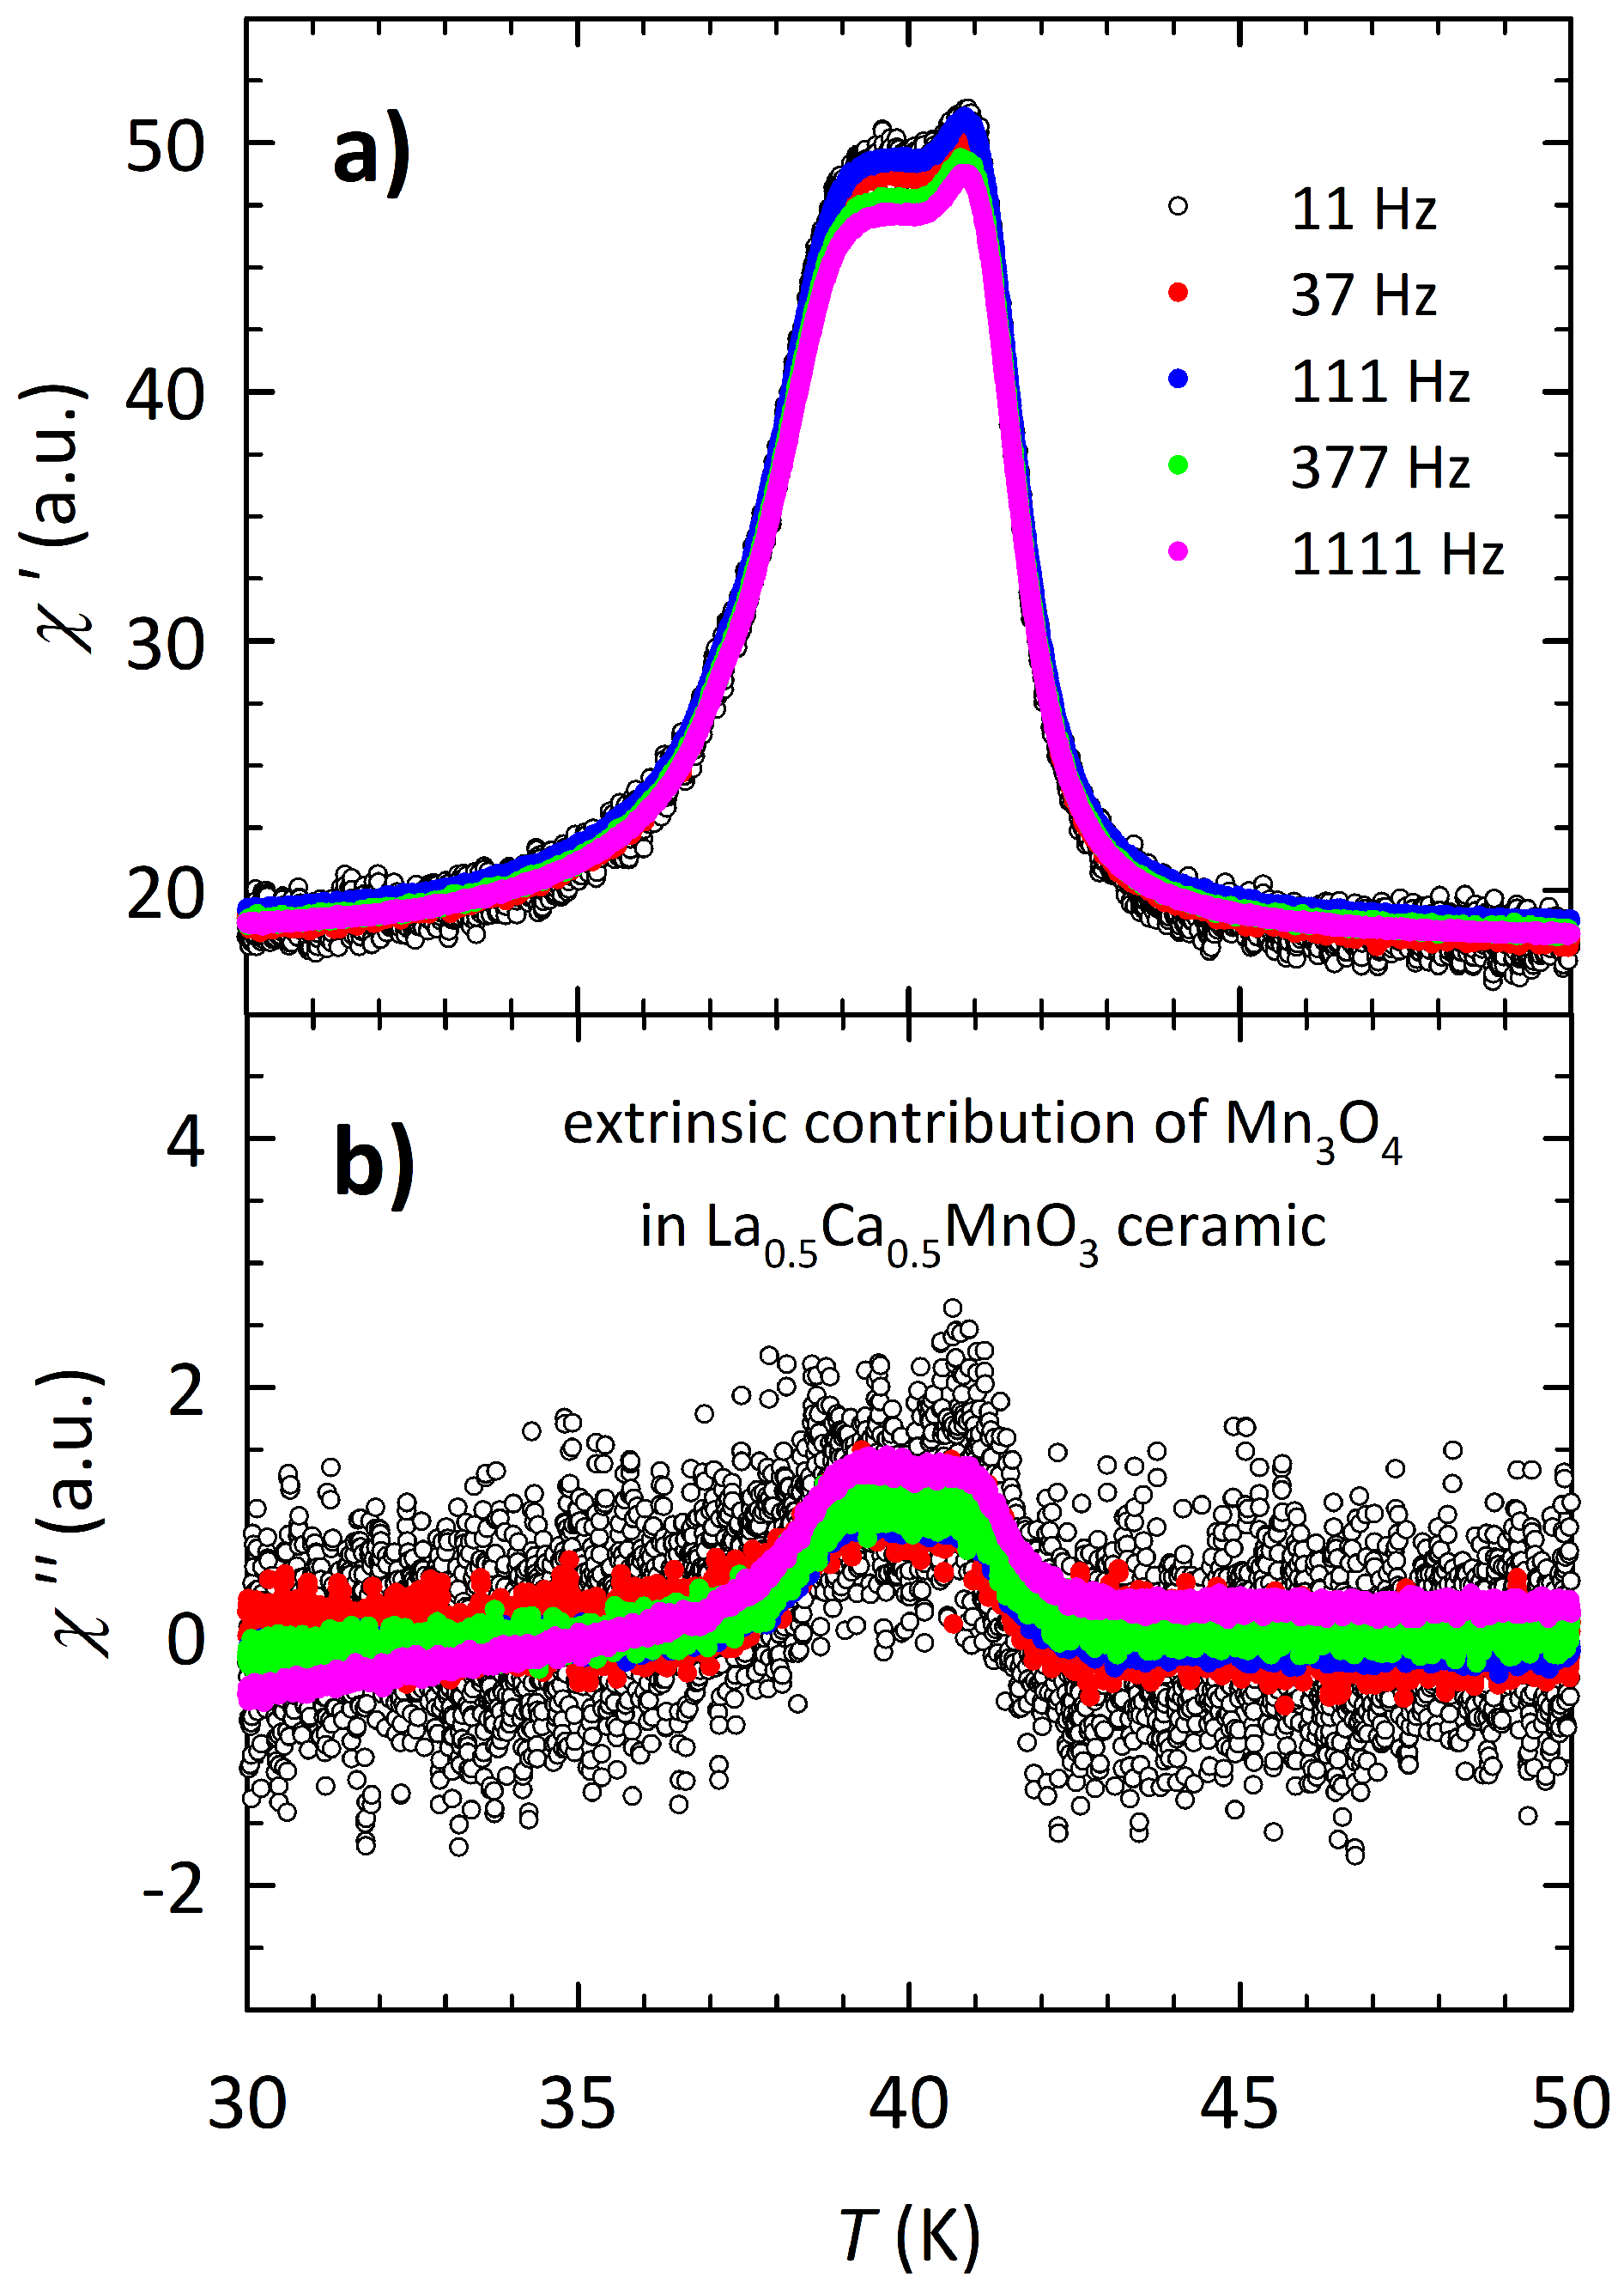
Appendix A. AC Susceptibility


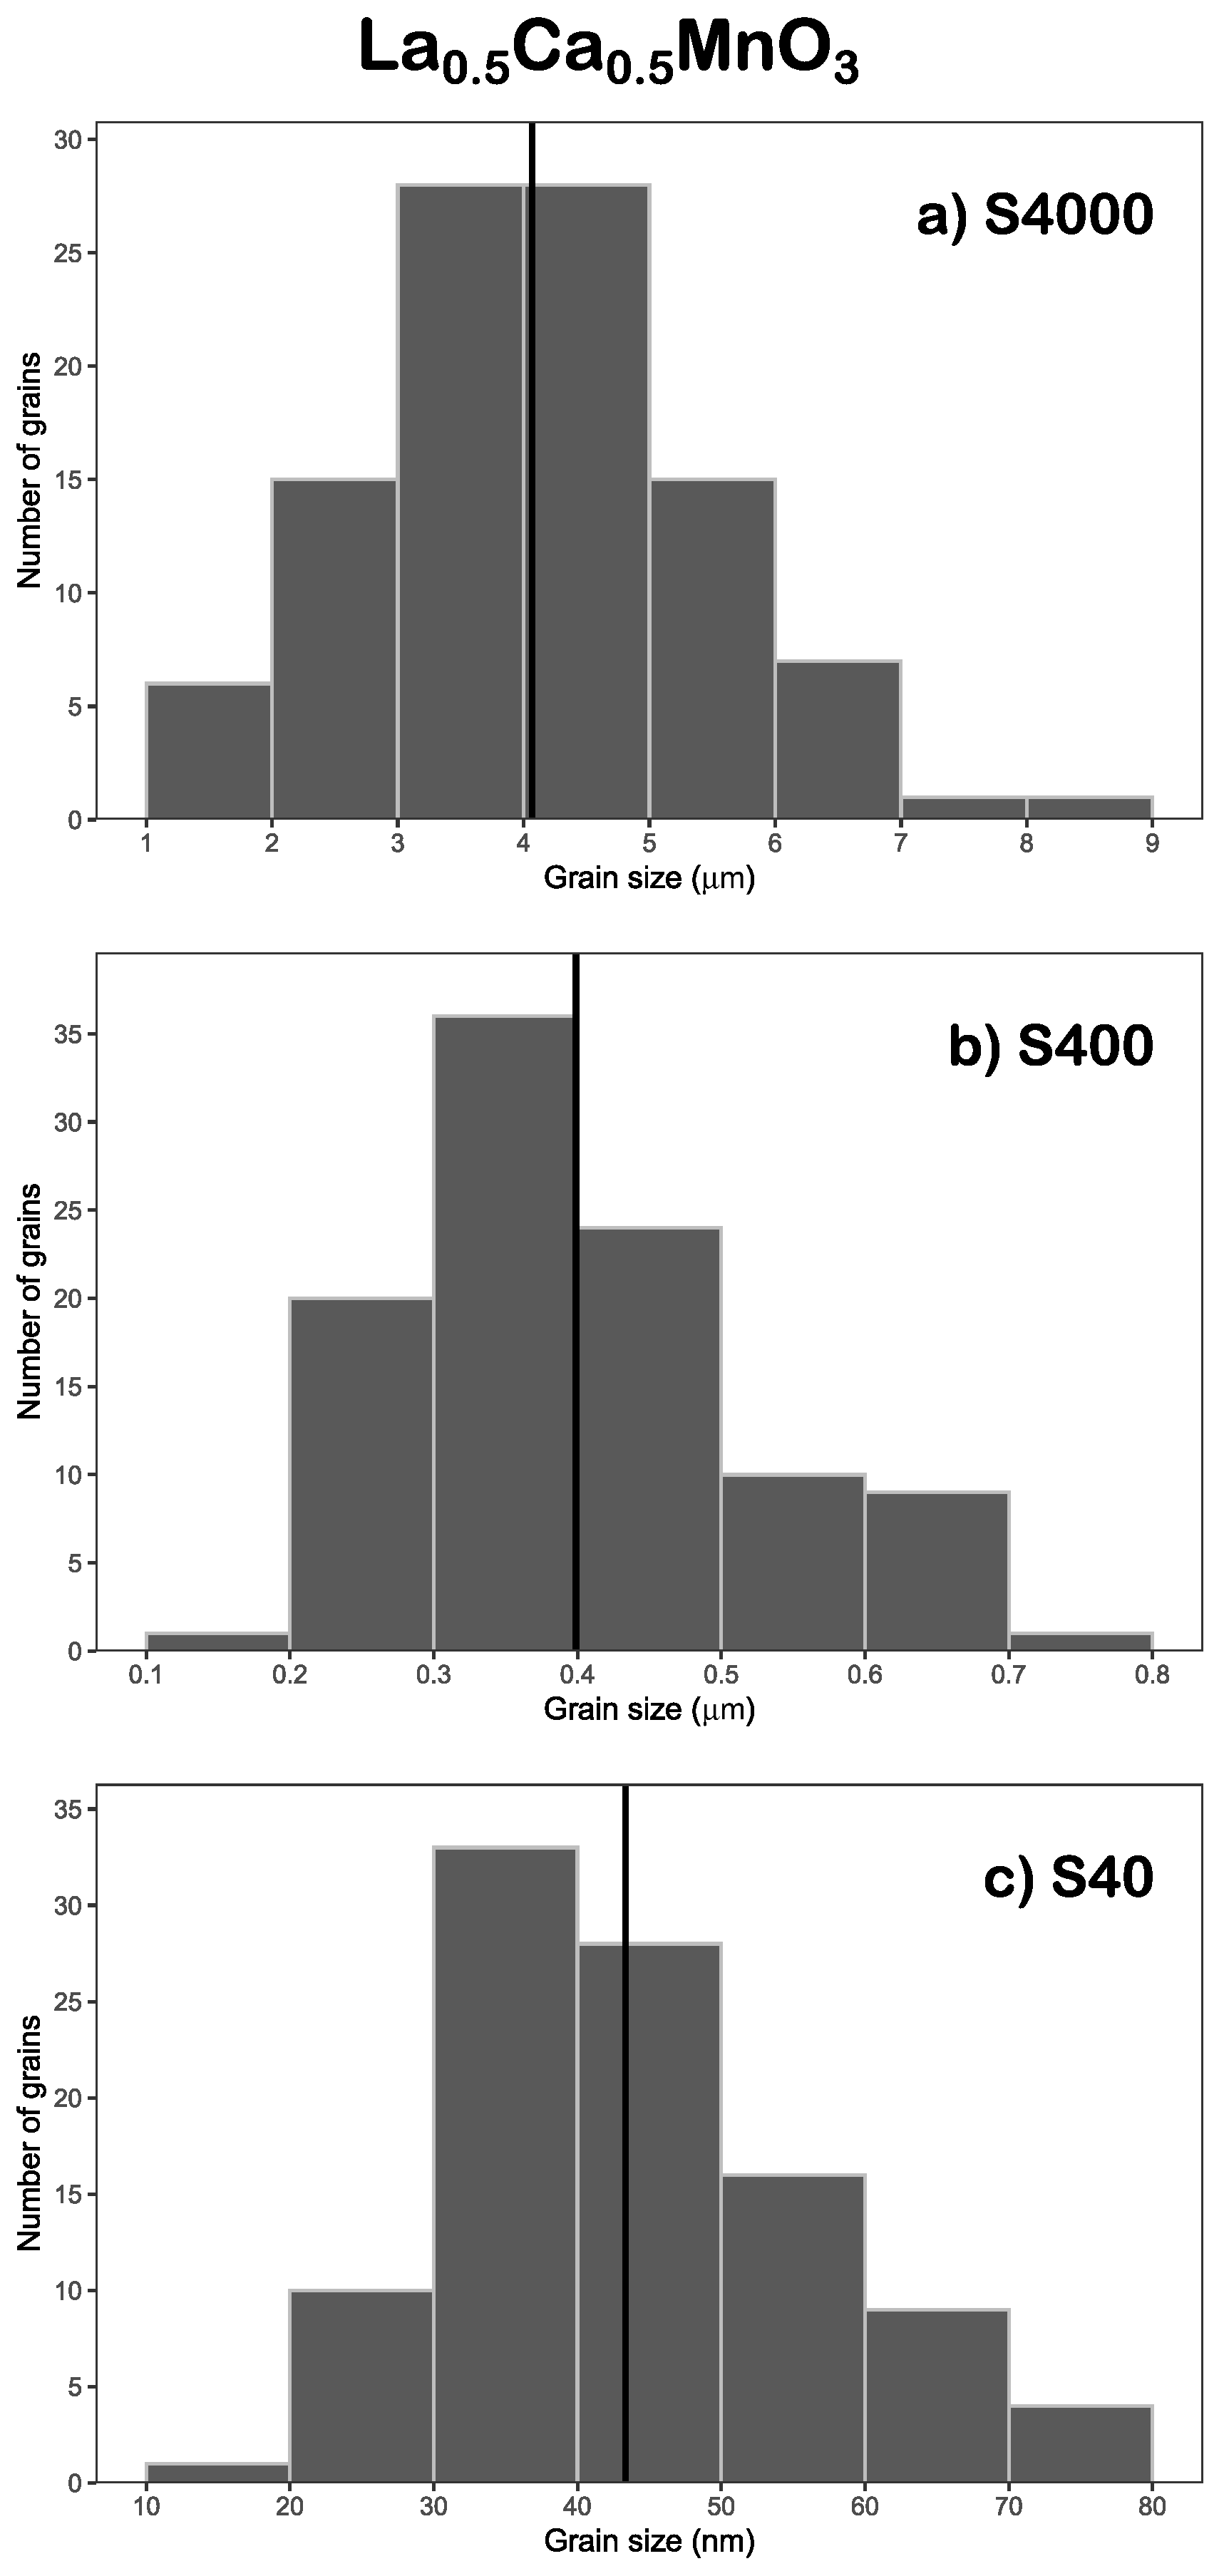
Appendix B. Grain Size Distribution

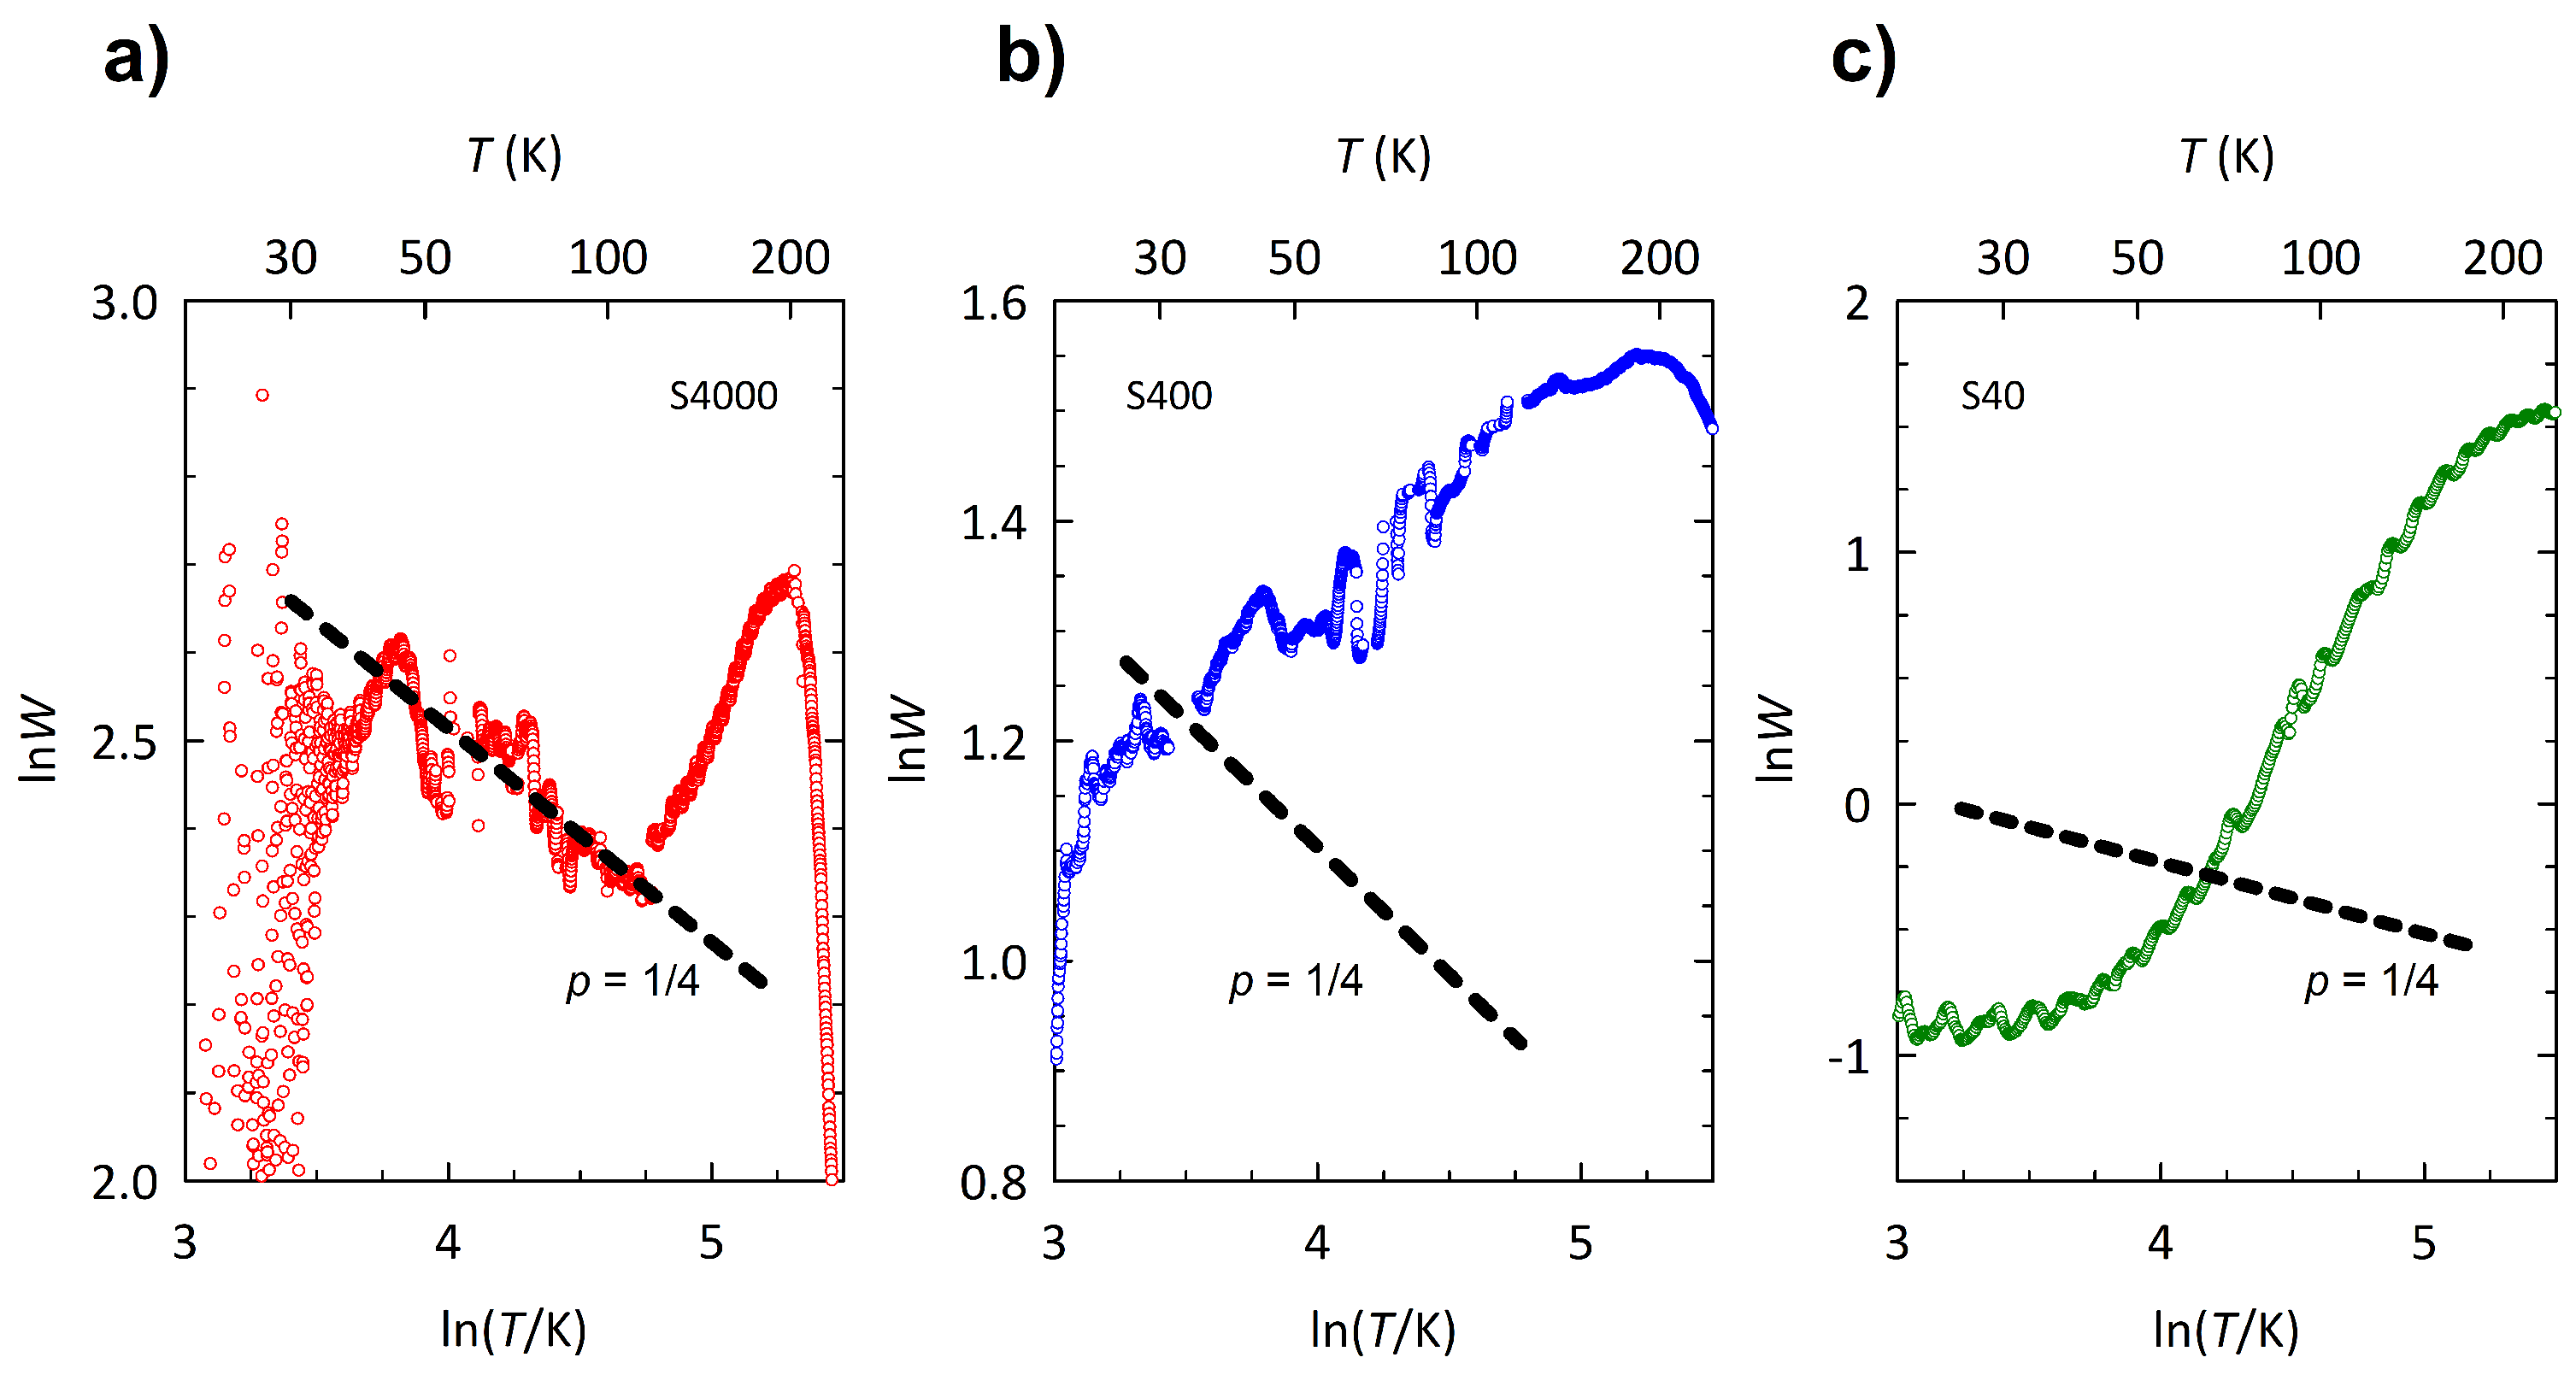
Appendix C. Fitting of Variable-Range-Hopping Mechanism

References
- Rao, C.N.R. Transition Metal Oxides. Annu. Rev. Phys. Chem. 1989, 40, 291–326. [Google Scholar] [CrossRef]
- Jonker, G.; Van Santen, J. Ferromagnetic compounds of manganese with perovskite structure. Physica 1950, 16, 337–349. [Google Scholar] [CrossRef]
- Jin, S.; Tiefel, T.H.; McCormack, M.; Fastnacht, R.A.; Ramesh, R.; Chen, L.H. Thousandfold Change in Resistivity in Magnetoresistive La-Ca-Mn-O Films. Science 1994, 264, 413–415. [Google Scholar] [CrossRef] [PubMed]
- Xiong, G.C.; Li, Q.; Ju, H.L.; Mao, S.N.; Senapati, L.; Xi, X.X.; Greene, R.L.; Venkatesan, T. Giant magnetoresistance in epitaxial Nd0.7Sr0.3MnO3−δ thin films. Appl. Phys. Lett. 1995, 66, 1427–1429. [Google Scholar] [CrossRef]
- Dagotto, E.; Hotta, T.; Moreo, A. Colossal magnetoresistant materials: The key role of phase separation. Phys. Rep. 2001, 344, 1–153. [Google Scholar] [CrossRef]
- Nagaev, E. Colossal-magnetoresistance materials: Manganites and conventional ferromagnetic semiconductors. Phys. Rep. 2001, 346, 387–531. [Google Scholar] [CrossRef]
- Salamon, M.B.; Jaime, M. The physics of manganites: Structure and transport. Rev. Mod. Phys. 2001, 73, 583–628. [Google Scholar] [CrossRef]
- Imada, M.; Fujimori, A.; Tokura, Y. Metal–insulator transitions. Rev. Mod. Phys. 1998, 70, 1039–1263. [Google Scholar] [CrossRef]
- Cheong, S.W.; Hwang, H.Y. Ferromagnetism vs. Charge/Orbital Ordering in Mixed-Valent Manganites. In Colossal Magnetoresistive Oxides; Tokura, Y., Ed.; Gordon and Breach: London, UK, 1999. [Google Scholar]
- Kováčik, R.; Ederer, C. Effect of Hubbard U on the construction of low-energy Hamiltonians for LaMnO3 via maximally localized Wannier functions. Phys. Rev. B 2011, 84, 075118. [Google Scholar] [CrossRef]
- Nguyen, T.T.; Bach, T.C.; Pham, H.T.; Pham, T.T.; Nguyen, D.T.; Hoang, N.N. Magnetic state of the bulk, surface and nanoclusters of CaMnO3: A DFT study. Phys. Condens. Matter 2011, 406, 3613–3621. [Google Scholar] [CrossRef]
- Zener, C. Interaction between the d-Shells in the Transition Metals. II. Ferromagnetic Compounds of Manganese with Perovskite Structure. Phys. Rev. 1951, 82, 403–405. [Google Scholar] [CrossRef]
- Anderson, P.W.; Hasegawa, H. Considerations on Double Exchange. Phys. Rev. 1955, 100, 675–681. [Google Scholar] [CrossRef]
- Kubo, K.; Ohata, N. A Quantum Theory of Double Exchange. I. J. Phys. Soc. Jpn. 1972, 33, 21–32. [Google Scholar] [CrossRef]
- Ohtaki, M.; Koga, H.; Tokunaga, T.; Eguchi, K.; Arai, H. Electrical Transport Properties and High-Temperature Thermoelectric Performance of (Ca0.9M0.1)MnO3 (M = Y, La, Ce, Sm, In, Sn, Sb, Pb, Bi). J. Solid State Chem. 1995, 120, 105–111. [Google Scholar] [CrossRef]
- Jaime, M.; Salamon, M.B.; Pettit, K.; Rubinstein, M.; Treece, R.E.; Horwitz, J.S.; Chrisey, D.B. Magnetothermopower in La0.67Ca0.33MnO3 thin films. Appl. Phys. Lett. 1996, 68, 1576–1578. [Google Scholar] [CrossRef]
- Jaime, M.; Hardner, H.T.; Salamon, M.B.; Rubinstein, M.; Dorsey, P.; Emin, D. Hall-Effect Sign Anomaly and Small-Polaron Conduction in (La1−xGdx)0.67Ca0.33MnO3. Phys. Rev. Lett. 1997, 78, 951–954. [Google Scholar] [CrossRef]
- Palstra, T.T.M.; Ramirez, A.P.; Cheong, S.W.; Zegarski, B.R.; Schiffer, P.; Zaanen, J. Transport mechanisms in doped LaMnO3: Evidence for polaron formation. Phys. Rev. B 1997, 56, 5104–5107. [Google Scholar] [CrossRef]
- Chun, S.H.; Salamon, M.B.; Han, P.D. Hall effect of La2/3(Ca,Pb)1/3MnO3 single crystals. J. Appl. Phys. 1999, 85, 5573–5575. [Google Scholar] [CrossRef]
- Millis, A.J. Lattice effects in magnetoresistive manganese perovskites. Nature 1998, 392, 147–150. [Google Scholar] [CrossRef]
- Wollan, E.O.; Koehler, W.C. Neutron Diffraction Study of the Magnetic Properties of the Series of Perovskite-Type Compounds [(1 − x) La, x Ca]MnO3. Phys. Rev. 1955, 100, 545–563. [Google Scholar] [CrossRef]
- Ramirez, A.P.; Schiffer, P.; Cheong, S.W.; Chen, C.H.; Bao, W.; Palstra, T.T.M.; Gammel, P.L.; Bishop, D.J.; Zegarski, B. Thermodynamic and Electron Diffraction Signatures of Charge and Spin Ordering in La1−xCaxMnO3. Phys. Rev. Lett. 1996, 76, 3188–3191. [Google Scholar] [CrossRef] [PubMed]
- Chen, C.H.; Cheong, S.W. Commensurate to Incommensurate Charge Ordering and Its Real-Space Images in La0.5Ca0.5MnO3. Phys. Rev. Lett. 1996, 76, 4042–4045. [Google Scholar] [CrossRef] [PubMed]
- Mori, S.; Chen, C.H.; Cheong, S.W. Pairing of charge-ordered stripes in (La,Ca)MnO3. Nature 1998, 392, 473–476. [Google Scholar] [CrossRef]
- Zang, J.; Bishop, A.R.; Röder, H. Double degeneracy and Jahn-Teller effects in colossal-magnetoresistance perovskites. Phys. Rev. B 1996, 53, R8840–R8843. [Google Scholar] [CrossRef]
- Mishra, S.K.; Pandit, R.; Satpathy, S. Mean-field theory of charge ordering and phase transitions in the colossal-magnetoresistive manganites. J. Physics Condens. Matter 1999, 11, 8561–8578. [Google Scholar] [CrossRef]
- Hotta, T.; Malvezzi, A.L.; Dagotto, E. Charge-orbital ordering and phase separation in the two-orbital model for manganites: Roles of Jahn-Teller phononic and Coulombic interactions. Phys. Rev. B 2000, 62, 9432–9452. [Google Scholar] [CrossRef]
- Zimmermann, M.v.; Hill, J.P.; Gibbs, D.; Blume, M.; Casa, D.; Keimer, B.; Murakami, Y.; Tomioka, Y.; Tokura, Y. Interplay between Charge, Orbital, and Magnetic Order in Pr1−xCaxMnO3. Phys. Rev. Lett. 1999, 83, 4872–4875. [Google Scholar] [CrossRef]
- Hotta, T.; Takada, Y.; Koizumi, H.; Dagotto, E. Topological Scenario for Stripe Formation in Manganese Oxides. Phys. Rev. Lett. 2000, 84, 2477–2480. [Google Scholar] [CrossRef]
- Goodenough, J.B. Theory of the Role of Covalence in the Perovskite-Type Manganites [La, M(II)]MnO3. Phys. Rev. 1955, 100, 564–573. [Google Scholar] [CrossRef]
- Bîrsan, E. The superexchange interaction influence on the magnetic ordering in manganites. J. Magn. Magn. Mater. 2008, 320, 646–650. [Google Scholar] [CrossRef]
- Yi, H.; Yu, J.; Lee, S.I. Suppression of ferromagnetic ordering in doped manganites: Effects of the superexchange interaction. Phys. Rev. B 2000, 61, 428–431. [Google Scholar] [CrossRef]
- Bao, W.; Axe, J.; Chen, C.; Cheong, S.W.; Schiffer, P.; Roy, M. From double exchange to superexchange in charge-ordering perovskite manganites. Phys. B Condens. Matter 1997, 241–243, 418–420. [Google Scholar] [CrossRef][Green Version]
- Dagotto, E. Open questions in CMR manganites, relevance of clustered states and analogies with other compounds including the cuprates. New J. Phys. 2005, 7, 67. [Google Scholar] [CrossRef]
- Dagotto, E. Nanoscale Phase Separation and Colossal Magnetoresistance; Springer Series in Solid-State Sciences; Springer: Berlin/Heidelberg, Germany, 2003; Volume 136. [Google Scholar] [CrossRef]
- Dagotto, E. Complexity in Strongly Correlated Electronic Systems. Science 2005, 309, 257–262. [Google Scholar] [CrossRef]
- Nagaev, E.L. Lanthanum manganites and other giant-magnetoresistance magnetic conductors. Physics-Uspekhi 1996, 39, 781–805. [Google Scholar] [CrossRef]
- Kagan, M.; Kugel, K.; Rakhmanov, A. Electronic phase separation: Recent progress in the old problem. Phys. Rep. 2021, 916, 1–105. [Google Scholar] [CrossRef]
- Zhang, P.; Chern, G.W. Arrested Phase Separation in Double-Exchange Models: Large-Scale Simulation Enabled by Machine Learning. Phys. Rev. Lett. 2021, 127, 146401. [Google Scholar] [CrossRef]
- Burgy, J.; Mayr, M.; Martin-Mayor, V.; Moreo, A.; Dagotto, E. Colossal Effects in Transition Metal Oxides Caused by Intrinsic Inhomogeneities. Phys. Rev. Lett. 2001, 87, 277202. [Google Scholar] [CrossRef]
- Zhang, P.; Saha, P.; Chern, G.W. Machine Learning Dynamics of Phase Separation in Correlated Electron Magnets. arXiv 2020, arXiv:2006.04205v1. [Google Scholar]
- Luo, J.; Chern, G.W. Dynamics of electronically phase-separated states in the double exchange model. Phys. Rev. B 2021, 103, 115137. [Google Scholar] [CrossRef]
- Pradhan, K.; Yunoki, S. Nanoclustering phase competition induces the resistivity hump in colossal magnetoresistive manganites. Phys. Rev. B 2017, 96, 214416. [Google Scholar] [CrossRef]
- Burgy, J.; Moreo, A.; Dagotto, E. Relevance of Cooperative Lattice Effects and Stress Fields in Phase-Separation Theories for CMR Manganites. Phys. Rev. Lett. 2004, 92, 097202. [Google Scholar] [CrossRef] [PubMed]
- Čulo, M.; Basletić, M.; Tafra, E.; Hamzić, A.; Tomić, S.; Fischgrabe, F.; Moshnyaga, V.; Korin-Hamzić, B. Magnetotransport properties of La1−xCaxMnO3 (0.52 ≤ x ≤ 0.75): Signature of phase coexistence. Thin Solid Films 2017, 631, 205–212. [Google Scholar] [CrossRef][Green Version]
- Freitas, R.; Ghivelder, L.; Levy, P.; Parisi, F. Magnetization studies of phase separation in La0.5Ca0.5MnO3. Phys. Rev. B 2002, 65, 104403. [Google Scholar] [CrossRef]
- Giri, S.K.; Nath, T.K. Suppression of Charge and Antiferromagnetic Ordering in La0.5Ca0.5MnO3 Nanoparticles. J. Nanosci. Nanotechnol. 2011, 11, 4806–4814. [Google Scholar] [CrossRef]
- Dhieb, S.; Krichene, A.; Boudjada, N.C.; Boujelben, W. Suppression of Metamagnetic Transitions of Martensitic Type by Particle Size Reduction in Charge-Ordered La0.5Ca0.5MnO3. J. Phys. Chem. C 2020, 124, 17762–17771. [Google Scholar] [CrossRef]
- Levy, P.; Parisi, F.; Polla, G.; Vega, D.; Leyva, G.; Lanza, H.; Freitas, R.; Ghivelder, L. Controlled phase separation in La0.5Ca0.5MnO3. Phys. Rev. B 2000, 62, 6437–6441. [Google Scholar] [CrossRef]
- Quintero, M.; Passanante, S.; Irurzun, I.; Goijman, D.; Polla, G. Grain size modification in the magnetocaloric and non-magnetocaloric transitions in La0.5Ca0.5MnO3 probed by direct and indirect methods. Appl. Phys. Lett. 2014, 105, 152411. [Google Scholar] [CrossRef]
- Gamzatov, A.G.; Batdalov, A.B.; Aliev, A.M.; Amirzadeh, P.; Kameli, P.; Ahmadvand, H.; Salamati, H. Influence of the granule size on the magnetocaloric properties of manganite La0.5Ca0.5MnO3. Phys. Solid State 2013, 55, 502–507. [Google Scholar] [CrossRef]
- Sarkar, T.; Ghosh, B.; Raychaudhuri, A.K.; Chatterji, T. Crystal structure and physical properties of half-doped manganite nanocrystals of less than 100-nm size. Phys. Rev. B 2008, 77, 235112. [Google Scholar] [CrossRef]
- Byczuk, K.; Hofstetter, W.; Vollhardt, D. Mott-Hubbard Transition versus Anderson Localization in Correlated Electron Systems with Disorder. Phys. Rev. Lett. 2005, 94, 056404. [Google Scholar] [CrossRef] [PubMed]
- Shinaoka, H.; Imada, M. Single-Particle Excitations under Coexisting Electron Correlation and Disorder: A Numerical Study of the Anderson–Hubbard Model. J. Phys. Soc. Jpn. 2009, 78, 094708. [Google Scholar] [CrossRef]
- Aguiar, M.C.O.; Dobrosavljević, V.; Abrahams, E.; Kotliar, G. Critical Behavior at the Mott-Anderson Transition: A Typical-Medium Theory Perspective. Phys. Rev. Lett. 2009, 102, 156402. [Google Scholar] [CrossRef] [PubMed]
- Di Sante, D.; Fratini, S.; Dobrosavljević, V.; Ciuchi, S. Disorder-Driven Metal-Insulator Transitions in Deformable Lattices. Phys. Rev. Lett. 2017, 118, 036602. [Google Scholar] [CrossRef] [PubMed]
- Worledge, D.C.; Snyder, G.J.; Beasley, M.R.; Geballe, T.H.; Hiskes, R.; DiCarolis, S. Anneal-tunable Curie temperature and transport of La0.67Ca0.33MnO3. J. Appl. Phys. 1996, 80, 5158–5161. [Google Scholar] [CrossRef]
- Coey, J.M.D.; Viret, M.; von Molnár, S. Mixed-valence manganites. Adv. Phys. 1999, 48, 167–293. [Google Scholar] [CrossRef]
- Zhou, H.D.; Zheng, R.K.; Li, G.; Feng, S.J.; Liu, F.; Fan, X.J.; Li, X.G. Transport properties of La1−xCaxMnO3 (0.5 ≤ x < 1). Eur. Phys. J. B 2002, 26, 467–471. [Google Scholar] [CrossRef]
- Mott, N.F.; Davis, E.A. Electronic Processes in Non-Crystalline Materials, 2nd ed.; International Series of Monographs on Physics, Clarendon Press: Oxford, UK, 2012. [Google Scholar]
- Lu, C.L.; Dong, S.; Wang, K.F.; Gao, F.; Li, P.L.; Lv, L.Y.; Liu, J.M. Charge-order breaking and ferromagnetism in La0.4Ca0.6MnO3 nanoparticles. Appl. Phys. Lett. 2007, 91, 032502. [Google Scholar] [CrossRef]
- Rozenberg, E.; Auslender, M.; Shames, A.I.; Mogilyansky, D.; Felner, I.; Sominskii, E.; Gedanken, A.; Mukovskii, Y.M. Nanometer size effect on magnetic order in La0.4Ca0.6MnO3: Predominant influence of doped electron localization. Phys. Rev. B 2008, 78, 052405. [Google Scholar] [CrossRef]
- Zhang, T.; Zhou, T.F.; Qian, T.; Li, X.G. Particle size effects on interplay between charge ordering and magnetic properties in nanosized La0.25Ca0.75MnO3. Phys. Rev. B 2007, 76, 174415. [Google Scholar] [CrossRef]
- Zhang, T.; Dressel, M. Grain-size effects on the charge ordering and exchange bias in Pr0.5Ca0.5MnO3: The role of spin configuration. Phys. Rev. B 2009, 80, 014435. [Google Scholar] [CrossRef]
- Sarkar, T.; Mukhopadhyay, P.K.; Raychaudhuri, A.K.; Banerjee, S. Structural, magnetic, and transport properties of nanoparticles of the manganite Pr0.5Ca0.5MnO3. J. Appl. Phys. 2007, 101, 124307. [Google Scholar] [CrossRef]
- Rao, S.S.; Tripathi, S.; Pandey, D.; Bhat, S.V. Suppression of charge order, disappearance of antiferromagnetism, and emergence of ferromagnetism in Nd0.5Ca0.5MnO3 nanoparticles. Phys. Rev. B 2006, 74, 144416. [Google Scholar] [CrossRef]
- Boucher, B.; Buhl, R.; Perrin, M. Magnetic Structure of Mn3O4 by Neutron Diffraction. J. Appl. Phys. 1971, 42, 1615–1617. [Google Scholar] [CrossRef]
- Narayani, L.; Jagadeesha Angadi, V.; Sukhdev, A.; Challa, M.; Matteppanavar, S.; Deepthi, P.; Mohan Kumar, P.; Pasha, M. Mechanism of high temperature induced phase transformation and magnetic properties of Mn3O4 crystallites. J. Magn. Magn. Mater. 2019, 476, 268–273. [Google Scholar] [CrossRef]
- Filippetti, A.; Hill, N.A. First principles study of structural, electronic and magnetic interplay in ferroelectromagnetic yttrium manganite. J. Magn. Magn. Mater. 2001, 236, 176–189. [Google Scholar] [CrossRef]
- Tomuta, D.G.; Ramakrishnan, S.; Nieuwenhuys, G.J.; Mydosh, J.A. The magnetic susceptibility, specific heat and dielectric constant of hexagonal YMnO3, LuMnO3 and ScMnO3. J. Physics Condens. Matter 2001, 13, 4543–4552. [Google Scholar] [CrossRef]
- Počuča-Nešić, M.; Marinković-Stanojević, Z.; Cotič-Smole, P.; Dapčević, A.; Tasić, N.; Branković, G.; Branković, Z. Processing and properties of pure antiferromagnetic h-YMnO3. Process. Appl. Ceram. 2019, 13, 427–434. [Google Scholar] [CrossRef]
- Zhang, J.; Yu, L.; Cao, G.; Yu, Q.; Chen, M.; Cao, S. Cluster coexistence state in strongly correlation La0.5Ca0.5MnO3 manganites. Phys. B Condens. Matter 2008, 403, 1650–1651. [Google Scholar] [CrossRef]
- Cao, G.; Zhang, J.; Wang, S.; Yu, J.; Jing, C.; Cao, S.; Shen, X. Reentrant spin glass behavior in CE-type AFM Pr0.5Ca0.5MnO3 manganite. J. Magn. Magn. Mater. 2006, 301, 147–154. [Google Scholar] [CrossRef]
- Lees, M.R.; Barratt, J.; Balakrishnan, G.; Paul, D.M.; Dewhurst, C.D. Low-temperature magnetoresistance and magnetic ordering in Pr1−xCaxMnO3. J. Physics Condens. Matter 1996, 8, 2967–2979. [Google Scholar] [CrossRef]
- Wang, K.F.; Wang, Y.; Wang, L.F.; Dong, S.; Li, D.; Zhang, Z.D.; Yu, H.; Li, Q.C.; Liu, J.M. Cluster-glass state in manganites induced by A-site cation-size disorder. Phys. Rev. B 2006, 73, 134411. [Google Scholar] [CrossRef]
- Lee, P.A.; Ramakrishnan, T.V. Disordered electronic systems. Rev. Mod. Phys. 1985, 57, 287–337. [Google Scholar] [CrossRef]
- Bałanda, M. AC Susceptibility Studies of Phase Transitions and Magnetic Relaxation: Conventional, Molecular and Low-Dimensional Magnets. Acta Phys. Pol. A 2013, 124, 964–976. [Google Scholar] [CrossRef]
- Topping, C.V.; Blundell, S.J. A.C. susceptibility as a probe of low-frequency magnetic dynamics. J. Phys. Condens. Matter 2019, 31, 013001. [Google Scholar] [CrossRef]
- Vincent, E.; Dupuis, V. Spin glasses: Experimental signatures and salient outcomes. In Frustrated Materials and Ferroic Glasses; Lookman, T., Ren, X., Eds.; Springer Series in Materials Science; Springer: Berlin/Heidelberg, Germany, 2017. [Google Scholar]
- Joung, D.; Khondaker, S.I. Efros-Shklovskii variable-range hopping in reduced graphene oxide sheets of varying carbon sp2 fraction. Phys. Rev. B 2012, 86, 235423. [Google Scholar] [CrossRef]
- Khondaker, S.I.; Shlimak, I.S.; Nicholls, J.T.; Pepper, M.; Ritchie, D.A. Two-dimensional hopping conductivity in a δ-doped GaAs/AlxGa1−xAs heterostructure. Phys. Rev. B 1999, 59, 4580–4583. [Google Scholar] [CrossRef]
- Khondaker, S.; Shlimak, I.; Nicholls, J.; Pepper, M.; Ritchie, D. Crossover phenomenon for two-dimensional hopping conductivity and density-of-states near the Fermi level. Solid State Commun. 1999, 109, 751–756. [Google Scholar] [CrossRef]
- Chuang, C.; Puddy, R.; Lin, H.D.; Lo, S.T.; Chen, T.M.; Smith, C.; Liang, C.T. Experimental evidence for Efros–Shklovskii variable range hopping in hydrogenated graphene. Solid State Commun. 2012, 152, 905–908. [Google Scholar] [CrossRef]
- Zabrodskii, A.G. The Coulomb gap: The view of an experimenter. Philos. Mag. B 2001, 81, 1131–1151. [Google Scholar] [CrossRef]


| Sample Label | Grain Size (nm) | Crystallite Size (nm) | a (Å) | b (Å) | c (Å) |
|---|---|---|---|---|---|
| S4000 | 5.4099(3) | 7.6240(4) | 5.4183(3) | ||
| S400 | 5.464(2) | 7.787(3) | 5.504(2) | ||
| S40 | 5.502(3) | 7.786(4) | 5.424(3) |
Publisher’s Note: MDPI stays neutral with regard to jurisdictional claims in published maps and institutional affiliations. |
© 2022 by the authors. Licensee MDPI, Basel, Switzerland. This article is an open access article distributed under the terms and conditions of the Creative Commons Attribution (CC BY) license (https://creativecommons.org/licenses/by/4.0/).
Share and Cite
Novosel, N.; Rivas Góngora, D.; Jagličić, Z.; Tafra, E.; Basletić, M.; Hamzić, A.; Klaser, T.; Skoko, Ž.; Salamon, K.; Kavre Piltaver, I.; et al. Grain-Size-Induced Collapse of Variable Range Hopping and Promotion of Ferromagnetism in Manganite La0.5Ca0.5MnO3. Crystals 2022, 12, 724. https://doi.org/10.3390/cryst12050724
Novosel N, Rivas Góngora D, Jagličić Z, Tafra E, Basletić M, Hamzić A, Klaser T, Skoko Ž, Salamon K, Kavre Piltaver I, et al. Grain-Size-Induced Collapse of Variable Range Hopping and Promotion of Ferromagnetism in Manganite La0.5Ca0.5MnO3. Crystals. 2022; 12(5):724. https://doi.org/10.3390/cryst12050724
Chicago/Turabian StyleNovosel, Nikolina, David Rivas Góngora, Zvonko Jagličić, Emil Tafra, Mario Basletić, Amir Hamzić, Teodoro Klaser, Željko Skoko, Krešimir Salamon, Ivna Kavre Piltaver, and et al. 2022. "Grain-Size-Induced Collapse of Variable Range Hopping and Promotion of Ferromagnetism in Manganite La0.5Ca0.5MnO3" Crystals 12, no. 5: 724. https://doi.org/10.3390/cryst12050724
APA StyleNovosel, N., Rivas Góngora, D., Jagličić, Z., Tafra, E., Basletić, M., Hamzić, A., Klaser, T., Skoko, Ž., Salamon, K., Kavre Piltaver, I., Petravić, M., Korin-Hamzić, B., Tomić, S., Gorshunov, B. P., Zhang, T., Ivek, T., & Čulo, M. (2022). Grain-Size-Induced Collapse of Variable Range Hopping and Promotion of Ferromagnetism in Manganite La0.5Ca0.5MnO3. Crystals, 12(5), 724. https://doi.org/10.3390/cryst12050724