Article

Effect of Gold Nanoparticles on the Crystallization and Optical Properties of Glass in ZnO-MgO-Al2O3-SiO2 System

1
Department of Glass and Glass-ceramics, Mendeleev University of Chemical Technology, Miusskaya Sq., 9, 125047 Moscow, Russia
2
Physical Department, Southern Federal University, Zorge Street 5, 344090 Rostov-on-Don, Russia
3
P. N. Lebedev Physical Institute, Russian Academy of Sciences, Leninskiy Av., 53, 119333 Moscow, Russia
4
Institute of Physics and Applied Mathematics, National Research University of Electronic Technology (MIET), Shokin Square, Bld. 1, Zelenograd, 124498 Moscow, Russia
5
Scientific Research Institute of Physical Problems Named after F.V. Lukin, Pass. 4806, Bld. 6, Zelenograd, 124498 Moscow, Russia
*
Author to whom correspondence should be addressed.
Crystals 2022, 12(2), 287; https://doi.org/10.3390/cryst12020287
Submission received: 30 January 2022 / Revised: 12 February 2022 / Accepted: 17 February 2022 / Published: 18 February 2022
(This article belongs to the Special Issue Mineralogical Crystallography (2nd Edition))

Abstract

:
Gold nanoparticles precipitated in transparent glass-ceramics could pave the way for the development of multifunctional materials that are in demand in modern photonics and optics. In this work, we explored the effect of gold nanoparticles on the crystallization, microstructure, and optical properties of ZnO-MgO-Al2O3-SiO2 glass containing TiO2 and ZrO2 as nucleating agents. X-ray diffraction, transmission electron microscopy, Raman, and optical spectroscopy were used for the study. We showed that gold nanoparticles have no effect on the formation of gahnite nanocrystals during the glass heat treatments, while optical properties of the glass-ceramics are strongly dependent on the gold addition. A computational model was developed to predict optical properties of glass during the crystallization, and the possibility for adjusting the localized surface plasmon resonance band position with the heat treatment temperature was shown.

1. Introduction

Research and development in the field of new optical materials are becoming especially important today, in an era of challenges in the field of photonics and integrated optics [1]. In addition to optical materials based on glasses, crystals, and polymers, transparent glass-ceramics, which combine the properties of various materials, are beginning to play an increasingly important role in optical materials science [2,3]. Transparent glass-ceramics are multiphase materials that consist of crystallites distributed in a glass matrix; the unique properties of transparent glass-ceramics are achieved due to the small size of crystallites, their chemical content and structure, and chemical composition of the residual glassy phase also plays an important role [4].
The phases formed in glass-ceramics can be oxide and non-oxide crystallites, metal nanoparticles (NPs), clusters, or semiconductor quantum dots [4]. The precipitation of different crystallites in transparent glass-ceramics is being actively studied to develop new light-emitting and laser media [5,6,7], materials with controlled values of the thermal expansion coefficient [8], and high-strength transparent cover materials [9,10,11]. Similarly, glass-ceramics based on metal NPs (mainly silver or gold) are in great demand as new nonlinear optical and plasmonic materials [12,13,14,15,16]. Moreover, glass-ceramics with metal NPs are promising systems for the implicating of the effect of rare-earth ion fluorescence enhancement [17], and different combinations of the interaction between NPs and rare-earth ions have been demonstrated to modify the spectral properties of glass-ceramics [18,19,20,21].
However, the study of glass-ceramics, in which crystalline phases of various types are precipitated simultaneously, has received quite little attention, despite the fact that the combination of various crystallites in a glass matrix can lead to the creation of glass-ceramics with a wide range of properties [22,23]. Moreover, it is known that metal NPs can also act as crystallization catalysts in the production of glass-ceramics during heat treatment [24]. Few works have been devoted to the study of gold NPs on crystallization, microstructure, and thermal and mechanical properties of glass-ceramics. M. Garai et al. showed that microstructural variation caused by gold NPs in silicate glass-ceramics significantly affects the thermal and mechanical properties [25]. The strong effect of gold NPs on the crystallization kinetics as well as microstructure and thermal and mechanical properties was also observed during the preparation of mica glass-ceramics [26,27]. Kochetkov et al. reported that precipitation of gold NPs plays the main role in the process of the heterogeneous lithium disilicate crystallization in glass; it was found that regions with an elevated concentration of lithium ions formed around colloidal gold particles [28]. Accelerated crystal growth in the gold-doped glass-ceramics was observed by Thieme et al. during heat treatments of zinc-silicate glass [29]. Gold NPs were also introduced in the silicate glass-ceramics to establish their solid oxide fuel cell sealing ability, while no effect of NPs on the crystallization kinetics was reported [30]. Kracker et al. reported on the detailed study of the optical properties of gold NPs precipitated in the silicate glass-ceramics with low thermal expansion, whereas no data were provided on the influence of gold NPs on the microstructure of the glass-ceramics [31]. This implies that gold NPs definitely have an effect on the crystallization and properties of glass-ceramics, but more work is needed to further explore this area for the development of new multifunctional transparent glass-ceramics.
Recently, we showed that gold NPs precipitated in the phase-separated glasses and glass-ceramics of the ZnO-MgO-Al2O3-SiO2 system containing TiO2 and ZrO2 demonstrate tunable position of the localized surface plasmon resonance (LSPR) [32]. The present study aims to explore the effect of gold NPs on the crystallization, microstructure, and optical properties of the mentioned glass system. Appropriate investigation techniques were used to evaluate the role of gold-doping in the glass-ceramics production process.

2. Materials and Methods

2.1. Glass Synthesis

In this work we synthesized glasses in the ZnO-MgO-Al2O3-SiO2 system containing SnO2, Na2O, TiO2 and ZrO2 oxides with the chemical composition described in the previous work [32]. We added 0.2 g of HAuCl4 to the glass batch for the Au-doping of glass (designated as Au-doped) and did not add gold for the Au-free glass (designated as Matrix). Glass batch was calculated to prepare 1000 g of bulk glass.
The process of the glass synthesis was described previously [32] and represents traditional melt-quenching technique with the subsequent annealing to reduce residual stress. Obtained glass samples were transparent and free of defects.

2.2. Glass Characterization

The visual appearance of the samples was captured by digital camera. For the density determination of studied samples Archimedes method with distilled water was used.
For the determination of the glass transition temperature (Tg) and the crystallization temperature (TC) differential scanning calorimetry (DSC) was used. Bulk glass samples of about 20 mg in weight were loaded in the platinum crucible and heated in the simultaneous thermal analyzer NETZSCH STA 449 F3 Jupiter (NETZSCH-Gerätebau, Selb, Germany) with a dynamic flow atmosphere of Ar. The temperature range was from room temperature to 950 °C with a heating rate of 10 °C/min.
X-ray diffraction patterns (XRD) of powdered samples were recorded by means of a diffractometer Bruker D2 Phaser (Bruker AXS GmbH, Karlsruhe, Germany) employing nickel-filtered CuKα radiation. Crystal phases were identified by comparing the peak position and relative intensities in the XRD pattern with the ICDD PDF-2 database (release 2011). The mean crystallite size was estimated from broadening of the XRD peak at about 37° according to Scherrer’s equation:
D = K λ Δ cos θ ,
where λ is the wavelength of the X-ray radiation (1.5406 Å), θ is the diffraction angle, Δ is the width of the peak at half of its maximum and K is the constant assumed to be 1 [33]. The crystallized fraction was evaluated as 100·(Ap/Ax), where Ax and Ap are the area of the whole XRD pattern (without background) and the area of the peaks considered as the area outside of the broad amorphous XRD pattern, respectively. Indicated areas were calculated (in cps × degrees) using DIFFRAC.EVA software [1].
The microstructure of the samples was studied by high-resolution transmission electron microscopy (HRTEM) with the transmission electron microscope FEI Tecnai G2 20 S-Twin (FEI, Hillsboro, OR, USA), in 200 kV mode. Bulk glass samples were grounded in an agate mortar to fine powders and dispersed in ethanol. The obtained solution was dropped on a microscope grid which was dried for 20 min. The HRTEM images were analyzed with the ImageJ software (version 1.53n. https://imagej.nih.gov/ij/ (accessed on 20 January 2022)).
Spectroscopy studies were performed using Raman and optical spectroscopy. For the first NTEGRA Spectra spectrometer (NT-MDT, Zelenograd, Moscow, Russia) with the Ar laser beam (488 nm excitation wavelength) was used and for the last Shimadzu UV-3600 spectrophotometer (Shimadzu, Kyoto, Japan) was used. Double-sided polished samples were utilized for the spectroscopy studies. The glass refractive index was determined by an ATAGO DR-M4 Abbe refractometer (ATAGO Co., Tokyo, Japan).

3. Results and Discussion

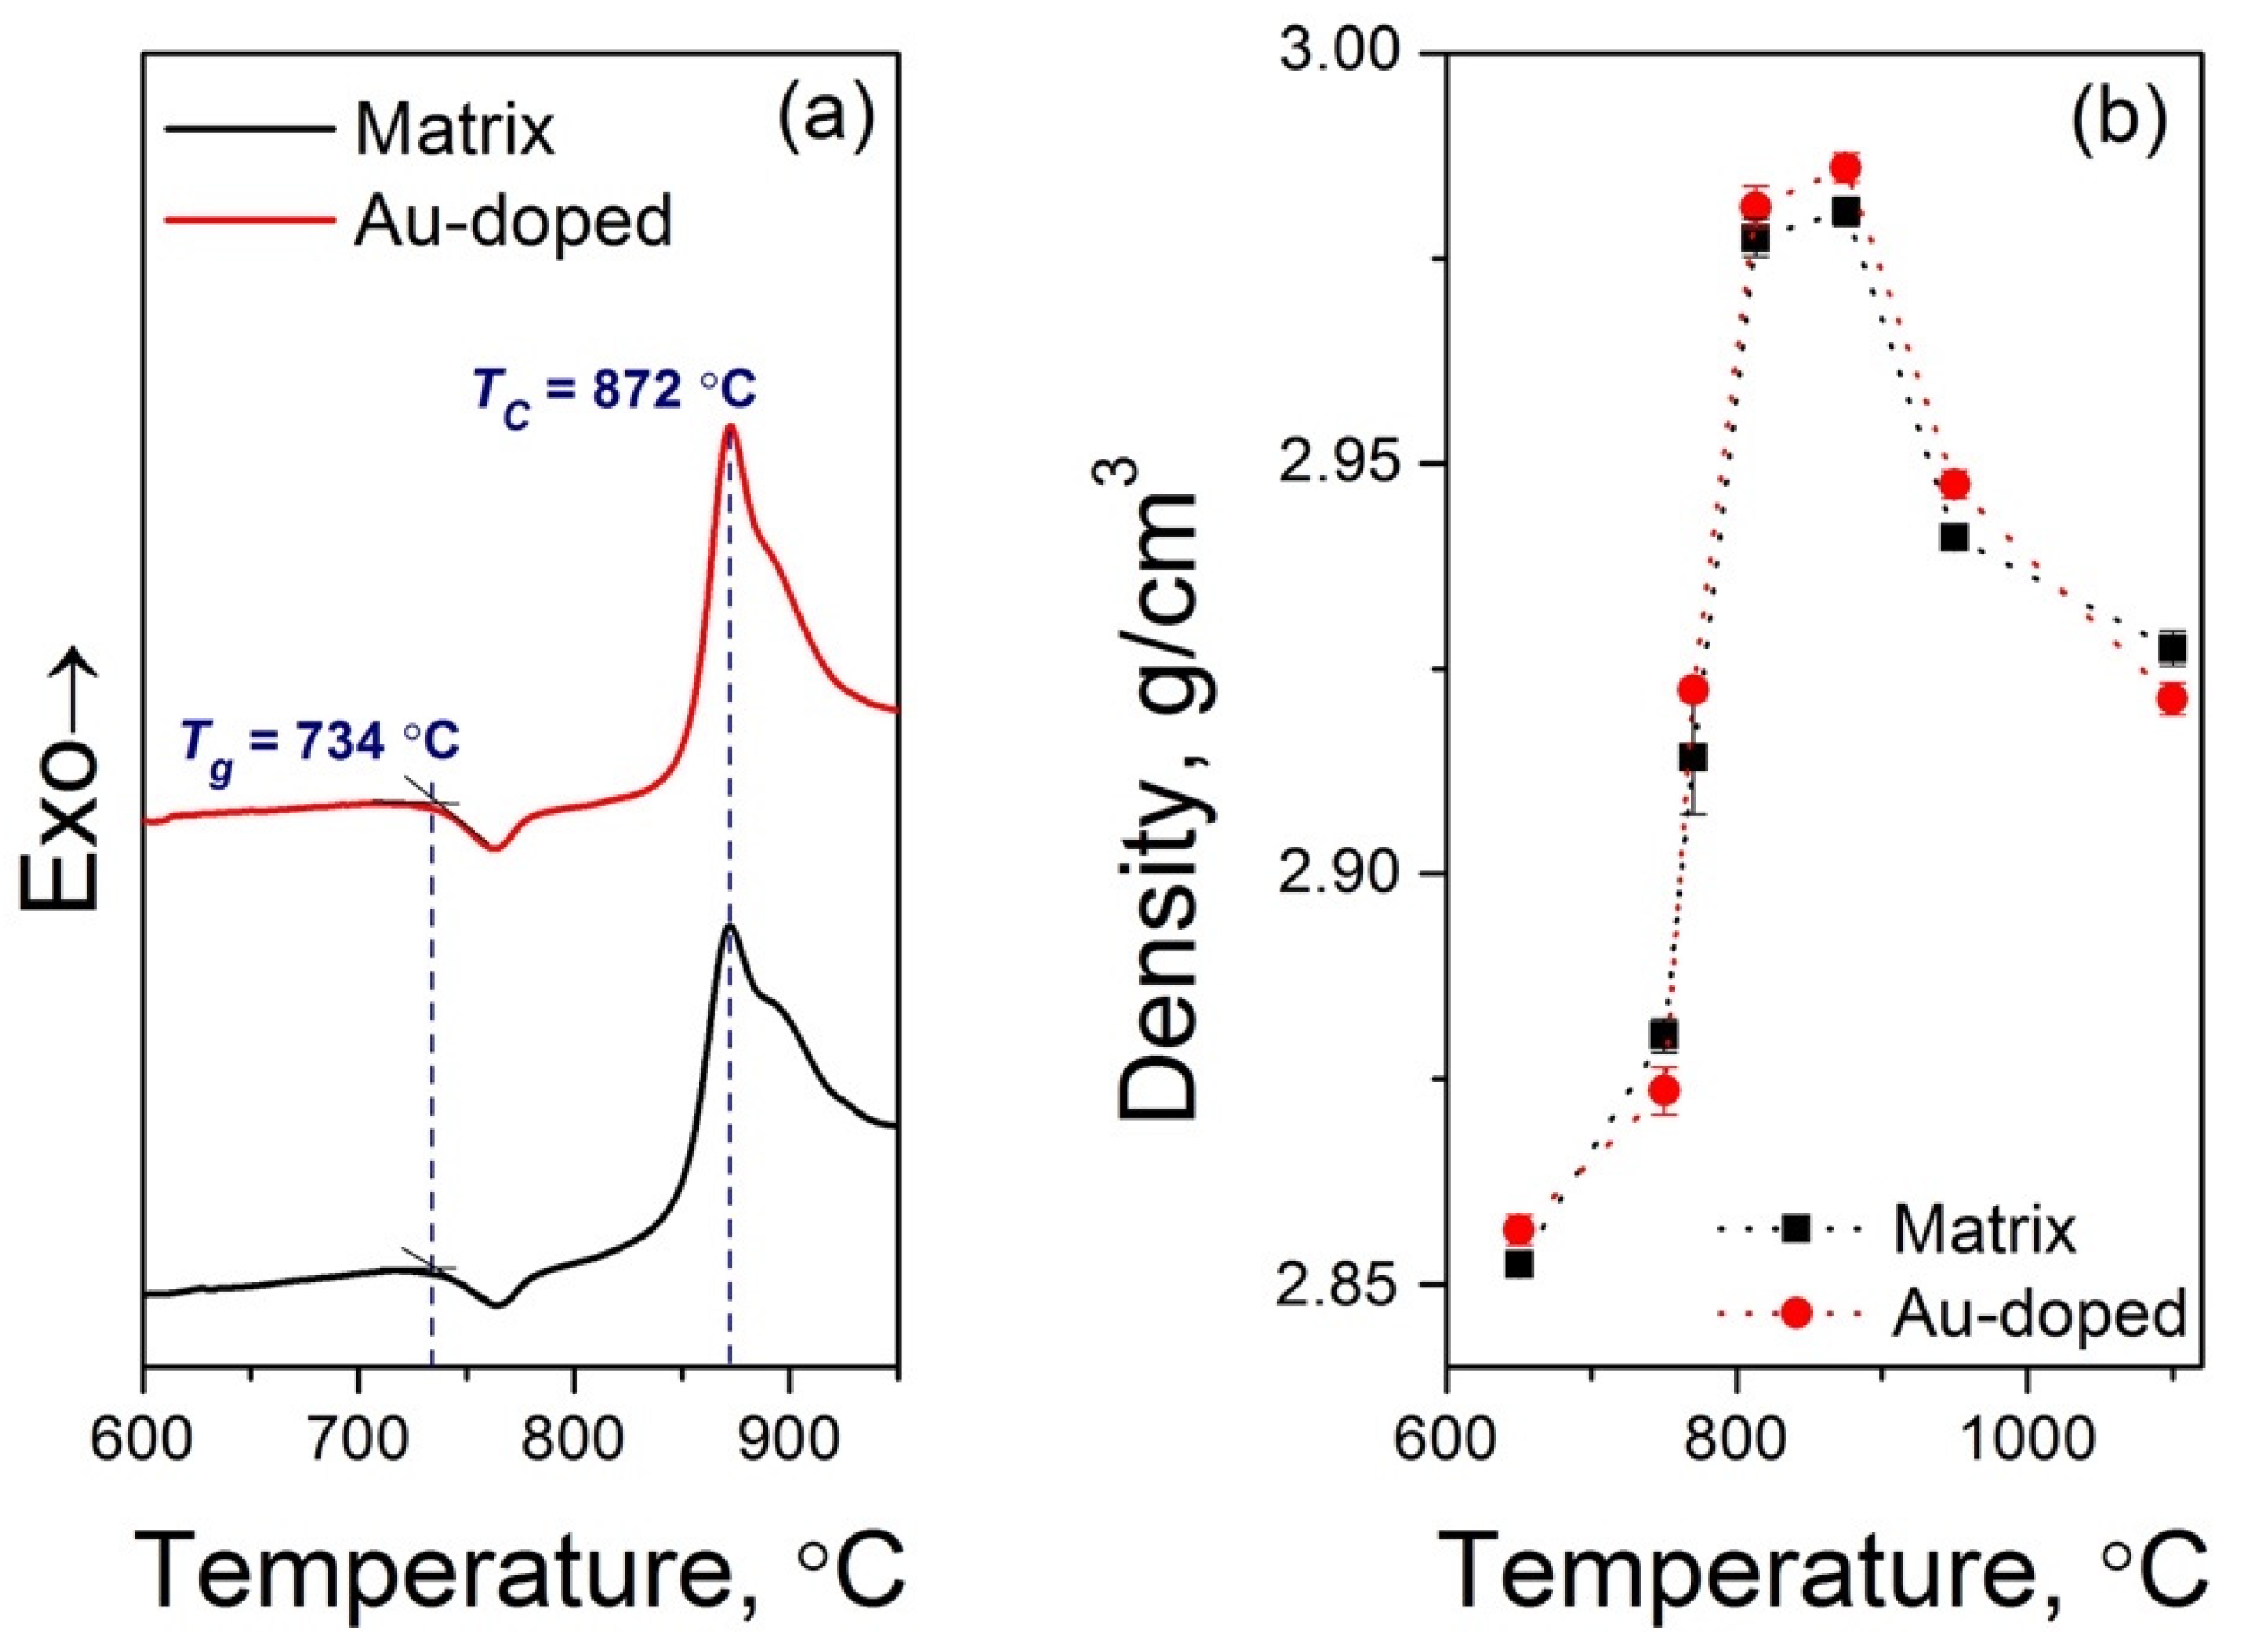
3.1. Physicochemical Properties
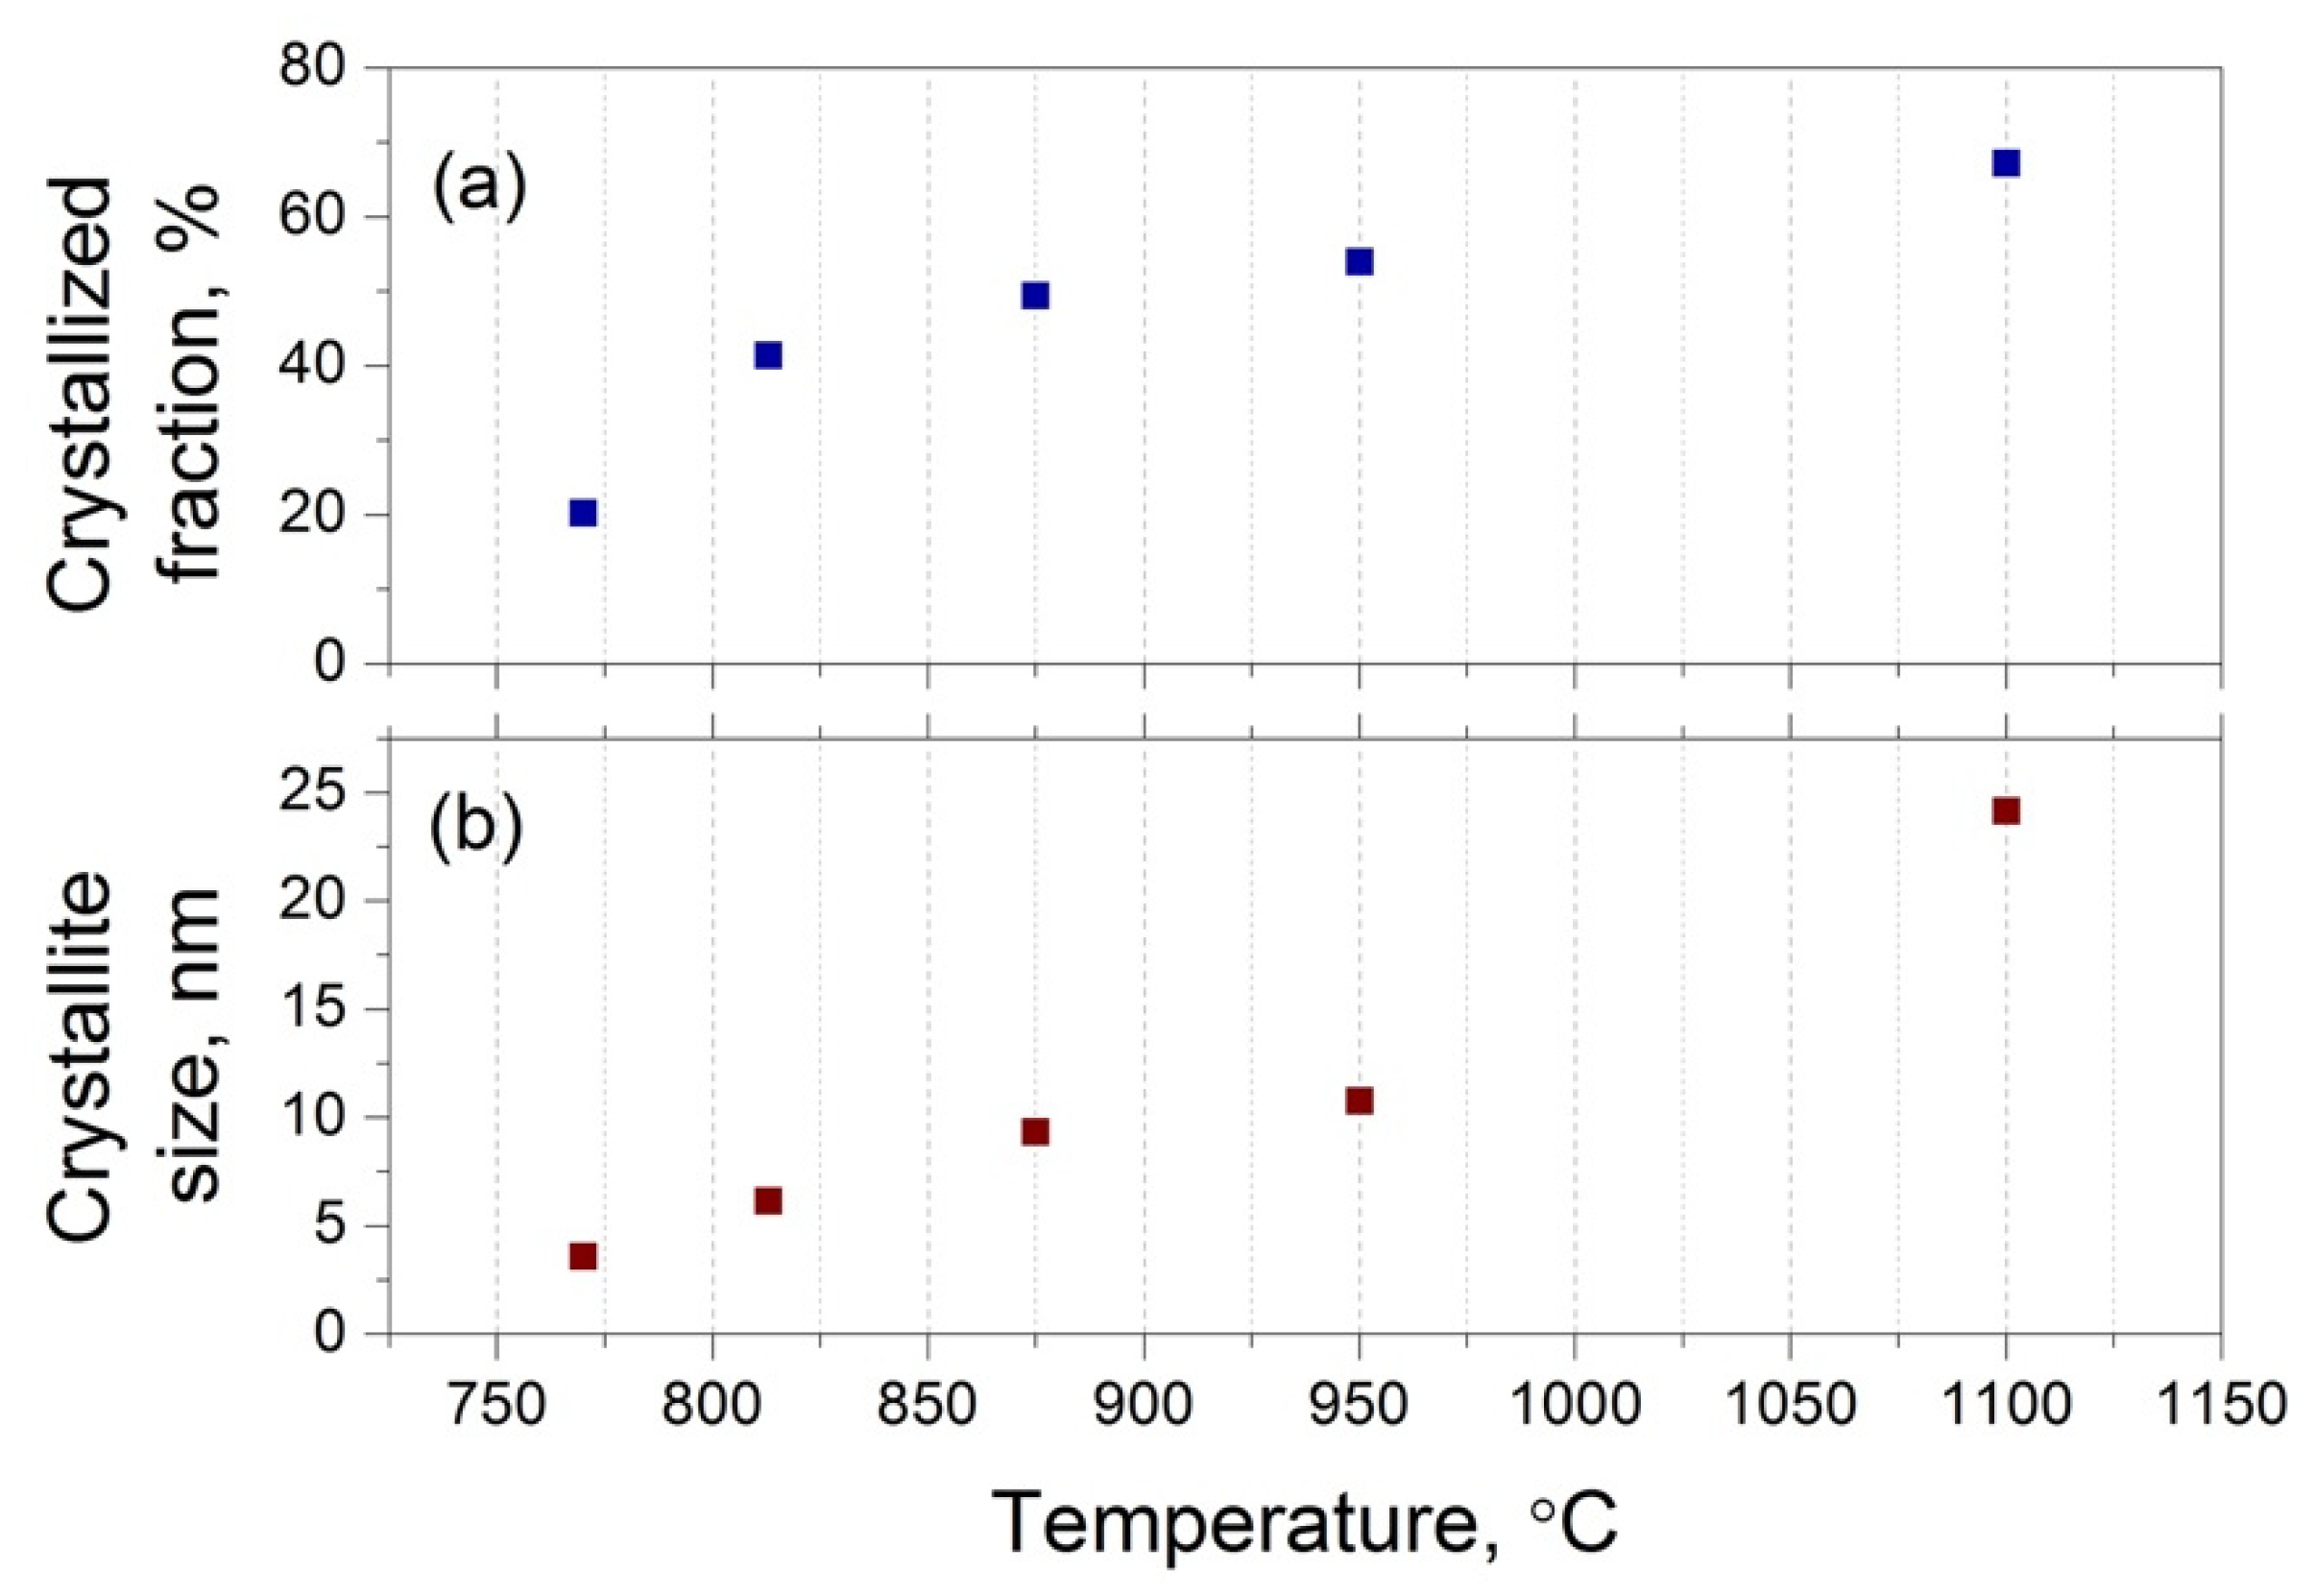
The DSC curves for the two glass samples under study are similar, showing the glass transition temperature, Tg, is about 740 °C for both glasses, as well as the temperature of the crystallization TC about 872 °C (Figure 1a). To study the influence of the gold NP precipitation on the phase-separation, crystallization, and optical properties of glass, we performed a series of heat treatments at temperatures below and above the Tg and the TC both for the Matrix and Au-doped samples.
The density variation for the Matrix and Au-doped glass samples with the heat treatment temperature is shown in Figure 1b. It demonstrates a complex behavior typical for density variation of spinel-based glass-ceramics and was reported previously for similar glass systems [34,35]. One can see that density variations for both samples are very close. After the heat treatment in the 650–750 °C range, the density rapidly increases and reaches the maximum values up to 2.98 g/cm3 at 875 °C heat treatment temperature. Further increase of the heat treatment temperature leads to the decrease of the density down to 2.92 g/cm3, which can be explained by the precipitation of mixed crystal phases affecting the overall density of the composite material. The observed increase of the density after the heat treatment at 750 °C could suggest amorphous phase separation in the glass. This assumption is confirmed below using TEM, Raman, and optical spectroscopy data.

3.2. XRD Studies

According to the XRD data of the Matrix series (Figure 2), the glass sample after the heat treatment at 750 °C is likely amorphous, showing a broad bump in the 20–30° range, as does glass sample before the heat treatment. When analyzing the XRD patterns, what draws attention is a slight shift of the amorphous halo position to smaller angles for treated samples, which suggests a change in the composition of the residual glass. Since the position of the amorphous halo becomes close to that of the fused silica, the residual glass seems to be more enriched in silica compared to the composition of the parent glass [34].
Crystal phases start to brightly appear on the XRD patterns after the heat treatments at 770 °C and higher temperatures. The main crystal phase for the studied samples is gahnite (ZnAlO4), which is believed to be the single-phase up to the heat treatment at 950 °C. At this temperature, ZrTiO4 crystallites start to precipitate, and further increase of the heat treatment temperature up to 1100 °C leads to the opacity of the sample and sharpening of the XRD peaks that is caused by a significant increase of the crystallized fraction and crystallite size. We suggest that ZrTiO4 crystallites could start to precipitate already at 770 °C since the extremely broadened peak at 2θ ~32 deg. can be observed on the XRD pattern. Moreover, we need to underline that Mg2+ and Zn2+ ions have nearly the same ionic radii, thus the incorporation of Mg in the crystal phase will not lead to a drastic change in the lattice constant. Since the glass composition contains nearly the same amount of ZnO and MgO, we can suggest formation of the (Mg, Zn)Al2O4 crystal phase. In this work we use gahnite to describe the precipitated crystal phase; future studies using the TEM elemental analysis will help to clarify the exact composition of the precipitated crystals.
Figure 3 shows the data for the crystallized fraction and crystallite size determined from the abovementioned XRD patterns. As can be seen, the crystallized fraction rapidly grows after treatment at temperatures higher than 770 °C and exceeds 65% for the sample heat treated at 1100 °C. Calculated crystallite size seems to be increased linearly from about 3–4 nm after the treatment at 770 °C to 23–25 nm for the opaque sample treated at 1100 °C.
These findings along with the data on sample density suggest that during the low-temperature heat treatment of the glass samples, amorphous phase separation could occur while the further increase of the treatment temperature leads to the precipitation of gahnite crystals, the sizes and fraction of which rapidly grow with the temperature. In order to analyze the influence of gold addition on the crystallization process of the glass samples, we compare XRD patterns of samples from the Matrix and Au-doped series (Figure 4). One can see that the detailed comparison of the XRD patterns does not allow to commit any changes: both at 770 and 950 °C the XRD patterns are practically identical. Based on these data, we can propose that gold NPs precipitated in the glass samples do not affect the crystallization of gahnite.

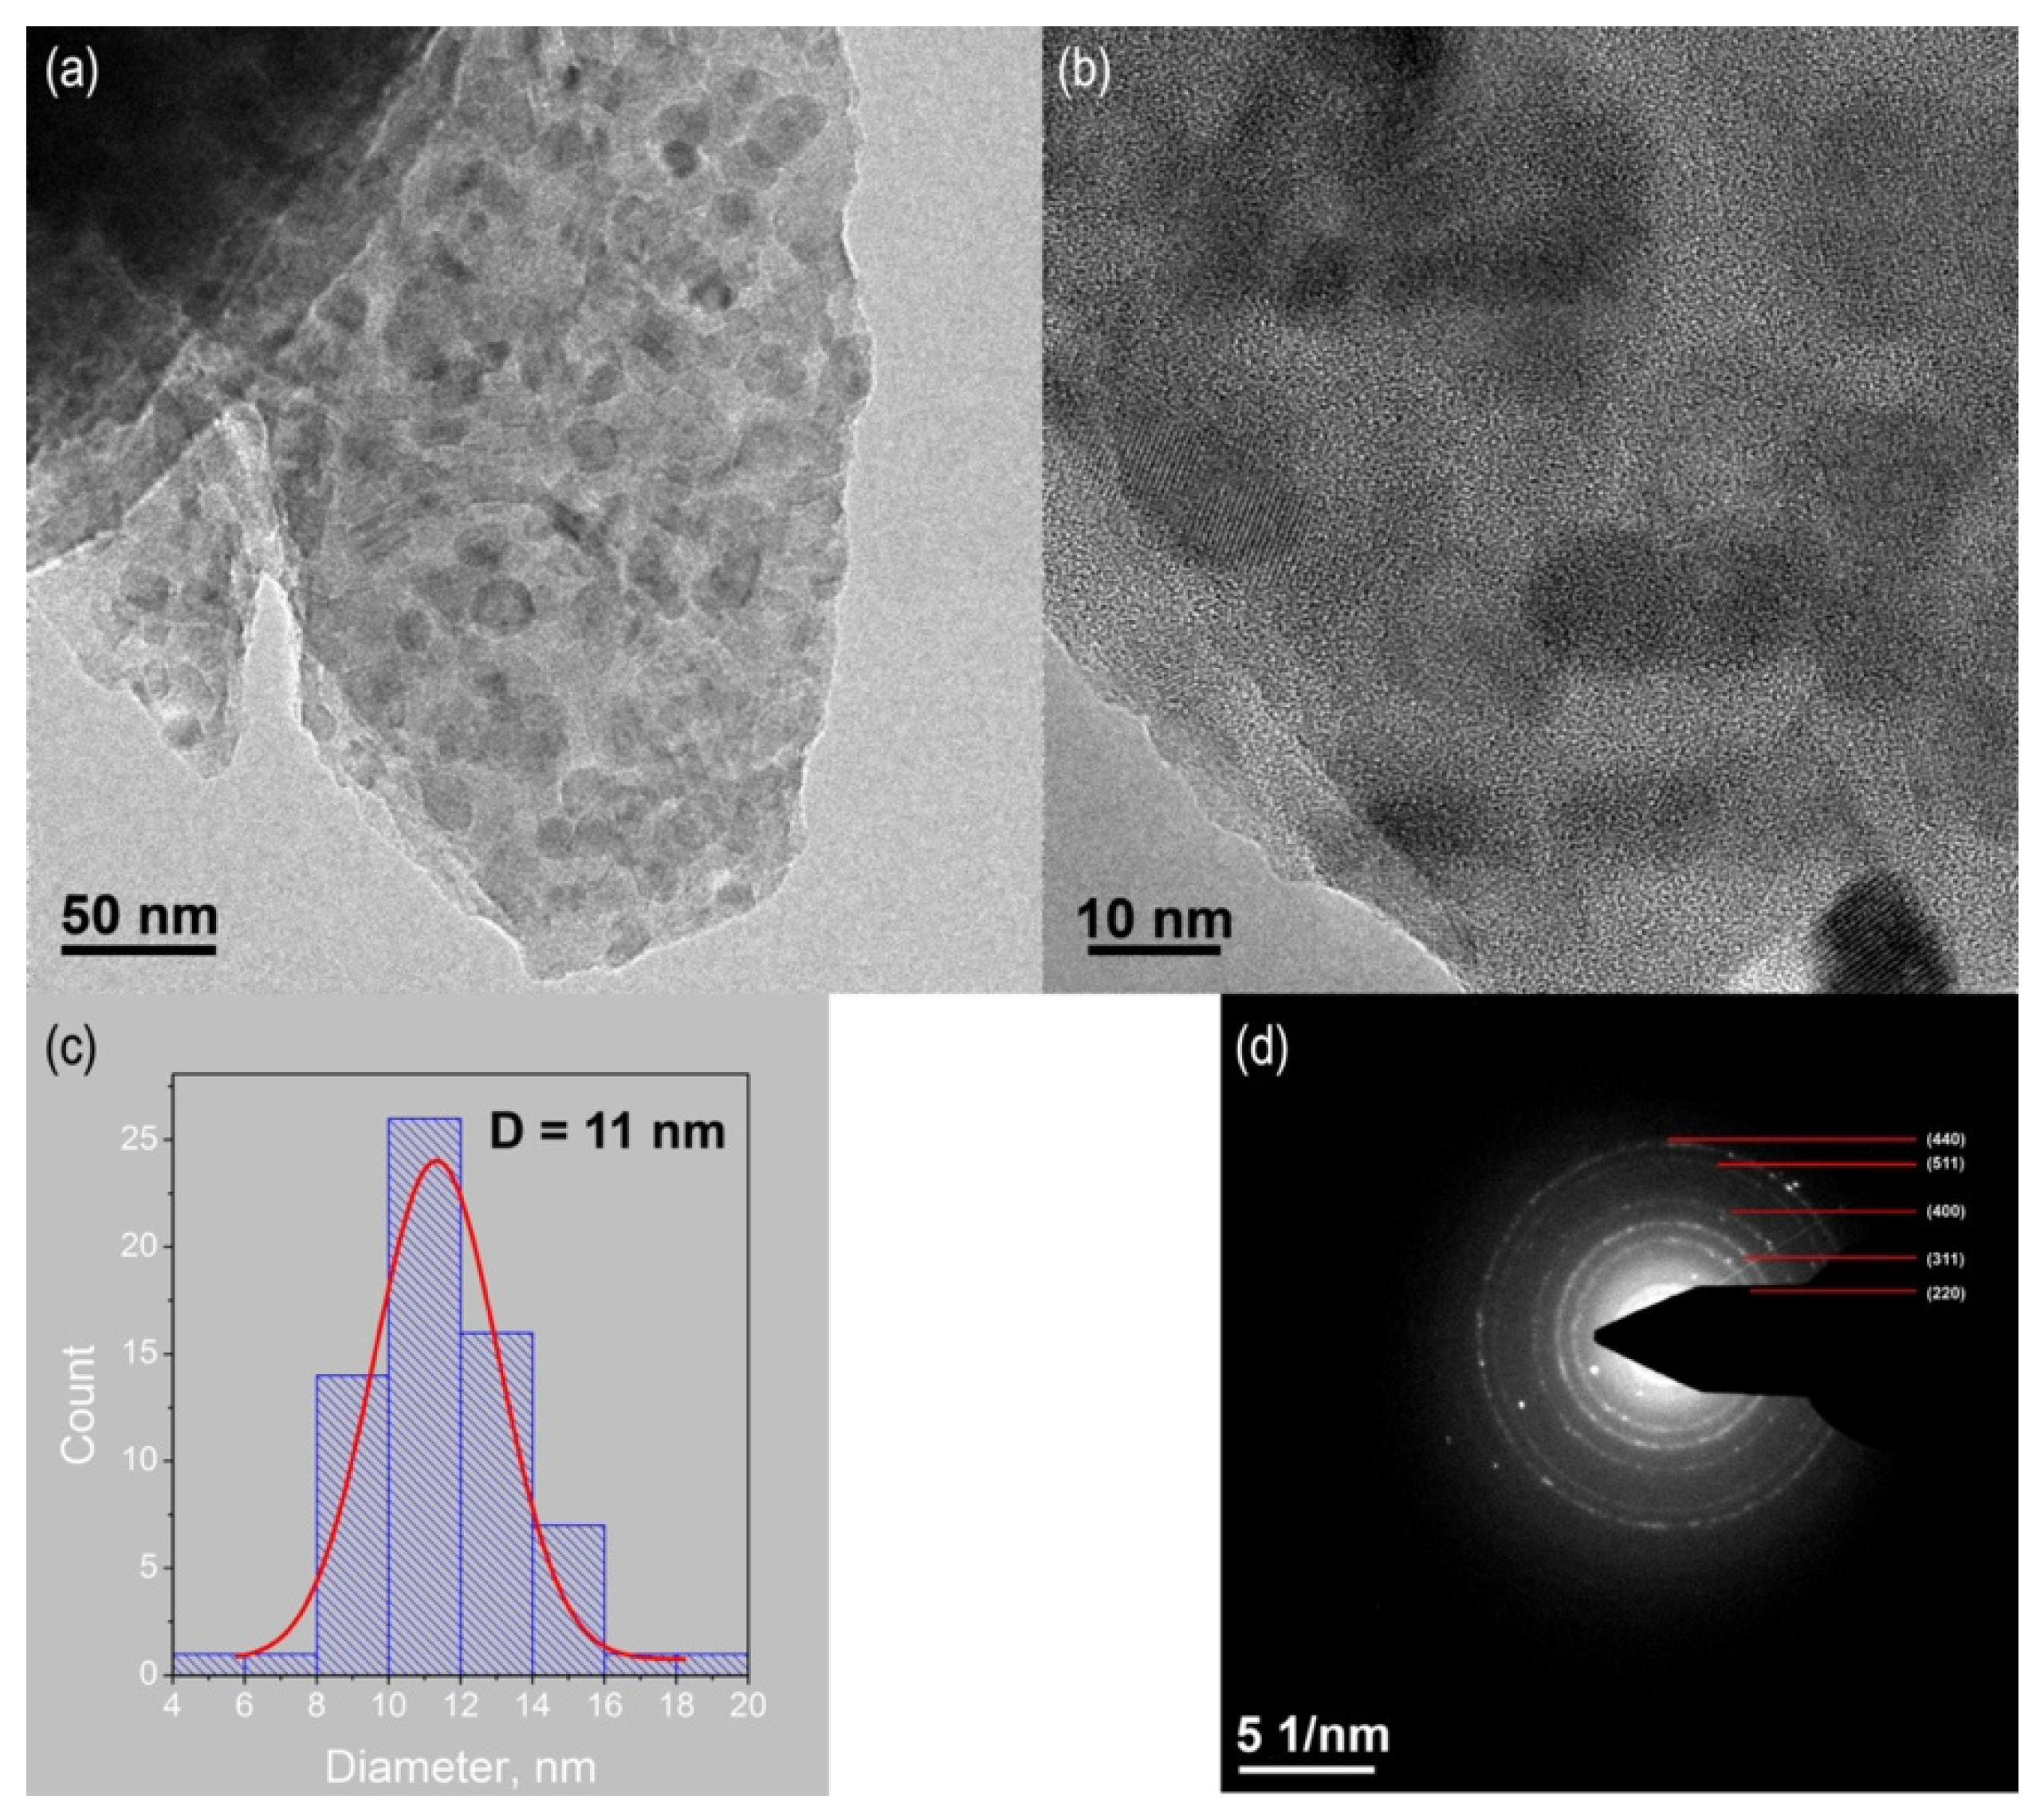
3.3. TEM/HRTEM Studies
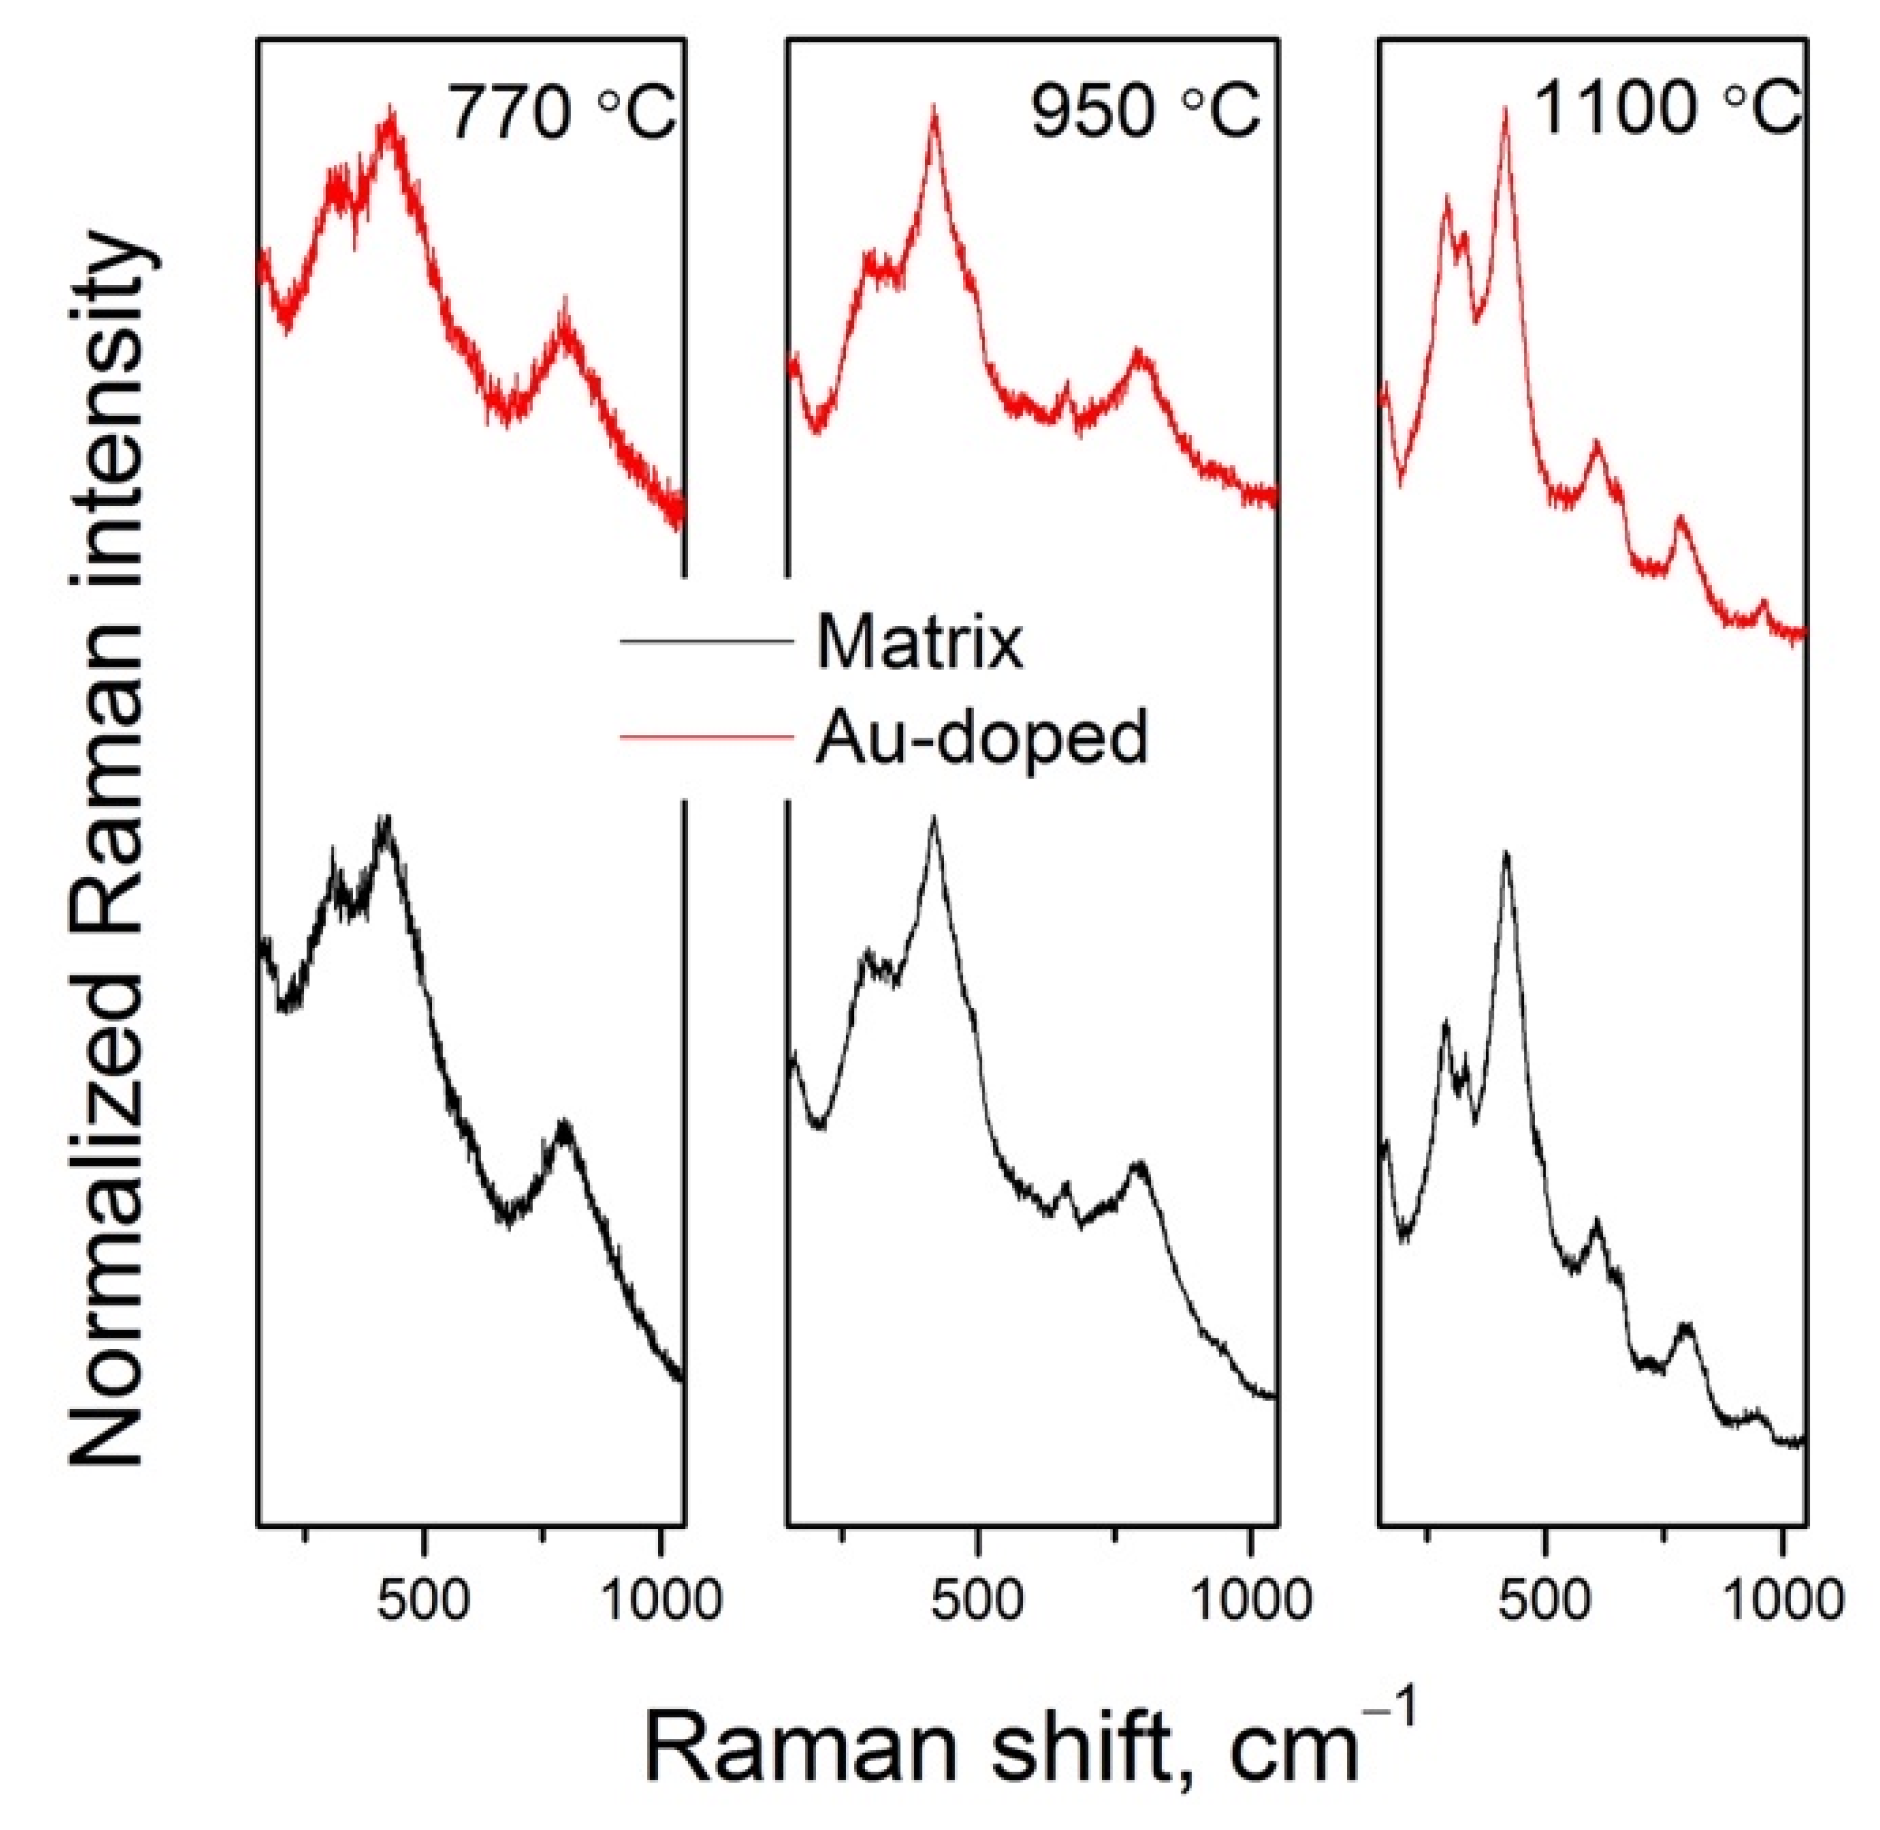
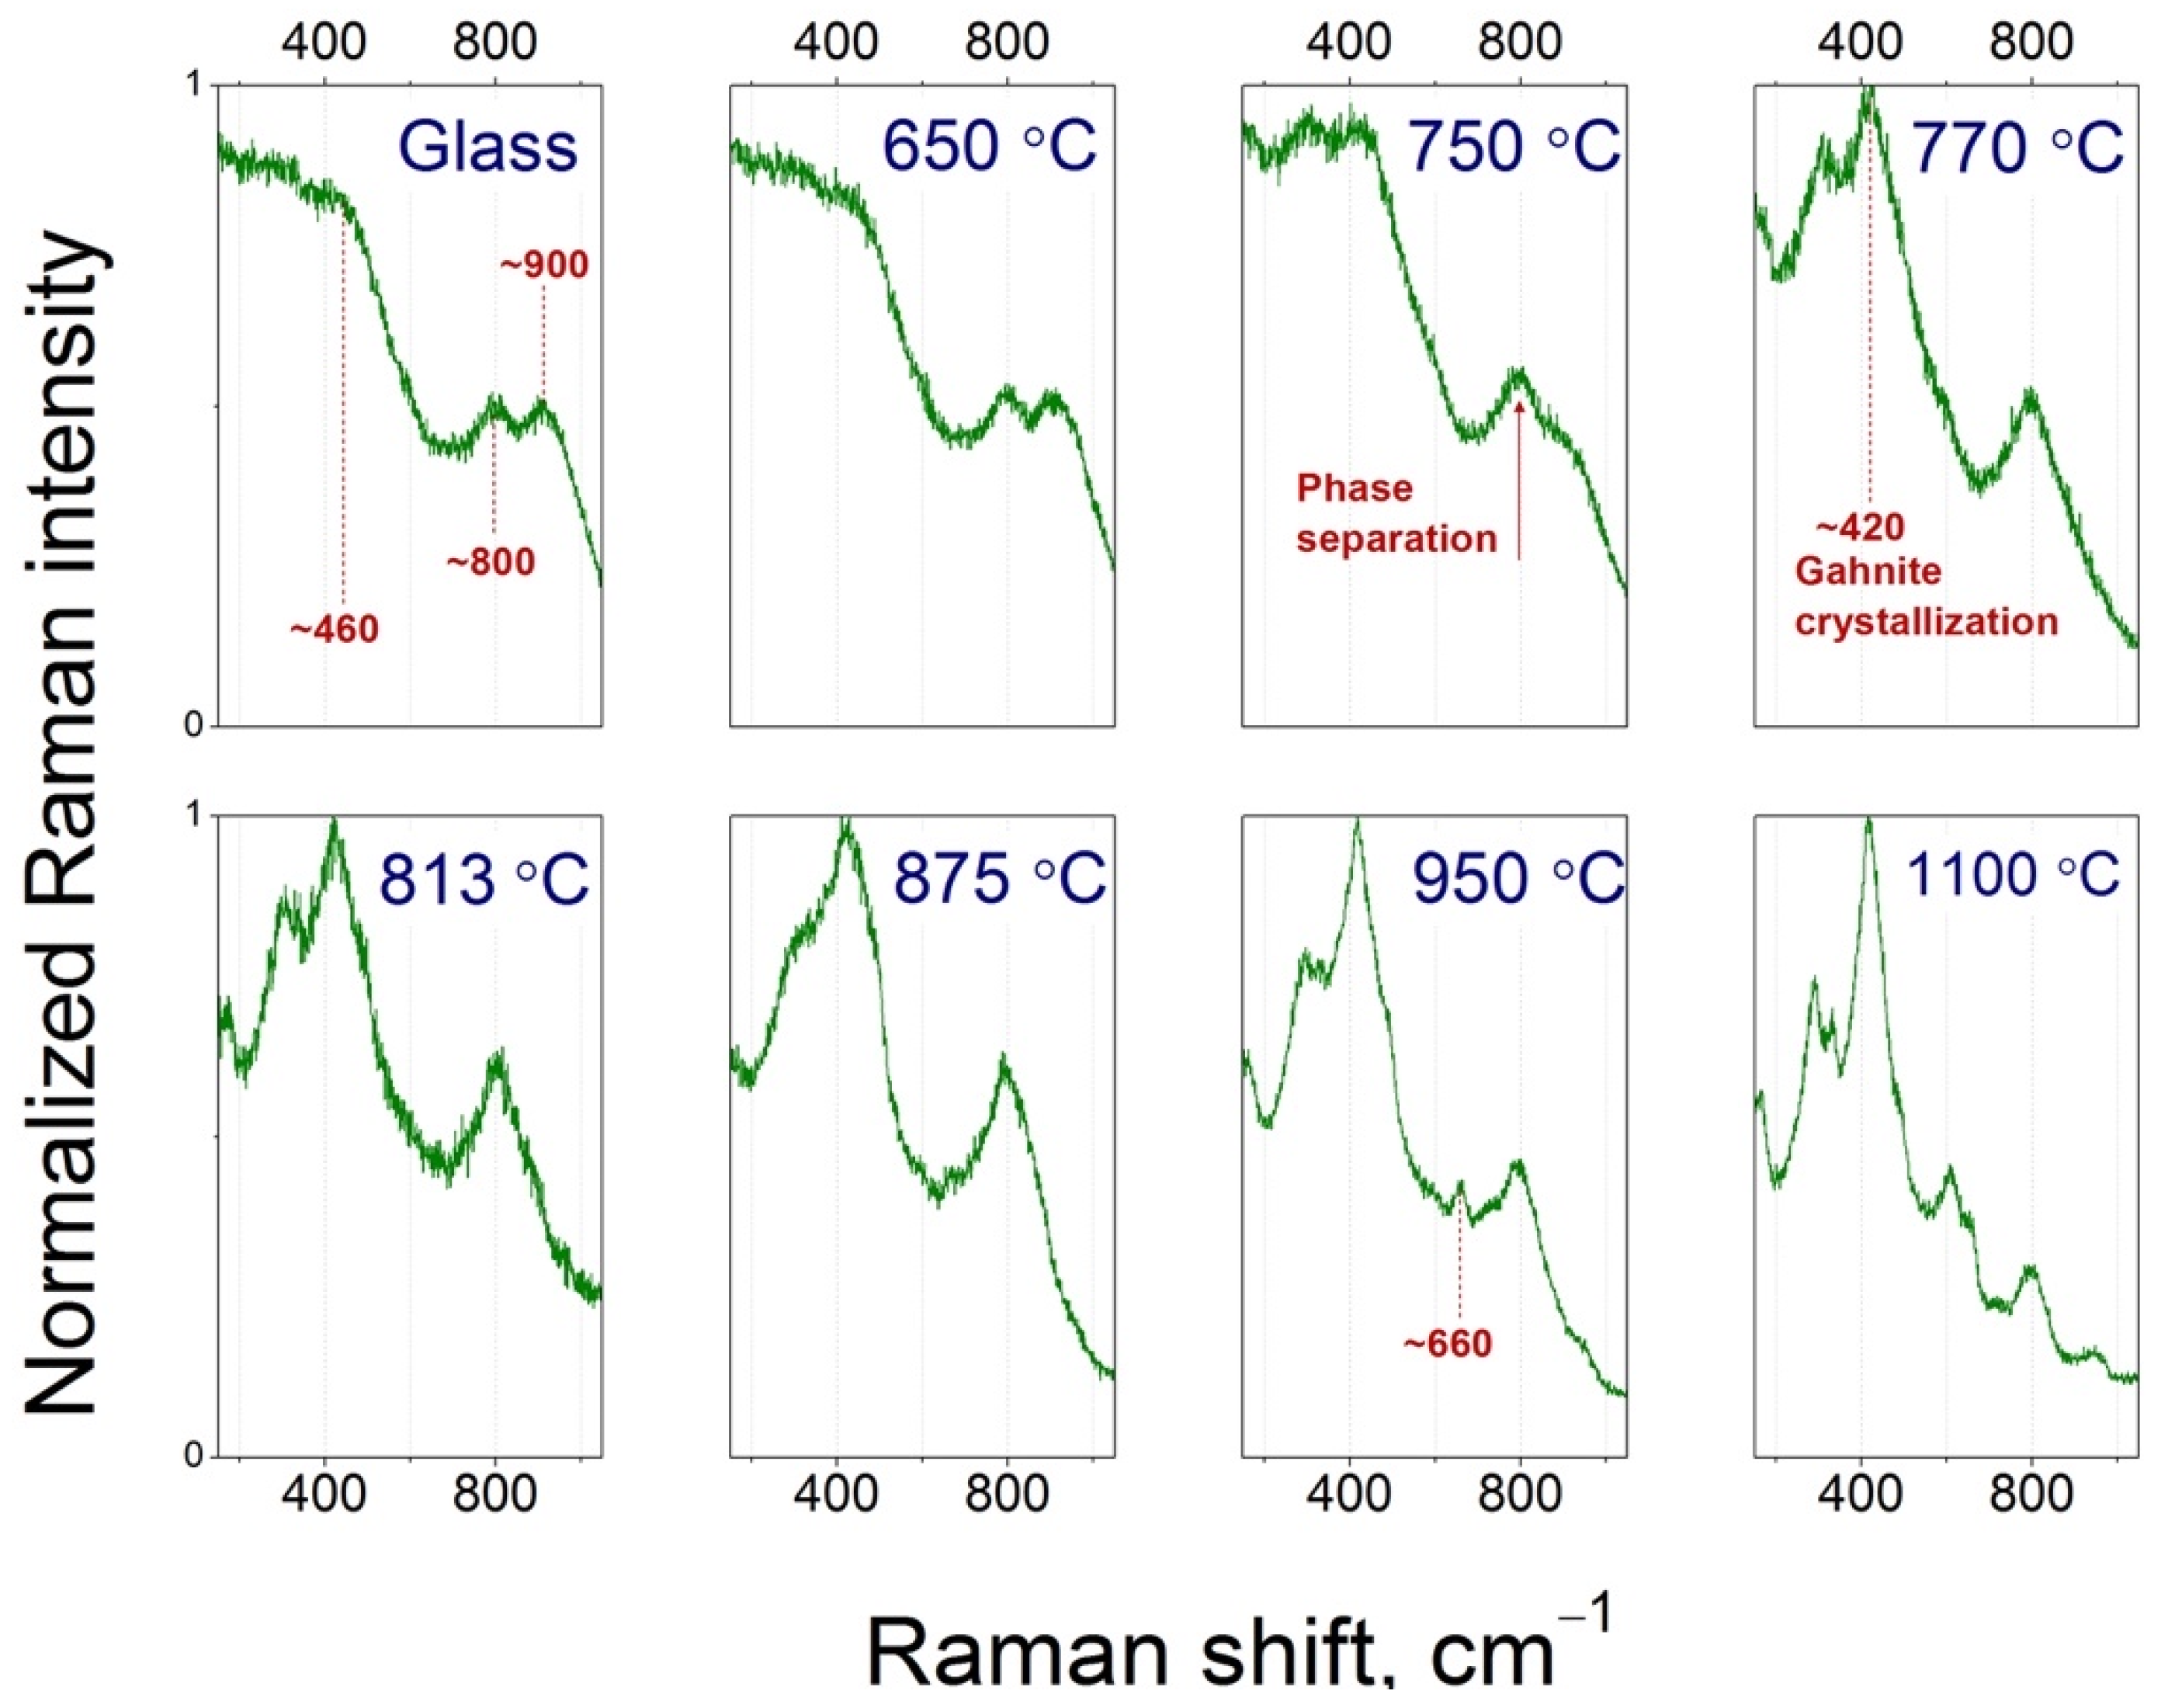
To study the structure of the Au-doped samples in more detail, we performed a series of TEM measurements. The TEM characterization of the Au-doped glass sample heat treated at 750 °C (Figure 5) indicated the presence of inhomogeneous contrast regions about 10 nm in size uniformly dispersed in the glass matrix. These areas are not crystalline since no crystalline fringes can be observed in the HRTEM images. We propose that these regions are formed by amorphous droplets due to liquid-liquid phase separation and enriched with TiO2 and ZrO2. The study of TEM images does not lead to the detection of gold NPs. This is possibly due to a very low concentration of gold in the glass.
Figure 6a shows the microstructure of the glass sample after the heat treatment at 770 °C. One can see the appearance of the abovementioned inhomogeneous regions indicating that phase separation still proceeds at this treatment temperature. At once, the HRTEM image depicts single nanocrystals about 3–5 nm in size (Figure 6b); the observed lattice fringes prove that the particles indeed are crystallites. The interplanar spacing of the crystallites is 0.29 nm which is consistent with the spacing of gahnite (220) crystallographic planes [36].
In order to further analyze the observed crystals, we need once again to underline the fact of the total similarity between XRD patterns for glasses from the Matrix and Au-doped series (Figure 4). In this regard, we can compare the data (crystallinity and crystallite size) calculated from the XRD patterns for the Matrix series (Figure 3) and data obtained from the TEM studies for the Au-doped series. Hence, based on the XRD results, we can conclude that the nanocrystals observed in the HRTEM image refer to gahnite. Moreover, the calculated crystallite size of 3–4 nm (Figure 3b) perfectly matches with HRTEM data.
As shown by XRD analysis, the increase of the heat treatment temperature up to 950 °C results in the growth of both the nanocrystal size and the crystallized fraction, which one can see also on the TEM image (Figure 7a). The estimated crystallized fraction of more than 50% matches well with the visual analysis of the observed image, while calculated nanocrystal size (10–11 nm) perfectly correlates with the mean value from the size distribution histogram (inset on Figure 7). Analysis of the HRTEM image and corresponding selected area diffraction (SAED) pattern confirms the formation of gahnite (ZnAl2O4) nanocrystals, which correlates with the XRD data indicating that gahnite is the dominant crystal phase in the investigated sample. Thus, we can preliminarily confirm our assumption about the lack of gold NP influence on the glass crystallization.

3.4. Raman Spectra

Analysis of the Raman spectra provides more insights into the glass structure change during the heat treatment. Figure 8 shows the Raman spectra of the glass samples for the Matrix series. One can see that the spectrum for the initial glass as well as for the glass sample after the treatment at 650 °C formed by three bands: one broadband with maximum at ~450 cm−1, the bands at ~800, and at ~900 cm−1 [37,38]. The band at ~460 cm−1 is associated with the vibrations of [SiO4] tetrahedrons of a glass matrix, the band at ~900 cm−1 can be assigned to [TiO4] tetrahedrons built into the glass matrix, while the band at ~800 cm−1 has more complex nature: such band is superimposed by the band associated with the vibrations of [SiO4] tetrahedra and with the vibrations of the Ti–O bonds in [TiO]5 and in [TiO]6 polyhedrons, which could be formed during the phase separation process [39].
It is known that the increase of the ~800 cm−1 band intensity with the decrease of the ~900 cm−1 band could be the indicator of the phase separation development in the glass during the heat treatment [34]. Hence, we analyze the evolution of the Raman bands in the high-frequency part of the spectra with the heat treatment temperature increase. Figure 8 clearly shows that the ~800 cm−1/~900 cm−1 intensity ratio rapidly rises from 650 to 750 °C and higher temperatures. This observation means that essentially all titania enters into the zinc aluminotitanate inhomogeneous regions, which confirms that the phase separation occurs in the glass samples treated at 750 °C and higher temperatures.
The first band related to the gahnite formation (at ~420 cm−1) appears in the spectrum of the sample treated at 770 °C and continuously sharpens with the temperature increase. The second characteristic gahnite band at ~660 cm−1 appears in the spectrum after the heat treatment at 950 °C. The comparison of the characteristic Raman spectra for the Matrix and Au-doped series is shown in Figure 9. One can see that spectra for all treatment temperatures are similar for the Matrix and Au-doped series. This finding once again indicates the negligible influence of the Au NP formation on the structure change of the studied glasses. Nevertheless, optical properties of the Au-doped glass samples undergo crucial changes during the heat treatment, as is shown in the next section.

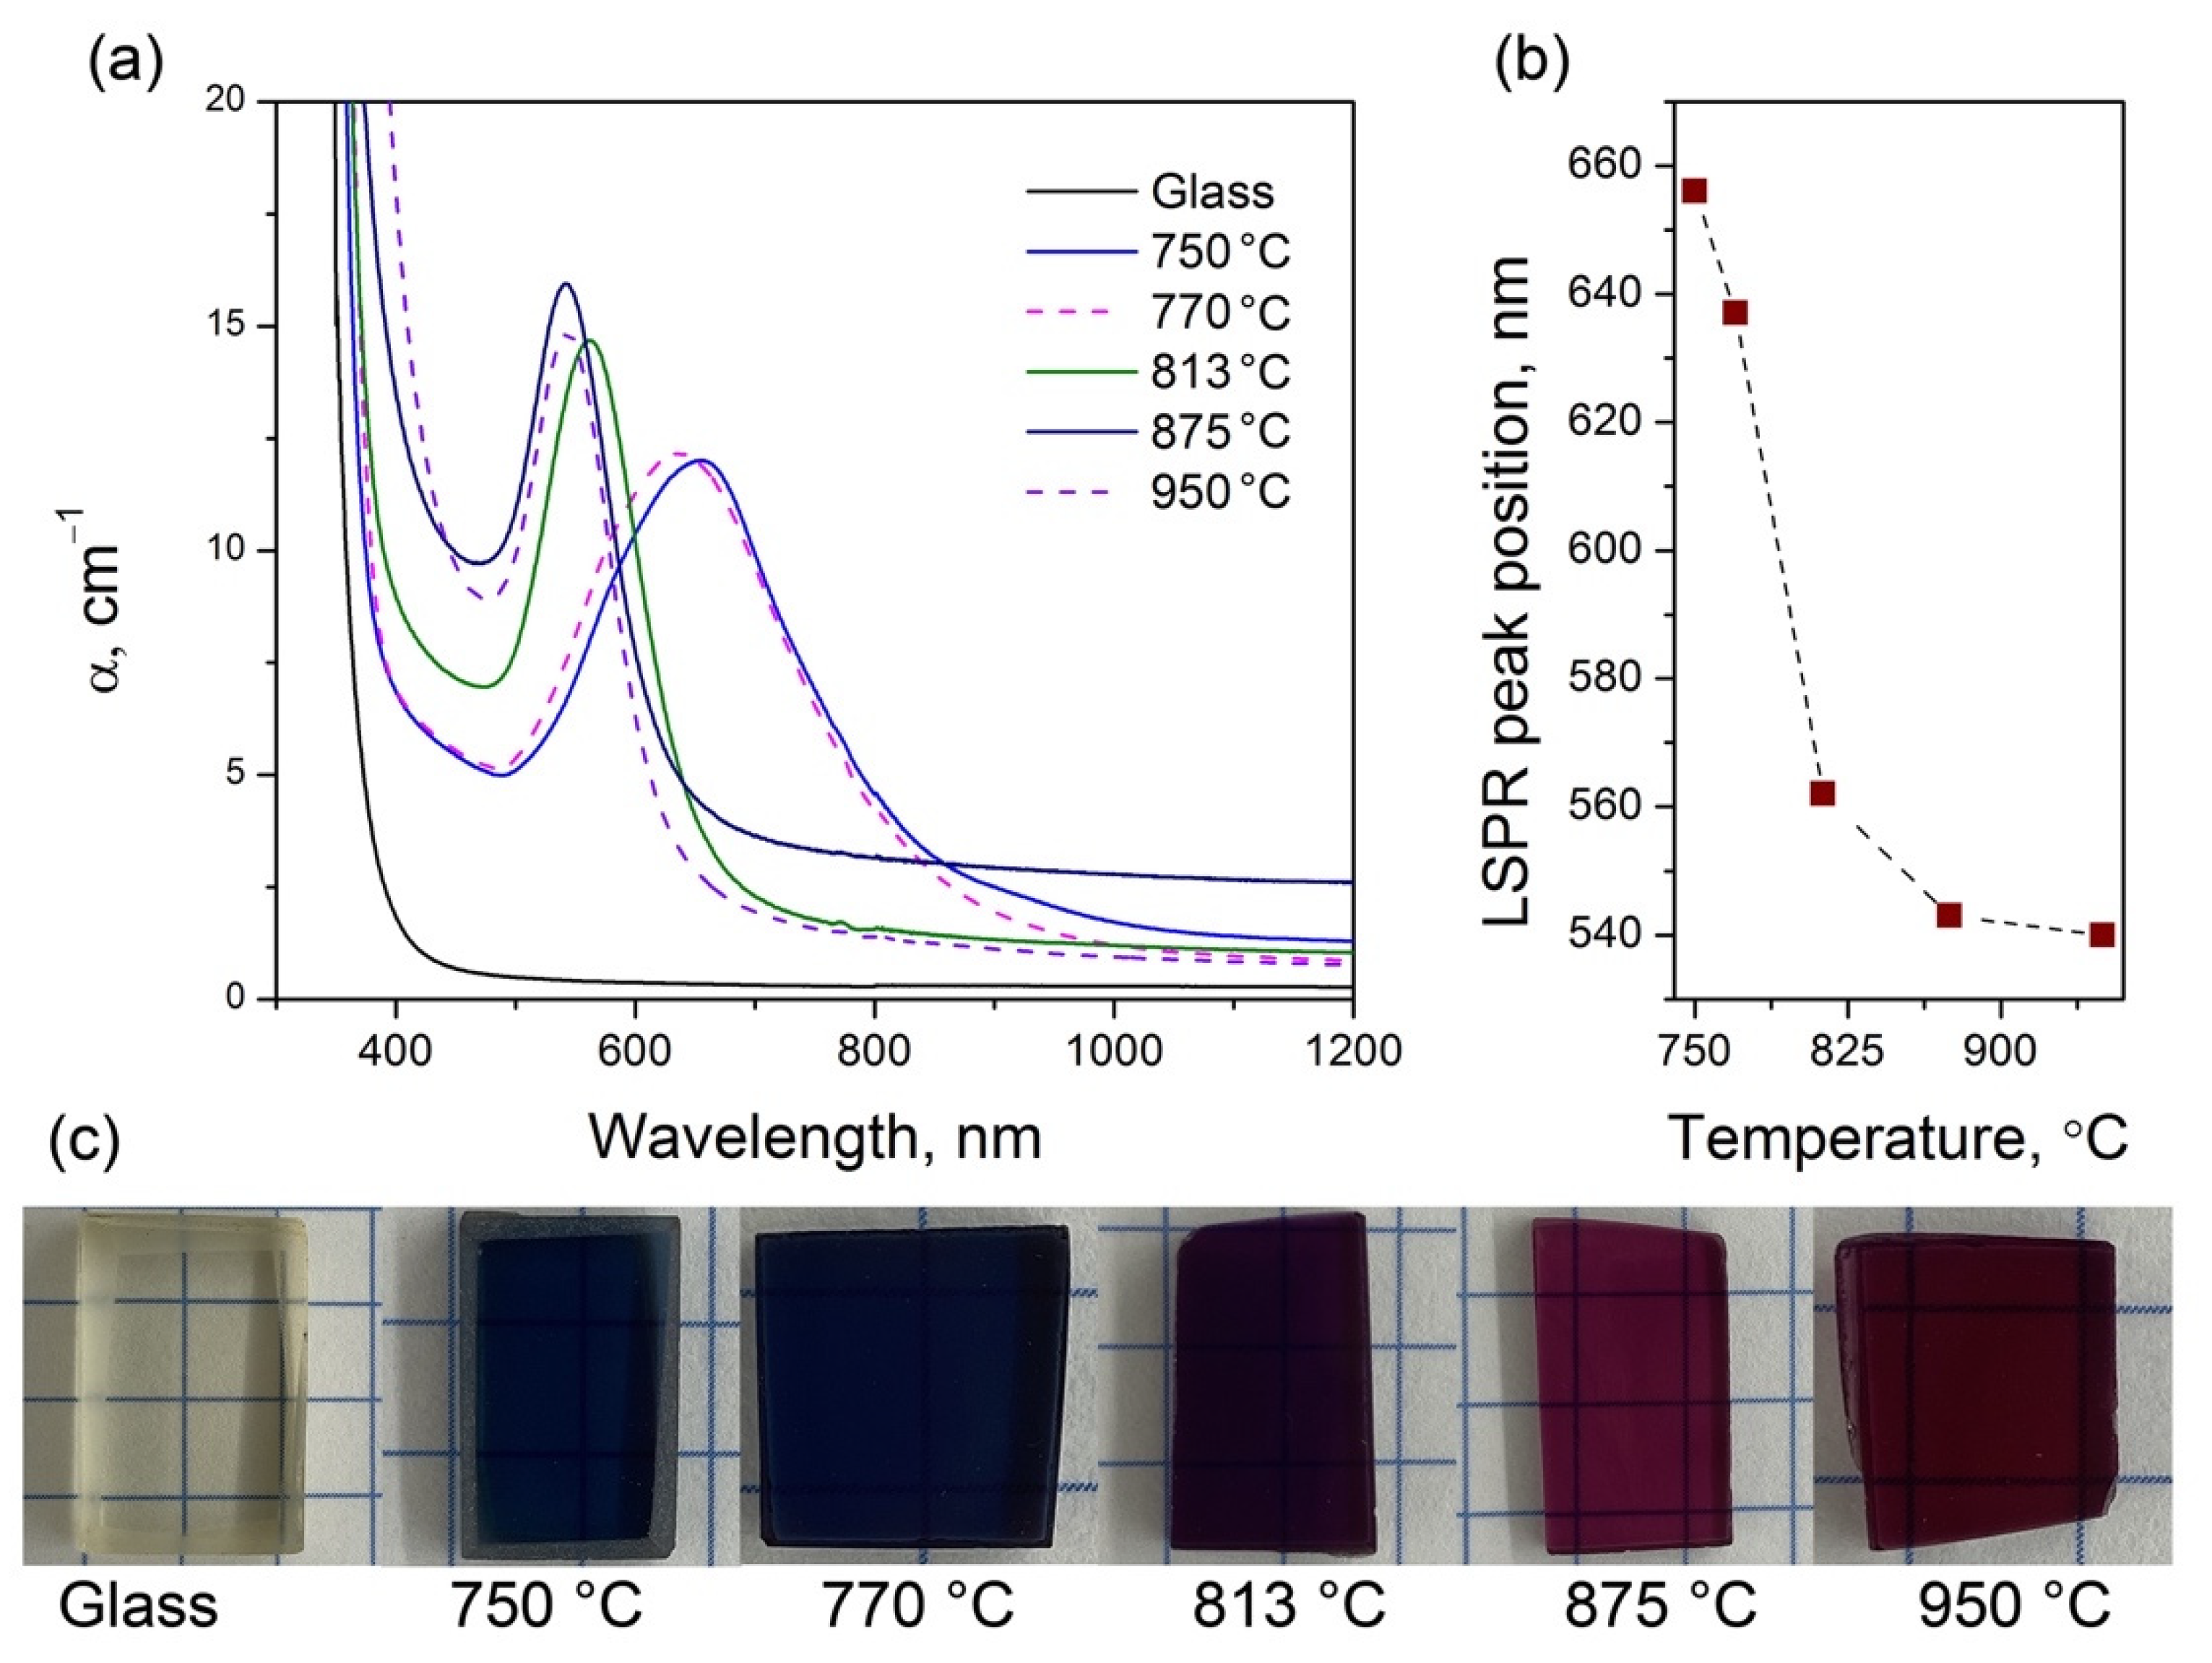
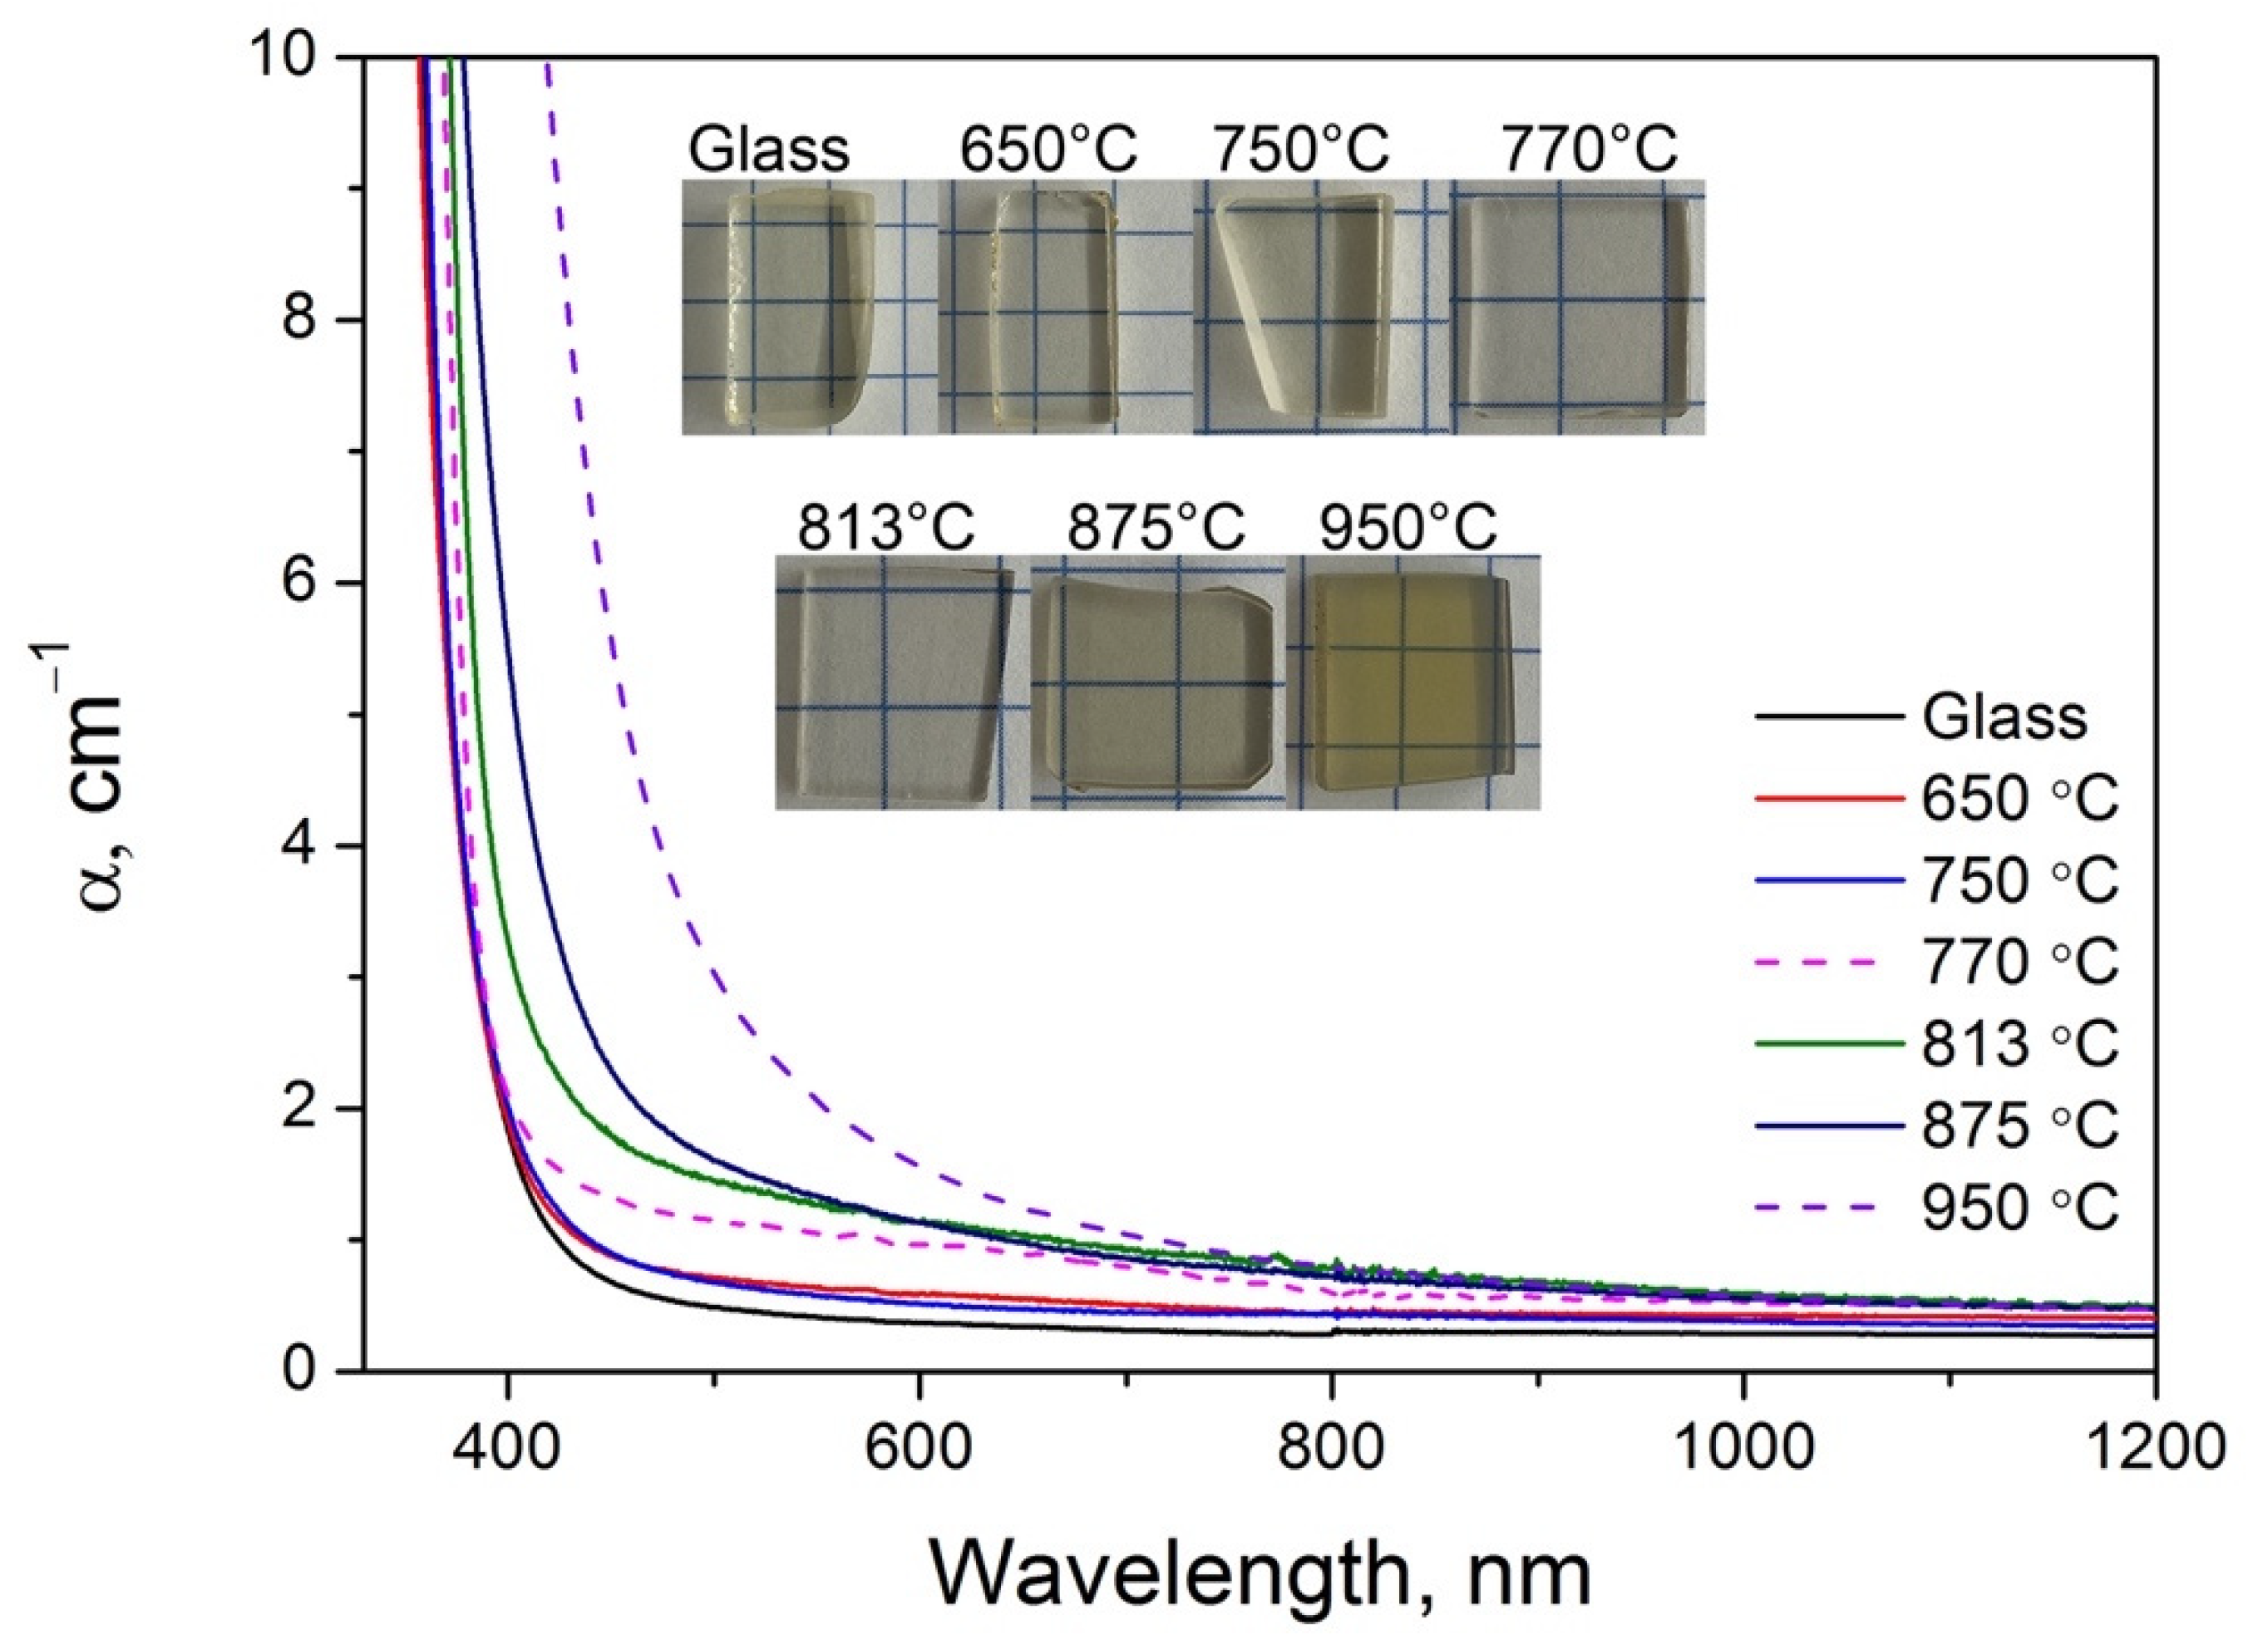
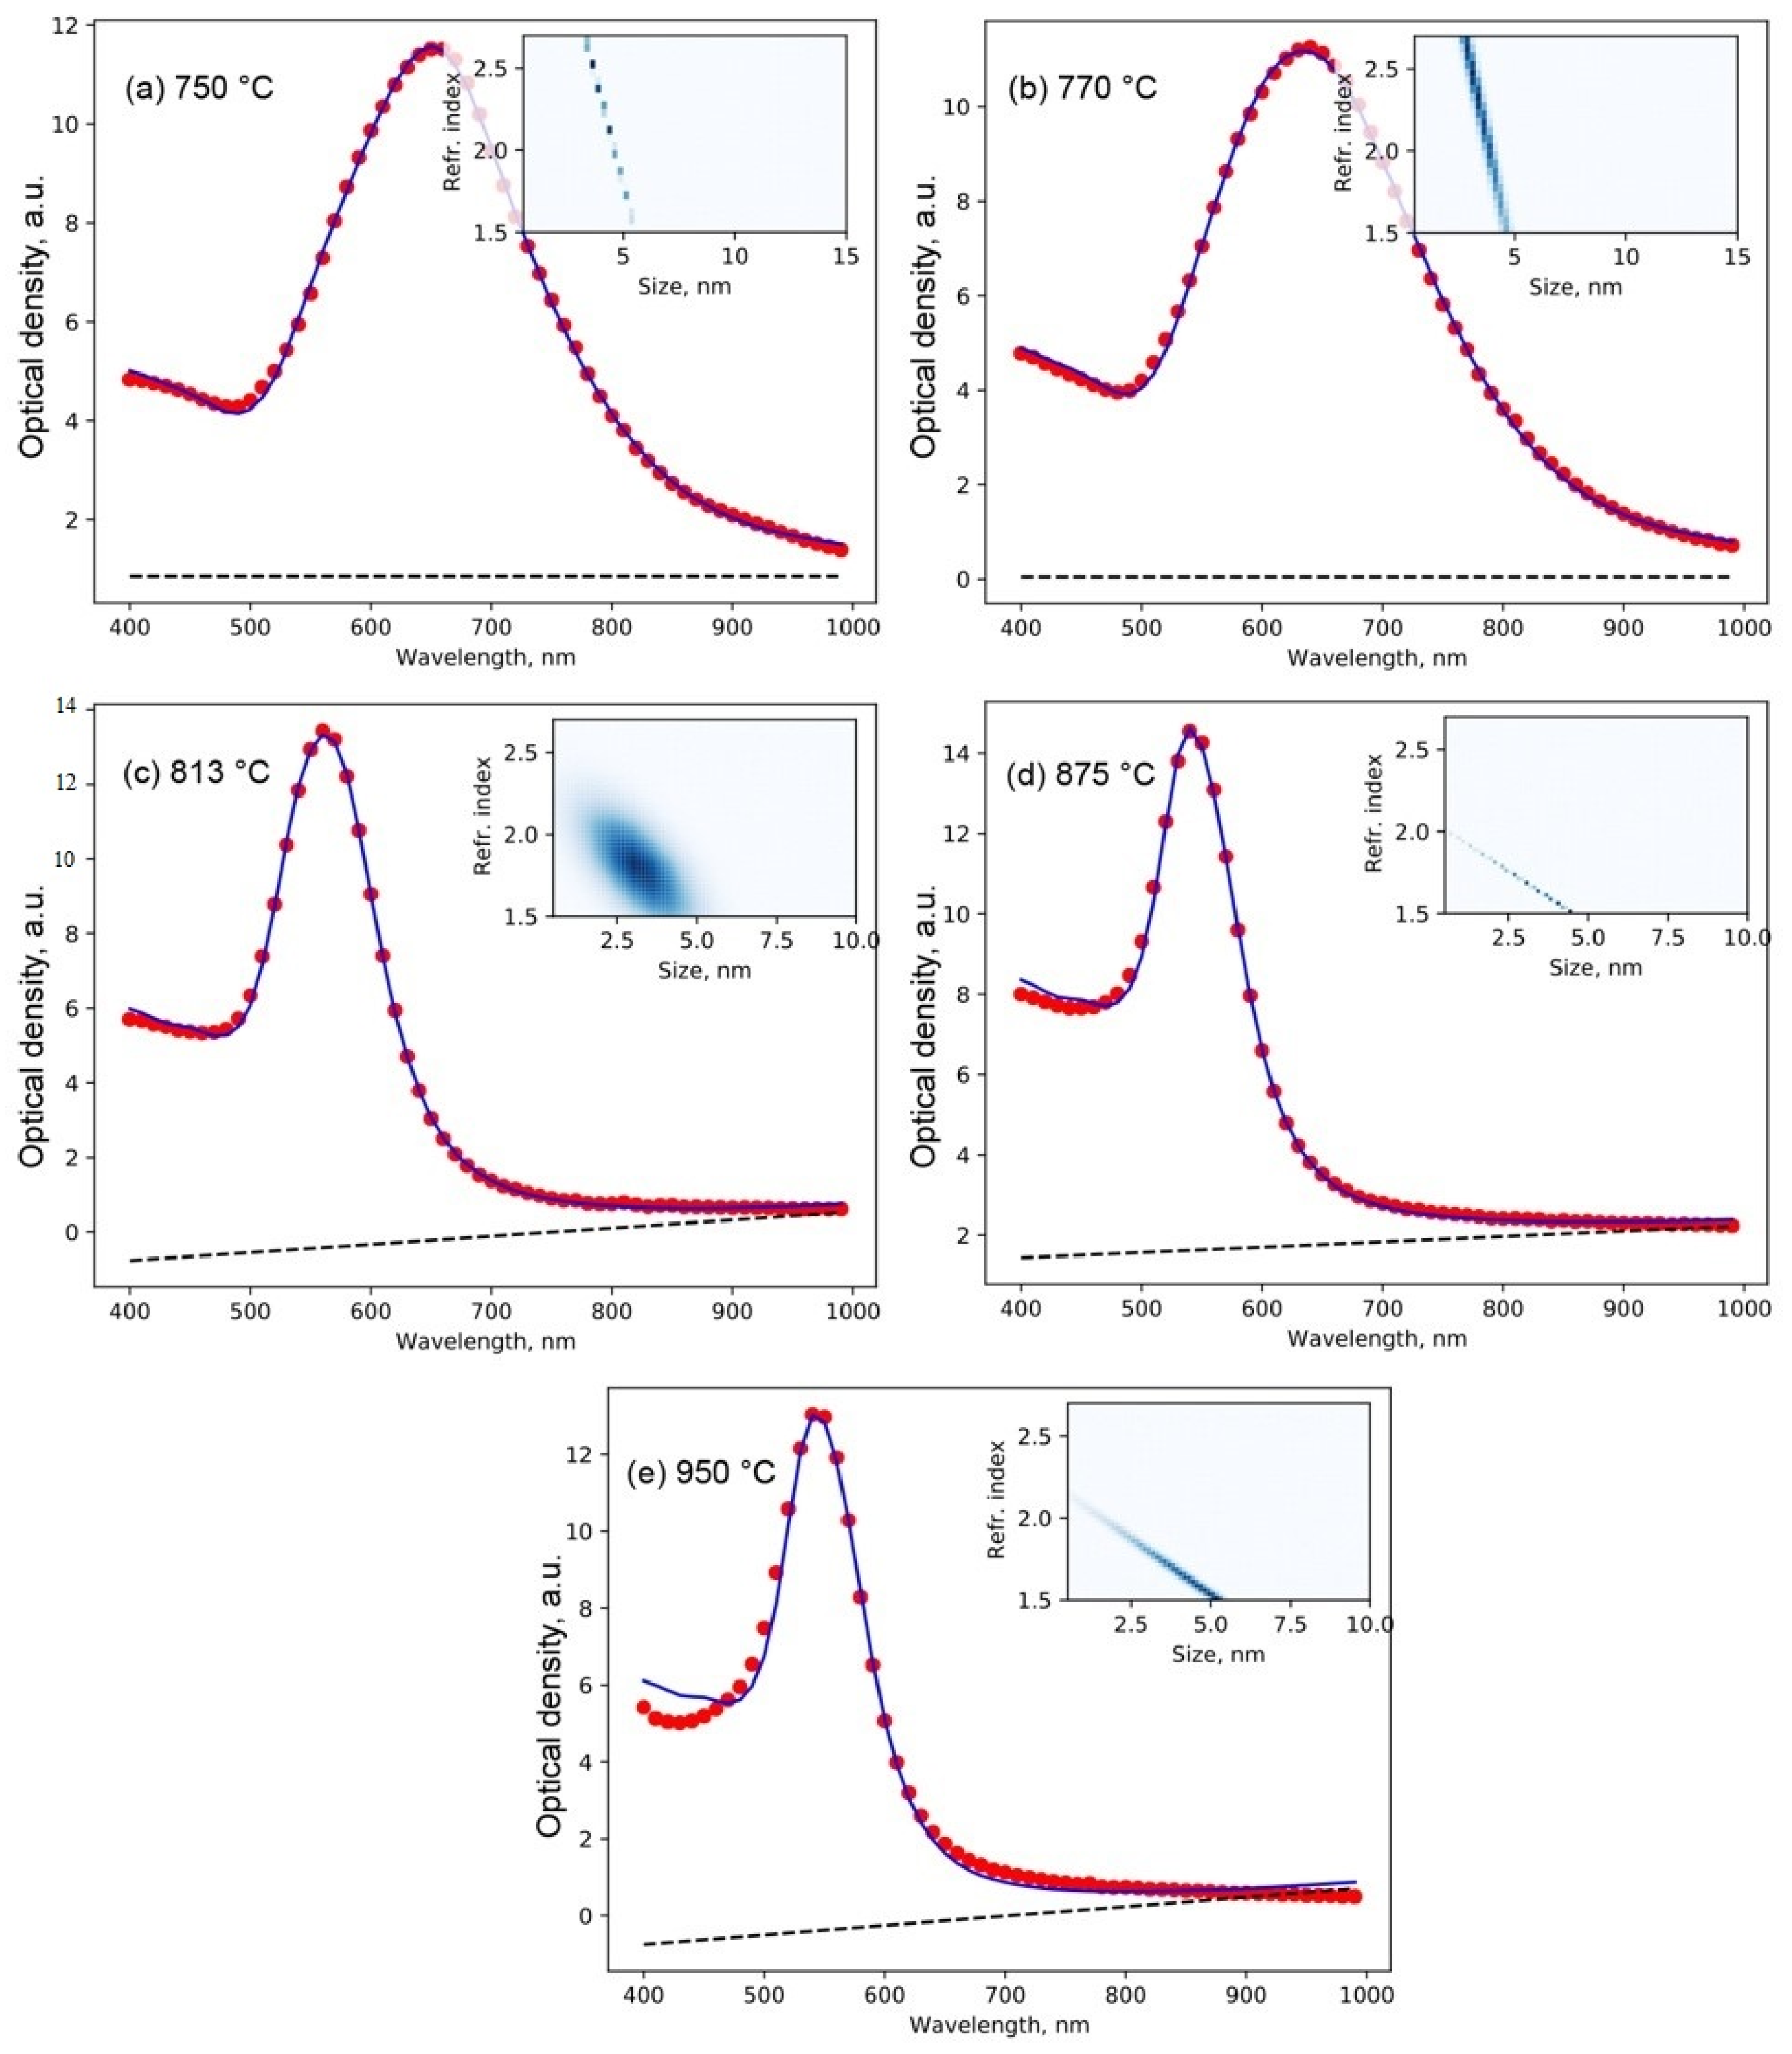
3.5. Optical Properties

Figure 10 displays optical absorption spectra of the Matrix glass samples before and after the heat treatment in the 650–950 °C range as well as photos of the samples. One can see that both the initial glass and samples heat treated up to 950 °C are transparent, while the sample treated at 1100 °C is translucent (absorption spectrum presented in Figure S1 of the Supplementary Materials). There is no coloration in the initial glass and samples treated up to 813 °C. Higher temperature treatment leads to light yellowish coloration for the sample treated at 875 °C and pronounced yellow color for the sample treated at 950 °C.
The observed color changes are related to the distinct shift of the UV absorption edge upon the heat treatment: for the initial glass, the UV absorption edge is observed at 375 nm and for the glass treated at 950 °C the edge redshifted to 422 nm. These changes are likely to have complex nature, and different factors can be responsible for the observed shift. The shift (from 3.3 to 2.9 eV) can be due to the onset of band-to-band excitations of precipitated gahnite crystals in the glass matrix, the increase of crystallized fraction, and the consequent increase of intensity of the UV absorption tail. Moreover, some absorption contribution could also be caused by O2–[Ti4+] charge transfer transitions [34].
Analysis of the absorption spectra of Au-doped glasses reveals the strong differences in the optical properties and crucial effect of the gold NPs. Figure 11a presents absorption spectra of the Au-doped glass samples before and after the heat treatment. It is obvious that the spectrum and appearance of the initial Au-doped glass and the spectrum of the initial Matrix glass are the same. However, all spectra of the heat treated Au-doped glass samples contain the absorption band with the repositionable maxima (Figure 11b). This band is characteristic of the LSPR of gold NPs and resulted from the resonant oscillation of conduction electrons at the surface of the NPs stimulated by incident light [40]. All heat-treated Au-doped samples are transparent and colored (Figure 11c). The color of the glass samples undergoes distinct change with the heat treatment temperature rise: from deep-blue at 750–770 °C, to violet at 813 °C, crimson at 875 °C, and finally bloody red at 950 °C.
Observed color changes are related to the blue shift of the LSPR band with the heat treatment (Figure 11b). The overall plasmonic shift obtained in this work is 117 nm which is the largest value for the gold NPs precipitated in glass to the best of our knowledge. Hence, despite there being an absence of any effect of gold NPs precipitated in the glass under study on the structure change and crystallization kinetics, they play a crucial role in the change of optical properties.
The origin of the LSPR shift and the observed color change we previously reported in [32]. We suggested that upon the low-temperature heat treatment, gold NPs precipitate in the phase-separated regions which probably have high values of the refractive index. Such an environment of the NPs with high refraction provides a redshift of the LSPR band. Further increase of the heat treatment temperature leads to the formation of gahnite nanocrystals from the phase separation sites. This results in the decline of the overall refractive index around the gold NPs and the blue shift of the LSPR band.
In order to verify the applicability of the previous suggestions to the glasses under study, we performed computer simulations of the absorption spectra of the Au-doped samples with the evolution of the heat treatment temperature. To take into account changes in the sizes of NPs and the refractive index of the glass, we consider an ensemble of nanoparticles described by a two-dimensional truncated normal distribution [41]:
f ( D , n ) = 1 2 π σ D σ n 1 r 2 e x p [ 1 1 r 2 ( ( D μ D ) 2 2 σ D 2 + ( n μ n ) 2 2 σ n 2 r ( D μ D ) ( n μ n ) σ D σ n ) ]
where the variables D (nanoparticle diameter) and n (local refractive index of the glass) were limited: 2 < D < 15 nm, 1.5 < n < 3.0. The distribution parameters μD, σD, μn, σn, and r were selected so as to ensure the best agreement between the calculated spectrum and the experimental one. For an uncut normal distribution, the parameters μ and σ determine the mean and variance, respectively.
The spectrum of each nanoparticle was calculated within the framework of the Mie theory [40], taking into account size-dependent corrections to the dielectric function of bulk gold, as we did earlier in [32] using the MSTM-Studio program [42]. The theoretical absorption spectrum of the glass with NPs was calculated in the diluted limit as a linear combination of contributions from each nanoparticle with weights determined by Equation (2).
The achieved theoretical description of the experimental curves and the resulting two-dimensional distributions are shown in Figure 12. One can see a very good agreement between the experimental and fitted spectra. This confirms the applicability of the proposed approach for the description of the LSPR shift in the glass during the heat treatment.
Figure 13a,b illustrates the dependence of the distribution of NPs by size and refractive index, respectively, of regions with NPs from the evolution of heat treatment temperature. With increasing of the temperature, the average NP size μD increases (lines in Figure 13a), while the size dispersion σD (width of the filled regions in Figure 13a) is retained. This behavior is expected and indicates the continued formation of gold NPs as the temperature increases. Despite the proposed increase of the NP size the overall quantity of the NPs is too low, which is why we cannot detect it using the TEM.
The highest refractive index with the average value μn ≈ 2.5 of the glass regions containing gold NPs is achieved at a treatment temperature of 750 °C. Heat treatment at higher temperatures leads to a decrease in the average refractive index of the material, down to the values of the initial glass, n = 1.5–1.6.
The evidence from the study of the optical properties of the Matrix and Au-doped glasses subjected to heat treatments suggests that gold NPs have a great effect on the color and absorption spectra of glasses. Moreover, phase separation plays a crucial role in the location of the LSPR band in the visible part of the spectrum. We propose that a possible area of future research would be to investigate the plasmonic enhancement of the rare-earth ions’ photoluminescence by the tunable LSPR in the co-doped Au/rare-earth glass systems.

4. Conclusions

The effect of Au-doping on structure, crystallization, and optical properties of ZnO-MgO-Al2O3-SiO2 glass containing TiO2 and ZrO2 as nucleating agents were studied. We showed that thermally-induced precipitation of gold NPs has no effect on the structure and crystallization of the studied glass. Taken together, obtained results suggest that regardless of the Au-doping, heat treatment of the glass above the crystallization peak (872 °C) leads to the volume formation of spinel-type gahnite crystallites from 10 to 25 nm in size. Heat treatment below the crystallization peak results in the development of the amorphous phase-separated regions up to 10 nm in size and the formation of 3–4 nm crystallites.
Conversely, the findings from the performed studies on the optical properties suggest that Au-doping has a crucial effect on the color and electronic structure of the glass. Gold NPs precipitated in the glass during the heat treatments cause the appearance of the absorption band due to the LSPR of NPs. Change of the heat treatment temperature allows adjusting the LSPR band position with the possible shift of 117 nm in the visible part of the spectrum. Using the computational methods, we showed that one possible implication of this is a change of the local refractive index around the NPs in the 1.5–2.6 range occurring during the phase separation and crystallization process of glass. We propose that a possible area of future research would be to investigate the plasmonic enhancement of the rare-earth ions’ photoluminescence by the tunable LSPR in the co-doped Au/rare-earth glass systems.

Supplementary Materials

The following are available online at www.mdpi.com/article/10.3390/cryst12020287/s1, Figure S1: Absorption spectrum of the glass sample heat-treated at 1100 °C for 20 h. Inset shows the photo of the glass sample.

Author Contributions

Conceptualization, G.S. and V.D.; Funding acquisition, G.S.; Investigation, M.Z., G.A., N.G., A.T. and O.C.; Methodology, G.A. and N.G.; Supervision, V.S.; Visualization, M.Z., A.T. and L.A.; Writing—original draft, G.S. and L.A.; Writing—review and editing, N.G., L.A., L.B. and V.S. All authors have read and agreed to the published version of the manuscript.

Funding

This research was funded by Mendeleev University of Chemical Technology, project number 2020-012.

Institutional Review Board Statement

Not applicable.

Informed Consent Statement

Not applicable.

Data Availability Statement

The data presented in this study are available on request from the corresponding author. The data are not publicly available due to privacy restriction.

Conflicts of Interest

The authors declare no conflict of interest.

References

  1. Soukoulis, C.M.; Wegener, M. Past Achievements and Future Challenges in the Development of Three-Dimensional Photonic Metamaterials. Nat. Photonics 2011, 5, 523–530. [Google Scholar] [CrossRef] [Green Version]
  2. Komatsu, T.; Honma, T. Optical Active Nano-Glass-Ceramics. Int. J. Appl. Glass Sci. 2013, 4, 125–135. [Google Scholar] [CrossRef]
  3. Gorni, G.; Velázquez, J.; Mosa, J.; Balda, R.; Fernández, J.; Durán, A.; Castro, Y. Transparent Glass-Ceramics Produced by Sol-Gel: A Suitable Alternative for Photonic Materials. Materials 2018, 11, 212. [Google Scholar] [CrossRef] [Green Version]
  4. Liu, X.; Zhou, J.; Zhou, S.; Yue, Y.; Qiu, J. Transparent Glass-Ceramics Functionalized by Dispersed Crystals. Prog. Mater. Sci. 2018, 97, 38–96. [Google Scholar] [CrossRef]
  5. Veber, A.; Lu, Z.; Vermillac, M.; Pigeonneau, F.; Blanc, W.; Petit, L. Nano-Structured Optical Fibers Made of Glass-Ceramics, and Phase Separated and Metallic Particle-Containing Glasses. Fibers 2019, 7, 105. [Google Scholar] [CrossRef] [Green Version]
  6. Golubev, N.V.; Ignat’eva, E.S.; Mashinsky, V.M.; Kozlova, E.O.; Sigaev, V.N.; Monguzzi, A.; Paleari, A.; Lorenzi, R. Pre-Crystallization Heat Treatment and Infrared Luminescence Enhancement in Ni2+-Doped Transparent Glass-Ceramics. J. Non-Cryst. Solids 2019, 515, 42–49. [Google Scholar] [CrossRef]
  7. Lorenzi, R.; Golubev, N.V.; Ignat’eva, E.S.; Sigaev, V.N.; Ferrara, C.; Acciarri, M.; Vanacore, G.M.; Paleari, A. Defect-Assisted Photocatalytic Activity of Glass-Embedded Gallium Oxide Nanocrystals. J. Colloid Interface Sci. 2022, 608, 2830–2838. [Google Scholar] [CrossRef]
  8. Venkateswaran, C.; Sreemoolanadhan, H.; Vaish, R. Lithium Aluminosilicate (LAS) Glass-Ceramics: A Review of Recent Progress. Int. Mater. Rev. 2021, 1–38. [Google Scholar] [CrossRef]
  9. Shakhgil’dyan, G.Y.; Savinkov, V.I.; Shakhgil’dyan, A.Y.; Alekseev, R.O.; Naumov, A.S.; Lopatkina, E.V.; Sigaev, V.N. Effect of Sitallization Conditions on the Hardness of Transparent Sitalls in the System ZnO–MgO–Al2O3–SiO2. Glass Ceram. 2021, 77, 426–428. [Google Scholar] [CrossRef]
  10. Sant’Ana Gallo, L.; Célarié, F.; Bettini, J.; Rodrigues, A.C.M.; Rouxel, T.; Zanotto, E.D. Fracture Toughness and Hardness of Transparent MgO–Al2O3–SiO2 Glass-Ceramics. Ceram. Int. 2021. [Google Scholar] [CrossRef]
  11. Wang, Z.; Wang, Z.; Gan, L.; Zhang, J.; Wang, P. Structure/Property Nonlinear Variation Induced by Gamma Ray Irradiation of Boroaluminosilicate Transparent Glass Ceramic Containing Gahnite Nanocrystallite. J. Non-Cryst. Solids 2022, 578, 121346. [Google Scholar] [CrossRef]
  12. Chakraborty, P. Metal Nanoclusters in Glasses as Non-Linear Photonic Materials. J. Mater. Sci. 1998, 33, 2235–2249. [Google Scholar] [CrossRef]
  13. Savinkov, V.I.; Shakhgil’Dyan, G.Y.; Paleari, A.; Sigaev, V.N. Synthesis of Optically Uniform Glasses Containing Gold Nanoparticles: Spectral and Nonlinear Optical Properties. Glass Ceram. (Engl. Transl. Steklo Keram.) 2013, 70, 143–148. [Google Scholar] [CrossRef]
  14. Shakhgildyan, G.Y.; Lipatiev, A.S.; Fedotov, S.S.; Vetchinnikov, M.P.; Lotarev, S.V.; Sigaev, V.N. Microstructure and Optical Properties of Tracks with Precipitated Silver Nanoparticles and Clusters Inscribed by the Laser Irradiation in Phosphate Glass. Ceram. Int. 2021, 47, 14320–14329. [Google Scholar] [CrossRef]
  15. Shakhgil’dyan, G.Y.; Lipat’ev, A.S.; Vetchinnikov, M.P.; Popova, V.V.; Lotarev, S.V.; Sigaev, V.N. Femtosecond Laser Modification of Zinc-Phosphate Glasses with High Silver Oxide Content. Glass Ceram. (Engl. Transl. Steklo Keram.) 2017, 73, 420–422. [Google Scholar] [CrossRef]
  16. Lipat’ev, A.; Shakhgil’dyan, G.; Lipat’eva, T.; Lotarev, S.; Fedotov, S.; Vetchinnikov, M.; Ignat’eva, E.; Golubev, N.; Sigaev, V.; Kazanskii, P. Formation of Luminescent and Birefringent Microregions in Phosphate Glass Containing Silver. Glass Ceram. 2016, 73, 277–282. [Google Scholar] [CrossRef]
  17. Drexhage, K.H. Influence of a Dielectric Interface on Fluorescence Decay Time. J. Lumin. 1970, 1–2, 693–701. [Google Scholar] [CrossRef]
  18. Shakhgil’dyan, G.Y.; Ziyatdinova, M.Z.; Kovgar, V.V.; Lotarev, S.V.; Sigaev, V.N.; Prusova, I.V. Effect of Gold Nanoparticles on the Spectral Luminescence Properties of Eu3+-Doped Phosphate Glass. Glass Ceram. (Engl. Transl. Steklo I Keram.) 2019, 76, 121–125. [Google Scholar] [CrossRef]
  19. Shakhgildyan, G.Y.; Ziyatdinova, M.Z.; Vetchinnikov, M.P.; Lotarev, S.V.; Savinkov, V.I.; Presnyakova, N.N.; Lopatina, E.V.; Vilkovisky, G.A.; Sigaev, V.N. Thermally-Induced Precipitation of Gold Nanoparticles in Phosphate Glass: Effect on the Optical Properties of Er3+ Ions. J. Non-Cryst. Solids 2020, 550, 120408. [Google Scholar] [CrossRef]
  20. Jiménez, J.A.; Smith, S. Gold-Assisted Enhancement of the Luminescence of Mn2+ Ions Induced by Silicon in Phosphate Glass. Phys. Lett. A 2020, 384, 126776. [Google Scholar] [CrossRef]
  21. Danmallam, I.M.; Ghoshal, S.K.; Ariffin, R.; Bulus, I. Europium Luminescence in Silver and Gold Nanoparticles Co-Embedded Phosphate Glasses: Judd-Ofelt Calculation. Opt. Mater. 2020, 105, 109889. [Google Scholar] [CrossRef]
  22. Deubener, J.; Allix, M.; Davis, M.J.; Duran, A.; Höche, T.; Honma, T.; Komatsu, T.; Krüger, S.; Mitra, I.; Müller, R.; et al. Updated Definition of Glass-Ceramics. J. Non-Cryst. Solids 2018, 501, 3–10. [Google Scholar] [CrossRef]
  23. Sakamoto, A.; Yamamoto, S. Glass-Ceramics: Engineering Principles and Applications. Int. J. Appl. Glass Sci. 2010, 1, 237–247. [Google Scholar] [CrossRef]
  24. Stookey, S.D. Catalyzed Crystallization of Glass in Theory and Practice. Ind. Eng. Chem. 1959, 51, 805–808. [Google Scholar] [CrossRef]
  25. Garai, M.; Sasmal, N.; Molla, A.R.; Tarafder, A.; Karmakar, B. Effects of In-Situ Generated Coinage Nanometals on Crystallization and Microstructure of Fluorophlogopite Mica Containing Glass‒Ceramics. J. Mater. Sci. Technol. 2015, 31, 110–119. [Google Scholar] [CrossRef]
  26. Garai, M.; Murthy, T.S.R.C.; Karmakar, B. Microstructural Characterization and Wear Properties of Silver and Gold Nanoparticle Doped K-Mg-Al-Si-O-F Glass-Ceramics. Ceram. Int. 2018, 44, 22308–22317. [Google Scholar] [CrossRef]
  27. Garai, M.; Reka, A.A.; Karmakar, B.; Molla, A.R. Microstructure–Mechanical Properties of Ag0/Au0 Doped K–Mg–Al–Si–O–F Glass-Ceramics. RSC Adv. 2021, 11, 11415–11424. [Google Scholar] [CrossRef]
  28. Kochetkov, D.A.; Nikonorov, N.V.; Sycheva, G.A.; Tsekhomskii, V.A. The Effect of Gold Nanoparticles on Crystallization Processes in Photostructured Lithium-Silicate Glass. Glass Phys. Chem. 2013, 39, 351–357. [Google Scholar] [CrossRef]
  29. Thieme, C.; Kracker, M.; Patzig, C.; Thieme, K.; Rüssel, C.; Höche, T. The Acceleration of Crystal Growth of Gold-Doped Glasses within the System BaO/SrO/ZnO/SiO2. J. Eur. Ceram. Soc. 2019, 39, 554–562. [Google Scholar] [CrossRef]
  30. Garai, M.; Molla, A.R.; Reka, A.A.; Karmakar, B. Wide Thermal Expansion in Ag0/Au0 Nanoparticle Doped SiO2-MgO-Al2O3-B2O3-K2O-MgF2 Glass-Ceramics. Mater. Today Proc. 2021, 50, 134–138. [Google Scholar] [CrossRef]
  31. Kracker, M.; Thieme, C.; Thieme, K.; Patzig, C.; Berthold, L.; Höche, T.; Rüssel, C. Redox Effects and Formation of Gold Nanoparticles for the Nucleation of Low Thermal Expansion Phases from BaO/SrO/ZnO/SiO2 Glasses. RSC Adv. 2018, 8, 6267–6277. [Google Scholar] [CrossRef] [Green Version]
  32. Shakhgildyan, G.; Avakyan, L.; Ziyatdinova, M.; Atroshchenko, G.; Presnyakova, N.; Vetchinnikov, M.; Lipatiev, A.; Bugaev, L.; Sigaev, V. Tuning the Plasmon Resonance of Gold Nanoparticles in Phase-Separated Glass via the Local Refractive Index Change. J. Non-Cryst. Solids 2021, 566, 120893. [Google Scholar] [CrossRef]
  33. Langford, J.I.; Wilson, A.J.C. Scherrer after Sixty Years: A Survey and Some New Results in the Determination of Crystallite Size. J. Appl. Crystallogr. 1978, 11, 102–113. [Google Scholar] [CrossRef]
  34. Basyrova, L.; Bukina, V.; Balabanov, S.; Belyaev, A.; Drobotenko, V.; Dymshits, O.; Alekseeva, I.; Tsenter, M.; Zapalova, S.; Khubetsov, A.; et al. Synthesis, Structure and Spectroscopy of Fe2+:MgAl2O4 Transparent Ceramics and Glass-Ceramics. J. Lumin. 2021, 236, 118090. [Google Scholar] [CrossRef]
  35. Loiko, P.A.; Dymshits, O.S.; Skoptsov, N.A.; Malyarevich, A.M.; Zhilin, A.A.; Alekseeva, I.P.; Tsenter, M.Y.; Bogdanov, K.V.; Mateos, X.; Yumashev, K.V. Crystallization and Nonlinear Optical Properties of Transparent Glass-Ceramics with Co:Mg(Al,Ga)2O4 Nanocrystals for Saturable Absorbers of Lasers at 1.6–1.7. Mm. J. Phys. Chem. Solids 2017, 103, 132–141. [Google Scholar] [CrossRef]
  36. Kurajica, S.; Šipušić, J.; Zupancic, M.; Brautović, I.; Albrecht, M. ZnO-Al2O3-SiO2 Glass Ceramics: Influence of Composition on Crystal Phases, Crystallite Size and Appearance. J. Non-Cryst. Solids 2020, 553, 120481. [Google Scholar] [CrossRef]
  37. Golubkov, V.V.; Dymshits, O.S.; Petrov, V.I.; Shashkin, A.V.; Tsenter, M.Y.; Zhilin, A.A.; Kang, U. Small-Angle X-Ray Scattering and Low-Frequency Raman Scattering Study of Liquid Phase Separation and Crystallization in Titania-Containing Glasses of the ZnO–Al2O3–SiO2 System. J. Non-Cryst. Solids 2005, 351, 711–721. [Google Scholar] [CrossRef]
  38. Loshmanov, A.A.; Sigaev, V.N.; Khodakovskaya, R.Y.; Pavlushkin, N.M.; Yamzin, I.I. Small-Angle Neutron Scattering on Silica Glasses Containing Titania. J. Appl. Crystallogr. 1974, 7, 207–210. [Google Scholar] [CrossRef]
  39. Dymshits, O.S.; Zhilin, A.A.; Petrov, V.I.; Tsenter, M.Y.; Chuvaeva, T.I.; Shashkin, A.V.; Golubkov, V.V.; Kang, U.; Lee, K.-H. A Raman Spectroscopic Study of Phase Transformations in Titanium-Containing Magnesium Aluminosilicate Glasses. Glass Phys. Chem. 2002, 28, 66–78. [Google Scholar] [CrossRef]
  40. Kreibig, U.; Genzel, L. Optical Absorption of Small Metallic Particles. Surf. Sci. 1985, 156, 678–700. [Google Scholar] [CrossRef]
  41. Tong, Y.L. The Multivariate Normal Distribution; Springer: New York, NY, USA, 1990; ISBN 978-1-4613-9657-4. [Google Scholar]
  42. Avakyan, L.A.; Heinz, M.; Skidanenko, A.V.; Yablunovski, K.A.; Ihlemann, J.; Meinertz, J.; Patzig, C.; Dubiel, M.; Bugaev, L.A. Insight on Agglomerates of Gold Nanoparticles in Glass Based on Surface Plasmon Resonance Spectrum: Study by Multi-Spheres T-Matrix Method. J. Phys. Condens. Matter 2018, 30, 045901. [Google Scholar] [CrossRef] [PubMed]
Figure 1. (a) DCS curves of the glass samples (Tg—glass transition temperature, TC—the temperature of the crystallization peak); (b) variation of density with the heat treatment temperature for the glass samples. The heat treatment duration was 20 h. The dashed lines in (b) serve as a guide for the eye. The error bars match the size of the symbols.
Crystals 12 00287 g001
Figure 2. XRD patterns of the glass samples within the Matrix series after treatment at the indicated temperatures for 20 h compared to the XRD pattern of the parent glass. Symbols are indicated the following crystal phases: Δ—#01-074-1136 (ZnAlO4), V—#01-074-9434 (ZrTiO4), X—#00-060-0061 (Al2Mg3O18Si6). The patterns are shifted for the convenience of observation.
Crystals 12 00287 g002
Figure 3. (a) Crystallized fraction and (b) crystallite size of the gahnite determined from the XRD studies for the glass samples heat treated up to 1100 °C for 20 h for the Matrix series.
Crystals 12 00287 g003
Figure 4. XRD patterns of the glass samples within the Matrix and Au-doped series after treatment at 770 or 950 °C for 20 h. Symbols are indicated the following crystal phases: Δ—#01-074-1136 (ZnAlO4), V—#01-074-9434 (ZrTiO4).
Crystals 12 00287 g004
Figure 5. TEM image of the Au-doped glass sample heat treated at 750 °C for 20 h. The right image depicts magnified region in red.
Crystals 12 00287 g005
Figure 6. (a) TEM and (b) HRTEM images of the Au-doped glass sample heat treated at 770 °C for 20 h.
Crystals 12 00287 g006
Figure 7. (a) TEM and (b) HRTEM images of the Au-doped glass sample heat treated at 950 °C for 20 h. (c) the size distribution of nanocrystals and (d) corresponding SAED patterns of the area in (b).
Crystals 12 00287 g007
Figure 8. Raman spectra of the glass samples of the Matrix series before and after the heat treatment in the 650–1100 °C range for 20 h.
Crystals 12 00287 g008
Figure 9. Raman spectra of the glass samples heat treated in the 770–1100 °C range for 20 h for the Matrix and Au-doped series.
Crystals 12 00287 g009
Figure 10. Absorption spectra of the Matrix glass samples before and after treatment at the indicated temperatures for 20 h. Inset—photos of the samples.
Crystals 12 00287 g010
Figure 11. (a) Absorption spectra of the Au-doped glass samples before and after the heat treatment in the 650–950 °C range for 20 h; (b) change of the LSPR peak wavelength with a variation of the heat treatment temperature; (c) photos of the samples.
Crystals 12 00287 g011
Figure 12. (ae) Fitting quality of the absorption spectra of the Au-doped glass samples upon the heat treatment in the 750–950 °C range. Red dots—experimental spectrum, solid blue line—theoretical spectrum, dashed line—background contribution. The inset illustrates the obtained 2D normal distribution of NPs over the sizes and glass refraction index defined by Equation (2).
Crystals 12 00287 g012
Figure 13. Illustration of the obtained size distributions (a) and glass refractive index (b) for gold NPs in samples obtained at heat treatment temperatures from 750 to 950 °C. The solid line corresponds to the parameter μ, and the shaded areas correspond to the deviation from μ by ±0.5σ.
Crystals 12 00287 g013
Publisher’s Note: MDPI stays neutral with regard to jurisdictional claims in published maps and institutional affiliations.

