Abstract
Laser-induced plasma micromachining (LIPMM) can be used to fabricate high-quality microstructures of hard and brittle materials. The liquid medium of the LIPMM process plays a key role in inducing the plasma and cooling the materials, but the liquid medium is overheated which induces lots of bubbles to defocus the laser beam and reduce machining stability. In this paper, a comparative investigation on bubble behavior and its effect on the surface integrity of microchannels in three types of liquids and at different depths during LIPMM has been presented. Firstly, the formation mechanism of microbubbles was described. Secondly, a series of experiments were conducted to study the number and maximum diameter of the attached bubbles and the buoyancy movement of floating bubbles in the LIPMM of single-crystal silicon under deionized water, absolute ethyl alcohol, and 5.6 mol/L phosphoric acid solution with a liquid layer depth of 1–5 mm. It was revealed that the number and maximum diameter of attached bubbles in deionized water were the highest due to its high tension. Different from the continuous rising of bubbles at the tail of the microchannels in the other two liquids, microbubbles in 5.6 mol/L phosphoric acid solution with high viscosity rose intermittently, which formed a large area of bubble barrier to seriously affect the laser focus, resulting in a discontinuous microchannel with an unablated segment of 26.31 μm. When the depth of the liquid layer was 4 mm, absolute ethyl alcohol showed the advantages in narrow width (27.15 μm), large depth (16.5 μm), and uniform depth profile of the microchannel by LIPMM. This was because microbubbles in the anhydrous ethanol quickly and explosively spread towards the edge of the laser processing zone to reduce the bubble interference. This research contributes to a better understanding of the behavior and influence of bubbles in different liquid media and depths in LIPMM of single-crystal silicon.
1. Introduction
Single-crystal silicon is the key essential material of semiconductors with outstanding electrical properties and photovoltaic characteristics and has been widely used in the fields of optoelectronics and microelectronic devices [1]. However, it is difficult to fabricate high-precision microstructures of silicon wafer due to its high degree of hardness (12–14 GPa) and low level of fracture toughness (~1 MPa·m(1/2)), which leads to significant restriction in the applications of conventional mechanical machining technologies like turning, milling, or grinding [2]. Ehmann et al. [3] proposed a novel type of underwater micromachining process, laser-induced plasma micromachining (LIPMM), to fabricate microchannels on the silicon surface through high-temperature spot plasma in the liquid.
Compared with conventional mechanical machining technologies like turning, milling, or grinding which generate considerable cutting force leading to severe tool wear and surface damage (microcracks), as well as low machining accuracy and efficiency, the proposed LIPMM is not restricted by the hardness and brittleness of materials to without contact machining for the reason that the principle of this process is to focus a laser beam on a liquid medium to induce a high-temperature plasma which is used to remove material. Thus, LIPMM could solve these drawbacks of conventional mechanical machining technologies and achieve a high machining quality of single-crystal silicon. The material removal mechanism of LIPMM is similar to that of electrical discharge machining (EDM). The material removal of the two processes depends on the coupling of thermal energy and the mechanical energy of the plasma [4,5]. Totally different from EDM, LIPMM can be used to machine non-conductive materials and is not restricted by wear or size of tool electrodes [6], thereby effectively improving the dimensional accuracy of the workpiece. With the expansion of the induced plasma, its resistance generates recoil pressure acting on the processing zone to cause debris splashing [7]. By comparison of a laser through air, the liquid of LIPMM can not only remove the redundant heat and debris on the machine surface, but also contribute to weakening the plasma shielding effect [8]. Charee et al. [9] found out that high water flow efficiently flushed away the debris from the machined surface to block its deposition, thereby machining clean microgrooves on the silicon wafer. The redeposition phenomenon of molten material in LIPMM was reduced and a high-quality surface with little recast layer was achieved from the research of Muhammad et al. [10]. Thus, LIPMM showed strong potential in the micromachining of non-conductive hard and brittle materials with low thermal damage and no contact-cutting force.
However, the extremely high temperature of the plasma used for removing the materials inevitably causes a phase transformation of the surrounding liquid medium, and a large number of microbubbles are formed that move towards the liquid surface and attach to both sides of the microchannel [11]. In the case of continuous laser pulses, there tends to be more bubbles because of the heat accumulation effect [12]. Additionally, the formation of the microchannel also constrains the bubbles and results in different sizes of attached bubbles [6]. The existence of these microbubbles causes defocus and energy dissipation of the pulsed laser, which ultimately reduces machining stability and the quality of the surface microstructures. Moreover, the shockwave emitted by bubble collapse is also detrimental to the surface morphology [13]. So Tangwarodomnukun et al. [14] implemented an ice layer to replace the liquid layer in laser micromachining of silicon wafers to develop machining stability. Though the water made from the melting ice could provide key contributions to heat dissipation and debris removal, the problem of the formation of a large number of microbubbles still cannot be effectively solved.
In LIPMM, the parameters of the liquid medium, like the laser parameters, are also the main factors affecting the quality of the microchannel. In order to study the effect of liquid on the machining efficiency and surface quality of a picosecond laser cutting germanium, Barcikowski et al. [15] mixed ethanol with distilled water. The results showed that as the ethanol content in the solution increased, the cutting quality was improved. Compared with the pits machined in the air, the pits machined in ethanol were cleaner and the hardness of the pits was higher. More uniform nano-scale colloids, liquids, and pores were observed on the microscopic surface [16]. Jin et al. [17] found that with the increase of liquid viscosity or surface tension, the range of the bubble size distribution became wider. At the same time, Kováts et al. [18] also found that bubble size was positively correlated with liquid viscosity and surface tension, while bubble velocity was negatively correlated with liquid viscosity and positively correlated with surface tension. In addition, the results of Abdulkadir et al. [19] showed that as the viscosity of the liquid increased, the resistance of the bubbles increased and eventually the bubbles were more likely to coalesce. In the glycerin aqueous solution, the bubble was constrained by the liquid resistance after its formation, and the velocity decreased first, but as the bubble shape became stable, the bubble velocity increased until the resultant force of the bubble reached equilibrium [20].
At present, pure water or deionized water is commonly used in LIPMM as its liquid medium [21], but there are few articles on the formation of bubbles and the quality of microchannels in other liquid media. Since different liquid media have different thermal physical properties, the bubble behavior generated by LIPMM will show the obvious difference in the different liquid media. It is imperative to find out the appropriate liquid to relieve the negative effect of bubble behavior on machining stability and quality.
According to the above research questions, this paper compared and analyzed bubble behavior in different liquids when picosecond laser-induced plasma micromachining silicon. Section 2 illustrates the forming mechanisms of bubbles in LIPMM. Section 3 describes the experimental procedure. Section 4 conducts the comprehensive analysis of the simulation and experimental results, and the conclusions are drawn in Section 5.
2. Materials and Methods
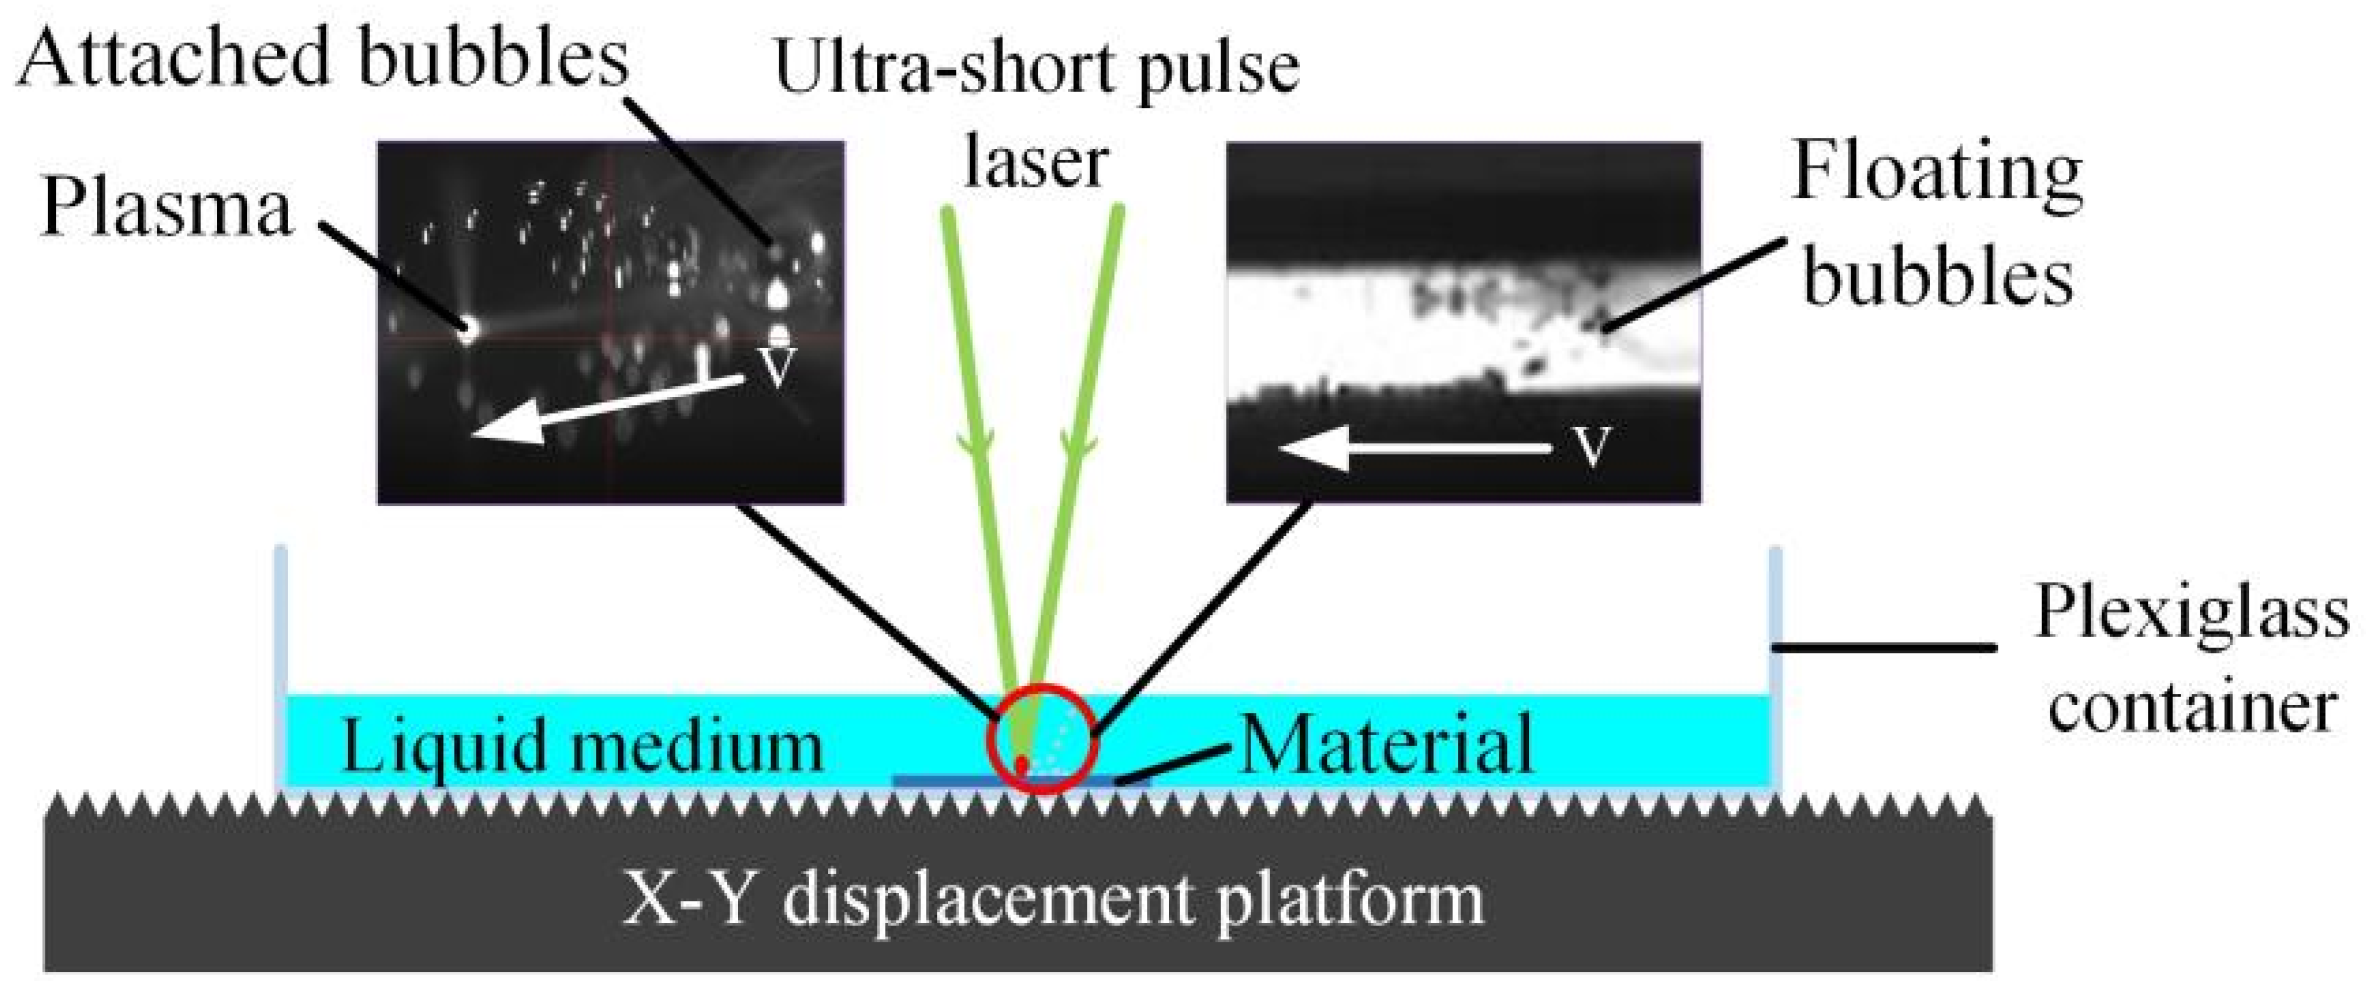
The theory of LIPMM is that when the focus of an ultrashort pulsed laser instantly induces optical breakdown of liquid medium and material (exceeding the critical breakdown threshold), high-temperature plasma is generated to achieve material removal through a thermo-mechanical coupling effect accompanying the plasma evolution process. The moving trajectory of the laser focus is controlled to obtain different microstructures. As shown in Figure 1, the optical breakdown results in rapidly heating up the processing area, and with the effect of heat diffusion, a large number of microbubbles with different initial velocity and direction are ejected from the processing area. A small number of bubbles are ejected close to the microchannel and captured by the surface of the workpiece due to the constraint of adhesion force (adhesion force is related to surface roughness and surface microdefects). The size of these attached bubbles changes continuously under the action of the large temperature gradient of the processing area and the external pressure of the surrounding liquid. When the mechanical disequilibrium of the bubble surface leads to bubble collapse, the shock wave of bubble cavitation will cause microcraters on the silicon surface. On the other hand, most of the microbubbles move upwards due to the effect of buoyancy and eventually float at the liquid–air interface. These floating bubbles may hinder laser focus during the next laser pulse, reducing machining stability, which in turn has a negative impact on surface quality. In this paper, bubbles attached onto the machined surface of silicon were mainly quantitatively analyzed in different liquids, which could directly impact the surface integrity of silicon, while floating bubbles were qualitatively analyzed by use of high-speed observed images.

Figure 1.
Schematic of LIPMM.
3. Experimental Procedure
3.1. Materials and Equipment
The sample of this experiment was a 2-inch circular polished silicon wafer with a thickness of 1 mm, which was attached to the bottom of the plexiglass tank (20 mm × 20 mm × 5 mm). A thin layer of liquid was poured into the tank to enable the silicon sample to be fully immersed. The solid-state laser (Huaray pin-532-7) in this experiment could generate a laser with a fixed pulse width of 8 ps and a wavelength of 532 nm. As shown in Figure 2, the laser was focused on the liquid medium and the sample surface after passing through various optical elements, and then the plasma was immediately induced on the material surface to remove the silicon with a focal spot of 50 μm.
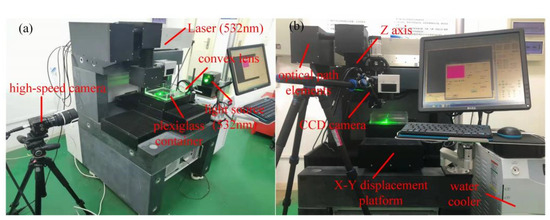
Figure 2.
Devices: (a) side-view path; (b) top-view path.
Figure 2a shows the optical measurement capturing a side view of the bubble motion. Another light source with a wavelength of 532 nm passed through the convex lens and was transformed into parallel light, which then irradiated the laser processing region and was finally captured by a high-speed camera along the light path. Figure 2b shows the optical measurement capturing a top view of the bubble motion. A CCD camera equipped with a telecentric lens was directed towards the plasma processing area, and its position was adjusted to ensure that the entire microchannel processing could be fully observed. Additionally, the high-speed cameras and CCD cameras were equipped with an optical filter in front of the lens to filter out most of the bright light and ensure a clear image of the bubble.
3.2. Experimental Design
As shown in Table 1, the single-factor experimental study in this paper included two process variables: namely, the type of liquid medium and the depth of the liquid layer. The three types of liquid medium were deionized water, absolute ethyl alcohol, and 5.6 mol/L phosphoric acid solution. The depths of the liquids were set as five levels: namely, 1, 2, 3, 4, and 5 mm. Other process parameters were constant in the experiment, as shown in Table 2. The bubbles that attached onto the machined surface of silicon were counted, and the experimental results of the attached bubble numbers and the maximum diameter of these bubbles are listed in Table 1.

Table 1.
Experimental results.
Table 2.
Constant process parameters.
3.3. Measurements and Characterizations
The number of attached bubbles and the maximum diameter of the attached bubbles under different processing parameters were counted and recorded according to the images observed by CCD camera during a period of 2 s. The maximum diameter referred to the diameter of the largest of the bubbles attached to either side of the microchannel at the end of processing. After the processing, the telecentric lens at the front of the CCD camera and the CCD camera were slowly moved to observe the bubbles around the microchannel together. When moved to a new position, the camera should be refocused each time to ensure the accuracy of the number of tiny, attached bubbles. In addition, the position of the largest attached bubble was also noted in the process in order to capture the image containing the largest attached bubble in the next step. In other words, during the selection of the largest attached bubble, the bubbles needed to be compared in size. The size of the largest bubble (maximum diameter) was the size of a single bubble, not the average diameter value of multiple bubbles. The diameter of the largest attached bubble was measured with a microchannel length of 2 mm as a measurement benchmark. During the recording process of the bubble floating trajectory, the brightness of the external 532 nm light source and the aperture value of the high-speed camera needed to be adjusted in relation to each other. It was necessary to ensure that the background light was sufficient and that the bubble trajectory could be observed clearly and to prevent overexposure and loss of bubble details. The surface morphology channel width and the heat-affected zone (HAZ) of the microchannels processed on the surface of the monocrystalline silicon wafer was photographed with a thermal field emission scanning electron microscope (JEOL JSM-7600 F) under different magnification of 80×, 800×, and 1600×. The microchannels were first viewed as a whole in order to find significant differences, and then the individual defects were subsequently observed in detail at high magnification. The depth of the microchannels was measured by Laser Scanning Confocal Microscope, and the chemical elements of the machined surface were analyzed by EDS.
4. Results and Discussion
4.1. Analyzing Bubble Number
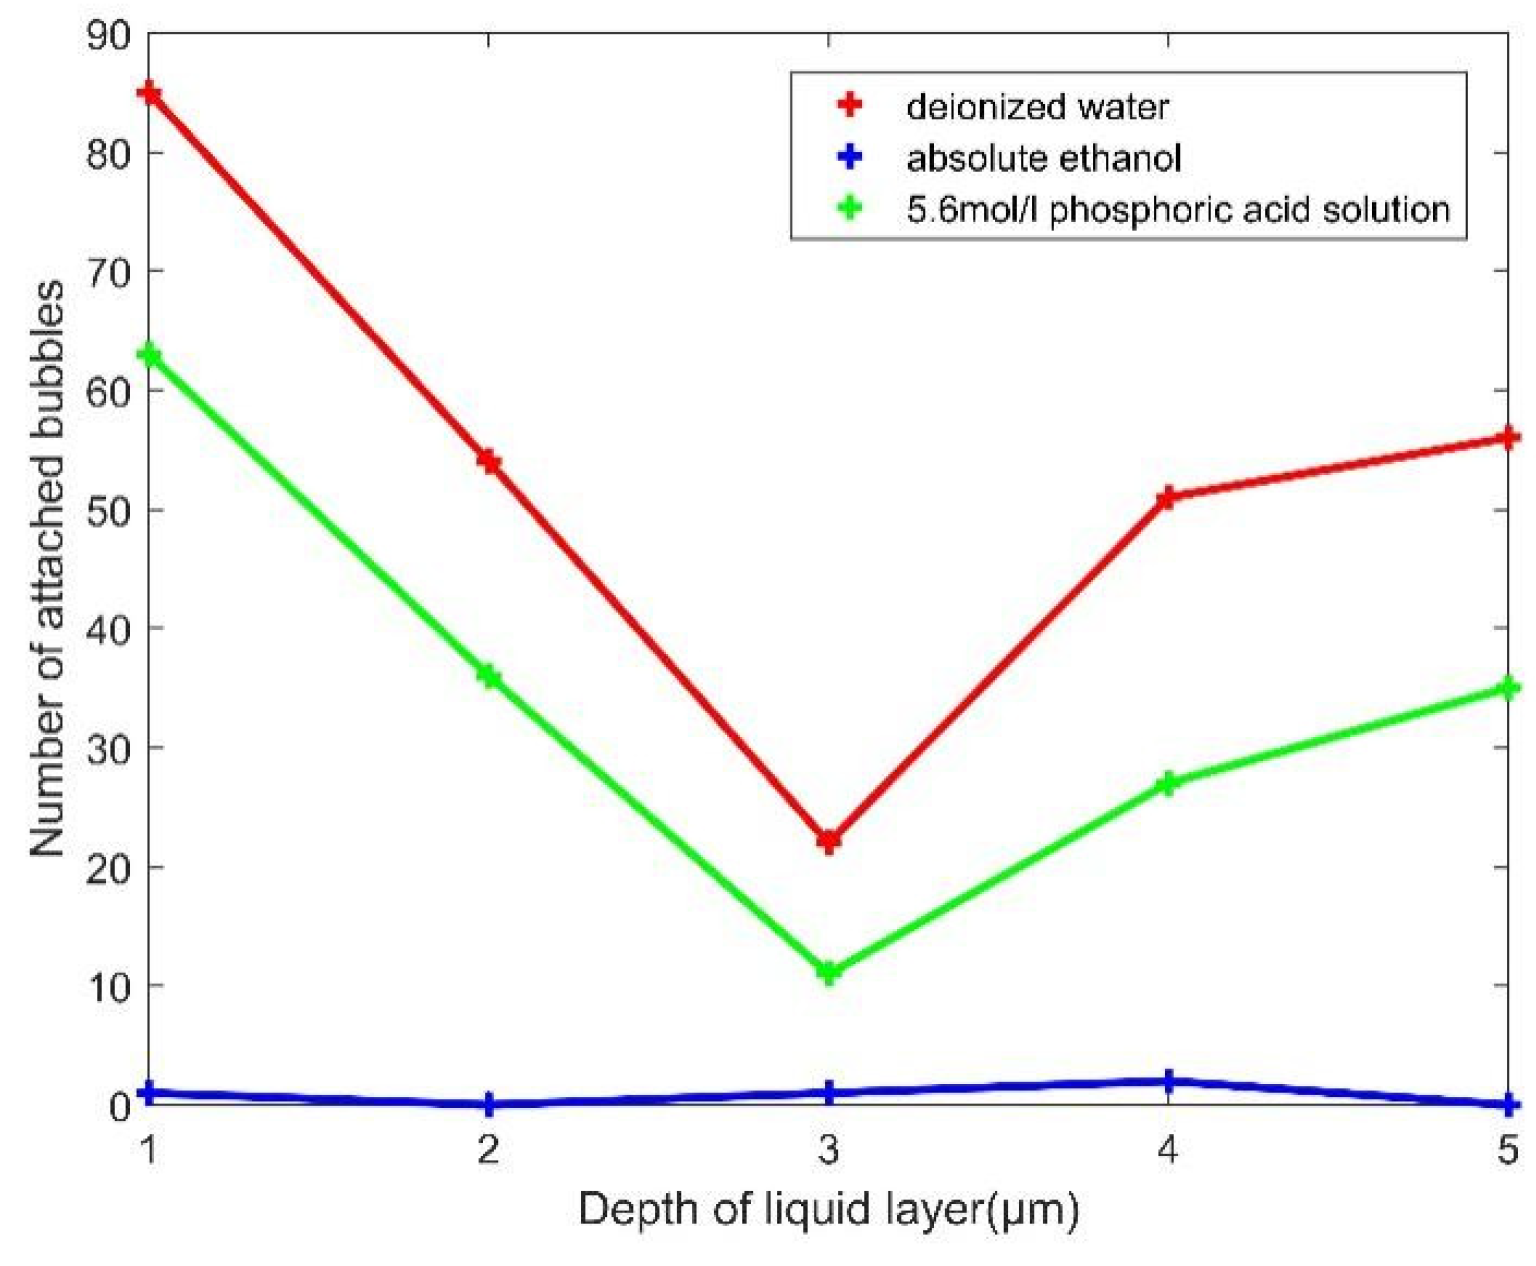
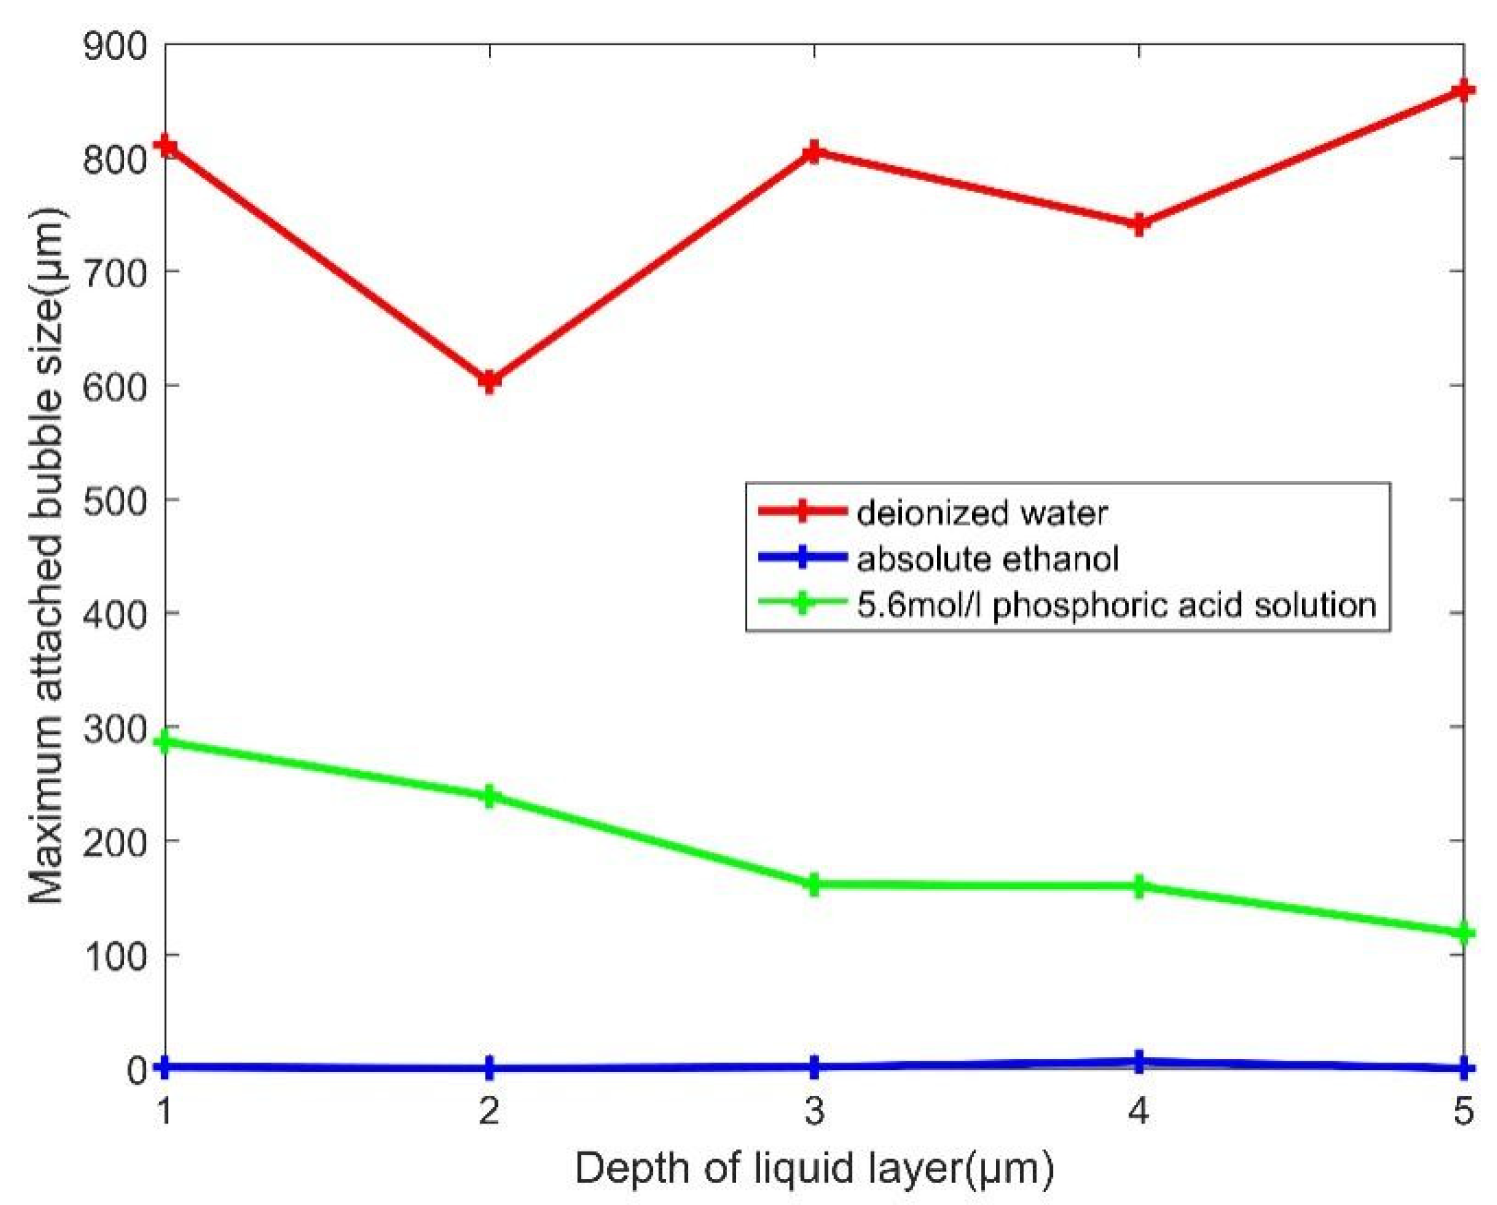
Figure 3 presents the number of attached bubbles under different liquid mediums and depths of the liquid layer at the time point of the 2nd second when the laser machining stopped. In both the deionized water and 5.6 mol/L phosphoric acid solution, the number of attached bubbles decreased significantly when the depth of the liquid layer increased from 1 to 3 mm, while the number of attached bubbles increased when continuing to increase the liquid depth. The reason for this phenomenon may be that with the increase of the liquid layer depth, the laser defocus and the focal spot area both became more severe and much larger, which led to the more divergent distribution of the induced plasma energy and the decrease of the number of bubbles due to the increase of heat transfer dissipation. However, when the depth of the liquid layer exceeded 3 mm, the laser defocusing resulted in a larger focused spot. Although the energy of the laser-induced plasma was not concentrated at the shallow liquid depth, it also resulted in a wider area of the surface being affected by the heat. Eventually, the number of attached bubbles generated on the surface began to increase. Figure 4 shows the maximum diameter of the attached bubbles in the three kinds of liquid medium at the end of laser processing (2nd second), including the increase of the liquid depth. Correspondingly, it could be seen that after the liquid layer depth exceeded 3 mm, the maximum diameter of the attached bubbles in deionized water and 5.6 mol/L phosphoric acid solution became less significant with the change of the liquid layer depth. When the depth of the liquid layer exceeded 3 mm, the laser energy was diffused, and the bubble distribution became scattered. The interaction (aggregation) of multiple bubbles and the explosive behavior of the bubbles was less likely to occur. The generated microbubbles were relatively stable in size.
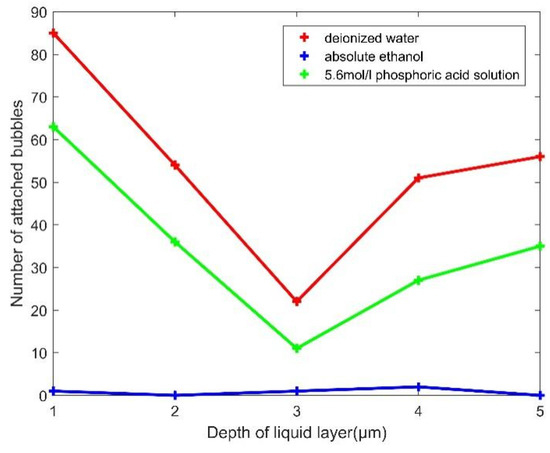
Figure 3.
The number of attached bubbles under different liquid mediums and depths of liquid layer at the end of 2-s machining.
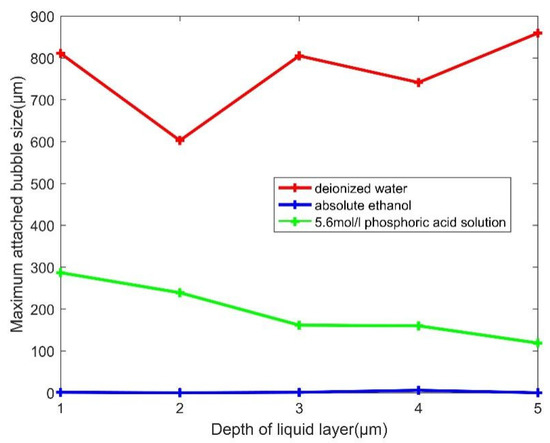
Figure 4.
Maximum attached bubble sizes under different liquid mediums and depths of liquid layer at the end of 2-s machining.
At the same conditions, the number of attached bubbles in deionized water was higher than that in 5.6 mol/L phosphoric acid solution. However, compared with the two liquid media, no residual microbubbles were found on the machined surface in the absolute ethyl alcohol at the end of processing. At the temperature of 20 °C, the tension of absolute ethanol (22.3 mN/m) is much lower than that of deionized water (72.7 mN/m). The lower the liquid surface tension is, the more the number of retained large bubbles will be significantly reduced [17]. This also explains why large bubbles on the surface of the processed material in ethanol were not observed by CCD cameras.
4.2. Analyzing Maximum Size of Bubbles
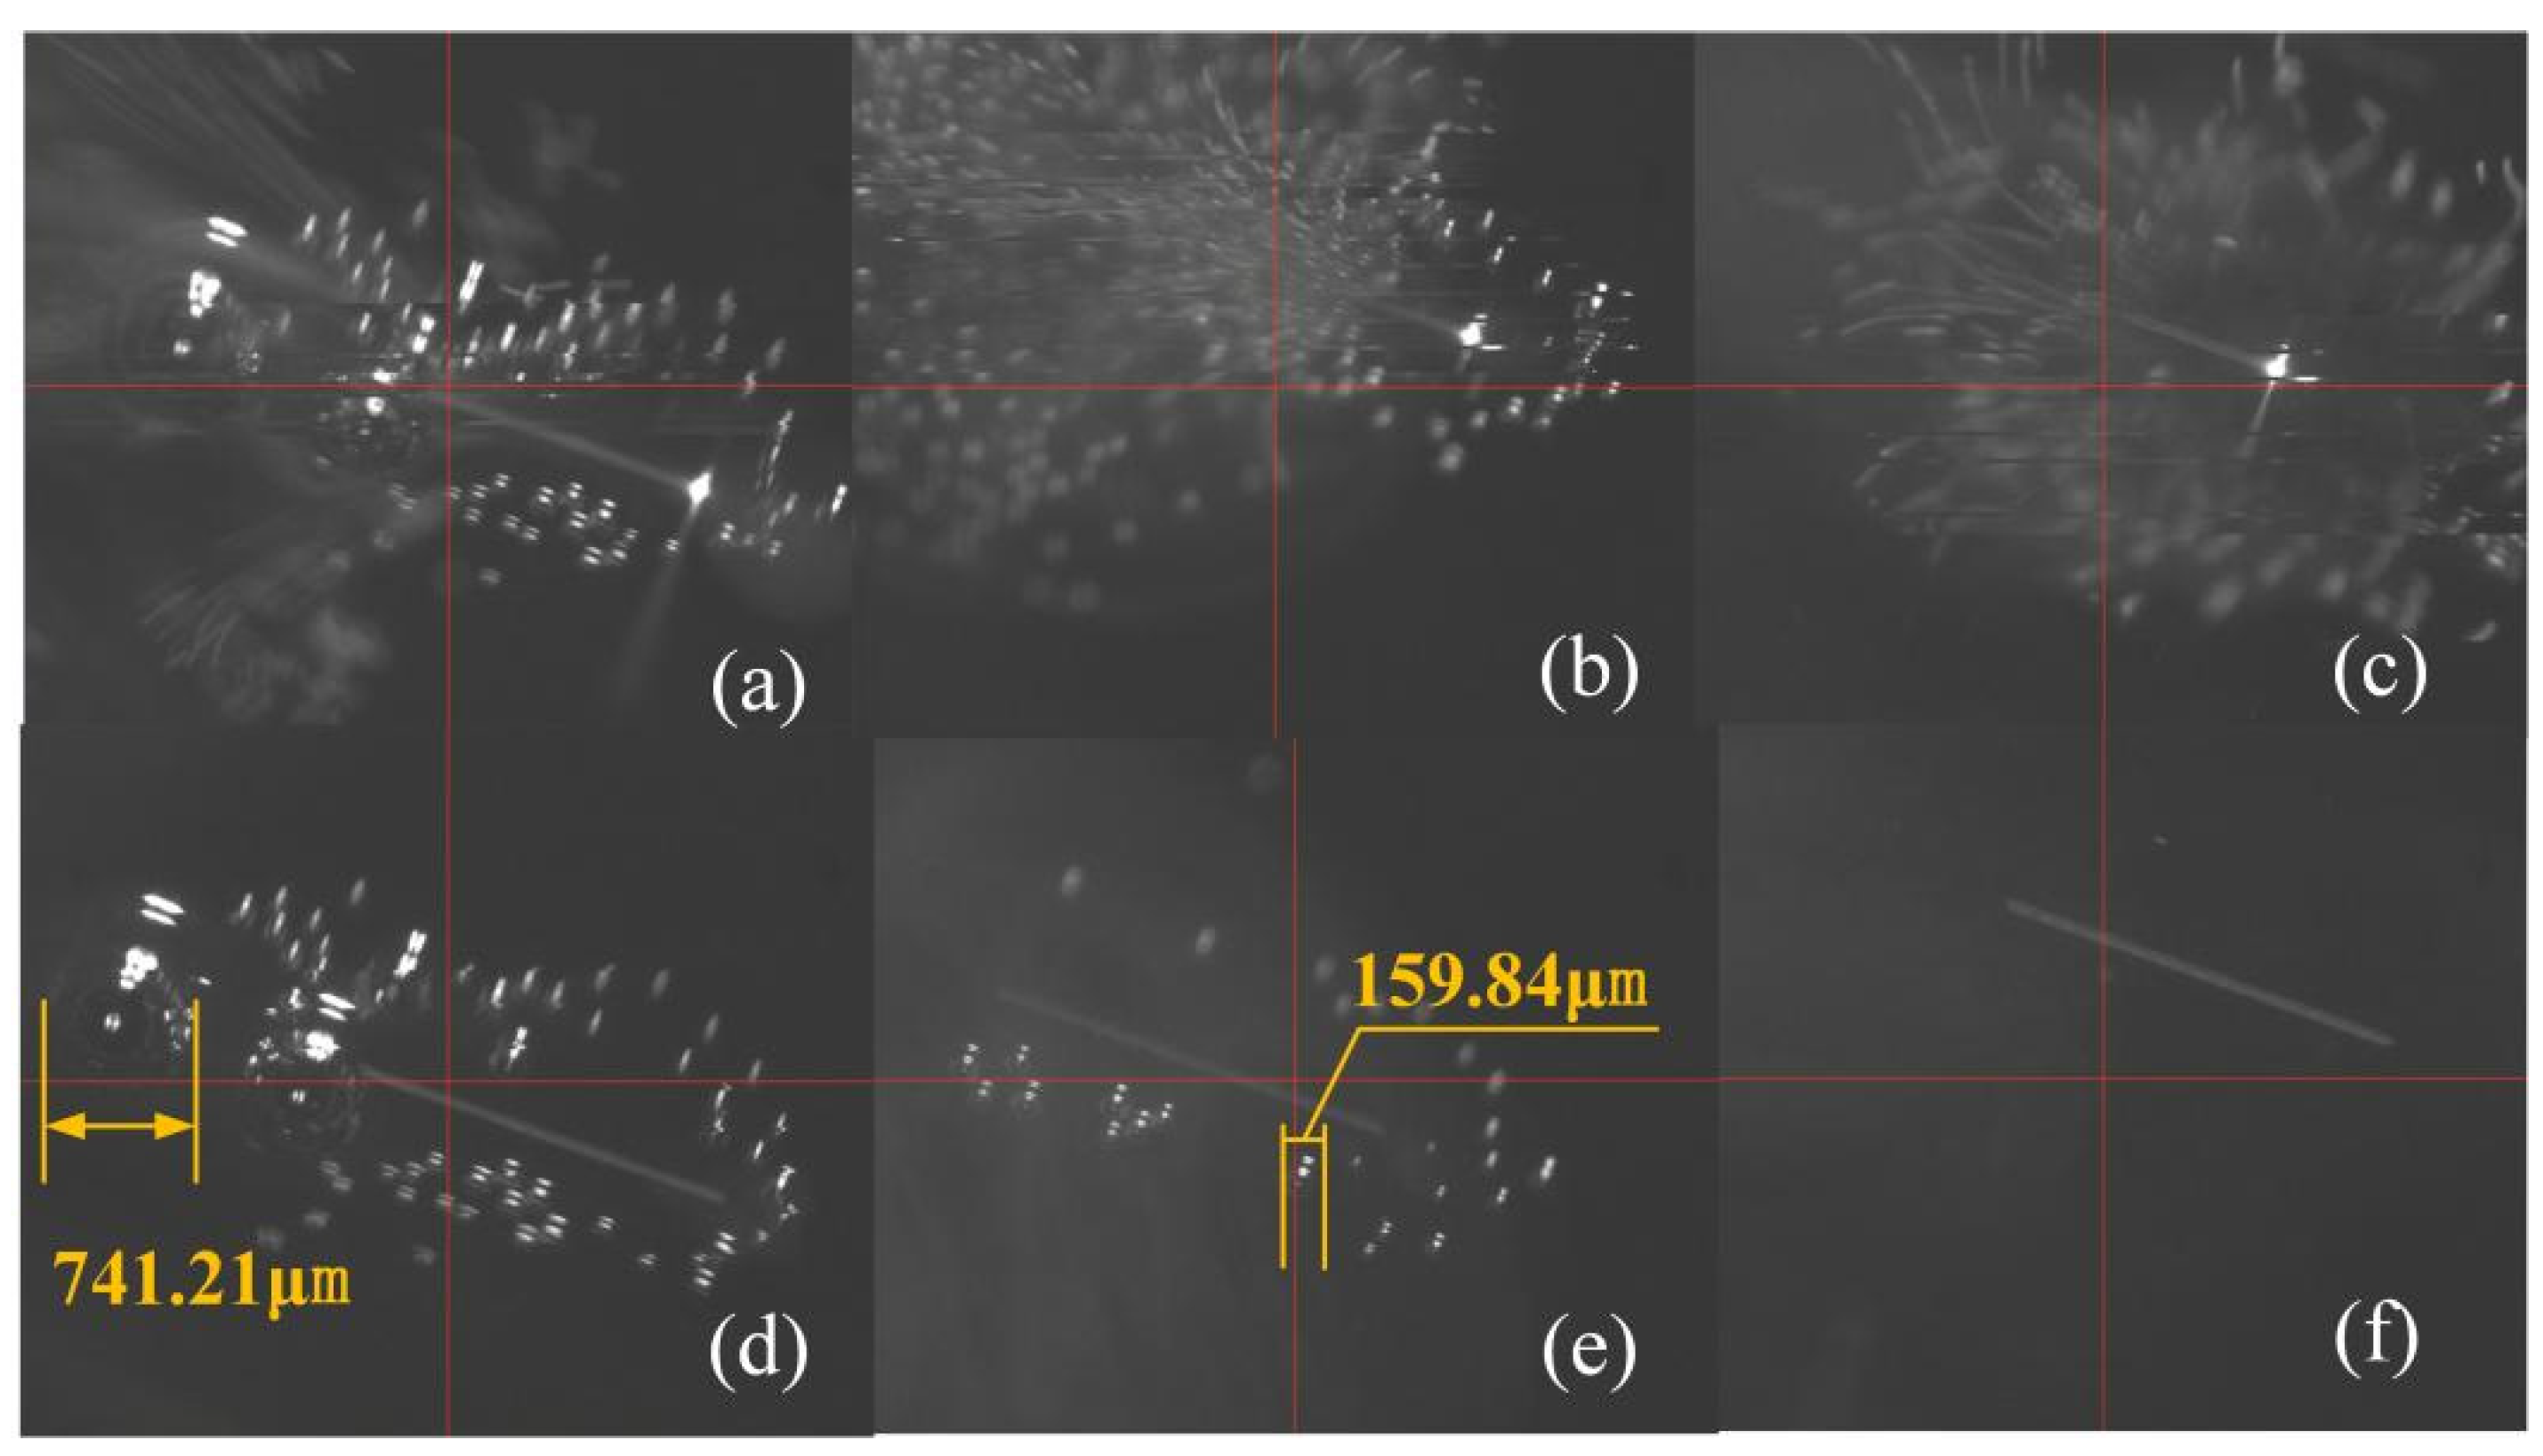
As shown in Figure 4, at the end of laser processing (2nd second), the maximum diameter of the attached bubbles in 5.6 mol/L phosphoric acid solution gradually decreased with the increase of liquid depth, while liquid depth had little effect on the maximum diameter of the attached bubbles in deionized water. As the depth of the liquid layer increased, the laser defocused more easily, and the energy was severely dissipated, which led to the decreased continuous absorption of heat energy by the bubbles so that the maximum size of the attached bubbles became smaller. As shown in Figure 5a,d, it was obvious that the largest size of the attached bubbles was located at the beginning of the microchannel processing, and the heat absorbed by bubble expansion came from the induced plasma. Once the velocity of the plasma in different liquid media and different liquid layer depth was beyond a certain range, the maximum attached bubble would be farther from the starting point, which increased the difficulty of energy transfer. Therefore, the size of the maximum attached bubble did not fluctuate much. However, there were hardly any residual bubbles to observe in the absolute ethyl alcohol. This is because the tension of absolute ethyl alcohol (22.3 mN/m at 20 °C) is very low, and the number of attached large bubbles is greatly reduced [17].

Figure 5.
Attached bubbles under different liquid mediums: (a) deionized water in process; (b) 5.6 mol/L phosphoric acid solution in process; (c) absolute ethanol in process; (d) deionized water at 2 s; (e) 5.6 mol/L phosphoric acid solution at 2 s; (f) absolute ethanol at 2 s.
The bubble behavior in the processing process (Figure 5a–c) and the maximum diameter of the attached bubbles at 2 s in different liquid media (Figure 5d–f) were also investigated. Figure 5a presents the discovery that the newly formed bubbles in deionized water mainly moved towards the tail end, and there were fewer bubbles in the front end. The density of bubbles ejected towards the bubble tail end in 5.6 mol/L phosphoric acid solutions was greater than that in deionized water. This was because the phosphoric acid solution is more viscous than both water and anhydrous ethanol. The increase in the viscosity of the liquid caused a resistance against the bubble motion and made the bubbles rise slowly and coalesce with each new bubble, resulting in a higher bubble density at the tail [19].
Different phenomenon in absolute ethyl alcohol can be seen from Figure 5c where the bubbles jetted quickly from the microchannel to the outside of the plasma processing zone, and few bubbles remained close to the inner ring of plasma. Figure 5d,e describes that static behavior of attached bubbles in deionized water and phosphoric acid solution, respectively. The maximum diameter of the attached bubble in deionized water was 741.21 μm, while the maximum diameter of the attached bubble in phosphoric acid solutions was 159.84 μm. Surprisingly, there were no attached bubbles surrounding the microchannel at the end of processing. This was also attributed to the tension of absolute ethyl alcohol (22.3 mN/m at 20 °C) being much lower than that of deionized water (72.7 mN/m). The lower the surface tension of the liquid, the fewer large bubbles were retained [17], so the surface of the silicon in absolute ethyl ethanol looked much cleaner.
4.3. Analyzing Motion Trajectory of Bubbles
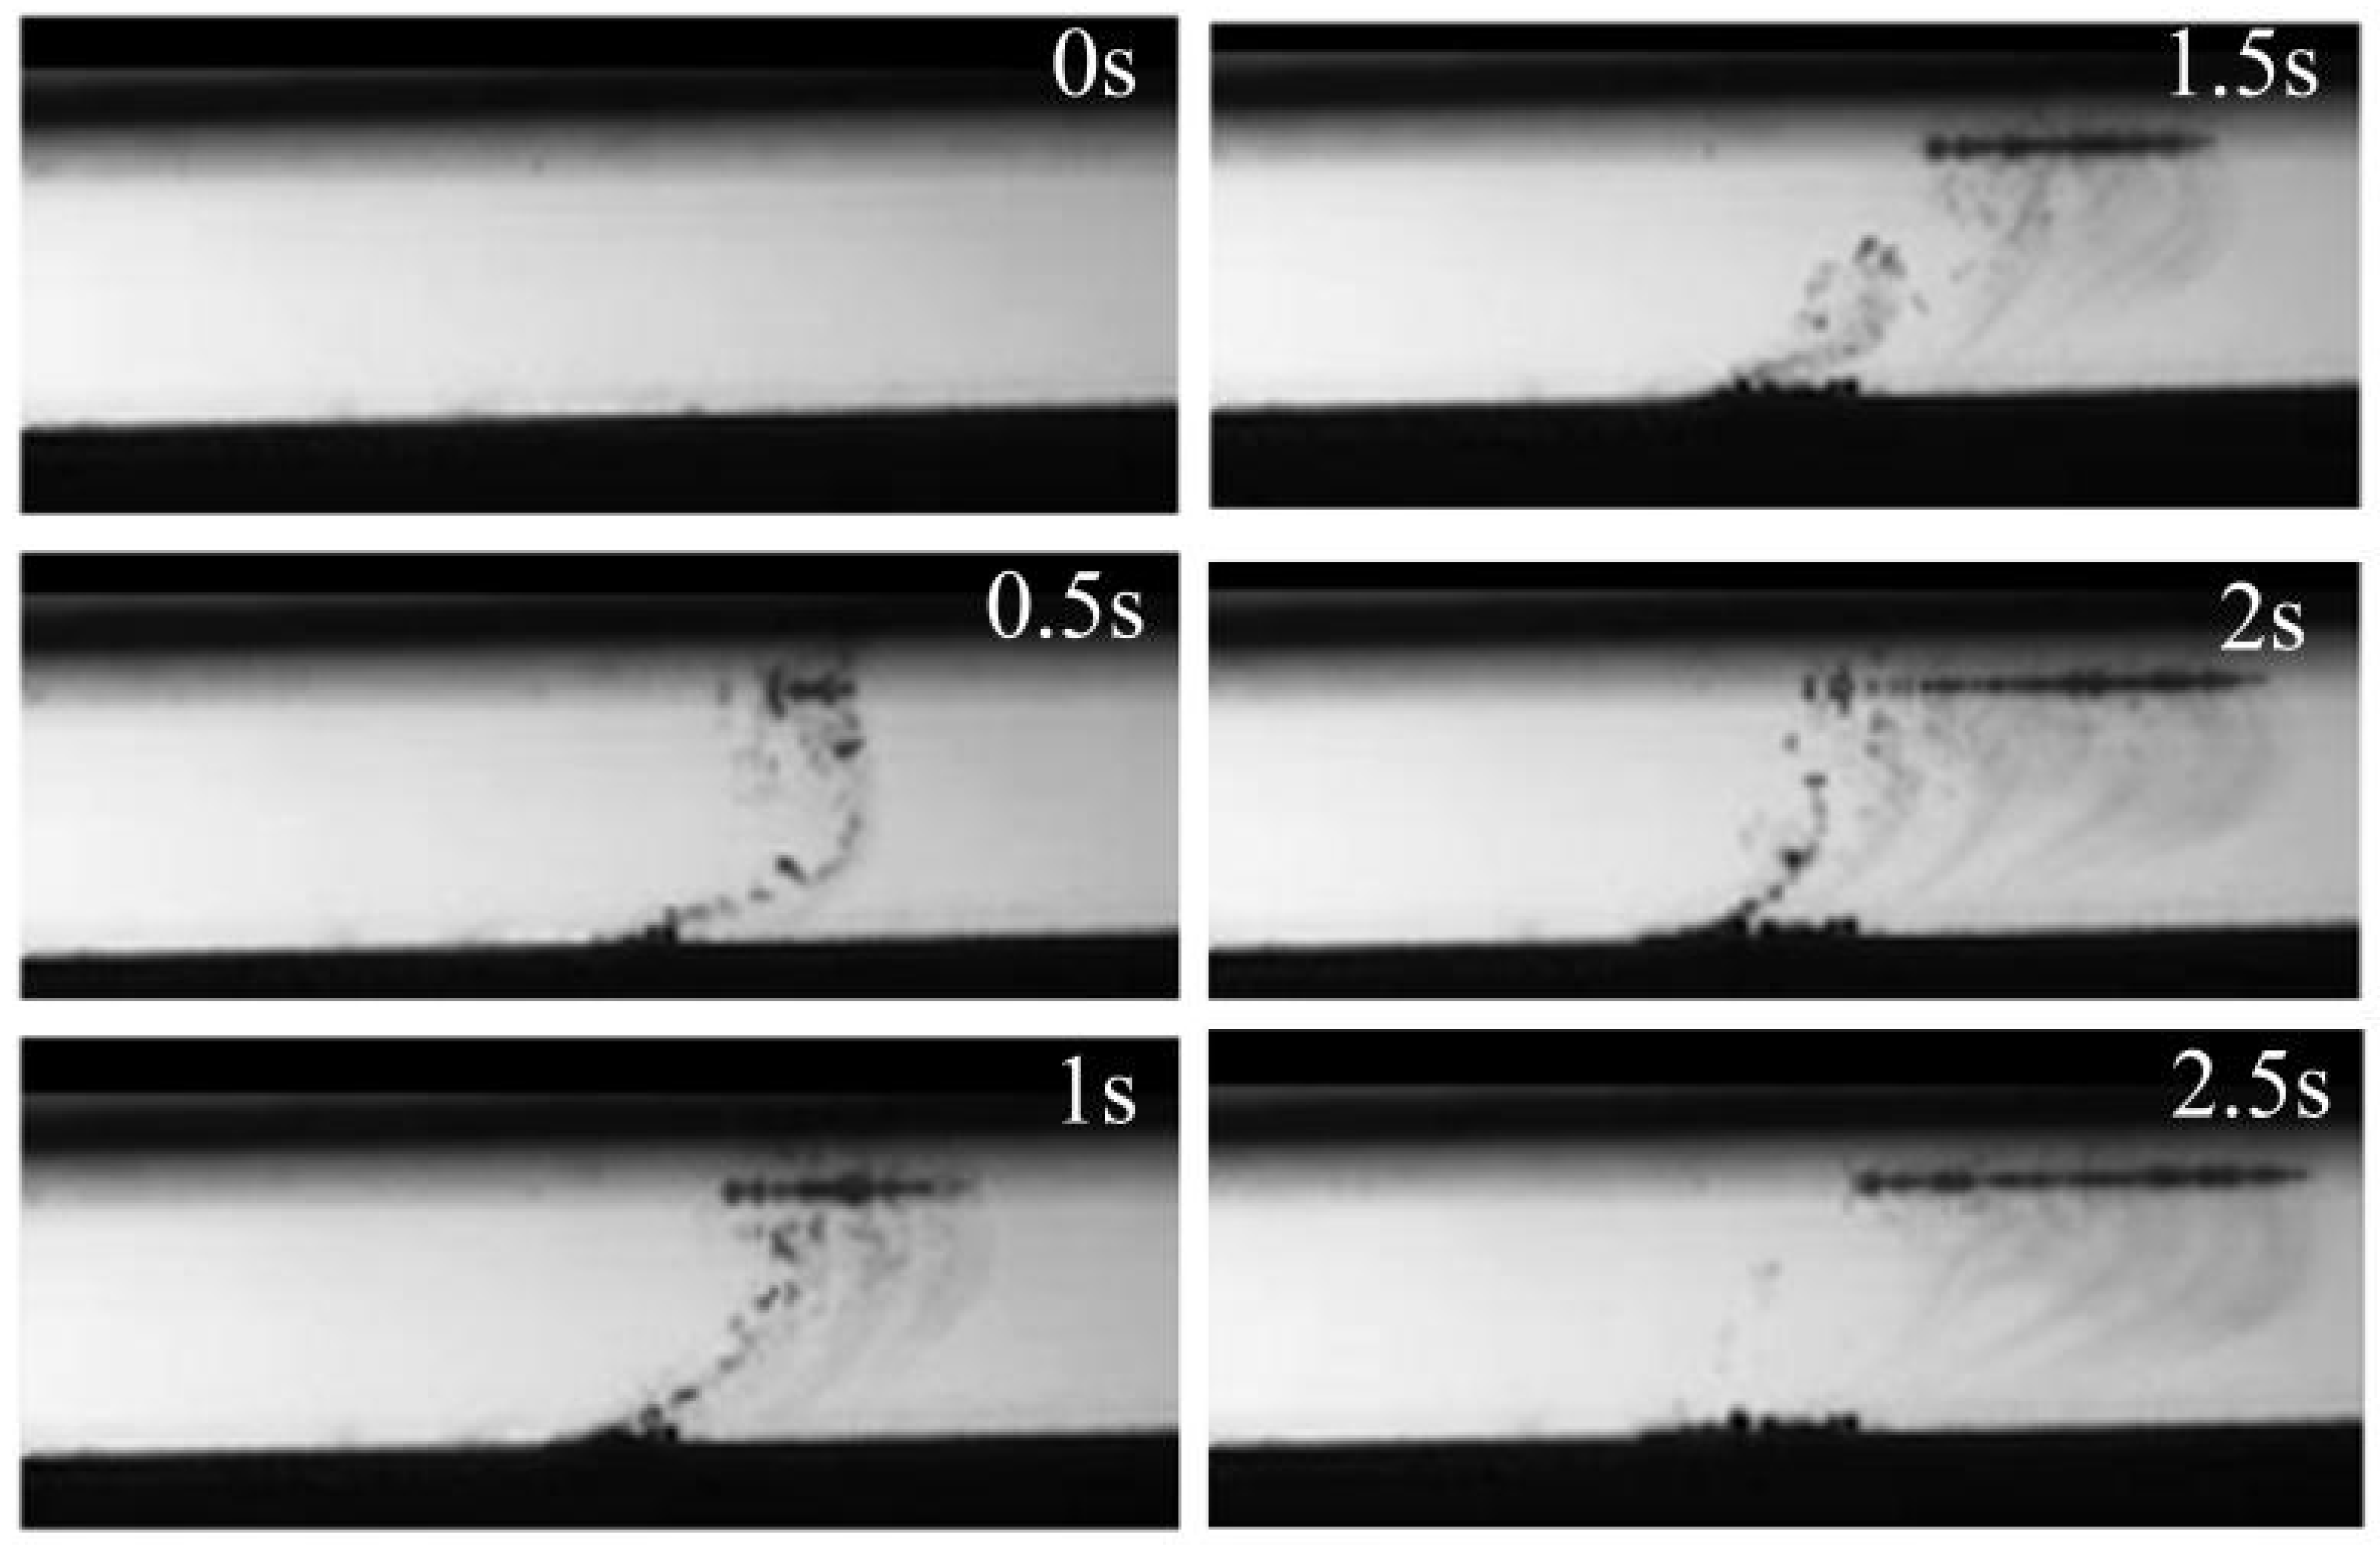
In order to study the difference of the bubble movement trajectories in different liquid medium, other process parameters and the thickness of the liquid layer were all keep constant. It can be seen from Figure 6, Figure 7 and Figure 8 that the bubble movement was continuous with one bubble following another during the laser process in both deionized water and absolute ethyl alcohol. However, the bubbles in the phosphoric acid solution floated up differently. The large clumps of bubbles gathered together to move up. The newly generated bubbles did not float up until a certain number of bubbles had accumulated. The viscosity of deionized water and anhydrous ethanol is 1.005 mPa·s and 1.18 mPa·s, respectively, which is relatively similar. However, when phosphoric acid is added to water, the viscosity of the solution increases significantly. The formed bubbles had an initial velocity. The drift movement of the newly generated bubbles was subject to great resistance with the increase of liquid viscosity, and the velocity of the microbubbles was reduced. Then, since the subsequent bubbles will be accumulated together, the distribution area of microbubbles becomes wider [19]. Until the bubble shape becomes stable, the bubble velocity conversely begins to increase [20]. This also explains the intermittently agglomerated bubbles in the phosphoric acid solutions. In combination analysis of Figure 5b,e, the bubbles stacked above the microchannel, which interacted easily with each other, were widely distributed and dense. The concentrated bubble cluster caused a change of buoyancy and surrounding pressure gradient to affect the force balance of the bubbles.

Figure 6.
Time sequence diagrams of bubbles floating in deionized water.
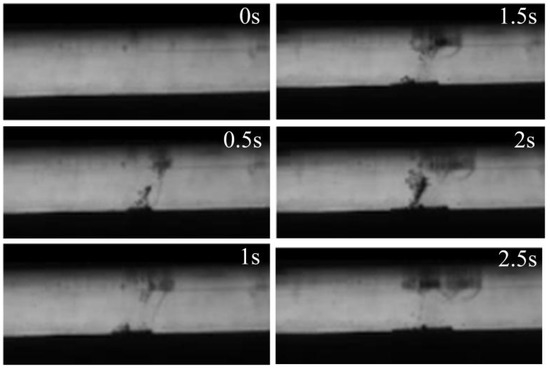
Figure 7.
Time sequence diagrams of bubbles floating in 5.6 mol/L phosphoric acid solution.
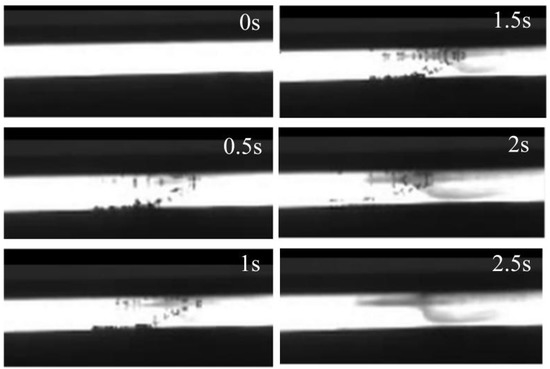
Figure 8.
Time sequence diagrams of bubbles floating in absolute ethanol.
4.4. Analyzing Surface Integrity of Micro Channels
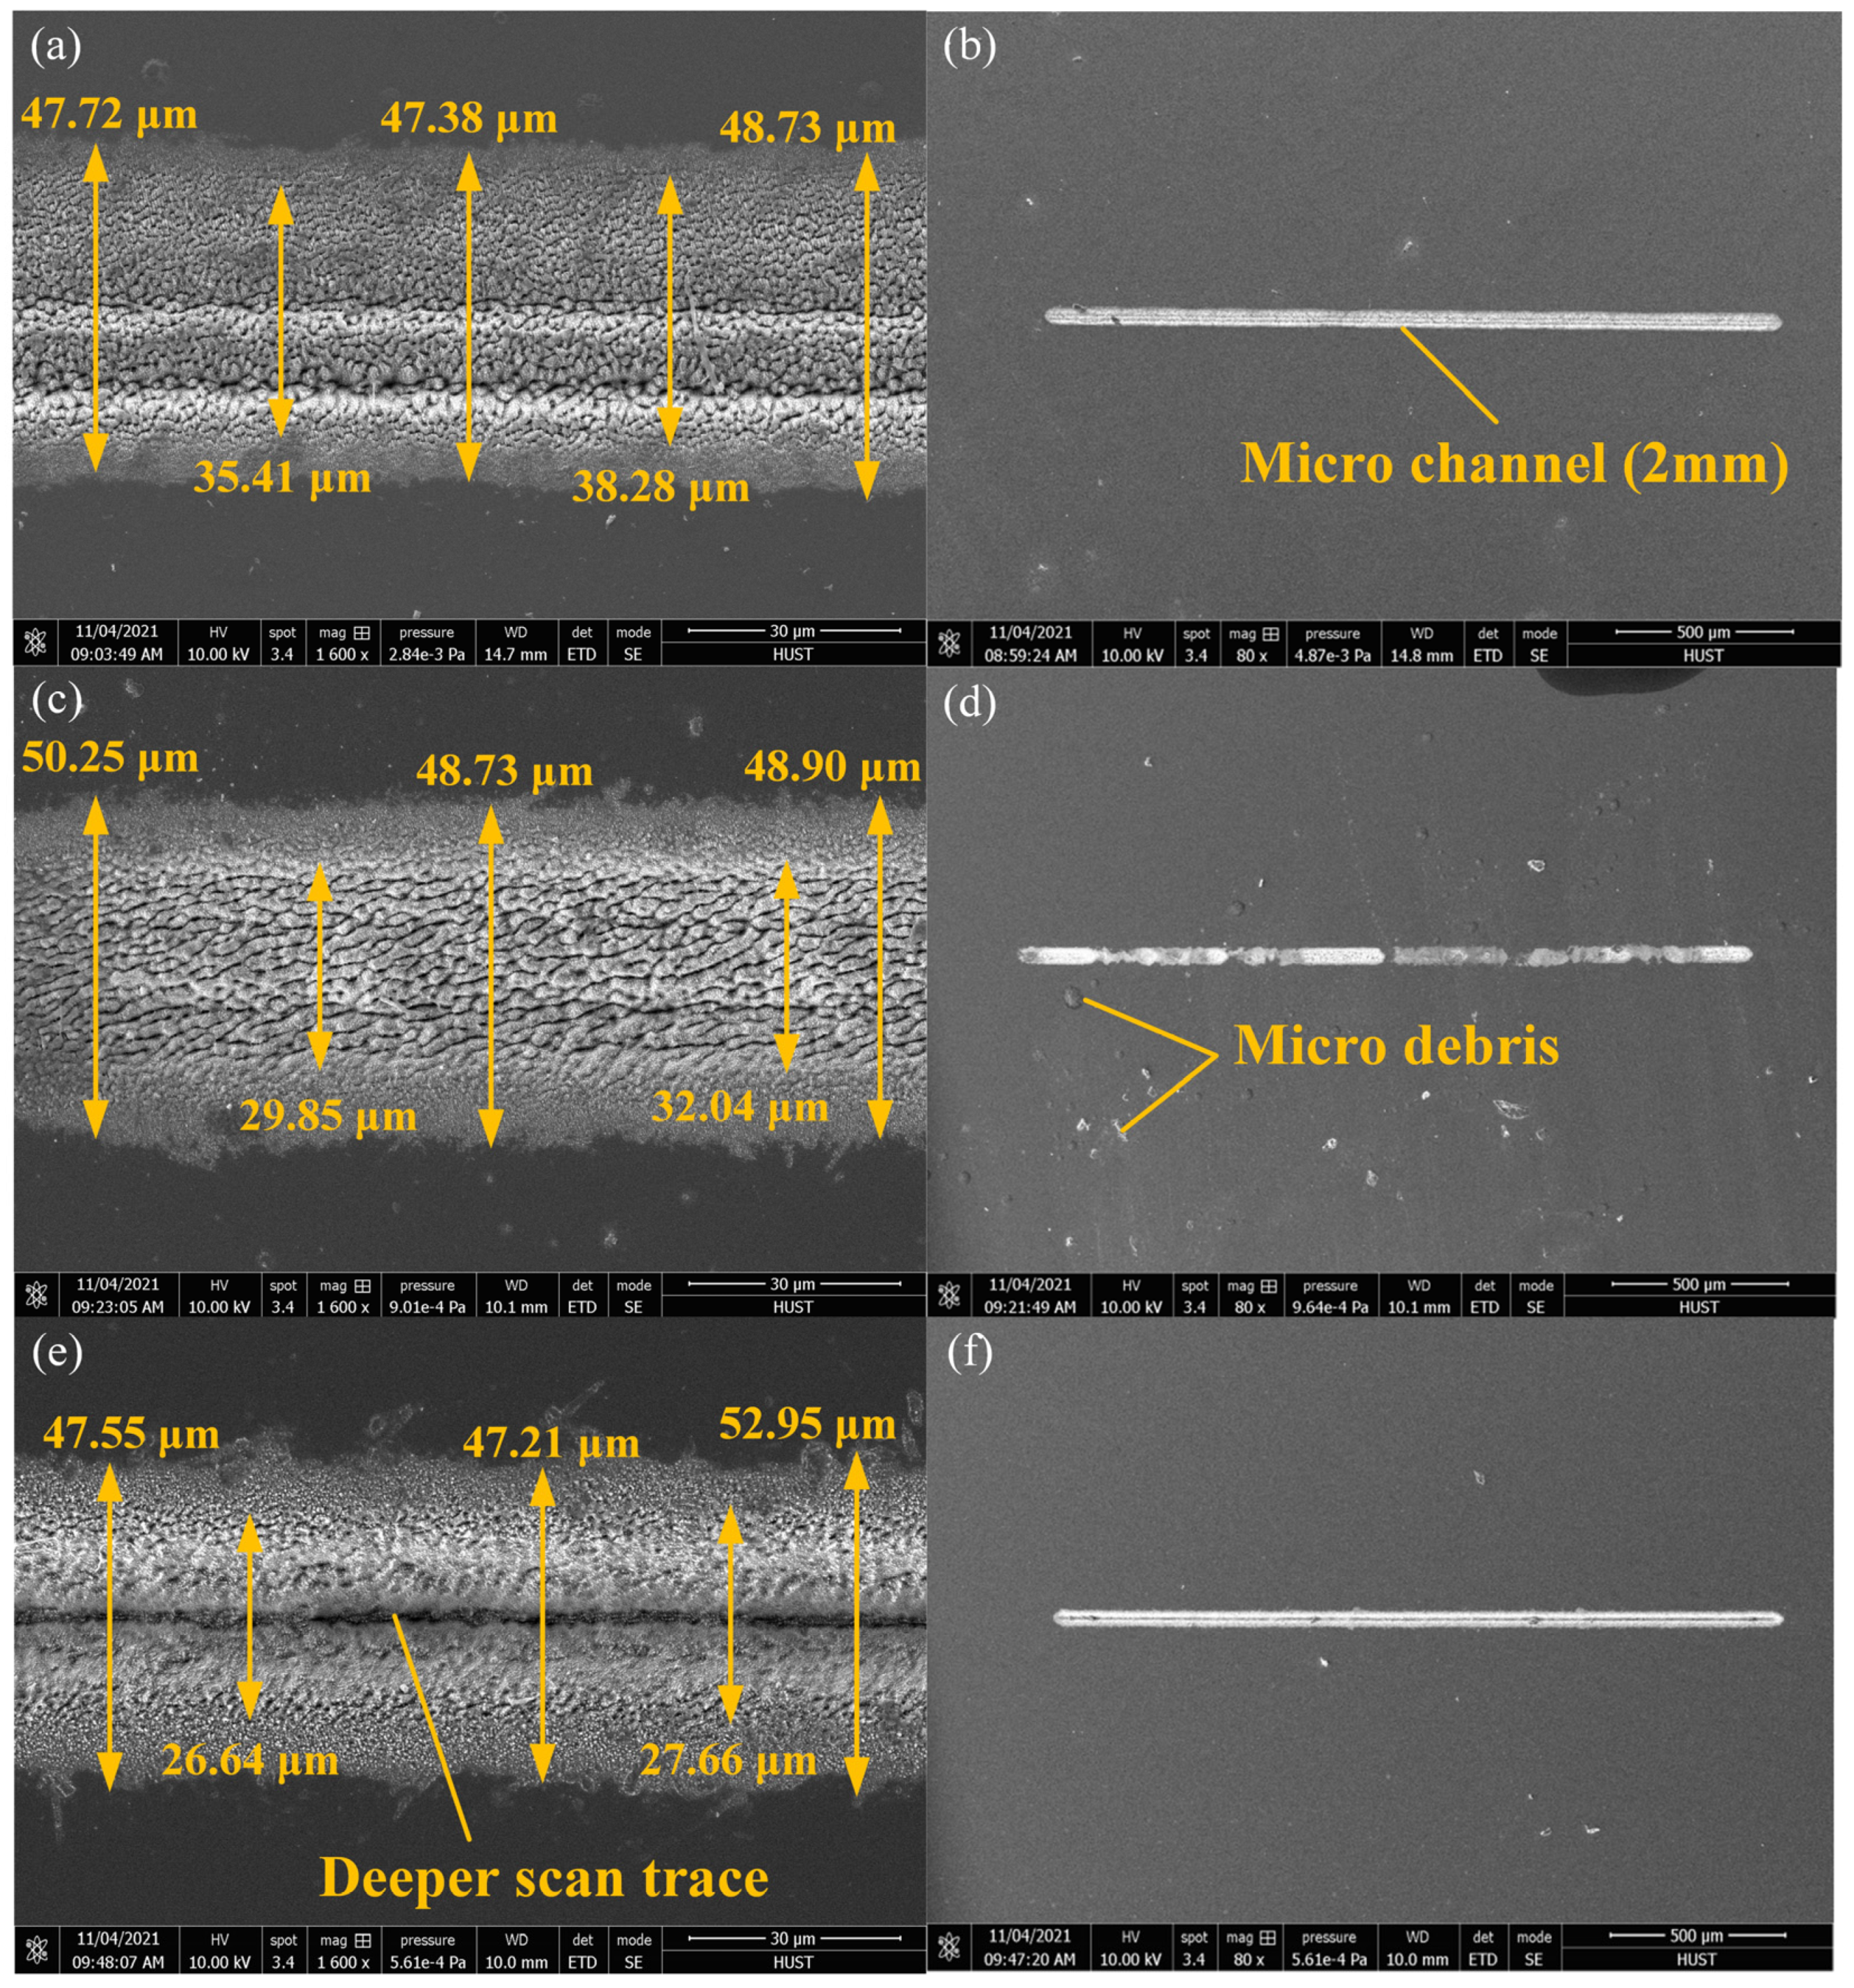
Figure 9 shows the profiles and morphology of the microchannels fabricated by LIPMM under three different liquid mediums. The average HAZ and width of the microchannel in deionized water were 47.94 μm and 36.85 μm, the average HAZ and width of the microchannel in phosphoric acid solution were 49.29 μm and 30.95 μm, and those in absolute ethyl alcohol were 49.24 μm and 27.15 μm. The widths of the microchannel obtained in absolute ethyl alcohol were narrower than those obtained in deionized water and phosphoric acid solutions. In addition, it can be seen from Figure 9e that the microchannel obtained in ethanol had very significant and deeper scan traces. This indicated a high utilization rate of laser energy in ethanol. It can be found from Figure 5 that the formed microbubbles in ethanol spread rapidly to the periphery of the laser processing zone, which was beneficial to reducing the processing interference to the microchannel and ensuring the effectiveness of subsequent laser processing. Moreover, the lower density of bubbles attached to the edge reduced the destruction of bubbles from plasma energy distribution and provided a relatively stable environment for the laser focusing process, which can concentrate the thermal energy to narrow the microchannel. By combination analysis of Figure 3, Figure 4 and Figure 5, both the number of bubbles and the maximum size of the attached bubbles in deionized water were larger than those in the other two liquid media. The microbubbles close to the microchannel more easily caused laser refraction and scattering, resulting in a larger heat-affected zone on both sides of the microchannel, so the number and size of the bubbles became larger. This could contribute to the microchannel being wider in deionized water. Similarly, the number and the maximum size of the attached bubbles as well as the microchannel width in phosphoric acid solution were between those of ethanol and deionized water. Although the HAZ of the microchannels in all three types of liquid medium had almost no difference, the profile of the microchannel in absolute ethyl alcohol was the clearest.
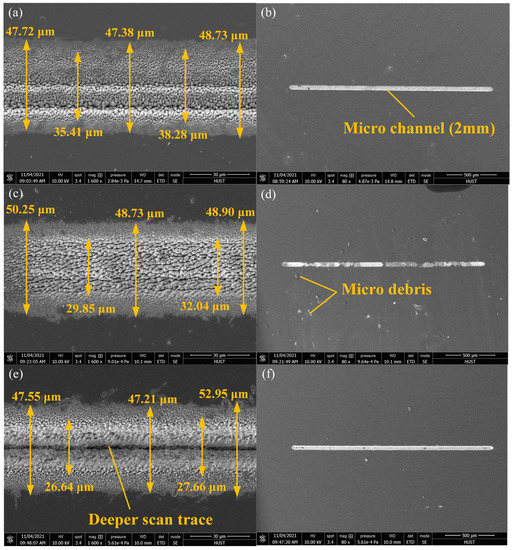
Figure 9.
Profiles and morphology of micro channels under different liquid mediums: (a,b) deionized water; (c,d) 5.6 mol/L phosphoric acid solution; (e,f) absolute ethyl alcohol.
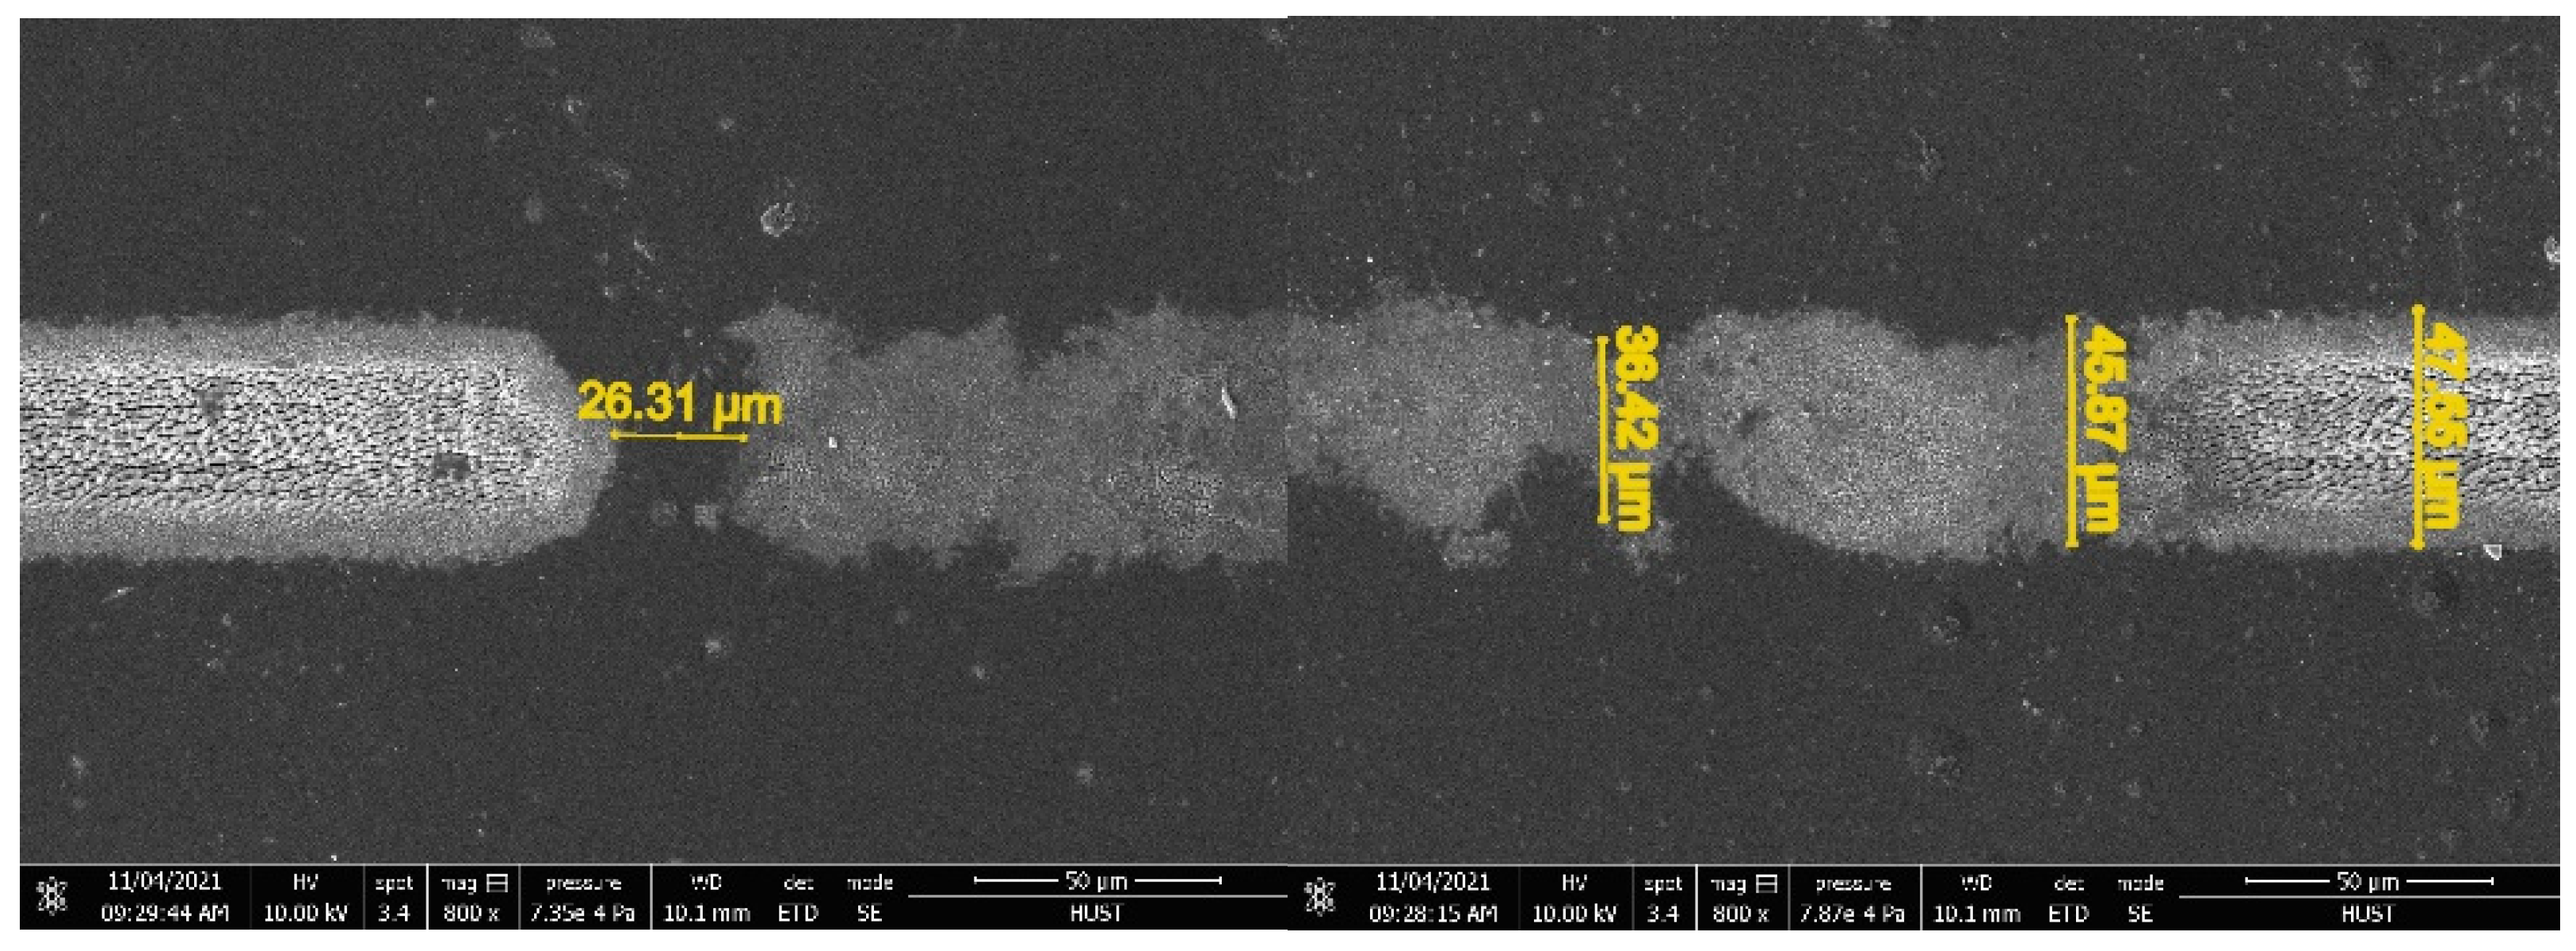
As shown in Figure 9d, the uniformity and continuity of the microchannel in 5.6 mol/L phosphoric acid solution were the worst. In the detail view (800×) of Figure 10, its defects can be clearly seen in that one section with a length of 26.31 μm was not ablated, and the ablation depths of the microchannel were also different along the direction of the scanning path. Since Figure 7 shows that the microbubbles produced in phosphoric acid moved upward in intermittent clusters, it could be inferred that the reason for the unablated section is that the bubbles did not immediately float but accumulated into a large cluster of bubbles to float, and these accumulated bubbles in the processing zone of the channel lead to multiple reflections and refraction of the pulsed laser as well as serious attenuation of laser energy, negatively affecting the laser ablation of the silicon material. It can also be seen from Figure 9b,d,f that there was far more micro debris on both sides of the 2 mm microchannel obtained in the phosphoric acid solution than in the ethanol and deionized water. The stability and continuity of processing was reduced due to the effect of bubble retention. The residues removed by the material were not effectively flushed away by the liquid and a large amount of debris remained on the surface of the material.
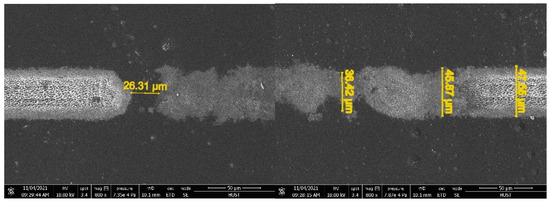
Figure 10.
Defects of microchannel under 5.6 mol/L phosphoric acid solution.
Figure 11 presents the depths profiles of microchannels under different liquid mediums. The maximum depth of the microchannels under deionized water, 5.6 mol/L phosphoric acid solution, and absolute ethyl alcohol were 4.8, 8.4, and 16.5 μm, respectively. As for the microchannel under absolute ethyl alcohol, its depth was the biggest, and the ablated depth in longitudinal direction always remained consistent and had the most uniform and smooth profile. This was because the generated bubbles rose up quickly in ethanol, while the density of the bubbles attached to the edges of the microchannel was too low to interfere with the laser focus [15], finally forming a deep and uniform microchannel. It can be seen from Figure 5c,f that the floating microbubbles spread explosively, farther away from the machining center, and had less influence on the machining process. Comparatively, the depth of the microchannel in deionized water was the smallest one in the three liquid media. The number and the maximum size of the bubbles attached to both sides of the microchannel in deionized water were much larger than those in ethanol and phosphoric acid solutions. These phenomena also verified that since the laser propagation was defocused due to the obstruction of bubbles attached to the edge of the microchannel, the effective energy that could act on the center of the microchannel became weaker. On the contrary, the depths profile of the microchannel under phosphoric acid solution had a large discontinuous part. According to the floating motion of the bubbles in phosphoric acid solution as shown in Figure 7, some newly generated microbubbles remained near the microchannel to form a dense bubble barrier (as seen in Figure 5b), resulting in serious laser defocus. Due to the obstruction of heat transfer, the material surface could not be effectively ablated, which led to the depth fault and discontinuity of the machined microchannel.
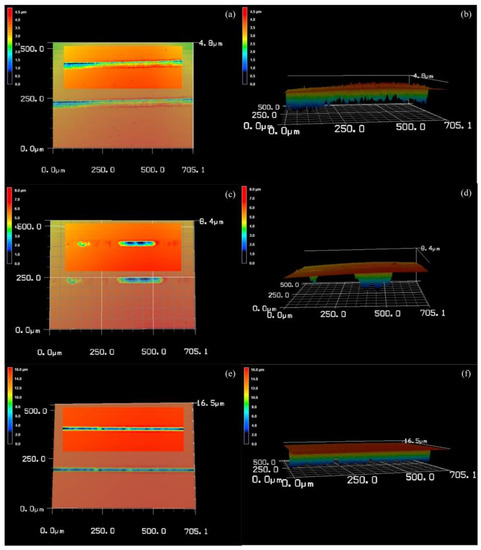
Figure 11.
Maximum depths of microchannels under different liquid mediums: (a,b) deionized water; (c,d) 5.6 mol/L phosphoric acid solution; (e,f) absolute ethanol.
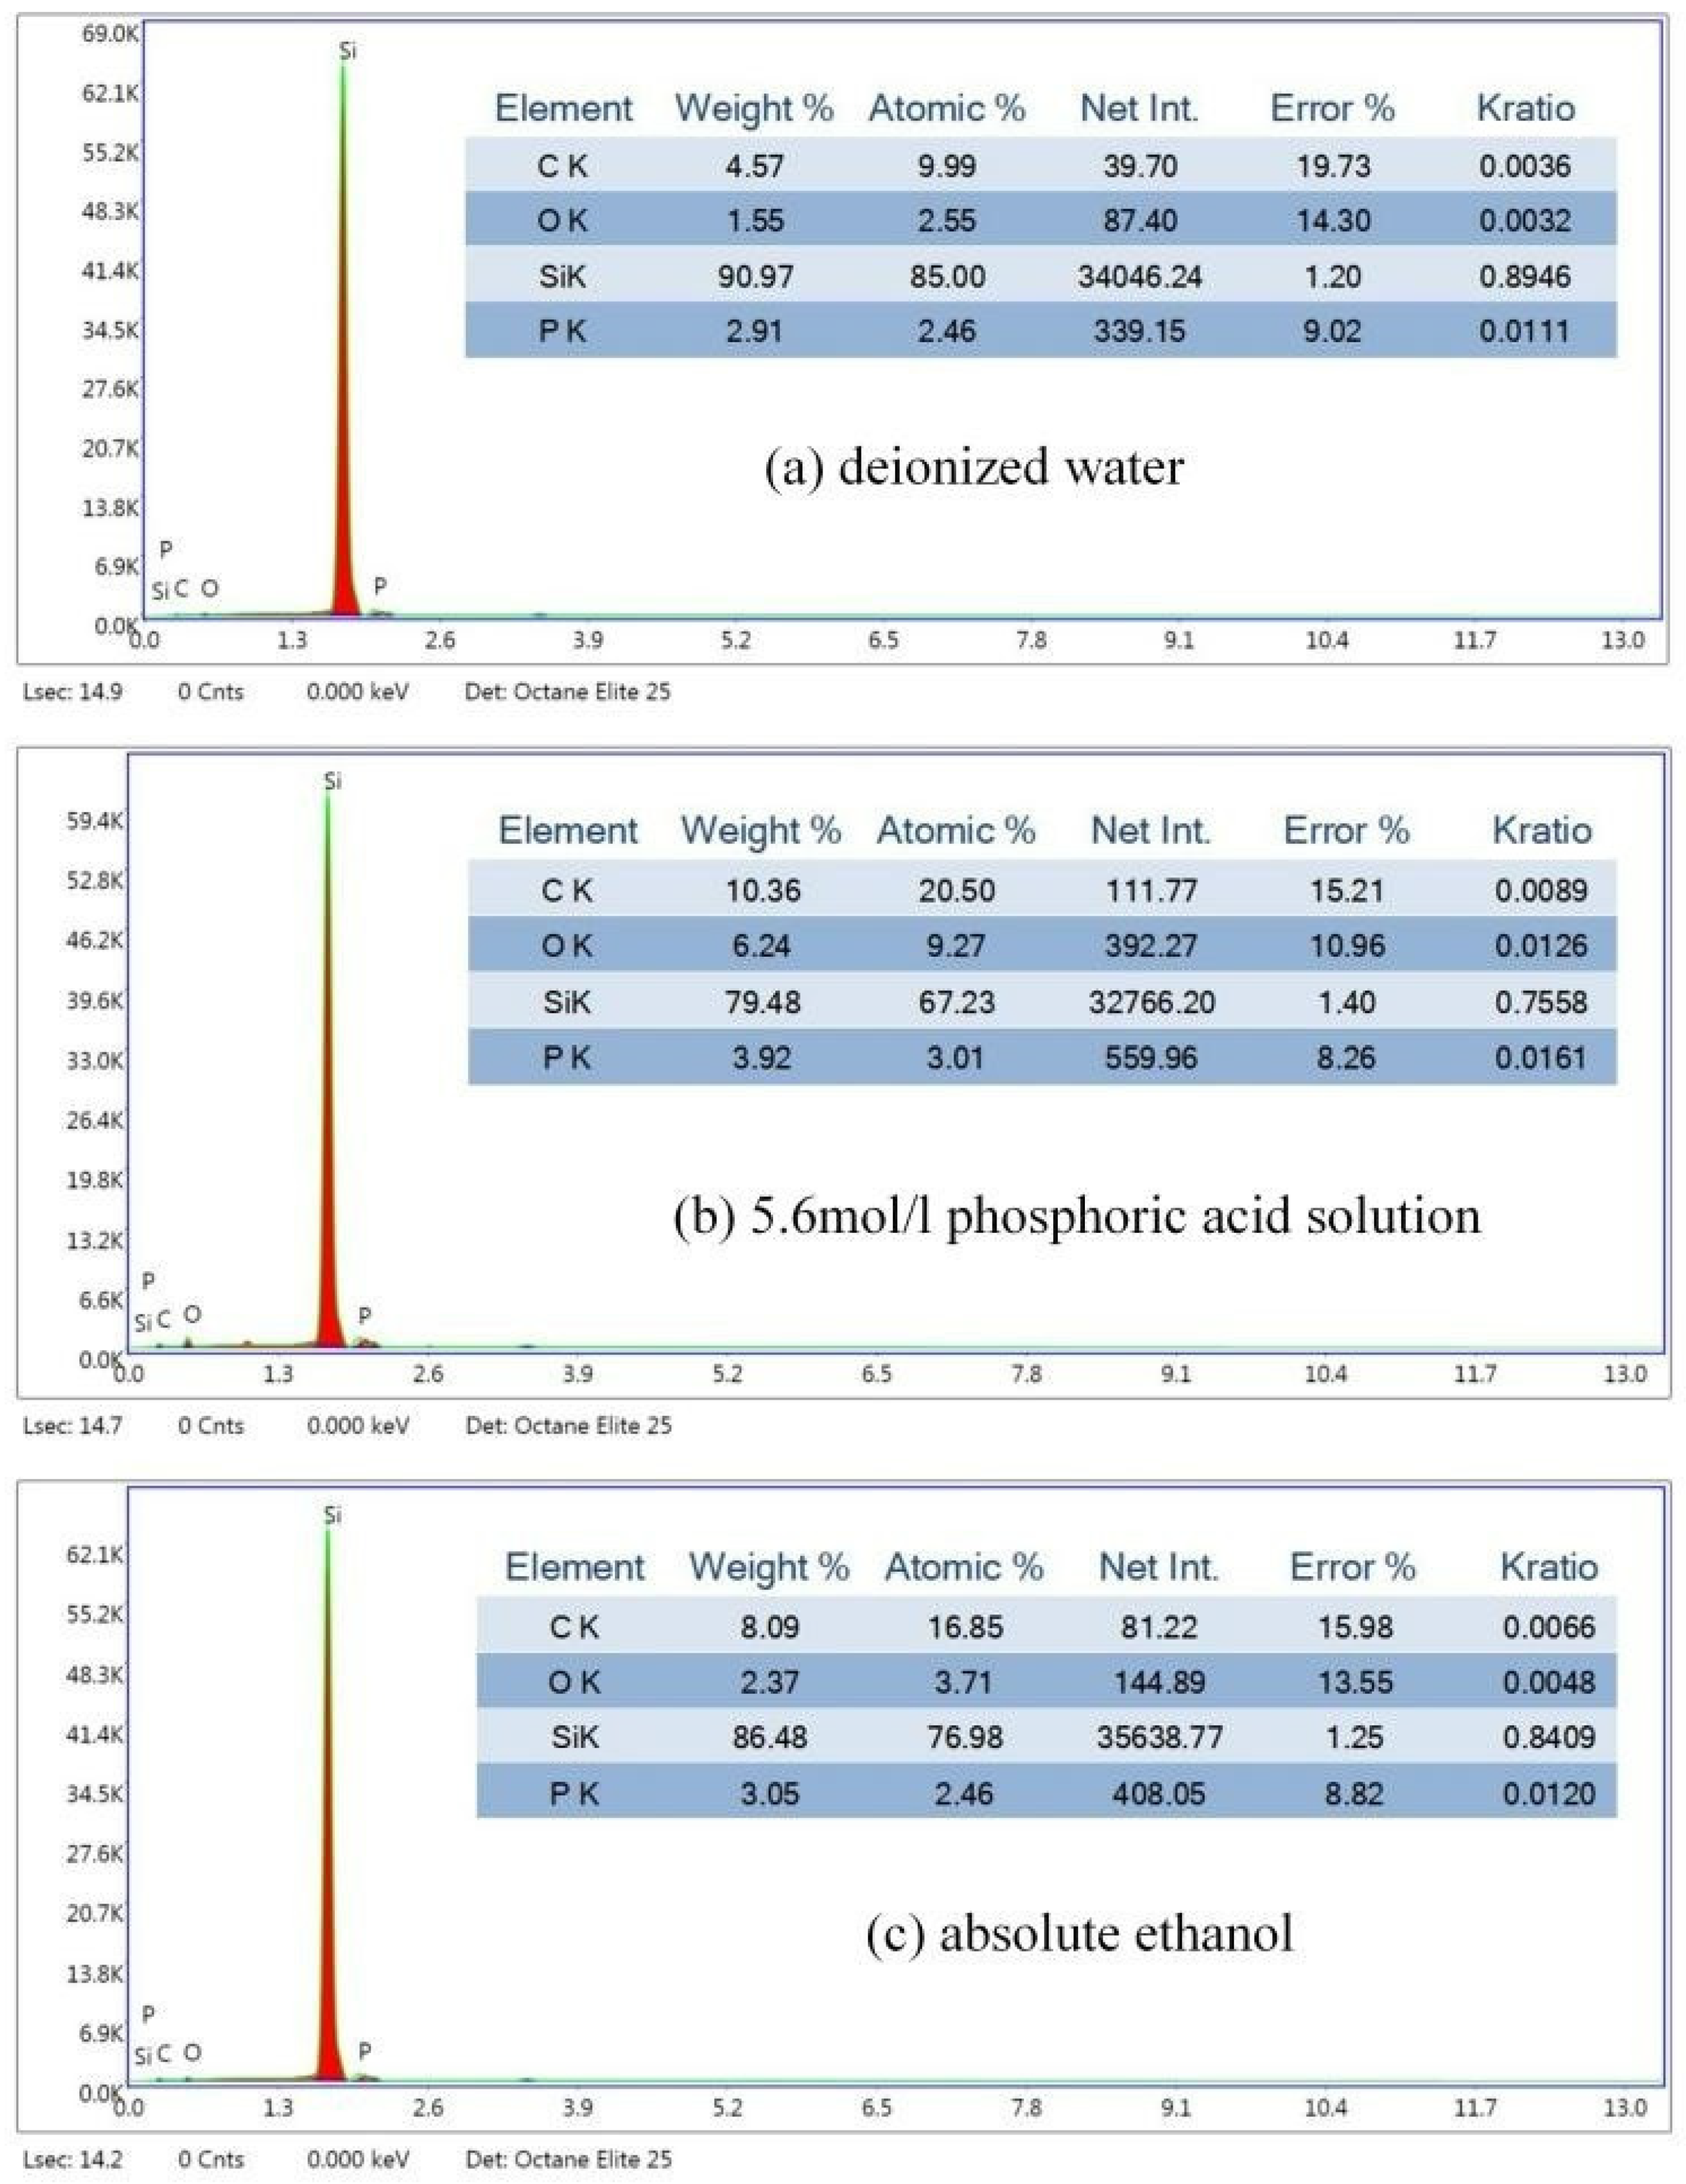
EDS analyses of microchannels under different liquid mediums were conducted as shown in Figure 12. Compared with microchannels of the other two liquids, the amounts of C and O elements of the microchannel in the phosphoric acid solution were the largest, 6.24% and 10.36%, but the amounts of P elements were almost the same. This also revealed that the microchannel in the phosphoric acid was subjected to a stronger thermal effect due to the interference of the thermal energy distribution by microbubbles.
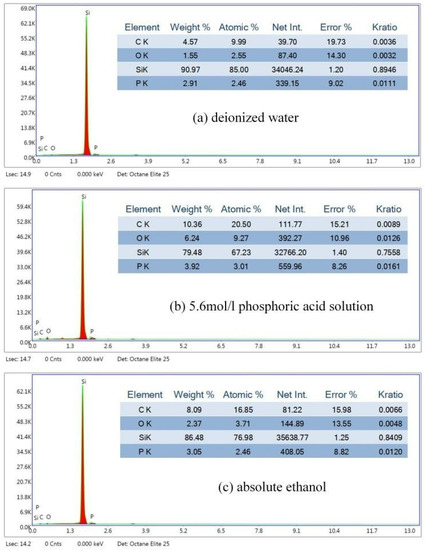
Figure 12.
EDS analysis results of microchannels under different liquid mediums.
5. Conclusions
In this paper, the effects of three types of liquid mediums and the depth of the liquid layer on the adhesion of microbubbles and the buoyancy movement of bubbles in LIPMM of single-crystal silicon were analyzed, and the effects of bubble behavior on the surface integrity of microchannels were further revealed. The main conclusions were summarized as follows:
- The number and maximum diameter of attached bubbles in deionized water were the largest in different depths of liquid layer, while absolute ethyl alcohol with the low tension of alcohol contributing to just generate a few small sized attached bubbles at the edge of the microchannel, which could reduce the negative effect of bubbles on the energy distribution of laser-induced plasma.
- Compared with the following and continuing buoyancy movement of bubbles in both deionized water and absolute ethyl alcohol, microbubbles in 5.6 mol/L phosphoric acid solution with its high viscosity rise up intermittently after a certain accumulation of newly generated bubbles. The formation of a large area of bubble barrier seriously affects the laser focus, resulting in a discontinuous microchannel with an unablated segment of 26.31 μm. However, the microchannel in the phosphoric acid was subjected to a stronger thermal effect. The mass fractions of oxygen (6.24%) and carbon (10.36%) in the phosphoric acid were both larger than that of oxygen and carbon in deionized water (O 1.55% and C 4.57%) and anhydrous ethanol (O 2.37% and C 8.09%).
- When the depth of the liquid layer is 4 mm, absolute ethyl alcohol showed the advantages in a narrow width (27.15 μm), large peak depth (16.5 μm), and uniform depth profile of the microchannel by LIPMM, but the HAZ width of the microchannels in all three types of liquid mediums had almost no difference. Microbubbles in the anhydrous ethanol quickly and explosively spread towards the edge of the laser processing zone, which reduced laser scattering and refraction and ensured the efficiency of subsequent processing.
Author Contributions
Conceptualization, Y.Z. and Z.Z.; methodology, Y.L.; software, Y.L.; validation, H.G., H.W. and Y.Z.; formal analysis, Z.Z.; investigation, Y.Z.; resources, H.G. and Z.Z.; data curation, Y.L.; writing—original draft preparation, Y.L. and Y.Z.; writing—review and editing, Y.Z. and Z.Z.; visualization, Y.L.; supervision, H.G. and H.W.; project administration, Z.Z.; funding acquisition, Z.Z. All authors have read and agreed to the published version of the manuscript.
Funding
This research is supported by the National Natural Science Foundation of China under Grant No. 51975228, Local Innovative and Research Team Project of Guangdong Pearl River Talents Program under Grant No. 2017BT01G167. In addition, this research is also supported by the Natural Science Foundation of Guangdong Province under Grant No. 2020A151501638.
Institutional Review Board Statement
Not applicable.
Informed Consent Statement
Not applicable.
Data Availability Statement
Not applicable.
Conflicts of Interest
All the authors declare no conflict of interest.
References
- Wang, M.; Wang, B.; Zheng, Y. Weakening of the anisotropy of surface roughness in ultra-precision turning of single-crystal silicon. Chin. J. Aeronaut. 2015, 28, 1273–1280. [Google Scholar] [CrossRef] [Green Version]
- Zhu, P.; Li, R.; Gong, H. Molecular dynamics simulation of nanoscale abrasive wear of polycrystalline silicon. Crystals 2018, 8, 463. [Google Scholar] [CrossRef] [Green Version]
- Malhotra, R.; Saxena, I.; Ehmann, K.; Cao, J. Laser-induced plasma micro-machining (LIPMM) for enhanced productivity and flexibility in laser-based micro-machining processes. CIRP Ann.—Manuf. Technol. 2013, 62, 211–214. [Google Scholar] [CrossRef]
- Pallav, K.; Han, P.; Ramkumar, J.; Ehmann, K.F. Comparative assessment of the laser induced plasma micromachining and the micro-EDM processes. J. Manuf. Sci. Eng. 2014, 136, 011001. [Google Scholar] [CrossRef]
- Zhang, Y.; Zhang, G.; Zhang, Z.; Zhang, Y.; Huang, Y. Effect of assisted transverse magnetic field on distortion behavior of thin-walled components in WEDM process. Chin. J. Aeronaut. 2022, 35, 291–307. [Google Scholar] [CrossRef]
- Zhang, Y.; Zhang, Z.; Zhang, Y.; Liu, D.; Wu, J.; Huang, Y.; Zhang, G. Study on Machining Characteristics of Magnetically Controlled Laser Induced Plasma Micro-Machining Single-crystal Silicon. J. Adv. Res. 2020, 30, 39–51. [Google Scholar] [CrossRef]
- Hwang, D.J.; Grigoropoulos, C.P.; Choi, T.Y. Efficiency of silicon micromachining by femtosecond laser pulses in ambient air. J. Appl. Phys. 2006, 99, 083101. [Google Scholar] [CrossRef]
- Mak, G.Y.; Lam, E.Y.; Choi, H.W. Liquid-immersion laser micromachining of GaN grown on sapphire. Appl. Phys. A 2011, 102, 441–447. [Google Scholar] [CrossRef] [Green Version]
- Charee, W.; Tangwarodomnukun, V. Dynamic features of bubble induced by a nanosecond pulse laser in still and flowing water. Opt. Laser Technol. 2018, 100, 230–243. [Google Scholar] [CrossRef]
- Muhammad, N.; Li, L. Underwater femtosecond laser micromachining of thin nitinol tubes for medical coronary stent manufacture. Appl. Phys. A 2012, 107, 849–861. [Google Scholar] [CrossRef]
- Wang, X.; Huang, Y.; Xu, B.; Xing, Y.; Kang, M. Comparative assessment of picosecond laser induced plasma micromachining using still and flowing water. Opt. Laser Technol. 2019, 119, 105623. [Google Scholar] [CrossRef]
- Qi, P.; Su, Q.; Lin, L.; Liu, W. Bubble dynamics driven by a few successive femtosecond laser pulses in methanol under 1 kHz. J. Opt. Soc. Am. B 2018, 35, 2727. [Google Scholar] [CrossRef]
- Nguyen, T.T.P.; Tanabe-Yamagishi, R.; Ito, Y. Effects of liquid depth on the expansion and collapse of a hemispherical cavitation bubble induced in nanosecond pulsed laser ablation of a solid in liquid. Opt. Lasers Eng. 2020, 126, 105937. [Google Scholar] [CrossRef]
- Tangwarodomnukun, V.; Mekloy, S. Temperature field modeling and cut formation in laser micromachining of silicon in ice layer. J. Mater. Process. Technol. 2019, 271, 202–213. [Google Scholar] [CrossRef]
- Zhang, D.; Gökce, B.; Sommer, S.; Streubel, R.; Barcikowski, S. Debris-free rear-side picosecond laser ablation of thin germanium wafers in water with ethanol. Appl. Surf. Sci. 2016, 367, 222–230. [Google Scholar] [CrossRef]
- Bashir, S.; Rafique, M.S.; Ajami, A.A.; Nathala, C.S.; Husinsky, W.; Whitmore, K. Femtosecond laser ablation of Zn in air and ethanol: Effect of fluence on the surface morphology, ablated area, ablation rate and hardness. Appl. Phys. A 2021, 127, 226. [Google Scholar] [CrossRef]
- Yan, P.; Jin, H.; He, G.; Guo, X.; Ma, L.; Yang, S.; Zhang, R. Numerical simulation of bubble characteristics in bubble columns with different liquid viscosities and surface tensions using a CFD-PBM coupled model. Chem. Eng. Res. Des. 2020, 154, 47–59. [Google Scholar] [CrossRef]
- Kováts, P.; Thévenin, D.; Zähringer, K. Influence of viscosity and surface tension on bubble dynamics and mass transfer in a model bubble column. Int. J. Multiph. Flow 2020, 123, 103174. [Google Scholar] [CrossRef]
- Abdulkadir, M.; Kajero, O.T.; Zhao, D.; Al-Sarkhi, A.; Hunt, A. Experimental investigation of liquid viscosity’s effect on the flow behaviour and void fraction in a small diameter bubble column: How much do we know? J. Pet. Sci. Eng. 2021, 207, 109182. [Google Scholar] [CrossRef]
- Oshaghi, M.R.; Shahsavari, M.; Afshin, H.; Firoozabadi, B. Experimental investigation of the bubble motion and its ascension in a quiescent viscous liquid. Exp. Therm. Fluid Sci. 2019, 103, 274–285. [Google Scholar] [CrossRef]
- Zhou, J.; Xu, R.; Jiao, H.; Bao, J.D.; Liu, Q.Y.; Long, Y.H. Study on the mechanism of ultrasonic-assisted water confined laser micromachining of silicon. Opt. Lasers Eng. 2020, 132, 106118. [Google Scholar] [CrossRef]


Publisher’s Note: MDPI stays neutral with regard to jurisdictional claims in published maps and institutional affiliations. |
© 2022 by the authors. Licensee MDPI, Basel, Switzerland. This article is an open access article distributed under the terms and conditions of the Creative Commons Attribution (CC BY) license (https://creativecommons.org/licenses/by/4.0/).