Abstract
The quasi-one-dimensional material PdTeI exhibits unusual electronic transport properties at ambient pressure. Here, we systematically investigate both the structural and electronic responses of PdTeI to external pressure, through a combination of electrical transport, synchrotron X-ray diffraction (XRD), and Raman spectroscopy measurements. The charge density wave (CDW) order in PdTeI is fragile and the transition temperature TCDW decreases rapidly with the application of external pressure. The resistivity hump is indiscernible when the pressure is increased to ~1 GPa. Upon further compression, the resistivity dropping is observed approximately ~15 GPa and zero resistance is established above ~20 GPa, suggesting the occurrence of superconductivity. Combined XRD and Raman data evidence that the emergence of superconductivity is accompanied by a pressure-induced amorphization of PdTeI.
1. Introduction
Both charge density wave (CDW) and superconductivity (SC) are two typical collective electronic phenomena, which are caused by strong electron–phonon coupling and Fermi surface (FS) instabilities [,,,]. The tuning of the CDW via external parameters such as doping [,,], intercalation [,,,,] or pressure [,,,,,] usually lead to the discovery of SC. The relationship between CDW and SC has been the subject of extensive investigations over the past decades and complex connections between them have been revealed, including coexistence, cooperative or competition [,,,,,,].
In a one-dimensional (1D) system, atomic chains have strong interaction, thus in theory, a long-range CDW state hardly exists when the thermal fluctuation is strong at finite temperature. In practice, long-range CDW ordering states exist in some quasi-1D (q1D) systems, e.g., NbSe3 [,], HfTe3 [,], K0.3MoO3 [,], and TaTe4 [], where 1D chains are embedded in a three-dimensional (3D) structure with weak interchain coupling. Thus, when we modulate the interchain or/and intrachain coupling with a high pressure, q1D materials provide a great platform for exploring relationships between different quantum states [].
Recently, PdTeI with q1D PdTe chains has received much attention since it exhibits unusual electronic transport properties and multiple quantum states. X-ray diffraction (XRD) and neutron powder diffraction studies indicated that there is a dynamic charge separation of Pd ions with local Pd2+ and Pd4+ pair persisting at high temperature []. The long-range CDW transition have been found at TCDW = 110 K with CDW vector q = [0, 0, 0.396(3)]. Surprisingly, the carrier concentration decreases gradually before TCDW, reflecting the existence of strong CDW fluctuation with possible pseudogap states. Moreover, the sliding CDW state appears below T2 ~ 6 K. Thus, PdTeI provides a novel platform for studying the CDW fluctuation and the interplay between CDW and SC states.
High pressure (HP) as a conventional thermodynamic parameter is a pure way with high efficiency in tuning lattice and electronic states, in particular for quantum state. In order to investigate the pressure effect on CDW and explore possible exotic states in PdTeI, we performed experiments of electrical transport, synchrotron XRD as well as Raman spectroscopy and systematically investigated the electrical transport properties and crystal structure of PdTeI under pressure. We observed that the TCDW is suppressed until 1 GPa and SC emerges up to 3.10 K at 44.5 GPa. Meanwhile, a metallic amorphous transition has been identified by HP X-ray diffraction and Raman measurements. Our results suggest that the suppression of CDW may be caused by the stability of Pd3+ ion and SC could be relevant to the amorphous transition as a result of structural instability.
2. Materials and Methods
High quality single crystals of PdTeI were grown using a hydrothermal method, as described elsewhere []. Bar-like single crystals with metallic luster used in this work are stable in the air. In situ HP resistivity measurements were performed using various apparatus including piston cylinder cell (PCC), palm-type cubic anvil cell (CAC) [] and diamond anvil cell (DAC). For PCC and CAC, the standard four-probe method was employed with current along the c axis. The Daphne 7373 and glycerol were used in PCC and CAC as the pressure transmitting medium. The pressure values in PCC were determined in situ by monitoring the shift of the superconducting transition of lead (Pb), while those in CAC were estimated from the low-temperature calibration curve established from separate measurements on the superconducting transition of Pb. It should be noted that the pressure values inside the CAC exhibit slight variations upon cooling, which has been characterized in our previous work []. For DAC, four Pt foils were arranged in a van der Pauw four-probe configuration to contact the sample in the chamber for resistivity measurements. A cubic boron nitride and epoxy mixture layer was employed between BeCu gasket and Pt wires as an insulator layer. In situ HP XRD measurements were carried out on the beamline BL15U of Shanghai Synchrotron Radiation Facility using X-rays (λ = 0.6199 Å). In situ HP Raman spectroscopy experiments were performed using a Renishaw Raman spectrometer (laser excitation wavelength λ = 532 nm). Pressure was determined by the ruby luminescence method [].
3. Results and Discussion
PdTeI crystallizes in a tetragonal structure with space group P42/mmc (No. 131). As shown in Figure 1a, PdTeI features quasi-1D channels of corner sharing PdTe4I2 octahedra along the c axis. The channels are connected mutually by the I-I edges of the octahedron of PdTe4I2 along the a and c axes, there are four Pd-Te chains in each channel. Since the tilt of the octahedron of PdTe4I2, the Pd-Te chains are not parallel to the c axis straightly. The single-crystal XRD data reveals that the (h00) plane is a natural cleavage facet of as-grown single crystals (Figure 1b). The full width at half maximum (FWHM) of (400) peak is only 0.0438° (inset of Figure 1b), indicating the high quality of our samples. Optical microscope shows a rod-like crystal (inset of Figure 1c). The average compositions were derived from a typical EDX measurement at several points on the crystal, revealing good stoichiometry with the atomic ratio of Pd:Te:I = 31.53%:33.45%:35.02% (Figure 1c). At ambient pressure, resistivity measurements on high-quality PdTeI single crystals reveal obvious anomalies TCDW ~ 110 K [], which has been ascribed to the formation of a CDW order, as shown in Figure 1d.
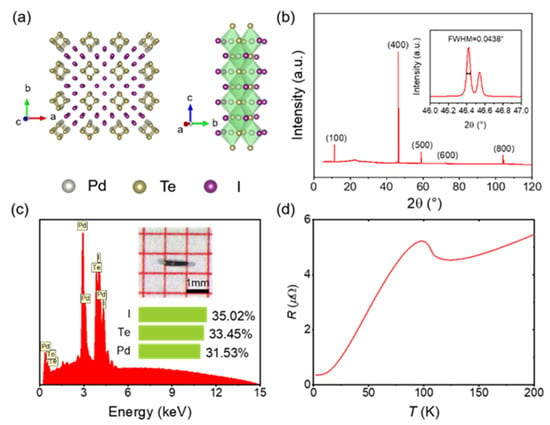
Figure 1.
(a) Crystal structure of PdTeI. The PdTe4I2 octahedron highlighted in green, gray, yellow, and violet balls represent Pd, Te, and I atoms, respectively. (b) XRD patterns of single crystal of PdTeI at ambient pressure. Inset: the FWHM of (400) peak is 0.0438°. (c) Energy-dispersive X-ray spectroscopy and optical photograph of PdTeI. (d) Temperature-dependent resistance at ambient pressure for PdTeI single crystal.
We carried out a comprehensive HP study on single-crystalline samples in order to investigate the pressure effect on CDW. Figure 2a shows the temperature-dependent resistivity ρ(T) of PdTeI single crystals under various pressures up to 7.2 GPa at 0 T. The TCDW can be well defined from the sharp minimum of the dρ/dT curve, as shown in Figure 2b. However, a misalignment may exist in our resistivity measurements with the contributions from both c axis and b axis. In light of the competing nature between CDW and SC, we measured the resistivity ρ(T) of PdTeI under various hydrostatic pressures to further explore whether SC will emerge followed a suppression of CDW by using PCC up to ~2.3 GPa and CAC up to 7.2 GPa. With increasing pressure gradually, the hump-like anomaly in ρ(T) and the corresponding minimum in dρ/dT move to lower temperatures monotonically from ~110 K at ambient pressure to ~71 K at 0.75 GPa. It should be noted that the ρ(T) curve measured at 0.61 GPa was recorded during the pressure decreasing process from ~2.3 GPa to 0.61 GPa. As shown in Figure 2a,b, the CDW transition in ρ(T) and dρ/dT only exhibits very weak feature at 0.75 GPa and cannot be discerned at 1.6 GPa.
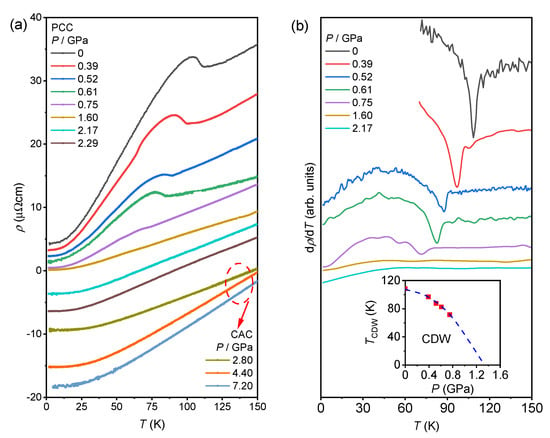
Figure 2.
Temperature-dependent (a) resistivity ρ(T) and (b) its derivative dρ/dT of PdTeI under various hydrostatic pressures up to 7.2 GPa. All the resistivity curves were vertically shifted for clarity. The inset shows the CDW transition temperature TCDW as a function of pressure.
As can be seen in the inset of Figure 2b, the pressure dependent TCDW determined from the minimum of dρ/dT shows a complete suppression at ~1.3 GPa. However, no SC was observed down to 2 K with pressure further increasing to ~2.3 GPa in PCC and 7.2 GPa in CAC. At the pressure of 19.9 GPa, the ρ(T) curve drops to zero at low temperature, suggesting the emergence of SC (Figure 3a). It is clear that the Tc increases monotonously with increasing pressure and up to 3.07 K at 44.5 GPa (Figure 3b). Moreover, the ρ(T) curves as a function of temperature at various fields for 44.5 GPa is shown in Figure 3c. When increasing the magnetic field, the resistivity drop is continuously shifted to a lower temperature and no SC is observed at 2.5 T. The temperature dependent upper critical field μ0Hc2(T) is shown in Figure 3d. Here, the value of Tc is derived from 90% of the normal state resistivity. To determine the upper critical field μ0Hc2(0) at 0 K, the Ginzburg–Landau (G-L) formula μ0Hc2(T) = μ0Hc2(0)(1 − t2)/(1 + t2), where t denotes a reduced temperature of T/Tc, is used to fit the μ0Hc2(T) curves. The obtained μ0Hc2(0) is 2.25 T for 44.5 GPa, which is much lower than the Pauli limiting field Hp(0) = 1.84Tc = 5.65 T. It indicates that the orbital pair breaking mechanism is dominant in PdTeI.
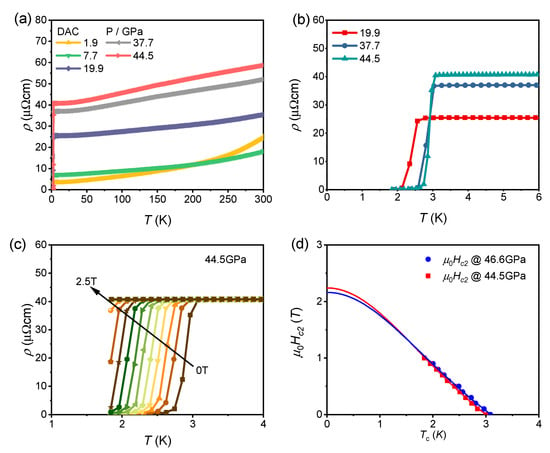
Figure 3.
(a) Electrical resistivity of PdTeI as a function of temperature under high pressures up to 44.5 GPa. (b) Temperature-dependent resistivity of PdTeI in the vicinity of the superconducting transition. (c) Temperature dependence of resistivity under different magnetic fields for PdTeI at 44.5 GPa. (d) The upper critical field μ0Hc2(T) as a function of temperature at representative pressures. The solid lines correspond to the results of fitting by Ginzburg–Landau (G-L) formula.
In situ HP synchrotron XRD measurements were carried out on powered single crystals of PdTeI to clarify whether the pressure-induced SC is associated with structural phase transition (Figure 4a). In the low-pressure range, most diffraction peaks of PdTeI could be indexed to the tetragonal P42/mmc structure. When increasing the pressure, all peaks slowly shift to higher angles and no structural phase transition is observed up to 13.3 GPa. As shown in Figure 4b, both a- and c-axial lattice parameters decrease with increasing pressure. Interestingly, above 18.22 GPa, apart from the formation of a broad diffusive peak at ≈13°, the Bragg peaks disappear from the XRD spectra. It demonstrates that PdTeI may go through an amorphous phase transition persistent up to 75.6 GPa. In addition, upon decompression, the amorphous behavior is maintained. Meanwhile, in situ HP Raman spectroscopy experiments were also carried out up to 31 GPa (Figure 4c). At 1.0 GPa, PdTeI displays seven Raman vibrational modes at 34.8, 44.4, 70.4, 81.5, 127.2, 140.8 and 147.4 cm−1, respectively. The split of Raman peak around 127 cm−1 and the red shift around 141 cm−1 (Figure 4d) above about 1.3 GPa may related with the suppression of CDW. Consistent with the pressure-induced amorphization from the XRD results aforementioned, all the Raman modes disappear above 15.4 GPa corresponding to completion of the structural transition.
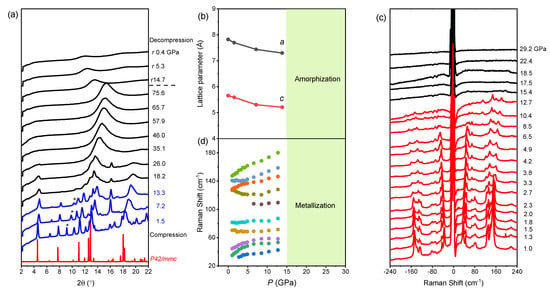
Figure 4.
Pressure effect on structure of PdTeI. (a) XRD patterns of PdTeI measured at room temperature with increasing of external pressure up to 75.6 GPa. The X-ray diffraction wave-length λ is 0.6199 Å. (b) Pressure dependence of the lattice constants a and c for PdTeI. (c) Raman spectrum of PdTeI at various pressures. Anti-stokes shift and stokes shift of Raman shifts are symmetrical about 0 cm−1. (d) Stokes shifts of Raman spectroscopy for PdTeI in compression.
On the basis of the above results, we construct a temperature-pressure phase diagram for PdTeI single crystal, as displayed in Figure 5. One can see that the CDW is fragile and TCDW decreases sharply with pressure. By extrapolating this tendency, the CDW transition is estimated to be suppressed completely above around 1 GPa. It should be noted that some typical vibration mode (e.g., 127.2 cm−1 and 140.8 cm−1 in ambient condition) shows redshift behavior, which may be related to the stability of Pd3+ ion []. The disappearance of charge separation of Pd ions may be the reason for the suppression of CDW under high pressure. Different from many previous reports, compression can destabilize the CDW and then SC will emerge nearby [,,], here however we do not observe SC around 1 GPa at temperatures down to 1.8 K []. With further increasing pressure, SC was observed at around 15 GPa (Figure S1) (see supplementary materials), where a pressure-induced amorphization emerges. The Tc increases with applied pressure and reaches a value of 3.07 K at 44.5 GPa for PdTeI. The transport measurements on different samples for independent runs provide the consistent and reproducible results, confirming this intrinsic SC under pressure (Figure S1). It is very interesting that an amorphous phase of PdTeI could support SC. Other materials also show superconductivity under high pressure when the crystal structure change to an amorphous phase, such as Pd3P2S8 [,], Bi4I4 [], (NbSe4)2I [], and (TaSe4)2I [,]. Recently we learned that correlated disorder in the amorphous phase could be considered a way toward robust superconductivity []. The results shown here provide a platform to investigate the mechanism of superconductivity in the amorphous phase. Further studies from both experimental and theoretical perspectives still need to be addressed.
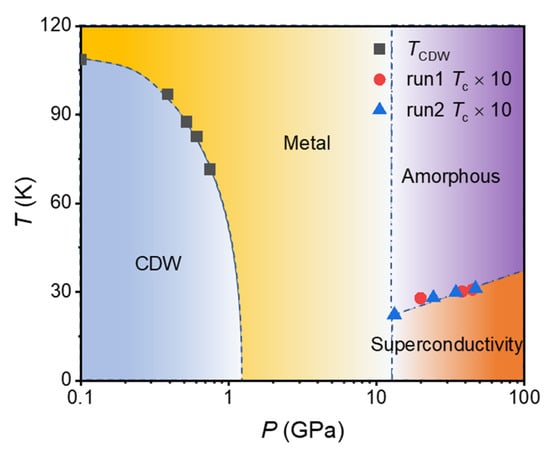
Figure 5.
Phase diagram of PdTeI. The TCDW and Tc determined from the resistivity measurements are shown as a function of pressure.
4. Conclusions
In summary, we have investigated the electrical transport properties and crystal structures of the q1D CDW material PdTeI using various high apparatus. Experimental results show that the CDW order is suppressed quickly with pressure and disappears above ~1 GPa. At a higher pressure above 15 GPa, a pressure-induced SC is observed, which is related to a pressure-induced amorphization. Thus, PdTeI provides a novel platform for studying the CDW fluctuation and SC in q1D systems.
Supplementary Materials
The following supporting information can be downloaded at: https://www.mdpi.com/article/10.3390/cryst12121833/s1. Figure S1: Electrical resistivity ρ(T) of PdTeI as a function of temperature for pressures up to 46.6 GPa in run 2.
Author Contributions
Investigation, Y.Z., C.P., J.S., Q.W., L.G., W.C., C.L., S.Z., M.Z. and Y.C.; resources, Y.F. and H.L.; data curation, Y.Z., J.H., Y.F. and J.S.; writing—original draft preparation, Y.Z., J.H. and J.S.; writing—review and editing, Y.Z. and Y.Q.; supervision, H.L., J.C. and Y.Q. All authors have read and agreed to the published version of the manuscript.
Funding
This work was supported by the National Natural Science Foundation of China (Grant No. 12004252, U1932217, 11974246), the National Key R&D Program of China (Grant No. 2018YFA0704300), Shanghai Science and Technology Plan (Grant No. 21DZ2260400). The work at IOPCAS was supported by the Beijing Natural Science Foundation (Z190008), the National Natural Science Foundation of China (12025408, 11921004, 11834016, 11904391, 11874400), and the CAS Interdisciplinary Innovation Team. The work at RUC was supported by the Beijing Natural Science Foundation (Grant No. Z200005), the National Key R&D Program of China (Grant No. 2018YFE0202600), the National Natural Science Foundation of China (12274459), and the Beijing National Laboratory for Condensed Matter Physics.
Data Availability Statement
Not applicable.
Acknowledgments
The authors thank the support from Analytical Instrumentation Center (# SPST-AIC10112914), SPST, ShanghaiTech University, the staff from BL15U1 at Shanghai Synchrotron Radiation Facility for assistance during data collection.
Conflicts of Interest
The authors declare no conflict of interest.
References
- Morosan, E.; Zandbergen, H.W.; Dennis, B.S.; Bos, J.W.G.; Onose, Y.; Klimczuk, T.; Ramirez, A.P.; Ong, N.P.; Cava, R.J. Superconductivity in CuxTiSe2. Nat. Phys. 2006, 2, 544–550. [Google Scholar] [CrossRef]
- Kiss, T.; Yokoya, T.; Chainani, A.; Shin, S.; Hanaguri, T.; Nohara, M.; Takagi, H. Charge-order-maximized momentum-dependent superconductivity. Nat. Phys. 2007, 3, 720–725. [Google Scholar] [CrossRef]
- Agterberg, D.F.; Tsunetsugu, H. Dislocations and vortices in pair-density-wave superconductors. Nat. Phys. 2008, 4, 639–642. [Google Scholar] [CrossRef]
- Chang, J.; Blackburn, E.; Holmes, A.T.; Christensen, N.B.; Larsen, J.; Mesot, J.; Liang, R.X.; Bonn, D.A.; Hardy, W.N.; Watenphul, A.; et al. Direct observation of competition between superconductivity and charge density wave order in YBa2Cu3O6.67. Nat. Phys. 2012, 8, 871–876. [Google Scholar] [CrossRef]
- Li, L.J.; Lu, W.J.; Zhu, X.D.; Ling, L.S.; Qu, Z.; Sun, Y.P. Fe-doping-induced superconductivity in the charge-density-wave system 1T-TaS2. EPL 2012, 97, 6. [Google Scholar] [CrossRef]
- Liu, Y.; Ang, R.; Lu, W.J.; Song, W.H.; Li, L.J.; Sun, Y.P. Superconductivity induced by Se-doping in layered charge-density-wave system 1T-TaS2-xSex. Appl. Phys. Lett. 2013, 102, 5. [Google Scholar] [CrossRef]
- Liu, Y.; Shao, D.F.; Li, L.J.; Lu, W.J.; Zhu, X.D.; Tong, P.; Xiao, R.C.; Ling, L.S.; Xi, C.Y.; Pi, L.; et al. Nature of charge density waves and superconductivity in 1T-TaSe2-xTex. Phys. Rev. B 2016, 94, 8. [Google Scholar] [CrossRef]
- Fang, L.; Wang, Y.; Zou, P.Y.; Tang, L.; Xu, Z.; Chen, H.; Dong, C.; Shan, L.; Wen, H.H. Fabrication and superconductivity of NaxTaS2 crystals. Phys. Rev. B 2005, 72, 8. [Google Scholar] [CrossRef]
- Kogar, A.; de la Pena, G.A.; Lee, S.; Fang, Y.; Sun, S.X.L.; Lioi, D.B.; Karapetrov, G.; Finkelstein, K.D.; Ruff, J.P.C.; Abbamonte, P.; et al. Observation of a Charge Density Wave Incommensuration Near the Superconducting Dome in CuxTiSe2. Phys. Rev. Lett. 2017, 118, 5. [Google Scholar] [CrossRef]
- Zhu, X.D.; Lei, H.C.; Petrovic, C. Coexistence of Bulk Superconductivity and Charge Density Wave in CuxZrTe3. Phys. Rev. Lett. 2011, 106, 4. [Google Scholar] [CrossRef]
- Lei, H.; Zhu, X.; Petrovic, C. Raising Tc in charge density wave superconductor ZrTe3 by Ni intercalation. EPL 2011, 95, 17011. [Google Scholar] [CrossRef][Green Version]
- Sipos, B.; Kusmartseva, A.F.; Akrap, A.; Berger, H.; Forro, L.; Tutis, E. From Mott state to superconductivity in 1T-TaS2. Nat. Mater. 2008, 7, 960–965. [Google Scholar] [CrossRef] [PubMed]
- Kusmartseva, A.F.; Sipos, B.; Berger, H.; Forro, L.; Tutis, E. Pressure Induced Superconductivity in Pristine 1T-TiSe2. Phys. Rev. Lett. 2009, 103, 4. [Google Scholar] [CrossRef]
- Chen, K.Y.; Wang, N.N.; Yin, Q.W.; Gu, Y.H.; Jiang, K.; Tu, Z.J.; Gong, C.S.; Uwatoko, Y.; Sun, J.P.; Lei, H.C.; et al. Double Superconducting Dome and Triple Enhancement of T-c in the Kagome Superconductor CsV3Sb5 under High Pressure. Phys. Rev. Lett. 2021, 126, 247001. [Google Scholar] [CrossRef] [PubMed]
- Freitas, D.C.; Rodiere, P.; Osorio, M.R.; Navarro-Moratalla, E.; Nemes, N.M.; Tissen, V.G.; Cario, L.; Coronado, E.; Garcia-Hernandez, M.; Vieira, S.; et al. Strong enhancement of superconductivity at high pressures within the charge-density-wave states of 2H-TaS2 and 2H-TaSe2. Phys. Rev. B 2016, 93, 6. [Google Scholar] [CrossRef]
- Wang, Q.; Kong, P.F.; Shi, W.J.; Pei, C.Y.; Wen, C.H.P.; Gao, L.L.; Zhao, Y.; Yin, Q.W.; Wu, Y.S.; Li, G.; et al. Charge Density Wave Orders and Enhanced Superconductivity under Pressure in the Kagome Metal CsV3Sb5. Adv. Mater. 2021, 33, 6. [Google Scholar] [CrossRef]
- Pei, C.; Ying, T.; Zhao, Y.; Gao, L.; Cao, W.; Li, C.; Hosono, H.; Qi, Y. Pressure-induced reemergence of superconductivity in BaIr2Ge7 and Ba3Ir4Ge16 with cage structures. Matter Radiat. Extrem. 2022, 7, 038404. [Google Scholar] [CrossRef]
- Nagano, Y.; Araoka, N.; Mitsuda, A.; Yayama, H.; Wada, H.; Ichihara, M.; Isobe, M.; Ueda, Y. Charge Density Wave and Superconductivity of RPt2Si2 (R = Y, La, Nd, and Lu). J. Phys. Soc. Japan 2013, 82, 064715. [Google Scholar] [CrossRef]
- Scholz, G.A. Charge-density-wave behaviour in intercalated single crystal Nb3Te4. Solid State Ion. 1997, 100, 135–141. [Google Scholar] [CrossRef]
- Wolf, T.M.R.; Holst, M.F.; Sigrist, M.; Lado, J.L. Nonunitary multiorbital superconductivity from competing interactions in Dirac materials. Phys. rev. res. 2022, 4, L012036. [Google Scholar] [CrossRef]
- Lian, C.-S.; Si, C.; Duan, W. Unveiling Charge-Density Wave, Superconductivity, and Their Competitive Nature in Two-Dimensional NbSe2. Nano Lett. 2018, 18, 2924–2929. [Google Scholar] [CrossRef] [PubMed]
- Yu, F.; Ma, D.; Zhuo, W.; Liu, S.; Wen, X.; Lei, B.; Ying, J.; Chen, X. Unusual competition of superconductivity and charge-density-wave state in a compressed topological kagome metal. Nat. Commun. 2021, 12, 3645. [Google Scholar] [CrossRef] [PubMed]
- Gabovich, A.; Voitenko, A.; Ekino, T.; Li, M.S.; Szymczak, H.; Pękała, M. Competition of superconductivity and charge density waves in cuprates: Recent evidence and interpretation. Adv. Condens. Matter Phys. 2010, 2010, 681070. [Google Scholar] [CrossRef]
- Regueiro, M.N.; Mignot, J.M.; Castello, D. Superconductivity at High Pressure in NbSe3. EPL 1992, 18, 53–57. [Google Scholar] [CrossRef]
- Briggs, A.; Monceau, P.; Nunez-Regueiro, M.; Peyrard, J.; Ribault, M.; Richard, J. Charge density wave formation, superconductivity and Fermi surface determination in NbSe3 a pressure study. J. Phys. C 1980, 13, 2117–2130. [Google Scholar] [CrossRef]
- Liu, Z.Y.; Li, J.; Zhang, J.F.; Li, J.; Yang, P.T.; Zhang, S.; Chen, G.F.; Uwatoko, Y.; Yang, H.X.; Sui, Y.; et al. Quasi-one-dimensional superconductivity in the pressurized charge-density-wave conductor HfTe3. NPJ Quantum Mater. 2021, 6, 90. [Google Scholar] [CrossRef]
- Denholme, S.J.; Yukawa, A.; Tsumura, K.; Nagao, M.; Tamura, R.; Watauchi, S.; Tanaka, I.; Takayanagi, H.; Miyakawa, N. Coexistence of superconductivity and charge-density wave in the quasi-one-dimensional material HfTe3. Sci. Rep. 2017, 7, 45217. [Google Scholar] [CrossRef]
- Sato, M.; Fujishita, H.; Sato, S.; Hoshino, S. Neutron inelastic scattering and X-ray structural study of the charge-density-wave state in K0.3MoO3. J. Phys. C 1985, 18, 2603–2614. [Google Scholar] [CrossRef]
- Travaglini, G.; Mörke, I.; Wachter, P. CDW evidence in one-dimensional K0.3MoO3 by means of Raman scattering. Solid State Commun. 1983, 45, 289–292. [Google Scholar] [CrossRef]
- Liu, F.-H.; Fu, W.; Deng, Y.-H.; Yuan, Z.-B.; Wu, L.-N. First-principles study of the Kohn anomaly in TaTe4. Appl. Phys. Lett. 2021, 119, 091901. [Google Scholar] [CrossRef]
- Lebed, A.G. The Physics of Organic Superconductors and Conductors; Springer: Berlin/Heidelberg, Germany, 2008; Volume 110. [Google Scholar]
- Cottingham, P.; Miller, D.C.; Sheckelton, J.P.; Neilson, J.R.; Feygenson, M.; Huq, A.; McQueen, T.M. Dynamic charge disproportionation in the 1D chain material PdTeI. J. Mater. Chem. C 2014, 2, 3238–3246. [Google Scholar] [CrossRef]
- Lei, H.; Liu, K.; Yamaura, J.-I.; Maki, S.; Murakami, Y.; Lu, Z.-Y.; Hosono, H. Strong charge density wave fluctuation and sliding state in PdTeI with quasi-one-dimensional PdTe chains. Phys. Rev. B 2016, 93, 121101. [Google Scholar] [CrossRef]
- Cheng, J.G.; Matsubayashi, K.; Nagasaki, S.; Hisada, A.; Hirayama, T.; Hedo, M.; Kagi, H.; Uwatoko, Y. Integrated-fin gasket for palm cubic-anvil high pressure apparatus. Rev. Sci. Instrum. 2014, 85, 093907. [Google Scholar] [CrossRef]
- Mao, H.K.; Xu, J.; Bell, P.M. Calibration of the ruby pressure gauge to 800 kbar under quasi-hydrostatic conditions. J. Geophys. Res. Solid Earth 1986, 91, 4673–4676. [Google Scholar] [CrossRef]
- Gleason, S.L.; Gim, Y.; Byrum, T.; Kogar, A.; Abbamonte, P.; Fradkin, E.; MacDougall, G.J.; Van Harlingen, D.J.; Zhu, X.; Petrovic, C.; et al. Structural contributions to the pressure-tuned charge-density-wave to superconductor transition in ZrTe3: Raman scattering studies. Phys. Rev. B 2015, 91, 155124. [Google Scholar] [CrossRef]
- Yomo, R.; Yamaya, K.; Abliz, M.; Hedo, M.; Uwatoko, Y. Pressure effect on competition between charge density wave and superconductivity in ZrTe3: Appearance of pressure-induced reentrant superconductivity. Phys. Rev. B 2005, 71, 4. [Google Scholar] [CrossRef]
- Wang, S.; Chen, X.; An, C.; Zhou, Y.; Zhou, Y.; Gu, C.; Zhang, L.; Yang, X.; Yang, Z. Pressure-induced superconductivity in the quasi-one-dimensional charge density wave material CuTe. Phys. Rev. B 2021, 103, 134518. [Google Scholar] [CrossRef]
- Wang, Q.; Qiu, X.; Pei, C.; Gong, B.; Gao, L.; Zhao, Y.; Cao, W.; Li, C.; Zhu, S.; Zhang, M. Emergent superconductivity in van der Waals Kagome material Pd3P2S8 under high pressure. arXiv 2022, arXiv:2204.05179. [Google Scholar]
- Zhou, Y.; He, X.; Wang, S.; Wang, J.; Chen, X.; Zhou, Y.; An, C.; Zhang, M.; Zhang, Z.; Yang, Z. Pressure-induced superconductivity in the kagome single-crystal Pd3P2S8. Phys. Rev. B 2022, 106, 104512. [Google Scholar] [CrossRef]
- Qi, Y.P.; Shi, W.J.; Werner, P.; Naumov, P.G.; Schnelle, W.; Wang, L.; Rana, K.G.; Parkin, S.; Medvedev, S.A.; Yan, B.H.; et al. Pressure-induced superconductivity and topological quantum phase transitions in a quasi-one-dimensional topological insulator: Bi4I4. NPJ Quantum Mater. 2018, 3, 4. [Google Scholar] [CrossRef]
- Pei, C.; Shi, W.; Zhao, Y.; Gao, L.; Gao, J.; Li, Y.; Zhu, H.; Zhang, Q.; Yu, N.; Li, C.; et al. Pressure-induced a partial disorder and superconductivity in quasi-one-dimensional Weyl semimetal (NbSe4)2I. Mater. Today Phys. 2021, 21, 100509. [Google Scholar] [CrossRef]
- An, C.; Zhou, Y.; Chen, C.; Fei, F.; Song, F.; Park, C.; Zhou, J.; Rubahn, H.-G.; Moshchalkov, V.V.; Chen, X.; et al. Long-Range Ordered Amorphous Atomic Chains as Building Blocks of a Superconducting Quasi-One-Dimensional Crystal. Adv. Mater. 2020, 32, 2002352. [Google Scholar] [CrossRef] [PubMed]
- Mu, Q.-G.; Nenno, D.; Qi, Y.-P.; Fan, F.-R.; Pei, C.; ElGhazali, M.; Gooth, J.; Felser, C.; Narang, P.; Medvedev, S. Suppression of axionic charge density wave and onset of superconductivity in the chiral Weyl semimetal Ta2Se8I. Phys. Rev. Mater. 2021, 5, 084201. [Google Scholar] [CrossRef]
- Neverov, V.D.; Lukyanov, A.E.; Krasavin, A.V.; Vagov, A.; Croitoru, M.D. Correlated disorder as a way towards robust superconductivity. Commun. Phys. 2022, 5, 177. [Google Scholar] [CrossRef]
Publisher’s Note: MDPI stays neutral with regard to jurisdictional claims in published maps and institutional affiliations. |
© 2022 by the authors. Licensee MDPI, Basel, Switzerland. This article is an open access article distributed under the terms and conditions of the Creative Commons Attribution (CC BY) license (https://creativecommons.org/licenses/by/4.0/).