Article

Effect of Plant Nanocellulose Electrolyte, Zinc Oxide Nanoparticles, and Nano-Chlorophyll Sensitiser on the Dye-Sensitised Solar Cell Performance

by
Abdullah K. Alanazi
1,2,*,
Hala M. Abo-Dief
2,3,*,
Zeid A. Alothman
4,
Ashraf T. Mohamed
5,*,
Tanay Pramanik
6 and
Saad H. Alotaibi
7
1
Department of Chemistry, College of Science, Taif University, P.O. Box 11099, Taif 21944, Saudi Arabia
2
High Altitude Research Center, Taif University, P.O. Box 11099, Taif 21944, Saudi Arabia
3
Department of Science and Technology, University College–Ranyah, Taif University, P.O. Box 11099, Taif 21944, Saudi Arabia
4
Department of Chemistry, College of Science, King Saud University, P.O. Box 145111, Riyadh 11451, Saudi Arabia
5
Design and Production Department, College of Engineer, Minia University, Minya 61519, Egypt
6
Department of Chemistry, University of Engineering and Management Kolkata, Kolkata 700160, India
7
Department of Chemistry, Turabah University College, Taif University, P.O. Box 11099, Taif 21944, Saudi Arabia
*
Authors to whom correspondence should be addressed.
Crystals 2022, 12(12), 1771; https://doi.org/10.3390/cryst12121771
Submission received: 2 October 2022 / Revised: 24 October 2022 / Accepted: 9 November 2022 / Published: 6 December 2022

Abstract

:
Owing to ecological concerns and the rapid increase in fossil fuel consumption, sustainable and efficient generation technologies are being developed. The present work aimed at manufacturing DSSC that is based on natural elements for converting the sun energy into electrical energy. ZnO nano materials are used in solar cells as binary compound semiconductor according to their stability, better conductivity, excellent mobility, the best affinity of electrons, and lower cost compared to other semiconductors. Recently, nanocellulose has shown potential as an advanced nanomaterial used in electrochemical conversion devices since it is considered the best abundant Earth biopolymer and is inexpensive and versatile. The constructed DSSC composed of plant nanocellulose (PNC) extracted from banana peel and nano-chlorophyll dye extracted from aloe vera were evaluated as the electrolyte and sensitiser, respectively. With increasing PNC content from 0 to 32 wt.%, both PV parameters and lifetime increase, and voltage decay decreases. The nano particles size modification for three materials carried by ultrasonic waves. Increasing the ultrasonic wave exposure time reduced the size of the Chl particles. The addition of PNC from banana peel to DSSC electrolyte is shown effective. The effect of varying the PNC/nano-chlorophyll content (0–32 wt.%) on the photovoltaic parameters of the DSSC was investigated. The addition of PNC significantly increased the fill factor and sunlight conversion efficiency. The DSSCs showed acceptable performance under relatively low irradiation conditions and different light intensities, indicating that they are suitable for outdoor applications.

1. Introduction

Fossil fuels increasing consumption and the related ecological problems have inspired much research on cleaner sources of energy that can provide environmental sustainability and sufficient energy at an acceptable cost. Various forms of renewable energy are required to satisfy the increasing energy demands of a growing population. Gielen et al. [1] indicated that energy efficiency and renewable energy technologies are the core elements of that transition, and their synergies are likewise important. Such a transition is underpinned through benefit economics, resources of ubiquitous, developed technology, and the benefits of significant socio-economic, [2]. Two-thirds of the total global energy demand are supplied from renewable energy and controlled the greenhouse gas emissions reduction which needed between now and 2050 to make the average global surface temperature increase below 2 °C [3]. Solarin [4] concluded that the policies to reduce the dependence on the crude oil resource over a long-term impact is limited. However, Sonter et al. [5] showed that renewable energy production is required to reduce the climate changes and its associated biodiversity losses, which generated new technologies and driving the infrastructure into an increment of the production of many metals that creating biodiversity mining threats. Renewable energy (RE) sources composed of; geothermal, hydro, solar, tidal, waste, biofuels and wind. It is contributed 26% of the generated global electricity which its advancement is the prime area of investigation coupled with the forecasting of the RE systems energy generation, and the technology advancement. The RE forecasting energy generation from RE systems are now the prime areas of investigation, but Solar and wind are the most unpredictable, due to their high variability compared with other RE sources, [6]. Smith et al. [7] concluded that renewable power generation is causing an overhaul in the topology, composition, and dynamics of electrical grids. Al Qubeissi et al. [8] presented that renewable energy will reduce environmental costs since the energy systems will be operated both securely and economically without environmental problems. Arndt et al. [9] explained that variable renewables will possess very high levels of penetration into energy systems, particularly in regions with solar and wind potential.
Saba and Ngepah [10] measured renewable energy (RE) sources through renewable electricity output and renewable energy consumption. Kinolikar et al. [11] generated power using advanced solar panels to overcome the disadvantages of the current version of solar panels, which are flat plate collectors, by replacing them with appropriate dimensions of convex lenses. They used this setup for the generation of steam for the generation of electricity in a thermal power plant. Laha et al. [12] showed the effect of solar energy in photovoltaic using a Fresnel convex Lens. They found that there is unbelievable improvement in various parameters of photovoltaic nature, enhanced in commendable time, diminished the reflection losses, and implemented proper photon management. Angowski et al. [13] identified and explained the behavioural intention to use home photovoltaic systems by Polish households and potential buyers. Ata and Dolmatov [14] suggested that RE investment is inversely relative to; energy, electricity and carbon (CO2) emissions usages. Alam et al. [15] predicted the PV solar technology through environmental concern, environmental knowledge, adoption cost, awareness, and government initiatives. Dincer and Meral [16] considered the most important factors that affect the solar cells efficiency for more reliable applications. To fulfil mankind energy needs for one year, the Sun energy reaching the Earth is sufficient since solar energy is highly attractive, [17]. Armaroli and Balzani [18] concluded that it is required to optimise methods of solar energy harvesting and conversion to electrical energy.
Until now, solid-state junction devices that are often made of silicon are used for sunlight conversion to electrical power while nanocrystalline materials and conducting polymer films are considered for new generation photovoltaic cells, [19]. For past few decades, dye-sensitised solar cells considered as low-cost type compared to inorganic solar cells that based on a semiconductor-formed photosensitised anode (e.g., TiO2 or ZnO semiconductor coated with a photoactive dye) and an electrolyte. Patni et al. [20] explored the working mechanism of natural dye sensitisers and observed a high cell efficiency (η) of 3.73%. Dinesh et al. [21] obtained 0.13% solar cell conversion efficiency as a new type of eco-friendly DSSC using electro-spun ZnO nanofibers. Pratiwi et al. [22] obtained DSSCs with an overall efficiency of 0.077% by using a metal doping of natural dyes. Kohn et al. [23] produced DSSCs from inexpensive and non-toxic materials, but only low efficiencies were achieved. Junger et al. [24] created textile-based DSSCs with an overall efficiency of 0.033%. To enhance the sustainability of this technology, several groups have recently proposed the use of plant materials for DSSCs [25]. High-performance DSSCs development required dyes with strong absorption in the visible-light region and suitable chemical groups to allow strong bonding by injecting electrons into semiconductor surfaces [26]. Atli et al. [27] obtained a PCE of 0.028% by using extracted natural dyes as promising alternative sensitisers. Junger et al. [28] used caffeine sensitisers in DSSCs to obtain a PCE of 0.072%. Bashar et al. [29] achieved PCE values of 0.56% and 0.49% by extracting natural red dye from beetroot and spinach green dye, respectively.
Hosseinnezhad et al. [30] achieved a maximum PCE of 1.38% from extracted natural Celosia Cristata, Saffron, Cynoglossum, and eggplant peel dyes. Franchi et al. [31] prepared new series of symmetrical organic dyes containing an indigo central core decorated with different electron donor groups starting from Tyrian Purple. Navar et al. [32] extracted cochineal, papaya peel, and Scenedesmus natural dyes with 0.228%, 0.093%, and 0.064% efficiencies respectively. Velasco et al. [33] achieved an efficiency of 0.032% using Prodigiosin pigment as a sensitiser. Arifin et al. [34] reported enhanced performance and stability of DSSCs using natural dyes from papaya leaves (PCE = 0.16%).
Zinc oxide (ZnO) has higher conductivity, electron mobility, stability against photo-corrosion, and availability at low-cost to be used in solar cell applications, [35]. Vittal and Ho [36] concluded that Zinc oxide (ZnO) is an alternative to TiO2 as the semiconductor material in a dye-sensitised solar cell (DSSC) since ZnO has much higher electron diffusivity than TiO2, electron mobility, a large excitation binding energy, low cost, and stable against photo-corrosion. Das et al. [37] modified the Zn2SnO4 photo anode surface stability using N3 and N719 dye molecules. They illustrated the fabricated DSSCs benefits, high electron mobility, high electrical conductivity, adequate thermodynamic stability, and low visible absorption. Lee et al. [38] used SERS, ATR-FTIR, and confocal Raman imaging for adsorbed TiO2 films using N719 dye. Franchi et al. [39] prepared and fully characterised two new organic dye sensitisers using regioisomeric carboxyl-N-methylpyridinium moieties. Reginato et al. [40] focused on the preparation and characterisation of three different families for D-π-A dyes with respect to their stability and efficiency. Pham et al. [41] used lower-cost hole transporting materials (HTMs) for producing new inexpensive, more stable, and highly efficient anthanthrone (ANT) dye core for Perovskite solar cells (PSCs). Additionally, Pham et al. [42] related the low cost of hole transporting materials (HTM) of stable Perovskite solar cells to inexpensive starting precursor anthanthrone dye paves and large-scale production [43]. Liang and Chen [44] demonstrated the advantages/disadvantages of each DSSCs class using DSSCs.
Siddick et al. [45] developed an innovative, low-cost, and efficient DSSC device with a PCE of 3.95% for synthetic dye and 0.67% for Chl dye. Zhao et al. [46] improved solid-state solar cells using carboxylated Chl (C-Chl) sensitiser and increased their PCE to 3.1%. Almaz et al. [47] used anthocyanin and Chl pigments from the powder of P.rubra flowers and S. androgynous leaves for extracting natural dyes. Anthocyanin gave a higher PCE (0.038%) due to the enhanced interface charge transfer between the dye molecule and ZnO nanoparticles. Wang et al. [48] enhanced and extend the absorption spectrum of C-Chl-sensitised mesoporous TiO2 film as an electron transport layer that results in 3% PCE increment. Cui et al. [49] used synthetic Chl derivatives for fabricating DSSCs based on a mesoporous TiO2 electrode and obtained a PCE of 2.25%. Al-Alwani et al. [50] extracting Chl and anthocyanin natural dyes from Cymbopogon schoenanthus leaves and Ixora coccinea flowers with 0.23% PCE. Wang et al. [48] presented chlorine tri-methyl ester and its copper complex (Cu–Ce6Me3) as two easily synthesised Chl derivatives for organic solar cells with PCEs of only 0.85% and 0.93%, respectively. Delgado et al. [51] described Chl-A spinach leaf sensitisation using an affordable extraction method for Si solar cells to have 15.61% PCE. Li et al. [52] evaluated hole-transporting materials in perovskite solar cells using four Chl derivatives of average PCEs of; (13.06 ± 0.72%), (12.52 ± 1.60%), (10.33 ± 1.23%), and (9.90 ± 0.93%) for hexyl ester, dodecyl ester, methyl ester and phytyl ester respectively. Ridwan et al. [53] used a Chl pigment from Sargassum sp. in a DSSC, giving a PCE of 1.5%. Wang et al. [54] created an artificial- pigment-protein complex by supra-molecular binding of Chl (PCE = 0.55%), while Tamiaki et al. [55] found that increasing the length of the oligomethylene moiety between the chlorin π-system and the carboxy group suppressed the PCE. Wang et al. [56] showed that sensitised Chl–GroEL cells have good photoelectric with a PCE of ~0.9%. Ezike et al. [57] found that C-Chl single dye has PCE of 1.14% and 0.25% for BC-Chl with 25:75 volume %. Zhao et al. [58] reported that sensitisation of mixing Chl-C1 with Chl-C2 at the TiO2–Chl-C interface increases the electron-injection efficiency with a PCE of 4.14%.
Plant nanocellulose (PNC)-based materials have also been proposed as highly promising sustainable and environmentally friendly nanomaterials for advanced electrochemical energy conversion and storage devices [59]. PNC natural materials have potential applications in the coatings, biomedical, energy, construction, separation, and specialty chemical industries [60]. Poskela et al. [61] applied bio based cryogel membranes as electrolyte substrates in DSSCs with a maximum PCE of ~4.9%. Ardakani et al. [62] used Fe3O4@nanocellulose/TiCl nanocomposite as a nanofiller in a polymeric system to enhance triiodide ions and decrease the polymer crystallinity in quasi-solid-state DSSCs to obtain PCE of 7.22%. Teo et al. [63] evaluated polysaccharides as the polymer matrix for sustainable-energy applications, particularly DSSCs. Bita et al. [64] developed PV cells based on conductive polymers in an ambient atmosphere. Hsu and Zhong [65] isolated nanocellulose from a variety of plants through several simple and rapid methods.
In this study, the novelty of this research based on a green-chemistry method is presented for improving the stability and performance of DSCCs composed of Chl-based natural dye and plant nanocellulose as the electrolyte. The extracted aloe-vera natural dye was extracted from aloe-vera waste, and the extracted banana peel electrolytes were characterised and investigated to increase the DSSC PCE. The present work focused on producing the optimal electrolyte/dye fractions with respect to various PV parameters. The chemical, physical, and optical properties characterisation of the extracted cellulose and dye were performed. The effect of PNC content on the DSSC voltage decay and the PV performance at various sunlight intensities is carried out and investigated.

2. Experimental

2.1. Preparation of PNC

Banana peels are the raw material, bran, used. The chemicals used (sodium hypochlorite, potassium metabisulfite, sulfuric acid, acetic acid, petroleum ether, acetone, and ethanol) were supplied by Asseel-Trading-Est., Riyadh, Riyadh Province, Saudi Arabia. The banana peels were washed, immersed in potassium metabisulfite solution (1% w/v) for 24 h to inhibit oxidation, dried in an oven at 70 °C for 24 h, and grinding using a knife mill (model-Lambart-MA201, Linyi Bang Kaishun Int. Trad., CN) [66,67,68]. The lipid fractions were removed, and the raw material washed with ethanol, dried under the same conditions, sieved to a 200 mesh to eliminate the larger particles and the resulting product is stored at 5 °C in a sealed container. The bran that composed of 55% of the original weight, treated with an alkaline solution of 5% w/v KOH 1:20 (bran/solution) at room temperature with stirring to solubilise both the hemicellulose and pectin. The substrate neutralised using both alkaline and acid solution (5% KOH or 10% acetic acid, respectively), applied to successive washings with distilled water and centrifugated at 8000 rpm for 30 min until neutral pH was reached. The lignin removed from insoluble substrate using NaClO2 (1% w/v) at pH = 5.0 (adjusted with acetic acid; 10% v/v) for 1 h at 70 °C to break down the phenolic compounds or molecules with chromophoric groups in the lignin. The pulp became white, indicating that bleaching occurred and performed twice to ensure effective bleaching. Secondly, alkaline treatment occurred under the same conditions as the first step. In the end, the insoluble product treated with H2SO4 (1% v/v) solution for 1 h at 80 °C to hydrolyse the amorphous cellulose, removed trace minerals, and gave the required nanofibres, Shreedhana and Ilavarasi [69]. Then, we processed the product using an ultrasonic wave frequency of 40 kHz and output power of 40 kW for 20 min to produce NPC shown in Figure 1a.

2.2. Preparation of Nano-Chlorophyll

Chlorophyll compounds were extracted from aloe-vera waste, according to Delgado et al. [70]. The plant was cut into pieces (0.5 cm2 for each piece) and placed in a porcelain mortar. Five different solvents used independently: petroleum ether, acetone, isopropyl alcohol, methanol, or ethanol. Then, the mixture is ground with a pestle to produce a solvent paste composed of Chl and fragments. In total, 25 mL of the solvent paste centrifuged at 10,000 rpm for 5 min to separate the aloe-vera remaining fragments, and 18 mL of the centrifuged paste collected ensuring that no solid residues presented in the sample.
Two solutions of Chl are separated according to the fact that Chl-A and Chl-B have polarity and solubility differences. The acetone added to the collected paste solutions containing Chl-A and Chl-B. Then, 30 mL of petroleum ether was added, and the obtained mixtures were transferred to a chromatography column. Soluble acetone that mixed with water has higher density and not miscible with petroleum ether. After that, 35 mL of water was slowly added over the column walls until the water was mixed with acetone and settled at the chromatography column bottom, creating well-defined water/acetone solution interface and the Chl-rich petroleum ether solution. The bottom solution part extracted, and the process repeated three times to remove all the remaining acetone in the solution. Since the top portion of the Chl-rich petroleum-ether solution contained mostly Chl-A, while the bottom portion contained methanol solution, mostly Chl-B, then, Chl-A separated from Chl-B, Figure 1b. In our work, we used chlorophyll (A) according to Szutt and Śródka [71] and Liu et al. [72]. To discuss the effect of ultrasound waves on converting chlorophyll to Nano, four periods of 5 min, 10 min, 15 min, and 20 min are used and compared.

2.3. Preparation of ZnO nanoparticles

ZnO nanoparticles were fabricated using sol–gel at 80–90 °C. A 2.195 g of 0.75M zinc acetate solution dissolved in 100 mL of distilled water, stirred under ambient conditions, (1.122 g) of 0.75M potassium hydroxide dissolved in 10 mL distilled water and added drop wise to the above solution under continuous stirring. After, few minutes, the solution began to gel, and a milky white solution was obtained. The mixture was heated for 3 h at 80–90 °C without stirring, centrifuged to retrieve the product, washed with distilled water, and dried at 70 °C overnight to yield the powder. The structure, morphology, and optical properties of such ZnO powders have been presented previously by Ashtaputre et al. [73] and Bhakat and Singh [74].
ZnO sol–gel solution obtained by diluting the ZnO powder of 0.75 M with 2-methoxyethanol of 0.75 M according to Sekine et al. [75]. A 1:6 volume ratio used as 200 °C hot substrates sprayed coating solution at 40 cc/min N2 gas flow rate. The spray and substrate distance was fixed at 10 cm at 3 cm/s moving speed. The deposition photoactive layer coated ITOs that transferred into a nitrogen-filled glove box, according to Noh et al. [76]. For easier distribution, the ZnO paste was transferred to a syringe that its end wrapped with parafilm to keep the paste from drying during usage. The syringe usage shortens the working time, makes it easier clean-up, and gives proper consistency paste, which will last for more than a lab period in agreement with Liu et al. [72].

2.4. DSSC Assembly

To fabricate DSSCs, glass plates were first cut into 1 × 1 cm2 pieces, which were then cleaned with acetone, distilled water, and ethanol sequentially and dried at 70 °C. Then, the glass plate was covered with adhesive tape to control the film thickness of the nano ZnO paste that spread homogeneously on the plate, and heated to 120 °C for 1 h using hotplate. To avoid the nZnO film cracking, the coated glass plates cooled to room temperature. The prepared ZnO electrodes immersed in dye solutions at room temperature for 24 h to produce photoanodes. The counter electrode (cathode glass plate) was coated with a graphite layer. In DSSCs, the dye is surrounded by an electrolyte (usually an iodide solution) to compensate for reaction electrons lost reaction electrons. The iodide electrolyte prepared by mixing 2.0 g of I2, 3 g of KI, with 50 mL deionised water. The solution diluted to 100 mL deionised water, stirred, and mixed with PNC to form a thick solution. Then, a dropper was used to drop 1–2 electrolyte drops onto the photo anode. After that, the two electrodes were ready to assemble the DSSC.

2.5. Morphology and Particle Size Analyses

The sample morphology was examined using scanning electron microscopy (SEM; Philips, XI 30, Encino, CA, USA). An energy-dispersive X-ray spectroscopy (EDS; 6390 LA, USA) system was used with ZAF corrections to quantify the elemental composition of PNC. In this analysis, the X-ray signal was detected using a solid-state Li-drifted Si detector (20 kV acceleration voltage, 0–20 keV energy range, and 56,356 cps counting rate).
Dynamic light scattering (DLS) was performed on specimens subjected to ultrasonic treatment using a Sonfier 450-SOP instrument (No. 27 Probe Sonicator) with an oscillating ultrasonic frequency of 40 kHz, ultrasonic power of 40 kW, 5 min to 20 min test period and equipped with NanoQ software Boston Sales Branch, Cambridge, MA 02139, USA, to study the particle size of the ZnO nanoparticles, PNC, and Chl. The PNC and Chl were diluted in water and acetone, respectively, for measurement. The effect of an ultrasound treatment method on the Chl particle size was investigated at various time periods of 5, 10, 15, and 20 min with a laser power of 100% at room temperature.

2.6. Photovoltaic Measurements

The photovoltaic performances of the cells with different dyes were evaluated to compare their efficiency in the experimental setup, and the intensity of natural sunlight was measured under constant illumination. The standard terrestrial solar intensity is approximately 1.366 kW/m2, according to Amin et al. [10], and varies only slightly over practical time scales.
First, the assembled DSSCs were connected to a multi-meter and resistors using clips. Each DSSC was measured with five resistors with different resistance (R) values to obtain different voltage (V) readings, which were converted to a current using Ohm’s law (I = V/R). These values were used to calculate the maximum power Pmax = ImaxVmax.
Under illumination, the IV characteristics are monitored through changing the external load from zero to infinity. By using data acquisition, the photovoltaic parameters were obtained. All samples had the same nominal area of 1.0 cm2. The (Jsc), Voc, Jmax, Vmax, and Pmax. relations are shown in Figure 2. FF is obtained at Voc and Jsc, FF = JmaxVmax/JSCVOC, where Jmax and Vmax. Typically, (η) = (JSCVOCFF)/Pin.

2.7. Working Principles of DSSC

The enhancement of green-light harvesting is a goal in the field of DSSCs. This is usually attempted by molecular engineering of the sensitiser, dye modifying, photoelectrode metal oxide thin layer, adding ZnO nanoparticles for light-scattering effects, or adding photonic crystals to the photo-anode. In this study, it is proposed that the PNC electrolyte can enhance the light-harvesting capability of the device, as shown in the schematic diagrams in Figure 3.
As graphite and platinum electrodes are considered inert when they are utilised, they do not participate in any chemical reactions whatsoever, but graphite is preferred over platinum as an anode in the electrolysis of molten lead bromide because graphite electrode is an inert electrode, and it does not react with bromine, whereas platinum electron reacts with bromine. Additionally, graphite is easy to machine, resistant to thermal shock, lower cost, and lower coefficient of thermal expansion (3 times lower than copper), which guarantees electrodes with high stability during electro discharge machining [77,78].
Figure 3a showed DSSC consists of two conductive electrodes, of which one has to be transparent. Between the electrodes, a dye with 1.0 M weight and 1.0 M weight to make bonding and flexibility is adsorbed on a 0.5 M weight nZnO semiconductor, according to Chen et al. [79]. Between the monomolecular dye layer (Chlorophyll) and the graphite-coated counter electrode, an electrolyte (PNC) is introduced.
Figure 3b illustrates the working principle as follows: the photon absorbed by the dye excites electrons which injected from excited state into the semiconductor conduction band, transported through the nZnO layer to an external load and the counter electrode, Chiappone et al. [80]. Next, the electron recombines with acceptors in the electrolyte, which completes the circuit by reducing the dye cation to its neutral ground state. A stable enhancement in light harvesting is expected to be achieved by the introduction of a natural electrolyte (PNC) as a three-dimensional network. The electrolyte dispersed in the photo-polymerised matrix operated as a multi-planar light-scattering grating. Therefore, the photons that pass unabsorbed through the photo-anode are reflected in the dye molecules adsorbed on the semiconductor to provide another chance of being absorbed. This enhances the excitation of the sensitiser and subsequent charge.

2.8. Cyclic Voltammetry Measurements

The highest occupied molecular thin films orbital energy (HOMO) determined with reasonable accuracy using ultraviolet photoelectron spectroscopy (UPS). Additionally, from inverse photoelectron spectroscopy (IPES), the lowest unoccupied molecular orbital energy (LUMO) determined [81,82]. Shabir et al. [83] dealt with the dye-sensitised solar cells applications using both cyclic voltammetry and draft calculations to estimate the redox potential and dyes band gap energies.
The material transport gap (Et) is the difference between the HOMO and LUMO energy levels [84]. For design and fabrication of an organic solar cell, HOMO and LUMO, cyclic voltammetry (CV) is carried out using a three-electrode cell consisting of a platinum working electrode, platinum counter electrode, and Ag/AgCl reference electrode at 10–20 mV/s (Solrtron potentiostat 1286) according to Al-Ibrahim et al. technique, [85]. Lin et al. [86] and Hseih et al. [87] illustrated that using sandwich plates as internal reference or external reference and calculating the relation between HOMO and LUMO values using UV-VIS for both absorbance and emission spectra and they get the Eo-o transition energy from the intersection between them, get the HOMO value from oxidation potential and LUMO=HOMO-Eo-o. This is considered by the relationship between HOMO (Equation (1)) and the molecular organic semiconductors (LOMO) (Equation (2)) according to D’Andrade et al. [88]. Additionally, Bredas et al. [89] used Ferrocene to calculate the energy of the HOMO and LOMO levels as follows.
E (HOMO) = −e [Eoxonset + 4.4],
E (LUMO) = −e [Ered onset + 4.4]

3. Results and Discussion

3.1. DLS Particle Size

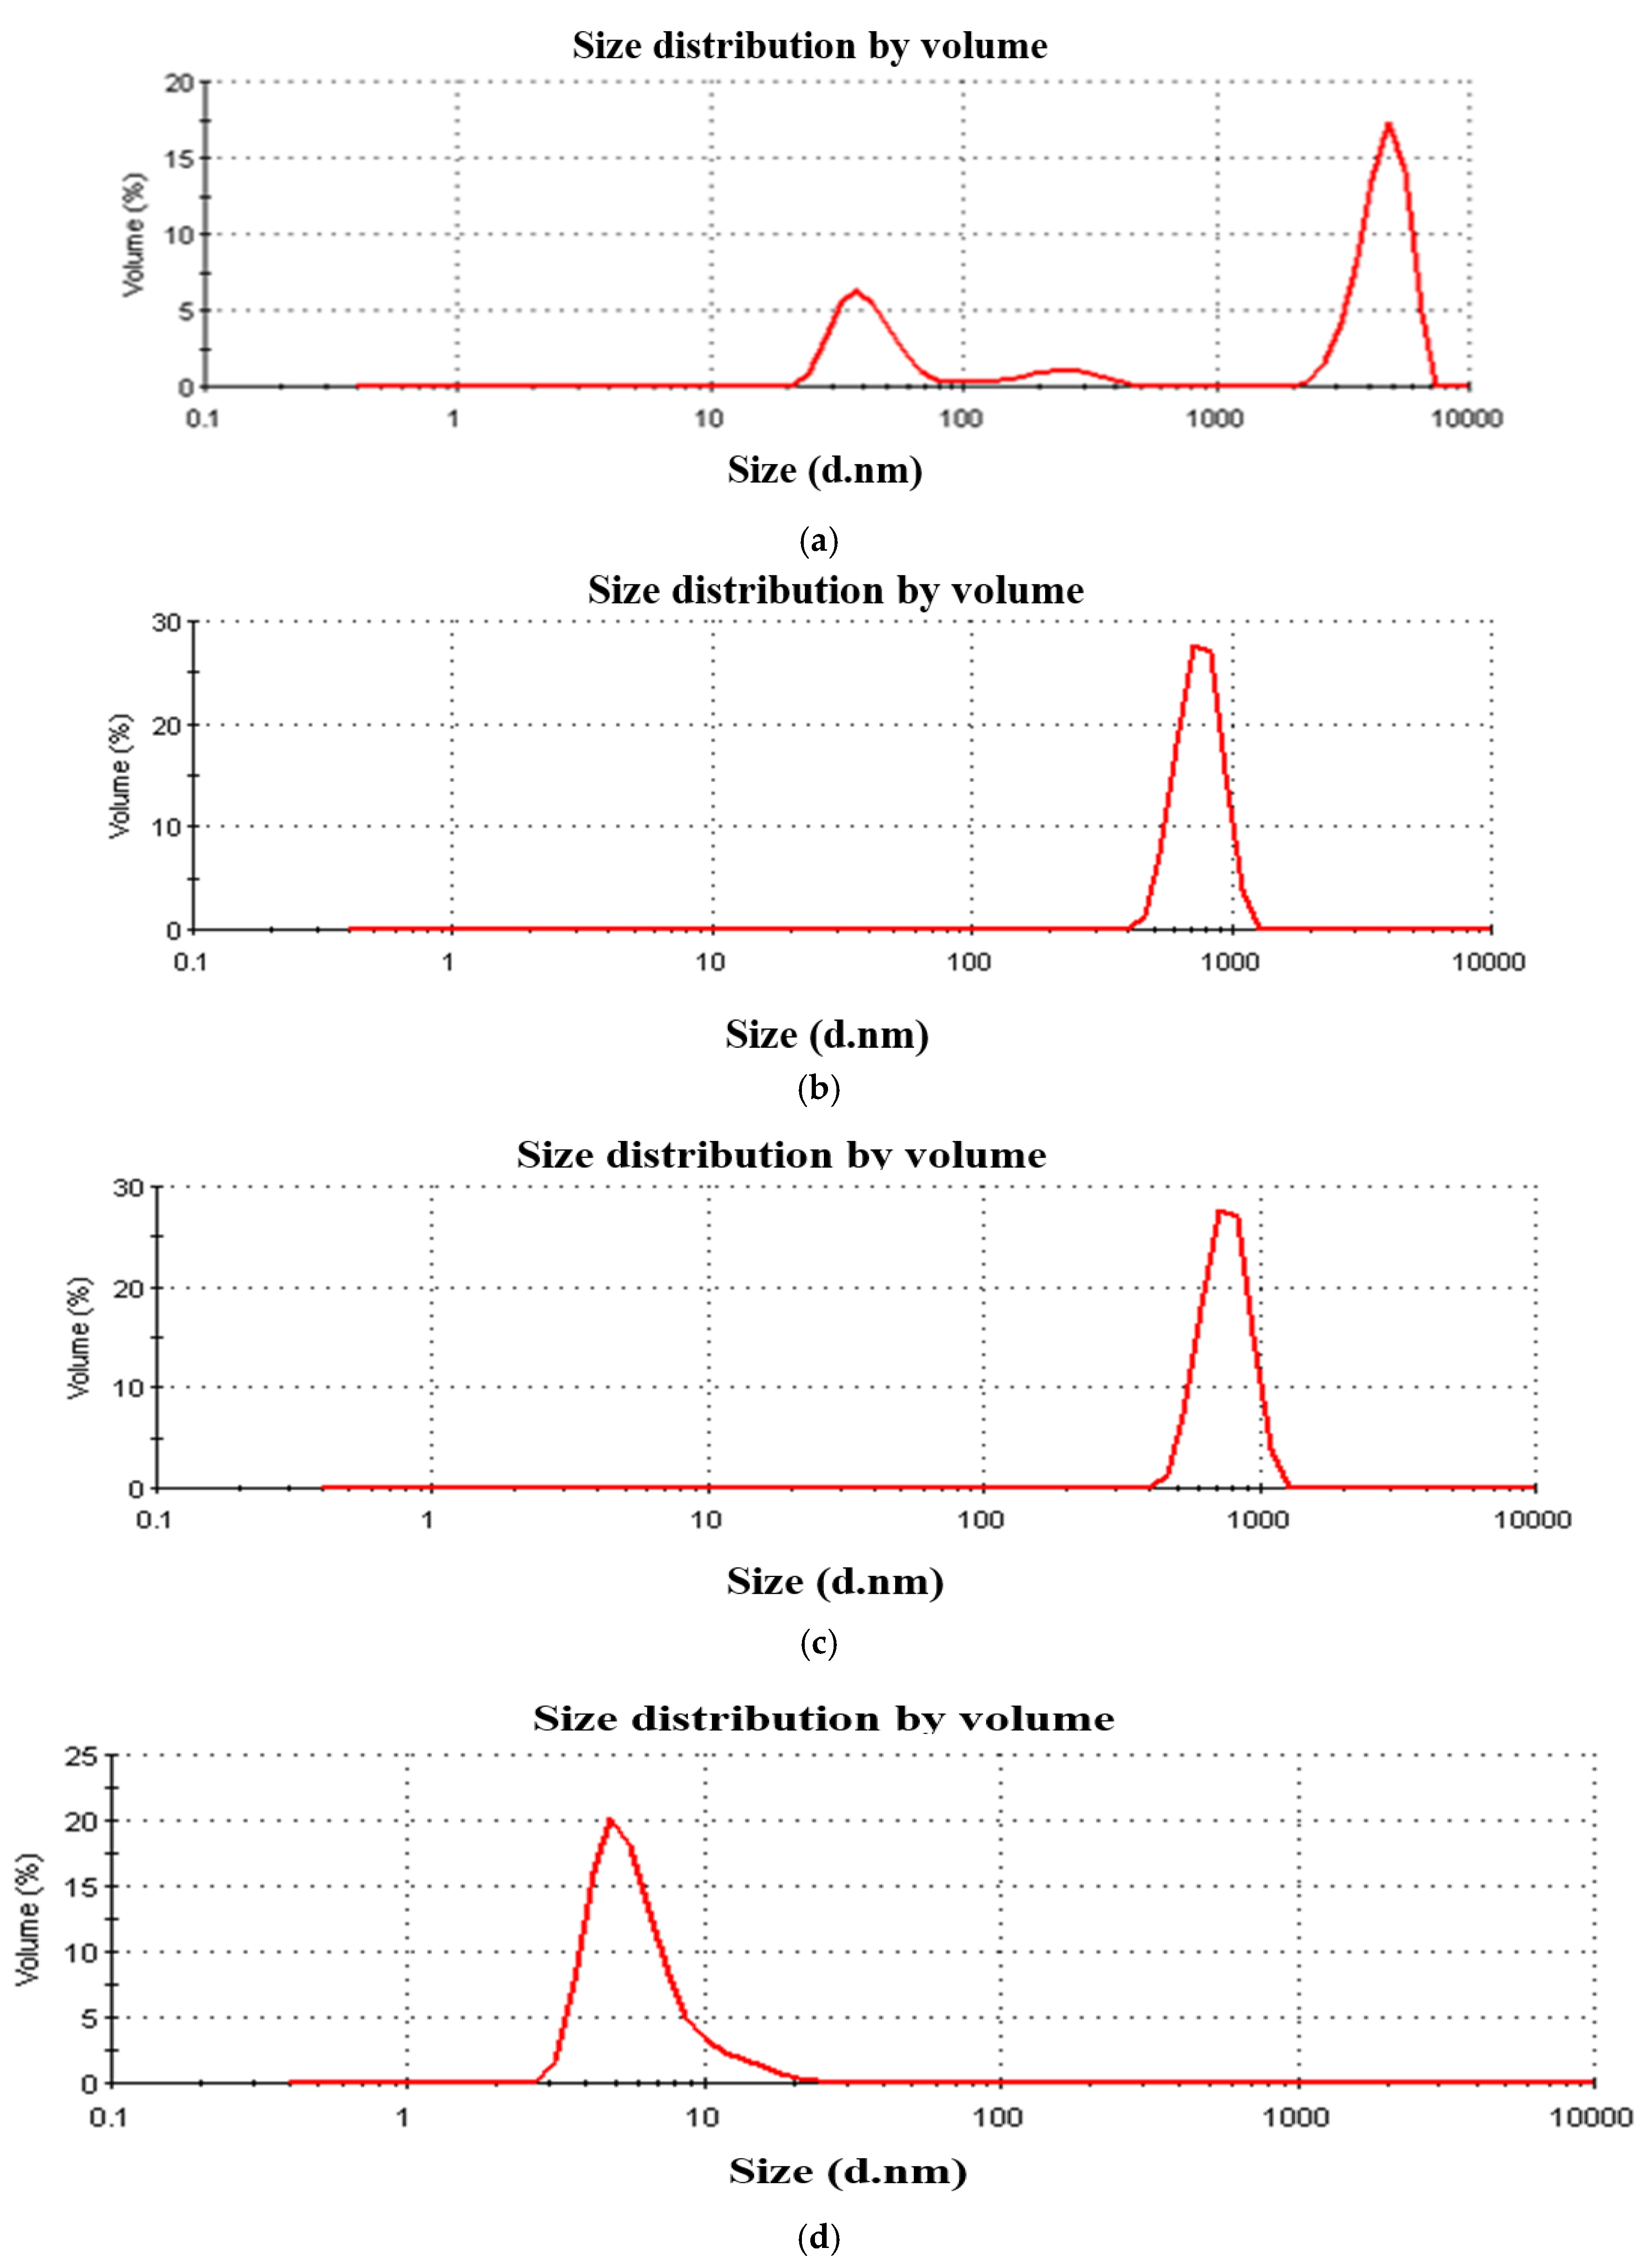
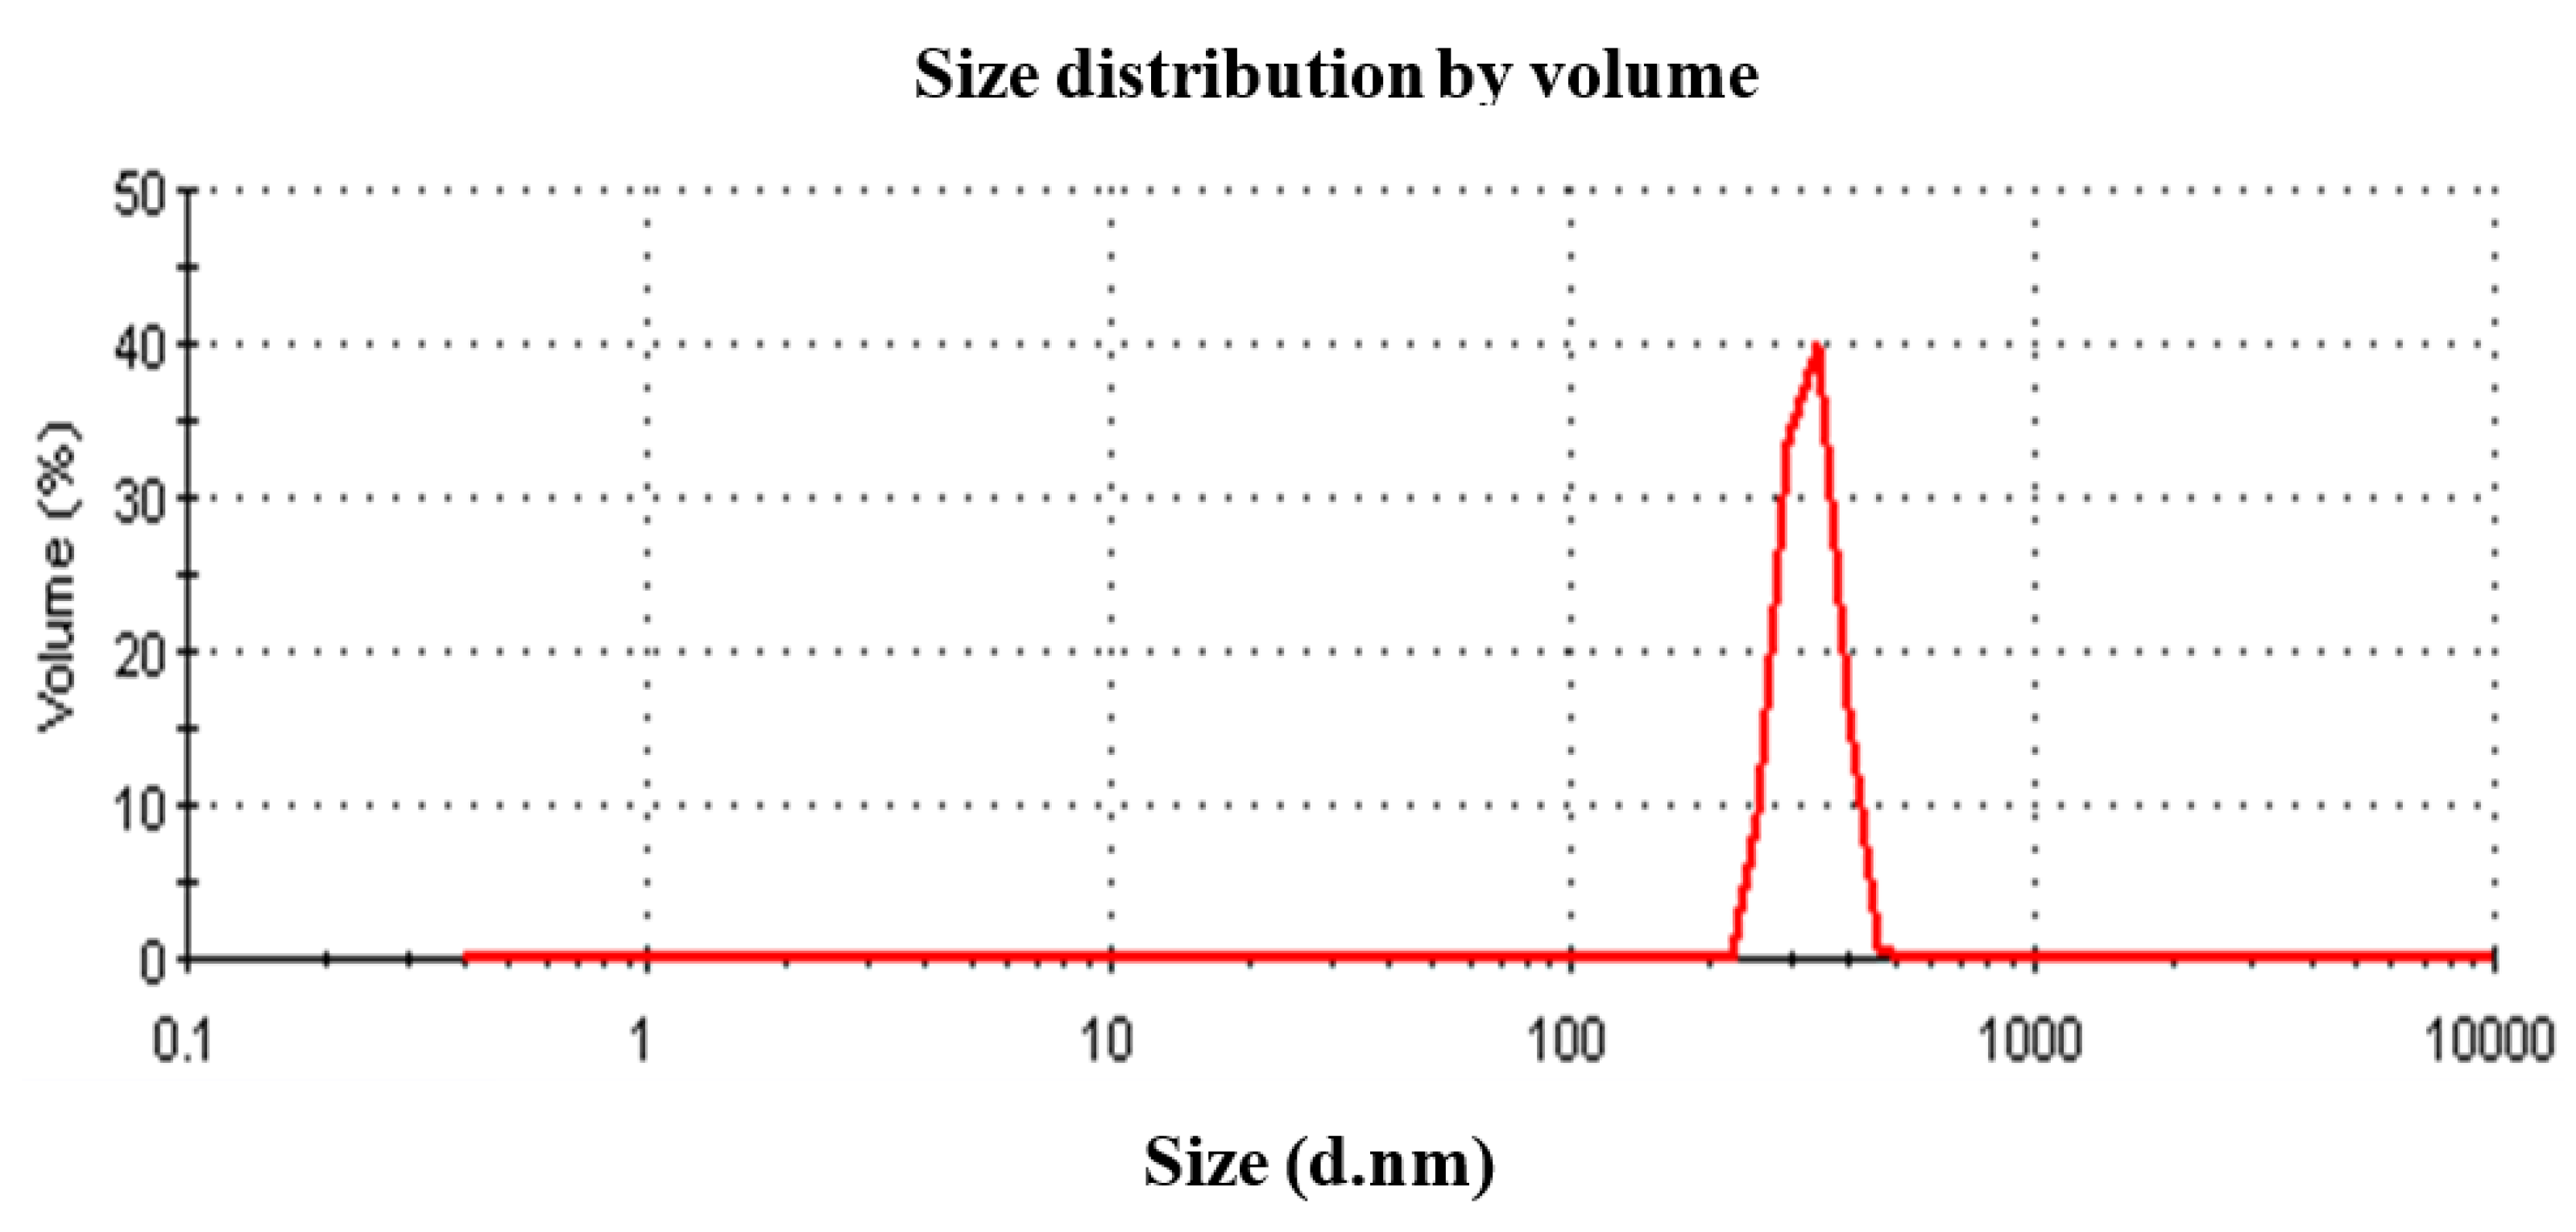
The particle size of the dilute Chl suspensions was analysed to ascertain the effectiveness of the ultrasonic pretreatment for reducing the particle size. Figure 4 shows the particle size of Chl diluted in acetone as calculated by the method of cumulants. Increasing the exposure time to ultrasonic waves reduced the size of the Chl particles and narrowed the distribution. The Chl particle size decreased with increasing ultrasound treatment time in agreement with Cao et al. [90] and Yang et al. [91]. After 0, 5, 10, and 15 min of exposure time, the average particle size was approximately 4.5 µm, 760 nm, 500 nm, and 10 nm, respectively. Beyond 20 min, the particle size was too small to be measured by DLS in agreement with Sompech et al. [92] and Aydar et al. [93]. Figure 5 shows the particle-size distribution of PNC diluted with water after 20 min of ultrasound waves treatment. It is shown that particles’ width, %volume, and size were 420 nm, 100%, and 327.9 for peak (1) with 0.00 values for peak (2) and peak (3) in agreement with the previous explanation shown in the analysis of PNC particle size.
Figure 6 shows the particle-size distribution of ZnO diluted with water after 5 min of ultrasound waves treatment. It turns out that the homogeneity of the size of the particles up to less than 10 nm is in agreement with Zhang et al. [94] and Barabaszová et al. [95].

3.2. Chemical Bonding

Figure 7 shows FTIR spectra ZnO nanoparticles, PNC, chlorophyll/. ZnO nanoparticles, and chlorophyll/ZnO nanoparticles/PNC. ZnO nanoparticles (Figure 7a) show characteristic absorption bands around 490, 613, and 673 cm−1. These three peaks are related to the bulk transverse optical and longitudinal optical phonon frequencies, Anzlovar et al. [96]. The absorption bands around 3777, 3707, and 3458 cm−1 are related to the OH groups on the nZnO surface. Figure 7b–d show the FTIR spectra of PNC, dye extracted from aloe vera/nZnO, and Chl/nZnO/PNC, respectively. The CH3 vibration was observed at 2930–2919 cm−1. Further, C–H2 and C–N at 2855–2360 cm−1 and 2852 cm−1 for PNC, 2890.09 and 2188.91 cm−1 for nZnO/Chl, and 2866 cm−1 for nZnO. Moreover, C=O stretching ester vibrations at 1723 cm−1 for PNC, 1988, 1830, and 1770 cm−1 for Chl/nZnO/PNC and 1942 cm−1 for nZnO. C=C vibrations at 1638 cm−1 for nZnO/Chl and 1769 cm−1 for Chl/nZnO/PNC in agreement with Rammah et al. [97] and Alomairy et al. [98].

3.3. Microstructure

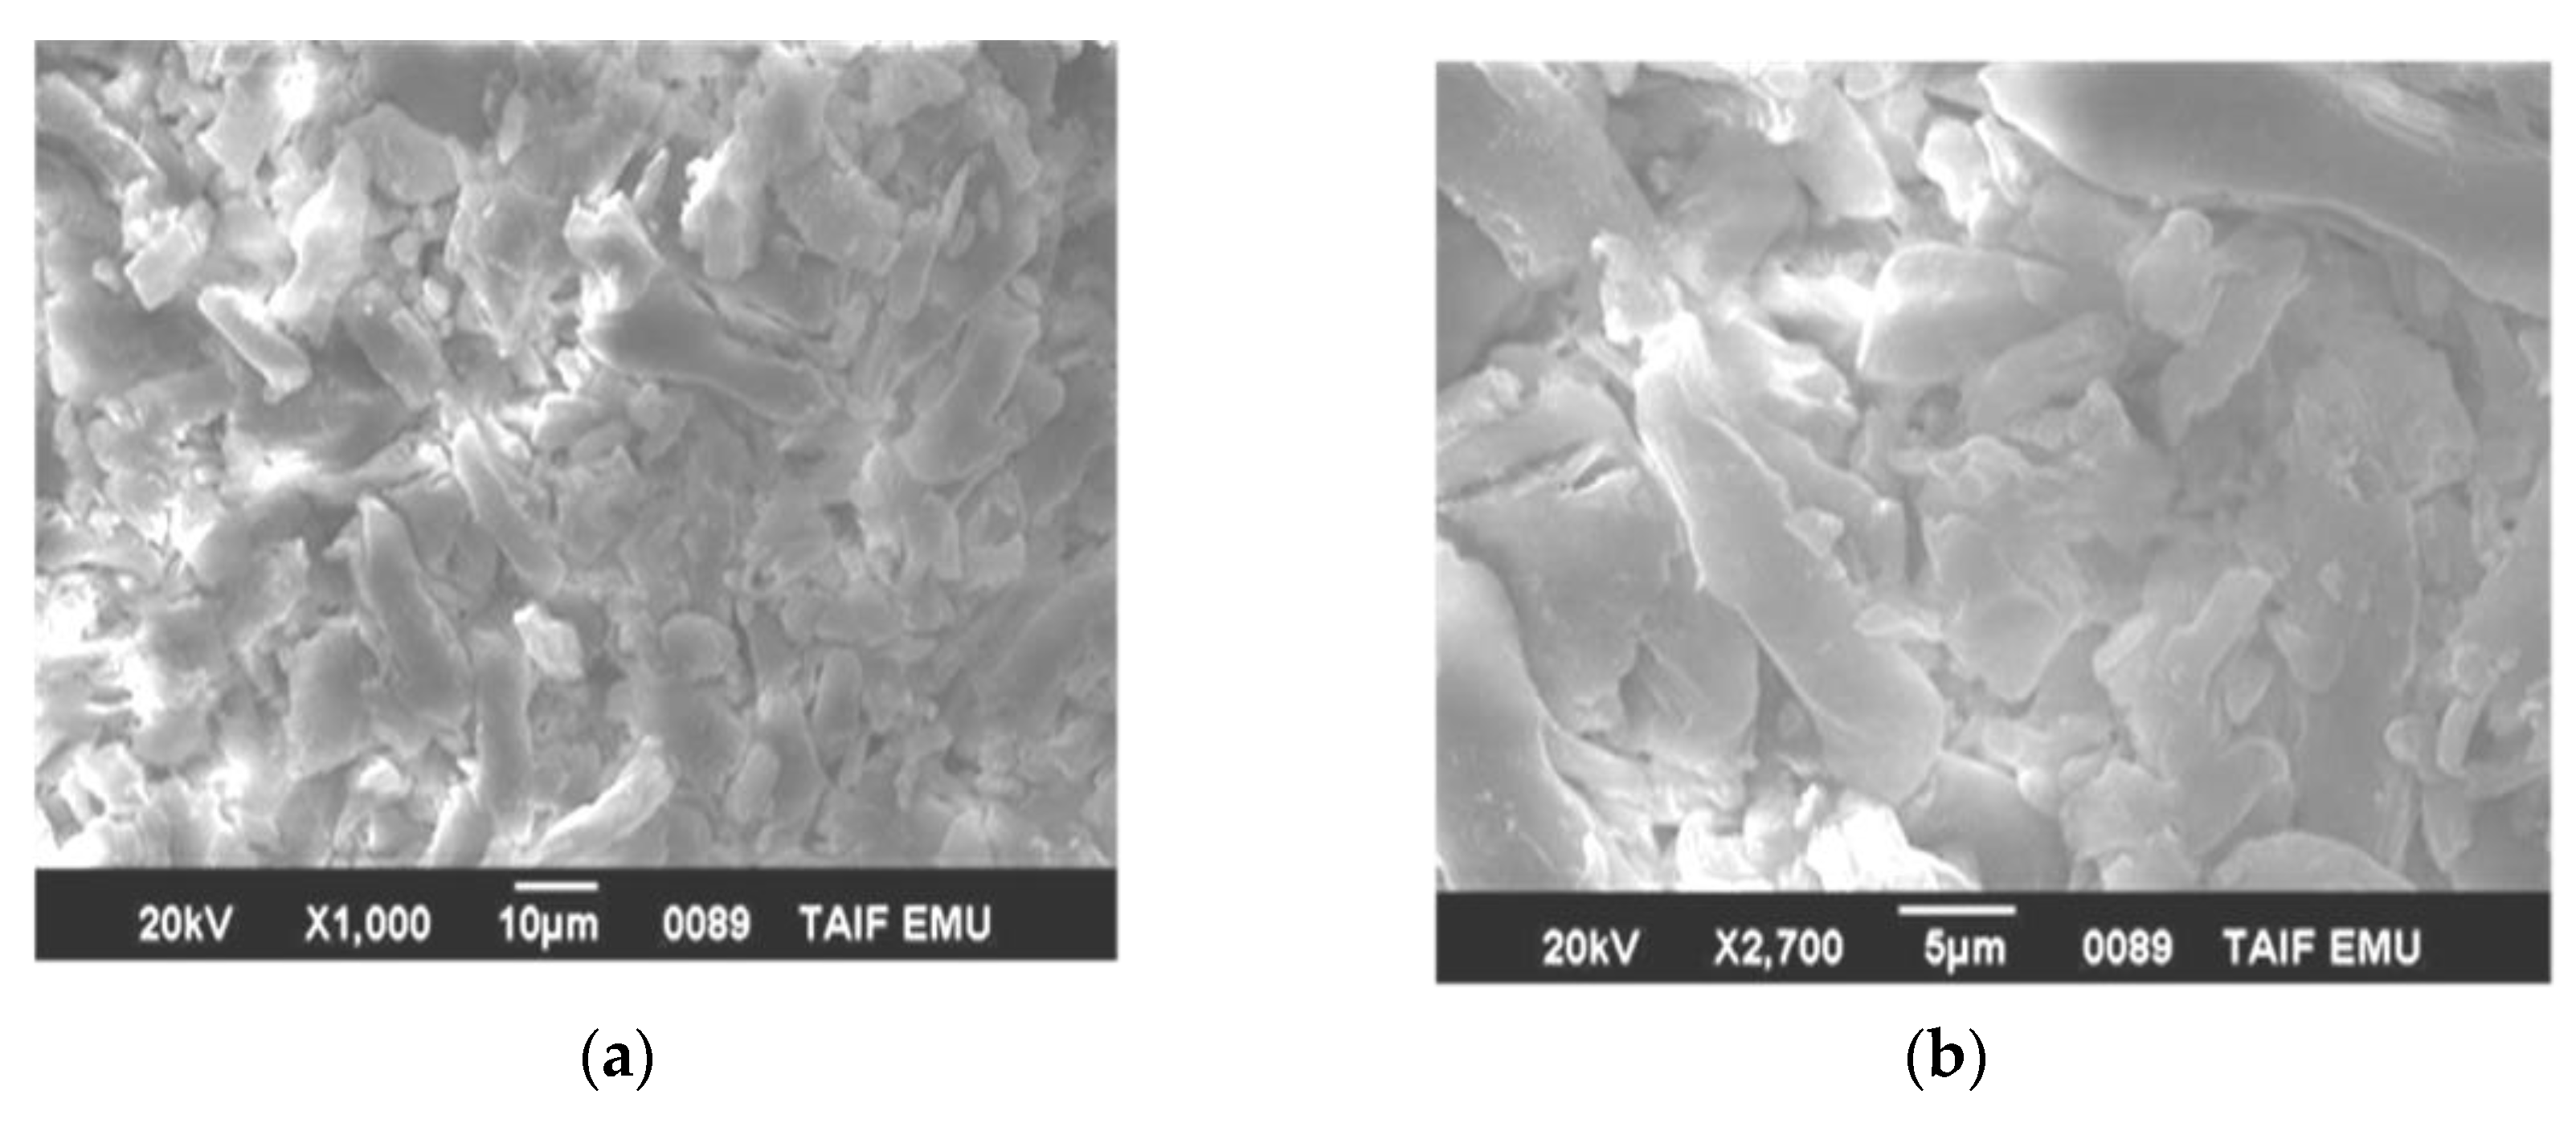
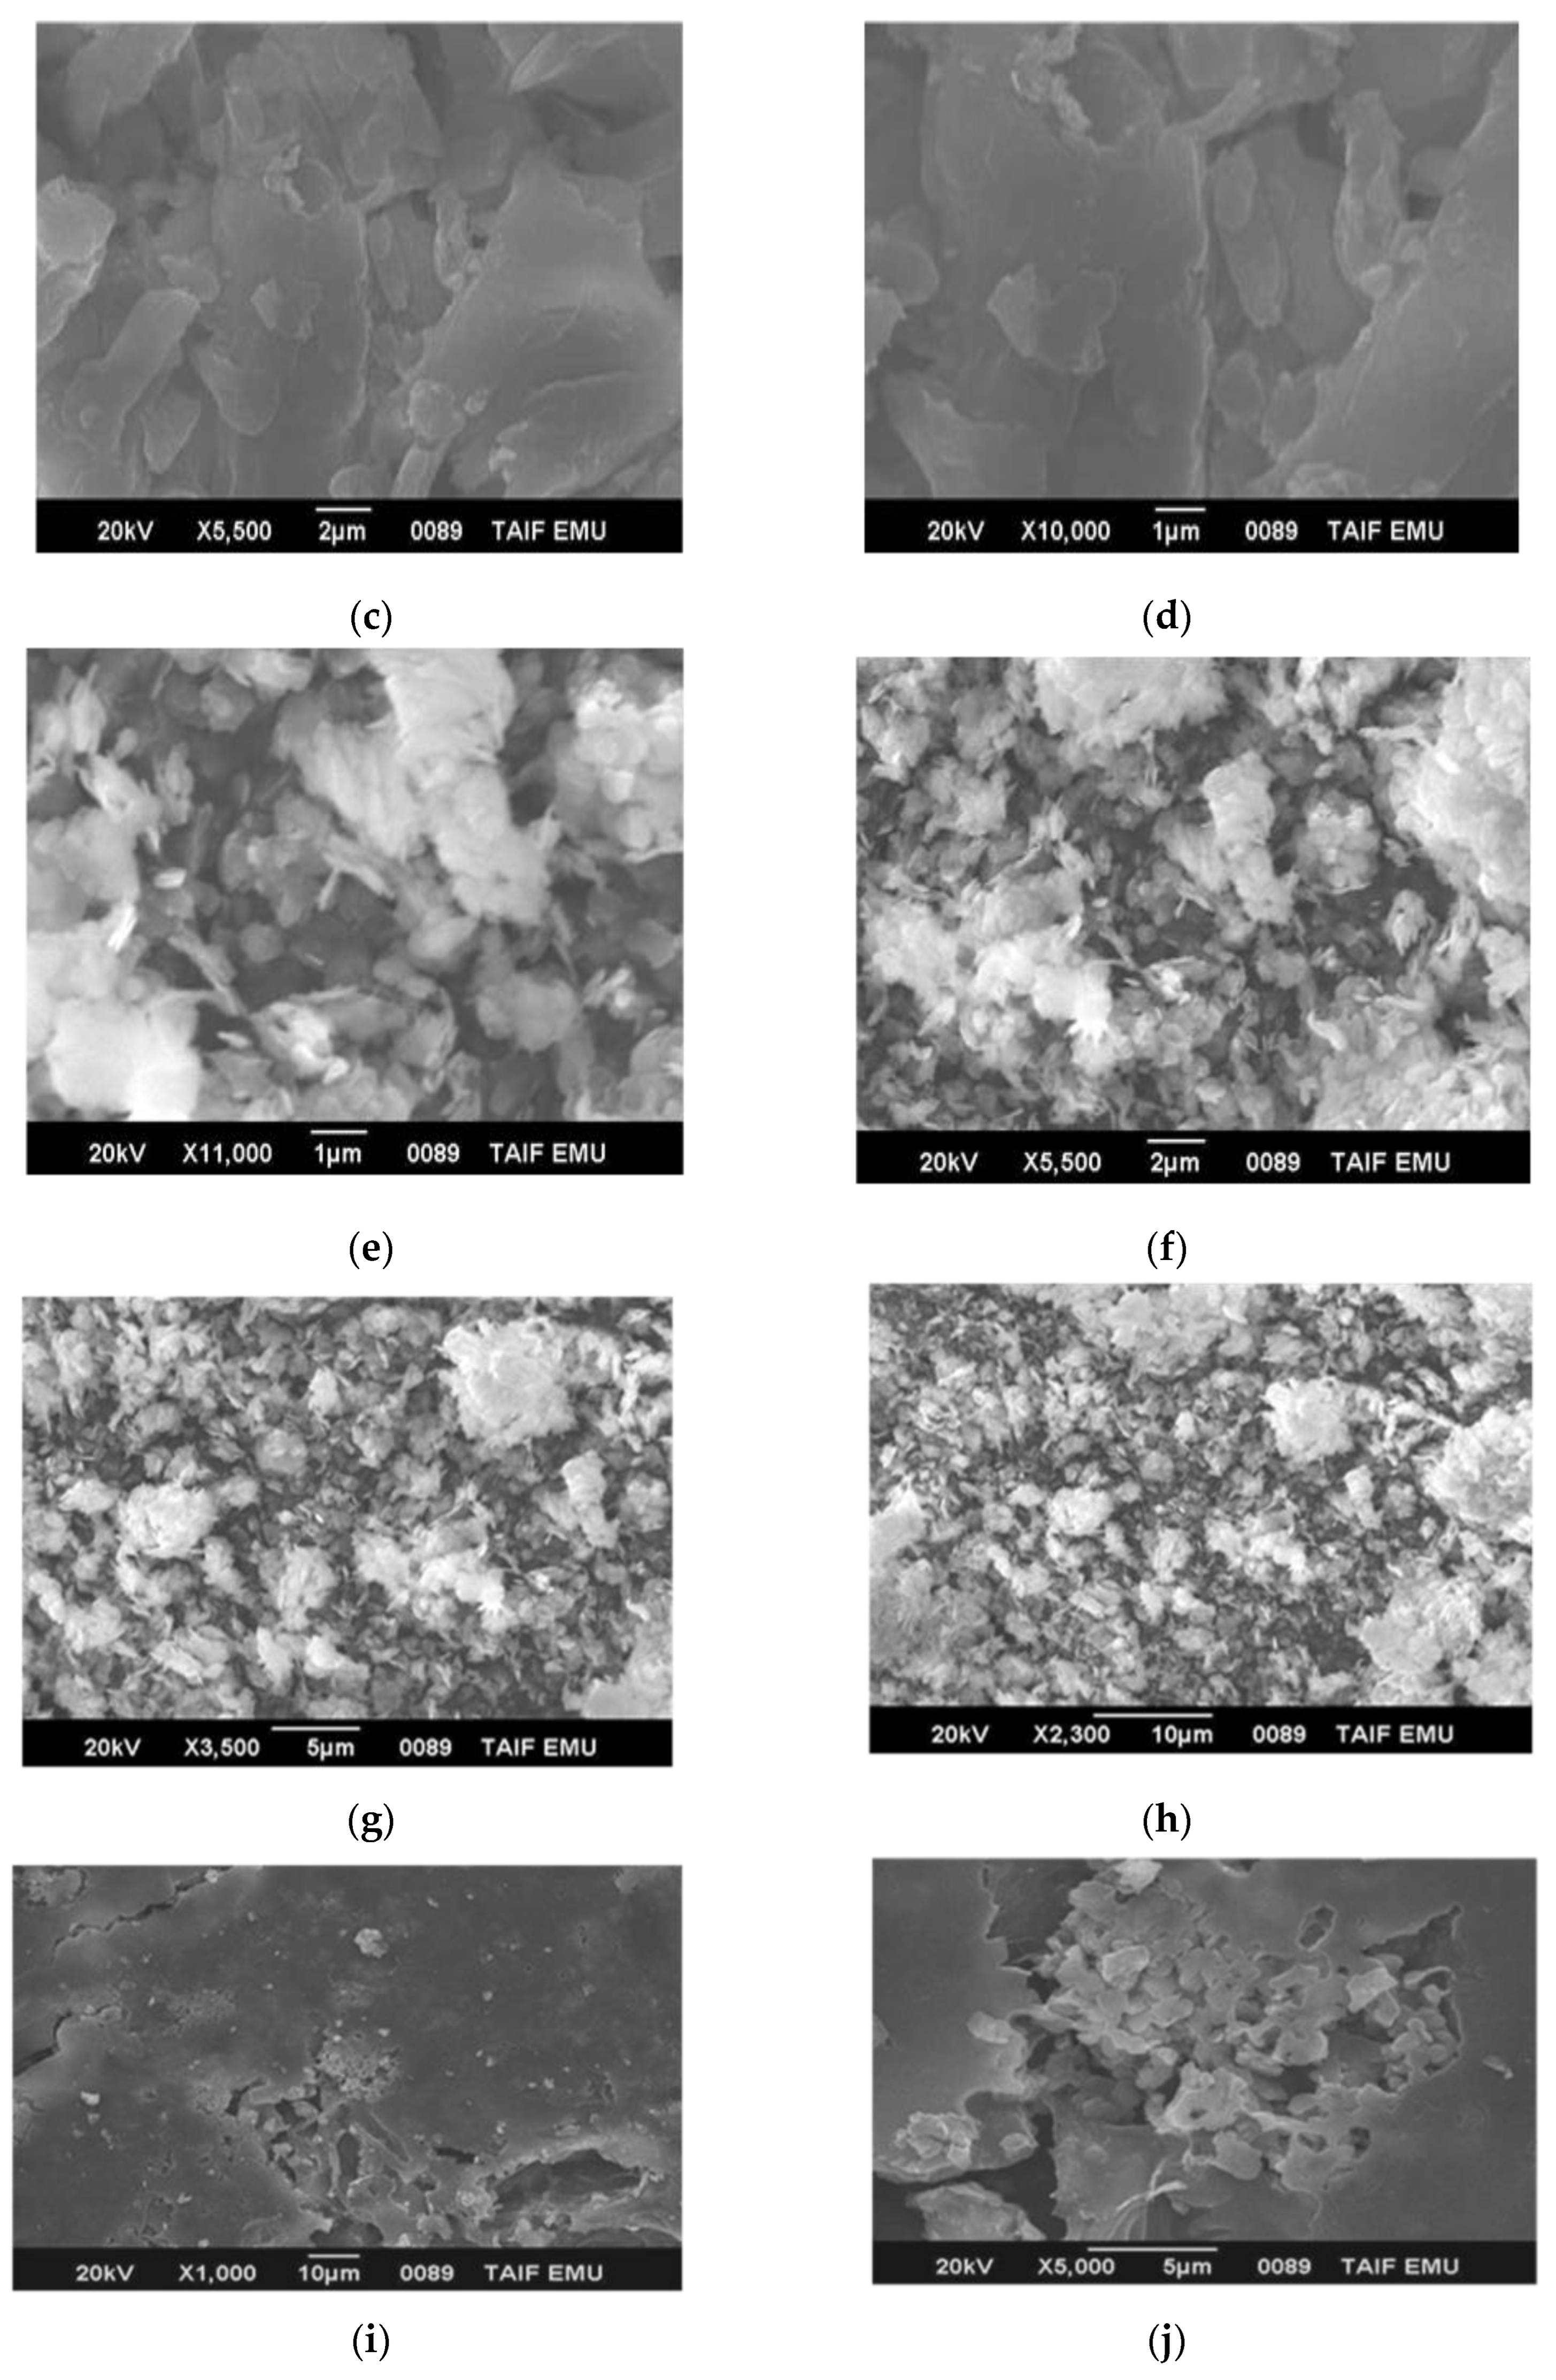
Figure 8 shows the SEM micrographs of nanomaterials with different magnifications. The macroscopic view showed an irregular surface of the banana NCF, but the smooth surfaces of the fibres were observed at a magnification of ×1000. However, with increasing magnification, the particle size and surface morphology of the PNC significantly changed. The external surface of the PNC fibres suggested that the material consisted of irregular fibres that were agglomerated and folded, with quite a low aspect ratio (Figure 8a–d). Agglomeration due to strong hydrogen bonding and van der Waals forces between PNC fibres. The catalyst surface morphology is an important parameter that affects the DSSC photocatalytic efficiency. The nZnO particles formed here were uniform and were mainly cubic, with some spherical particles (Figure 8e–h). The surface morphology of electrolytic paste with and without nZnO was smooth and homogeneous (Figure 8i,j), in agreement with Sarno and Cirillo [99] and Ogawa and Putaux [100]. Javed et al. [101] obtained ZnO nanoprisms in an aqueous solution, while methanol in an alkaline solution yielded ZnO nanorice morphology.

3.4. Elemental Composition

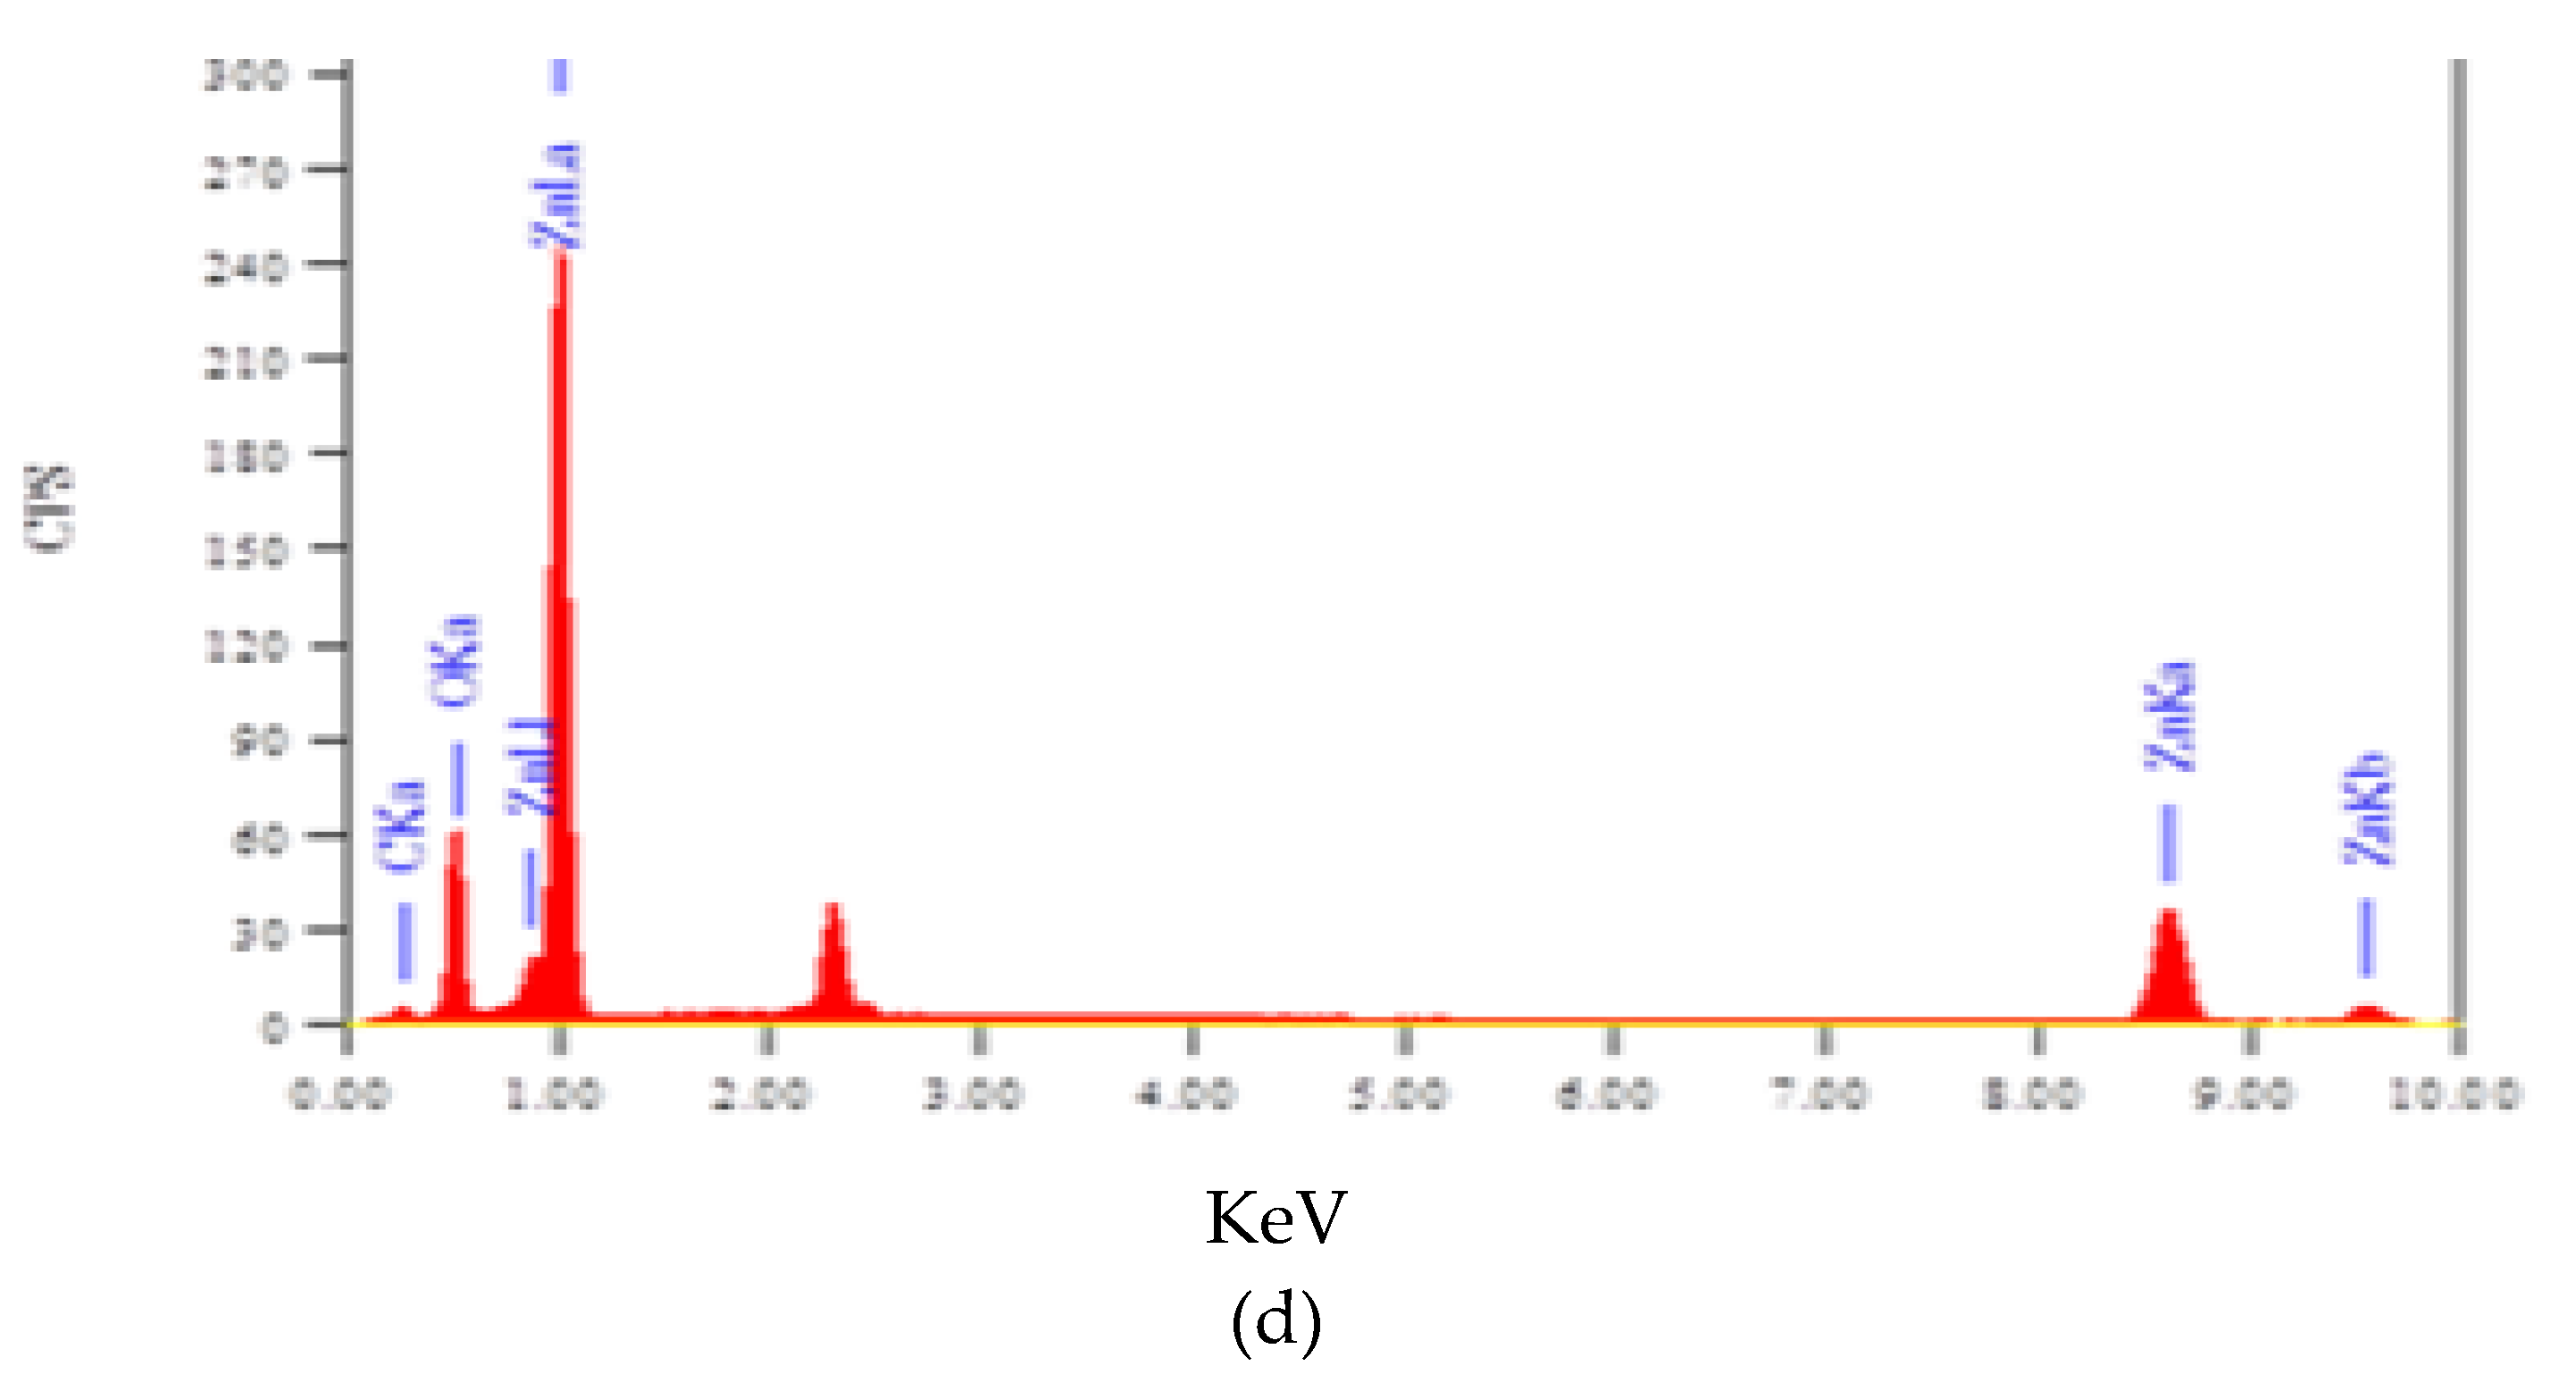
The EDS spectrum of diluted PNC diluted in is shown in Figure 9a. As determined by ZAF-corrected elemental analysis, the main elements in PNC were C (~80 at%; ~75 wt.%) and O (~20 at%; ~25 wt.%), which is consistent with the composition of lignocellulose; these values are in accordance with those of previous studies by Kohn et al. [23] and Hosseinnezhad et al. [30] in Figure 9b. The main elemental components of nZnO were C (~17 at%; ~7 wt.%), O (~53 at%; ~29 wt.%), and Zn (~30 at%; ~65 wt.%). The Zn and O originated from the nZnO. The observed elemental composition was in accordance with Ashtaputre et al. [73], Hosseinnezhad et al. [30], and Kohn et al. [23]. The EDS spectrum of the electrolytic paste for the DSSC (containing PNC, Chl, and nZnO) is shown in Figure 9c. The Mg (0.48 wt.%) and S (0.88 wt.%) elements were attributed to the Chl compound, while the other elements were related to PNC and nZnO (~41 wt.% C, ~45 wt.% O, and ~13% Zn). The difference between the compositions before and after mixing indicated the reaction between them and more stable electricity for these compounds. The EDS spectrum of the electrolyte paste without nZnO is shown in Figure 9d. The main elements were C (~54 at%), O (~45 at%), and Mg (~0.5 at%), consistent with the lignocellulose and chlorophyll chemistry. In addition, the paste without nZnO contained C (~47 wt.%), O (~52 wt.%), and Mg (~0.8 wt.%), where these components and values were in accordance with those of previous studies by Hosseinnezhad et al. [14] and Kohn et al. [7]. From these analyses, the Chl adsorbed on PNC decreased Mg% after the addition of N ZnO.

3.5. Dye Purification, Conductivity, Concentration, and Structure

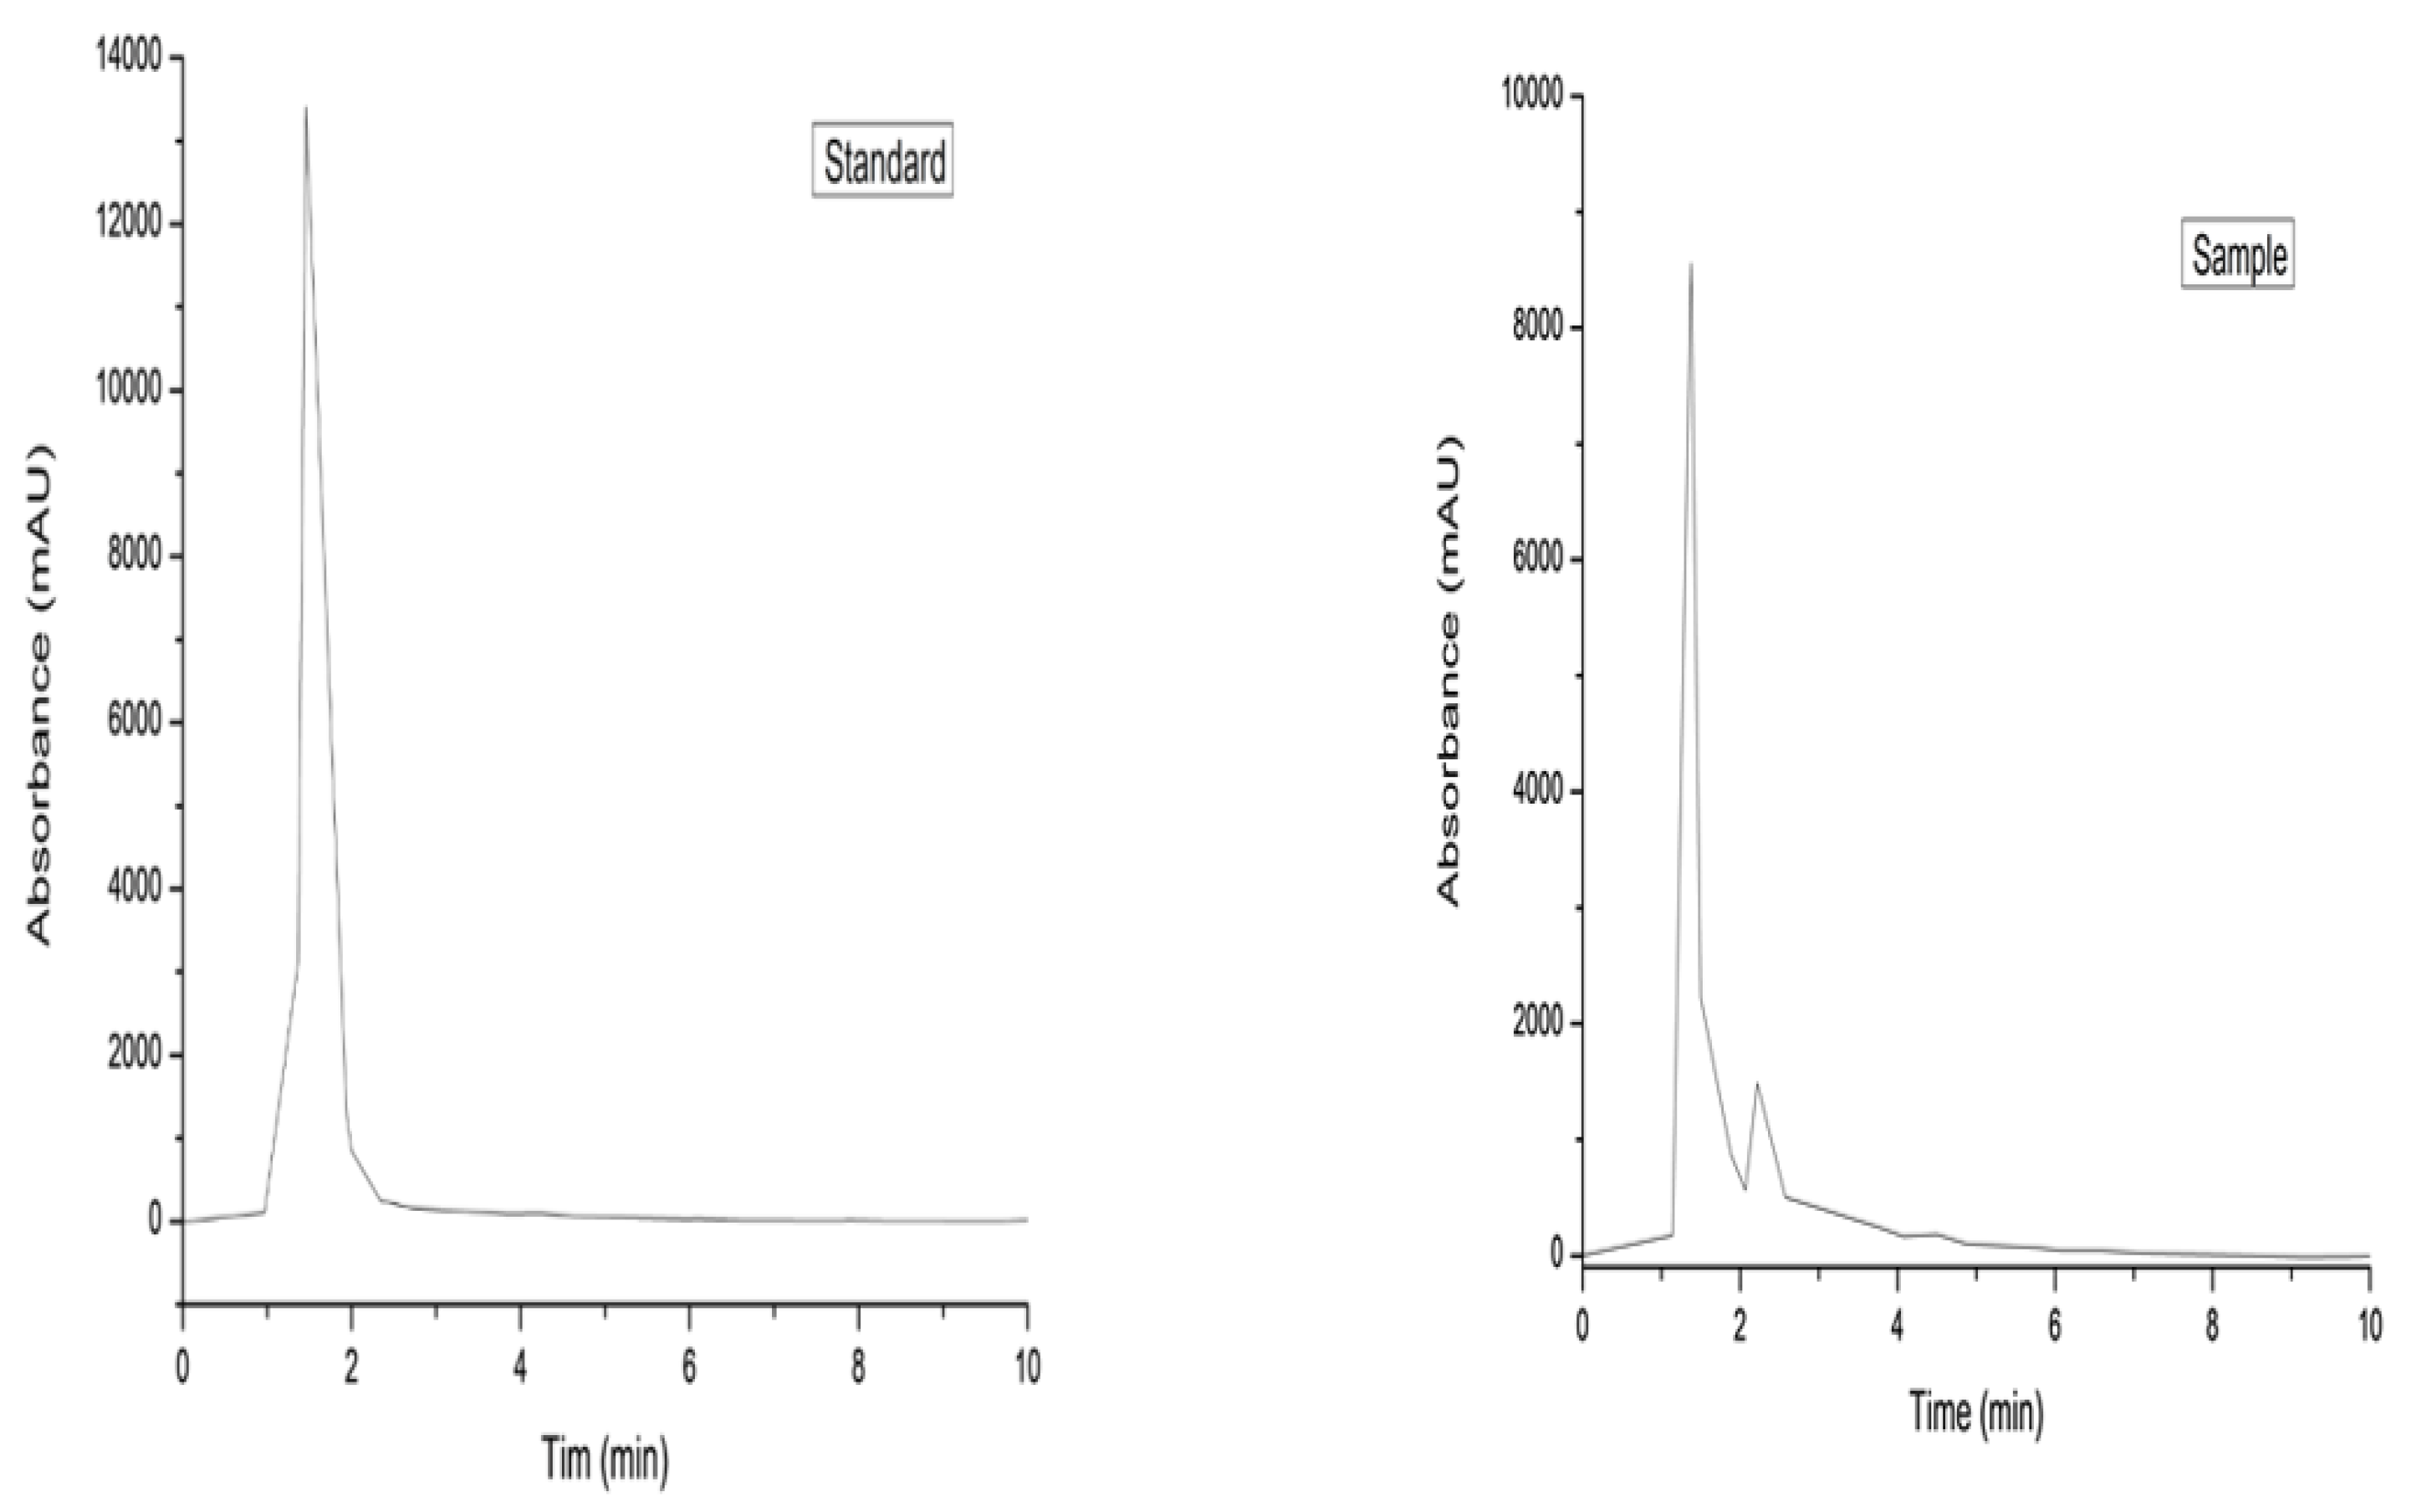
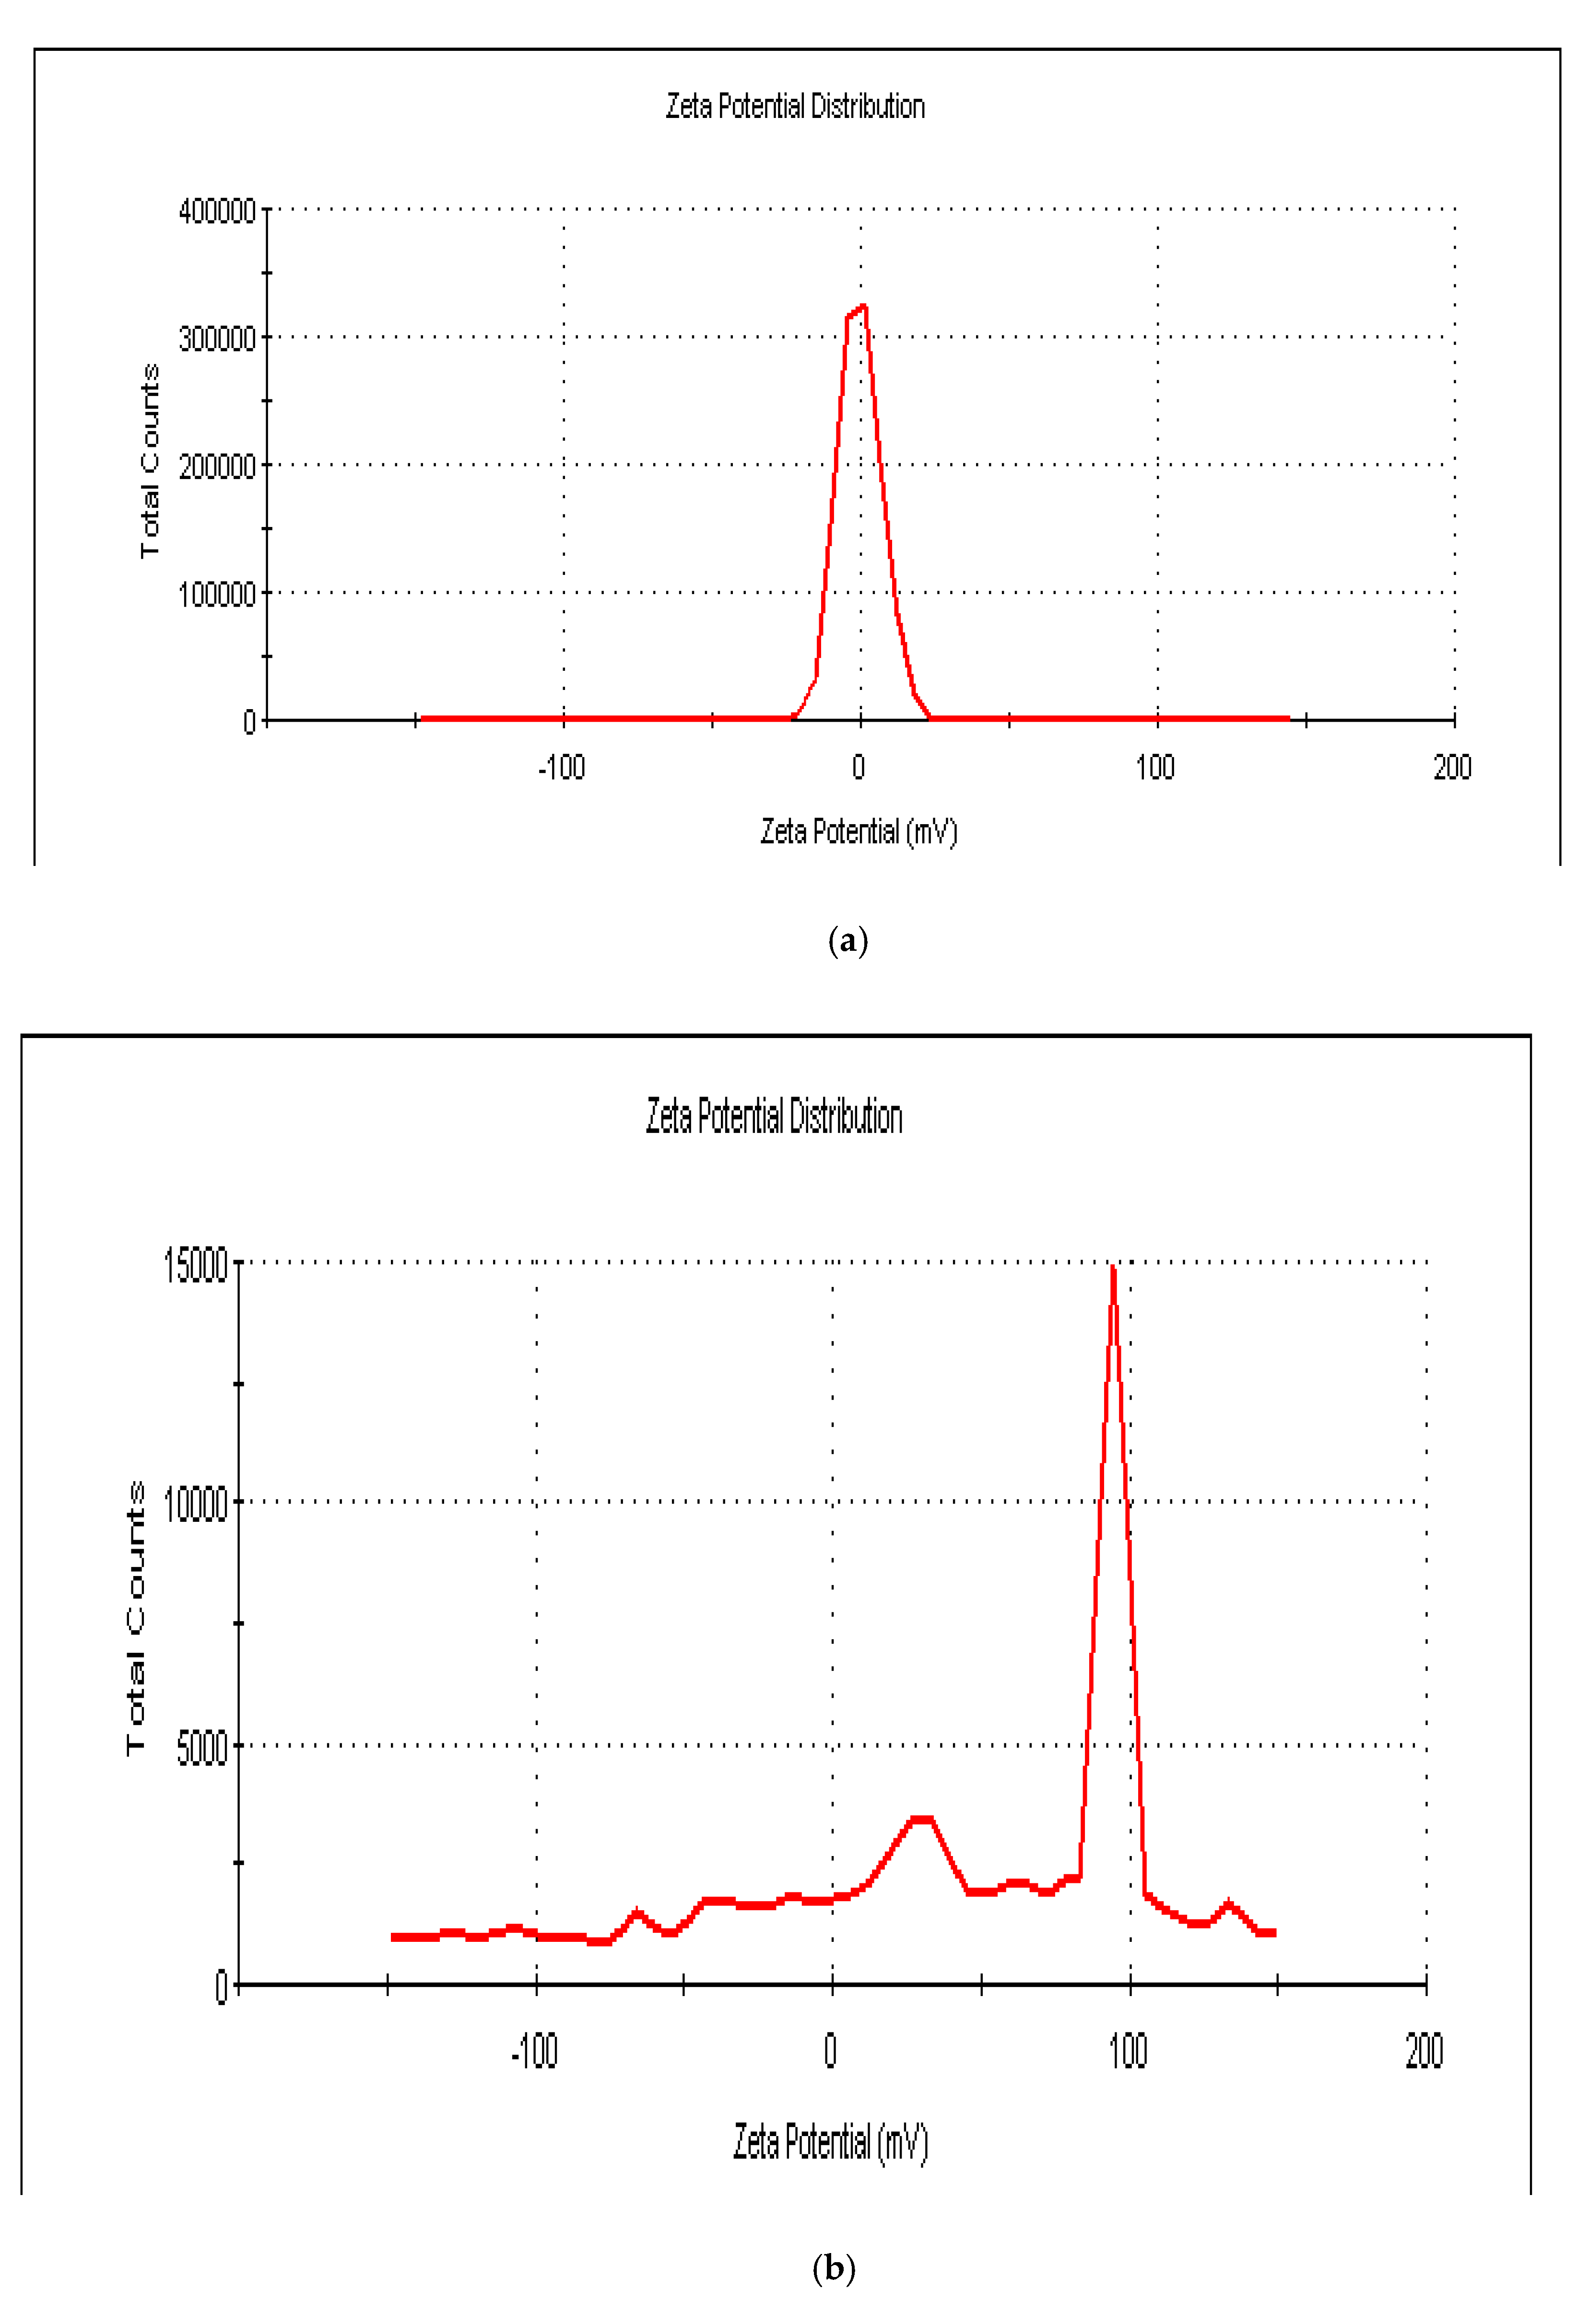
The resulting pigmented eluent purity was evaluated by HPLC, on which the chromatographic profile showed a single peak at 1.50 min retention time, as shown in Figure 10 in agreement with Velasco et al. [33]. Figure 11a,b illustrate the Zeta Potential Distribution of Nano Chlorophyll and chlorophyll, respectively. The figure showed that the used Nano chlorophyll has a conductivity value of 0.0231 mS/cm while the chlorophyll has a conductivity value of 1.77 × 10⁻⁴ mS/cm as the lower conductivity resulted in lower current values that caused lower sunlight conversion efficiency for the whole DSSC. Therefore, using Nano chlorophyll enhanced the produced cell characteristics in agreement with Chiappone et al. [80]. The extracted aloe-vera waste chlorophyll dissolved in acetone with a dye concentration of 5 gr/100 mL in agreement with Muryani et al. [102]. It is known that chlorophyll’s chemical structure is a chlorin pigment with a magnesium ion at its center. As the colour of the generated chlorophyll is green, its structure is chlorophyll A, in agreement with Woodward et al. [103] listed in Table 1.

3.6. Effect of PNC Content on the PV Properties

The PNC content effect on the DSSC performance was clearly observed from the PV characterisation experiments, as shown in Figure 12. With increasing PNCcontent from 0 to 32 wt.%, the PV parameters all showed an increase: Jsc from 0.93 to 19.2 mA/cm2; Voc from 0.61 to 0.96 V; FF from 0.55% to 0.77%; and η from 4.13% to 8.90%, as shown in Figure 12a,b [73].

3.7. DSSC PV Performance and Stability

Wu et al. [104] understanded the underlying mechanisms that limit the open-circuit voltage (VOC) and fill factor to be solar cells key performance parameters. The main parameters that affected Voc are the peak power Pmax, Jsc, and the fill factor FF. FF is affected by the following Parameters; front and rear metallic contact resistivities, bulk resistivity, n+ and p+ emitters resistivities, and metal-emitters interfaces resistivities. In your case, it is clear that the degradation is due to the bulk (active layer) resistivity [105].
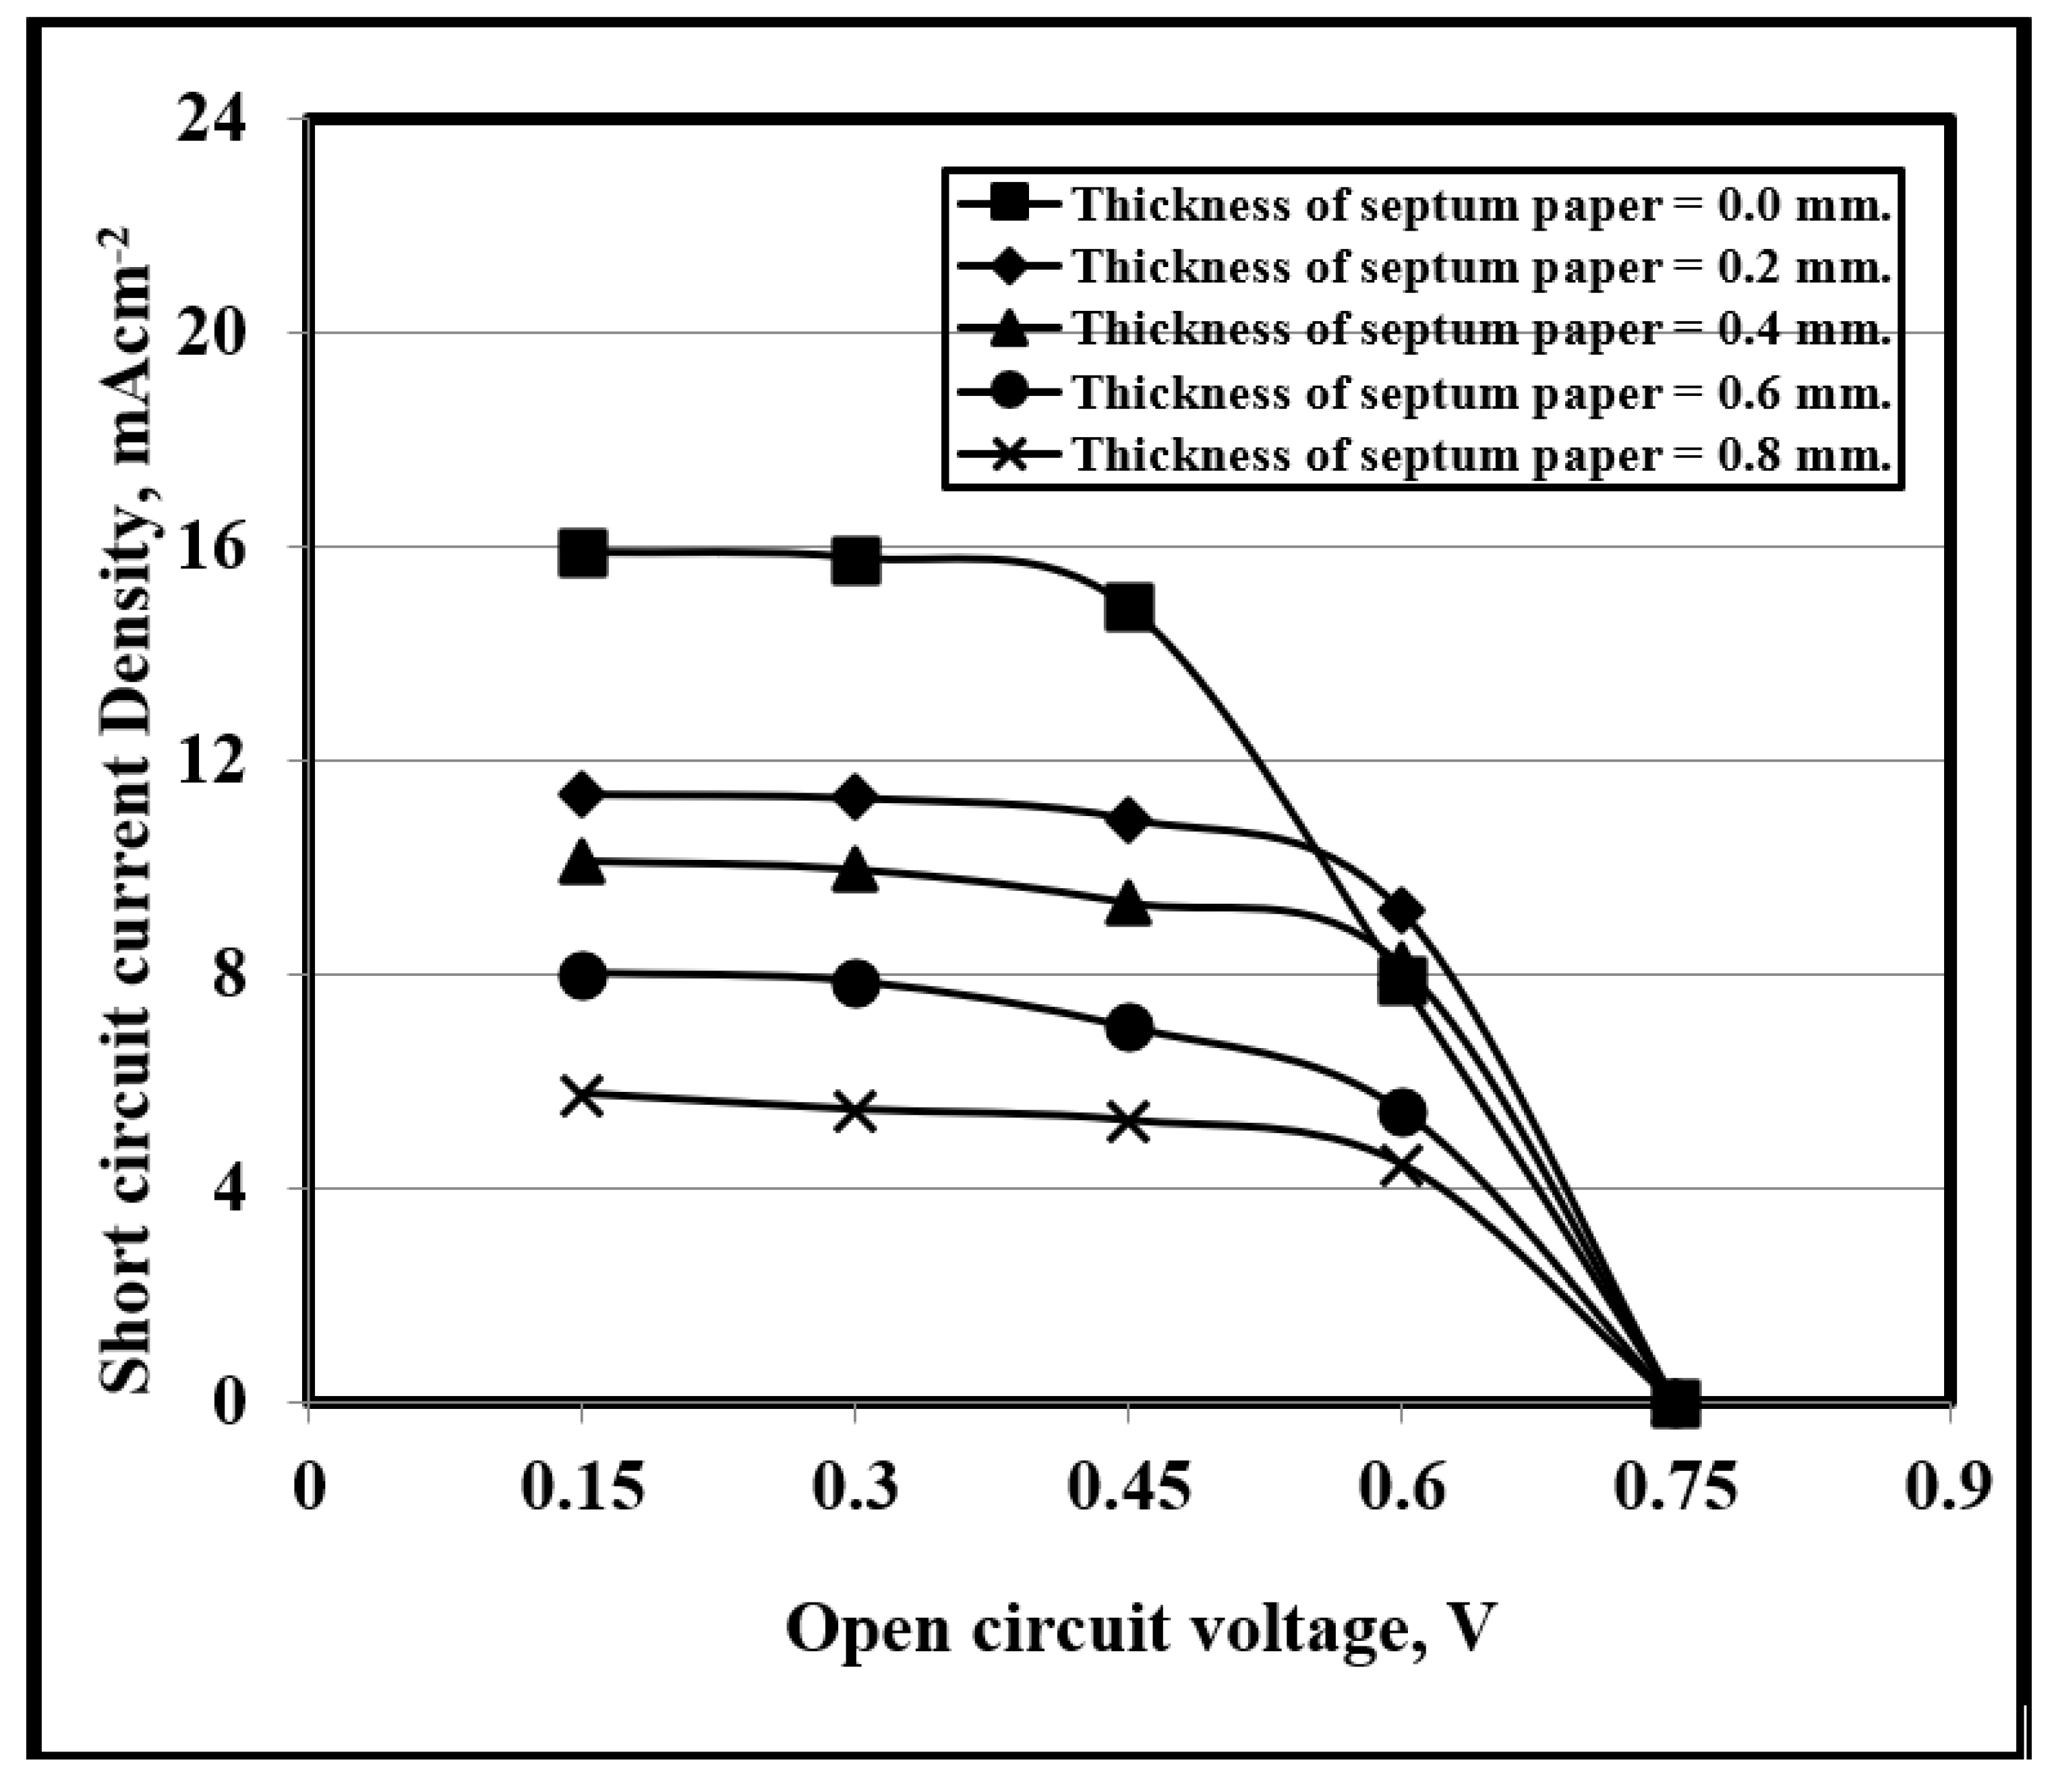
Figure 13 shows JscVoc curves of a DSSC with 32 wt.% PNC operating under low irradiation conditions. To reduce the illumination, filter paper with different thicknesses (2–8 mm) was used to cover the DSSC to simulate different sunlight intensities. The figure shows that Jsc (at Voc = 0) decreased from 16.62 mAcm−2 under full sunlight (no paper) to 11.393 mAcm−2 with 2 mm of filter paper thickness and then decreased approximately linearly with each additional sheet of filter paper to 6.998 mAcm−2 (with 8 mm of paper thickness). This confirms neither the I/I2 transport within the PNC network nor the transferred electron at the interface.
These results confirm that the proposed DSSC with 32% PNC is suitable for outdoor applications. The different sunlight intensity effect on cell efficiency is as follows according to Amadi et al. [106] and listed in Table 2 [107];
As; Power (P) = Current × Voltage
Surface Area of ITO (S.A) = 1 × 1 = 1.0 cm2 = 1 × 10⁻⁴ m2
Power Output (Pcell) = Power / Surface Area
Solar Power Constant (PAM 1.5) = (1000 to 1366) W/m2,
Efficiency (η) = (Pcell / PAM 1.5) ×100
Table 2 lists the photoelectric parameters of the DSSCs prepared with five different filter paper thicknesses. At 0.0, filter paper thickness has the best photoelectric conversion efficiency at 12.45%. When the DSSC is prepared by a filter paper thickness of 8 mm, the photoelectric conversion efficiency falls to 5.95% because with the filter paper thickness increment; the incident light cannot effectively penetrate the bottom most layer of the thin film, which restricts the transmission of the excited dye molecules to the photo electrode. This proved DSSC the long-term stability, its ability to perform well under all the experimental irradiation conditions, and its appropriateness for outdoor environment applications in agreement with [61,73].
It is known that the Earth Sun power is called the solar constant and is approximately 1370 (W/m2). Because the Earth is slightly elliptical orbit around the Sun, the solar constant actually varies by ±3%, so we used the lower sun power that considered 1000 and 1370 W/m2. However, Thube et al. [107] measured the solar constant using glass beaker equipment for six days and indicated that the value is not fixed but varies with time, and these variations happened due to solar activities such as weather, climates, etc. They calculated the average black ink added water value, and they found that the solar constant is 1366 W/m2 to 1387.19 W/m2 at the ground surface. Table 2 used the two values of Sun power of 1000 W/m2 and 1366.0 W/m2 to calculate the DSSCs efficiency at various filter paper thicknesses and light intensities.

3.8. DSSC Stability and Voltage Decay

The DSSCs’ widespread application’s main limiting factor is the long-term stability of standard DSSCs, which is mainly based on the liquid electrolytes’ volatility. With the photo-anode thickness decrement, the light-harvesting efficiency was negatively affected [108]. Voc slower decay evidencing a superior tified that resulting from enzymatic treatment and superior charge lifetime [109,110]. The crystallinity increment clearly proved the scattering effect increment. The NC content increment improved the sunlight conversion efficiency values.
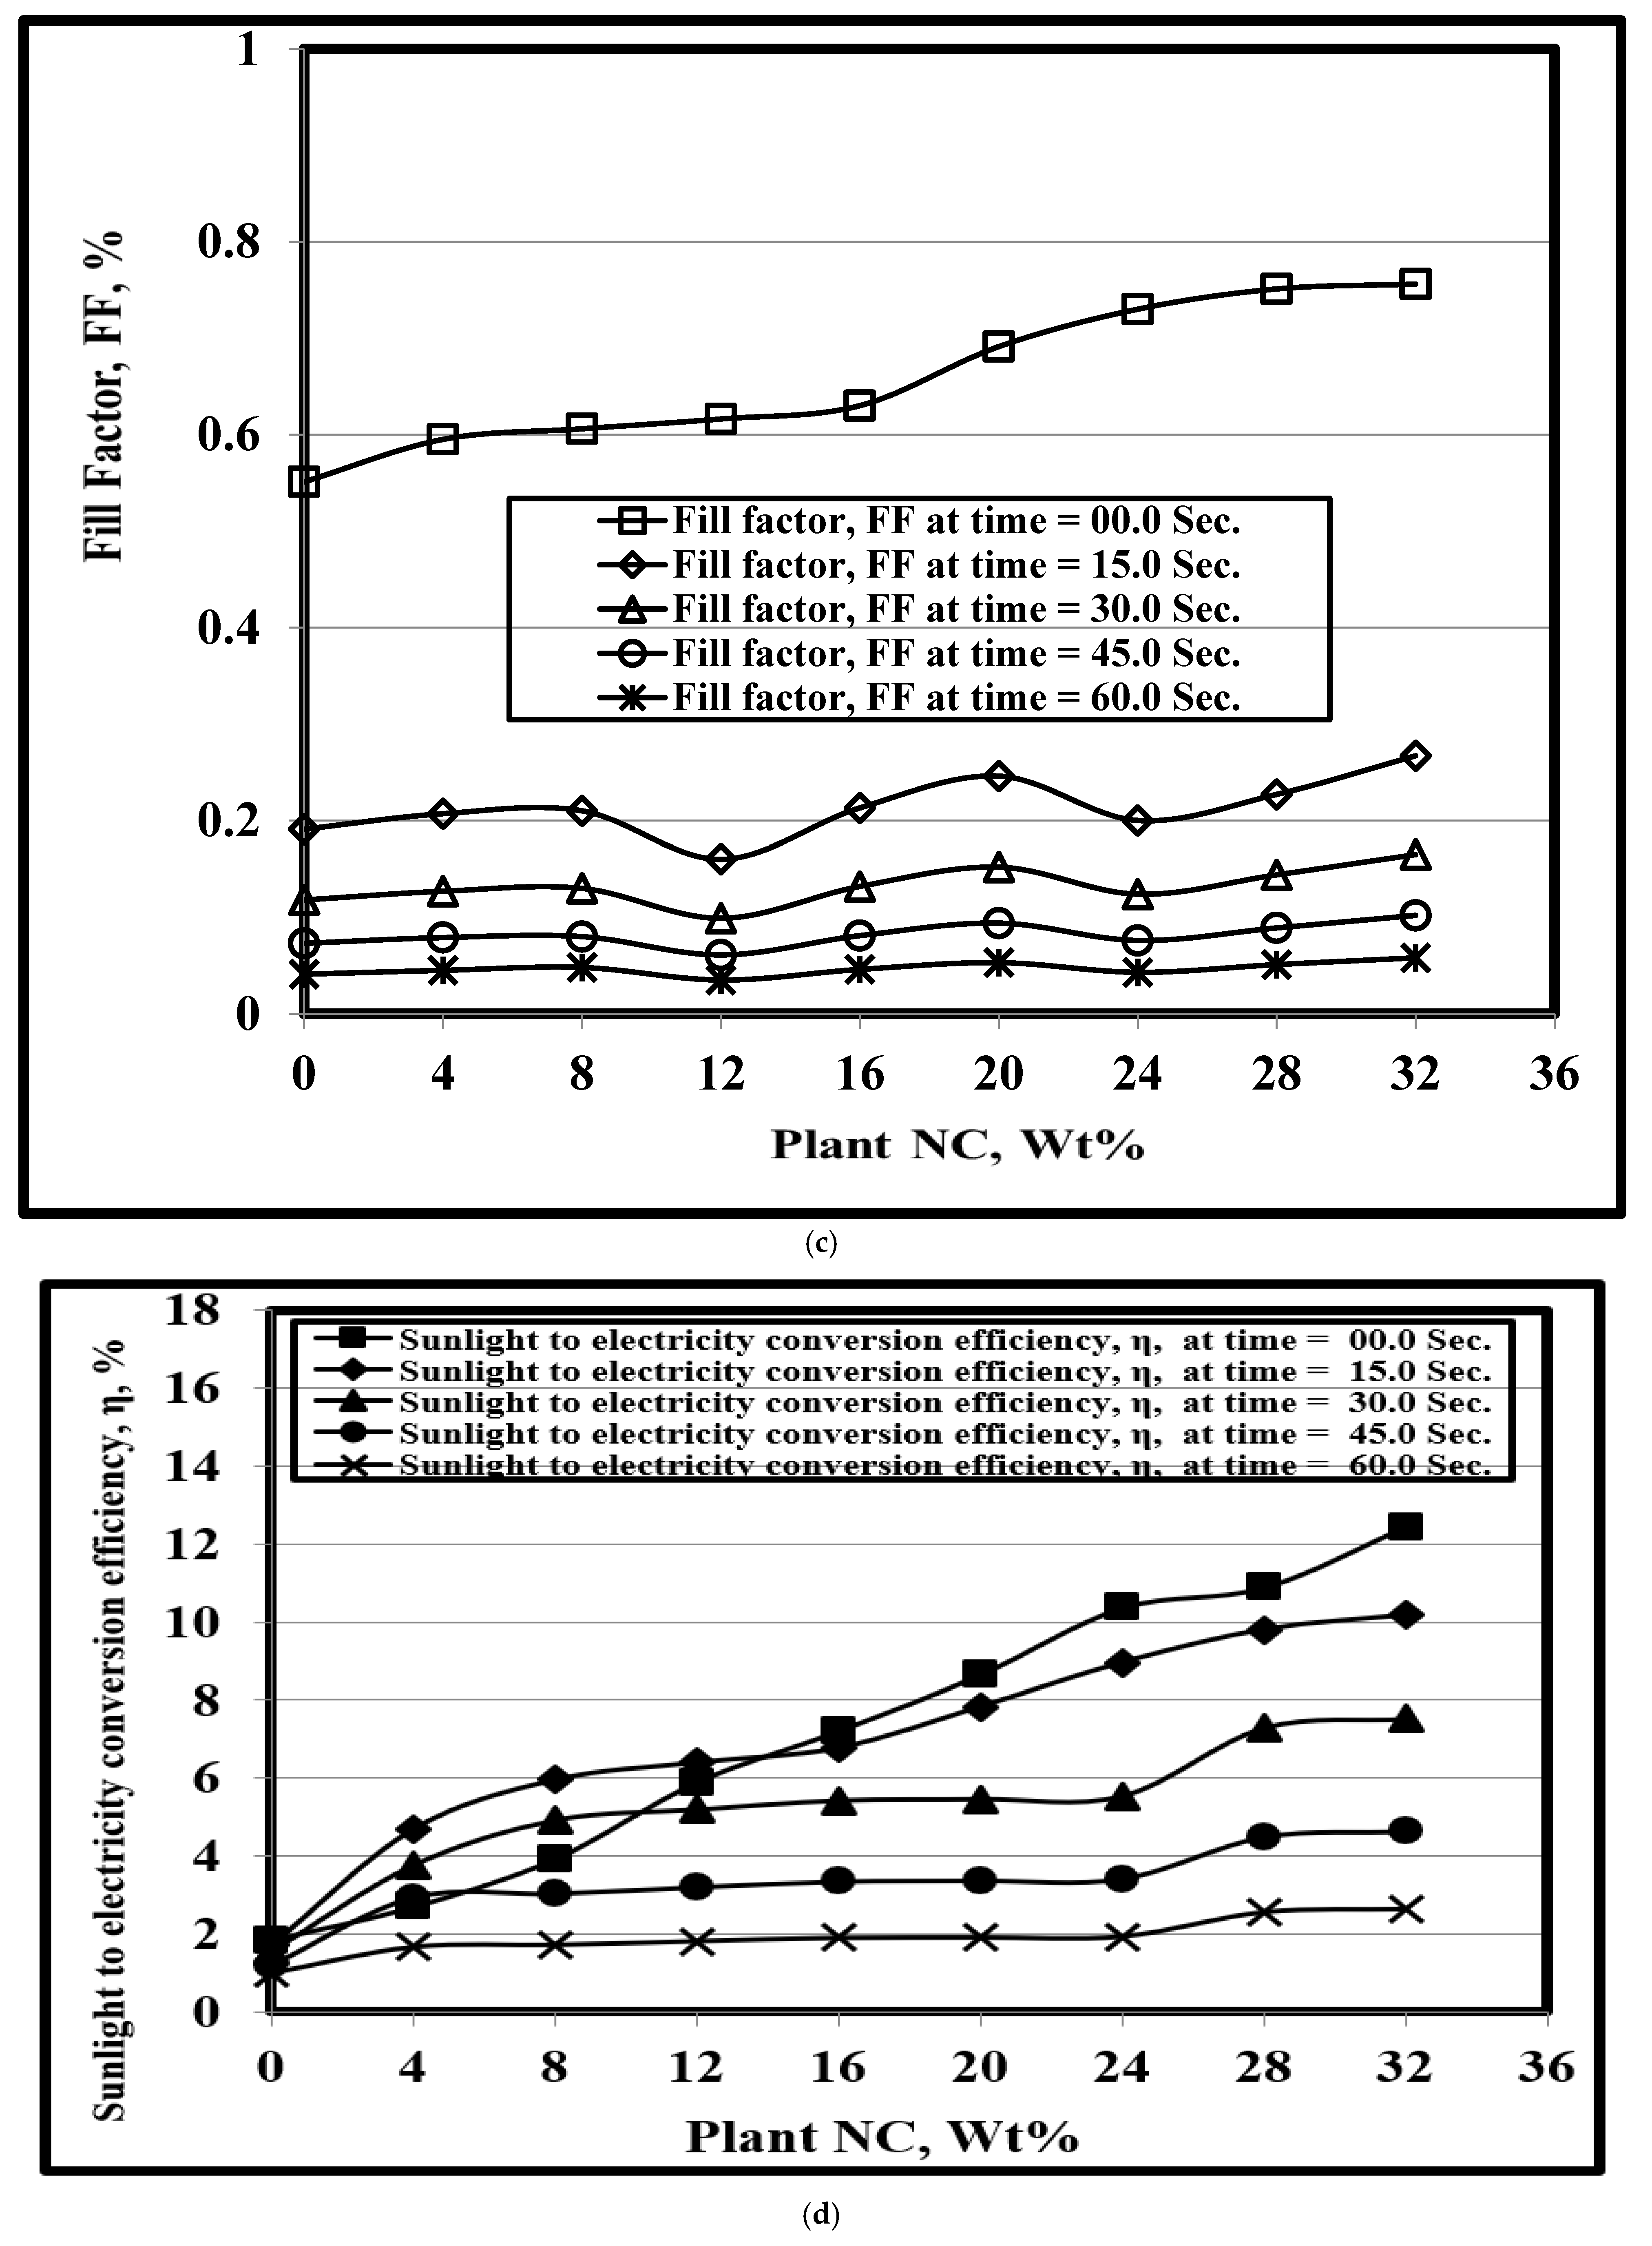
Figure 14 shows the DSSCs voltage decay features at different time periods. The DSSCs were continuously irradiated by light for 5 s, followed by turning off the light. The results shown in Figure 14, after removing the light, the voltage decay decreased with time increment due to the oxidised chlorophyll dye molecules in the excited state being stronger, and the electrons easily captured within the ZnO thin film by I3 ions in the electrolyte. Therefore, the DSSC electrons’ lifetime with chlorophyll dye was relatively decreased. The effect of the light turned-off periods on the photo voltaic parameters is shown in Figure 14.
The PV parameters evaluated the charge-carrier lifetime and stability in the DSSC, where slower decay indicates longer lifetimes and higher stability. In such experiments, the illumination is switched off, and the PV parameters are measured in the dark over time from the sun-illuminated state to the dark equilibrium state. Figure 14 shows the results of this analysis measured at different time periods (at intervals of 10 s from 0 to 60 s) for DSSCs with different PNC contents. Figure 14a showed that the maximum Jsc ranged from 11.91 to 20.96 mA cm−2 under full sun and from 0.82 to 1.442 mA cm−2 in the dark 60 s after the sunlight was completely cut off) for DSSC with 0 and 32 wt.% PNC, respectively. Similarly, Figure 14b shows that the maximum Voc ranged from 0.67 to 1.048 V under full sun and from 0.045 to 0.072 V in the dark for 0 and 32 wt.% PNC, respectively. Figure 14c showed that the maximum FF ranged from 0.60% to 0.84% in full sun and from 0.04% to 0.06% in the dark for 0 and 32 wt.% PNC, respectively. Figure 14d shows that η ranged from 4.5% to 9.7% in full sun and from 0.3% to 0.7% in the dark for 0 and 32 wt.% PNC, respectively. The slight differences between the data shown in Figure 11 and Figure 12 and those in Figure 14 were attributed to slight differences in the sunlight intensity during the experimental periods.
After removing the light, the 32 wt% PNC DSSC has a lower voltage decay time with Voc of 0.67 V and η of 4.5% after 60 s. Therefore, the chlorophyll dye and PNC had a long DSSC lifetime of photoexcited electrons, which increased with increasing PNC content. Thus, it is evident that increasing the PNC content results in corresponding increases in FF and η. As η after 60 s darkness is nearer to 50%, η in full sunlight assesses the long-term stability of the fabricated DSSCs, [51,66].
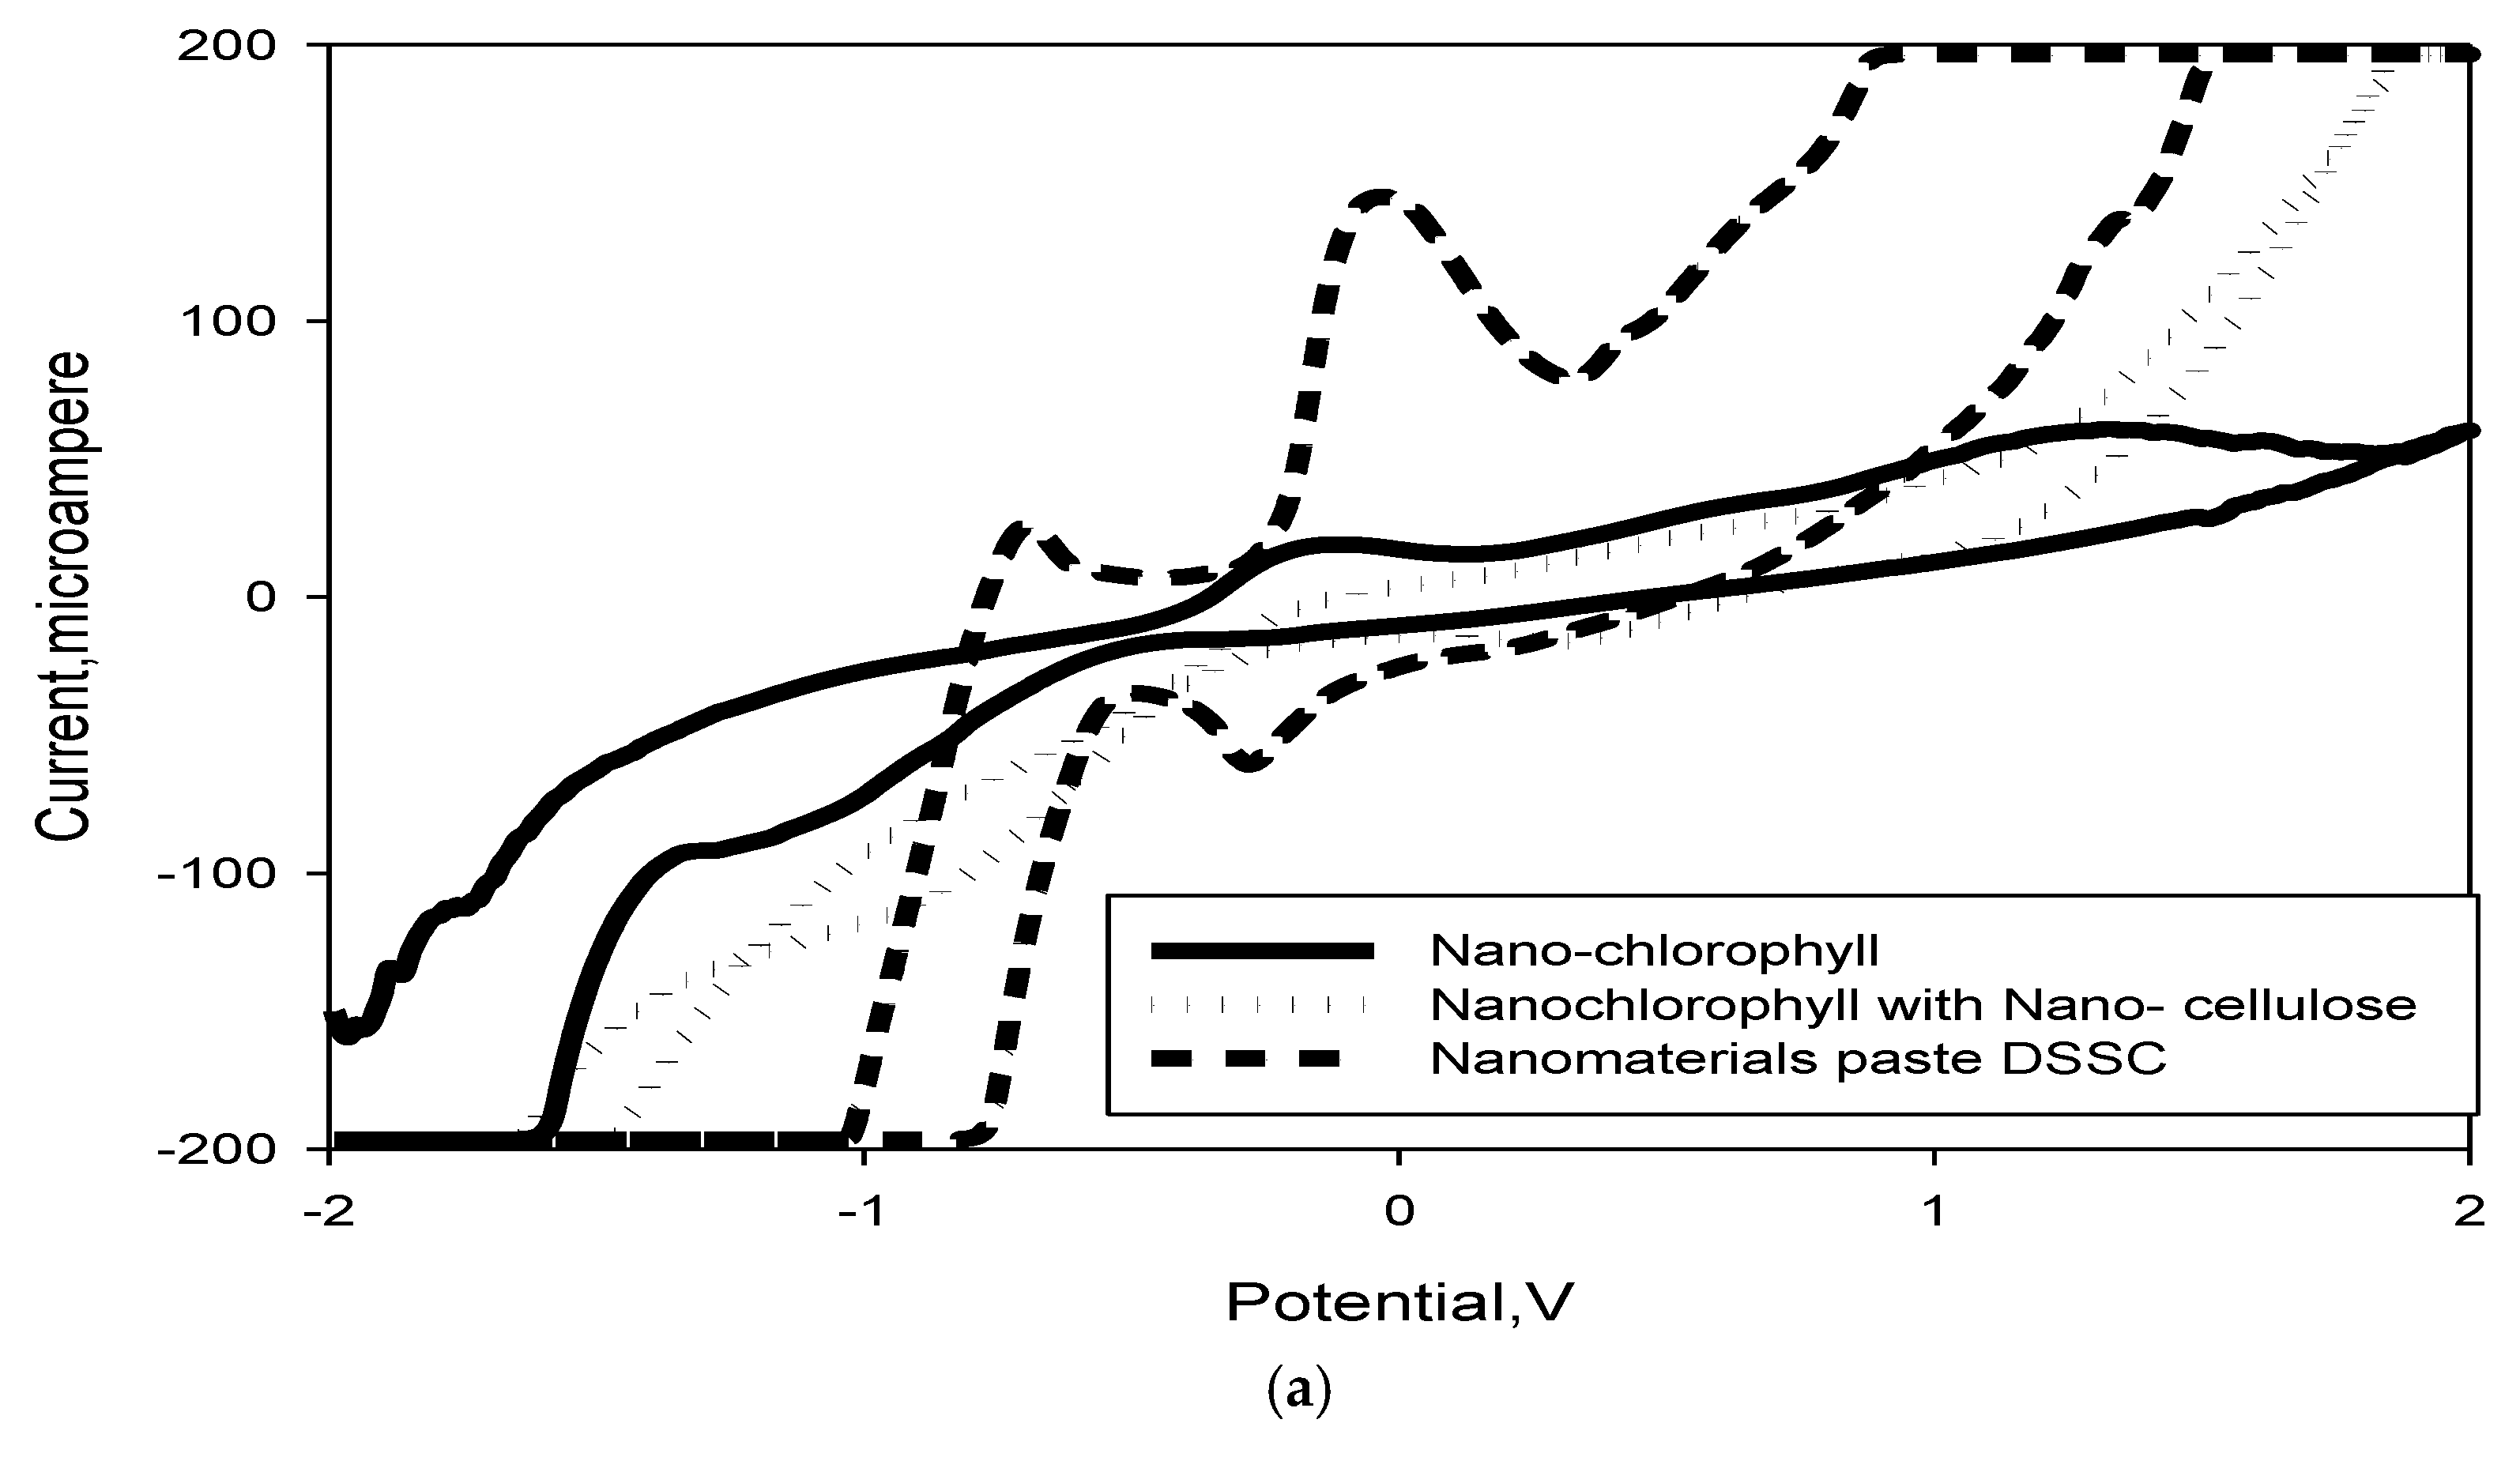
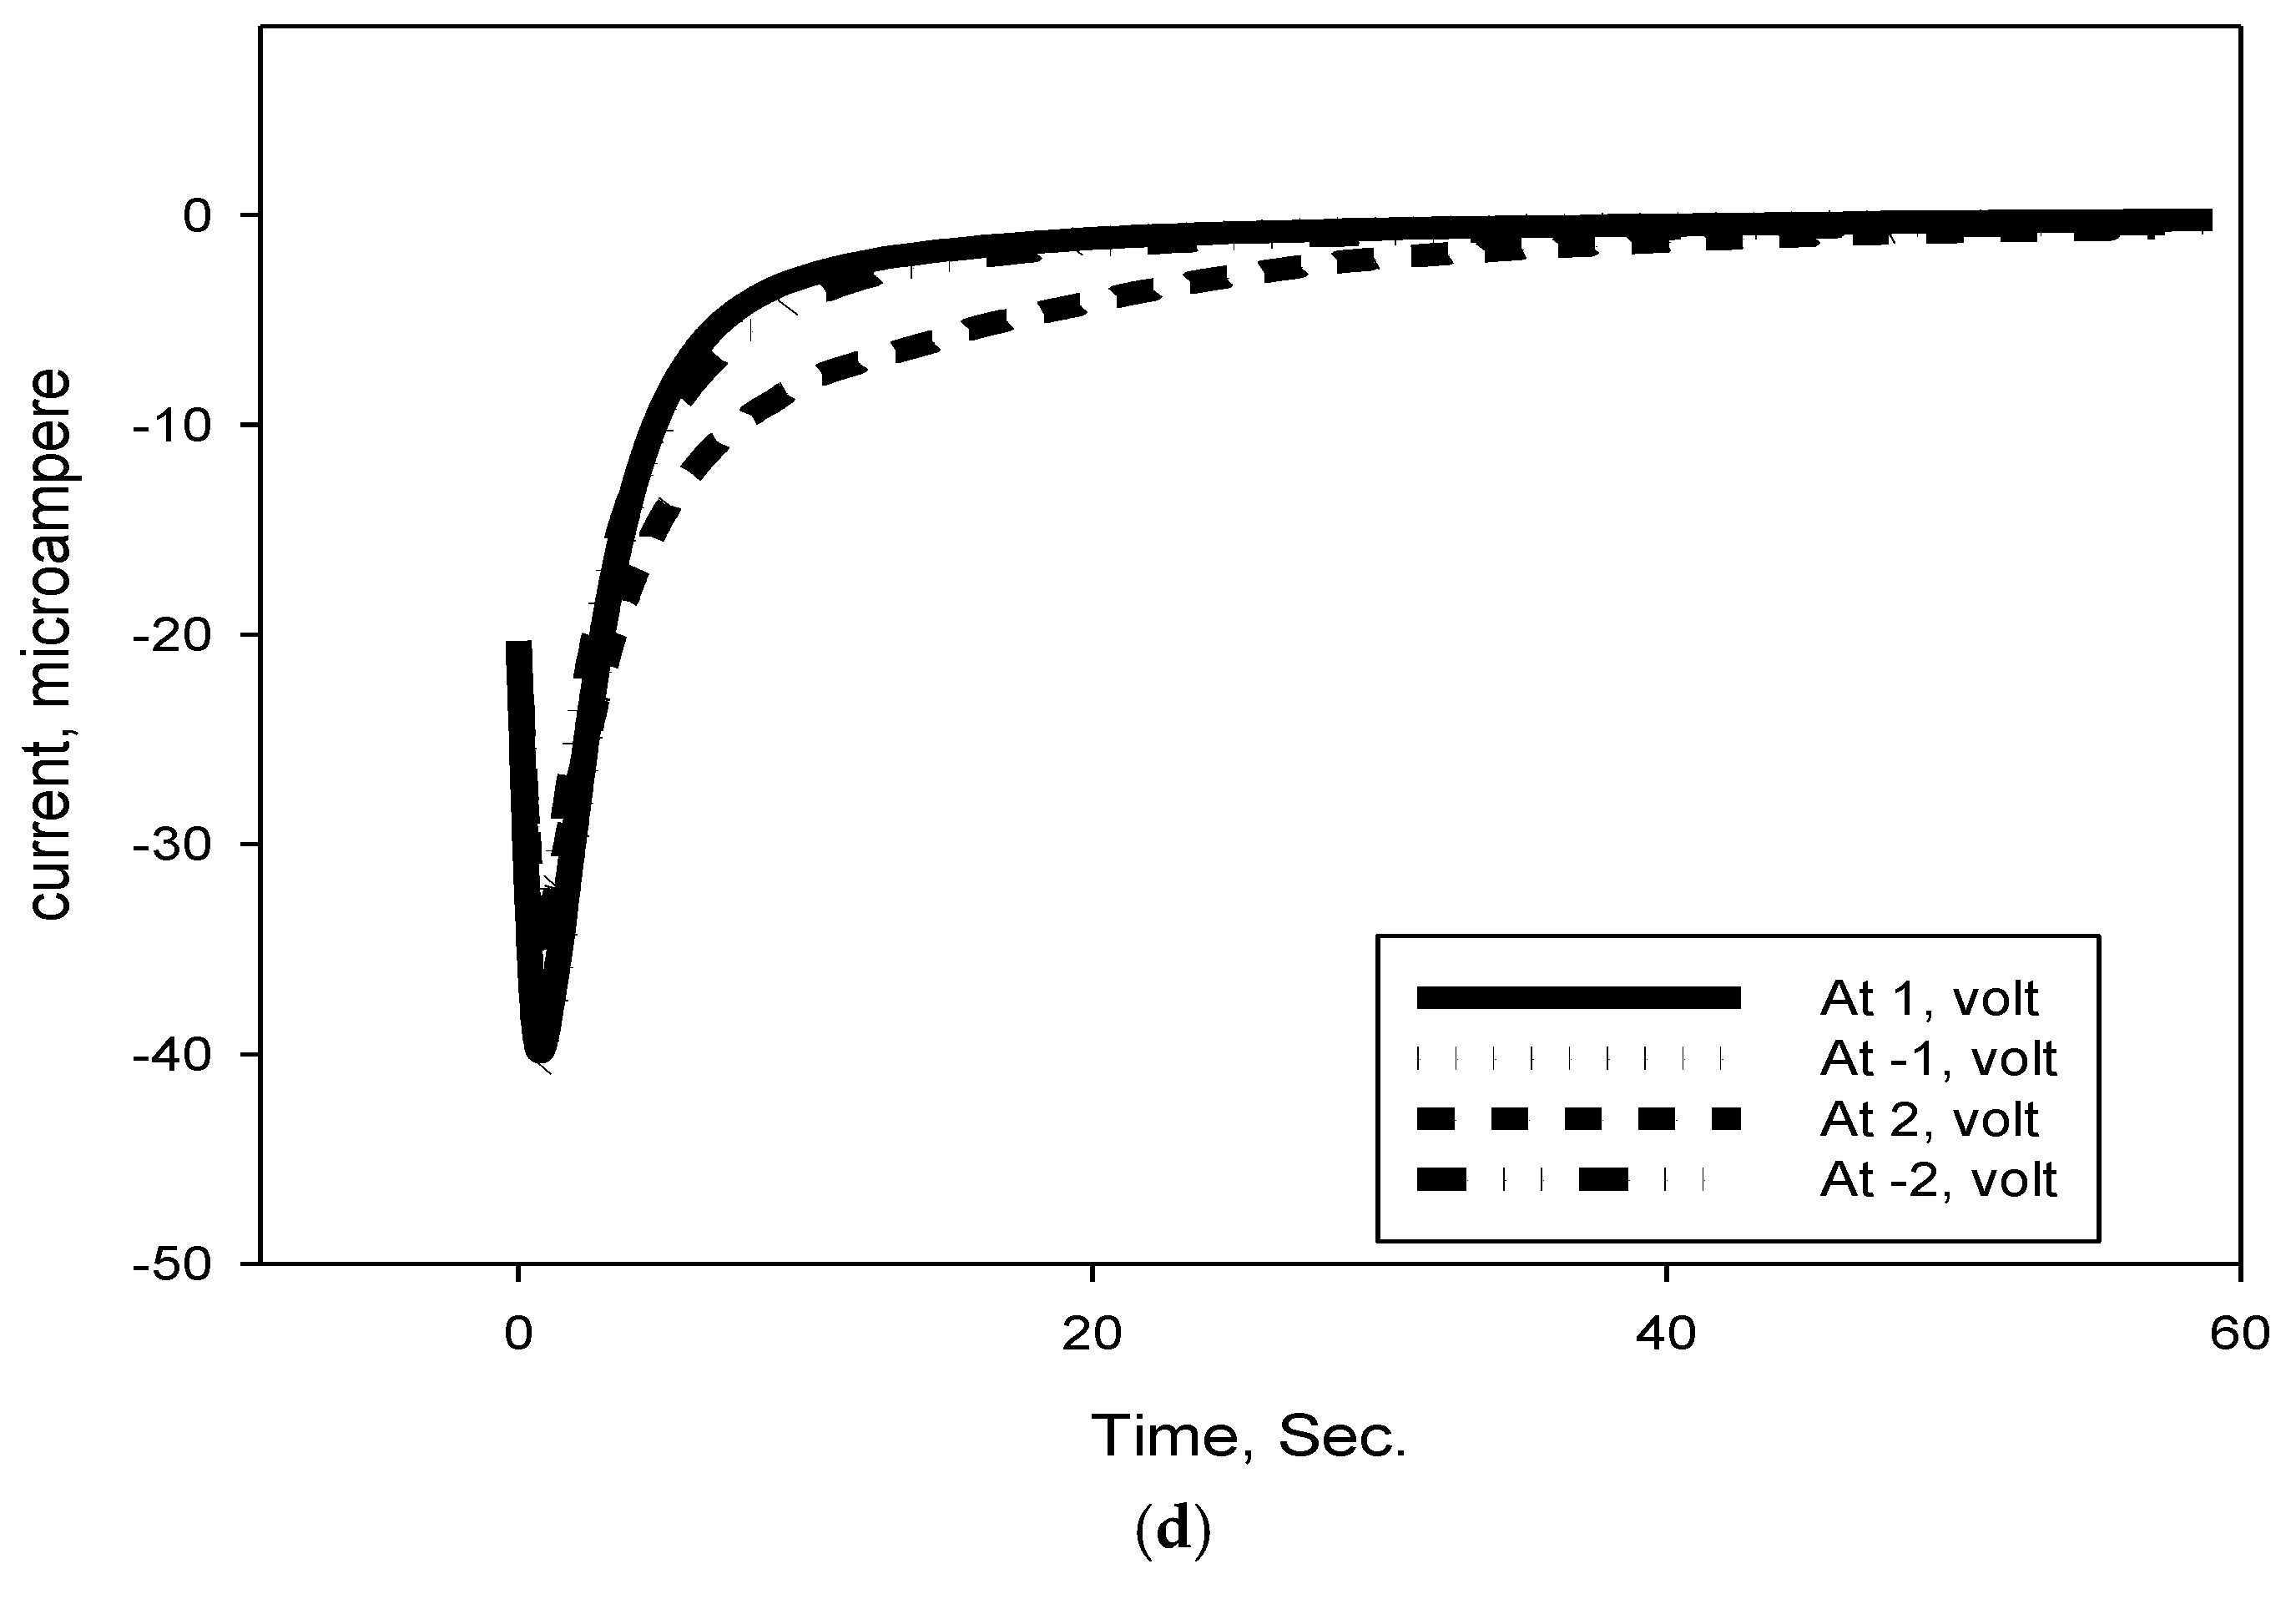
The dye’s ground state oxidation potential (Eox) under ambient conditions is measured using cyclic voltammetry. The first (Eox) is equal to HOMO of the natural dye (nano-chlorophyll), PNC, and paste used for a dye-sensitised solar cell shown in Figure 15. The prepared nano materials adsorbed on NZnO film showed quasi-reversible electrochemical behavior; the redox peaks can be calculated at −0.8, −0.1, 0.8, 1.5, −0.5, −0.7, and −0.95 V, respectively, vs. Ag/AgCl/KCl for paste DSSC and the redox peaks of nano-chlorophyll with and without PNC −0.5, 0.31.5, 1.7, −0.5, and −1.5 V vs. Ag/AgCl/KCl (Figure 15a). The DSSC nano materials LUMO level is calculated using the equation (ELUMO = Eox − Eo-o), where Eo-o is the zeroth-zeroth transition energy of materials in the range of −0.5 to −1.5V. This indicates the sufficient driving force required to inject the electrons from the excited natural nano dye to the ZnO nano conduction band. Figure 15b–d shows these materials were more stable for 20 cycles, in agreement with Lin et al. [86] and Hsieh et al. [87].

4. Conclusions

The following conclusions are obtained as follows:
The proposed DSSC with 32% PNC has long-term manufactured stability and is found suitable for outdoor applications. The addition of PNC from banana peel to DSSC electrolyte is shown effective. Increasing the ultrasonic wave exposure time reduced the size of the Chl particles and narrowed the size distribution. Beyond 20 min, the particle size was too small to be measured by DLS.
FT-IR spectra of the ZnO nanoparticles showed characteristic absorption for 20 min bands around 490, 613, and 673 cm−1. The three absorption peaks related to the bulk transverse optical and longitudinal optical frequencies. SEM micrographs at different magnifications of cellulose nanoparticles, ZnO nanoparticles, (i) electrolyte paste, and (j) electrolytic paste without ZnO are found in good agreement with DLS particle size measurements. HPLC chromatographic profile of Chl showed the presence of a single peak at 1.50 min retention time proving its purity evaluated at 13,500 mAU. Zeta Potential Distribution obtained Nano chlorophyll and chlorophyll conductivity values of 0.0231 mS/cm and 1.77 × 10⁻⁴ mS/cm, respectively. As the higher conductivity leads to higher current values, that results in DSSC higher sunlight conversion efficiency using Nano chlorophyll which enhances the produced cell characteristics.
With increasing PNCcontent from 0 to 32 wt%, the PV parameters all showed an increase: Jsc from 10.93 to 18.752 mA/cm2; Voc from 0.61 to 0.96 mV; FF from 0.55% to 0.77%; and η from 16.58% to 35.16%, respectively. The proposed DSSC with 32% PNC has long-term manufactured stability and is found suitable for outdoor applications. The PNC content increases FF and η values and had a positive effect on both the Jsc and Voc parameters. Increasing the PNC content in the DSSC resulted in lifetime increment and voltage decay decrement.

Author Contributions

Formal analysis, A.K.A.; Funding acquisition, A.K.A.; Investigation, A.T.M.; Methodology, A.T.M., A.K.A. and H.M.A.-D.; Software, H.M.A.-D. and A.K.A.; Supervision, T.P.; Visualization, Z.A.A., T.P., S.H.A. and A.K.A.; Writing—original draft, H.M.A.-D. and A.K.A. All authors have read and agreed to the published version of the manuscript.

Funding

The authors would like to extend their sincere thanks to the High Altitude Research Center, Taif University for its funding of this research through the Research Group of Project number: 1-442-47.

Institutional Review Board Statement

Not applicable.

Informed Consent Statement

Not applicable.

Data Availability Statement

The authors confirm that the data supporting the findings of this study are available within the article.

Acknowledgments

The authors would like to extend their sincere thanks to the High Altitude Research Center, Taif University for its funding of this research through the Research Group of Project number: 1-442-47.

Conflicts of Interest

The authors declare no conflict of interest.

Nomenclature

Dye-sensitised solar cell (DSCC); plant nanocellulose (PNC); Chlorophyll, (Chl); energy return on investment (EROI); Tera watt (TW); surface enhanced Raman, scattering (SERS); attenuated total reflection (ATR); power conversion efficiency (PCE); hole transporting materials (HTMs); anthanthrone (ANT); Perovskite solar cells (PSCs); Fourier transform spectrophotometer infrared (FTIR); ultra violet-visible (UV-Vis); short-circuit, current density (Jsc); highest occupied molecular orbital (HOMO); lowest unoccupied molecular, orbital (LUMO); the basis of current (I) and voltage (V) generated; Cellulose nanocrystal (CNC), cellulose nanofiber (CNF); Dynamic light scattering (DLS); short-circuit current density (Jsc); maximum open circuit voltage (Voc); resistance (R); power per unit area of incident light, (Pin); efficiency (η); fill factor (FF); inverse photoelectron spectroscopy (IPES); Cyclic voltammetry (CV); energy of the HOMO and LOMO(HOMO) & (LUMO); Time-dependent density-functional theory (TD-DFT), Density functional theory (DFT).

References

  1. Gielen, D.; Boshell, F.; Saygin, D.; Bazilian, M.D.; Wagner, N.; Gorini, R. The role of renewable energy in the global energy transformation. Energy Strategy Rev. 2019, 24, 38–50. [Google Scholar] [CrossRef]
  2. Pye, S.; Li, P.H.; Keppo, I.; O’Gallachoir, B. Technology interdependency in the United Kingdom’s low carbon energy transition. Energy Strategy Rev. 2019, 24, 314–330. [Google Scholar] [CrossRef]
  3. Ortner, A.; Totschnig, G. The future relevance of electricity balancing markets in Europe—A 2030 case study. Energy Strategy Rev. 2019, 24, 111–120. [Google Scholar] [CrossRef]
  4. Solarin, S.A. Will energy strategies to reduce oil imports by countries dependent on foreign oil be effective? Evidence from residual augmented least squares and cross-sectionally augmented panel unit root tests. Energy Strategy Rev. 2019, 24, 268–278. [Google Scholar] [CrossRef]
  5. Sonter, L.J.; Dade, M.C.; Watson, J.E.M.; Valenta, R.K. Renewable energy production will exacerbate mining threats to biodiversity. Nat. Commun. 2020, 11, 1–6. [Google Scholar] [CrossRef] [PubMed]
  6. Ghosh, A. Recent Advances in Renewable Energy and Clean Energy. Energies 2022, 15, 3204. [Google Scholar] [CrossRef]
  7. Smith, O.; Cattell, O.; Farcot, E.; O’Dea, R.D.; Hopcraft, K.I. The effect of renewable energy incorporation on power grid stability and resilience. Sci. Adv. 2022, 8, 1–9. [Google Scholar] [CrossRef]
  8. Al Qubeissi, M.; El-kharouf, A.; Soyhan, H.S. For Sustainable Development: Future Trends in Renewable Energy and Enabling Technologies. Renew. Energy Resour. Chall. Appl. 2020, 1–10. [Google Scholar] [CrossRef]
  9. Arndt, C.; Arent, D.; Hartley, F.; Merven, B.; Mondal, A.H. Annual review of resource economics faster than you think: Renewable energy and developing countries. Annu. Rev. Resour. Econ. 2019, 11, 149–168. [Google Scholar] [CrossRef]
  10. Saba, C.S.; Ngepah, N. Convergence in renewable energy sources and the dynamics of their determinants: An insight from a club clustering algorithm. Energy Rep. 2022, 8, 3483–3506. [Google Scholar] [CrossRef]
  11. Kinolikar, A.; Garg, S.; Pundir, S.; Shakya, M.K. Power generation using advanced solar panel. Int. J. Eng. Res. Technol. 2014, 3, 1695–1697. [Google Scholar]
  12. Laha, S.K.; Sadhu, P.K.; Ganguly, A.; Naskar, A.K. Convergence tuning of solar power for enhanced energy harvesting. Lat. Am. Appl. Res. Int. J. 2018, 48, 113–118. [Google Scholar] [CrossRef]
  13. Angowski, M.; Kijek, T.; Lipowski, M.; Bondos, I. Factors Affecting the Adoption of Photovoltaic Systems in Rural Areas of Poland. Energies 2021, 14, 5272. [Google Scholar] [CrossRef]
  14. Ata, N.K.; Dolmatov, I.A. Which factors infuence the decisions of renewable energy investors? Empirical evidence from OECD and BRICS countries. Environ. Sci. Pollut. Res. 2022, 1–24. [Google Scholar] [CrossRef]
  15. Alam, S.S.; Masukujjaman, M.; Lin, C.Y.; Omar, N.A.; Na, M.; Othman, A.S. Factors affecting photo voltaic solar energy usage intention in rural households in bangladesh: A structural equation modelling approach. Environ. Clim. Technol. 2022, 26, 276–293. [Google Scholar] [CrossRef]
  16. Dincer, F.; Meral, M.E. Critical Factors that Affecting Efficiency of Solar Cells. Smart Grid Renew. Energy 2010, 1, 47–50. [Google Scholar] [CrossRef]
  17. Hagfeldt, A.; Boschloo, G.; Sun, L.; Kloo, L.; Pettersson, H. Dye-Sensitized Solar Cells. Chem. Rev. 2010, 110, 6595–6663. [Google Scholar] [CrossRef] [PubMed]
  18. Armaroli, N.; Balzani, V. Solar Electricity and Solar Fuels: Status and perspectives in the Context of the energy transition. Chem. Eur. J. 2016, 22, 32–57. [Google Scholar] [CrossRef] [PubMed]
  19. Grätzel, M. Photoelectrochemical cells. Nature 2001, 414, 338–344. [Google Scholar] [CrossRef] [PubMed]
  20. Patni, N.; Pillai, S.G.; Sharma, P. Effect of using betalain, anthocyanin and chlorophyll dyes together as a sensitizer on enhancing the efficiency of dye-sensitized solar cell. Int. J. Energy. Res. 2020, 44, 10846–10859. [Google Scholar] [CrossRef]
  21. Dinesh, V.P.; Kumar, R.S.; Sukhananazerin, A.; Sneha, J.M.; Kumar, P.M.; Biji, P. Novel stainless steel based, eco-friendly dye-sensitized solar cells using electrospun porous ZnO nanofibers. Nano-Struct. Nano-Objects 2019, 19, 100311. [Google Scholar] [CrossRef]
  22. Pratiwi, D.D.; Nurosyid, F.; Kusumandari; Supriyanto, A.; Suryana, R. Effect of Ni Doping into Chlorophyll Dye on the Efficiency of Dye-Sensitized Solar Cells (DSSC); AIP Publishing: Long Island, NY, USA, 2018; pp. 267–276. [Google Scholar]
  23. Kohn, P.S.; Großerhode, C.; Storck, J.L.; Grötsch, G.; Cornelißen, A.; Cornelißen, C.; Pfeiffer, A.S.; Ehrmann, A. Commercially available teas as possible dyes for dye-sensitized solar cells. Optik 2019, 202, 178–182. [Google Scholar] [CrossRef]
  24. Junger, I.J.; Wehlage, D.; Böttjer, R.; Grothe, T.; Juhász, L.; Grassmann, C.; Blachowicz, T.; Ehrmann, A. Dye-Sensitized Solar Cells with Electrospun Nanofiber Mat-Based Counter Electrodes. Materials 2018, 11, 1604. [Google Scholar] [CrossRef]
  25. Khammee, P.; Unpaprom, Y.; Subhasaen, U.; Ramaraj, R. Potential evaluation of yellow cotton (cochlospermum regium) pigments for dye sensitized solar cells application. Glob. J. Sci. Eng. 2020, 2, 16–21. [Google Scholar] [CrossRef]
  26. Amin, M.T.; Abo-Dief, H.M.; Abu-Ali, O.A.; Mohamed, A.T. Effect of cabbage color on the improvement of dye-sensitized solar cell (DSSC) Parameters using nanostructured zinc oxide. In Proceedings of the #VSESA Conference, Jeddah, KSA, 1–2 December 2020; pp. 1–10. [Google Scholar]
  27. Atli, A.; Atilgan, A.; Altinkaya, C.; Oze, K.; Yildiz, A. St. Lucie cherry, yellow jasmine, and madder berries as novel natural sensitizers for dye-sensitized solar cells. Int. J. Energy Res. 2019, 43, 3914–3922. [Google Scholar] [CrossRef]
  28. Junger, I.J.; Udomrungkhajorncha, S.; Grimmelsmann, N.; Blachowicz, T.; Ehrmann, A. Effect of caffeine copigmentation of anthocyanin dyes on dssc efficiency. Materials 2019, 1–12. [Google Scholar] [CrossRef] [PubMed]
  29. Bashar, H.; Bhuiyan, M.; Hossain, M.; Kabir, F.; Rahaman, S.; Manir, M.; Ikegami, T. Study on combination of natural red and green dyes to improve the power conversion efficiency of dye sensitized solar cells. Optik 2019, 185, 620–625. [Google Scholar] [CrossRef]
  30. Hosseinnezhad, M.; Rouhani, S.; Gharanjig, K. Extraction and application of natural pigments for fabrication of green dye-sensitized solar cells. Opto-Electronics Rev. 2018, 26, 165–171. [Google Scholar] [CrossRef]
  31. Franchi, D.; Calamante, M.; Coppola, C.; Alessandro Mordini, A.; Reginato, G.; Adalgisa Sinicropi, A.; Lorenzo Zani, L. Synthesis and characterization of new organic dyes containing the Indigo core. Molecules 2020, 25, 3377. [Google Scholar] [CrossRef]
  32. Navar, A.O.; Hernández, I.A.; Luke, T.L.; Zarazúa, I.; Arellano, V.R.; Guerrero, J.P.; Soto, N.O. Photoconversion efficiency of Titania solar cells co-sensitized with natural pigments from cochineal, papaya peel and microalga Scenedesmus obliquus. J. Photochem. Photobiol. A Chem. 2020, 388, 1–10. [Google Scholar]
  33. Velasco, P.H.; Atilano, I.M.; Delgado, M.R.; Delgado, J.M.R.; Moreno, D.L.; Alanís, F.G.Á.; Villarreal-Chiu, J.F. Photoelectric evaluation of dye-sensitized solar cells based on prodigiosin pigment derived from Serratia marcescens 11E. Dye. Pigment. 2020, 177, 108278. [Google Scholar] [CrossRef]
  34. Arifin, Z.; Soeparman, S.; Widhiyanuriyawan, D.; Suyitno, S.; Setyaji, A.T. Improving stability of chlorophyll as natural dye for dye-sensitized solar cells. J. Teknol. 2017, 80, 27–33. [Google Scholar] [CrossRef]
  35. Chatterjee, S.; Karki, I.B. Effect of Photoanodes on the Performance of Dye-Sensitized Solar Cells. J. Inst. Eng. 2020, 15, 62–68. [Google Scholar] [CrossRef]
  36. Vittal, R.; Ho, K.-C. Zinc oxide based dye-sensitized solar cells: A review. Renew. Sustain. Energy Rev. 2017, 70, 920–935. [Google Scholar] [CrossRef]
  37. Das, P.P.; Roy, A.; Das, S.; Devi, P.S. Enhanced stability of Zn2SnO4 with N719, N3 and eosin Y dye molecules for DSSC application. Phys. Chem. Chem. Phys. 2016, 18, 1429–1438. [Google Scholar]
  38. Lee, K.E.; Gomez, M.; Elouatik, S.; Demopoulos, G. Further understanding of the adsorption mechanism of N719 sensitizer on anatase TiO2 Films for DSSC application. Langmuir 2010, 26, 9575–9583. [Google Scholar] [CrossRef]
  39. Calamante, M.; Mordini, A.; Franchi, D.; Reginato, G.; Zani, L.; Peruzzini, M.; Taddei, M.; de Biani, F.F.; Basosi, R.; Sinicropi, A.; et al. Two New Dyes with Carboxypyridinium Regioisomers as Anchoring Groups for Dye-Sensitized Solar Cells. Synlett 2015, 26, 2389–2394. [Google Scholar] [CrossRef]
  40. Reginato, G.; Calamante, M.; Zani, L.; Mordini, A.; Franchi, D. Design and synthesis of organic sensitizers with enhanced anchoring stability in dye-sensitized solar cells. Pure Appl. Chem. 2017, 90, 363–376. [Google Scholar] [CrossRef]
  41. Pham, H.D.; Do, T.T.; Kim, J.; Charbonneau, C.; Manzhos, S.; Feron, K.; Tsoi, W.C.; Durrant, J.R.; Jain, S.M.; Sonar, P. Molecular engineering using an anthanthrone dye for low-cost hole transport materials: A strategy for dopant-free, high-efficiency, and stable perovskite solar cells. Adv. Energy Mater. 2018, 8, 1703007. [Google Scholar] [CrossRef]
  42. Pham, H.D.; Do, T.T.; Kim, J.; Charbonneau, C.; Manzhos, S.; Feron, K.; Tsoi, W.C.; Durrant, J.R.; Jain, S.M.; Sonar, P. One step facile synthesis of a novel anthanthrone dye-based, dopant-free hole transporting material for efficient and stable perovskite solar cells. J. Mater. Chem. 2018, 6, 3699–3708. [Google Scholar] [CrossRef]
  43. Gokilamani, N.; Muthukumarasamy, N.; Thambidurai, M.; Ranjitha, A.; Velauthapillai, D. Utilization of natural anthocyanin pigments as photosensitizers for dye-sensitized solar cells. J. Sol-Gel Sci. Technol. 2013, 66, 212–219. [Google Scholar] [CrossRef]
  44. Liang, M.; Chen, J. Arylamine organic dyes for dye-sensitized solar cells. Chem. Soc. Rev. 2013, 42, 3453–3488. [Google Scholar] [CrossRef]
  45. Siddick, S.Z.; Lai, C.W.; Juan, J.C. An investigation of the dye-sensitized solar cell performance using graphene-titania (TrGO) photoanode with conventional dye and natural green chlorophyll dye. Mater. Sci. Semicond. Process. 2018, 74, 267–276. [Google Scholar] [CrossRef]
  46. Zhao, W.; Wang, X.-F.; Dall’Agnese, C.; Wei, Y.; Chen, G.; Tamiaki, H.; Sanehira, Y.; Sasaki, S.-I. P-type P3HT interfacial layer induced performance improvement in chlorophyll-based solid-state solar cells. J. Photochem. Photobiol. A Chem. 2018, 371, 349–354. [Google Scholar] [CrossRef]
  47. Almaz, W.; Muhamad, D.; Daud, Z.; Salleh, H. The sensitization effect of anthocyanin and chlorophyll dyes on optical and photovoltaic properties of zinc oxide based dye-sensitized solar cells. Optik 2020, 207, 458–464. [Google Scholar]
  48. Wang, S.; Duan, S.; Wang, Y.; Sun, C.; Wang, X.-F.; Sasaki, S.-I. Chlorophyll-based organic solar cells with improved power conversion efficiency. J. Energy Chem. 2019, 38, 88–93. [Google Scholar] [CrossRef]
  49. Cui, Y.; Zhao, W.; Ogasawara, S.; Wang, X.F.; Tamiaki, H. Fabrication and performance of all-solid-state dye-sensitized solar cells using synthetic carboxylated and pyridylated chlorophyll derivatives. J. Photochem. Photobiol. A Chem. 2018, 353, 625–630. [Google Scholar] [CrossRef]
  50. Al-Alwani, M.A.M.; Al-Mashaan, A.B.S.A.; Abdullah, M.F. Performance of the dye-sensitized solar cells fabricated using natural dyes from Ixora coccinea flowers and Cymbopogon schoenanthus leaves as sensitizers. Int. J. Energy Res. 2019, 43, 7229–7239. [Google Scholar]
  51. Delgado, R.L.; Plascencia, M.T.; Ramos, M.E.Á.; Ayón, A. Increasing the solar cell efficiency using glass balls. Version Rec. Sci. Direct 2019, 1–15. [Google Scholar]
  52. Li, M.; Li, N.; Chen, G.; Sasaki, S.-I.; Miyasaka, T.; Tamiaki, H.; Dall’Agnese, C.; Wang, X.-F. Perovskite solar cells based on chlorophyll hole transporters: Dependence of aggregation and photovoltaic performance on aliphatic chains at C17-propionate residue. Dye. Pigment. 2019, 162, 763–770. [Google Scholar] [CrossRef]
  53. Ridwan, M.A.; Noor, E.; Rusli, M.S.; Akhiruddin, A. Fabrication of dye-sensitized solar cell using chlorophylls pigment from sargassum. In Proceedings of the 1st International Conference on Tropical Studies and Its Application (ICTROPS), Samarinda, Indonesia, 9 November 2017; pp. 1–8. [Google Scholar]
  54. Wang, X.; Liu, C.; Shi, Z.; Pan, M.; Yu, D. Protein-encapsulated chlorophyll a molecules for biological solar cells. Mater. Des. 2020, 195, 108983. [Google Scholar] [CrossRef]
  55. Tamiaki, H.; Hagio, N.; Tsuzuki, S.; Cui, Y.; Zouta, T.; Wang, X.-F.; Kinoshita, Y. Synthesis of carboxylated chlorophyll derivatives and their activities in dye-sensitized solar cells. Tetrahedron 2018, 74, 4078–4085. [Google Scholar] [CrossRef]
  56. Wang, X.; Pan, M.; Shi, Z.; Yu, D.; Huang, F. Chlorophyll derivative-sensitized tio2 electron transport layer for record efficiency of Cs2AgBiBr6 double Perovskite solar cells. ACS Appl. Bio Mater. 2021, 4, 399–405. [Google Scholar] [CrossRef] [PubMed]
  57. Ezike, S.C.; Hyelnasinyi, C.N.; Salawu, M.A.; Wansah, J.F.; Ossai, A.N.; Agu, N.N. Synergestic effect of chlorophyll and anthocyanin Co-sensitizers in TiO2-based dye-sensitized solar cells. Surf. Interfaces 2020, 22, 100882. [Google Scholar] [CrossRef]
  58. Zhao, W.; Agnese, C.D.; Duan, S.; Sanehira, Y.; Wei, Y.; Tamiaki, H.; Tamiaki, S.; Wang, X.F. Trilayer chlorophyll-based cascade biosolar cells. ACS Energy Lett. 2019, 4, 384–389. [Google Scholar] [CrossRef]
  59. Lasrado, D.; Ahankari, S.; Kar, K. Nanocellulose-based polymer composites for energy applications—A review. J. Appl. Polym. Sci. 2020, 137, 48959. [Google Scholar] [CrossRef]
  60. Al-Ghamdi, S.A.; Abo-Dief, H.M.; Mohamed, A.T. Polymer/steel tribological characteristics and corrosion and under external voltages. J. Appl. Mech. Eng. 2021, 6, 1–9. [Google Scholar]
  61. Poskela, A.; Miettunen, K.E.; Borghei, M.; Vapaavuori, J.; Greca, L.G.; Lehtonen, J.; Solin, K.; Ago, M.; Lund, P.D.; Rojas, O.J. Nanocellulose and Nanochitin Cryogels Improve the Efficiency of Dye Solar Cells. ACS Sustain. Chem. Eng. 2019, 7, 10257–10265. [Google Scholar] [CrossRef]
  62. Ardakani, M.M.; Arazi, R.; Mirjalili, B.B.F.; Azad, S. Synthesis and application of Fe3O4 @nanocellulose/TiCl as a nanofiller for high performance of quasisolid-based dye-sensitized solar cells. Int. J. Energy Res. 2019, 43, 4483–4494. [Google Scholar] [CrossRef]
  63. Teo, L.P.; Buraidah, M.H.; Arof, A.K. Polysaccharide-based polymer electrolytes for future renewable energy sources. In Sustainable Materials for Next Generation Energy Devices, Challenges and Opportunities; Elsevier: Amsterdam, The Netherlands, 2021; pp. 283–316. [Google Scholar]
  64. Bita, B.; Iftimie, S.; Radu, A.; Antohe, V.A.; Coman, D.; Miron, C.; Staicu, D.; Dan, L.; Ion, L.; Antohe, S. On the Electrical and Photo-Electrical Behavior of the Photovoltaic Cells Based on Polymeric and Chlorophyll-a Thin Films; The Romanian Academy: Bucharest, Romania, 2019; Volume 20, pp. 51–57. [Google Scholar]
  65. Hsu, H.H.; Zhong, W. Nanocellulose-Based Conductive Membranes for Free-Standing Supercapacitors: A Review. Membranes 2019, 9, 74. [Google Scholar] [CrossRef]
  66. Raga, S.R.; Santiago, F.F. Temperature effects in dye-sensitized solar cells. Phys. Chem. Chem. Phys. 2013, 15, 2328–2336. [Google Scholar] [CrossRef]
  67. Radziemska, E.K. The effect of temperature on the power drop in crystalline solar cells. Renew. Energy 2003, 28, 1–12. [Google Scholar] [CrossRef]
  68. Savadogo, M.; Soro, B.; Konate, R.; Sourabié, I.; Zoungrana, M.; Zerbo, I.; Dieudonné Joseph Bathiebo, D.J. Temperature Effect on Light Concentration Silicon Solar Cell’s Operating Point and Conversion Efficiency. Smart Grid Renew. Energy 2020, 11, 61–72. [Google Scholar] [CrossRef]
  69. Shreedhana, K.; Ilavarasi, R. Fabrication of nanocrystalline cellulose from banana peel obtained from unripe plantain bananas. In Proceedings of the International Web Conference on Advanced Material Science and Nanotechnology (NANOMAT-2020), Nandgaon Khandeshwar, India, 20–21 June 2020. [Google Scholar]
  70. Delgadoa, R.L.; Plascenciac, M.T.; Ramosb, M.E.A.; Ayóna, A. Silicon Solar Cell Efficiency Improvement Employing Photoluminescent Properties of Chlorophyll-A; Elsevier: Amsterdam, The Netherlands, 2019; pp. 1–15. [Google Scholar]
  71. Szutt, A.; Śródka, A.D. Chlorophyll content in senescent pelargonium graveolens leaves. Proc. ECOpole 2019, 13, 1–7. [Google Scholar] [CrossRef]
  72. Liu, J.; Knapp, M.; Jo, M.; Dill, Z.; Bridwell-Rabb, J. Rieske Oxygenase Catalyzed C–H Bond Functionalization Reactions in Chlorophyll b Biosynthesis. ACS Central Sci. 2022, 8, 1393–1403. [Google Scholar] [CrossRef] [PubMed]
  73. Ashtaputre, S.S.; Deshpande, A.; Marathe, S.; Wankhede, M.E.; Chimanpure, J.; Pasricha, R.; Urban, J.; Haram, S.K.; Gosavi, S.W.; Kulkarni, S.K. Synthesis and analysis of ZnO and CdSe nanoparticles. Pramana 2005, 65, 615–620. [Google Scholar] [CrossRef]
  74. Bhakat, C.; Singh, P.P. Zinc oxide nanorods: Synthesis and its applications in solar cell. Int. J. Mod. Eng. Res. 2012, 2, 2452–2454. [Google Scholar]
  75. Sekine, N.; Chou, C.-H.; Kwan, W.L.; Yang, Y. ZnO nano-ridge structure and its application in inverted polymer solar cell. Org. Electron. 2009, 10, 1473–1477. [Google Scholar] [CrossRef]
  76. Noh, Y.-J.; Na, S.-I.; Kim, S.-S. Inverted polymer solar cells including ZnO electron transport layer fabricated by facile spray pyrolysis. Sol. Energy Mater. Sol. Cells 2013, 117, 139–144. [Google Scholar] [CrossRef]
  77. Moyassari, E.; Thomas Roth, T.; Kücher, S.; Chang, C.C.; Hou, S.C.; Spingler, F.B.; Jossen, A. The role of silicon in silicon-graphite composite electrodes regarding specific capacity, cycle stability, and expansion. J. Electrochem. Soc. 2022, 169, 010504. [Google Scholar] [CrossRef]
  78. Gouyon, J.; D’Orlyé, F.; Griveau, S.; Bedioui, F.; Varenne, A. Characterization of home-made graphite/PDMS microband electrodes for amperometric detection in an original reusable glass-NOA®-PDMS electrophoretic microdevice. Electrochim. Acta 2019, 329, 135164. [Google Scholar] [CrossRef]
  79. Chen, W.; Liu, Y.; Luo, J.; Sun, J.; Gao, L. A bifunctional TiO2 sol for convenient low-temperature fabrication of dye-sensitized solar cells. Mater. Lett. 2011, 67, 60–63. [Google Scholar] [CrossRef]
  80. Chiappone, A.; Bella, F.; Nair, J.R.; Meligrana, G. Structure–performance correlation of nanocellulose-based polymer electrolytes for efficient quasi-solid DSSCs. ChemElectroChem 2014, 1, 1350–1358. [Google Scholar] [CrossRef]
  81. Shafiee, A.; Salleh, M.M.; Yahaya, M. Determination of HOMO and LUMO of [6,6]-Phenyl C61-butyric Ac id3-ethylthiophene Ester and Poly (3-octyl-thiophene-2, 5-diyl) through Voltametry Characterization. Sains Malays. 2011, 40, 173–176. [Google Scholar]
  82. De Lile, J.R.; Kang, S.G.; Son, Y.A.; Lee, S.G. Do homo−lumo energy levels and band gaps provide sufficient understanding of dye-sensitizer activity trends for water purification? ACS Omega 2020, 5, 15052–15062. [Google Scholar] [CrossRef]
  83. Shabir, G.; Arooj, S.; Javed, A.H.; Saeed, A.; Shahzad, N.; Iqbal, N.; Jabeen, E. The development of highly fluorescent hemicyanine and dicyanoisophorone dyes for applications in dye-sensitized solar cells. J. Fluoresc. 2022, 32, 799–815. [Google Scholar] [CrossRef] [PubMed]
  84. Djurovich, P.I.; Mayo, E.I.; Forrest, S.R.; Thompson, M. Measurement of the lowest unoccupied molecular orbital energies of molecular organic semiconductors. Org. Electron. 2009, 10, 515–520. [Google Scholar] [CrossRef]
  85. Al-Ibrahim, M.; Roth, H.K.; Schroedner, M.; Alexander Konkin, A.; Zhokhavet, U.; Gobsch, G.; Scharff, P.; Sensfus, S. The influence of the optoelectronic properties of poly(3-alkylthiophenes) on The device parametersin flexible polymer solar cells. Org. Electron. 2005, 6, 65–77. [Google Scholar] [CrossRef]
  86. Lin, L.Y.; Tsai, C.H.; Wong, K.T.; Huang, T.W.; Hsieh, L.; Liu, S.H.; Lin, H.W. Organic dyes containing coplanar diphenyl-substituted dithienosilole core for efficient dye-sensitized solar cells. J. Org. Chem. 2010, 75, 4778–4785. [Google Scholar] [CrossRef] [PubMed]
  87. Hsieh, C.-P.; Lu, H.-P.; Chiu, C.-L.; Lee, C.-W.; Chuang, S.-H.; Mai, C.-L.; Yen, W.-N.; Hsu, S.-J.; Diau, E.W.-G.; Yeh, C.-Y. Synthesis and characterization of porphyrin sensitizers with various electron-donating substituents for highly efficient dye-sensitized solar cells. J. Mater. Chem. 2009, 20, 1127–1134. [Google Scholar] [CrossRef]
  88. D’Andrade, B.W.; Datta, S.; Forrest, S.R.; Djurovich, P.; Polikarpov, E.; Thompson, M.E. Relationship between the ionization and oxidation potentials of molecular organic semiconductors. Org. Electron. 2005, 6, 11–20. [Google Scholar] [CrossRef]
  89. Bredas, J.L.; Silbey, R.; Boudreux, D.S.; Chance, R.R. Chain-length dependence of electronic and electrochemical properties of conjugated systems: Polyacetylene, polyphenylene, polythiophene, and polypyrrole. J. Am. Chem. Soc. 1983, 105, 6555. [Google Scholar] [CrossRef]
  90. Cao, X.; Zhang, M.; Mujumdar, A.S.; Zhong, O.; Wang, Z. Effects of ultrasonic pretreatments on quality, energy consumption and sterilization of barley grass in freeze drying. Ultrason. Sonochemistry 2018, 40, 333–340. [Google Scholar] [CrossRef]
  91. Yang, A.; Liao, Y.; An, M.; Cao, Y.; Yang, Z.; Ren, H.; Su, H.; Zou, Q.; Chen, L. Effect of ultrasonic pretreatment on flocculation filtration of low-rank coal slurry. Molecules 2022, 27, 6460. [Google Scholar] [CrossRef] [PubMed]
  92. Sompech, S.; Srion, A.; Nuntiya, A. The Effect of Ultrasonic Treatment on the Particle Size and Specific Surface Area of LaCoO3. Procedia Eng. 2012, 32, 1012–1018. [Google Scholar] [CrossRef]
  93. Aydar, A.Y.; Aydın, T.; Yılmaz, T.; Kothakota, A.; Terezia, S.C.; Leontin, C.F.; Pandiselvam, R. Investigation on the influence of ultrasonic pretreatment on color, quality and antioxidant attributes of microwave dried Inula viscosa (L.). Ultrason. Sonochemistry 2022, 90, 106184. [Google Scholar] [CrossRef] [PubMed]
  94. Zhang, R.; Wang, Y.; Ma, D.; Ahmed, S.; Qin, W.; Liu, Y. Effects of ultrasonication duration and graphene oxide and nano-zinc oxide contents on the properties of polyvinyl alcohol nanocomposites. Ultrason. Sonochemistry 2019, 59, 104731. [Google Scholar] [CrossRef]
  95. Barabaszová, K.C.; Holešová, S.; Šulcová, K.; Hundáková, M.; Thomasová, B. Effects of ultrasound on zinc oxide/vermiculite/chlorhexidine nanocomposite preparation and their antibacterial activity. Nanomaterials 2019, 9, 1309. [Google Scholar] [CrossRef]
  96. Anžlovar, A.; Orel, Z.C.; Kogej, K.; Igon, M. Polyol-Mediated Synthesis of Zinc Oxide Nanorods and Nanocomposites with Poly(methyl methacrylate). J. Nanomater. 2012, 2012, 760872. [Google Scholar] [CrossRef]
  97. Rammah, Y.S.; El-Agawany, F.I.; Mahmoud, K.A.; El-Mallawany, R.; Ilik, E.; Kilic, G. FTIR, UV–Vis–NIR spectroscopy, and gamma rays shielding competence of novel ZnO-doped vanadium borophosphate glasses. J. Mater. Sci. Mater. Electron. 2020, 31, 9099–9113. [Google Scholar] [CrossRef]
  98. Alomairy, S.; Al-Buriahi, M.S.; Abdel Wahab, E.A.; Sriwunkum, C.; Shaaban, K. Synthesis, FTIR, and neutron/charged particle transmission properties of Pb3O4–SiO2–ZnO–WO3 glass system. Ceram. Int. 2021, 47, 17322–17330. [Google Scholar] [CrossRef]
  99. Sarno, M.; Cirillo, C. Production of nanocellulose from waste cellulose. Chem. Eng. Trans. 2019, 73, 1–6. [Google Scholar]
  100. Ogawa, Y.; Putaux, J.L. Transmission Electron Microscopy of Cellulose. Part 2: Technical and Practical Aspects. Cellulose; Springer: New York, NY, USA, 2019; Volume 26, pp. 17–34. [Google Scholar]
  101. Javed, A.H.; Shahzad, N.; Khan, M.A.; Ayub, M.; Iqbal, N.; Hassan, M.; Hussain, N.; Rameel, M.I.; Shahzad, M.I. Effect of ZnO nanostructures on the performance of dye sensitized solar cells. Sol. Energy 2021, 230, 492–500. [Google Scholar] [CrossRef]
  102. Muryani, B.Y.; Sarifah, N.; Kusumawardani, D.R.; Nurosyid, F. Effect concentration of dye solution binahong leaves to the efficiency of dye-sensitized solar cell (DSSC). In Proceedings of the International Conference on Science and Applied Science (ICSAS), Surakarta, Indonesia, 19 July 2019; pp. 020122-1–020122-4. [Google Scholar]
  103. Woodward, R.B.; Ayer, W.A.; Beaton, J.M.; Bickelhaupt, F.; Bonnett, R.; Buchschacher, P.; Closs, G.L.; Dutler, H.; Hannah, J.; Hauck, F.P.; et al. The total synthesis of chlorophyll a. Tetrahedron 1990, 46, 7599–7659. [Google Scholar] [CrossRef]
  104. Wu, N.; Wu, Y.; Walter, D.; Shen, H.; Duong, T.; Grant, D.; Barugkin, C.; Fu, X.; Peng, J.; White, T.; et al. Identifying the Cause of Voltage and Fill Factor Losses in Perovskite Solar Cells by Using Luminescence Measurements. Energy Technol. 2017, 5, 1827–1835. [Google Scholar] [CrossRef]
  105. Min, K.H.; Kim, T.; Kang, M.G.; Song, H.-E.; Kang, Y.; Lee, H.-S.; Kim, D.; Park, S.; Lee, S.H. An Analysis of Fill Factor Loss Depending on the Temperature for the Industrial Silicon Solar Cells. Energies 2020, 13, 2931. [Google Scholar] [CrossRef]
  106. Amadi, L.; Jenny, S.S.; Ahmed, A.; Brown, N.; Yadav, S.; Brown, D.; Ghann, W.; Gayrama, A.; Mintesinot Jiru, M.; Uddin, J. Creation of Natural Dye Sensitized Solar Cell by Using Nanostructured Titanium Oxide. Nanosci. Nanoeng. 2015, 3, 25–32. [Google Scholar] [CrossRef]
  107. Thube, S.G.; Nikale, V.M.; Patil, M.A. Measurement of solar constant using simple route. JETIR 2021, 8, 1362–1366. [Google Scholar]
  108. Hendry, E.; Koeberg, M.; O’Regan, B.; Bonn, M. Local Field Effects on Electron Transport in Nanostructured TiO2 Revealed by Terahertz Spectroscopy. Nano Lett. 2006, 6, 755–759. [Google Scholar] [CrossRef]
  109. Rojas, J.; Lopez, A.; Guisao, S.; Ortiz, C. Evaluation of several microcrystalline celluloses obtained from agricultural by-products. J. Adv. Pharm. Technol. Res. 2011, 2, 144. [Google Scholar] [CrossRef] [PubMed]
  110. Kothari, S.H.; Kumar, V.; Banker, G.S. Comparative evaluations of powder and mechanical properties of low crystallinity celluloses, microcrystalline celluloses, and powdered celluloses. Int. J. Pharm. 2002, 232, 69–80. [Google Scholar] [CrossRef] [PubMed]
Figure 1. Photographs of the preparation of (a) nanocellulose (PNC) and (b) chlorophyll.
Crystals 12 01771 g001
Figure 2. Definition of the photovoltaic parameters of a solar cell [10].
Crystals 12 01771 g002
Figure 3. (a) Schematic diagram of the proposed dye-sensitised solar cell. (b) Magnified view of the charge-injection process [55].
Crystals 12 01771 g003
Figure 4. DLS particle-size distribution curves of chlorophyll diluted with acetone and treated for ultrasonic treatment times of; (a) 0 min, (b) 5 min, (c) 10 min, and (d) 15 min.
Crystals 12 01771 g004
Figure 5. Plant NC Particle size diluted with water and treated with ultrasound for 20 min.
Crystals 12 01771 g005
Figure 6. Particle size distribution of ZnO nanoparticles diluted with water and treated with ultrasound for 5 min.
Crystals 12 01771 g006
Figure 7. ZnO nanoparticles FT-IR spectra of; (a) ZnO nanoparticles (black colour), (b) PNC (rouge colour), (c) chlorophyll/ZnO nanoparticles (yellow colour), and (d) chlorophyll/ZnO nanoparticles/PNC (green colour).
Crystals 12 01771 g007
Figure 8. SEM micrographs at different magnifications. (ad) Cellulose nanoparticles, (eh) ZnO nanoparticles, (i) electrolyte paste, and (j) electrolytic paste without ZnO.
Crystals 12 01771 g008aCrystals 12 01771 g008b
Figure 9. EDS spectra of (a) PNC, (b) nZnO, and the electrode paste (c) with and (d) without nZnO.
Crystals 12 01771 g009aCrystals 12 01771 g009b
Figure 10. Chlorophyll purity t evaluated by HPLC at 13,500 mAU.
Crystals 12 01771 g010
Figure 11. Zeta potential distribution of nano chlorophyll (a) and chlorophyll (b).
Crystals 12 01771 g011
Figure 12. Effect of the PNC content on (a) Voc and FF, and (b) Jsc and η.
Crystals 12 01771 g012
Figure 13. I-V curves of a nZnO-Chl/32wt%PNC DSSC under different sunlight intensities.
Crystals 12 01771 g013
Figure 14. Effect of plant NC wt.% on (a) Short-circuit current, (b) open-circuit voltage, (c) fill factor, and (d) efficiency measured at 15 s intervals within 0–60 s.
Crystals 12 01771 g014aCrystals 12 01771 g014b
Figure 15. Electrochemical analysis of nanomaterials for dye-sensitised solar cell (a) cyclic voltammetry, (b) 20 N cycles redox voltammograms, (c) amperometric detection, (d) Pulsed amperometric detection.
Crystals 12 01771 g015aCrystals 12 01771 g015bCrystals 12 01771 g015c
Table 1. Chlorophyll A structure variables.
VariableStructure
TypeChlorophyll A
Molecular FormulaC55H72O5N4Mg
C3 Group−CH=CH2
C7 Group−CH3
C8 Group−CH2CH3
C17 Group−CH2CH2COO-Phytyl
C17-C18 BondSingle
OccurrenceUniversal
Table 2. DSSC Photovoltaic parameters at various filter paper thicknesses and light intensities.
Filter Paper Thickness
(X = mm)
JSC
mAcm−2
Voc
mV
Jm
mAcm−2
Vm
mV
Vm*Jm(Voc X Jc)/A = PCell
W/cm2
PAM1.5
W/m2
FF
%
η
%
ηx
0.016.600.9614.670.5257.70212.451000.0
1366.0
0.7612.45
9.154
100
2.011.3930.7510.0510.5255.2779.741000.0
1366.0
0.6179.74
7.16
78.22
4.010.2830.758.965
8.674
0.525
0.525
4.707
4.554
9.711000.0
1366.0
0.611
0.591
9.71
7.14
77.92
6.08.1410.757.439
6.232
0.525
0.525
3.905
3.272
6.931000.0
1366.0
0.6396.93
5.11
55.66
8.06.9980.755.9450.5253.1215.951000.0
1366.0
0.6005.95
4.38
47.79
Publisher’s Note: MDPI stays neutral with regard to jurisdictional claims in published maps and institutional affiliations.