1. Introduction
For a few years, numerous methods have been investigated to obtain highly stable ecological energy sources and technologies. The photoelectrochemical (PEC) process has been considered one of the most interesting and capable procedures to harvest and produce sustainable eco-friendly energy, and can be utilized in a extensive range of industrial applications. The core challenge is to achieve stable and efficient long-term generation of photocurrents via PEC. Various semiconductors, such as ZnO, Bi
2WO
6, Fe
2O
3, and BiOI nanostructures, have been used as catalysts to produce charge carriers for catalytic surface reactions [
1,
2,
3,
4,
5,
6,
7,
8]. Recently, compounds containing bismuth, such as BiVO
4, BiOI, Bi
2O
3, and BiPO
4, have been utilized as electrode for PEC because of their enhanced oxidation ability [
4]. Bismuth oxyhalides, such as BiOCl, BiOBr, and BiOI, are particularly promising catalysts owing to their good electrocatalyst activities under irradiation. The photovoltaic ability of BiOI in solar cells makes it a suitable semiconductor [
9]. However, few researchers have studied the PEC performance of BiOI because of its low stability, low generation of photo-induced current densities, and fast degradation in aqueous solutions [
10,
11]. Various heterostructures based on BiOI nanostructures have been developed to improve the electrocatalyst activity [
9,
12,
13,
14]. This improvement is attributed to the suitable charge migration due to the phase structure and band characteristics of BiOI and the increased electron-hole separation by the inner electronic field in the heterostructure.
The main mechanism of heterostructures involves four key processes: Step 1, photon-harvesting; Step 2, carrier excitation; Step 3, e
− and h
+ separation and movement; and Step 4, surface reactions. The light-harvesting process of the semiconductors in Step 1 significantly depends on the morphology and structure of the photocatalyst. Light harvesting can be considerably increased by developing hierarchical structures; light is used more effectively through multiple reflections and scattering effects. In Step 2, the carrier excitation of the catalyst is significantly related to its distinctive band structure. A charge in the valence band of a photocatalytic material can be excited to its conduction band under illumination with photon energy that is greater than or the same as the optical band gap energy of a photocatalytic semiconductor, leaving a positive charge in the valence band. There are many ways to alter the band structure of a photocatalyst to use more visible light, such as by doping and hierarchical structures. In Step 3, opposed e
−—h
+ recombination in the bulk and on the catalyst surface is harmful to electron and hole separation and movement to the catalyst/interface sites. This is a significant factor for estimating the catalytic efficiency. Generally, charge recombination rates can be efficiently reduced by restricting the penetration length of the developed carriers or building electric fields, thereby considerably improving the catalytic activity. Finally, in Step 4, only energetically adequate charges travel to the catalyst surface, without loss on the surface states or heterostructures, and additionally encourage catalytic activity. In addition, the high onset potentials and slow carrier movement are two key factors controlling the surface catalytic reactions for surface-charge utilization. These two limiting features can be overwhelmed by an appropriate combination of two or more catalysts. Notably, the combined catalysts exhibit a supplementary feature in enhancing the catalytic strength and charge separation of semiconductors. Wang et al. studied a BiOI/TiO
2 heterostructure and achieved a current density of 0.13 mA cm
−2 in PEC [
15]. The catalytic activity of the BiOI/BiOBr sample was investigated by Lin et al. [
16]; they achieved a photocurrent of 0.028 A. Vinoth et al. [
14] synthesized a heterostructure of g-C
3N
4/BiOI and obtained a charge density of 600 mA cm
−2 in a combination electrolyte of 0.5 M Na
2SO
3 and NaHCO
3. The BiOI/WO
3 photoelectrodes demonstrated a charge density of 1.21 mA cm
−2 under illumination in 0.5 M Na
2SO
4 [
17]. The Bi
2MoO
6/BiOI heterojunctions synthesized for PEC applications observed a current density of 0.17 mA cm
−2 in 0.5 M Na
2SO
4 [
18]. Jiang et al. [
9] synthesized a ZnO/BiOI heterostructure and obtained a photocurrent density of 0.255 mA cm
−2. Therefore, in this study, BiOI nanostructures were combined with SnO
2 quantum dots (QDs) to enhance their stability in aqueous solutions and attain stable high photocurrents. The use of SnO
2 QDs decreased the recombination rate and increased the injection of produced H+ ions in a solid/liquid interface. The quantum confinement effect of SnO
2 as a catalytic site for photoelectrodes is outstanding for attaining enhanced transfer mechanisms, more active sites, and improved catalytic activity. A BiOI nanostructure modified with SnO
2 QDs can decrease the photocatalyst initiation energy and redox potentials to improve light utilization ability. In addition, the p–n junction heterostructure is crucial in the catalyst sector; the junction has been demonstrated as an effective charge separator because of the incorporated voltage with the path from an n-type to a p-type material [
19].
Furthermore, the PEC performance of the photocatalyst significantly depends on the existence of electrolyte ions to achieve stable and efficient photocurrents. To attain superior carrier pair generation, formation of a constructive interface among the surface of the photoelectrode and liquid electrolyte is required. The best aqueous electrolytes exhibit high ionic conductivity, high stability in an electrochemical environment, cost-effectiveness, and eco-friendliness [
20]. Restricted research has been conducted to establish the electrolyte effect on the heterostructures to achieve enhanced and stabilize PEC activity under illumination. Sreedhar et al. [
21] synthesized Bi
2Te
3@ZnO, studied the effect of various electrolytes, and observed that ion diffusion, ion conductivity, and electrolyte interactions significantly influenced the generation of photocurrents. Ding et al. [
22] observed that substantial change in surface catalysis was demonstrated in a type of electrolyte. The ion equivalent limiting conductivity, ion diffusion coefficient, and ionic conductivity of K+ (73.6 S cm
2 mol
−1, 1.960 m
2 s
−1, and 73.6 S cm
2 mol
−1) and OH- (197.9 S cm
2 mol
−1, 5.270 m
2 s
−1, and 197.9 S cm
2 mol
−1), are higher than those of Na
+ (50.0 S cm
2 mol
−1, 1.330 m
2 s
−1, and 50.0 S cm
2 mol
−1) and
(80.4 S cm
2 mol
−1, 1.07 m
2 s
−1, and 160.7 S cm
2 mol
−1), respectively. This study provides the first evidence of the electrolytic effect on the BiOI-SnO
2 heterostructure.
We synthesized BiOI, SnO2 QDs, and BiOI-SnO2 nanostructures and studied the heterostructure and electrolytic effects on the generation of photocurrents under illumination in 0.1 M KOH and 0.1 M Na2SO4 electrolytes. The maximum stable photo-induced current was observed for the BiOI-SnO2 heterostructure in the KOH electrolyte. It was higher than that of the Na2SO4 electrolyte due to a good interface between the bulk surface and the electrolyte, lower resistance values, and enhanced charge-transfer kinetics.
3. Results and Discussion
The crystal phases of BI, SN, and BI-SN nanostructures are shown in
Figure 1. From the XRD analysis, the BI nanostructures exhibited a tetragonal crystal system as described in JCPDF file No.:10-0445. The corresponding reflected peaks were observed at 23.99° (002), 29.30° (102), 31.82° (110), 37.21° (103), 42.09° (113), 46.10° (104), 49.88° (005), 55.38° (212), 60.18° (115), 66.57° (220), and 76.43° (310); the achieved crystalline structure of BI is in good agreement with the literature [
23,
24]. The characteristic peaks of SN were detected at 26.43° (110), 33.87° (101), 51.52° (211), and 64.50° (112), and exhibited a tetragonal crystal system, as described in JCPDF file No.:77-0448. Furthermore, a combination of the characteristic peaks of BI and SN for their heterostructure indicated a strong interaction between the nanostructures. In addition, no contamination peaks noticed in the phase analysis indicate that the synthesized structures were of high purity.
SEM images of BI, SN, and BI-SN are present in
Figure 2.
Figure 2a shows the morphology of the pristine BI sample, a marigold-flower-like nanostructure with well-established flower petals was observed. The morphology of the SN sample can be noticed in
Figure 2b as agglomerated QDs. The BI-SN heterostructure showed a morphology similar to that of pristine BI, with SN QDs well-distributed over the surface of the flower petals, as displayed in
Figure 2c. Moreover, the SN distribution did not destroy the pristine morphology of BI during the formation of the heterostructures.
Furthermore, HR-TEM and selected area electron diffraction (SAED) analyses were performed to investigate the distinguishing features of the nanostructures on the BI, SN, and BI-SN heterostructures, as shown in
Figure 3.
Figure 3a,b shows the HR-TEM image of the pristine BI sample, showing a morphology similar to that observed by SEM. The estimated lattice fringe width of the BI sample (0.283 nm) is shown in
Figure 3b. The HR-TEM images of the SN sample are shown in
Figure 3d,e, which shows a fine QD structure. The estimated lattice fringe width (0.33 nm) is shown in
Figure 3e. The BI-SN heterostructure morphology images obtained by HR-TEM are shown in
Figure 3g,h. These images indicate a strong interaction of SN on the surface of the BI flower petals, with a lattice fringe width similar to those of the pristine BI and SN samples. The SAED analyses of the BI, SN, and BI-SN samples are shown in
Figure 3c,f,i. A dotted line pattern in a unique direction, referred to as plane growth, was identified in the SAED analysis of BI (
Figure 3c). The SN QDs showed a circular ring pattern in the SAED analysis, as shown in
Figure 3f. The mixture of dotted lines and circular ring patterns identified in the heterostructure of BI-SN represents a good interaction between the two, as shown in
Figure 3i. This strong interaction between BI and SN can enhance the catalytic activity of the heterostructures [
25]. In addition, the elemental distribution of the BI-SN heterostructure was investigated by EDS attached to the HR-TEM, as shown in
Figure 4.
Figure 4a–e shows the elemental mapping of the BI-SN sample, representing a highly uniform distribution of core elements, such as Bi, I, O, and Sn, in the scanned area. It was proven that the SN QDs were well dispersed over the surface of the BI nanostructures.
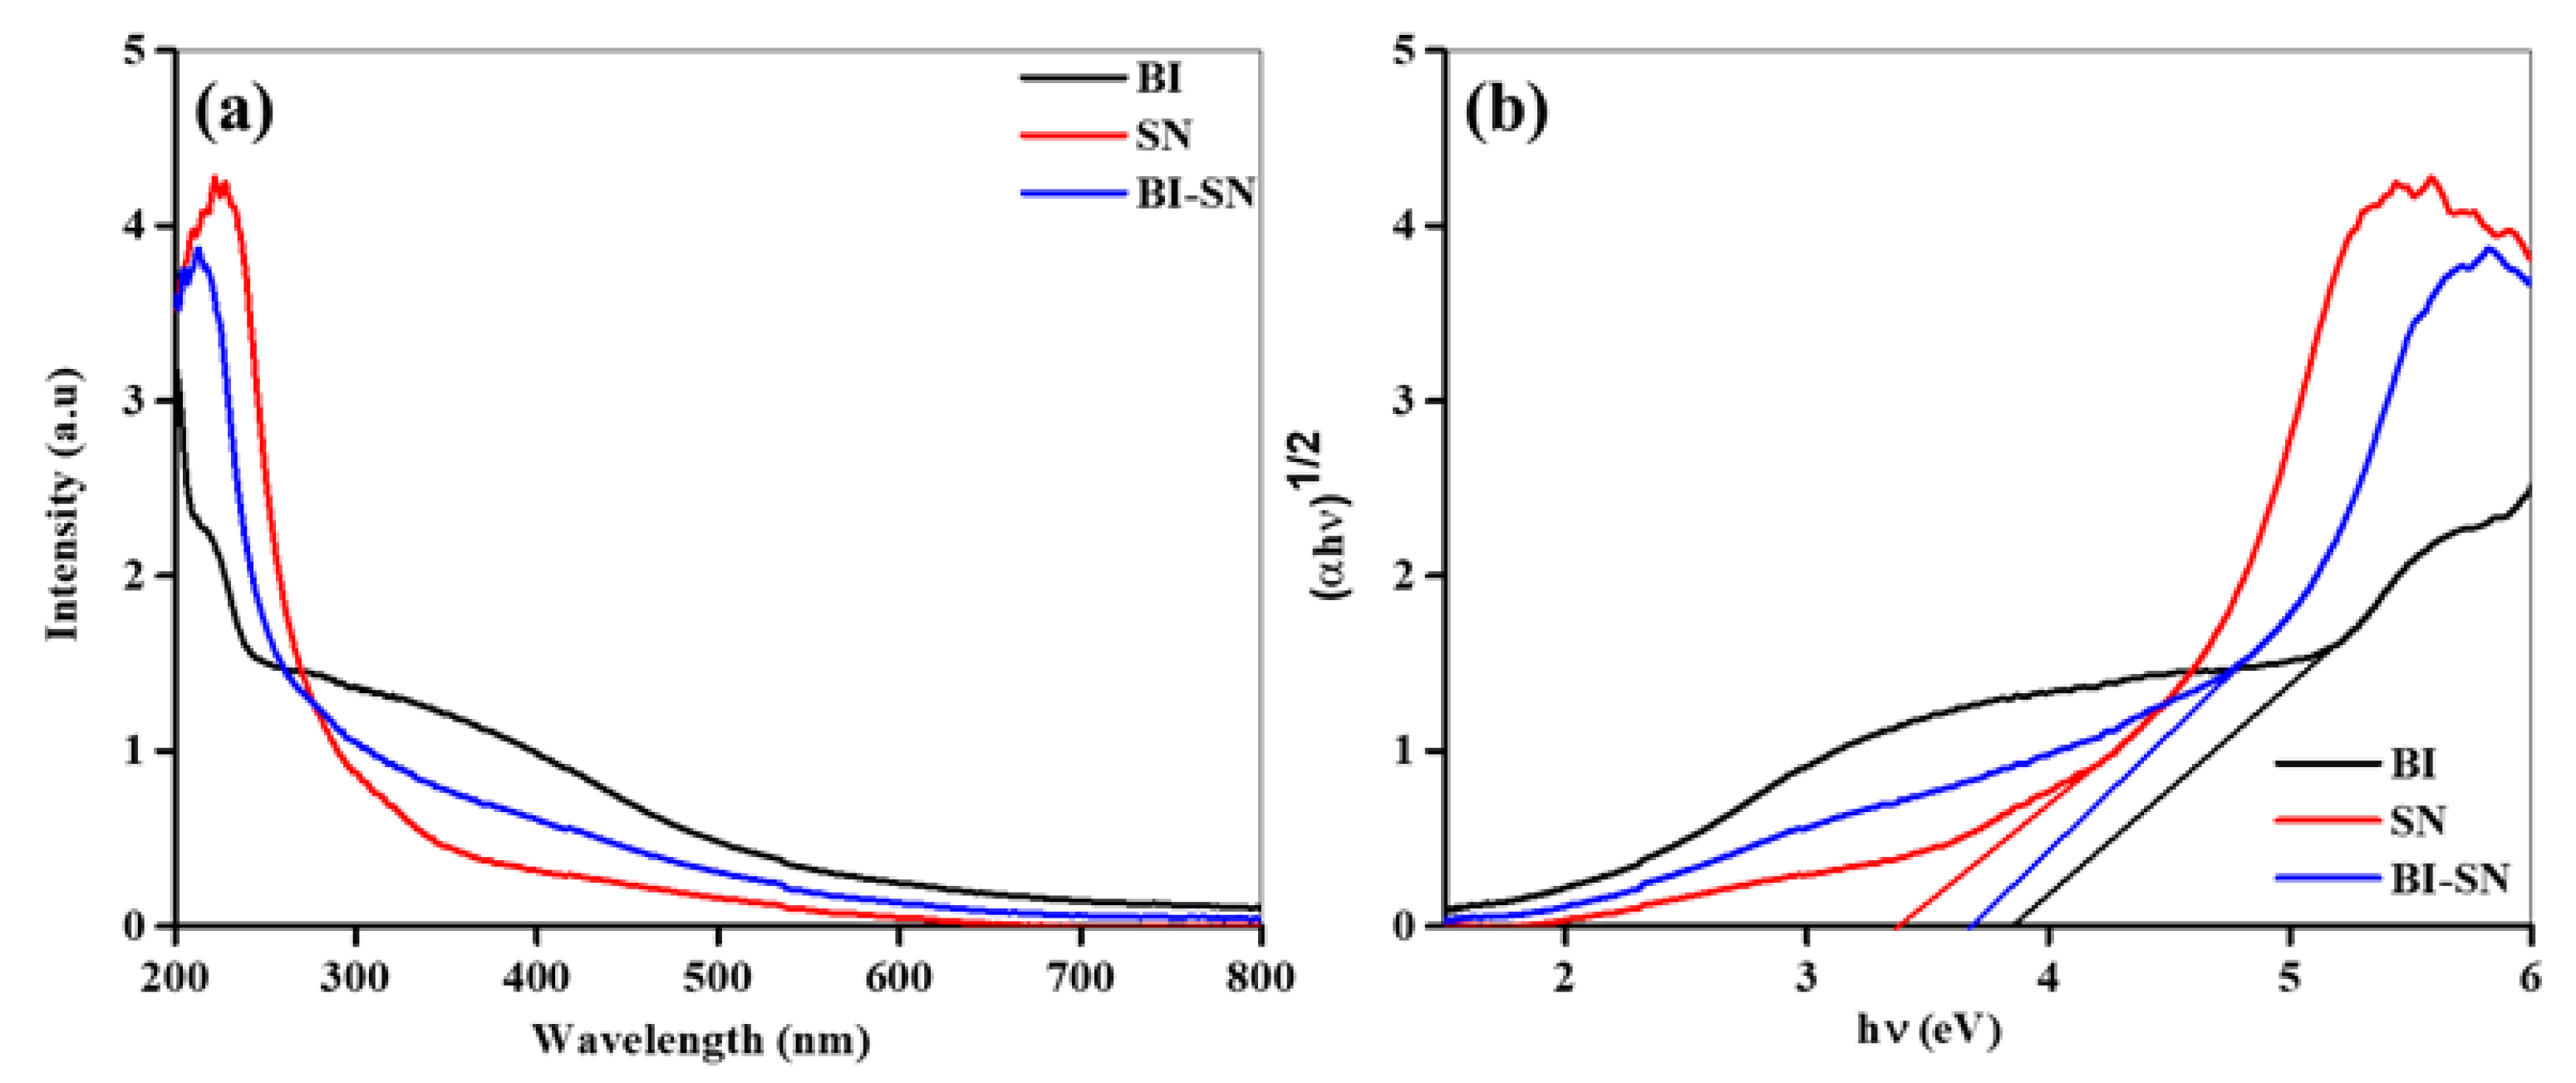
The optical properties of the BI, SN, and BI-SN nanostructures are shown in
Figure 5a,b. The strong absorption showed by the synthesized samples between 210 nm and 600 nm indicates that the materials exhibited PEC activity in the visible region (
Figure 5a). In the visible region, the absorption capability of the BI-SN heterostructure was considerably increased associated with that of the pristine BI sample. The bandgaps of the prepared samples were assessed from their absorption data, as shown in
Figure 5b. The calculated optical bandgaps of the BI, SN, and BI-SN nanostructures were 3.85, 3.40, and 3.60 eV, respectively.
The chemical states of the BI, SN, and BI-SN nanostructures were determined using XPS, as shown in
Figure 6,
Figure 7 and
Figure 8. The survey spectra of the BI, SN, and BI-SN structures are presented in
Figure 6a; only the peaks of Bi, I, Sn, and O indicate the purity of the synthesized catalyst. The XPS spectra of Bi4f for the BI and BI-SN nanostructures are shown in
Figure 6b,c; the two main peaks at energies of 158.4 and 163.8 eV were attributed to Bi4f
7/2 and Bi4f
5/2, respectively, confirming a Bi
3+ state of Bi in BI and BI-SN [
17].
The characteristic peaks noticed at 618.3 and 629.8 eV in
Figure 7a,b were attributed to I3d
5/2 and I3d
3/2 for the BI and BI-SN samples, respectively [
26]. Sn3d core peaks for the SN and BI-SN samples were shown in
Figure 7c,d, with the binding energies centered at 486.3 and 494.7 eV ascribed to Sn3d
5/2 and Sn3d
3/2, respectively. This represents the Sn
4+ state of the SN and BI-SN samples. The O 1s core peaks for the BI, SN, and BI-SN nanostructures are shown in
Figure 8a–c; the peaks were resolved into many peaks at energies of 529.1, 530.4, and 531.5 eV, attributed to Bi-O bonds, I-O bonds, and O-H bonds, respectively [
27].
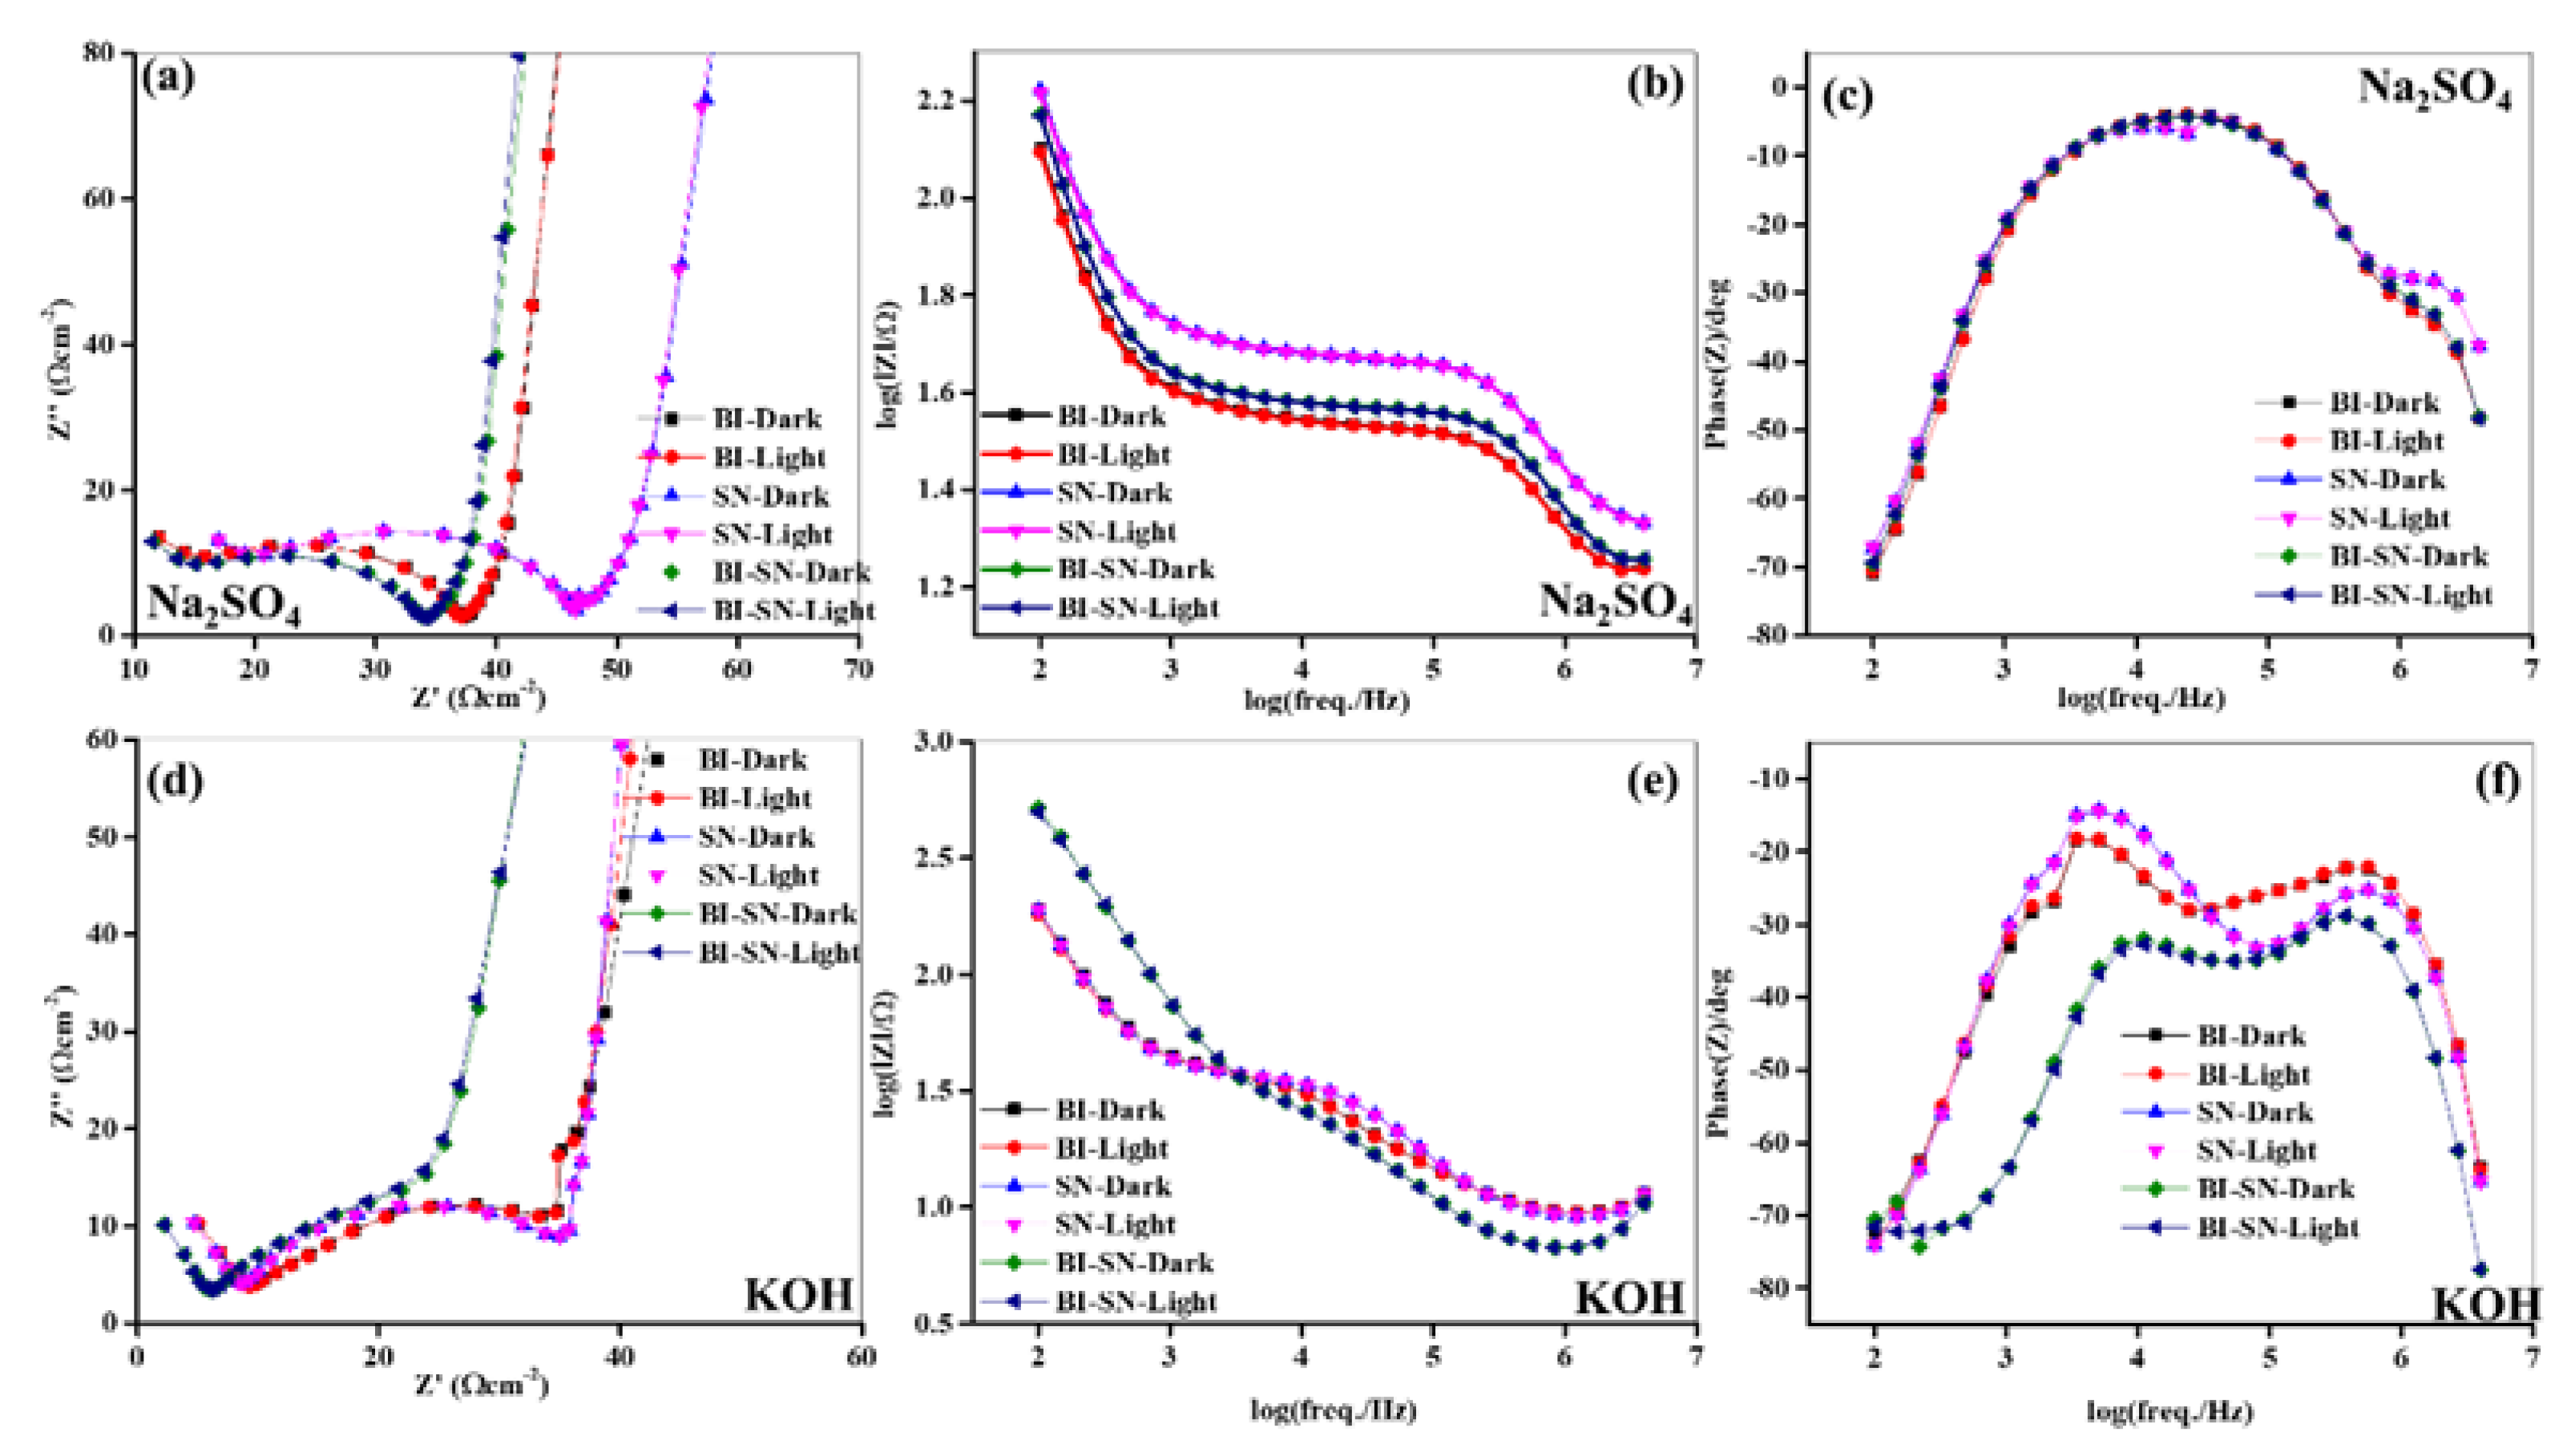
The electrolyte effect on the synthesized photoelectrodes, charge carrier transfer, and separation kinetics at the solid/liquid interface of the fabricated anodes was examined by electrochemical impedance spectroscopy (EIS). The recorded plots for all the electrodes under dark and light illumination in 0.1 M of both Na
2SO
4 and KOH electrolytes are shown in
Figure 9. In general, the EIS spectra contain three regions: (1) the resistance arises owing to the electrolyte solution; (2) bulk resistance occurs due to the development of an interface between the electrode surface and electrolyte, and the charge-transfer resistance; (3) diffusion occurs owing to ion transfer among the electrode surface and solution (
Figure S2). The plots acquired from EIS for all the prepared photoelectrodes showed a semicircular and inclined line at low and high frequencies under the dark and light states in both electrolytes (
Figure 9a,d). However, a change in the radius of the semicircle was observed for electrodes in both electrolytes, indicating various conductivities of the different photoelectrodes. In both electrolytes, the semicircle radius of the electrodes acquired in the dark state was larger than that in the illuminated state, which indicates that the anodes responded well to the incident photons. However, the radius of the semicircle for all the photoelectrodes in the KOH electrolyte was significantly smaller than that in the Na
2SO
4 electrolyte, showing that the catalyst exhibited strong interface contact with low resistance. This could be useful for charge generation, reduced charge recombination, and transfer kinetics. The lowest radius of the semicircle was obtained for BI-SN heterostructures in the KOH electrolyte under the light state, indicating that BI-SN has higher transfer kinetics than the BI and SN samples. To better understand the kinetics of the anodes, the recorded Nyquist plots were fitted with an equivalent model for all the samples under dark and light states in both electrolytes, as shown in
Figure S3. The physical model consists of electrolyte resistance (R1), bulk charge-transport resistance (R2), charge-transfer resistance (R3), bulk capacitance (C1), and Helmholtz capacitance (C3). The physical values for the BI, SN, and BI-SN samples under ON/OFF conditions in 0.1 M Na
2SO
4 and KOH are given in
Table 1. R1 in the physical model is demonstrated because of the occurrence in interfaces between the working electrode surface and electrolyte, which are critical for charge transportation. For the electrochemical activity, low R1 values exhibit better charge-transfer kinetics to obtain improved catalytic activity. Otherwise, the accumulation of charge occurs at the interface of the catalyst surface and solution, causing low electrochemical activity owing to poor immigration of charge carriers between the bulk surface and aqueous electrolyte. Here, the values of R1 in the OFF state were lower than those in the illumination state for all the anodes in both aqueous electrolytes. This signified that the nanostructures generated carrier pairs for catalytic activity. However, the monostructures of BI and SN showed higher R1 values than those of the BI-SN heterostructures in both electrolytes, which may be due to their larger surface area [
28]. In addition, the R1 values in the KOH electrolyte were much lower than those in Na
2SO
4 in both the dark and light states. This difference is because the ionic conductivity, electrical conductivity, ion diffusion, and equivalent limiting conductivity of K
+ and OH
− ions were greater than those of Na
+ and
ions [
29]. The lowest R1 value (4.58 Ω cm
−2) was observed for the BI-SN heterostructures in KOH electrolyte under light irradiation, indicating that the heterostructure formed a good interface with the electrolyte. This enhanced the charge carrier generation via photoelectrochemical activity. The R2 values of all synthesized electrodes in both electrolytes were smaller in the light state than in the dark state. This indicated that under the light state, several charge carrier pairs were generated. Furthermore, the BI-SN heterostructure showed lower R2 values than those of the BI and SN samples in both electrolytes. The decrease in R2 values signifies that the heterostructures can considerably reduce the recombination rate, which directly promotes catalytic activity. The R2 values in the KOH electrolyte were lower than those in the Na
2SO
4 electrolyte in both states, which may be due to the greater ion diffusion and conductivity. The lowest R2 value (25.75 Ω cm
−2) was noticed for the BI-SN heterostructure in the ON state in the KOH electrolyte, when compared with others under various conditions. The charge-transfer resistance values of all the photoelectrodes were higher in the dark state than in the light state for both electrolytes. This signified that the catalysts responded better to the photon and generated charge carrier pairs. However, the R3 values in the KOH electrolyte were smaller than those in the Na
2SO
4 electrolyte because the ionic conductivity, electrical conductivity, ion diffusion, and equivalent limiting conductivity of the K
+ and OH
− ions were greater than those of the Na
+ and
ions. The R3 value of the BI-SN sample was much lower than those of the pristine samples in both the electrolytes. The lowest R3 value (471 Ω cm
−2) was observed for the BI-SN nanostructures under the light state in the KOH electrolyte; it exhibited good charge-transfer kinetics compared with other samples at various conditions. The C1 values of all the electrodes were three orders of magnitude lower than the C3 values under the ON/OFF states in both electrolytes. After the enrichment of the recombination rate of the electrode, minor charge separation in the space charge layer occurred in BI and SN. This was consistent with the R2 values. The C1 and C3 values of all electrodes were higher in the KOH electrolyte than in the Na
2SO
4 electrolyte, under both the dark and light states, owing to the higher conductivity and diffusivity of the KOH electrolyte. The highest C1 value of the BI-SN nanostructures, when compared with the BI electrode, was 195 μF in the KOH electrolyte in the light state. This was due to the heterostructure development that avoided charge accumulation at the interface. The C3 values of all electrodes indicated the capacity of charge transmission from the surface of the synthesized photoelectrodes to the electrolyte. The C3 values of the synthesized electrodes in the KOH electrolyte were larger than those in the Na
2SO
4 electrolyte in both states, owing to the good conductivity and diffusivity of KOH. The BI-SN electrode showed a larger C3 value than the BI and SN electrodes. This resulted in a greater accumulation of charges at the BW-SO/solution interface than at the other electrodes [
30]. Consequently, this analysis proposes that the BI-SN electrode can produce enhanced currents under light in the KOH electrolyte. In addition, stability of formation of the catalysts (can be noticed in XPS analysis) enhances the electrochmical behaviour of the synthesized samples, which was proved in the EIS analysis. Furthermore, the Bode impedance plots of all the synthesized electrodes under the dark and light states in KOH and Na
2SO
4 are shown in
Figure 9b,e. The impedance of the BI-SN heterostructure shifted toward the low frequencies compared with that of the pristine samples, which could be related to the prompt generation and enhanced transfer of charge carriers. This impedance was more significant in the KOH electrolyte than in the Na
2SO
4 electrolyte because of the improved conductivity and diffusivity properties of KOH. This enhancement was reasonable for the reduction of the recombination rate in hybrid structures [
31].
Figure 9c,f shows the Bode phase analysis of the fabricated electrodes under the ON/OFF conditions in both electrolytes. For the BI-SN electrode, particularly in the KOH electrolyte, the peak frequency shifted to a low value, which suggested a better lifetime of electrons than in the BI and SN electrodes. This indicated that the dispersion of SN on the BI surface promoted charge separation and enhanced the electron lifetime [
32]. A significant peak frequency shift was observed for the KOH electrolyte compared to that for the Na
2SO
4 electrolyte for the synthesized electrodes under the dark and light states. This could be owed to the greater diffusion kinetics and conductivity properties of K
+ and OH
− ions when compared with Na
+ and
ions.
Tafel analyses of the BI, SN, and BI-SN nanostructures recorded in the Na
2SO
4 and KOH electrolytes under the ON/OFF conditions are presented in
Figure 10a,b. The electrons of the synthesized electrodes under the light state migrated toward the anode in the Na
2SO
4 and KOH electrolytes associated with the dark state. This indicates that the synthesized photoelectrodes produced more charge carrier pairs, which significantly enhanced their catalytic activity. A more anodic shift was observed in the KOH electrolyte than in the Na
2SO
4 electrolyte. The Tafel plots of the catalysts under dark/light states in both electrolytes were fitted to obtain Tafel slopes, as shown in
Table 2.
A lower Tafel slope indicates that the catalysts require lower voltage to produce charge pairs. For the synthesized electrodes, lower Tafel slopes were observed for the KOH electrolyte in the dark and light states than for the Na
2SO
4 electrolyte. In addition, the achieved slopes under the light states exhibited lower values than those of the dark states in both electrolytes. The BI-SN sample exhibited lower Tafel slopes than the BI and SN samples in both the electrolytes. The small Tafel slope of 48.2 mV dec
−1 was achieved for the BI-SN heterostructure in the KOH aqueous electrolyte under the light state. This indicates that the heterostructure produced more induced charge carriers. Therefore, the BI-SN heterostructures have enhanced charge kinetics [
33]; the comparison table of Tafel analysis with the reported various nanostructures is given in
Table S1 and could demonstrate enhanced catalytic activity under the light state.
Linear sweep voltammetry analyses of the synthesized BI, SN, and BI-SN photoelectrodes under the ON/OFF states in both electrolytes are given in
Figure 11. The linear sweep voltammetry plots indicate that the substantial deviation in the generation of photo-induced current densities for different photoelectrodes is greatly dependent on the photocatalyst nanostructure and type of electrolyte. A photocatalyst normally requires more active sites at the catalyst/solution interface and high stability to generate the highest current densities. In addition, the electrolyte should possess good ionic conductivity and high diffusion behavior, which could improve charge-transfer kinetics at the interfaces. The BI-SN nanostructures showed enhanced current densities under the light states compared to the BI and SN electrodes in both electrolytes (
Figure 11a,b). However, all the synthesized electrodes showed well-distinguished photocurrents generated in the KOH electrolyte under the light state when compared to the Na
2SO
4 electrolyte, owing to the lower resistance values, ionic conductivity, diffusivity, and better light absorption activity. These outcomes are supported by the ΔJ values estimated from the difference in the current densities under the ON/OFF conditions. The ΔJ values of the BI-SN sample showed a maximum charge density of 1.39 mA cm
−2 compared to the other electrodes under various conditions, owing to its well-organized morphology with a combination of BI and SN nanostructures and enlarged active sites of the BI-SN electrode, to achieve the highest current densities. Furthermore, the observed current densities of the BI-SN photoelectrode were 1.2 and 1.6 times greater than those of the BI sample in the Na
2SO
4 and KOH electrolytes, respectively. The BI electrodes generated the lowest current densities owing to their large resistance values (R1, R2, and R3) in both electrolytes. Therefore, the development of the BI-SN hetero-nanostructures empowered large active sites, decreased the resistance values, and permitted better charge-transfer kinetics, which enhanced the current density under illumination.
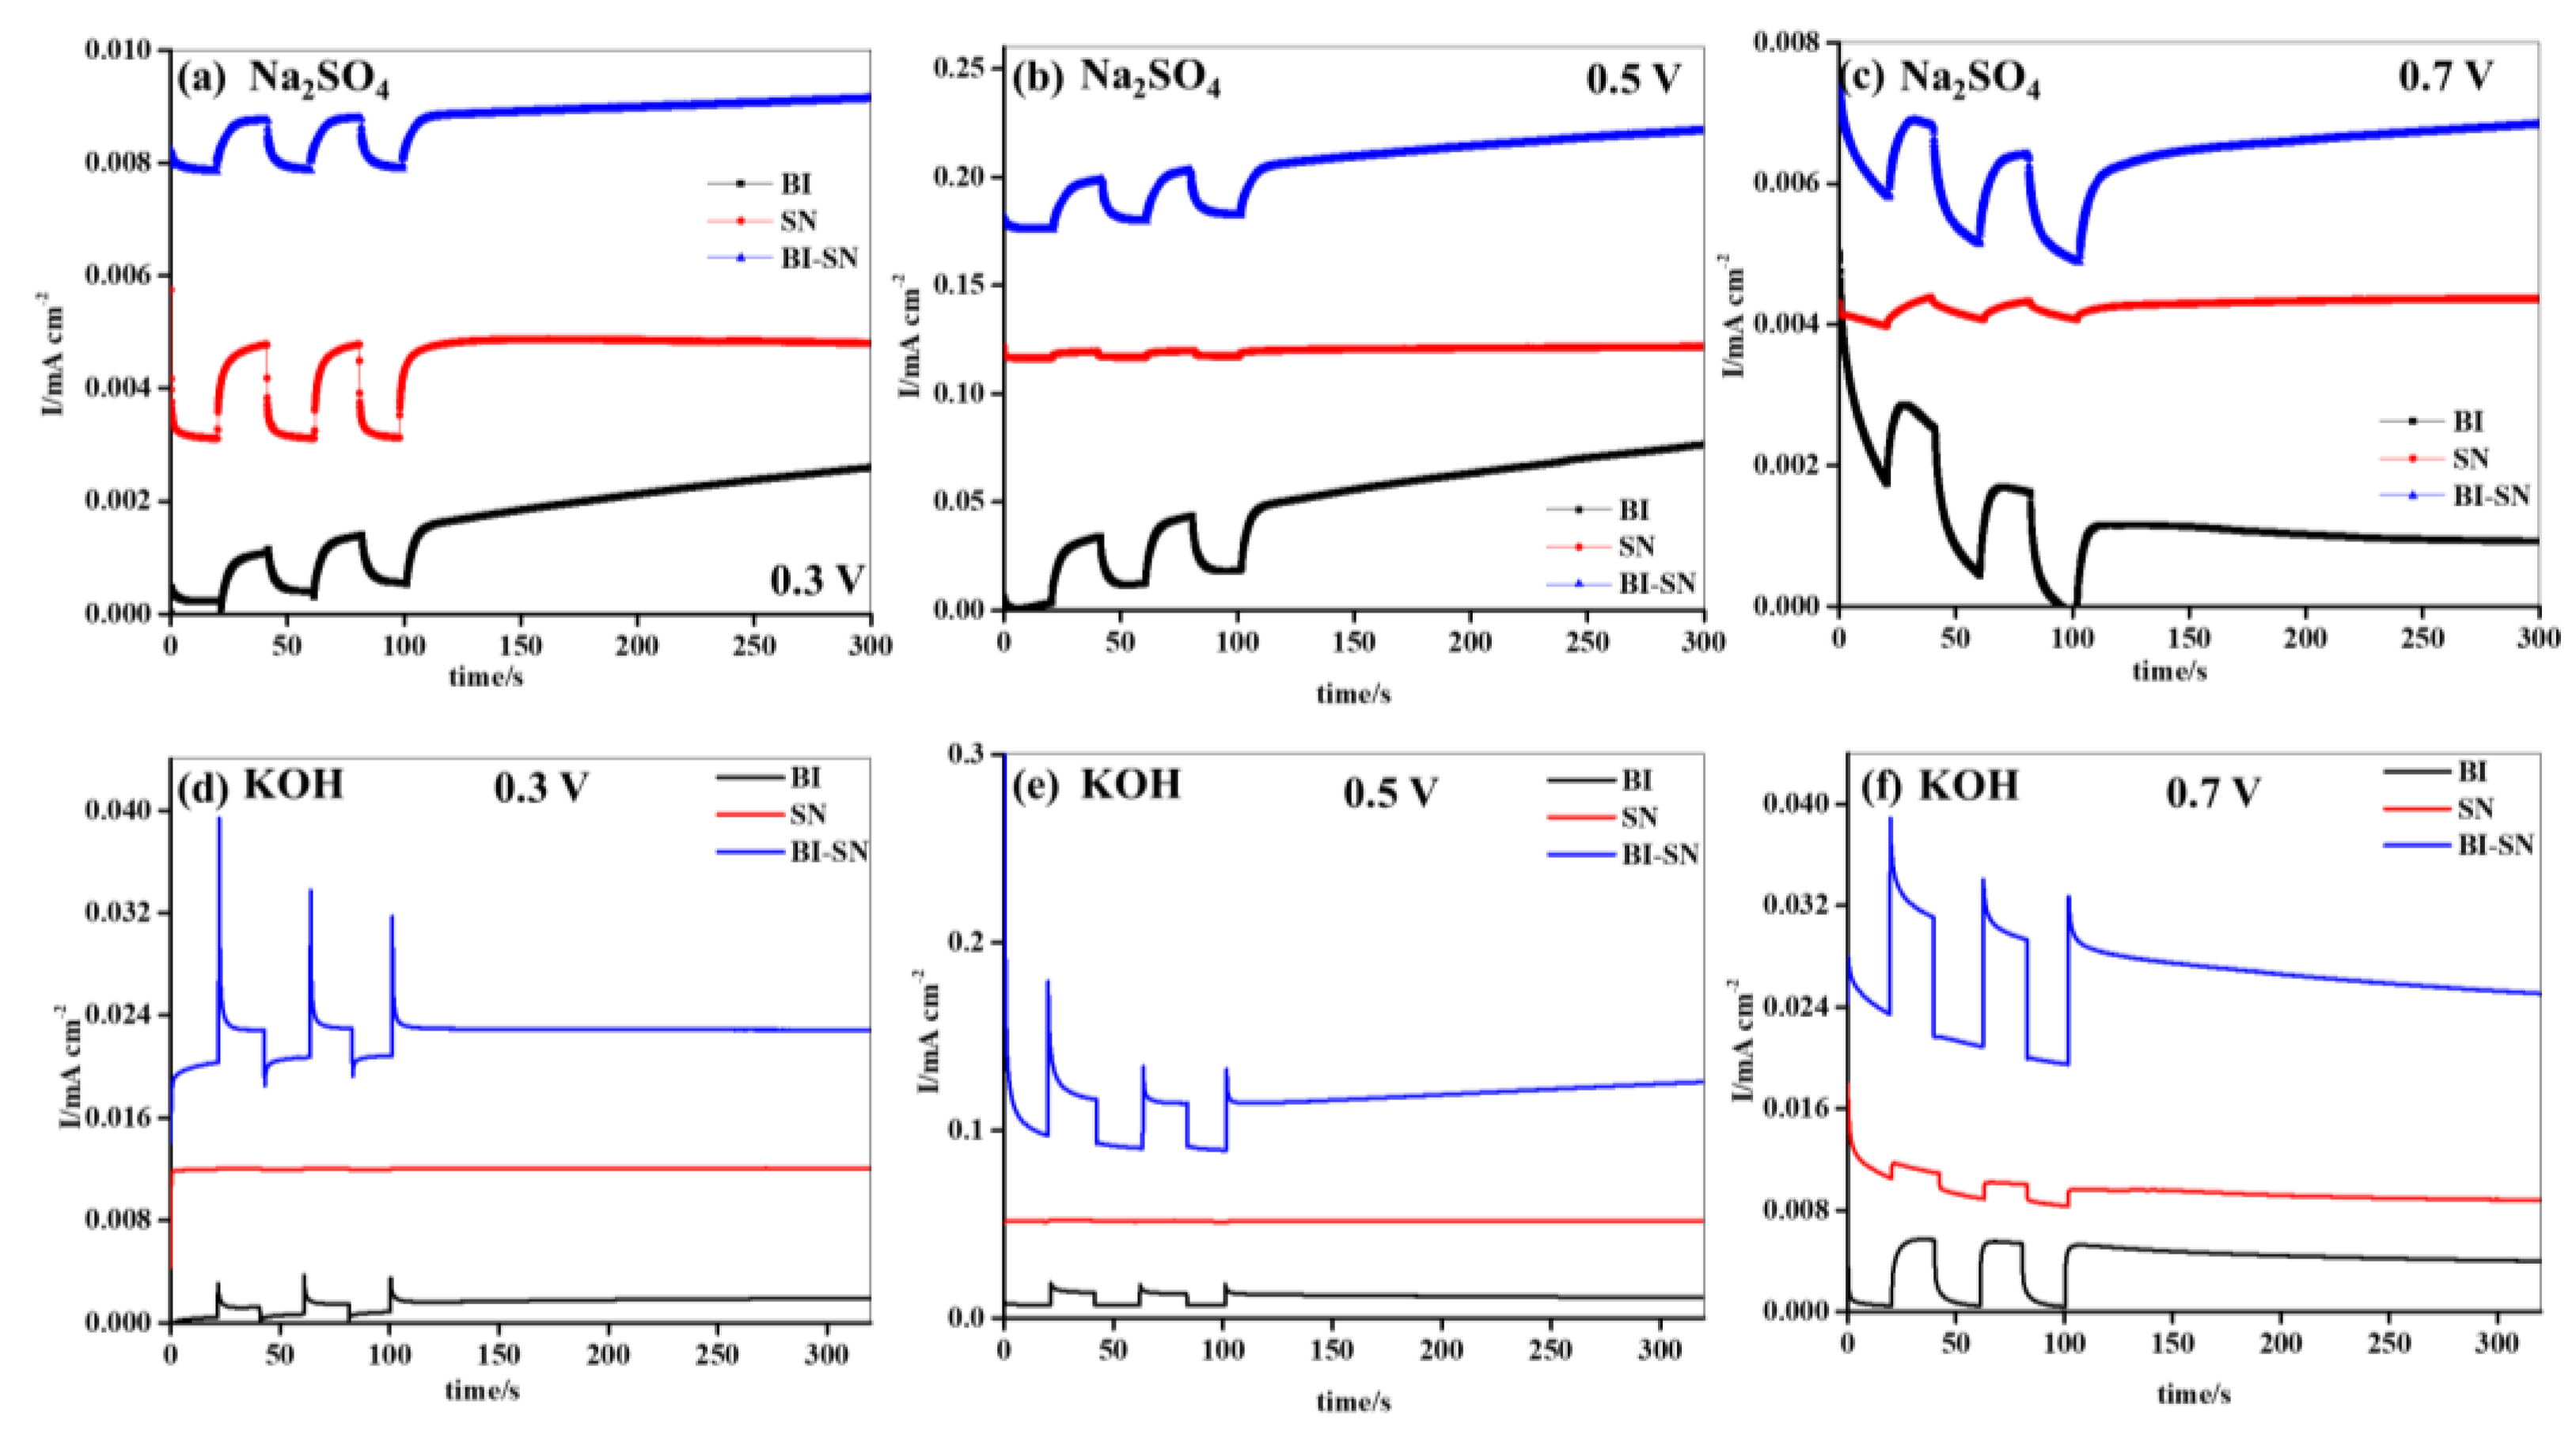
Chronoamperometry analysis of the synthesized BI, SN, and BI-SN photoelectrodes was performed at different applied voltages in the Na
2SO
4 and KOH electrolytes, as shown in
Figure 12. All the synthesized electrodes showed clear switching behavior with the ON and OFF states at all applied voltages in both electrolytes.
Figure 12a–f shows a chronoamperometry analysis of BI, SN, and BI-SN samples at a voltages of 0.3, 0.5, and 0.7 V, respectively, with switching behavior in the Na
2SO
4 and KOH electrolytes. The generation of current in the light state was observed to be strongly dependent on the applied voltage. The enhanced charge density achieved at the applied voltage of 0.5 V was observed for the synthesized electrodes in both electrolytes. However, the photoelectrodes exhibited better photo-induced currents in the KOH electrolyte than in the Na
2SO
4 electrolyte, owing to the low resistance values of the electrodes and better ionic conductivity of the KOH electrolyte. Nevertheless, the BI-SN photoelectrode generated the highest currents at various applied voltages compared to the BI and SN electrodes in the Na
2SO
4 and KOH electrolytes. This could be due to the formation of heterostructures with a combination of BI and SN, decreased resistance values, improved active sites, transfer kinetics, lower recombination rate, and increased capacitance behavior. Therefore, the BI-SN heterostructure produced the highest currents at a voltage of 0.5 V when compared with the others under various conditions. The generated photo-induced currents of BI, SN, and BI-SN photoelectrodes at various applied potentials are as follows: 0.3 V < 0.5 V > 0.7 V.
The generation of photocurrents of the BI-SN is schematically shown in
Figure 13. Under illumination state, the photoelectrode absorbs a photon energy, produces a cloud of negative electrons and positive holes on the electrode surface, and further separation of charges occur due to the variation of work function. The holes moves to the surface of the anode and generates oxygen from the liquid electrolyte. At the same time, the generated electrons move towards the Pt electrode and produce a hydrogen. Therefore, the BI-SN increases the light absorption ability due to the synergistic effect of the anodes [
34,
35]. Thereby enhancing the production of charge pairs and improving the photoelectrochemical activity.


