Article

Statistical Damage Constitutive Model for High-Strength Concrete Based on Dissipation Energy Density

1
School of Civil Engineering and Architecture, Anhui University of Science and Technology, Huainan 232001, China
2
School of Resources and Environmental Engineering, Anhui University, Hefei 230022, China
*
Author to whom correspondence should be addressed.
Crystals 2021, 11(7), 800; https://doi.org/10.3390/cryst11070800
Submission received: 24 May 2021 / Revised: 23 June 2021 / Accepted: 28 June 2021 / Published: 8 July 2021
(This article belongs to the Special Issue New Frontiers in Cementitious and Lime-Based Materials and Composites)

Abstract

:
To study the energy evolution law and damage constitutive behavior of high-strength concrete based on the conventional triaxial compression tests of C60 and C70 high-strength concrete subjected to five different confining pressures, the failure characteristics of high-strength concrete are analyzed at different confining pressures, and the evolution of the input energy density, elastic strain energy density, and dissipation energy density with axial strain and confining pressure are quantified. Combined with a continuous damage theory and non-equilibrium statistical method, the ratio of dissipation energy density of concrete to dissipation energy density corresponding to peak stress is used as the mechanical parameter. Assuming that the mechanical parameter obeys the Weibull distribution laws, the statistical damage variable describing the damage characteristics of concrete were derived. According to the Lemaitre strain equivalent principle, the damage variable is introduced to the generalized Hooke law to establish the statistical damage constitutive model for high-strength concrete. The results show that: (1) the input energy density and dissipation energy density increases with the increase of axial strain, while the elastic strain energy density increases first and then decreases as a function of the axial strain and reaches the maximum value at the peak stress; (2) the input, elastic strain, and dissipated energy densities corresponding to the peak stress of the two high-strength concretes all increase as a function of confining pressure, and the elastic strain energy density corresponding to the peak stress increases linearly as a function of the confining pressure; (3) the statistical damage constitutive model results of C60 and C70 high-strength concrete are in good agreement with the test results, and the average relative standard deviations are only 3.64% and 3.99%. These outcomes verify the rationality and accuracy of the model.

Graphical Abstract

1. Introduction

With the application of high-strength concrete in civil engineering, transportation, water conservancy, municipal engineering, and other engineering fields, it is of great significance to study the deformation law and failure characteristics of high-strength concrete subject to complex stress states aiming to improved scientific designs of concrete buildings (structures) and to the guarantee of their safety [1,2]. High-strength concrete is a type of composite material composed of sand, stone, cementing material, and water, mixed based on specific analogies. Owing to the incompleteness of vibration, incomplete hydration reaction, and temperature effects, there are a large number of discontinuity and irregular shape cracks and joints in the interior of high-strength concrete. The deformation and mechanical characteristics of high-strength concrete are obviously nonlinear and discontinuous. This leads to the complexity of micro-structure and macro-strength evolution of high-strength concrete at different ages and complex stress conditions. It is difficult to effectively judge the strength change and failure behavior of concrete materials by using classical elastic–plastic theory. Numerous research studies have shown that the failure of materials is a state instability phenomenon driven by energy, and the transmission and transformation of energy are the fundamental reasons for the deformation and failure of materials [3,4]. Therefore, the energy method based on thermodynamic theory is an effective way to study the constitutive relationships and failure behaviors of concrete materials.
The constitutive relationship constitutes the basis for the study of the relationship between material deformation and load. Ever since the proposition of the parallel bar system (PBS) model for the concrete uniaxial tensile process in 1982 by Krajcinovic [5], statistical damage theory has gradually become a new research hotspot of concrete damage mechanics. Yang et al. [6] proposed a statistical damage constitutive model of multi-size polypropylene fiber concrete under impact load and obtained the statistical parameters based on the particle swarm optimization algorithm. Bai et al. [7] assumed that there are two damage mechanisms of fracture and yield in the meso-structures of quasi-brittle materials, and established a triaxial orthotropic statistical damage model for concrete that can predict its constitutive behavior at complex loading environments. Based on Weibull and lognormal statistical distribution theory and Lemaitre’s strain equivalent principle, Liang Hui et al. [8] established a sectional uniaxial compression damage constitutive model of concrete materials by introducing the strain-rate factor. Cervera [9] established a rate-independent isotropic damage constitutive model of concrete, and used the model to conduct seismic analysis of concrete dams. Zhou [10] investigated the compression behavior of coral aggregate concrete (CAC) at uniaxial and triaxial loading, and proposed a constitutive model for coral aggregate concrete subjected to uniaxial and triaxial compression, wherein the suggested models correlated well with the test results. Wu [11] established the plastic damage constitutive relation with the internal variables based on the continuum damage mechanics, and proposed an energy release rate-based plastic-damage model for concrete. The aforementioned studies showed that the constitutive behavior of concrete materials can be studied from the perspective of statistics, but at present, most studies use the mechanical or deformation parameters of concrete materials as the basis for establishing statistical damage constitutive equations, and few studies have introduced the energy dissipation density parameter into the constitutive relationship.
To study the energy evolution law and damage constitutive behavior of high-strength concrete subjected to complex stress states, conventional triaxial compression tests at different confining pressures were conducted with ZTCR-2000 rock triaxial testing system. The evolution law of input energy, elastic strain energy and dissipation energy with axial strain and confining pressure were analyzed. Based on the continuum damage theory and non-equilibrium statistical method, a statistical damage constitutive model was established for high-strength concrete based on the use of the ratio of dissipation energy density of concrete to the dissipation energy density that corresponded to peak stress.

2. Conventional Triaxial Compression Tests of C60 and C70 High-Strength Concrete

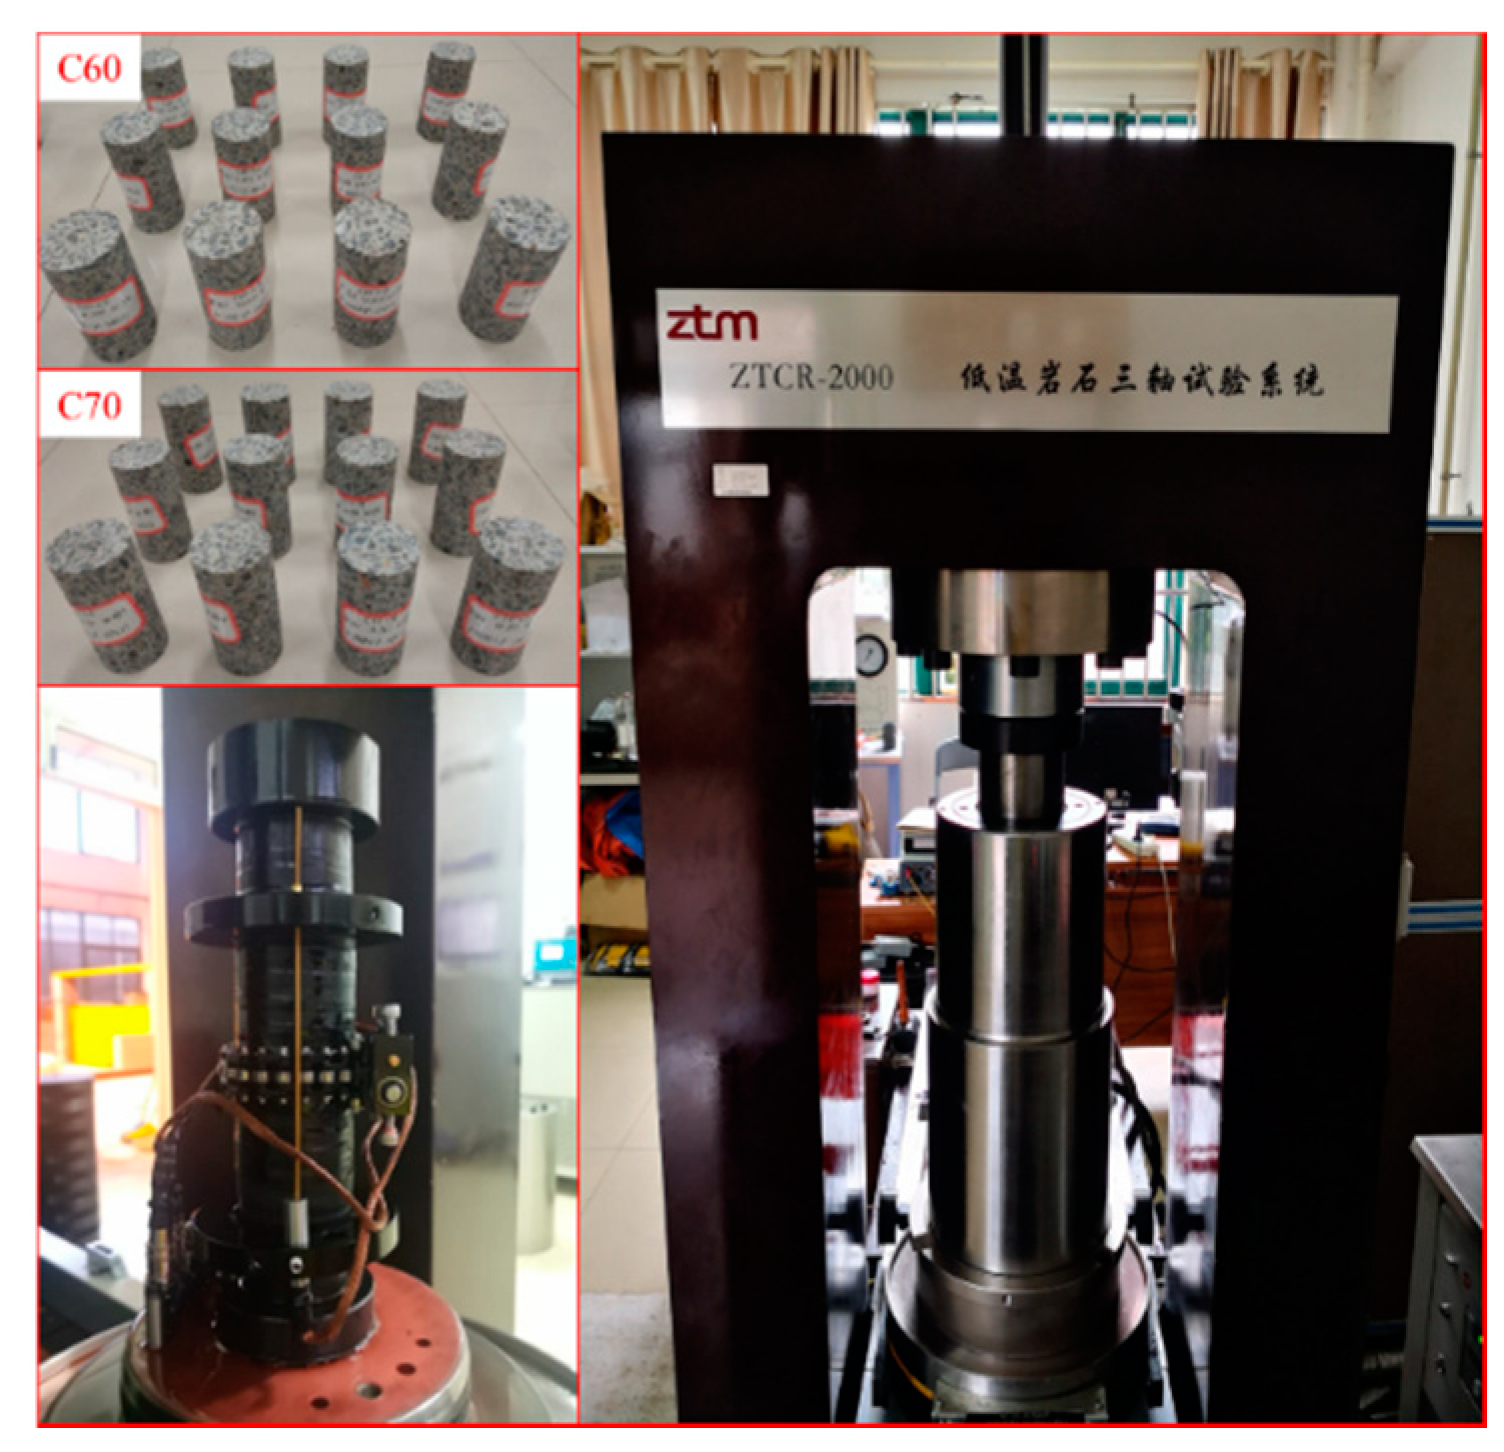
2.1. Test Materials and Equipment

According to the Specifications for Mix Proportion Design of Ordinary Concrete (JGJ55-2011), high-strength concrete with strength grade of C60 and C70 was prepared. The cement was grade 52.5 ordinary Portland cement, with siliceous river sand with a fineness modulus of 2.73, and crushed basalt with particle sizes in the range of 5–10 mm. The admixture is the NF-F high-efficiency admixture compound, wherein the slag and silicon powder accounted for 73% and 20%, respectively. The mix proportions of high-strength concrete (C60 and C70) are listed in Table 1.
The concrete mix was poured into 150 × 150 × 150 mm plastic molds. The obtained concrete specimens were demolded after 16 h and immediately transferred into a curing box at 20 ± 2 °C and at a relative humidity of 95% for 28 days. Three specimens were subsequently randomly selected for uniaxial compressive strength testing at 28 days. The remaining concrete specimens were finished by coring, cutting, and grinding according to the Standard for Tests Method of Engineering Rock Masses (GB/T50266-2013). The obtained standard cylindrical specimens measured φ50 × 100 mm. The upper and lower faces of the specimens were ground to be plane and parallel, and ensured a uniform stress distribution in the final cylindrical specimens.
Conventional triaxial compressive tests were conducted with a ZTCR-2000 rock triaxial testing system (Figure 1). The equipment is mainly used for uniaxial, conventional triaxial and creep tests of concrete and rock materials, which is mainly composed of an axial pressure system, confining pressure system, servo oil source, temperature control system, and computer control system. The computer system controls the whole process of the test equipment and operates the test steps, and automatically collects and processes the test data. The axial compression system includes an axial loading frame, three-axis cavity lifting device, controller, sensor, and electro-hydraulic servo valve. The confining pressure system consists of a pressure chamber, pressurization device, pressure transmitter, digital display meter, low temperature liquid filling oil source, air pump, guide rail, controller, and sensor. The computer system can draw the curve of each parameter in real time. The main technical parameters of the test equipment are shown in Table 2.
The circumferential and axial deformation was measured by a linear variable differential transducer (LVDT) attached to a chain wrapped tightly around the sample and an axial LVDT, respectively. Cylindrical samples of C60 and C70 high strength concrete were tested by applying compressive stress σ 1 and the constant confining pressures σ 2 = σ 3 = 0 , 5 , 10 , 15 , 20 MPa, respectively. The samples were hydrostatically compressed until the level of desired circumferential pressure was reached. The sample was then vertically compressed at a rate of 0.05 mm/min until failure.

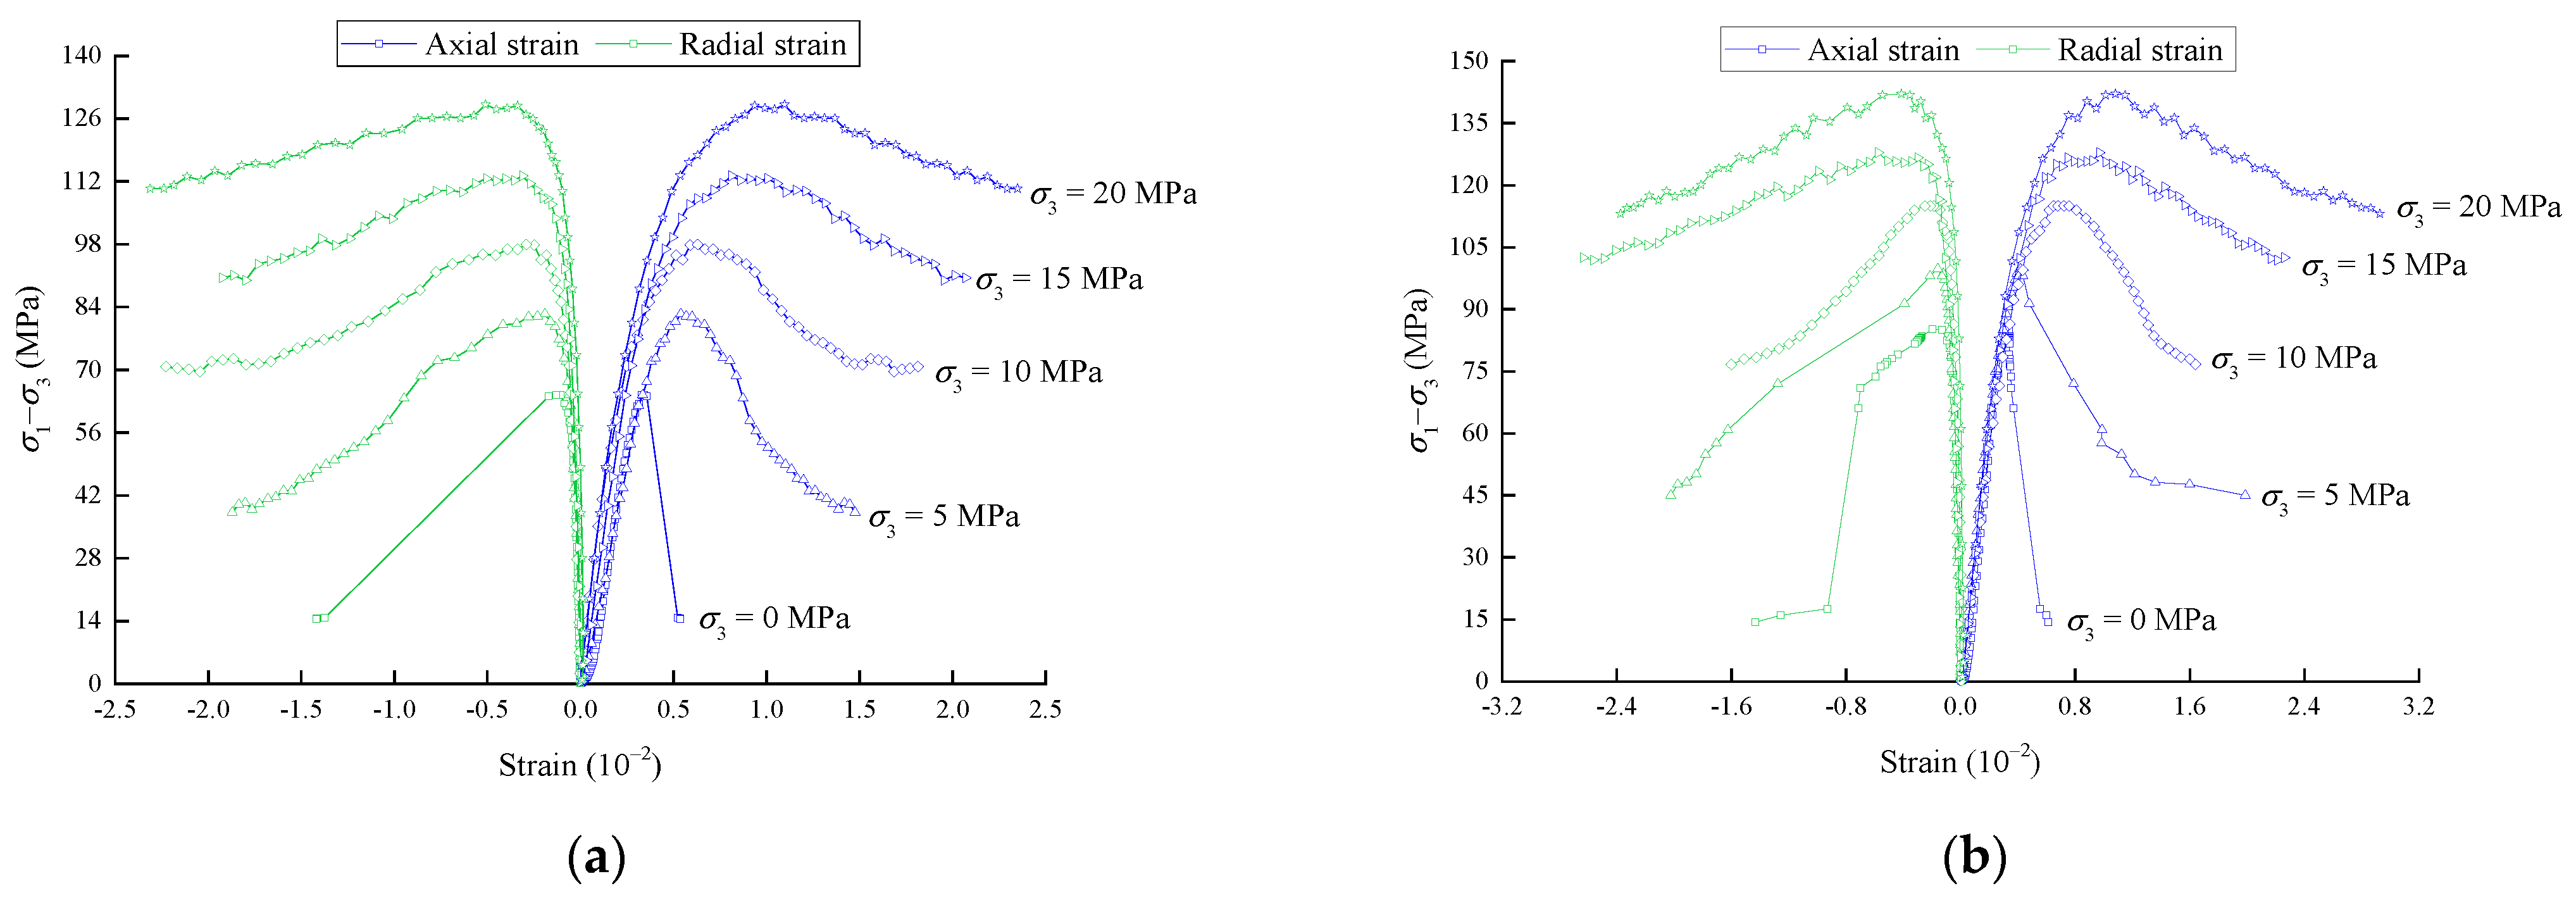
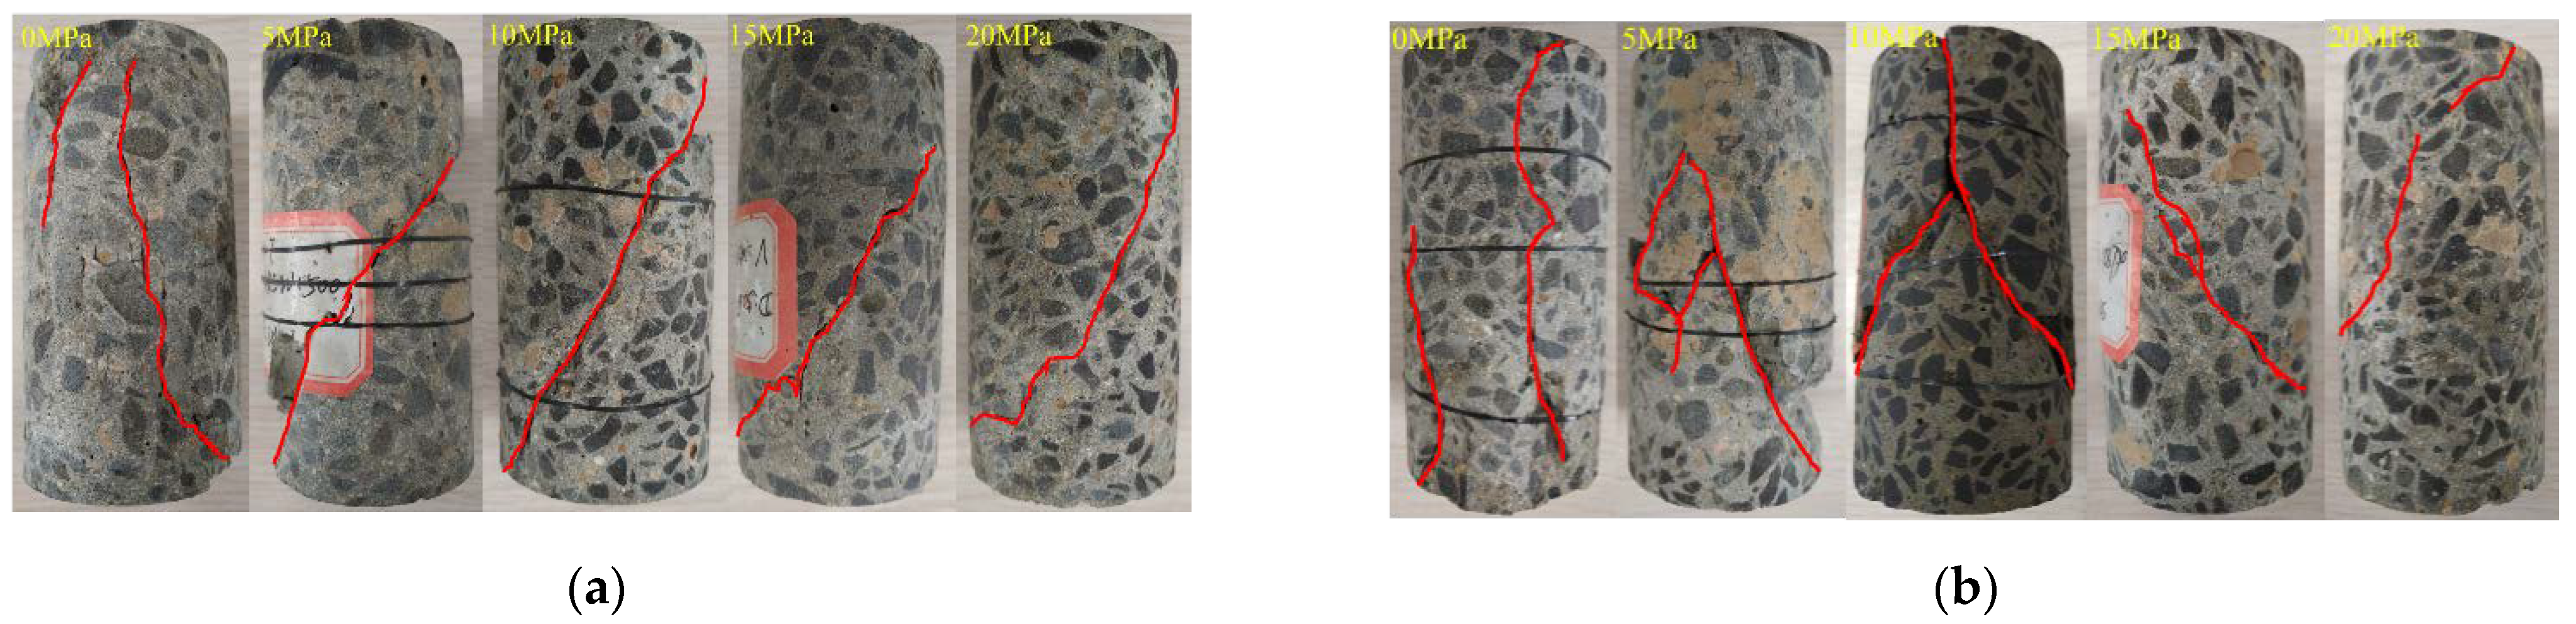
2.2. Analysis of Test Results

The stress–strain curves of high-strength concrete specimens (C60 and C70) at the confining pressures of 0, 5, 10, 15, and 20 MPa are shown in Figure 2.
According to the test results, the basic mechanical parameters of C60 and C70 high-strength concrete at different confining pressures are shown in Table 3.
During the setting process of concrete, many microcracks and holes will be formed owing to the drying shrinkage and water evaporation of cement slurry as well as the excessive interfacial microdefects (a) between the cement paste and aggregate, (b) among various phases of cement paste, and (c) among hydration products and un-hydrated cement particles. When subjected to uniaxial loading, the original cracks propagate along the interface and their direction is basically the same as the loading direction. The upper and lower parts of the cracks are compressive stress concentration areas, and the side is a tensile stress area. Because the tensile strength is far lower than the compressive strength, the microcracks first produce tensile failure. At this time, owing to the lack of lateral restraints, the rapid development of microcracks eventually leads to the loss of concrete strength [12]. When the confining pressure is 5, 10, 15, and 20 MPa, the high-confining pressure counteracts the tensile stress on the side of the crack, and increases the compressive stress required for the fracture to connect with each other. The macroscopic performance is characterized by the fact that the peak stresses of C60 and C70 high-strength concrete increase as a function of the confining pressure. Therefore, the confining pressure can effectively limit the propagation speed of micro-cracks in concrete samples, slows down the damage degree of samples, and improves the bearing capacity and deformation capacity of concrete samples. Because the conventional triaxial test is carried out in a closed cavity, it is impossible to directly observe the generation and development process of cracks, but it can be studied by means of SEM technology [13].
The failure modes of C60 and C70 high-strength concrete specimens at different confining pressures are shown in Figure 3. When the confining pressure is 0 MPa, the failure mode of the two high-strength concrete specimens is tensile failure. This is because the transverse tensile stress generated by the Poisson effect at axial loading is greater than the tensile strength of concrete, and results in cracks parallel to the maximum principal stress direction of concrete samples. When the confining pressures are 5, 10, 15, and 20 MPa, the failure mode is oblique shear failure. This is attributed to the fact that the larger confining pressure inhibits the expansion of vertical cracks. The shear stress on the inclined section of concrete subject to high-triaxial stress is greater than its shear strength, and the inclined shear failure occurs along a weak plane.

3. Energy Analysis of High-Strength Concrete during Compression

3.1. Energy Analysis

This section may be divided by subheadings. It should provide a concise and precise description of the experimental results, their interpretation, as well as the experimental conclusions that can be drawn.
According to the first law of thermodynamics, regardless of the influence of external temperature change and material exchange on the test system, the input energy W F is equal to the sum of the elastic strain energy W E and dissipation energy W D in the test process [14,15].
W F = W E + W D
The input energy mainly includes the work done by the axial force and confining pressure when the concrete sample deforms, and the elastic strain energy is the energy accumulated in the interior of concrete sample when the elastic deformation occurs because (a) the elastic deformation is reversible, and (b) because the elastic strain energy is also reversible. The dissipation energy mainly includes the (a) surface energy consumed during the initiation, development and penetration of cracks, (b) plastic strain energy for irreversible plastic deformation of concrete samples, (c) heat energy generated by friction and slip between cracks, and various radiation energy [16,17].
The energy input to the concrete specimen by the external force during the test can be expressed as [18],
W F = π 4 D 2 H ( 0 ε 1 σ 1 d ε 1 + 2 0 ε 3 σ 3 d ε 3 ) = V U F
where σ 1 , σ 3 are the maximum and minimum principal stresses, respectively, ε 1 and ε 3 are axial and lateral strains, respectively, U F is the input energy density, V is the volume of the concrete sample, and D and H are the diameter and height of the concrete sample, respectively.
Similarly, the elastic strain energy and dissipation energy are obtained as follows,
{ W E = π 4 D 2 H U E = V U E W D = π 4 D 2 H U D = V U D
where U E and U D are the elastic strain and dissipation energy densities, respectively.
Substituting Equations (2) and (3) into Equation (1), we obtain,
U F = U E + U D
According to the elastic theory (Gong et al., 2018), the elastic-strain energy density is obtained as follows,
U E = 1 2 ( σ 1 ε 1 e + 2 σ 3 ε 3 e ) = 1 2 E [ σ 1 2 + 2 ( 1 μ ) σ 3 2 4 μ σ 1 σ 3 ]
By substituting Equations (2) and (5) into Equation (4), the dissipation energy density is obtained as follows,
U D = 0 ε 1 σ 1 d ε 1 + 2 0 ε 3 σ 3 d ε 3 1 2 E [ σ 1 2 + 2 ( 1 μ ) σ 3 2 4 μ σ 1 σ 3 ]
where E is the elastic modulus, and μ is the Poisson’s ratio.

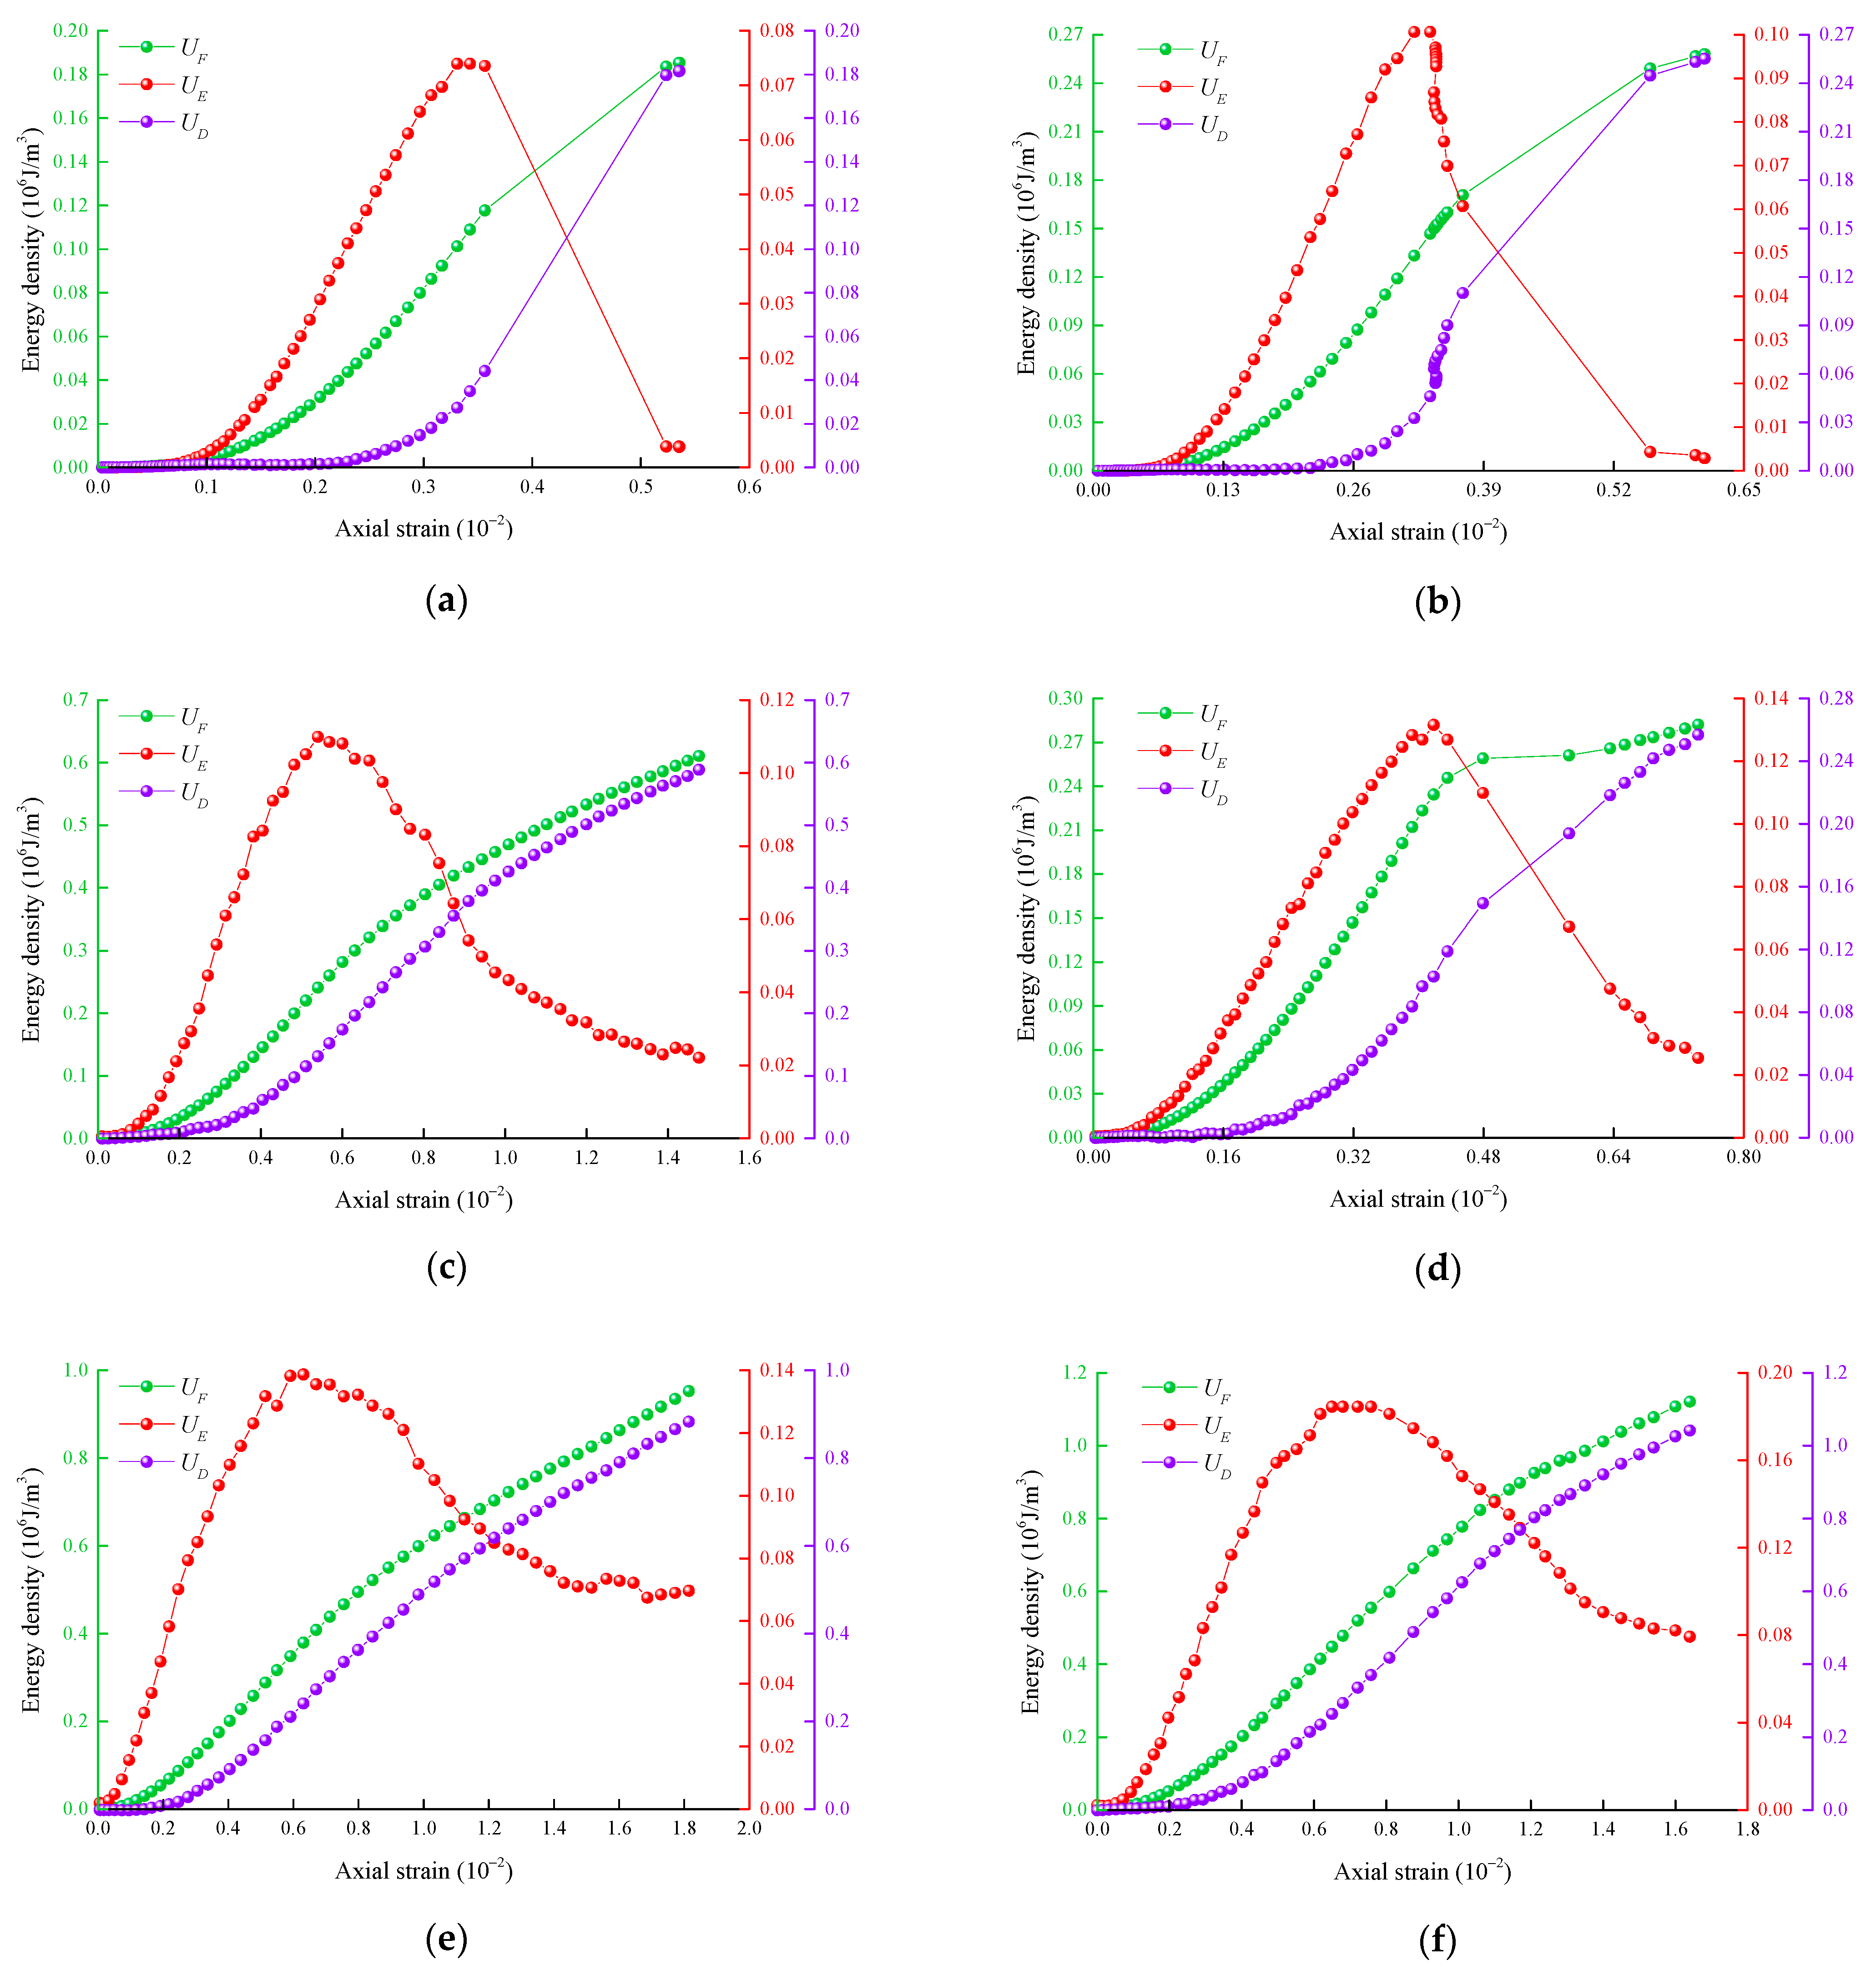
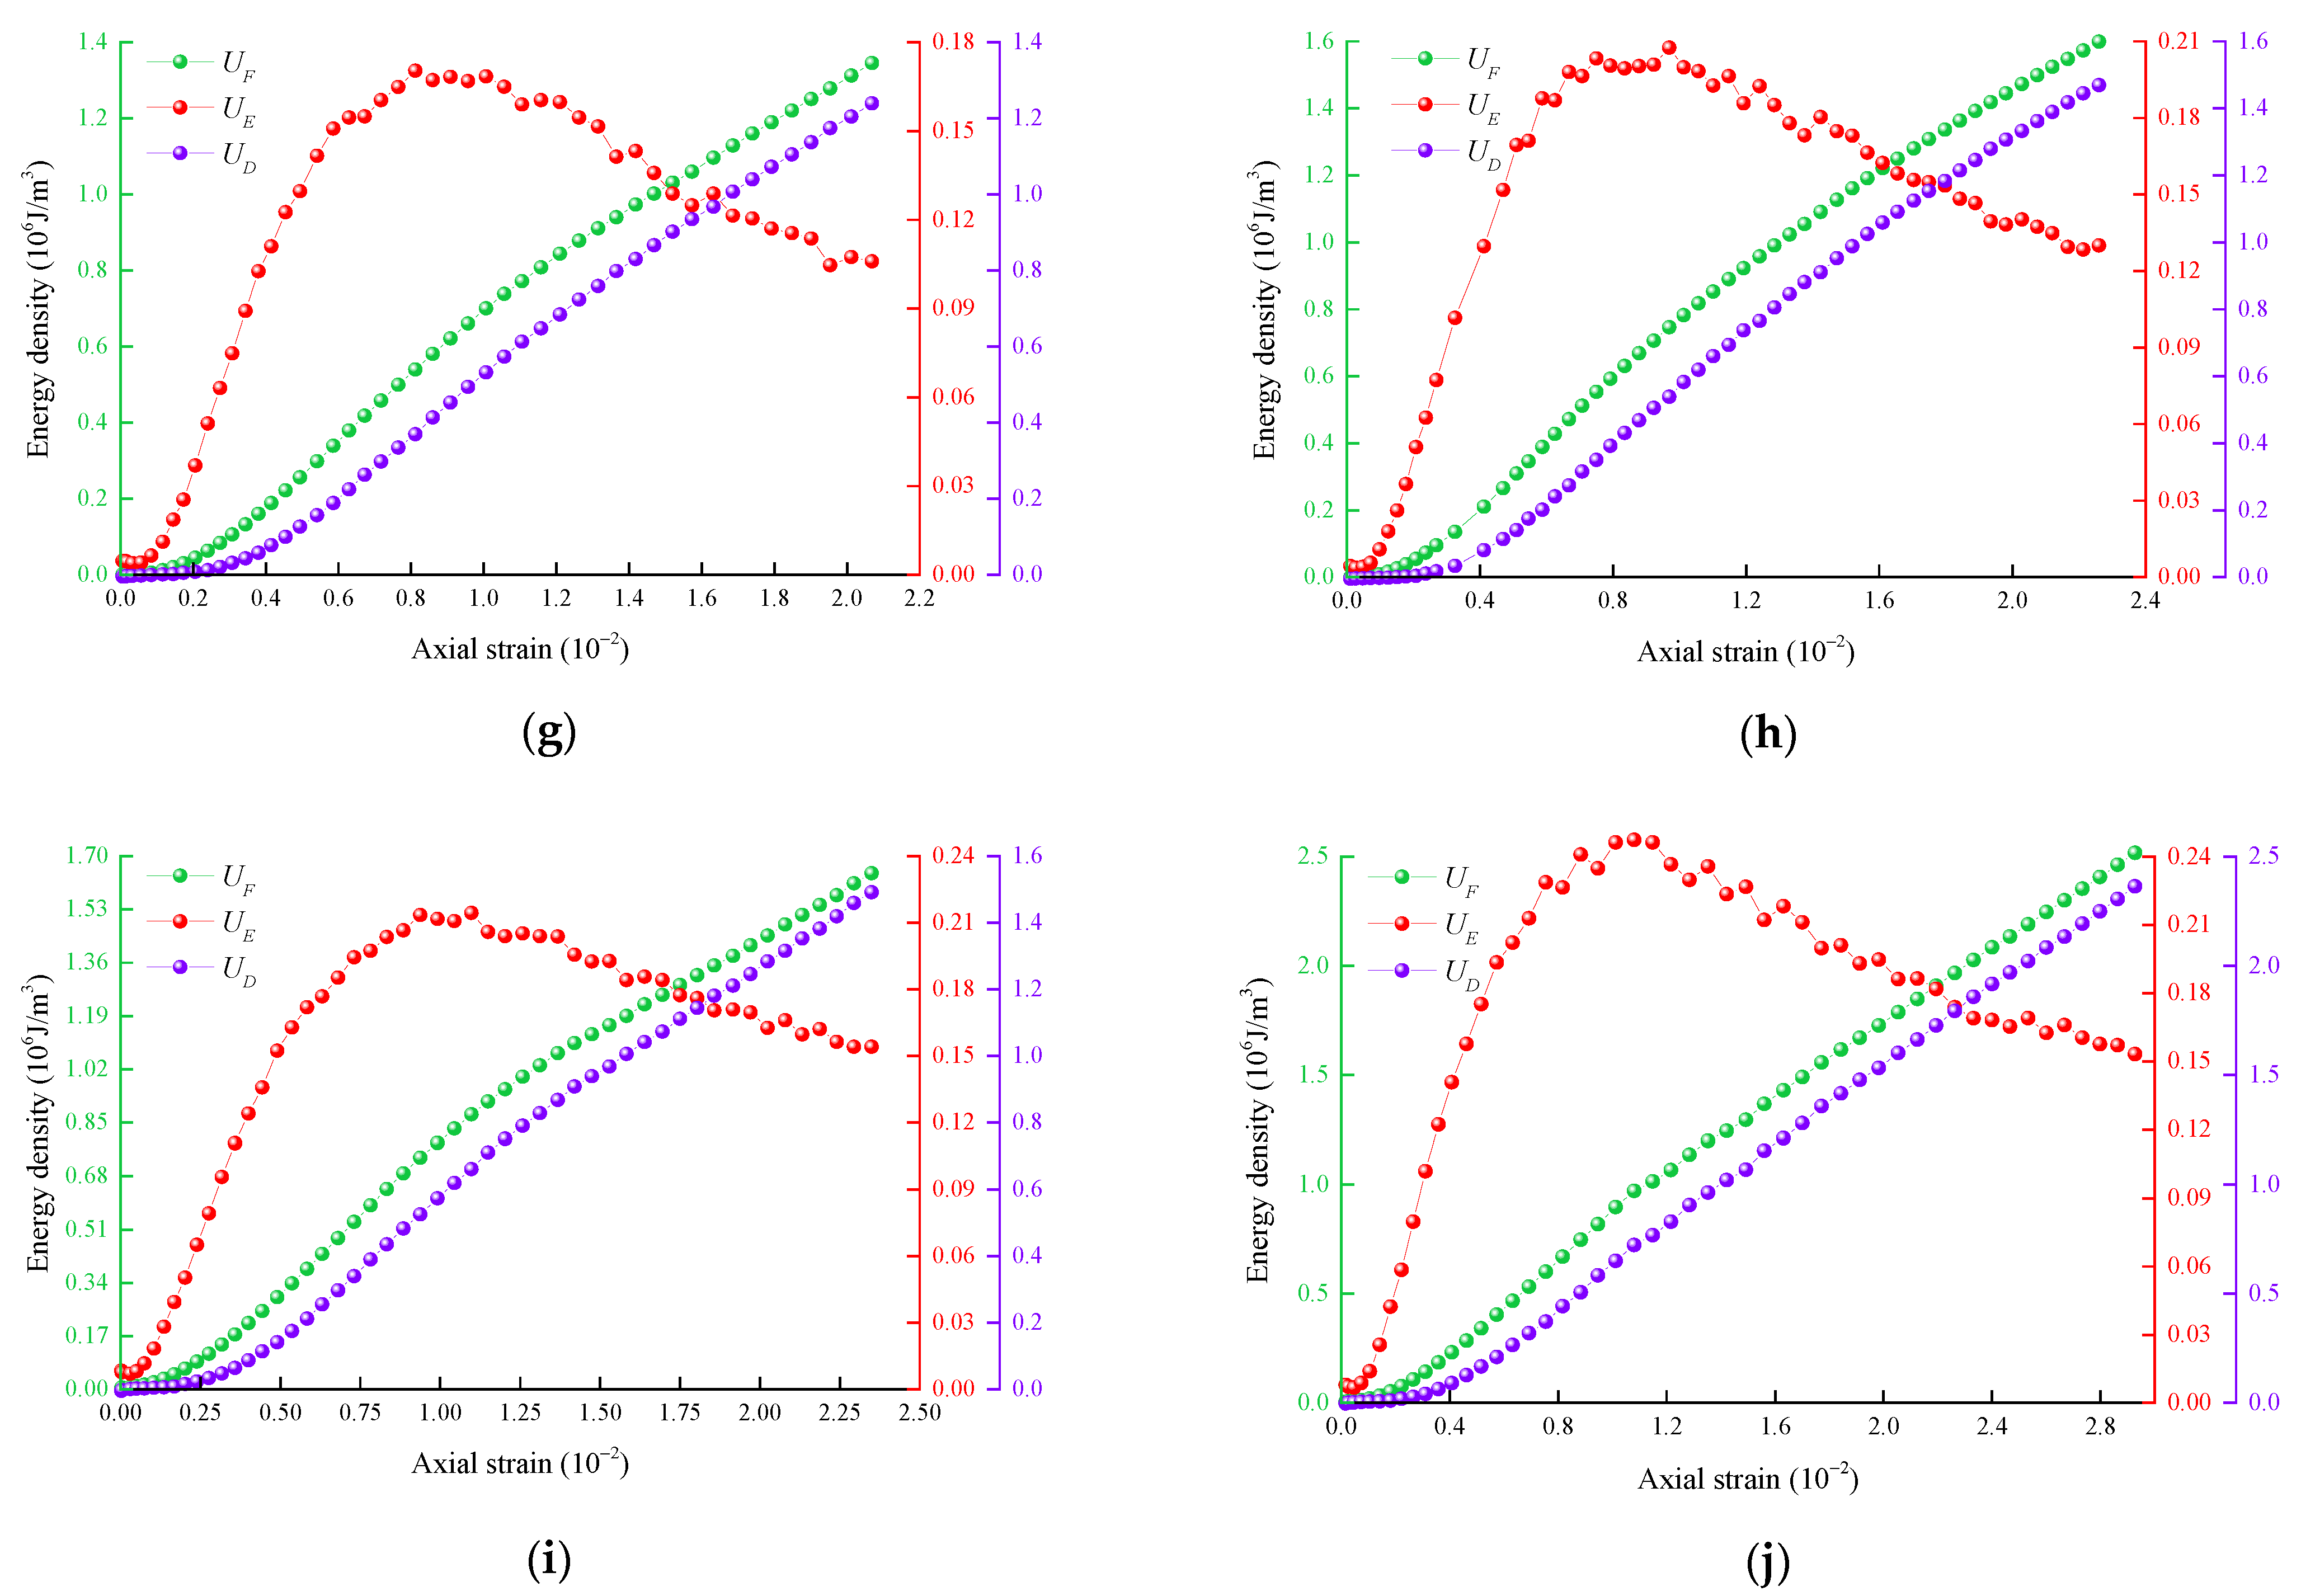
3.2. Relationship between Energy Density and Axial Strain

During the loading process of high-strength concrete samples, the changes of input energy, elastic-strain energy, and dissipated energy are always accompanied by the changes of initial hole compaction, elastic deformation, new crack propagation, and penetration. The energy coexisting in the specimen is not isolated from each other, but transformed with the concrete deformation process, and finally changed from the equilibrium state before the test to the new equilibrium state after the test. Based on the conventional triaxial compression test results of high-strength concrete (C60 and C70) at different confining pressures, the curves of input energy density, elastic-strain energy density and dissipation energy density with axial strain at different confining pressures are obtained according to Equations (2), (5), and (6). The results are shown in Figure 4.
It can be observed from Figure 4 that the input energy density and dissipation energy density of the two strength concrete samples at different confining pressures increase as a function of the axial strain. This indicates that the external force always inputs energy to the concrete samples during the entire test process, and at the same time, the energy is gradually dissipated. At the end of the test, the increasing trend of the input energy density slows down owing to the expansion of the sample and the negative work done by confining pressure offset part of the positive work done by axial stress. The elastic-strain energy density increases first and then decreases, as a function of the axial strain, and reaches the maximum value at the peak stress. This indicates that the pre-peak stage is mainly associated with the storage process of elastic-strain energy, and the post-peak stage is mainly associated with the release process of the elastic-strain energy.
Comparing the elastic-strain energy density curves of the two types of high-strength concrete and the stress–strain curves at the same confining pressure, it is found that the change trend of elastic-strain energy density with axial strain is similar to those of concrete samples. At the beginning of the test, the micro-holes and cracks in the concrete gradually close subject to the action of load, the stiffness of the concrete increases, and the curve becomes concave. At this time, most of the work done by the external force is converted into elastic-strain energy, it is stored in the sample, and the dissipation energy is almost zero. The elastic-strain energy density curve basically coincides with the input energy density curve. When the load exceeds the elastic limit of the concrete sample, new cracks will appear in the concrete. The generation and diffusion of the new cracks need to dissipate part of the surface energy, and the crack tip produces acoustic emission energy owing to the stress concentration effect accompanied by irrecoverable plastic strain energy and various radiation energy sources. As a result, the slope of the elastic-strain energy density curve slows down, and the dissipation energy density increases as a function of the axial strain. When the load exceeds the compressive strength of concrete, the concrete will be destroyed. At this time, the elastic-strain energy stored in pre-peak is released rapidly, and most of the input energy of external force is dissipated rapidly by the action of crack initiation, propagation and penetration, as well as the friction of fracture surface, thus resulting in an abrupt increase of dissipation energy density after the peak as a function of strain.
The results show that the storage of elastic-strain energy before the peak of concrete specimen is mainly elastic-strain energy, and constitutes the primary source of concrete failure. At the same time, with the dissipation of energy, the dissipation energy will gradually reduce the bearing capacity of concrete samples. After the peak, the elastic-strain energy is mainly released, and the released elastic-strain energy is transformed into various forms of energy dissipation, so the post-peak dissipation energy accounts for a large proportion of the input energy.

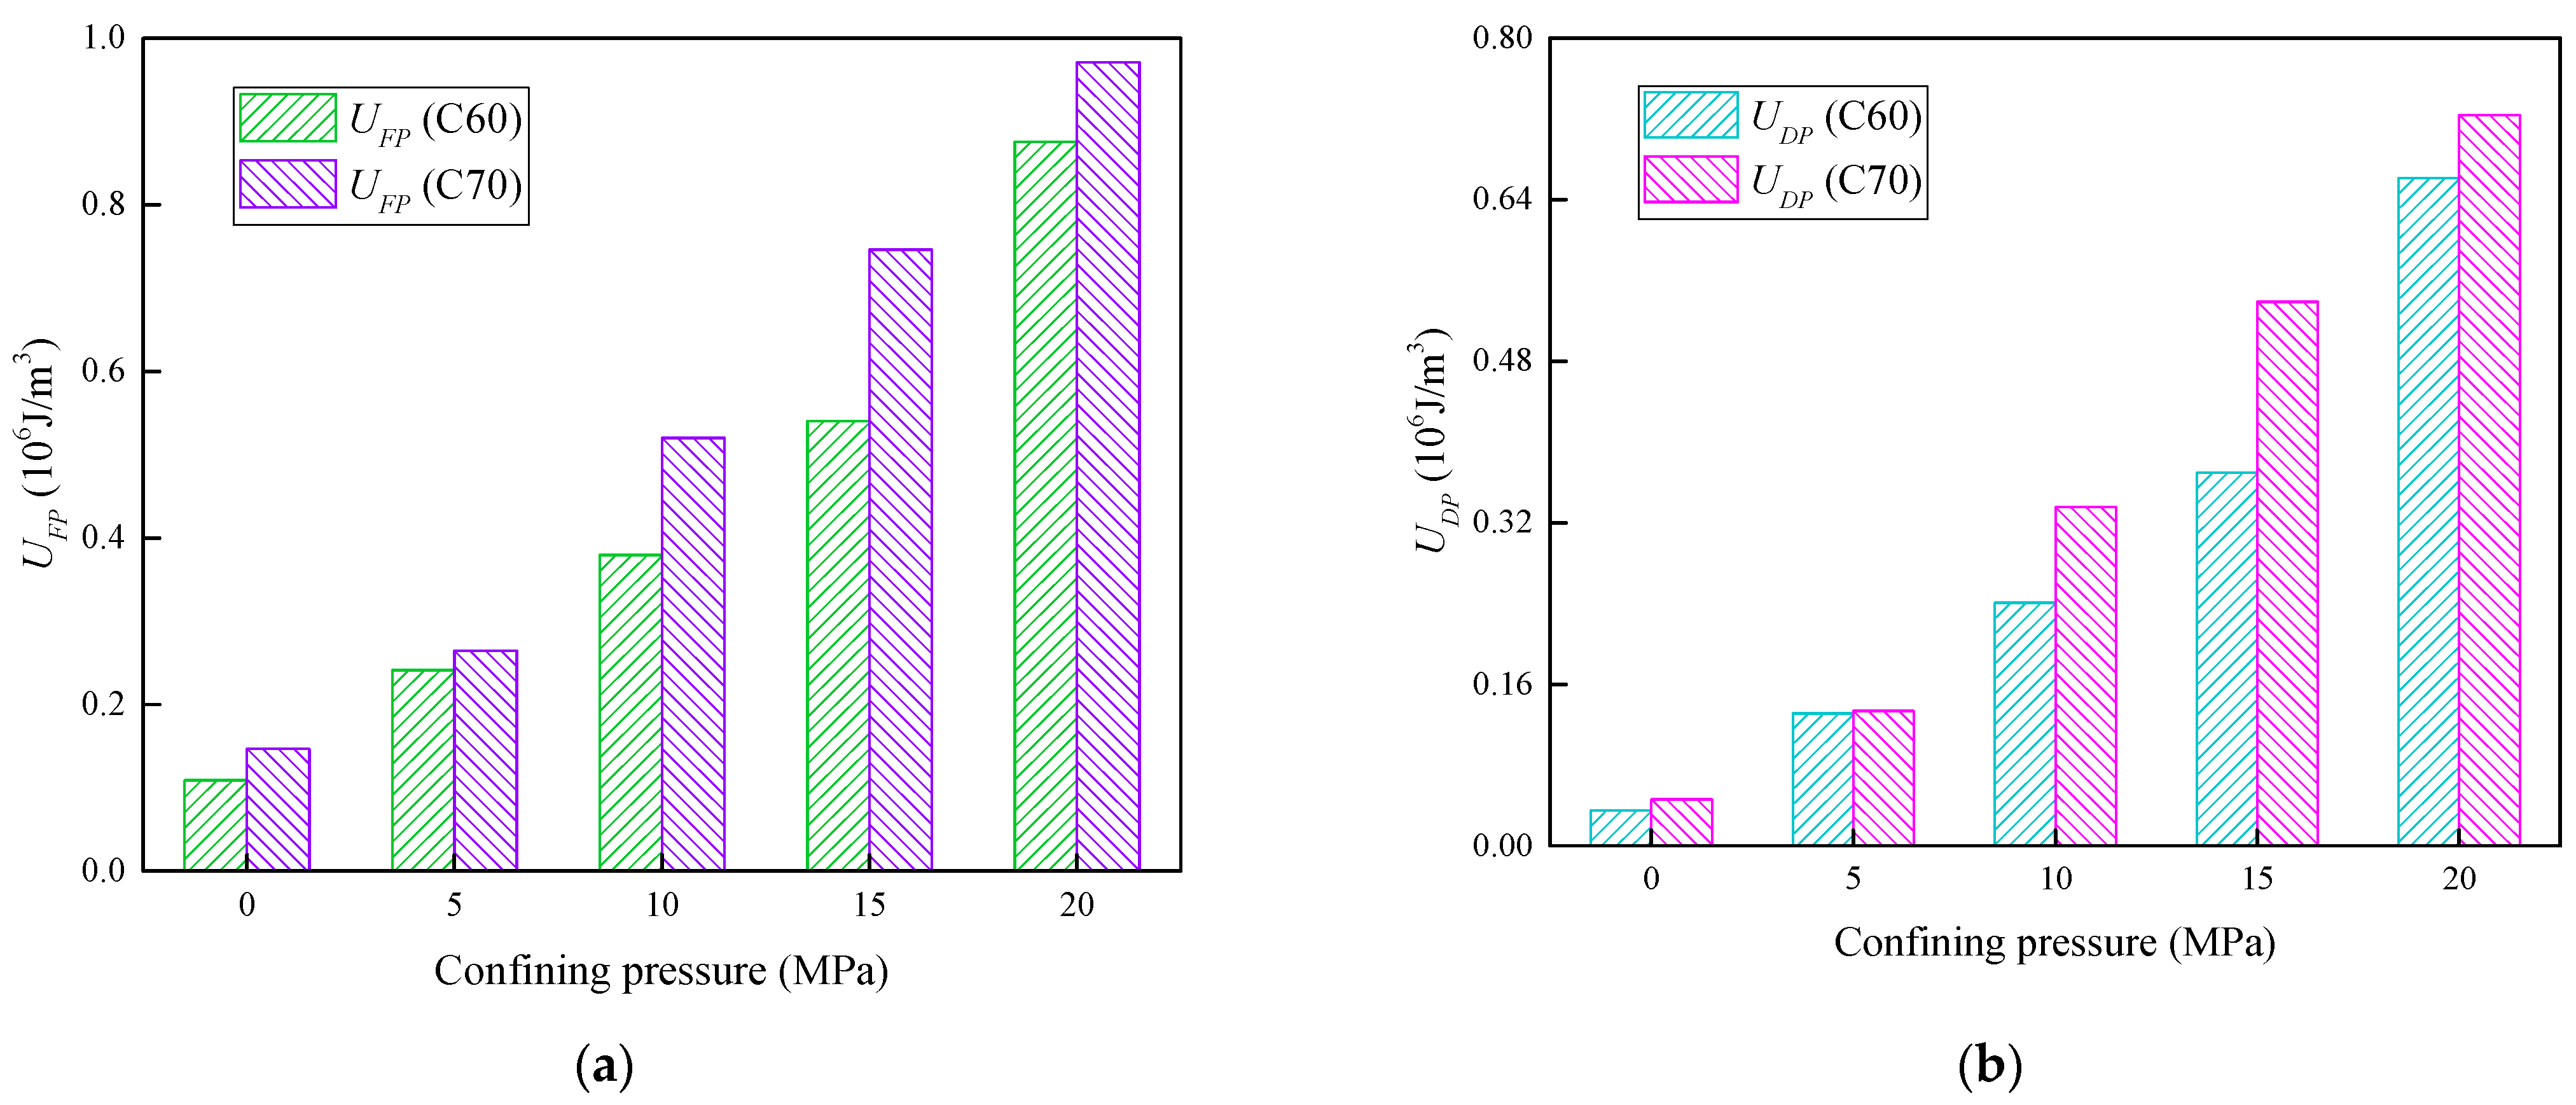
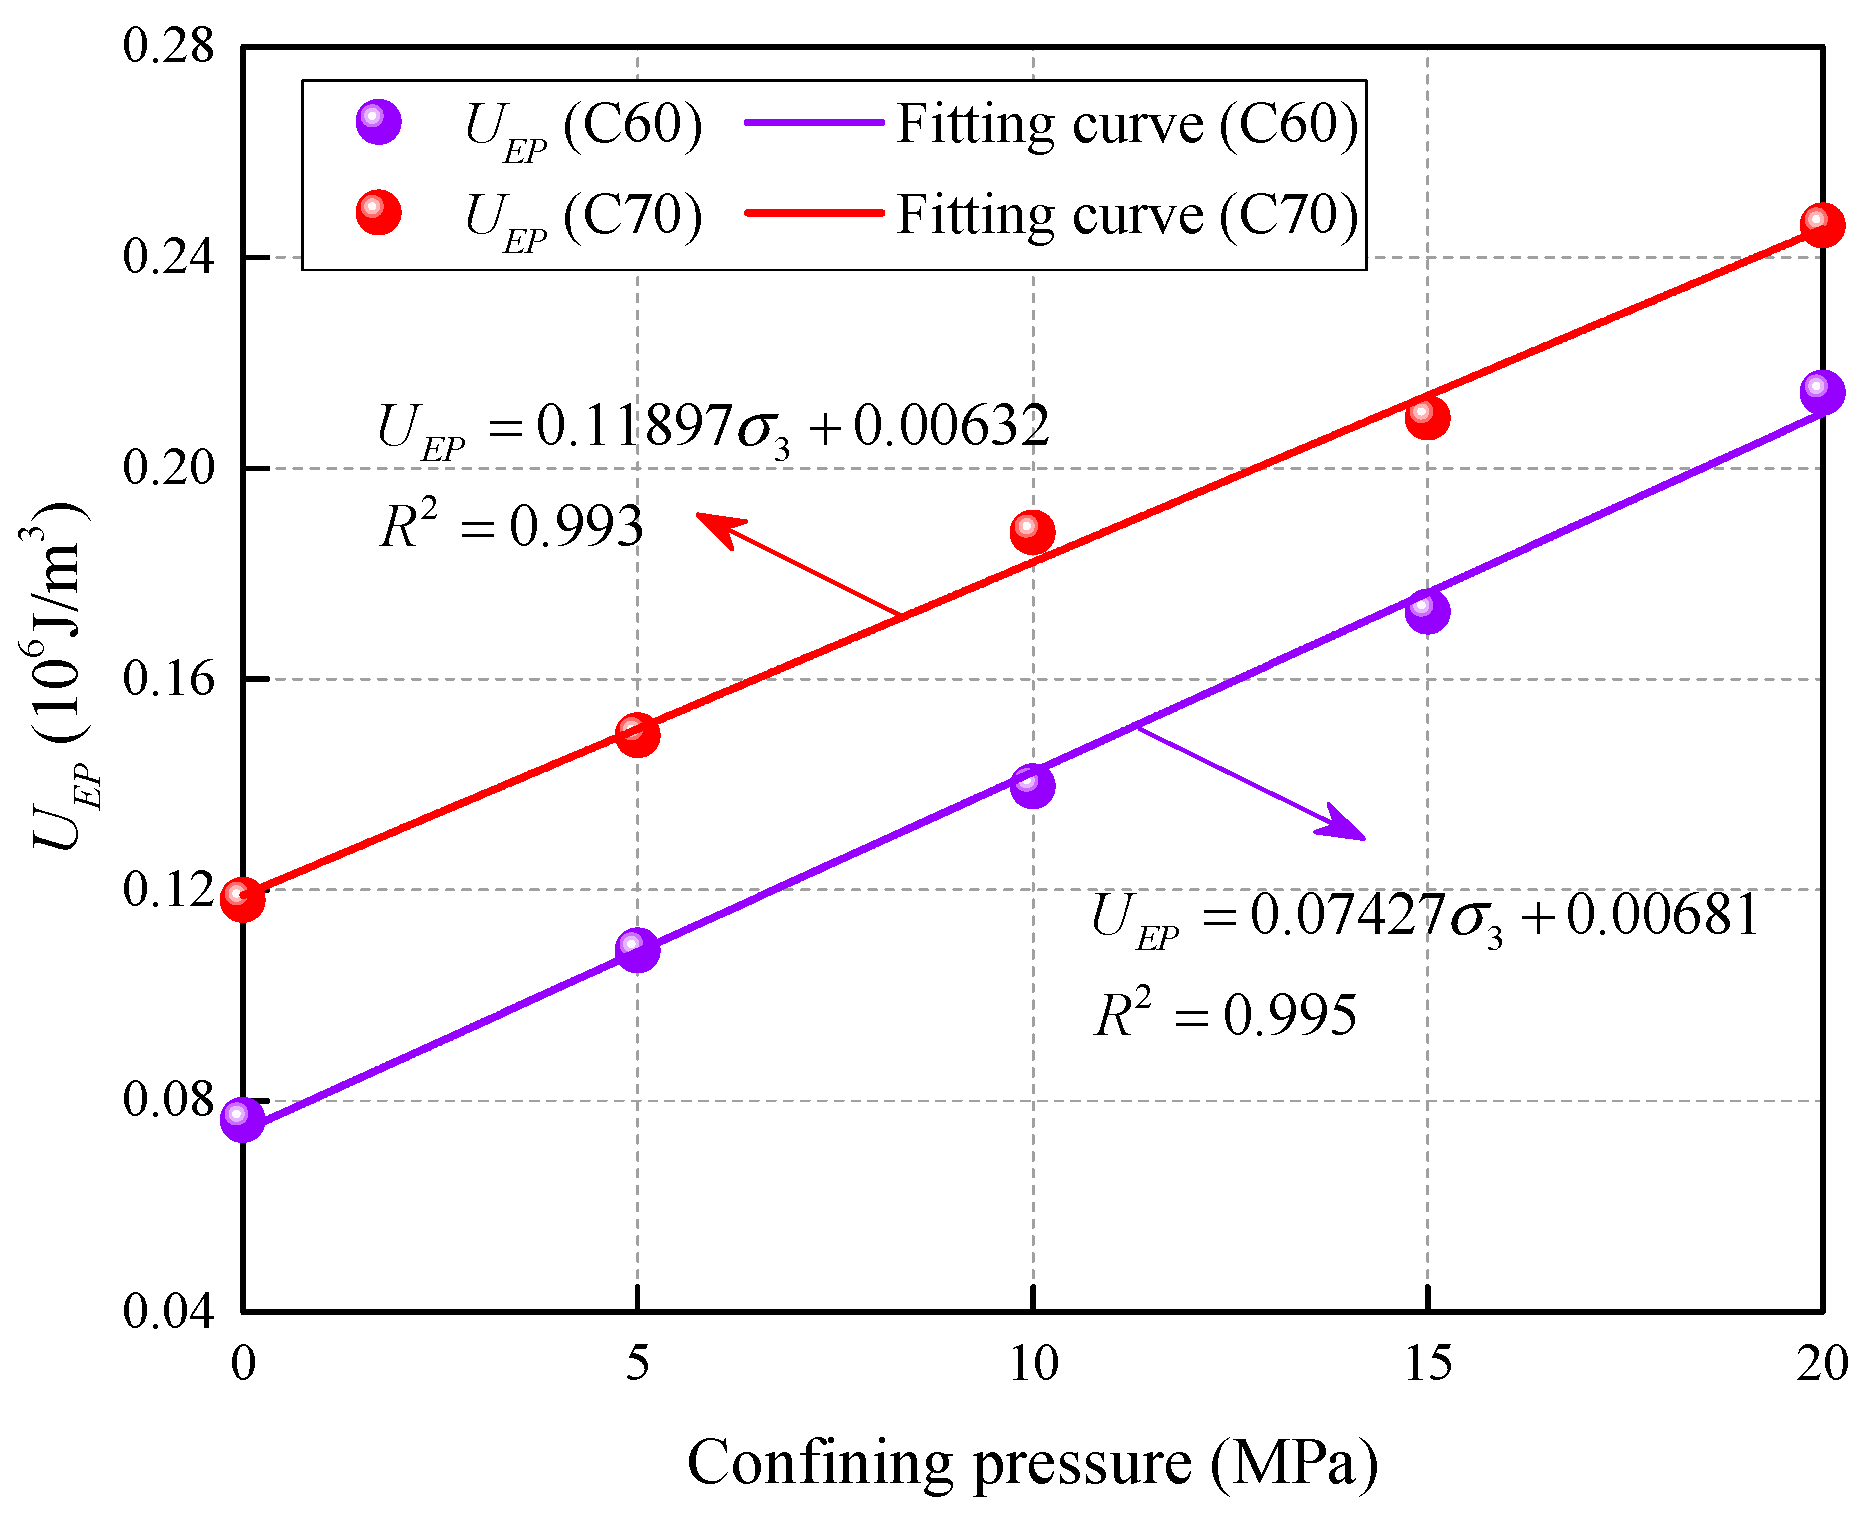
3.3. Relationship between Energy Density Corresponding to Peak Stress and Confining Pressure

Figure 5 shows the relationship between the confining pressure and input energy density U F P and dissipated energy density U D P corresponding to the peak stress of the two types of high-strength concrete samples. It can be observed from Figure 5a,b that the input energy density U F P and the dissipation energy density U D P corresponding to the peak stress of the two types of high-strength concrete samples increase as a function of the confining pressures, and the U F P and U D P of the C70 high-strength concrete samples subjected to the same confining pressure are higher than those of the C60 high-strength concrete. This is attributed to the fact that as the strength of the concrete increases, the system needs to input more energy to cause its failure. At the same time, the compressive capacity of high-strength concrete gradually decreases, and thus needs to dissipate more energy.
Figure 6 shows the relationship between the confining pressure and elastic-strain energy density U E P corresponding to peak stress for two types of high-strength concrete samples. As it can be observed from the figure, U E P and the confining pressure are linearly related, and the correlation coefficients are all above 0.99. It can be observed from Figure 6 that as U E P increases, the energy release at high-confining pressures is more rapid and abrupt compared with low-confining pressures.

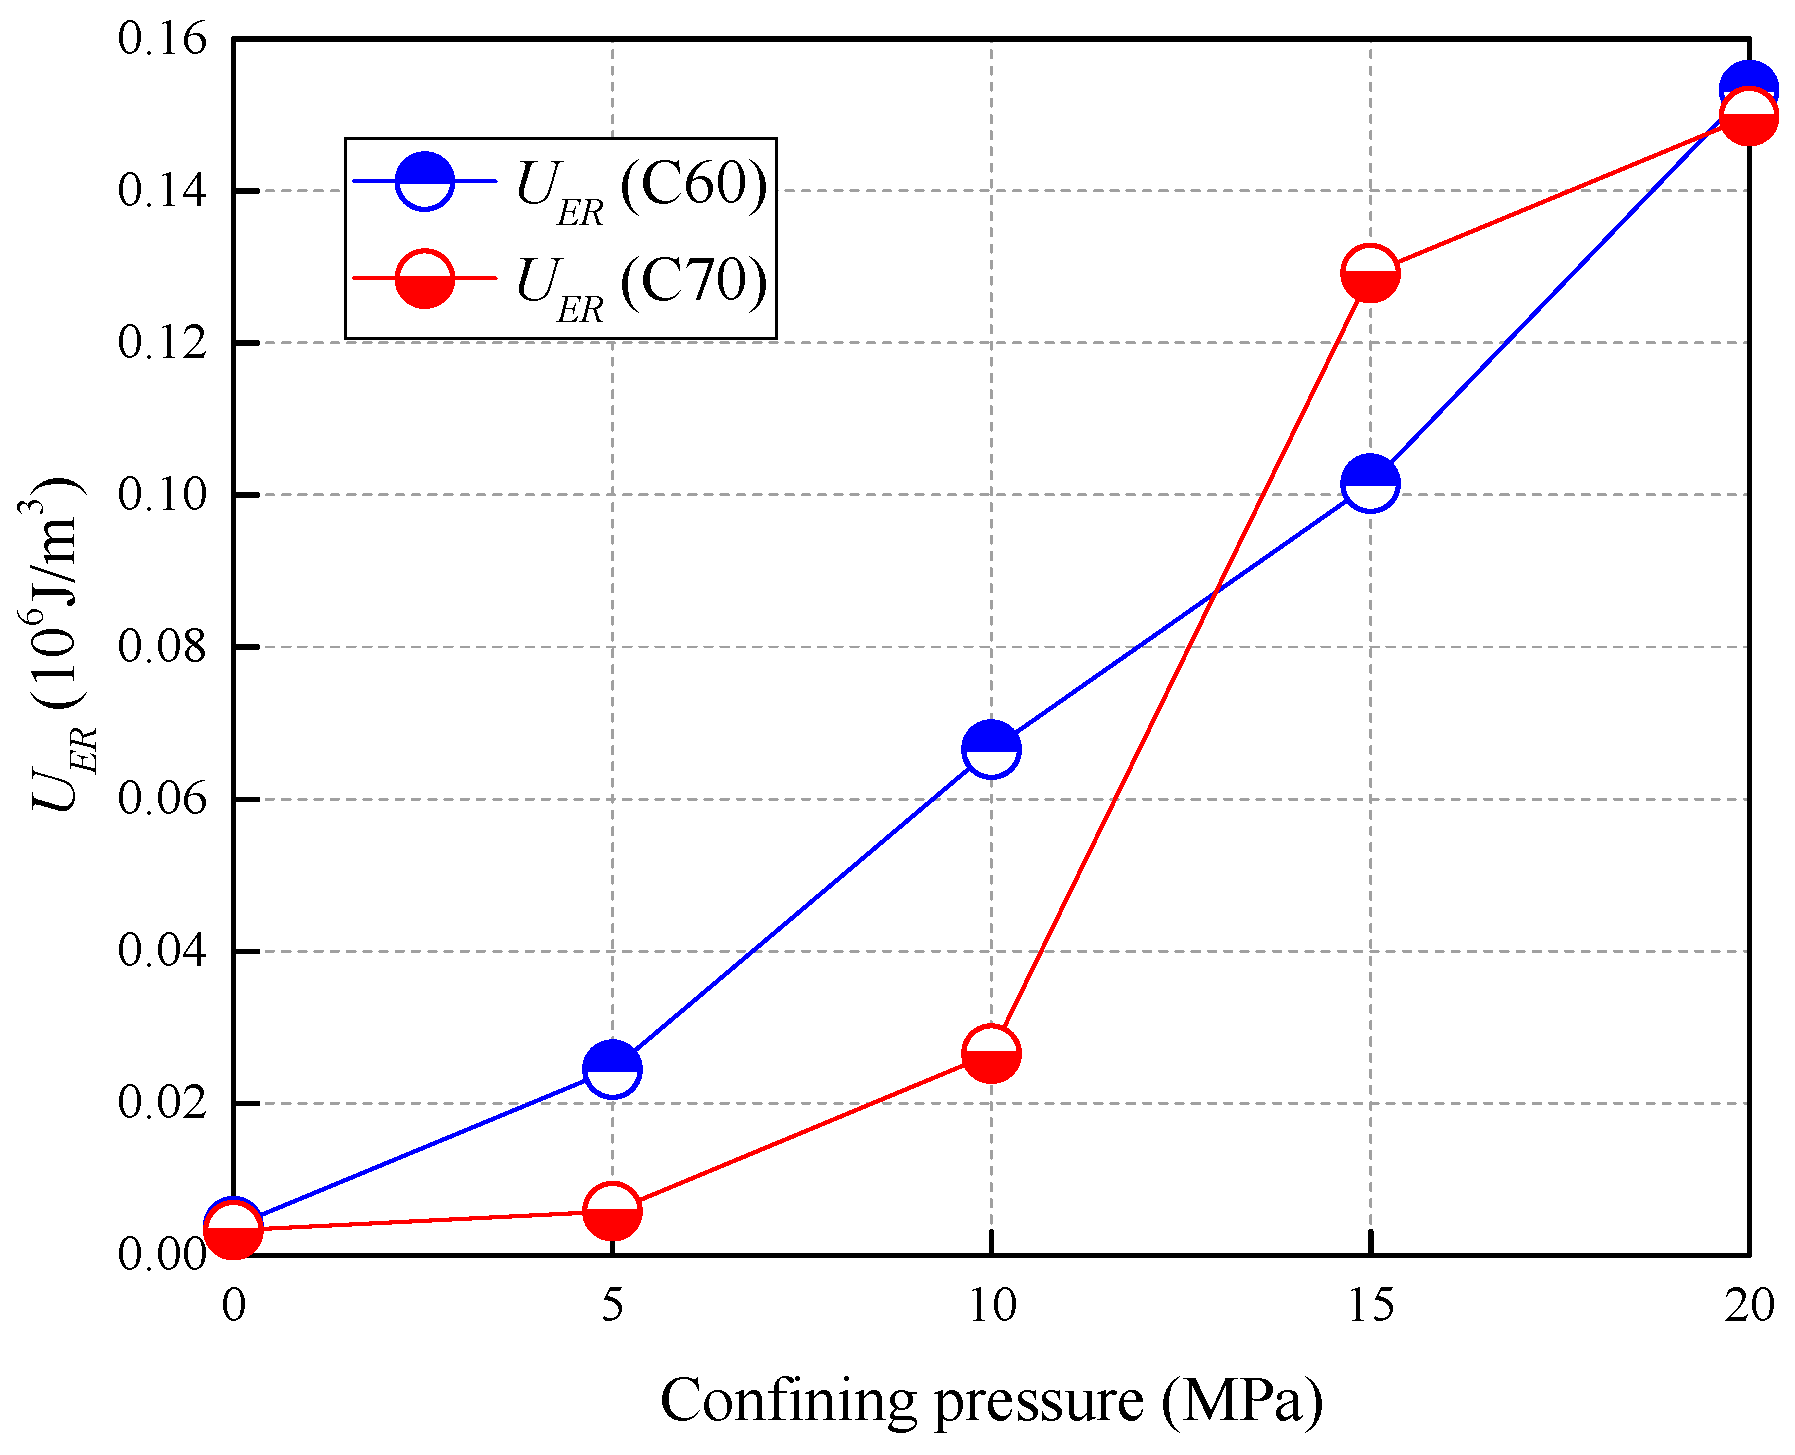
3.4. Relationship between Final Energy Density and Confining Pressure

Figure 7 shows the relationship between the confining pressure and final elastic-strain energy density U E R of two types of high-strength concrete specimens after complete failure. It can be observed from Figure 7 that the U E R values of the two types of high-strength concrete samples increase as a function of the confining pressure. Considering the C60 high-strength concrete sample as an example, when the confining pressure is 0, 5, 10, 15, and 20 MPa, the U E R values are 0.0038 × 10⁶ J/m3, 0.0244 × 10⁶ J/m3, 0.0665 × 10⁶ J/m3, 0.10150665 × 10⁶ J/m3, and 0.15330665 × 10⁶ J/m3, respectively. This shows that in the post-peak failure stage, the elastic-strain energy stored before the peak is not completely released, and a small part of the elastic strain energy is still stored in the sample. Accordingly, the larger the confining pressure is, the greater the residual elastic-strain energy is. This indicates that the confining pressure limits the release of the elastic-strain energy to a certain extent in the post-peak stage. Macroscopically, the concrete sample still has a finite bearing capacity and residual strength after failure. In addition, the larger the elastic strain energy remaining in the specimen is, the greater the residual strength of the concrete sample.

4. Statistical Damage Constitutive Model of High-Strength Concrete

4.1. Establishment of Constitutive Model

According to Lemaitre’s strain equivalent principle [19], the strain response produced by the nominal stress acting on the damaged material is equivalent to the strain response produced by the effective stress that acts on the undamaged material. Therefore, the constitutive relationship of the damaged material can be obtained by replacing the nominal stress with the effective stress.
σ = σ * ( 1 D ) = E ε ( 1 D )
where σ and σ * are nominal and effective stresses, respectively, and D is the damage variable.
In the conventional triaxial compression test of concrete, σ 1 , σ 3 , and ε 1 , can be measured, and the corresponding effective stresses are σ 1 * and σ 3 * . According to Equation (7) and the generalized Hooke’s law [20,21], we can obtain,
{ ε 1 = 1 E ( σ 1 * 2 μ σ 3 * ) σ 1 * = σ 1 1 D σ 3 * = σ 3 1 D
The high-strength concrete sample is equivalent to the macrostructure composed of innumerable tiny microelements, wherein the microelements are small enough at the macroscale, and the microelements are large enough at the microscale. The change of mechanical properties of each microelement is equivalent to the change of the mechanical properties of the high-strength concrete sample [22]. The microelement is a linear elastic body before failure, and the stress–strain relationship satisfies Hooke’s law. Because the concrete is a mixture of various mineral materials and cementitious materials, it has an obvious heterogeneity, and its mechanical properties show the characteristics of random distribution. The resulting damage is also randomly distributed in concrete materials. Therefore, the mechanical properties of concrete microelements can be described mathematically by a statistical method, based on the assumption that the ratio of dissipation energy density U D to dissipated energy density U D P at peak stress obeys the Weibull statistical law, and the probability density function can be expressed as follows,
{ χ = U D U D P P [ χ ] = k m ( χ m ) k 1 exp [ ( χ m ) k ]
where P [ χ ] is the function of probability density, m is the scale parameter, and k is the shape parameter of the distribution.
The dissipation energy increases as a function of the axial strain. When the dissipation energy density reaches a certain level, the number of damaged microelements in concrete samples can be expressed as,
N D = N P [ χ ] d ( χ ) = N k m ( χ m ) k 1 exp [ ( χ m ) k ] d ( χ ) = N { 1 exp [ ( χ m ) k ] }
where N D is the number of damaged microelements, and N is the number of total microelements.
The damage variable D is the ratio of damaged microelements to the total number of microelements [23], and is expressed as follows,
D = N D N
By substituting Equation (11) into Equation (10), the statistical damage variables describing the damage characteristics of concrete are obtained as follows,
D = 1 exp [ ( χ m ) k ]
The statistical damage constitutive relation of high-strength concrete based on Weibull distribution can be obtained by substituting Equation (12) into Equation (8),
σ 1 2 μ σ 3 = E ε 1 exp [ ( χ m ) k ]

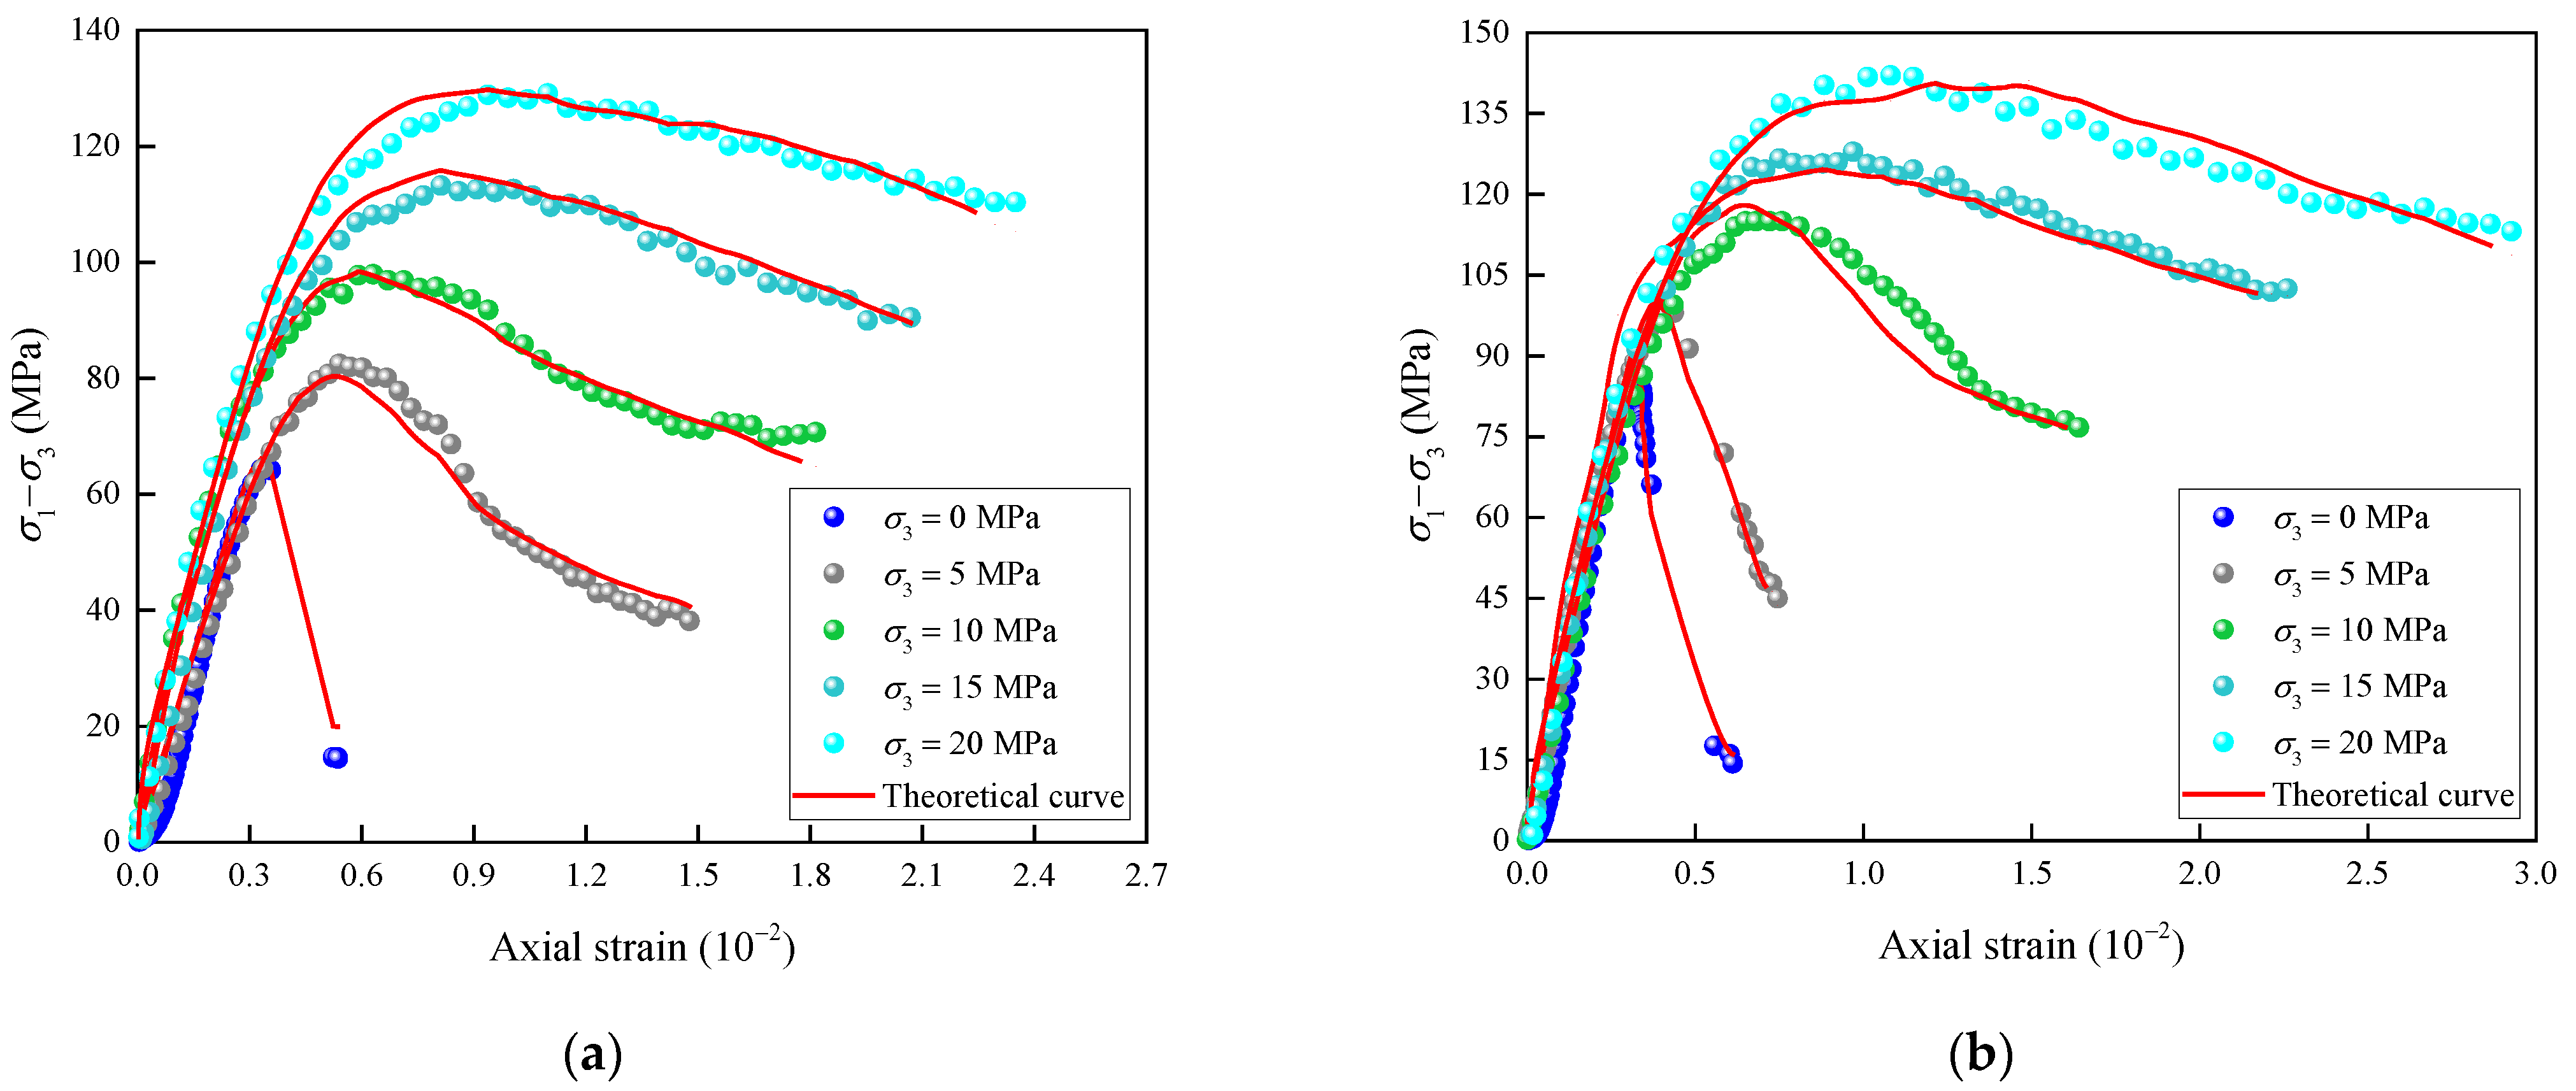
4.2. Verification of Constitutive Model

The key to establish the statistical damage constitutive relation of high-strength concrete is to determine the Weibull distribution parameters m and k. Applying the logarithms twice on Equation (13), the following equation is obtained:
ln [ ln ( σ 1 2 μ σ 3 E ε 1 ) ] = k ln ( χ ) k ln m
This is a linear equation with a slope coefficient equal to k and an intercept equal to k ln m . Therefore, parameters m and k can be easily determined based on a linear regression analysis on a set of triaxial test data of concrete samples, as shown in Table 4. The statistical damage constitutive relation curves of high-strength concrete are obtained by substituting m and k into Equation (13). The results are shown in Figure 8.
According to the comparison results of the statistical damage constitutive model curves and test curves of high-strength concrete (C60 and C70) at different confining pressures in Figure 8, it can be observed that the theoretical curves of the statistical damage constitutive model of high-strength concrete are in good agreement with the experimental curves in both the pre-peak elastic strain energy storage stage and the post-peak elastic strain energy release stage, and the correlation coefficient is above 0.96. Conversely, this constitutive model overcomes the defect of low correlation between concrete constitutive model and test results in the post-peak stage, and improves the accuracy of the model. Conversely, it is verified that the statistical damage constitutive model established from the energy theory and statistical damage theory is suitable to describe the constitutive behavior of high-strength concrete. Although the theoretical curve of the constitutive model established in this paper is in good agreement with the experimental curve, because the model parameters are obtained by fitting the experimental curve, whether the model can predict the total stress–strain curve of high-strength concrete needs further study.
Standard deviation and relative standard deviation can measure the deviation between the experimental and theoretical model results [24]. To verify the accuracy of the statistical damage constitutive model of high-strength concrete, the standard deviation and relative standard deviation of triaxial stress–strain test curve and the theoretical curve of two types of high-strength concrete under five confining pressures are calculated based on Equation (15). The results show that the relative standard deviations between the statistical damage constitutive model results and the test results of C60 high strength concrete are 7.56%, 3.54%, 2.45%, 2.40%, and 2.26%, respectively, at the confining pressures of 0, 5, 10, 15, and 20 MPa, and the average relative standard deviation is only 3.64%. Additionally, the relative standard deviation between the statistical damage constitutive model results and the test results of C70 high-strength concrete are 6.49%, 2.27%, 3.84%, 4.30%, and 3.03%, respectively, and the average relative standard deviation is only 3.99%. The error analysis further shows that the statistical damage constitutive model of high-strength concrete is reasonable and feasible.
{ η = i = 1 n ( σ s σ l ) 2 n f = η σ c
where η is the standard deviation, f is the relative standard deviation, σ s ,   σ l are the test values and theoretical values, respectively, σ c is the compressive strength, and n is the data volume.

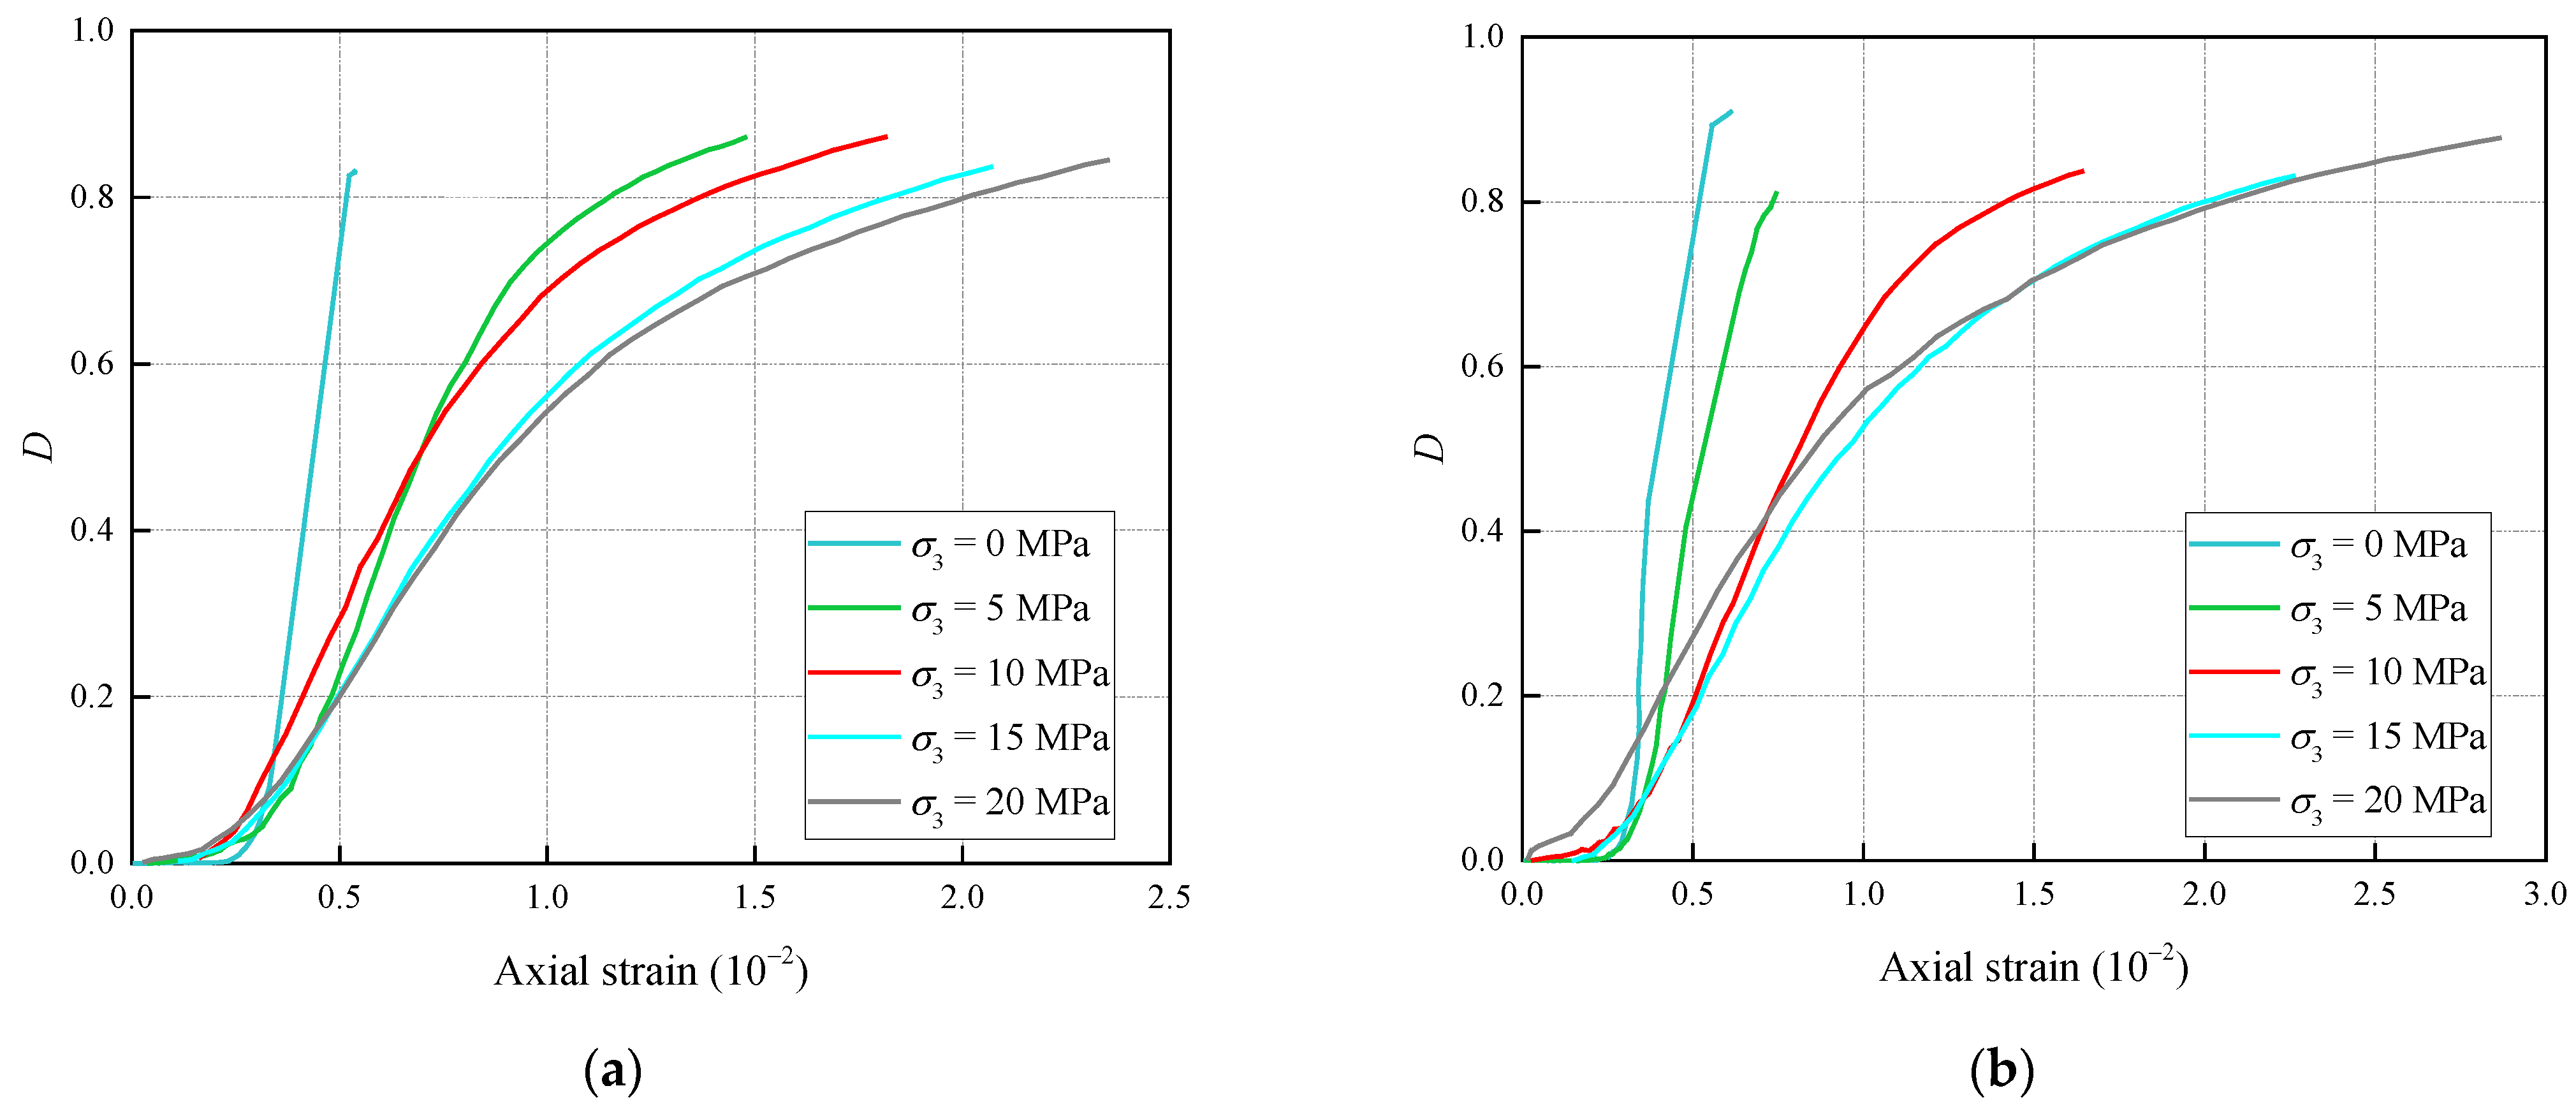
4.3. Damage Analysis of High-Strength Concrete

The Weibull distribution parameters m and k in Table 3 are substituted into Equation (12) to obtain the relationship between the damage variable and axial strain, as shown in Figure 9.
It can be observed from Figure 9 that the damage evolution curves of C60 and C70 high-strength concrete at different confining pressures are similar to the “S” curves. At the initial stage of loading, the damage weakening is not obvious. Owing to the continuous closure of micro-pores and micro-cracks in concrete samples subjected to pressure, the concrete gradually transforms from discontinuous medium to a quasi-continuous medium. With the increase of axial strain, the concrete microdefects are further compacted and closed, and the concrete enters the elastic deformation stage. Because the stress level at this stage is not enough to cause the crack to begin to expand, the microdefects will not decrease after their closure, that is, the damage cannot occur in the real linear elastic stage. However, in the elastic deformation stage of concrete, the damage variable is still increasing slowly. This indicates that the concrete at this time not only includes the elastic deformation, but also the mutual sliding of closed cracks that shows the existence of nonlinearity at low-stress levels. When the stress of concrete exceeds a certain level or its deformation reaches a certain value, new micro-cracks begin to sprout and expand slowly between the relatively weak particle boundaries, the concrete yields and produces plastic deformation, and the damage of concrete begins to evolve and expands steadily. With the increase of the stress level, the micro-cracks in the concrete are concentrated, expanded and penetrated locally, thus forming macro-cracks, and the concrete damage develops rapidly. The main fracture surface is formed by the ladder connection of the macro-cracks that leads to the sudden release of stress and the rapid decrease of concrete strength, thus resulting in damage. However, owing to the incomplete release of elastic strain energy, the damage variable is slightly less than one. With the increase of confining pressure, the rate of change of damage with strain decreases. This indicates that the increase of confining pressure can effectively inhibit the release of elastic-strain energy and the development of damage and will improve the stress state of concrete.

5. Conclusions

(1)
At different confining pressures, the input energy density and dissipation energy density of the C60 and C70 high-strength concrete samples increased as a function of the axial strain, while the elastic strain energy density increased first and then decreased as a function of the axial strain, and reached the maximum value at the peak stress. Before the concrete sample entered the plastic stage, the dissipated energy density increased slowly as a function of the axial strain, and the input energy was basically transformed into elastic-strain energy. After the specimen was destroyed, the elastic-strain energy was released rapidly and the input energy was basically transformed into dissipation energy.
(2)
The input, elastic, and the dissipated energy densities corresponding to the peak stresses of the C60 and C70 high-strength concrete increased as a function of the increase of confining pressure, and the elastic-strain energy density corresponding to the peak stress increased linearly as a function of the confining pressure. As the elastic strain energy density of the concrete sample at the moment of failure increased, the energy release at high-confining pressures became more rapid and abrupt compared with those at low-confining pressures.
(3)
At both the pre-peak elastic strain energy storage stage and the post-peak elastic strain energy release stage, the statistical damage constitutive model curves of C60 and C70 high-strength concrete at different confining pressures were in good agreement with the experimental curves, and the average relative standard deviations were only 3.64% and 3.99%. Conversely, this constitutive model overcame the defect of low correlation between the concrete constitutive model and the test results in the post-peak stage and improved the accuracy of the model. It was also verified that the statistical damage constitutive model established from the energy theory and statistical damage theory was suitable in describing the constitutive behavior of high-strength concrete.

Author Contributions

Conceptualization, L.Z. and J.L.; methodology, L.Z.; validation, X.W. and L.G.; writing—original draft preparation, L.Z.; writing—review and editing, H.C.; funding acquisition, H.C. All authors have read and agreed to the published version of the manuscript.

Funding

This research was funded by the National Natural Science Foundation of China (51874005).

Institutional Review Board Statement

Not applicable.

Informed Consent Statement

Not applicable.

Data Availability Statement

The data used to support the findings of this study are available from the corresponding author upon request.

Conflicts of Interest

The authors declare no conflict of interest.

References

  1. Li, W.S.; Wu, J.Y. A consistent and efficient localized damage model for concrete. Int. J. Damage Mech. 2018, 27, 541–567. [Google Scholar] [CrossRef]
  2. Li, R.T.; Li, X.K. A coupled chemo-elastoplastic-damage constitutive model for plain concrete subjected to high temperature. Int. J. Damage Mech. 2010, 19, 971–1000. [Google Scholar]
  3. Nishiyama, T.; Chen, Y.; Kusuda, H.; Ito, T.; Kita, H. The examination of fracturing process subjected to triaxial compression test in Inada granite. Eng. Geol. 2002, 66, 257–269. [Google Scholar] [CrossRef]
  4. McSaveney, M.J.; Davies, T.R. Surface energy is not one of the energy losses in rock comminution. Eng. Geol. 2009, 109, 109–113. [Google Scholar] [CrossRef]
  5. Krajcinovic, D.; Silva, M.A.G. Statistical aspects of the continuous damage theory. Int. J. Solids Struct. 1982, 18, 551–562. [Google Scholar] [CrossRef]
  6. Yang, X.; Liang, N.H.; Liu, X.R.; Zhong, Z. A study of test and statistical damage constitutive model of multi-size polypropylene fiber concrete under impact load. Int. J. Damage Mech. 2019, 28, 973–989. [Google Scholar] [CrossRef]
  7. Bai, W.F.; Chen, J.Y.; Fan, S.L.; Lin, G. The statistical damage constitutive model for concrete materials under uniaxial compression. J. Harbin Inst. Technol. (New Ser.) 2010, 17, 338–344. [Google Scholar]
  8. Liang, H.; Zou, R.H.; Peng, G.; Tian, W.; Chen, X.Q. Rate-dependent constitutive model of concrete based on the statistical theory of Weibull. J. Yangtze River Sci. Res. Inst. 2016, 33, 111–114. [Google Scholar]
  9. Cervera, M.; Oliver, J.; Manzoli, O. A rate-dependent isotropic damage model for the seismic analysis of concrete dams. Earthq. Eng. Struct. Dyn. 1996, 25, 987–1010. [Google Scholar] [CrossRef]
  10. Zhou, W.; Feng, P.; Lin, H.W. Constitutive relations of coral aggregate concrete under uniaxial and triaxial compression. Constr. Build. Mater. 2020, 251, 118957. [Google Scholar] [CrossRef]
  11. Wu, J.Y.; Li, J.; Faria, R. An energy release rate-based plastic-damage model for concrete. Int. J. Solids Struct. 2006, 43, 583–612. [Google Scholar] [CrossRef] [Green Version]
  12. Zhang, H.M.; Lei, L.N.; Yang, G.S. Characteristic and representative model of rock damage process under constant confining stress. J. China Univ. Min. Technol. 2015, 44, 59–63. [Google Scholar] [CrossRef]
  13. Golewski, G.L. The benefificial effect of the addition of fly ash on reduction of the size of microcracks in the ITZ of concrete composites under dynamic loading. Energies 2021, 14, 668. [Google Scholar] [CrossRef]
  14. Chen, W.; Konietzky, H.; Tan, X.; Thomas, F. Pre-failure damage analysis for brittle rocks under triaxial compression. Comput. Geotech. 2016, 74, 45–55. [Google Scholar] [CrossRef]
  15. You, M.Q.; Hua, A.Z. Energy analysis of failure process of rock specimens. Chin. J. Rock Mech. Eng. 2002, 21, 778–781. [Google Scholar]
  16. Zhao, Z.H.; Xie, H.P. Energy transfer and energy dissipation in rock deformation and fracture. J. Sichuan Univ. (Eng. Sci. Ed.) 2008, 40, 26–31. [Google Scholar]
  17. Xie, H.P.; Li, L.Y.; Peng, R.D.; Yang, J. Energy analysis and criteria for structural failure of rocks. J. Rock Mech. Geotech. Eng. 2009, 1, 11–20. [Google Scholar] [CrossRef] [Green Version]
  18. Zuo, J.P.; Huang, Y.M.; Xiong, G.J.; Liu, J.; Li, M.M. Study of energy-drop coefficient of brittle rock failure. Rock Soil Mech. 2014, 35, 321–327. [Google Scholar]
  19. Gong, F.Q.; Luo, S.; Li, X.B.; Yan, J. Linear energy storage and dissipation rule of red sandstone materials during the tensile failure process. Chin. J. Rock Mech. Eng. 2018, 37, 352–363. [Google Scholar]
  20. Lemaitre, J. Evaluation of dissipation and damage in metals submitted to dynamic loading. In Proceedings of the 1st International Conference on Mechanical Behavior of Materials, Kyoto, Japan, 15–20 August 1971; pp. 540–549. [Google Scholar]
  21. Deng, J.; Gu, D.S. 2011 On a statistical damage constitutive model for rock materials. Comput. Geosci. 2011, 37, 122–128. [Google Scholar] [CrossRef]
  22. Fu, Q.; Xie, Y.J.; Song, H.; Zhou, H. Model for mechanical properties of cement and asphalt mortar. J. Chin. Ceram. Soc. 2014, 42, 1396–1403. [Google Scholar]
  23. Wang, Z.L.; Li, Y.C.; Wang, J.G. A damage-softening statistical constitutive model considering rock residual strength. Comput. Geosci. 2007, 33, 1–9. [Google Scholar] [CrossRef]
  24. Guo, J.Q.; Liu, X.R.; Zhao, Q. Theoretical research on rock unloading mechanical characteristics. Rock Soil Mech. 2017, 38, 123–130. [Google Scholar]
Figure 1. ZTCR-2000 rock triaxial testing system.
Crystals 11 00800 g001
Figure 2. Conventional triaxial stress–strain curves of high-strength concrete. (a) C60 and (b) C70.
Crystals 11 00800 g002
Figure 3. Failure modes of C60 and C70 high-strength concrete at different confining pressures. (a) C60 and (b) C70.
Crystals 11 00800 g003
Figure 4. Relationships between energy density and axial strain of high-strength concrete (C60 and C70) at different confining pressures. (a) C60, σ 3 = 0 MPa ; (b) C70, σ 3 = 0 MPa ; (c) C60, σ 3 = 5 MPa ; (d) C70, σ 3 = 5 MPa ; (e) C60, σ 3 = 10 MPa ; (f) C70, σ 3 = 10 MPa ; (g) C60, σ 3 = 15 MPa ; (h) C70, σ 3 = 15 MPa ; (i) C60, σ 3 = 20 MPa ; (j) C70, σ 3 = 20 MPa .
Crystals 11 00800 g004aCrystals 11 00800 g004b
Figure 5. Relationships between confining pressure and U F P and U D P . (a) Relationship between U F P and σ 3 ; (b) Relationship between U D P and σ 3 .
Crystals 11 00800 g005
Figure 6. Relationship between confining pressure and U E P .
Crystals 11 00800 g006
Figure 7. Relationship between confining pressure and final elastic-strain energy density.
Crystals 11 00800 g007
Figure 8. Comparison of constitutive model and test results. (a) C60 and (b) C70.
Crystals 11 00800 g008
Figure 9. Relationship between damage variable D and axial strain. (a) C60 and (b) C70.
Crystals 11 00800 g009
Table 1. Mixture proportions of C60 and C70 high-strength concrete.
Strength GradeCement (kg/m3)Admixture (kg/m3)Cementing Materials (kg/m3)Sand (kg/m3)Gravel (kg/m3)Water (kg/m3)Sand RateWater Cement Ratio
C6041513555062011051750.360.42
C7042514557061510951700.360.4
Table 2. Main technical parameters of ZTCR-2000 rock triaxial test system.
ProjectTechnical Parameters
Maximum axial test force2000 kN
Test force accuracy±1%
Test force resolution1/180,000
Maximum displacement of piston120 mm
Displacement accuracy±0.5% FS
Displacement resolution5 μm
Deformation measurement accuracy±1%
Deformation resolution1/180,000
Maximum confining pressure50 MPa
Confining pressure accuracy±1%
Confining pressure resolution1/180,000
Minimum control temperature−20 °C
Temperature control accuracy±0.5 °C
Table 3. Mechanical parameters of high-strength concrete (C60 and C70) at different confining pressures.
σ 3   ( MPa ) σ 1 σ 3   ( MPa ) Elastic Modulus (GPa)Poisson’s Ratio
C60C70C60C70C60C70
065.3884.4128310.310.29
581.96100.2229320.280.26
1098.26115.9831330.290.26
15114.01128.2233350.280.28
20129.12141.6734360.260.26
Table 4. Weibull distribution parameters m and k at different confining pressures.
Confining Pressure (MPa)Weibull Distribution ParametersR2
C60C70C60C70
mkmk
03.5761.5383.3112.7470.9620.978
52.4931.2251.9732.1460.9840.988
101.7780.9971.7661.0560.9910.982
151.7180.9471.4530.9160.9940.992
201.1460.9191.2330.7620.9890.985
Publisher’s Note: MDPI stays neutral with regard to jurisdictional claims in published maps and institutional affiliations.

