Article

Mechanisms of Grain Structure Evolution in a Quenched Medium Carbon Steel during Warm Deformation

Laboratory of Bulk Nanostructured Materials, Belgorod State University, 85 Pobeda Str., 803015 Belgorod, Russia
*
Author to whom correspondence should be addressed.
Crystals 2020, 10(7), 554; https://doi.org/10.3390/cryst10070554
Submission received: 13 June 2020 / Revised: 25 June 2020 / Accepted: 26 June 2020 / Published: 29 June 2020
(This article belongs to the Special Issue Crystal Plasticity)

Abstract

:
The as-quenched medium-carbon low-alloy Fe-0.36wt.%C-1wt.%Cr steel was subjected to warm deformation via uniaxial compression at temperatures of 400–700 °C and strain rates of 10−4–10−2 s−1. At low temperatures (400–550 °C), the microstructure evolution was mainly associated with dynamic recovery with the value of activation energy of 140 ± 35 kJ/mol. At higher temperatures (600–700 °C), dynamic recrystallization was developed, and activation energy in this case was 243 ± 15 kJ/mol. The presence of nanoscale carbide particles in the structure at temperatures of 400–600 °C resulted in the appearance of threshold stresses. A two-component <001>//compression direction (CD) and <111>//CD deformation texture was formed during deformation. Deformation at the low temperatures resulted in the formation of elongated ferritic grains separated mainly by high-angle boundaries (HAB) with a strong <001>//CD texture. The grains with the <111>//CD orientation were wider in comparison with those with the <001>//CD orientation. The development of substructure in the form of low-angle boundaries (LAB) networks was also observed in the <111>//CD grains. The development of dynamic recrystallization restricted the texture formation. The processing map for warm deformation of the 0.36C-1Cr steel was constructed.

1. Introduction

Medium-carbon low-alloy (MCLA) steels are a workhorse material of modern industry due to their low cost and high performance. Generally, MCLA steels are used as structural materials for the machine components’ production. The main problem of these steels is the lack of ductility and toughness at low temperatures. The mechanical properties can be improved significantly due to microstructure refinement obtained by thermomechanical treatments at relatively low temperatures [1,2,3,4,5]. The martensitic initial structure was found to be very promising to receive a fine-grained structure by warm deformation [5]. For instance, according to Reference [6], an as-quenched Fe-1.2wt.%C steel had better workability in comparison with that in an initially spheroidized condition. One of the attractive strategies of warm deformation to receive an excellent balance of strength, ductility and toughness in a wide range of temperatures is the formation of an elongated fine-grained (EFG) structure with nanoscale carbide particles and a strong deformation texture [7], that has recently been applied in industry [8]. This microstructure can be obtained using warm deformation of as-quenched MCLA steels with the martensitic structure [7,8,9,10]—this working is sometimes defined as tempforming [11]. During warm deformation, various processes, including precipitation and/or spheroidization of carbide particles, dynamic recovery, dynamic recrystallization, elongation of ferritic grans along the deformation direction and texture formation, can develop in MCLA steels with the martensitic structure [11,12,13]. The completeness and order of these processes substantially depend on warm deformation parameters, such as temperature, strain rate and strain magnitude [14].
In comparison with ferrite-perlite steels, production of ultrafine grain structure in as-quenched low- or high-alloyed steels usually requires relatively low strain (up to 50%) due to early development of dynamic recrystallization (DRX) [12,15,16,17]. Besides, further grain refinement during DRX can be obtained at increased strain rate and/or decreased deformation temperature [18]. For example, warm deformation of an as-quenched Fe-0.45wt.%C steel at 550–600 °C resulted in the formation of an ultra-fine-grained ferritic structure with nanoscale carbides due to the development of DRX [15,19,20]. The nanoscale carbides can impede boundary motion through the pinning effect [10,21,22], thereby stabilizing the structure.
On the other hand, warm deformation of an as-quenched Fe-0.4wt.%C-2wt.%Si-1wt.%Cr-1wt.%Mo steel during rolling at 500 °C resulted in the formation of a fibrous fine-grained structure with a strong deformation texture that provided excellent mechanical properties [14]. Furthermore, a <110>//rolling direction (RD) deformation texture in ferrite became weaker while ferritic grains became coarser and more equiaxed with an increase in deformation temperature. In addition, an increase in deformation temperature resulted in the weakening of a <110>//RD texture component during swaging of an as-quenched Fe-0.43wt.%C-0.63wt.%Cr steel in the temperature range of 500 to 600 °C [23].
Analysis of the available literature suggested that the microstructure evolution during warm deformation of as-quenched MCLA steels was mainly studied for quite a narrow temperature interval, while low temperatures remain almost unexplored. Meanwhile, evolution of the martensite microstructure during warm deformation also deserves additional attention, particularly due to the high density of lattice defects in such materials. The relationship between texture formation and DRX during warm deformation should also be studied more comprehensively. Thus, the aim of this work was to examine the martensite microstructure evolution and mechanical behavior of an as-quenched MCLA steel during warm deformation at 400–700 °C.
In the present article, mechanical behavior during compression tests is studied, and activation energy and threshold stress are calculated at different temperatures (Section 3.1 Mechanical Behavior). Additionally, the texture and structure evolution are investigated (Section 3.2 Microstructure Evolution). Finally, a processing map is constructed and discussed in association with the observed structure evolution (Section 3.3 Processing Map Analysis).

2. Materials and Methods

A medium-carbon low-alloy steel with a nominal chemical composition of (in wt.%) Fe-0.36C-0.91Cr-0.62Mn-0.34Si-0.21Ni-0.15Cu-0.017P-0.022S was used as the program material. Compression specimens measuring 8 × 8 × 10 mm3 were cut from an as-received hot rolled bar using an electric-discharge machine (EDM), Sodick AQ300L (Sodick Co, Fukui, Japan). To produce a fully martensite structure (which is defined hereafter as the initial one), the specimens were oil-quenched from 860 °C. Compression tests were carried out at 400, 450, 500, 550, 600, 650 or 700 °C, with an initial strain rate of 10−2, 5·10−2, 1.3·10−3, 5·10−3 or 10−4 s−1 using an Instron 300XL test machine equipped with a radial heating furnace (Instron, Norwood, MA, USA). At least two samples were tested for each condition. The samples were heated up with a rate of 4°/min and held for 10 min at deformation temperatures before the tests. The temperature during compression was controlled by a thermocouple attached to the specimen side.
Microstructure was studied in specimens compressed to a true strain (ε) of 0, 0.3, 0.77 or 1.15 at a strain rate of 1.3·10−3 s−1 and temperatures of 400, 500, 600 or 700 °C. At 400 °C, the maximum attained true strain was 0.97. Samples for electron back scattering diffraction (EBSD) and transmission electron microscopy (TEM) analysis were cut from the central part of the deformed specimens by the EDM, then mechanically thinned to 0.1 mm and polished at room temperature using a twin-jet electro-polisher TenuPol-5 (Struers ApS, Ballerup, Denmark) in a mixture of 10% perchloric acid and 90% glacial acetic acid at a voltage of 29 V. The observation plane was normal to the compression direction. EBSD analysis was carried out using a FEI Nova NanoSEM 450 scanning electron microscope (SEM) (FEI Company, Hillsboro, Oregon, USA) equipped with an EDAX Hikari EBSD camera (EDAX, Mahwah, NJ, USA). EBSD maps measuring 20 × 20 µm2 or 45 × 45 µm2 were obtained with a step size of 50 nm. TEM observations were performed using a Jeol JEM 2100 microscope (JEOL, Tokyo, Japan) operating at an accelerating voltage of 200 kV.

3. Results and Discussion

3.1. Mechanical Behavior

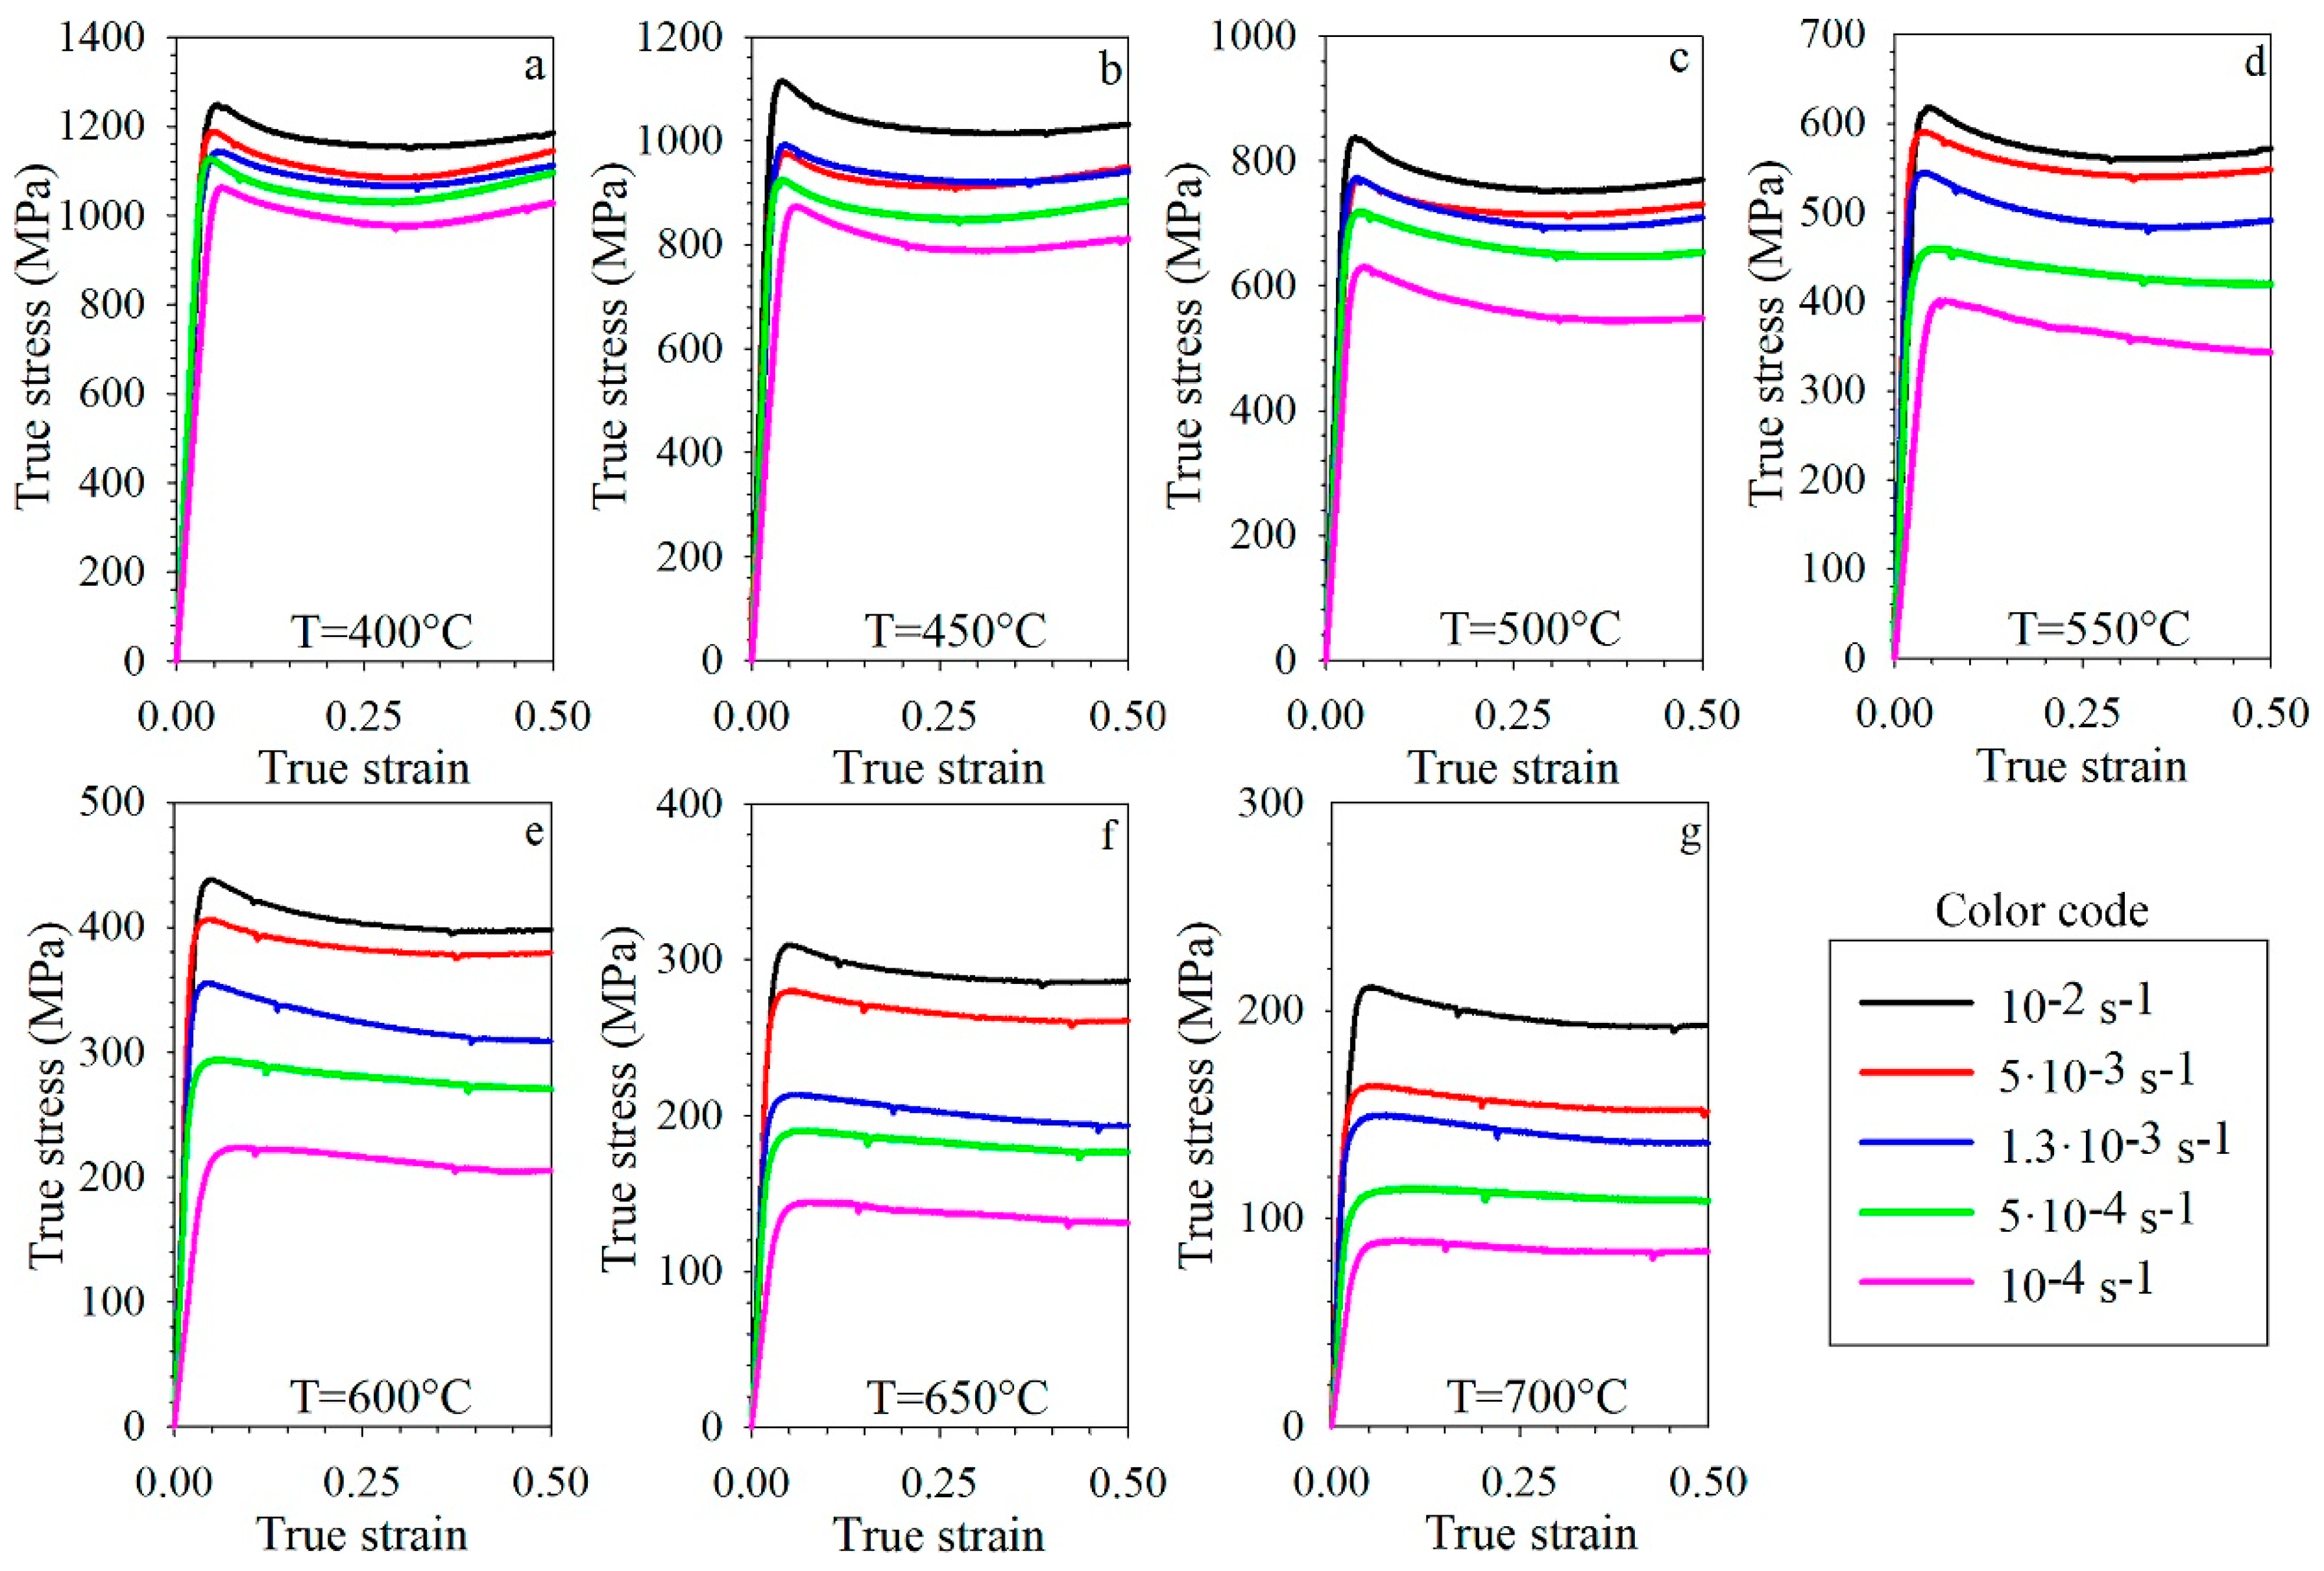
Compression curves of the as-quenched Fe-0.36wt.%C-1wt.%Cr steel obtained at different conditions expectedly show a decrease in flow stress with an increase in deformation temperatures and/or decrease in strain rates (Figure 1). Each curve for temperatures of 400–550 °C shows a peak soon after yielding, and the magnitude of the peak decreased with an increase in temperature (Figure 1a–e). At higher temperatures, the peaks were observed at high strain rates only, i.e. 1.3·10−3–10−2 s−1 (Figure 1e–g).
After reaching the peak stress, a work-softening stage was observed (Figure 1a–e). The work-softening became less pronounced with an increase in temperature or with a decrease in strain rate. At 500 °C and low strain rates (10−4–5·10−3 s−1), or at higher temperatures of 550–700 °C and any examined strain rates, a steady-stage flow stage was observed after softening. Some increase in flow stress at ε~0.35 at relatively low temperatures (400–500 °C) can be associated with friction between the die and the specimen surfaces (Figure 1a,b).
The observed mechanical behavior is typical of as-quenched steels during deformation in the temperature interval of tempering [12,15,20]. Specifically, the stress peak and subsequent work-softening stage can be ascribed to the development of dynamic recrystallization [24,25]. However, the most pronounced work-softening was observed for specimens strained at low temperatures and high strain rates, where dynamic recrystallization was not confirmed by microstructure analysis (see Section 3.2). Another factor which can influence the mechanical behavior can be associated with the martensite decomposition during deformation. Heating to rather low deformation temperatures does not necessarily result in a complete transformation of martensite into a mixture of ferrite and carbides. Therefore, this process proceeds during warm working, increasing both the peak flow stress and the work-softening rate [15].
The results of compression tests showed a strong dependence of mechanical behavior on temperature and strain rate. To establish mechanisms of plastic deformation operated at different conditions, the activation energy of deformation was determined using the Arrhenius equation [26,27]:
ε = A ( σ G ) n exp ( Q RT ) ,
where   ε is the strain rate (s−1), σ is the flow stress (MPa), G denotes the shear modulus (MPa), R is the universal gas constant (8.314 J·mol−1·K−1), T is the absolute temperature (K), Q is the activation energy of deformation (kJ·mol−1) and A and n are constants.
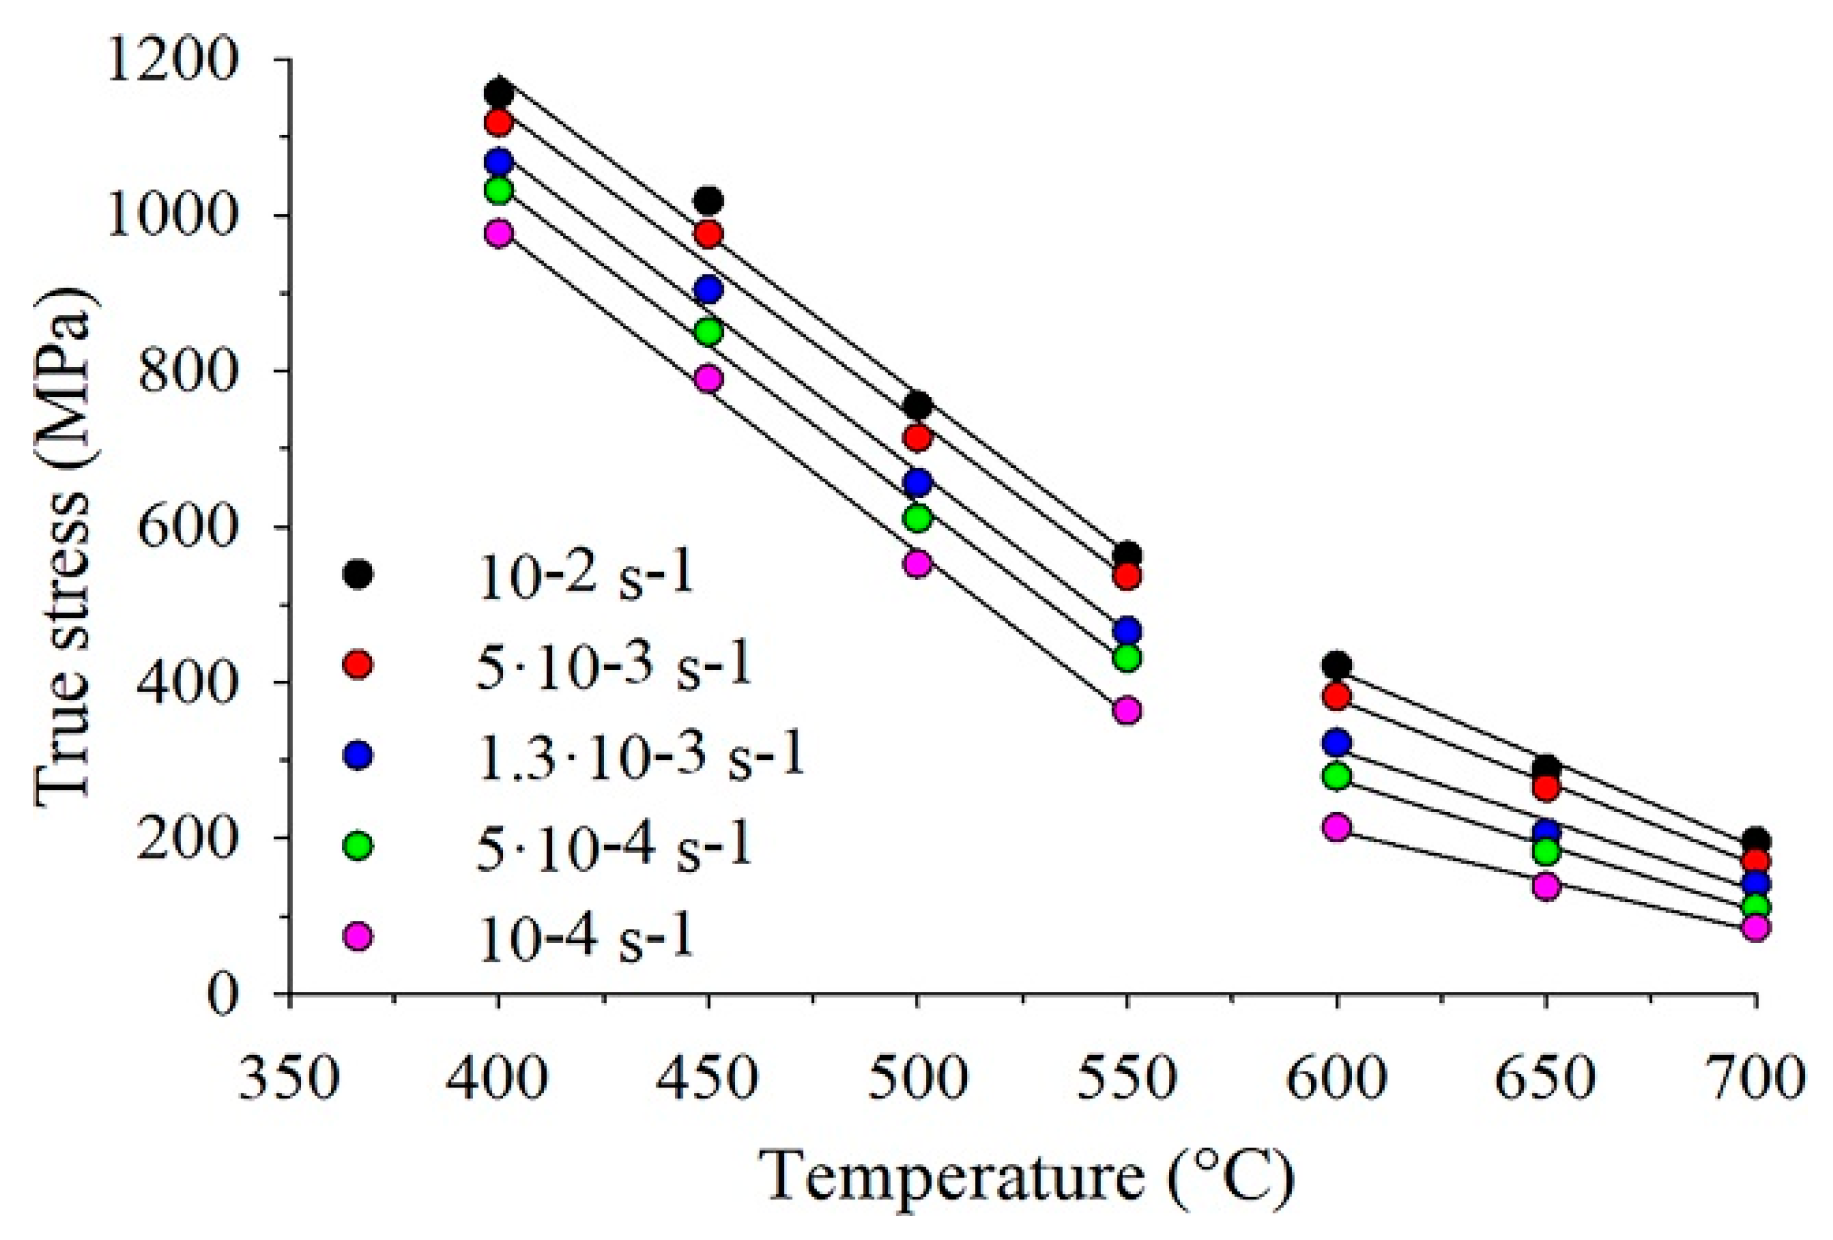
Since the steady-stage flow stage cannot be recognized at some compression curves, the value of stress corresponding to ε = 0.25 was used for activation energy analysis (Figure 1). Dependences of flow stress on deformation temperature for different strain rates revealed an inflection point at 550–600 °C (Figure 2) that may suggest different controlling mechanisms of deformation in two temperature intervals: 400–550 °C and 600–700 °C.
The shear modulus value was estimated using the following equation [26]:
G = 6.4 10 4 ( 1 0.81 ( T 300 ) 1810 ) { 3.2 10 2 ( T 573 ) 2 , if   T > 573 K 2.4 10 2 ( T 923 ) 2 , if   T > 923 K
The activation energy of plastic deformation in the temperature range 600–700 °C was determined using the following relations:
n = ln ( ε ) ln ( σ / G ) | T ,
and:
Q = R · n · ln ( σ / G ) ( 1 / T ) | ε .
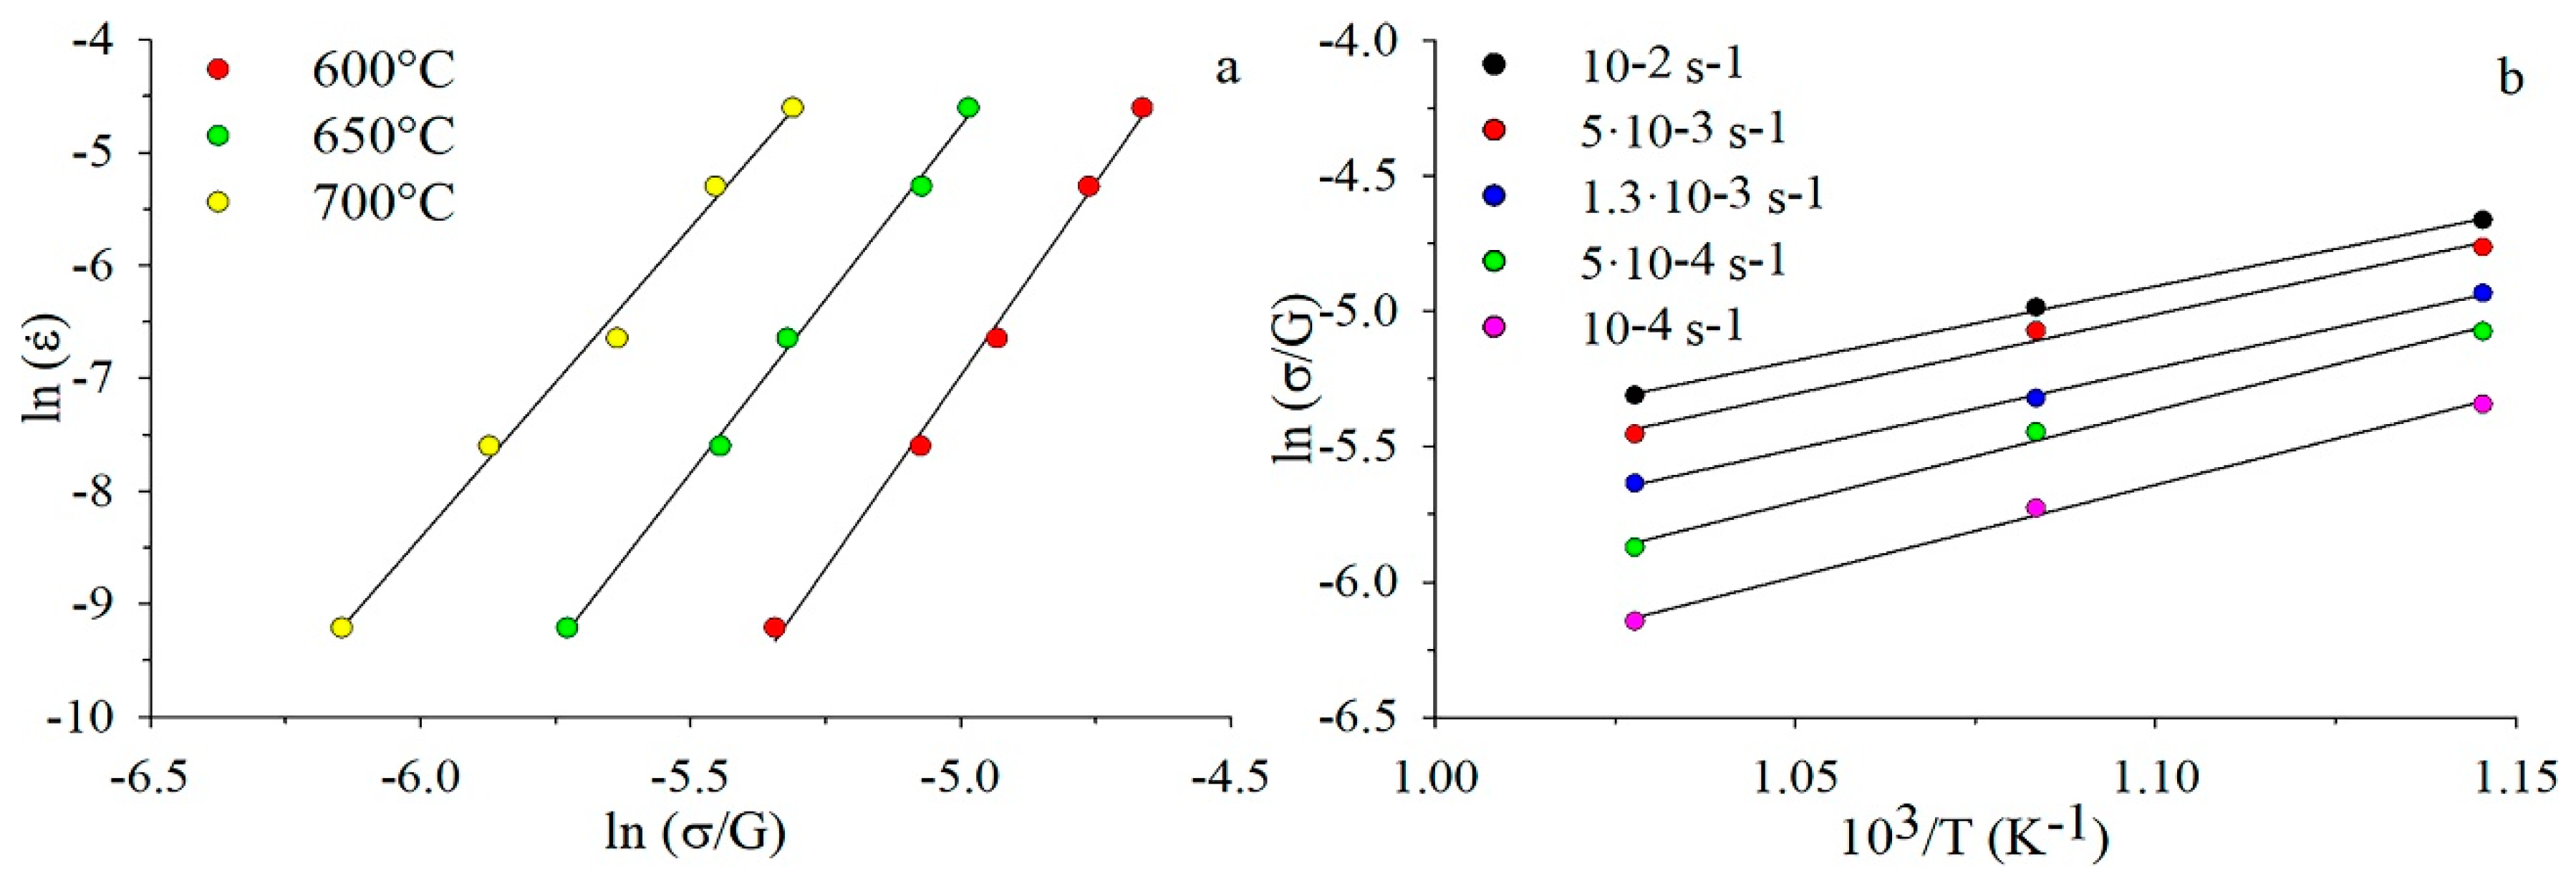
The values of n and Q can be found as the slope of the ln( ε ) – ln(σ/G) and ln(σ/G) – 103/T plots (Figure 3), respectively. The value of n changed from 6.8 to 5.5 for 600 and 700 °C, respectively. The activation energy was found to be 316 ± 35 kJ/mol using the mean value of n = 6.2 and by averaging different values of Q at five strain rates.
In the lower temperature interval (400–550 °C), the n values were unusually high: 27 at 400 °C and 10 at 550 °C. The activation energy Q = 470 kJ/mol was much higher than that for the interval 600–700 °C; generally, very high values of n and Q are associated with the presence of the threshold stresses σth. The values of σth were determined as the stress level below which no strain rate can be detected [28]. When the stress level exceeds σth, the strain rate is greater than zero. Therefore, the values of σth can be estimated by extrapolating the ε 1/n – σ linear relations (plotting for different n) to the zero strain rate [28,29] (Figure 4).
The obtained values of σth and n for different temperatures are presented in Table 1. At low temperatures, σth was very high; for example, at 400–450 °C, the threshold stress was a half of the flow stress. However, with an increase in temperature, σth quickly decreased, reaching σth = 43 MPa at 600 °C and disappearing at 700 °C. The n values also decreased from 14 at 400 °C to 6 at 600–650 °C.
Equation (1) with the threshold correction can be expressed as follows:
ε = A ( σ σ th G ) n exp ( Q RT ) .
The corrected activation energy for temperatures 400–550 °C was found to be Q = 140 ± 35 kJ/mol (n = 9.5 was accepted for the lower temperature domain; Table 1). The obtained value of Q agrees reasonably with the activation energy for pipe self-diffusion in α-iron (174 kJ/mol) [26] or with data obtained in Reference [30] for a Fe-0.6wt.%O steel by creep testing at temperatures of 550–650 °C (185 ± 15 kJ/mol). In the latter case, the main deformation mechanism was non-conservative movement of dislocations also controlled by self-diffusion along the dislocation cores. The higher activation energy reported in Reference [30] can be associated with greater stability of iron oxides against coagulation, in comparison to that of carbides that results in more dispersed oxide particles and a smaller interparticle space.
In the higher temperature interval of deformation (600–700 °C), the obtained value of Q = 243 ± 15 kJ/mol at n = 6.0 is quite close to the activation energy for volume self-diffusion in α-iron (251 kJ/mol) [26]. A little bit higher activation energy in our case can be associated with greater stability of iron oxides against coagulation in comparison to that of carbides that results in more dispersed oxide particles and a smaller interparticle space. For example, it was reported in Reference [30] that an increase in creep testing temperature to 700 °C and corresponding coagulation of oxides resulted in an increase in the activation energy to 259 ± 15 kJ/mol in the Fe-0.6O steel.
Even higher activation energy of 372.8 kJ·mol–1 at temperatures of 550–700 °C and strain rates of 0.001–1.0 s−1 was reported in Reference [15] for the as-quenched Fe-0.45wt.%C steel during warm deformation. This difference can be caused by the higher carbon content and a shorter exposure time before deformation (10 min in our case versus 3 min in Reference [15]), resulting in a higher amount of finer carbides which provides an effective obstacle for dislocation and boundary motion during deformation. However, the activation energy value at 550–700 °C in a 1.2%C steel was found to be higher in the as-quenched steel (Q = 331.56 kJ/mol) due to a more pronounced pinning effect by fine cementite particles in comparison to that in the spheroidized condition (Q = 297.94 kJ/mol) [6].

3.2. Microstructure Evolution

Microstructure of the as-quenched Fe-0.36wt.%C-1wt.%Cr steel (Figure 5a) consisted of initial austenitic grains divided by martensite packets, blocks or laths [31]. Subsequent soaking of the as-quenched steel at 400, 500, 600 or 700 °C for 10 min resulted both in the martensite decomposition and in the onset of recovery and recrystallization development [32,33] (Figure 5b–e). Inverse pole figures (IPF) maps show that the finest structure formed at 400 °C (Figure 5b). With an increase in the temperature to 500 or 600 °C (Figure 5c,d), martensite laths gradually transform into relatively large areas of tempered martensite (the microstructure is still martensite; however, the concentration of carbon is already close to that in ferrite [32]). Heating to 700 °C promoted the formation of large ferrite grains with irregular shape primarily surrounded by martensitic packets (Figure 5e). The incomplete martensite decomposition caused by the short exposure at the elevated temperatures can be terminated during further warm deformation [11].
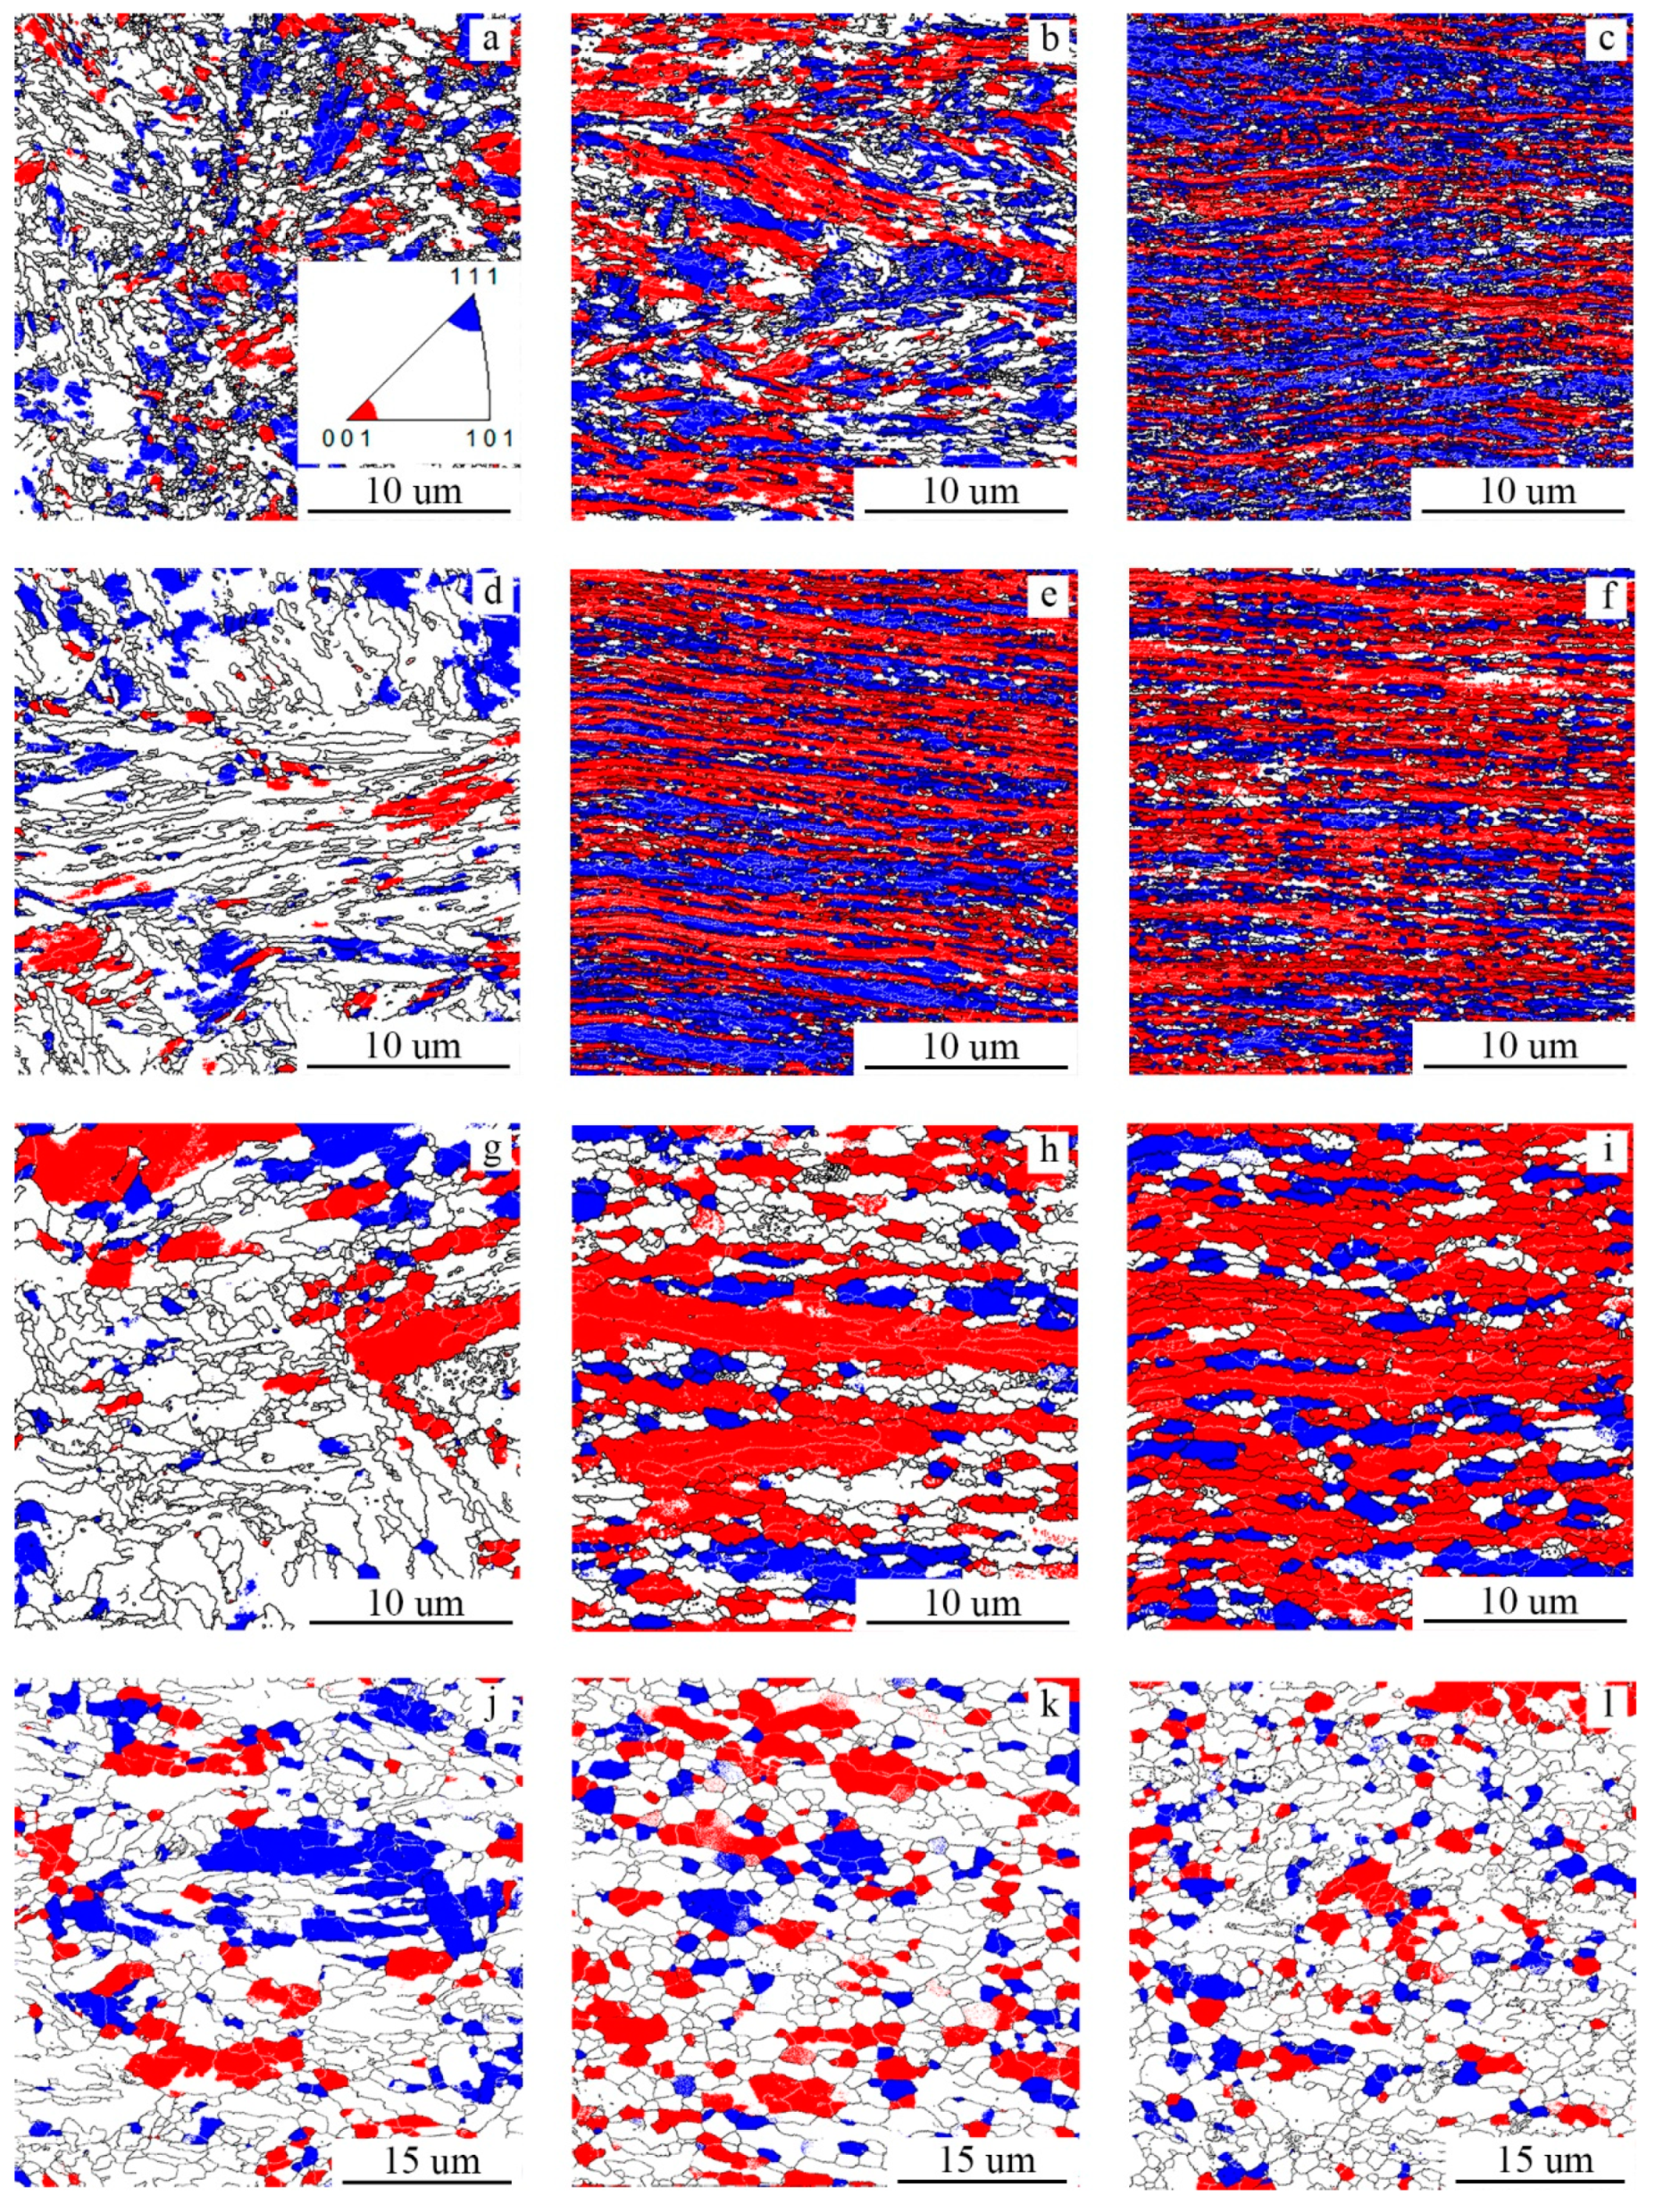
Texture component maps showed gradual formation of a two-component (<001>//compression direction (CD) and <111>//CD) deformation texture during compression of the program steel to a true stain of 1.15 at 400, 500, 600 or 700 °C and a strain rate of 1.3·10−3 s−1 (Figure 6). However, the texture and microstructure evolution during warm deformation strongly depended on deformation temperature.
Compression at 400 °C resulted in the formation of a “pancaked” structure comprising highly elongated ferrite grains with a strong <001>//CD texture, and the grains were mainly separated by high-angle boundaries (HABs) (Figure 6a–c). This type of microstructure was obtained by flattening of the initial grains (Figure 5a) due to the geometrical effect of plastic deformation. The grains with the <111>//CD orientation were usually wider in comparison with those with the <001>//CD orientation. The development of substructure in a form of low-angle boundaries (LAB) networks was often observed in the <111>//CD grains. After deformation to ε = 0.97, the volume fractions of the <001>//CD and <111>//CD components reached 32% and 52%, respectively (Table 2).
An increase in the compression temperature to 500 °C did not result in significant changes in the microstructure evolution. The microstructure was mostly composed of areas with both the <001>//CD and <111>//CD orientations—the latter were somewhat thicker after compression to ε = 0.77 (Figure 6e). After ε = 1.15, both structural constituents had a similar morphology of the elongated grains with predominantly high-angle misorientations (Figure 6f). Also, when the strain increased from ε = 0.77 to ε = 1.15, the fraction of the <001>//CD component remained at the same level of 49%, but the <111>//CD component fraction decreased from 41% to 31% (Table 2).
A further increase in the deformation temperature to 600 °C resulted in the formation of a much coarser, partially recrystallized structure (Figure 6g–i). The <001>//CD orientation became the dominant component, and its fraction gradually increased with strain reaching 57% at ε = 1.15. The development of a substructure was evident in the <001>//CD oriented regions. Meanwhile, the <111>//CD orientation fraction was considerably lower, only 19% at ε = 1.15 (Table 2). The microstructure became coarser and more equiaxed after deformation at 700 °C, most probably due to the development of the recrystallization processes (Figure 6g–l). Both the <001>//CD and <111>//CD orientation fractions were reduced dramatically. The morphology of grains with different texture components was quite similar after deformation at the high temperatures. The total fraction of both components did not exceed 30%. It is also worth noting that an increase in ε from 0.3 to 0.77 at 700 °C resulted in a considerable decrease in the fraction of the <111>//CD orientation, from 17% to 9% (Table 2). A similar phenomenon was observed during deformation at 500 °C to ε = 0.77 and ε = 1.15 (Table 2). However, a decrease in the volume fraction of areas with the <111>//CD texture at 600 °C was not detected.
It is also worth noting that the two-component <001>//CD and <111>//CD texture is not always observed after warm deformation. For example, in a Fe-0.4wt.%C-2wt.%Si-1wt.%Cr-1wt.%Mo steel with the initial martensite structure, a single-component <110>//RD deformation texture was observed after warm rolling [11]. The variations in the texture can most probably be attributed to the different character of the material flow depending on the processing scheme.
The dependence of the average distance between HABs (measured along the compression axis) on the deformation temperature and compression strain (Table 3) shows several trends. First, the initial (ε = 0) HABs spacing increased pronouncedly with an increase in the temperature. This finding agrees well with the observed changes in the microstructure (Figure 2). Second, deformation resulted in a continuous decrease in the HABs spacing at each temperature, though with different rates of the microstructure refinement. For instance, at 400 °C, the HABs spacing decreased from 0.78 to 0.19 µm as a result of compression to ε = 0.97. Meanwhile, deformation to ε = 1.15 at 700 °C decreased the boundary spacing from 1.52 to 1.07 µm only. In other words, the microstructure refinement was more evident at lower temperatures, most likely because of sluggish dynamic recrystallization (in contrast to higher temperatures).
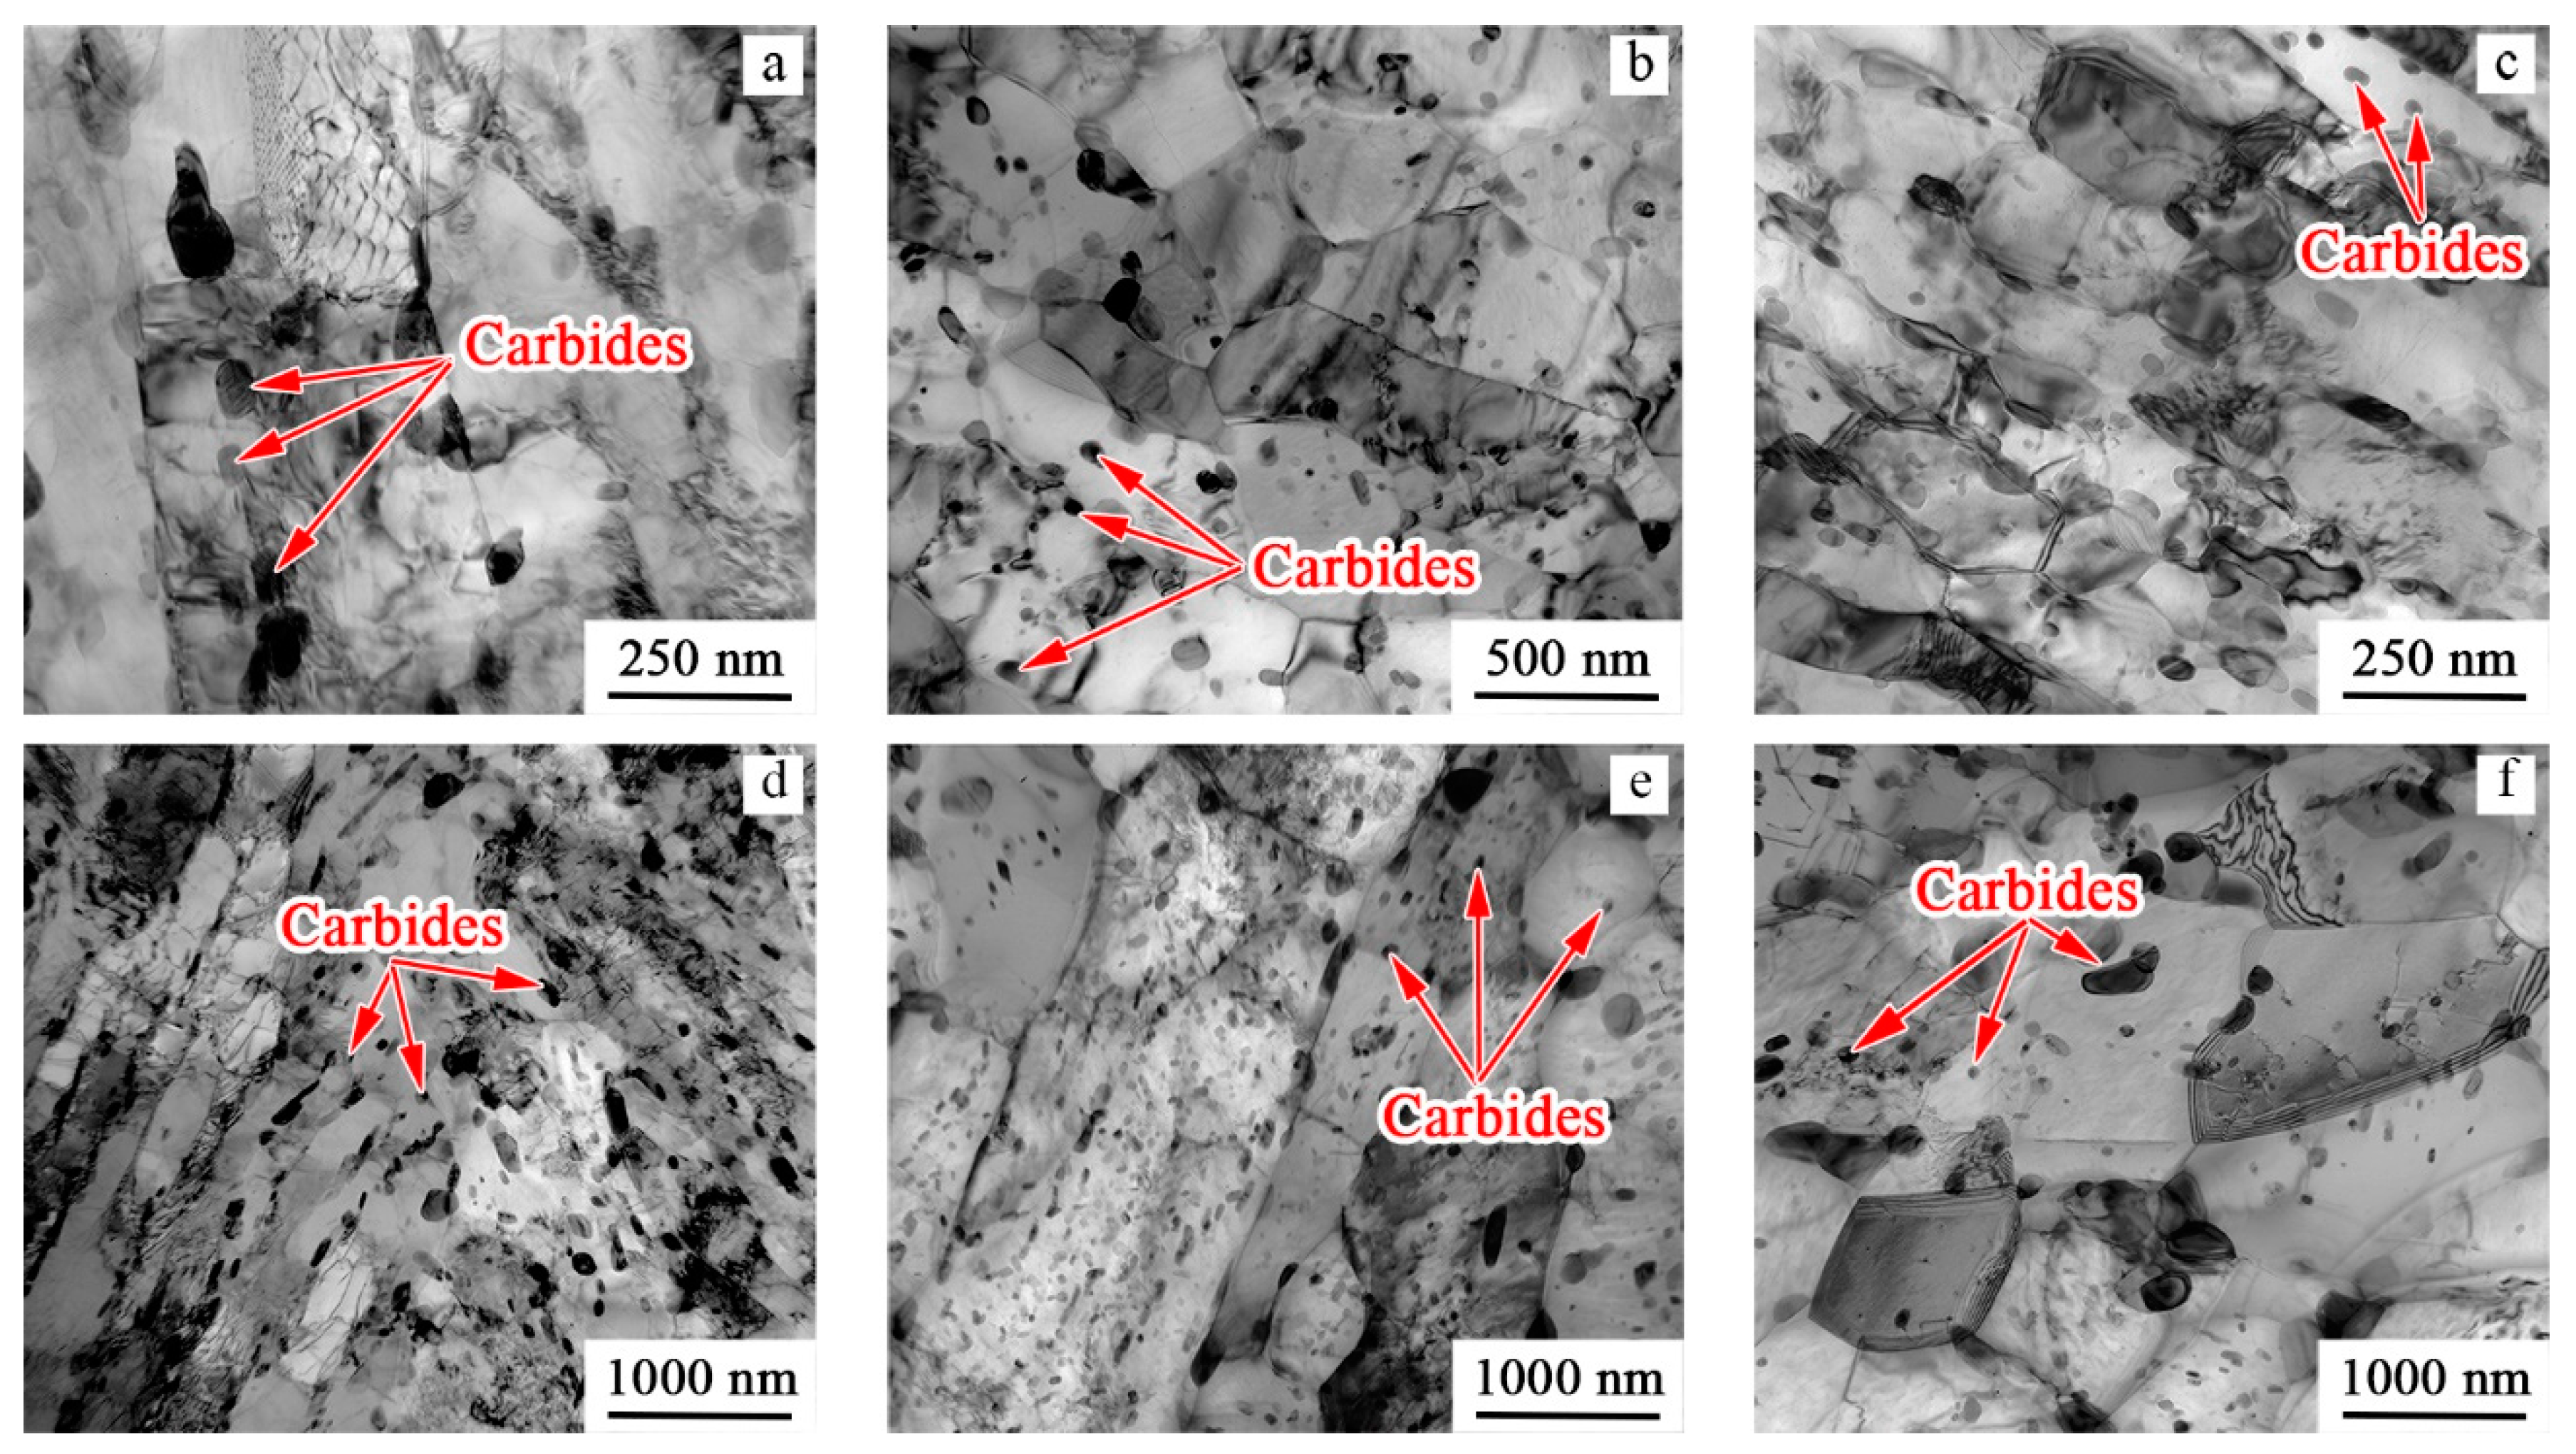
TEM analysis (Figure 7, Figure 8 and Figure 9) showed that after heating to 400 °C, the structure of the steel was comprised of tempered martensite laths with dislocation arrays inside them (Figure 7a) and two types of carbides: fine (<20 nm), almost equiaxed, and coarser rod-shaped particles (length 120 nm and thickness 20 nm). The rod-shaped carbides were predominantly located at the lath boundaries, but some of them were found inside the laths. After compression to ε = 0.3 (Figure 7b), due to the development of dynamic recovery, the dislocation density decreased, and transversal low-angle boundaries were observed in some laths. The fraction of the rod-shaped carbides located inside the laths increased, and this can suggest that boundaries broke from the obstacles during motion, leaving the carbides behind in grain volume. Further straining at 400 °C resulted in a considerable thinning of the laths/grains (Figure 7c). Fine, nearly equiaxed carbides (10 nm) were also observed inside elongated grains. Their formation can be associated with either coalescence of the initial fine carbides or with the fragmentation of the coarser rod-shaped particles.
After heating to 500 °C (Figure 7d), the microstructure became somewhat coarser in comparison with that at 400 °C. Some of the laths were almost free of dislocations while some of them contained dislocation arrays and pile-ups. Carbide particles (length 50 nm and thickness 20 nm) of elliptical shape were mainly located at lath boundaries. After deformation, fine elongated grains were observed (Figure 7e,f). Inside the grains, dislocation pile-ups and transversal sub-boundaries formed. In addition, some very fine equiaxed grains (diameter 200 nm) were observed—an example is shown in the insert in Figure 7f at a higher magnification. Note that these grains were often found close to the carbide particles. Some carbides (length 55 nm and thickness 20 nm), arranged in chains, were also found inside the laths/grains (Figure 7e), thereby suggesting boundaries’ motion.
With an increase in the heating temperature to 600 °C (Figure 8a) or 700 °C (Figure 8d), a microstructure consisted of rather coarse and elongated ferrite grains/sub-grains instead of martensitic laths. The overall dislocation density was quite low, yet dislocation pile-ups and arrays were found inside some grains. The carbides were coarse and nearly equiaxed (55 nm at 600 °C and 70 nm at 700 °C), however some of them still had an elliptical shape. The carbide particles were found both inside grains/sub-grains and at their boundaries. Compression at these high temperatures resulted in a decrease in dislocation density, obviously due to the development of DRX (Figure 8b,c,e,f). Some fine, dislocation-free equiaxed recrystallized grains with Moir fringes at the boundaries were observed. Carbides were often found at the boundaries of these recrystallized grains. In addition, the carbides became even more equiaxed after deformation at 700 °C, and some increase in size of the carbides from 70 to 110 nm was observed, with an increase in strain from ε = 0 to ε = 1.15.
The activation energy analysis and examination of the microstructure evolution of the as-quenched steel during warm deformation suggests two different controlling mechanisms: dynamic recovery in the interval of 400–550 °C and continuous DRX at 600–700 °C. Specifically, elongated granular structure with fine carbide nanoparticles and high dislocation density inside was found after deformation in the lower-temperature interval. At large strains, some fine equiaxed dislocation-free grains appeared (Figure 5e,f), most probably via discontinuous DRX [25]. However, the pinning effect of carbide nanoparticles and low temperatures made the discontinuous DRX effect insignificant [22]. Moreover, the nanoscale carbide particles in the structure served as obstacles for dislocation motion and influenced on the threshold stresses. An increase in the size of carbides from <20 nm to 55 nm, with a temperature rise from 400 to 600 °C respectively, decreased the threshold stress value from 522 to 43 MPa (Table 1). Specifically, there was not any threshold stress revealed at 700 °C, where the average size of carbide particles achieved 75 nm.
In the current work, the formation of a close to equiaxed structure with low dislocation density and coarser carbides suggested the development at higher temperatures (600–700 °C) of continuous DRX. Similar processes were also observed earlier during deformation at the same temperatures of steels with the initial martensite [12,15,16] or ferrite-perlite [17,22] structures. Meanwhile, the development of discontinuous DRX after large strain at low temperatures (about 500 °C) requires an additional study.
Moreover, the texture development also depended strongly on the temperature and mechanisms of the structure formation. The development of discontinuous DRX inhibited the formation of the <111>//CD orientation fraction in comparison with <001>//CD at a temperature of 500 °C. The formation of different form <111>//CD and <001>//CD orientations (white areas in Figure 6f) and simultaneous drop of the <111>//CD orientation volume fraction (Table 2) can indicate predominant development of discontinuous DRX inside of the <111>//CD oriented volumes. In the lower-temperature interval, the fractions of these components were comparable. Besides, an increase in the warm deformation temperature expectedly led to a less pronounced deformation texture [11].
The carbides precipitation/evolution was also linked to the microstructure evolution. On the one hand, just before the deformation, the solid solution was supersaturated with carbon [32]. Subsequent warm deformation led to intensive formation of the carbide particles which could inhibit dynamic recrystallization [34]. On the other hand, strain-induced decomposition of carbides can be expected [35], however the volume fraction of the carbides did not decrease during deformation. In fact, strain-induced particles were found even in interstitial-free steel after warm deformation [3]. The obtained results suggest dividing of coarser rod-shaped carbides into smaller particles in the lower-temperature interval (Figure 7a,b), and a similar observation was earlier described in Reference [6].

3.3. Processing Map Analysis

The results obtained show a significant dependence of mechanical behavior and microstructure evolution of the as-quenched steel during compression on process parameters (i.e., temperature, strain and strain rate). Generally, elongated microstructure with a developed two-component texture was formed at low temperatures (400 °C and 500 °C), but at high temperatures (600 °C and 700 °C), the formation of equiaxed grains with a weak texture occurred due to the DRX development.
The features of processes in the program steel, occurring during warm deformation, determined the efficiency of power dissipation, which was evaluated in a number of studies using a dynamic material model [24,36,37,38]. The efficiency of power dissipation (η) during deformation processes can be calculated as follows:
η = 2 m m + 1 ,
where m is the strain rate sensitivity:
m = ln ( σ ) ln ( ε ) | ε , T .
A processing map, representing the efficiency of power dissipation (η) for warm deformation at ε = 0.35, was constructed using the results of the calculation (Figure 9). This value of strain (0.35) was chosen to avoid the influence of friction between the specimen surface and the die at higher strains, especially at low temperatures. The border between the dynamic recovery/dynamic recrystallization areas corresponded to η~0.2 [36], that, depending on a strain rate, fell in the interval 550–600 °C. During deformation with strain rates close to 1.3·10−3 s−1, a rise in deformation temperature led to an increase in the efficiency of power dissipation to η = 0.3 and higher (at 700 °C), which was a consequence of a change in the mechanism of power dissipation from dynamic recovery to dynamic recrystallization. These results were in agreement with the result of microstructure evolution studies in the current work. However, deformation at 400 °C with almost all strain rates and in the temperature range of 400–500 °C with a strain rate of 5·10−2 s−1 can result in flow instability with the value of η~0.1. Moreover, the efficiency of power dissipation approaches values, typical of dynamic recovery, at 700 °C. An explanation of this behavior can be related with martensite decomposition during deformation and development of dynamic recovery/recrystallization; however, this point requires additional clarification.
From the viewpoint of practical application, an elongated fine-grained structure with nanoscale carbide particles and strong deformation texture was observed after deformation in the field of 0.1 < η < 0.2, where the energy dissipation occurred due to dynamic recovery. On the other hand, better workability can be obtained during warm deformation in the field, with η > 0.2, where DRX develops. Deformation instability in the field with η < 0.1 can be accompanied by cracking and failure. It should be noted that the as-quenched Fe-1.2wt.%C steel had lower efficiency of power dissipation in the field of deformation instability and, as a result, better processability in comparison with the initially spheroidized steel [6].

4. Conclusions

The mechanisms of the structure formation during warm deformation of the as-quenched Fe-0.36wt.%C-1wt.%Cr steel in a temperature range of 400–700 °C with strain rates of 10−2, 5·10−2, 1.3·10−3, 5·10−3 and 10−4 s−1 were investigated. The following results were obtained:
1. Two temperature domains can be clearly distinguished, depending on the structure formation mechanisms: low temperatures at 400–550 °C and high temperatures at 600–700 °C. At the low temperatures, deformation was accompanied by dynamic recovery/discontinuous dynamic recrystallization, causing both the rearrangement of dislocations and the formation of a developed substructure. Continuous dynamic recrystallization occurred during deformation at the higher temperatures, resulting in the formation of a coarse, nearly equiaxed grain structure. The activation energy of deformation was 140 ± 35 kJ/mol for the low-temperature domain, and 243 ± 15 kJ/mol for the high-temperature domain.
2. The presence of nanoscale carbide particles in the structure at temperatures of 400–600 °C resulted in the appearance of threshold stresses. The value of threshold decreased from 522 to 43 MPa with an increase in the size of carbides due to a temperature rise from 400 to 600 °C, respectively.
3. A two-component <001>//CD and <111>//CD deformation texture was formed during deformation. Deformation at the low temperatures resulted in the formation of elongated ferritic grains separated mainly by HABs with a strong <001>//CD texture. The grains with the <111>//CD orientation were wider in comparison with those with the <001>//CD orientation. The development of substructure in the form of LABs networks was also observed in the <111>//CD grains. The development of dynamic recrystallization restricted the texture formation.
4. The processing map of warm deformation was constructed. Three main fields of the power dissipation efficiency (η) were observed: dynamic recovery, dynamic recrystallization and flow instability. The border between the areas of dynamic recovery and dynamic recrystallization was at 550–650 °C at all studied strain rates. However, some flow instability was observed at 400 °C and strain rates of 10−4–5·10−2 s−1, and in the temperature range of 400–500 °C with a strain rate of 5·10−2 s−1.

Author Contributions

D.P., Formal analysis, Writing—Review and Editing, Visualization, Investigation; O.D., Investigation, Formal analysis, Visualization, Validation, Methodology, Writing—Review and Editing; D.S., Methodology, Investigation, Validation; N.S. and S.Z., Writing—Review and Editing; G.S., Conceptualization, Supervision, Writing—Review and Editing. All authors have read and agreed to the published version of the manuscript.

Funding

The authors gratefully acknowledge the financial support from the Russian Science Foundation Grant no. 19-79-30066. The authors are grateful to the personnel of the Joint Research Center, “Technology and Materials”, Belgorod National Research University, for their assistance.

Conflicts of Interest

The authors declare no conflict of interest.

References

  1. Song, R.; Ponge, D.; Raabe, D.; Speer, J.G.; Matlock, D.K. Overview of processing, microstructure and mechanical properties of ultrafine grained bcc steels. Mater. Sci. Eng. A 2006, 441, 1–17. [Google Scholar] [CrossRef]
  2. Zhao, J.; Jiang, Z. Thermomechanical processing of advanced high strength steels. Prog. Mater. Sci. 2018, 94, 174–242. [Google Scholar] [CrossRef]
  3. Akbari, G.H.; Sellars, C.M.; Whiteman, J.A. Microstructural development during warm rolling of an if steel. Acta Mater. 1997, 45, 5047–5058. [Google Scholar] [CrossRef]
  4. Niechajowicz, A.; Tobota, A. Warm deformation of carbon steel. J. Mater. Process. Technol. 2000, 106, 123–130. [Google Scholar] [CrossRef]
  5. Miller, R.L. Ultrafine- grained microstructures and mechanical properties of alloy steels. Met. Trans. 1972, 3, 905–912. [Google Scholar] [CrossRef]
  6. Wu, T.; Gao, Y.W.; Wang, M.Z.; Li, X.P.; Zhao, Y.C.; Zou, Q. Influence of Initial Microstructure on Warm Deformation Processability and Microstructure of an Ultrahigh Carbon Steel. J. Iron Steel Res. Int. 2014, 21, 52–59. [Google Scholar] [CrossRef]
  7. Kimura, Y.; Inoue, T.; Yin, F.; Tsuzaki, K. Inverse temperature dependence of toughness in an ultrafine grain-structure steel. Science 2008, 320, 1057–1059. [Google Scholar] [CrossRef]
  8. Kimura, Y.; Inoue, T. Mechanical property of ultrafine elongated grain structure steel processed by warm tempforming and its application to ultra-high-strength bolt. Tetsu-To-Hagane/J. Iron Steel Inst. Jpn. 2019, 105, 5–23. [Google Scholar] [CrossRef] [Green Version]
  9. Inoue, T.; Kimura, Y.; Ochiai, S. Shape effect of ultrafine-grained structure on static fracture toughness in low-alloy steel. Sci. Technol. Adv. Mater. 2012, 13. [Google Scholar] [CrossRef]
  10. Kimura, Y.; Inoue, T. Influence of warm tempforming on microstructure and mechanical properties in an ultrahigh-strength medium-carbon low-alloy steel. Metall. Mater. Trans. A Phys. Metall. Mater. Sci. 2013, 44, 560–576. [Google Scholar] [CrossRef]
  11. Kimura, Y.; Inoue, T.; Tsuzaki, K. Tempforming in medium-carbon low-alloy steel. J. Alloys Compd. 2013, 577, S538. [Google Scholar] [CrossRef]
  12. Bao, Y.Z.; Adachi, Y.; Toomine, Y.; Xu, P.G.; Suzuki, T.; Tomota, Y. Dynamic recrystallization by rapid heating followed by compression for a 17Ni-0.2C martensite steel. Scr. Mater. 2005, 53, 1471–1476. [Google Scholar] [CrossRef]
  13. Humphreys, F.J.; Hatherly, M. Recrystallization and Related Annealing Phenomena, 2nd ed.; Humphreys, F.J., Hatherly, M., Eds.; Pergamon: Oxford, UK, 2004. [Google Scholar]
  14. Kimura, Y.; Inoue, T.; Fuxing, Y.I.N.; Tsuzaki, K. Delamination toughening of ultrafine grain structure steels processed through tempforming at elevated temperatures. ISIJ Int. 2010, 50, 152–161. [Google Scholar] [CrossRef] [Green Version]
  15. Li, Q.; Wang, T.S.; Jing, T.F.; Gao, Y.W.; Zhou, J.F.; Yu, J.K.; Li, H.B. Warm deformation behavior of quenched medium carbon steel and its effect on microstructure and mechanical properties. Mater. Sci. Eng. A 2009, 515, 38–42. [Google Scholar] [CrossRef]
  16. Poorganji, B.; Miyamoto, G.; Maki, T.; Furuhara, T. Formation of ultrafine grained ferrite by warm deformation of lath martensite in low-alloy steels with different carbon content. Scr. Mater. 2008, 59, 279–281. [Google Scholar] [CrossRef]
  17. Ohmori, A.; Torizuka, S.; Nagai, K.; Koseki, N.; Kogo, Y. Effect of deformation temperature and strain rate on evolution of ultrafine grained structure through single-pass large-strain warm deformation in a low carbon steel. Mater. Trans. 2004, 45, 2224–2231. [Google Scholar] [CrossRef] [Green Version]
  18. Murty, S.V.S.N.; Torizuka, S.; Nagai, K.; Kitai, T.; Kogo, Y. Dynamic recrystallization of ferrite during warm deformation of ultrafine grained ultra-low carbon steel. Scr. Mater. 2005, 53, 763–768. [Google Scholar] [CrossRef]
  19. Zhao, X. Microstructural evolution during warm compression of medium carbon steel quenched. Adv. Mater. Res. 2008, 47–50, 853–856. [Google Scholar] [CrossRef]
  20. Zhao, X.; Yang, X.L.; Jing, T.F. Effect of Initial Microstructure on Warm Deformation Behavior of 45 Steel. J. Iron Steel Res. Int. 2012, 19, 75–78. [Google Scholar] [CrossRef]
  21. Li, J.; Xu, P.; Tomota, Y.; Adachi, Y. Dynamic recrystallization behavior in a low-carbon martensite steel by warm compression. ISIJ Int. 2008, 48, 1008–1013. [Google Scholar] [CrossRef]
  22. Song, R.; Ponge, D.; Raabe, D.; Kaspar, R. Microstructure and crystallographic texture of an ultrafine grained C-Mn steel and their evolution during warm deformation and annealing. Acta Mater. 2005, 53, 845–858. [Google Scholar] [CrossRef]
  23. Dedyulina, O.K.; Salishchev, G.A.; Pertsev, A.S. A Study of the Microstructure and Mechanical Properties of Medium-Carbon Steel 40KhGNM after Warm Swaging. Met. Sci. Heat Treat. 2016, 58, 132–137. [Google Scholar] [CrossRef]
  24. Al Omar, A.; Cabrera, J.M.; Prado, J.M. Characterization of the hot deformation in a microalloyed medium carbon steel using processing maps. Scr. Mater. 1996, 34, 1303–1308. [Google Scholar] [CrossRef]
  25. Sakai, T.; Belyakov, A.; Kaibyshev, R.; Miura, H.; Jonas, J.J. Dynamic and post-dynamic recrystallization under hot, cold and severe plastic deformation conditions. Prog. Mater. Sci. 2014, 60, 130–207. [Google Scholar] [CrossRef] [Green Version]
  26. Frost, H.J.; Ashby, M.F. Deformation-Mechanism Maps: The Plasticity and Creep of Metals and Ceramics, 1st ed.; Pergamon Press: Oxford, UK, 1982. [Google Scholar]
  27. Čadek, J. Creep in Metallic Materials, 1st ed.; Elsevier: Amsterdam, The Netherlands; Oxford, UK; New York, NY, USA; Tokyo, Japan, 1988. [Google Scholar]
  28. Gibeling, J.C.; Nix, W.D. Description of Elevated Temperature Deformation in Terms of Threshold Stresses and Back Stresses—A Review. Mater. Sci. Eng. 1980, 45, 123–135. [Google Scholar] [CrossRef]
  29. Li, Y.; Langdon, T.G. A simple procedure for estimating threshold stresses in the creep of metal matrix composites. Scr. Mater. 1997, 36, 1457–1460. [Google Scholar] [CrossRef]
  30. Dudko, V.A.; Kaibyshev, R.O.; Belyakov, A.N.; Sakai, Y.; Tsuzaki, K. Plastic flow of the mechanically alloyed Fe-0.6%O at temperatures of 550–700 °C. Phys. Met. Metallogr. 2009, 107, 516–521. [Google Scholar] [CrossRef]
  31. Morito, S.; Huang, X.; Furuhara, T.; Maki, T.; Hansen, N. The morphology and crystallography of lath martensite in alloy steels. Acta Mater. 2006, 54, 5323–5331. [Google Scholar] [CrossRef]
  32. Krauss, G. Tempering of Lath Martensite in Low and Medium Carbon Steels: Assessment and Challenges. Steel Res. Int. 2017, 88, 1–18. [Google Scholar] [CrossRef]
  33. Chen, K.; Jiang, Z.; Liu, F.; Yu, J.; Li, Y.; Gong, W.; Chen, C. Effect of quenching and tempering temperature on microstructure and tensile properties of microalloyed ultra-high strength suspension spring steel. Mater. Sci. Eng. A 2019, 766, 138272. [Google Scholar] [CrossRef]
  34. NajafiZadeh, A.; Jonas, J.J.; Yue, S. Grain refinement by dynamic the simulated warm-rolling of recrystallization during interstitial free steels. Metall. Mater. Trans. A 1992, 23, 2607–2617. [Google Scholar] [CrossRef]
  35. Shabashov, V.A.; Korshunov, L.G.; Zamatovskii, A.E.; Litvinov, A.V.; Sagaradze, V.V.; Kositsyna, I.I. Deformation-induced dissolution of carbides of the Me(V, Mo)-C type in high-manganese steels upon the friction effect. Phys. Met. Metallogr. 2012, 113, 914–921. [Google Scholar] [CrossRef]
  36. Prasad, Y.V.R.K.; Sasidhara, S. Hot Working Guide: A Compendium of Processing Maps, 1st ed.; ASM International: Materials Park, OH, USA, 1997. [Google Scholar]
  37. Prasad, Y.V.R.K.; Gegel, H.L.; Doraivelu, S.M.; Malas, J.C.; Morgan, J.T.; Lark, K.A.; Barker, D.R. Modeling of dynamic material behavior in hot deformation: Forging of ti-6242. Metall. Trans. A 1984, 15A, 1883–1892. [Google Scholar] [CrossRef]
  38. Vafaeenezhad, H.; Seyedein, S.H.; Aboutalebi, M.R.; Eivani, A.R. An investigation of workability and flow instability of Sn-5Sb lead free solder alloy during hot deformation. Mater. Sci. Eng. A 2018, 718, 87–95. [Google Scholar] [CrossRef]
Figure 1. Compression curves of as-quenched Fe-0.36wt.%C-1wt.%Cr steel at temperatures of 400 (a), 450 (b), 500 (c), 550 (d), 600 (e), 650 (f) and 700 °C (g), and different strain rates.
Crystals 10 00554 g001
Figure 2. Relationship between true stress (ε~0.25) and compression temperature.
Crystals 10 00554 g002
Figure 3. Relationships between ln( ε ) - ln(σ/G) (a) and ln(σ/G) – 103/T (b) in the higher temperature (600–700 °C) interval.
Crystals 10 00554 g003
Figure 4. Relationships between ε 1/n and σ for temperatures of 400 (a), 450 (b), 500 (c), 550 (d), 600 (e), and 650 °C (f).
Crystals 10 00554 g004
Figure 5. The initial microstructure (a) and inverse pole figures (IPF) maps (be) of Fe-0.36wt.%C-1wt.%Cr steel in as-quenched condition (a) and after soaking at 400 (b), 500 (c), 600 (d) or 700 °C (e) for 10 min.
Crystals 10 00554 g005
Figure 6. Texture component maps after deformation with a strain rate of 1.3·10−3 s−1 at 400 (ac), 500 (df), 600 (gi) or 700 °C (jl) to ε = 0.3, 0.77 or 1.15. Notation: high-angle boundaries (with misorientations ≥ 15°) are black, low-angle boundaries (with misorientations 2–15°) are white. Color code is shown in Figure 6a. The compression axis is vertical in all cases.
Crystals 10 00554 g006
Figure 7. Transmission electron microscopy (TEM) photographs of fine structure after compression at 400 °C (a–c) and 500 °C (d–f) with strain rate of 1.3·10−3 s−1 to different strain degrees (ε): 0 (a,d), 0.3 (b), 0.77 (e), 0.97 (c) and 1.15 (f).
Crystals 10 00554 g007
Figure 8. TEM photographs of fine structure after compression at 600 °C (a–c) and 700 °C (d–f) with strain rate of 1.3·10−3 s−1 to different strain degrees (ε): 0 (a,d), 0.3 (b,c) and 1.15 (e,f).
Crystals 10 00554 g008
Figure 9. Processing map for warm deformation of the as-quenched Fe-0.36wt.%C-1wt.%Cr steel at ε = 0.35. Notation: FI—flow instability; DR—dynamic recovery; DRX—dynamic recrystallization.
Crystals 10 00554 g009
Table 1. The values of threshold stress (σth), n and corrected activation energy of deformation (Q).
Temperature, °Cσth, MPanQ, kJ·mol−1
40052212140 ± 35
(at n = 9.5)
4504439
5002968
5501547
600436243 ± 15
(at n = 6.0)
65076
700--
Table 2. Volume fraction of areas with the <001>//compression direction (CD) (numerator, %) and <111>//CD (denominator, %) texture components in the Fe-0.36wt.%C-1wt.%Cr steel after different compression strain.
Temperature, °CTrue Strain (ε)
00.30.771.15
4004/39/1629/2832/52 *
5002/16/1449/4149/31
6004/616/840/1357/19
7005/311/1712/919/10
* for temperature of 400 °C, maximum strain is equal to 0.97.
Table 3. Average transverse high-angle boundaries (HAB) spacing (μm).
Temperature, °CTrue Strain (ε)
00.30.771.15
4000.770.440.290.19 *
5000.760.490.300.22
6001.070.620.570.47
7001.521.251.281.07
* for temperature of 400 °C, maximum strain is equal to 0.97.