Article

In-Situ Annealing and Hydrogen Irradiation of Defect-Enhanced Germanium Quantum Dot Light Sources on Silicon

1
Institute of Semiconductor and Solid State Physics, Johannes Kepler University Linz, Altenberger Strasse 69, A-4040 Linz, Austria
2
Department of Physics, Sapienza Università di Roma, Piazzale A. Moro 2, 00185 Roma, Italy
3
Christian Doppler Laboratory for Nanoscale Phase Transformations, Center for Surface and Nanoanalytics (ZONA), Johannes Kepler University Linz, Altenberger Strasse 69, A-4040 Linz, Austria
*
Authors to whom correspondence should be addressed.
Crystals 2020, 10(5), 351; https://doi.org/10.3390/cryst10050351
Submission received: 7 April 2020 / Revised: 26 April 2020 / Accepted: 27 April 2020 / Published: 29 April 2020
(This article belongs to the Special Issue Semiconductor Heteroepitaxy)

Abstract

:
While light-emitting nanostructures composed of group-IV materials fulfil the mandatory compatibility with CMOS-fabrication methods, factors such as the structural stability of the nanostructures upon thermal annealing, and the ensuing photoluminescence (PL) emission properties, are of key relevance. In addition, the possibility of improving the PL efficiency by suitable post-growth treatments, such as hydrogen irradiation, is important too. We address these issues for self-assembled Ge quantum dots (QDs) that are co-implanted with Ge ions during their epitaxial growth. The presence of defects introduced by the impinging Ge ions results in pronounced PL-emission at telecom wavelengths up to room temperature (RT) and above. This approach allows us to overcome the severe limitations of light generation in the indirect-band-gap group-IV materials. By performing in-situ annealing, we demonstrate a high PL-stability of the defect-enhanced QD (DEQD) system against thermal treatment up to 600 °C for at least 2 h, even though the Ge QDs are structurally affected by Si/Ge intermixing via bulk diffusion. The latter, in turn, allows for emission tuning of the DEQDs over the entire telecom wavelength range from 1.3 µm to 1.55 µm. Two quenching mechanisms for light-emission are discussed; first, luminescence quenching at high PL recording temperatures, associated with the thermal escape of holes to the surrounding wetting layer; and second, annealing-induced PL-quenching at annealing temperatures >650 °C, which is associated with a migration of the defect complex out of the QD. We show that low-energy ex-situ proton irradiation into the Si matrix further improves the light emission properties of the DEQDs, whereas proton irradiation-related optically active G-centers do not affect the room temperature luminescence properties of DEQDs.

1. Introduction

Practical, Si-compatible, monolithically-integrated lasers are the main missing ingredient towards the realization of efficient and low-cost integrated silicon photonics circuits that are designated to uplift fields of on-chip data communication [1,2,3] and on-chip sensing [4]. There has been substantial recent progress in the field ranging from the integration of III-V quantum dot (QD)-lasers on Si [5,6,7] to all-group-IV approaches [8,9,10,11,12]. Independently of the fabrication method used, the stability of the light emission with respect to the typical thermal budget of a CMOS process is of key importance. Concerning fast communication, monolithic light sources have the distinct advantage of possible front-end integration, i.e., placing the photonics layer in-between the CMOS and the metallization layers. Front-end integration is preferred, compared to back-side or back-end integration, since slow electrical driving of the integrated optics devices through vias (back-side) or the slowest metallization layers (back-end) can be avoided [13]. For front-end integration, the thermal budget of the photonics layer, including the fabrication of the light-emitters, must not deteriorate the underlying CMOS layer. Moreover, the thermal budget applied during the fabrication of the subsequent metallization layer must not impede the structural and optical properties of the photonics layer. For the former, thermal budgets of 6 h at 425 °C, 1 h at 450 °C, and 0.5 h at 475 °C are acceptable, [14] while for the latter, the photonics layer has to withstand annealing in the temperature range of at least 350 °C to 475 °C, depending on the actual metallization layers typically consisting of Al, AlSi, TiN, W, WSi, AlCu, or Cu [14,15]. The light sources themselves should furthermore withstand continuous operating temperatures of at least 95 °C, the typical maximum operation temperature specified for microprocessors [16]. Due to the thermal stability of its output characteristics, quantum dot-based gain material is preferred over bulk and quantum well emitters for such an environment [17].
In this work, the investigated Si-based photonic material contains so-called defect-enhanced quantum dots (DEQDs) [10,18,19]. These consist of epitaxial Ge/Si QD light-emitters, the optical properties of which are enhanced through the intentional implantation of Ge ions during QD formation. Since the implantation depth is controlled by the ion energy [18], low-energy ion implantation (<2 keV) allows for confinement of the defects to the QDs. The resulting defect sites were found to enhance light emission significantly, by overcoming the fundamental limitations of Ge/Si QD light emitters, namely (i) the indirect energy bandgap, (ii) charge carrier separation due to the type-II band alignment of the Ge/Si heterointerface, and (iii) efficient carrier trapping [10,18,19]. In this way, both, photoluminescence (PL) [10,20] and electroluminescence (EL) emission [21] of DEQDs were demonstrated at room temperature (RT), and even above.
The main temperature steps during the fabrication of DEQDs fulfil the aforementioned criteria regarding CMOS and metallization degradation, as discussed in Section 2. Concerning front-end implementation of DEQD light emitters, the resilience of their structural and optical properties against the thermal budget employed in the subsequent metallization and passivation layers is investigated in this work.
While hydrogen passivation is mandatory for silicon photovoltaic devices [22], it is also employed in CMOS fabrication processes for the passivation of defects in silicon [23]. Therefore, we also address the influence of low-energy ex-situ proton irradiation on the optical properties of DEQDs and the surrounding Si layers for different thermal annealing conditions.

2. Materials and Methods

The DEQD samples were grown in a SIVA-45 molecular beam epitaxy (MBE) system (RIBER, Paris, France) on high-resistivity (>5000 Ωcm) Si(001) substrates. After a standard substrate cleaning process, including Piranha solution and RCA cleaning [24], the samples were dipped for 30 s in diluted hydrofluoric acid (HF 1%), to remove the native oxide before their introduction into the load lock vacuum chamber. The samples were degassed at 720 °C for 15 min before the growth of a crystalline Si buffer layer of 50 nm thickness at a growth temperature (TG) of 500 °C. Note that this high degassing temperature is not mandatory for DEQD formation, and that, in principle, any TG higher than ~400 °C can be employed, above which the hydrogen termination of the HF-dipped Si surfaces starts to desorb [25]. Thus, the degassing process can be readily adapted to ensure CMOS-compatibility.
For the self-organized, strain-driven growth of QDs, 7.3 Å of Ge were deposited at TG = 500 °C. This leads to the formation of QDs in “hut-cluster” shape [26,27] on a Ge-rich wetting layer (WL) [28]. Hut clusters are elongated pyramidal structures terminated by {105}-oriented crystal facets [26]. For the given growth conditions, the typical QD height and density are ~1.4 nm to 2 nm, and 2 × 1010 cm−2, respectively. During the entire QD deposition process, Ge ions with a dose of about 104 µm−2 and an energy of 1.5 keV were impinging onto the sample surface. This low energy leads to implantation depths of roughly 1–2 nm for the positively charged Ge ions which, in turn, corresponds to the average height of the Ge hut clusters. Finally, the implanted Ge QDs were capped with a Si matrix of 70 nm thickness, which was deposited during a ramp-up of TG from 475 °C to 500 °C. Hereafter, the samples were annealed in-situ for 2 h at six different temperatures TA, ranging from 500 °C up to 675 °C. In addition, a reference sample was grown with the same layer sequence, but without the annealing step.
Each sample was cut into four parts. Hydrogen passivation experiments with a low-energy (100 eV) Kaufman source [29,30,31,32] were performed on three of these. To enhance hydrogen diffusion, the sample temperature during hydrogen treatment was always kept at 300 °C. The three pieces from each sample were exposed to proton irradiation doses of 5 × 1017 cm−2, 1 × 1018 cm−2, and 2.5 × 1018 cm−2, respectively.
For the spectroscopic investigation, the samples were placed in a helium flow cryostat with a heatable cold finger that allows sample temperatures (TPL) between 4 K and 350 K. The samples were excited using a fiber-coupled continuous-wave diode laser with an emission wavelength of 442 nm, and maximum output power of up to 3 mW. A microscope objective with a numerical aperture of 0.7 focused the laser to the sample surface, resulting in a laser spot diameter of ~2 µm. The resulting PL signal was collected by the same objective, fiber-coupled to a grating spectrometer and detected by a liquid nitrogen-cooled InGaAs line detector (Princeton Instruments OMA V, Trenton, NJ, USA), with a cut-off wavelength of 1580 nm.

3. Results and Discussion

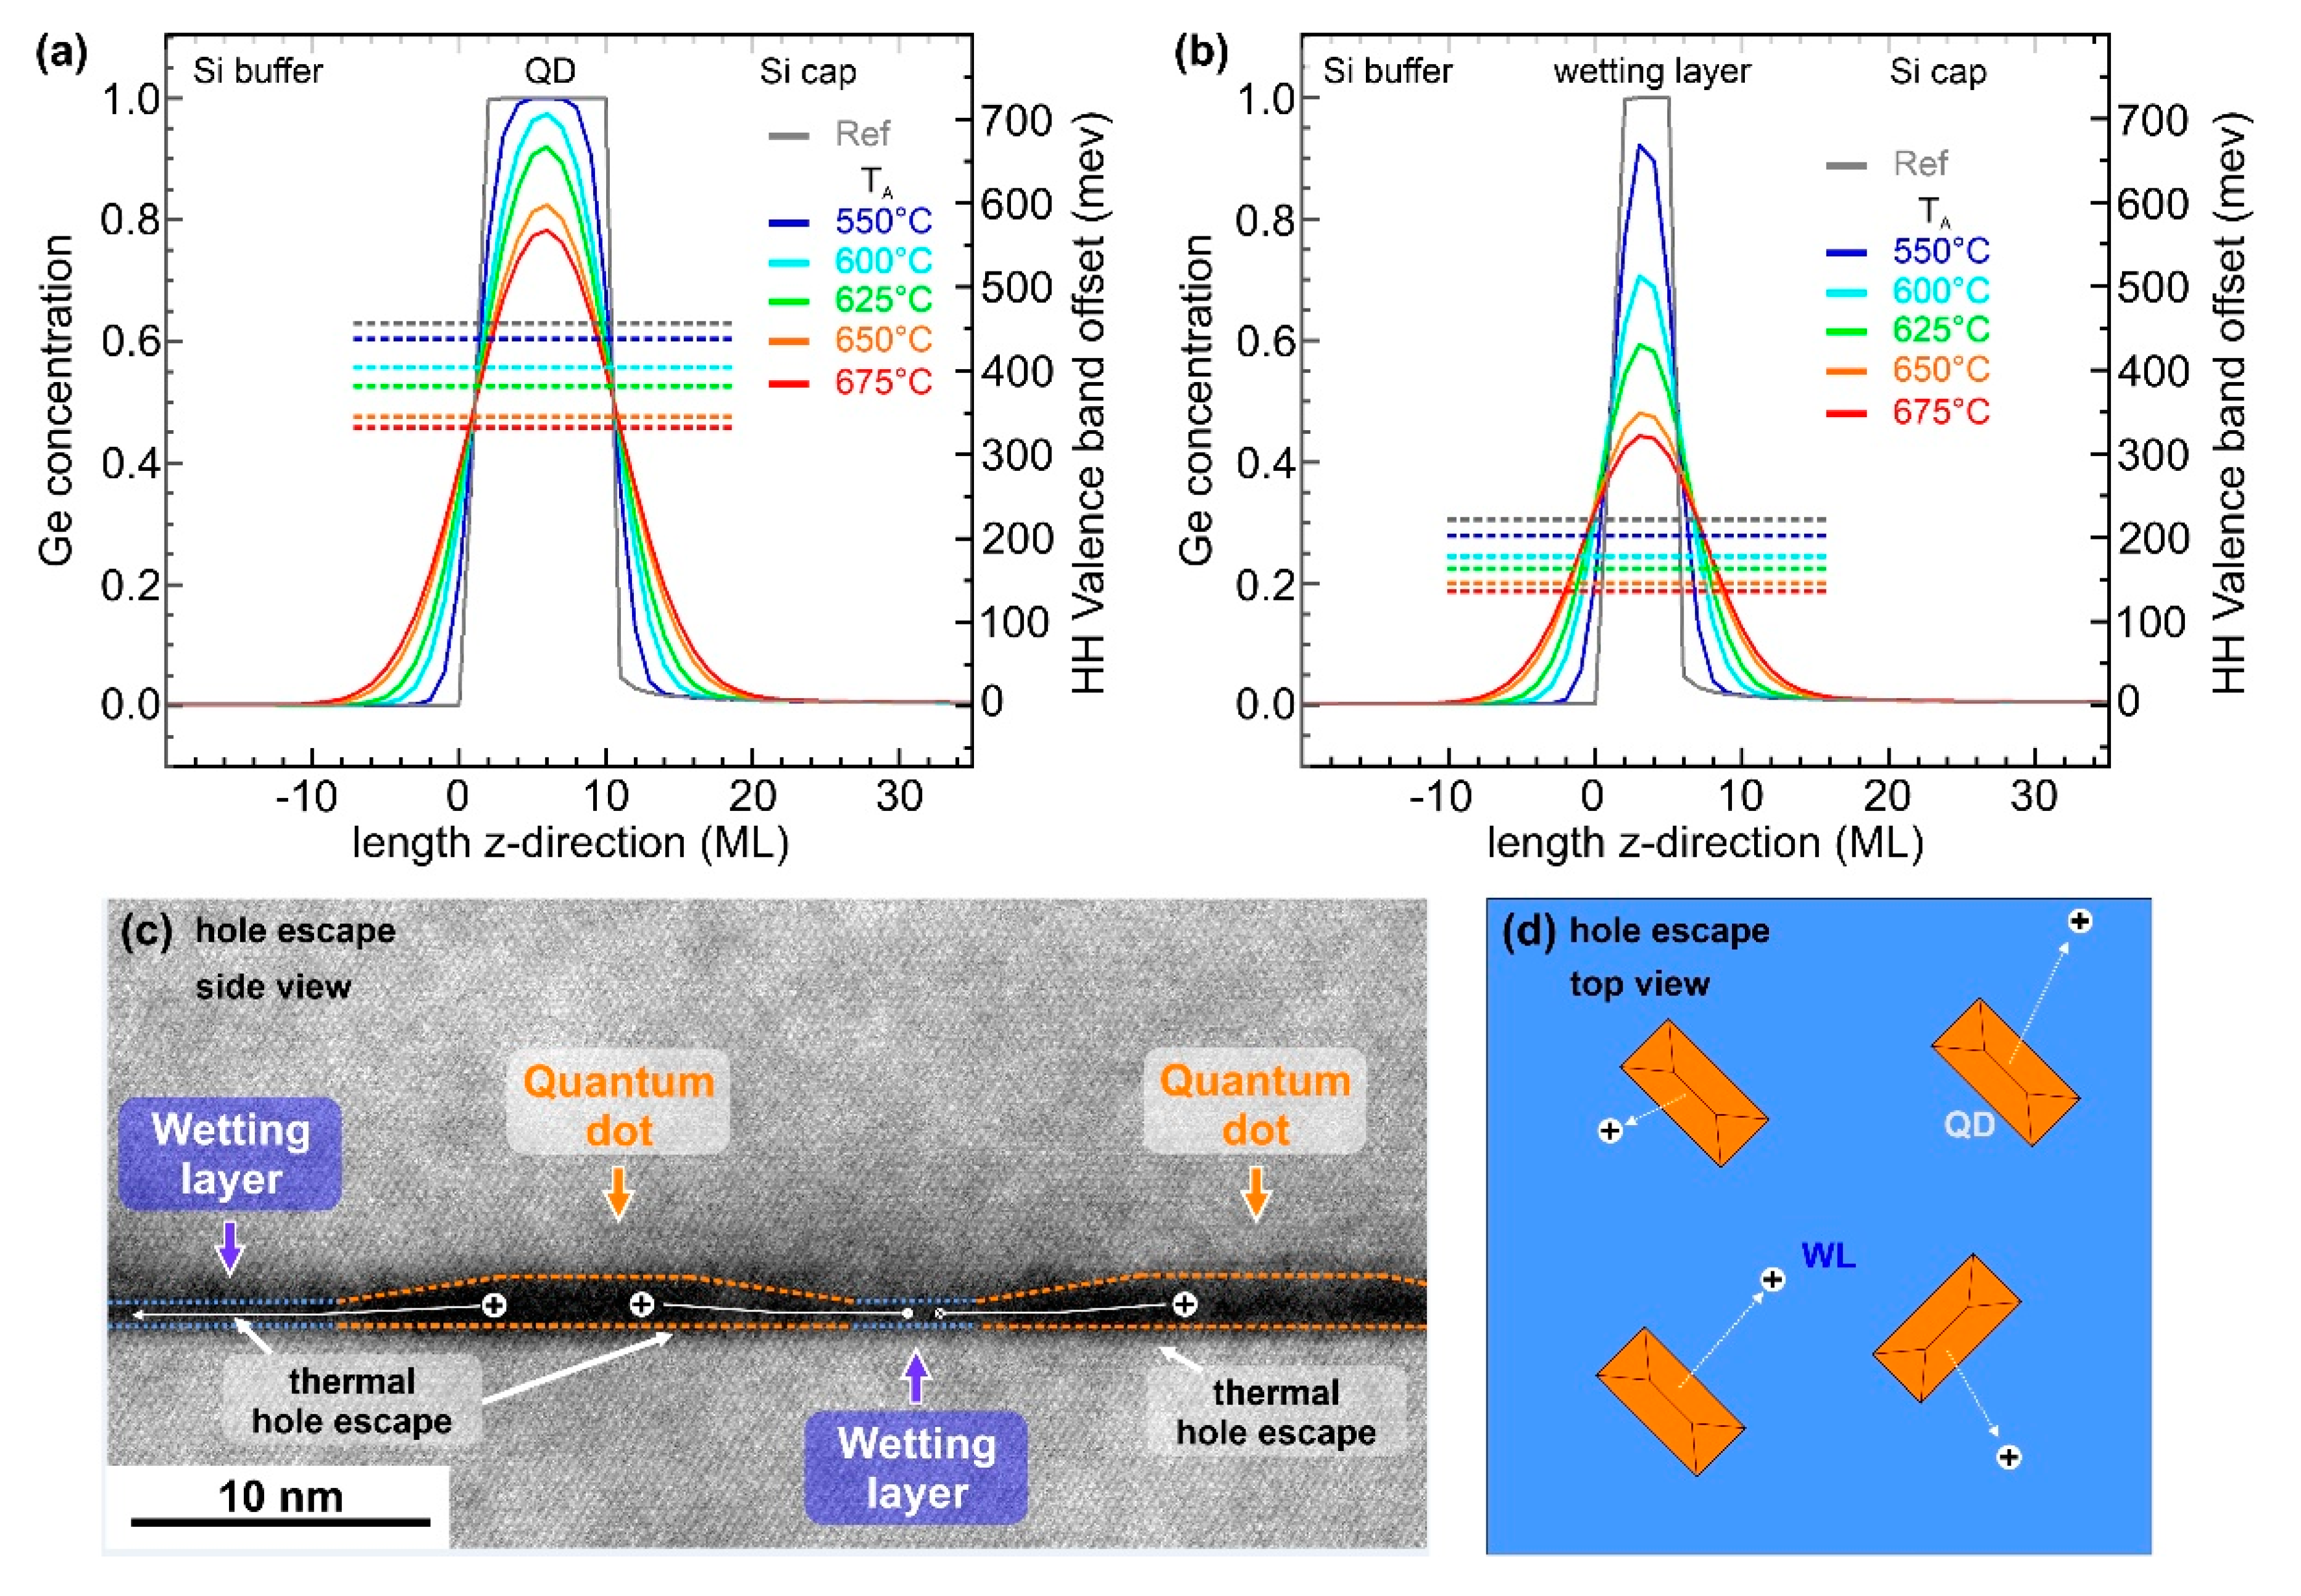
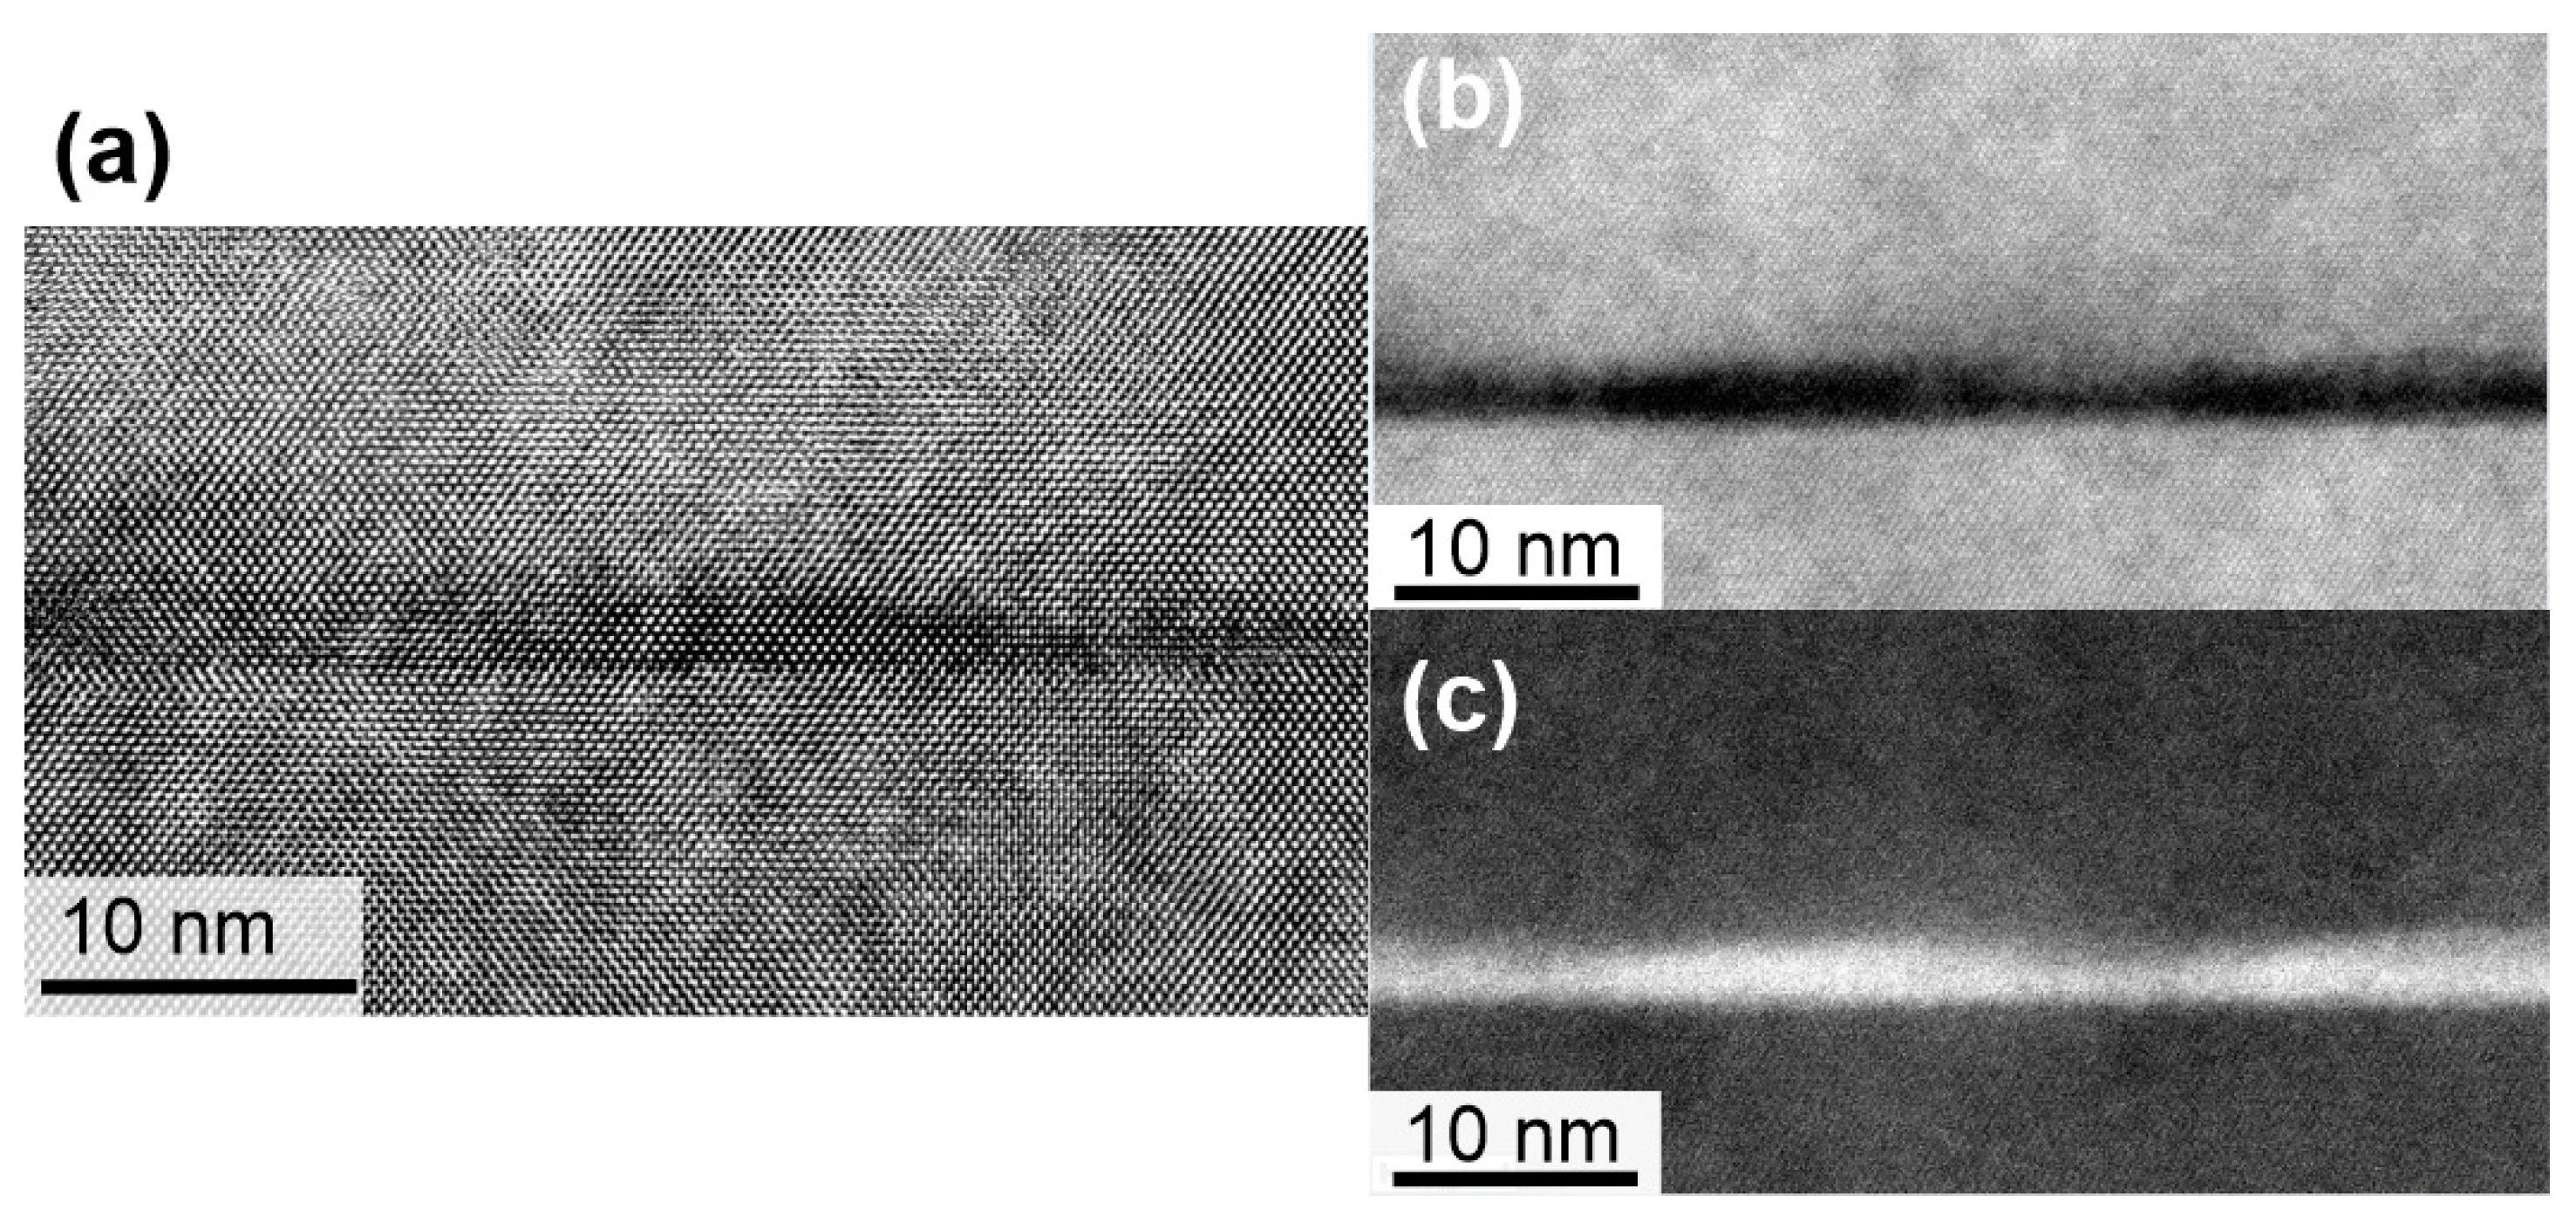
3.1. DEQD Nanostructures

The present understanding of the formation process of DEQDs and the reason for their superior optical properties are as follows: The implantation of Ge ions of low energies (<2 keV) during the QD growth leads to a partial amorphization of the QD’s crystal lattice. The subsequent solid-phase recrystallization at growth temperature has to remain incomplete, since an additional Ge atom was brought into a nanostructure which had perfect crystallinity before the ion implantation process. According to theoretical modelling, recrystallizing the structure results in the formation of a split-[110] self-interstitial [18] surrounded by a distorted Ge QD crystal lattice region consisting of about 45 atoms. These results suggest that it is this interstitial defect and the surrounding distorted crystal that are responsible for the enhanced light-emission properties of DEQDs at room temperature. The defect system introduces electronic states at the Γ-point of Ge, from where electrons directly recombine with holes confined by the large band offsets of the Si-Ge-Si QD heterostructure. Electrons tunnel from the surrounding Si matrix into these states, and this tunneling process is independent of temperature.
Therefore, we previously assumed [18] that the only mechanism leading to an eventual PL quenching at temperatures above ~300 K is caused by QD ionization, i.e., thermal escape of holes from the QD’s valence band potential well, induced by the band offsets of the Si-Ge-Si heterostructure to the Si matrix. However, no proof has been given so far for the assumption that hole-escape to the Si matrix is indeed the major mechanism for PL decay at high temperatures. As will be shown, this picture is indeed not fully adequate.

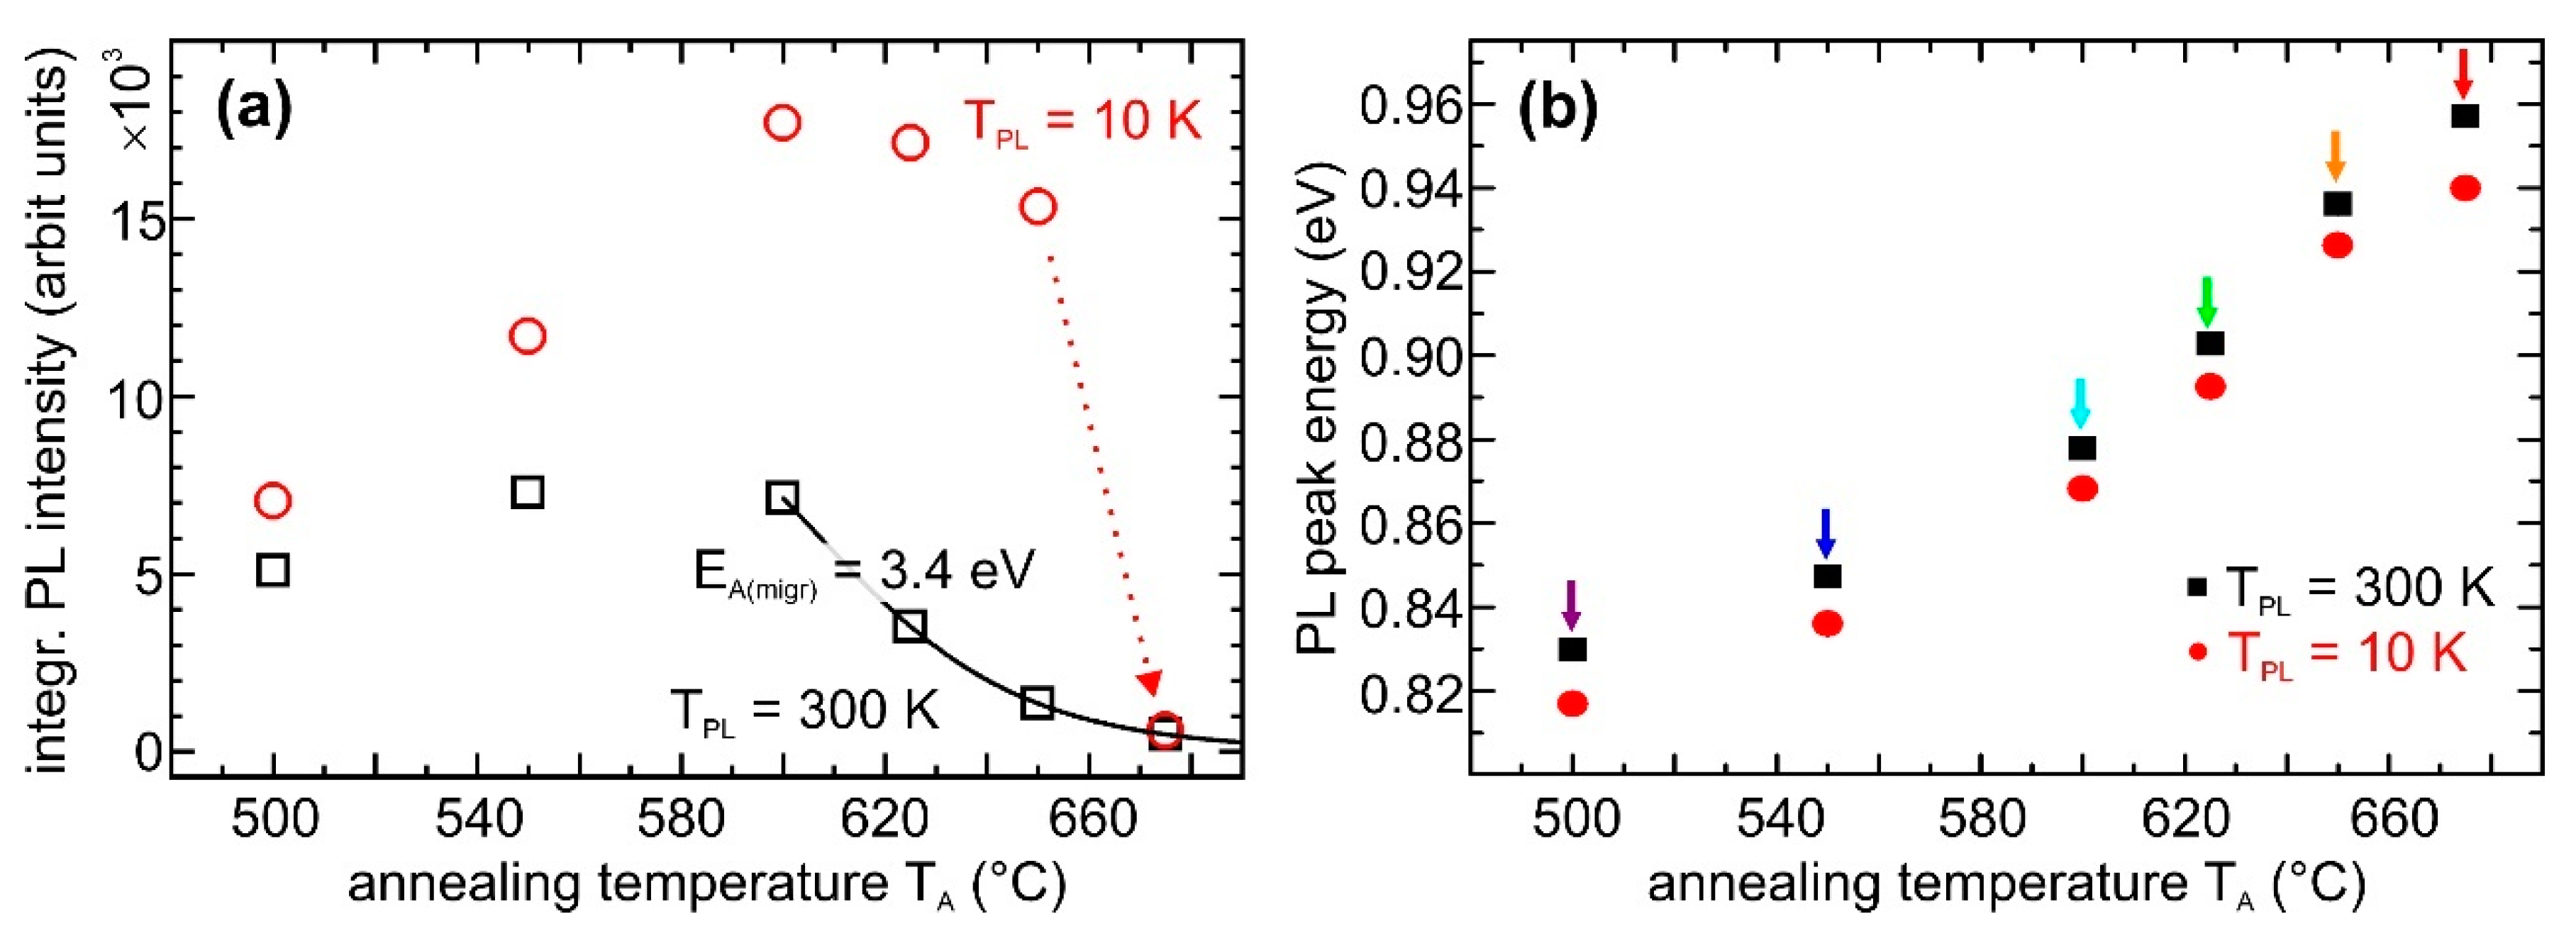
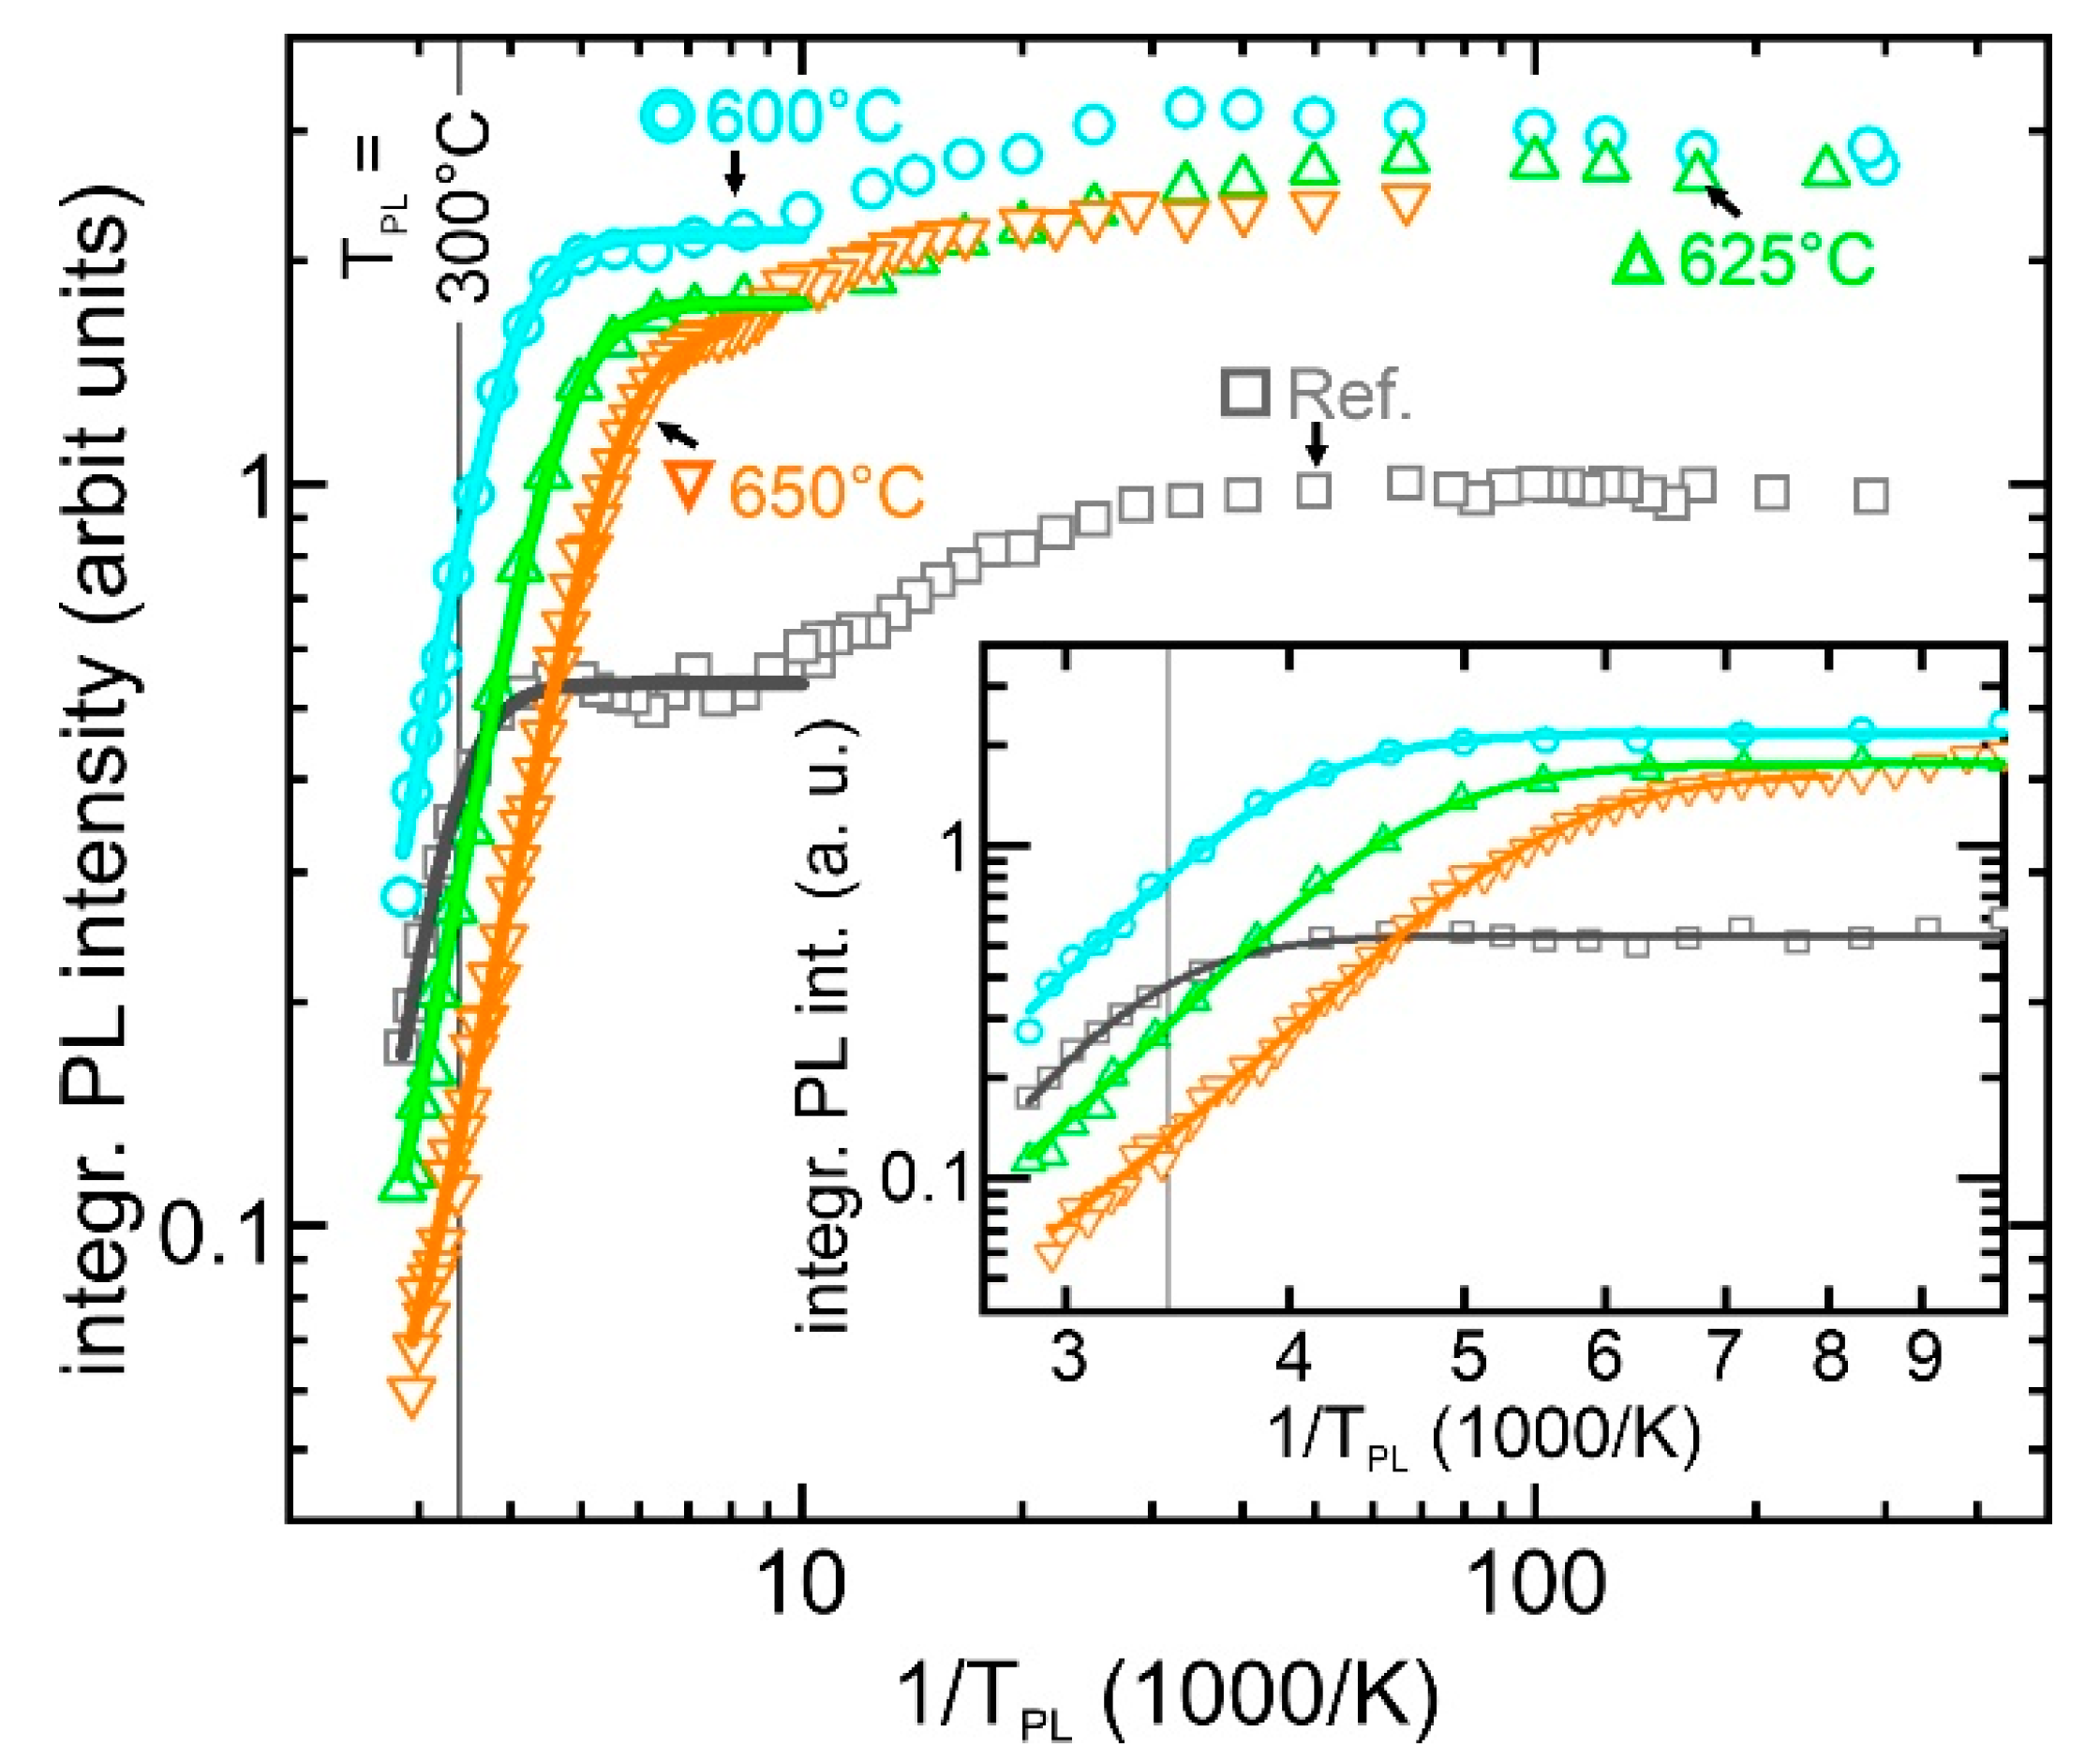
3.2. In-Situ Annealing of DEQDs

To study the influence of thermal hole-escape on the PL decay and the activation energy barrier for defect migration EA(migr), the same growth conditions for the Si matrix and the DEQDs were applied for all in-situ annealed samples. The annealing time was 2 h in all cases, and the only parameter varied was the annealing temperature TA, which was systematically changed within the range from 500 °C to 675 °C.
Figure 1 depicts PL spectra for the annealed samples, as well as for a pristine reference sample (grey) recorded at temperatures of TPL = 10 K (Figure 1a) and TPL = 300 K (Figure 1b). For low TPL, and low TA of 500 °C, we observe that sample annealing for 2 h leads to an increase of the integrated PL intensity, IPL, of the DEQD signal, but does not significantly change the spectral shape of the PL signal. Increasing TA results initially in a further improvement of IPL, followed by saturation in the TA range from 600 °C to 650 °C. However, a further slight increase of TA from 650 °C to 675 °C leads to almost complete quenching of the PL intensity.
The second obvious result of Figure 1a is a strong blueshift of the PL peak wavelengths (energies) from ~1520 nm (0.816 eV) for TA = 500 °C to 1330 nm (0.93 eV) for TA = 650 °C. At room temperature (TPL = 300 K, Figure 1b), this blueshift is present as well. The peak energy shift of the PL signal with increasing TA is plotted in Figure 2b, for TPL = 10 K and TPL = 300 K. As already seen in the PL spectra in Figure 1, the PL shifts for both TPL monotonously to higher energies with increasing TA. Note that all peak maxima of the spectra recorded at TPL = 300 K are also offset to the blue by 9.8–17.1 meV, as compared to the maxima observed at TPL = 10 K.
In contrast to the spectra recorded at TPL = 10 K, the PL signal measured at TPL = 300 K shows the onset of quenching already at TA ≥ 600 °C. The obtained values for IPL versus TA are plotted in Figure 2a for TPL = 10 K and TPL = 300 K, respectively. In a previous publication [18] we have argued, just on the basis of room-temperature PL measurements, that the decay of the DEQD PL with high TA is likely related to thermally-induced migration of the defect complex from the QD into the Si matrix. There, we extracted an activation energy EA(migr) of 3.4 eV for this process, which is indicated in Figure 2a by the Arrhenius fit to IPL(TA).
For the data recorded at TPL = 10 K, the same Arrhenius fit cannot be performed, as the fit does not converge. However, it is evident already, from the comparison between the low and high TPL spectra in Figure 1, that a significant difference in EA(migr) has to exist. In the next paragraph, we argue that the EA(migr) value extracted from the PL intensities at TPL = 300 K presents a lower limit to describe the migration of the defect out of the DEQD structure. In addition, the PL signal is affected by spurious PL quenching, due to a reduction of the hole binding energy that is caused by intermixing of the Si/Ge/Si interfaces upon annealing. Still, the observed large lower limit of EA(migr) = 3.4 eV rationalizes the resilience against thermal budgets of the DEQDs, that allows, for example, DEQD annealing at 600 °C for 2 h without loss of PL yield. Moreover, it was shown recently that DEQDs withstand thermal annealing, even for temperatures up to 800 °C, during 3–20 ms long flash-lamp annealing processes that are suitable for dopant activation [33], again demonstrating the robustness against thermal treatment of this nanosystem.
To gain further insight into the optical response of DEQDs, we recorded PL spectra in the TPL range between 10 K and 300 K, as shown in Figure 3. The quenching of IPL with increasing TPL beyond 140 K shows Arrhenius-type behavior. From these curves, we extracted activation energies of EA(ref) = 255 meV, EA(600) = 190 meV, EA(625) = 157 meV, and EA(650) = 124 meV for the reference sample and the samples annealed at TA = 600 °C, 625 °C, and 650 °C, respectively.
Since these activation energies for PL quenching decrease very strongly with increasing annealing temperature TA, it is immediately clear that the activation energy for defect migration EA(migr) cannot be extracted from the single experiment at TPL = 300 K reported in [18]. Evidently, quenching of the PL intensity at TPL = 300 K is affected by both defect migration and hole escape.
To assess the structural changes induced by two hours of annealing at TA, we started from the experimental values of the PL peak positions at TPL = 10 K for different TA. For the non-annealed sample (grey spectrum in Figure 1a), we assume for simplicity a box-like Ge composition profile with 100% Ge content along the growth direction for both the QD and the WL. This should be reasonably close to reality, since at the low employed TG = 500 °C, trench-formation concomitant with Si-Ge intermixing is suppressed [34]. Slight differences in the Ge content, e.g., between 90% and 100%, are in general difficult to determine experimentally. Also, asymmetric smearing out of the initial Ge box profile induced by surface segregation can be assumed at the employed capping layer growth temperature of 475 °C [35]. However, this effect dominates the optical properties only for much thinner nanostructures such as very thin wetting layers (<3 ML thickness), as only the topmost monolayers of the nanostructure are affected by surface segregation at this growth temperature [35]. We justify the approximation of the box-like profiles a posteriori, as the bulk-diffusion induced blurring of the Ge composition is affecting the QD and WL potential much more significantly.
For the different TA, we assume a degradation of the Ge profiles through bulk diffusion according to the model given in [36], which was already successfully applied for Ge/Si nanostructures and heterointerfaces [37]. Also, we assume that the initial state of the PL transition, i.e., the split-[110]-interstitial in the QDs, virtually does not shift in energy as a consequence of Ge diffusion. This assumption appears to be reasonable, as this defect probes the local Ge environment. Especially in the center of the QD, where the defect is most effective, this concentration does not decay below ~80% of its initial value and, thus the corresponding modifications of the defect’s energy levels are expected to be small, and were neglected. The height-to-base-length aspect ratio of our hut clusters is <0.1. Therefore, we modelled the DEQDs also as quantum wells, both for solving the Ge bulk diffusion equation, and for calculating the ground state energy of the holes confined to the resulting SiGe layer with locally varying Ge concentration. For the energy level calculations, we used the 6-band k·p envelope function approach described in [38], with the band parameters given in [39]. The heavy-hole ground state (HH1) energy in the DEQDs and the surrounding WL after Ge bulk diffusion were calculated as a function of the Ge diffusion length LD, assuming that the Ge diffusion constant is independent of the Ge concentration for the limit of high Ge concentrations as used in this work. A comparison of the observed DEQD-PL shifts for different TA to the calculated HH1 energy shifts allows us to determine for each TA a value for LD for which the calculated HH1 energy shift and the measured PL shift coincide. For the different TA used in this work, the resulting Ge profiles and the HH1 energy levels for the QD and WL potentials are shown in Figure 4a,b.
In addition to the shift of the PL peak as a function of TA, our model also predicts a value for the ionization energy of the holes in the HH1 DEQD state that dominates PL quenching via the thermal hole emission from the QD to the higher energy states in the WL, as schematically indicated in Figure 4c,d. For the LD values and the corresponding shapes of the confinement potentials that correctly reproduce the observed PL shifts, the extracted hole ionization energies also agree well with the experimentally observed activation energies for PL quenching. Thus, we are able to describe two independent experimental quantities (PL- and EA-shifts with TA) with one parameter, LD. These findings justify a posteriori our model assumptions.
From the shift of the PL transition energy with TA and the correlated diffusion lengths LD = (D∙τ)0.5, where D is the diffusion constant and τ the total annealing time (7200 s), we can additionally determine the activation energy EA,diff for bulk diffusion for Ge in Si. From D(T) = D0∙exp(−EA,diff/kT) we extract an activation energy of EA,diff = 1.4 eV and the diffusion constant at infinite temperature, D0 = 1.7 × 10⁻¹² cm2/s. The value for EA,diff is surprisingly low compared to the reported values in the literature for coherent, i.e., defect-free, bulk crystals, which are typically about ~3 eV [40,41]. Diffusion of highly strained Ge in Si was, however, not investigated thus far. Here, we argue that it is the highly strained region around the split-[110] self-interstitial [18] that leads to the significant lowering of EA,diff. Furthermore, the disorder in the crystal, induced by the Ge ion implantation, might enhance vacancy formation, the main driving factor for bulk diffusion [42].

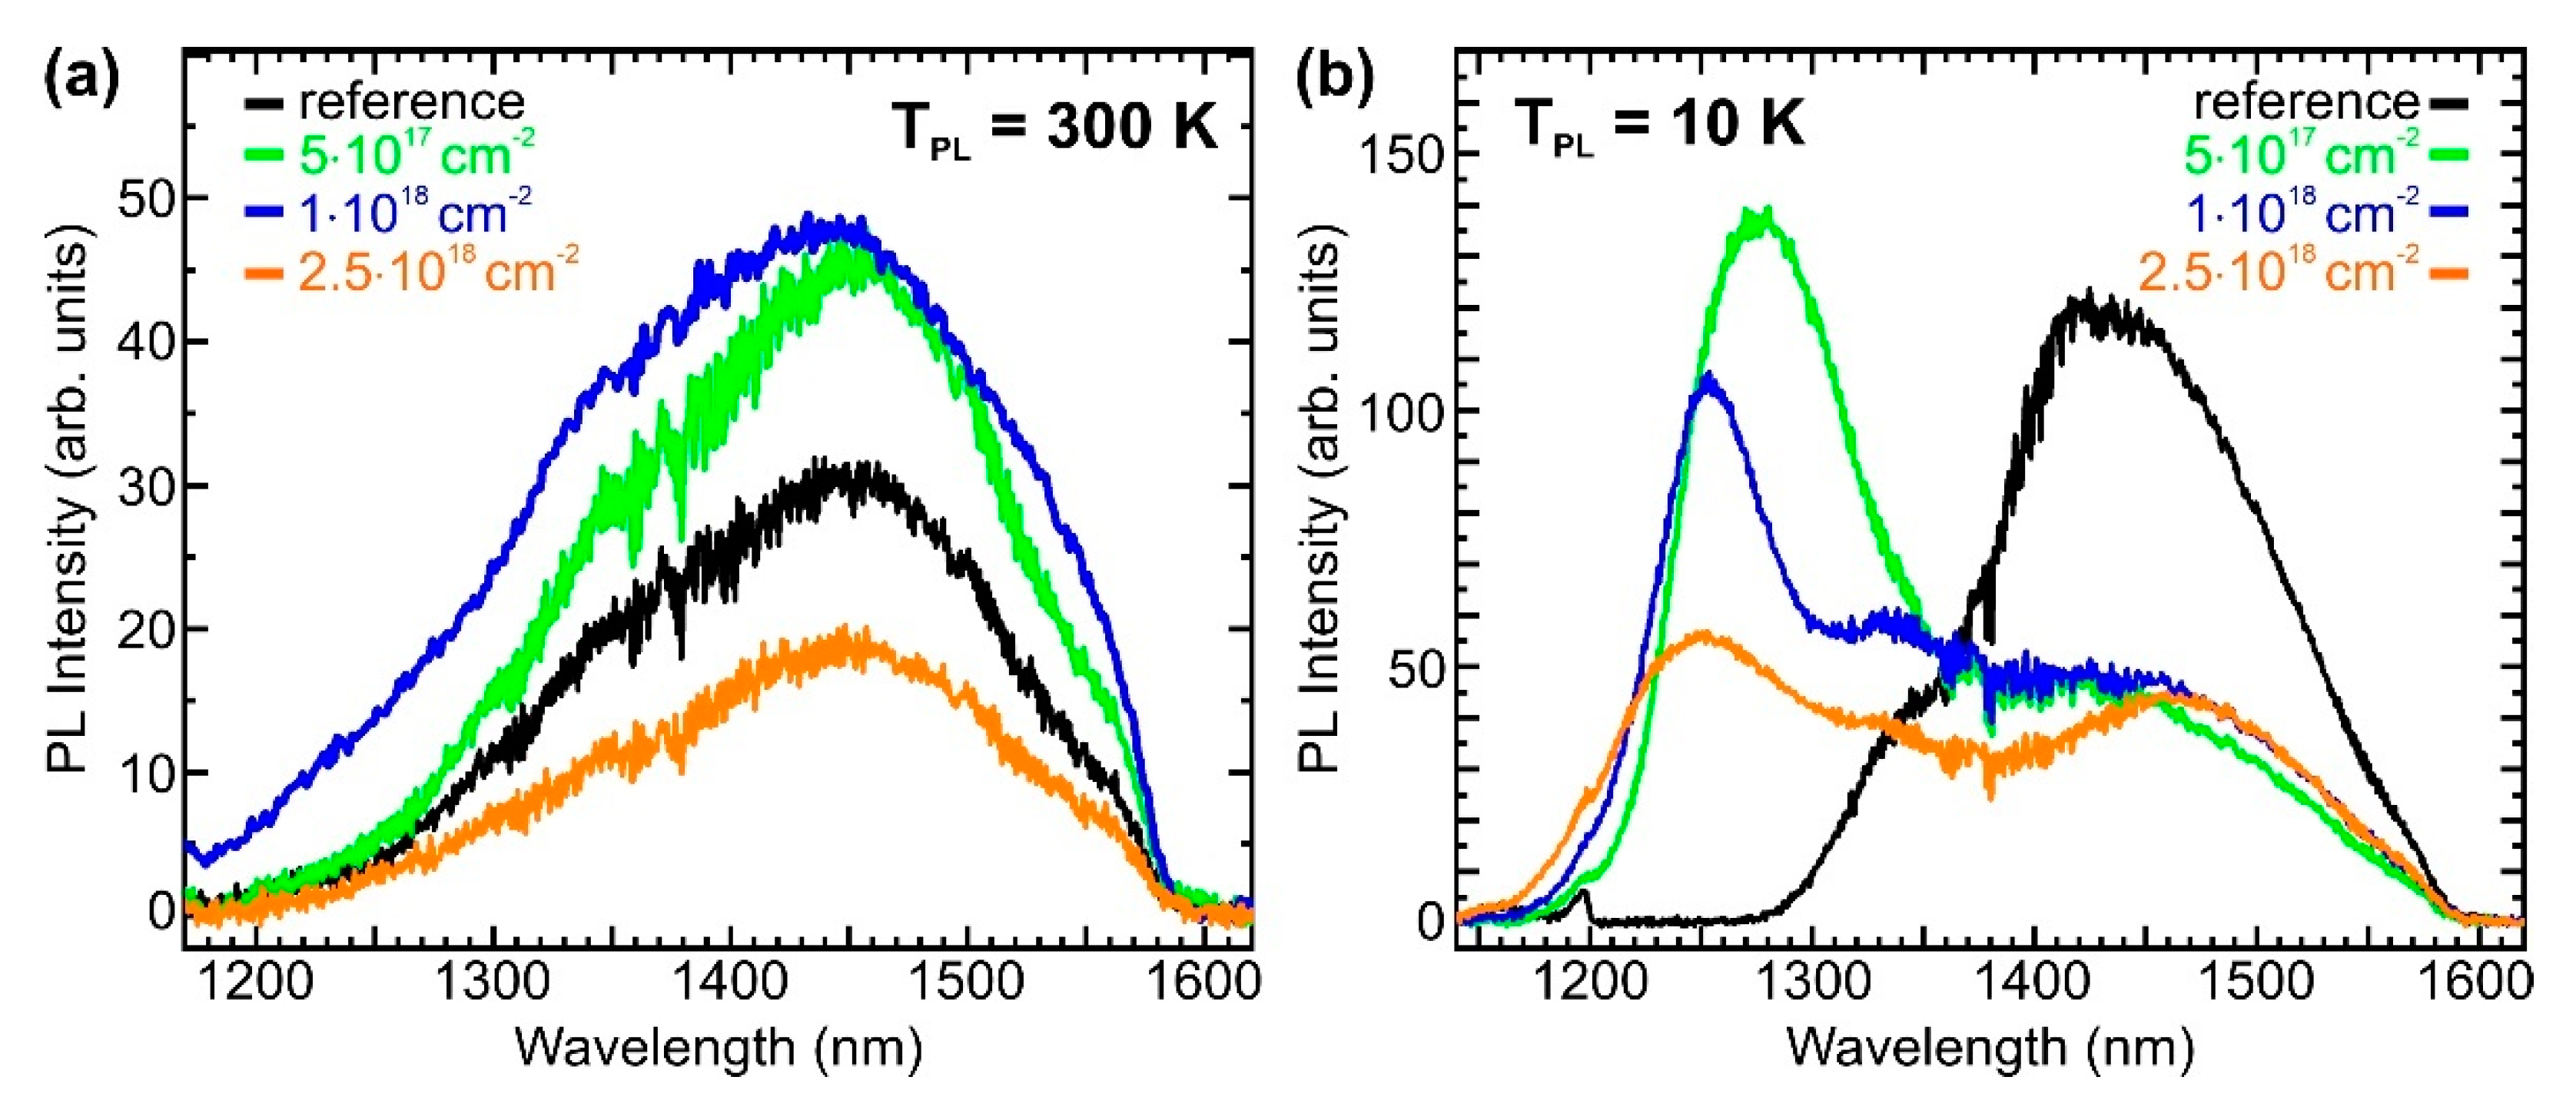
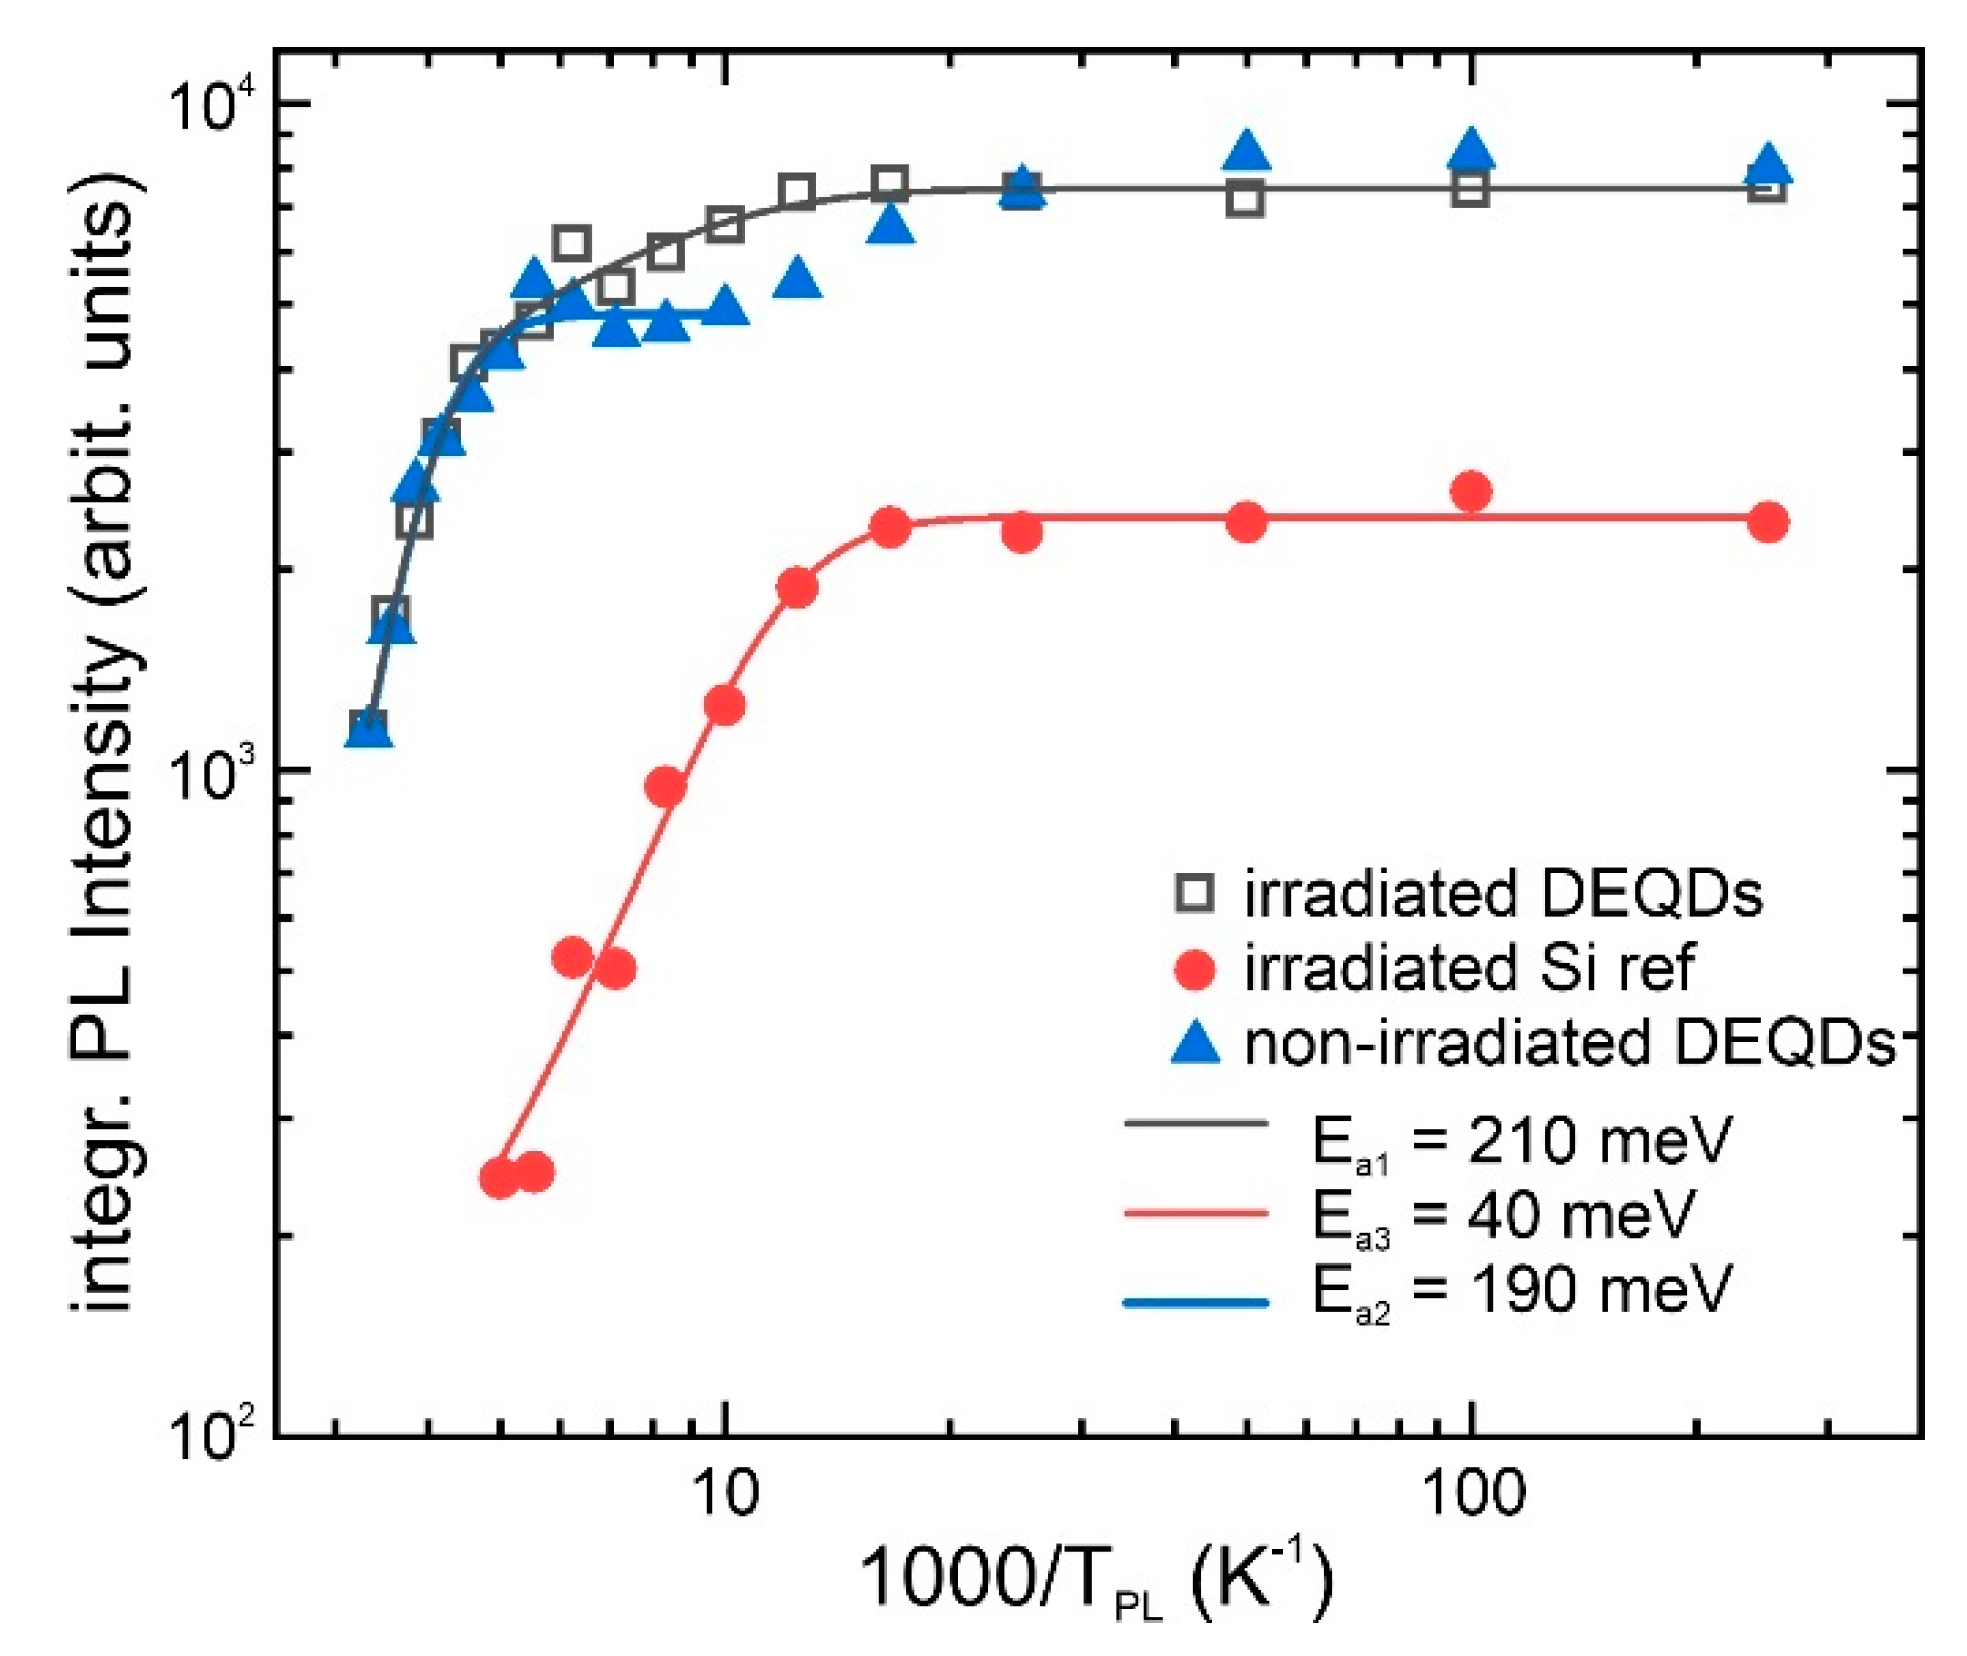
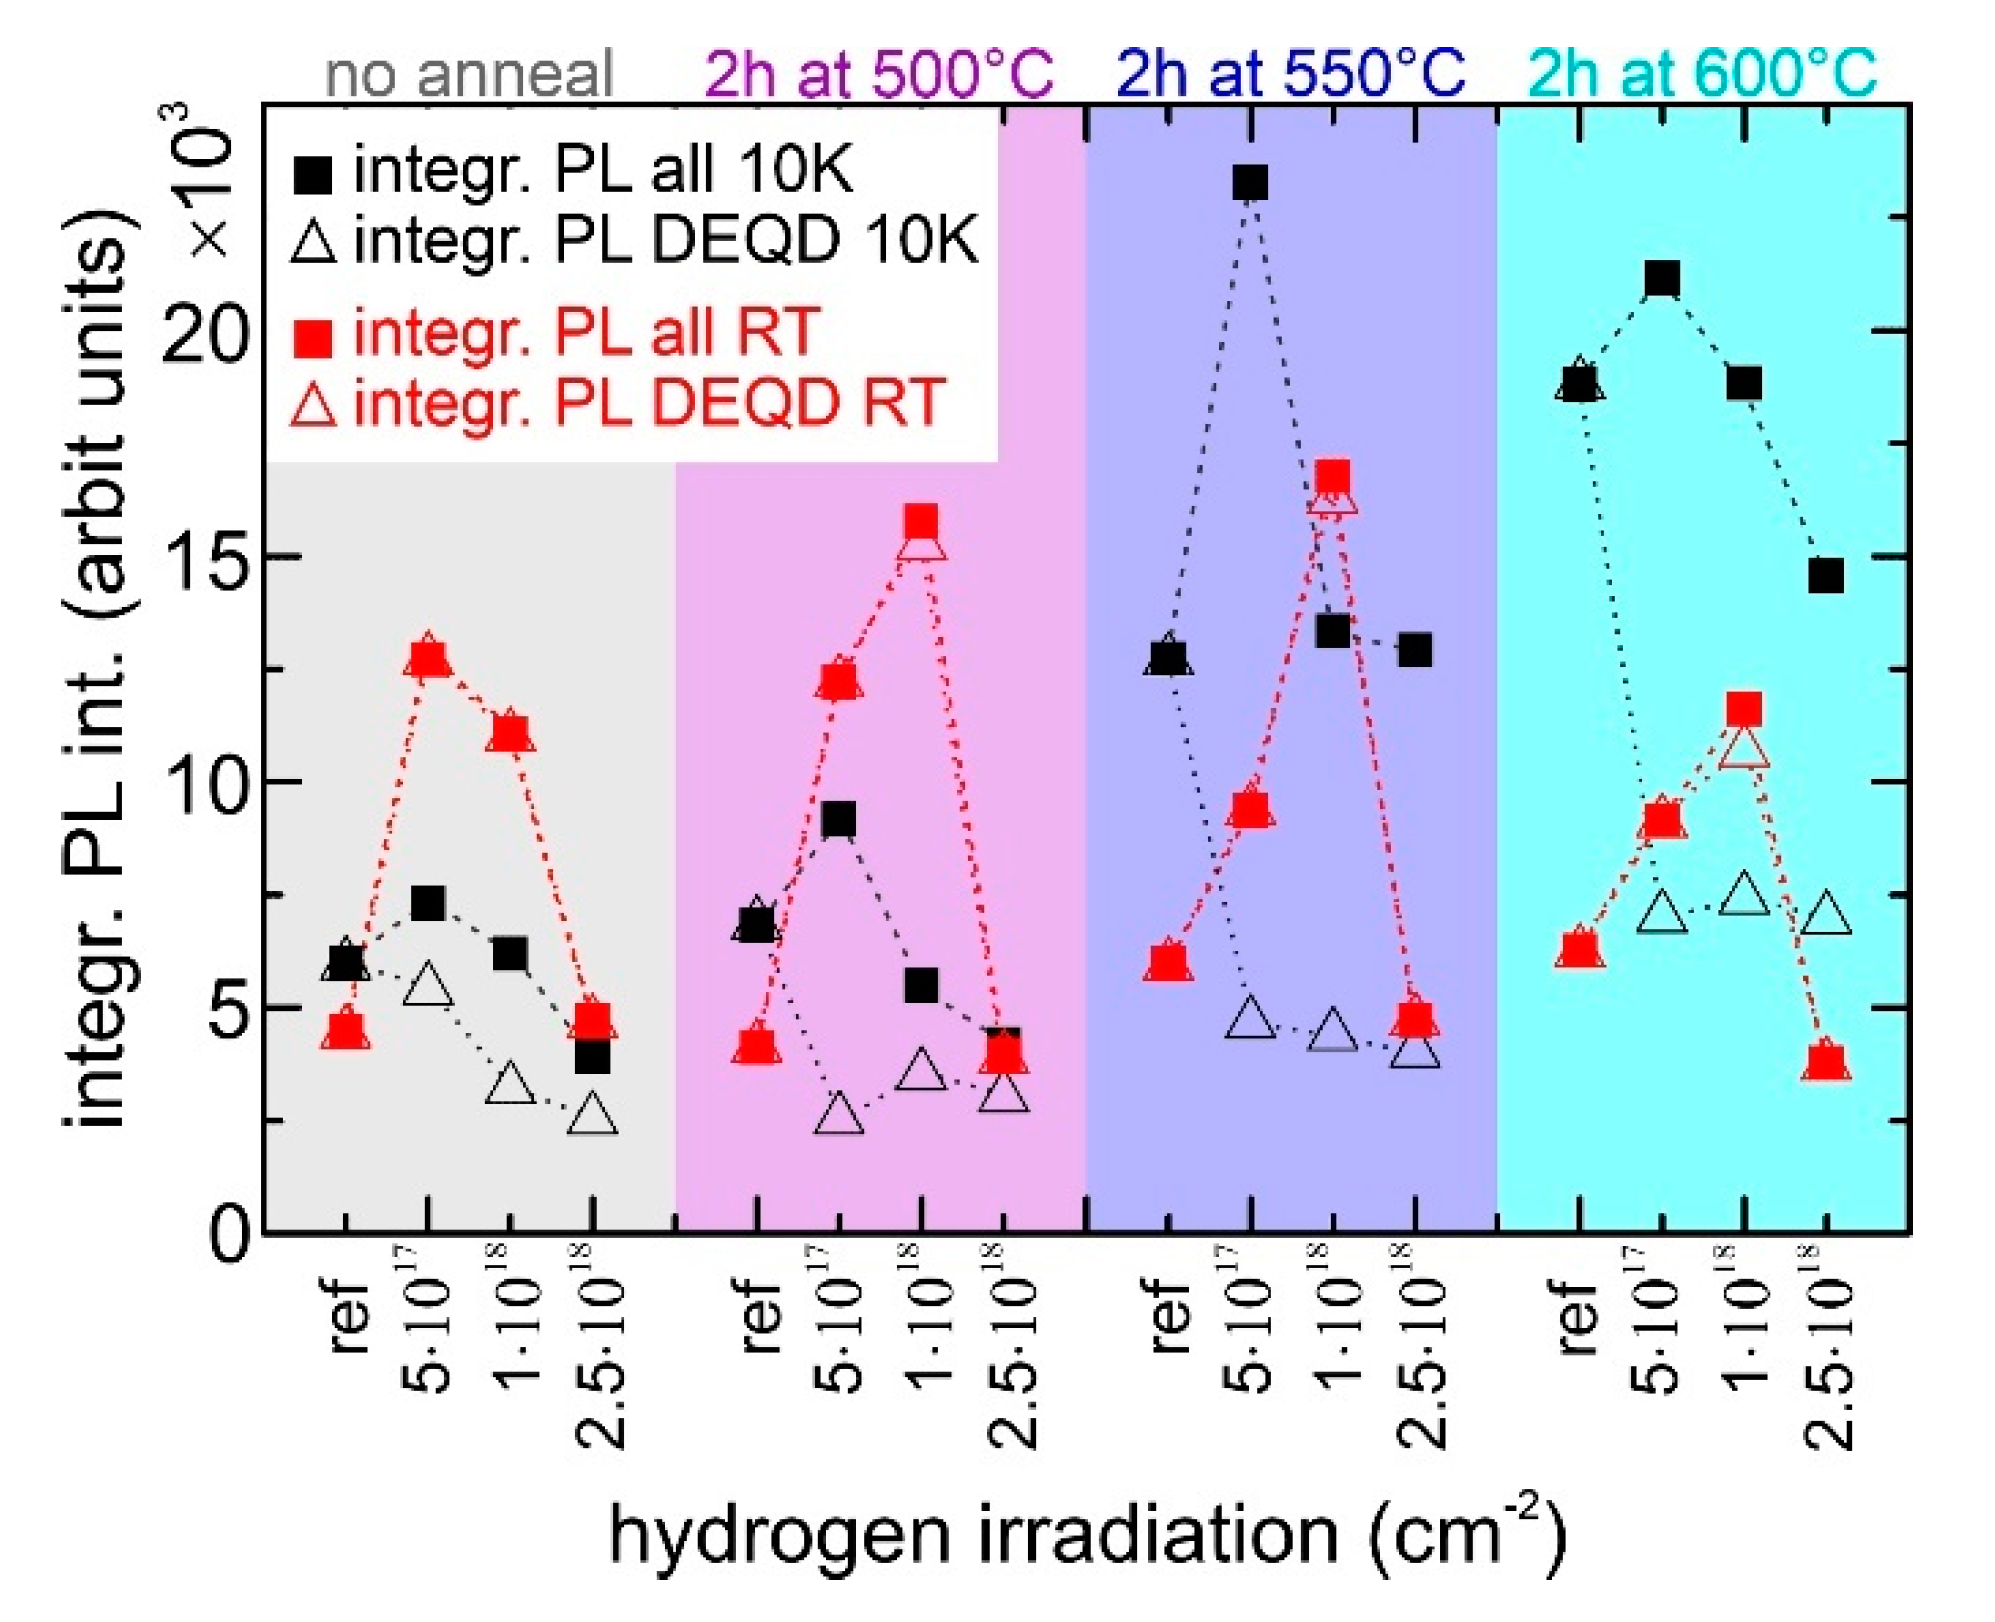
3.3. H-Irradiation Treatment of DEQDs

Hydrogen passivation is an indispensable tool for improving the electrical and optical quality of silicon in applications ranging from solar cells to CMOS technology to emission improvement of GeSi nanostructures [23,43,44]. DEQDs—the optically active material in this work—are surrounded by crystalline Si; the Si float-zone substrate, and the epitaxial Si buffer and capping layers.
Process steps, such as sample cleaning before growth, imperfect Ge ion implantation through the QD layer into the Si buffer layer, or the growth of the Si epilayers itself might lead to the introduction of point defects, which might not be detectable using methods such as transmission electron microscopy (TEM). Furthermore, it is known that the presence of larger crystal defects, such as stacking faults or misfit dislocations, leads to significant PL quenching from SiGe QD emitters [45], which makes the interpretation of the observed changes of the PL yield with respect to the performed in-situ/ex-situ treatments impossible. However, such extended defects are not observed in our samples, as evidenced by the TEM micrographs in Figure 5. Nevertheless, point defects might still limit the PL yield of DEQDs by the non-intentional introduction of non-radiative recombination paths in the Si matrix.
In Figure 6 we present the PL-response of a series of samples annealed at TA = 600 °C and recorded at TPL = 300 K (Figure 6a) and TPL = 10 K (Figure 6b). Besides an untreated reference sample, the samples underwent an additional low-energy proton irradiation treatment with various irradiation doses (5 × 1017 cm−2, 1 × 1018 cm−2, and 5 × 1018 cm−2). For these samples and hydrogenated samples that were previously annealed at other TA, the integrated PL intensity is given in Appendix A.
Figure 6a reveals that for moderate low-energy proton irradiation doses of 5 × 1017 cm−2 and 1 × 1018 cm−2, IPL emitted from the DEQDs (Figure 6, green and blue curves) can be increased by 48% and 89%, respectively, as compared to the untreated reference sample (Figure 6, black curve). In contrast, the highest investigated H-implantation dose leads to a 63% decrease of IPL. At TPL = 300 K, the shape of all PL spectra is similar, except for a slight increase of the full width at half maximum of ≈29 meV for some of the H-treated samples. The PL response recorded at TPL = 10 K, however, reveals that H-implantation causes changes in the carrier recombination paths, and thus in the shape of the PL spectra. An additional peak at wavelengths between 1200 nm and 1300 nm appears that is absent in the DEQD reference sample without low-energy proton irradiation and has not been observed in DEQD samples before [10,18,19,20,21]. This additional peak exhibits a systematic shift to higher energies with increasing proton irradiation dose. It can be assigned to so-called G-centers that are ascribed in the literature to the formation of Si-C vacancy clusters in Si [46].
The PL response from the low-energy proton-irradiated sample with a dose of 1 × 1018 cm−2 is shown in Figure 7 (black curve) over a TPL range from 20 K to 300 K. These spectra are compared to the ones of the not-H-treated DEQD sample (blue spectrum in Figure 7). Additionally, we compare the signal to another reference sample that contains only the Si layers, but no Ge DEQD layer. The PL response of this Si sample, which underwent the same proton irradiation treatment as the DEQD sample, is depicted in red in Figure 7. For both H-treated samples, the peak intensity associated with the G-center defect quenches already at TPL <120 K. For TPL >120 K, the spectral shapes of the hydrogen-treated DEQD sample and DEQD-reference coincide.
The corresponding temperature dependence of IPL for DEQDs, proton-irradiated DEQDs, and proton-irradiated Si are plotted in Figure 8. As mentioned before, EA(600) amounts to 190 meV. This value slightly improves to 210 meV for the DEQD sample treated with hydrogen. For the proton-irradiated Si epilayer, a low activation energy of 40 meV was found for the G-center related PL signal. The results of Figure 7 and Figure 8 indicate that the PL signal associated with the G-center is caused by structural changes in the Si capping layer upon low-energy proton irradiation, whereas the PL-results confirm that the DEQD layer is structurally not affected by H-treatment. Moreover, the light-emission improvement observed for the H-treated samples at TPL = 300 K proves that H-treatment is a valid tool to be combined with group IV nanostructures, since non-radiative recombination in the Si cladding layers can be suppressed.

4. Conclusions

We demonstrate that DEQD light-emitters can withstand a high thermal budget of at least up to 600 °C over 2 h, which makes them compatible with front-end integration in CMOS processes. Two main reasons for the quenching of the PL emission from DEQDs have been identified. First, at high luminescence temperatures, quantum dot ionization occurs by the escape of heavy holes from the deep valence band potentials to the higher energy states in the surrounding wetting layer (up to 250 meV). Second, at high annealing temperatures (TA >650 °C), defect migration out of the QD occurs, which quenches the PL intensity at all TPL. The latter is associated with a surprisingly high activation energy, larger than 3.4 eV. We showed that annealing at moderate temperatures of 500 °C to 550 °C, as well as low-energy ex-situ proton irradiation, are advantageous technology steps to improve the optical properties of DEQDs by the curing and passivation of point defects in the Si matrix surrounding the DEQDs.

Author Contributions

Conceptualization: M.B., L.S., and J.A.; PL investigation: L.S., J.A., T.F., and M.B.; TEM investigation: J.H., T.T., and H.G.; proton irradiation: A.P.; theoretical modelling: T.F. and J.S., writing—original draft preparation: M.B., L.S., and J.A.; writing—review and editing: L.S., J.A., A.P., J.H., H.G., T.F., F.S., and M.B.; supervision: M.B.; project administration: M.B., H.G., F.S., and T.F.; funding acquisition: M.B., H.G, T.F., and F.S. All authors have read and agreed to the published version of the manuscript.

Funding

This work was funded by the Austrian Science Fund (FWF): Y1238-N36, P29137-N36 and P30564-NBL, which is co-funded by the province of Upper Austria. Funding was also provided by the EU H2020 QuantERA ERA-NET via the Quantum Technologies project CUSPIDOR, which is co-funded by FWF(I3760). The financial support provided by the Austrian Federal Ministry for Digital and Economic Affairs and the National Foundation for Research, Technology, and Development in the frame of the Christian Doppler Laboratory for Nanoscale Phase Transformations is gratefully acknowledged. A.P. acknowledges funding from the Regione Lazio programme “Progetti di Gruppi di ricerca” legge Regionale n. 13/2008 (SINFONIA project, prot. n. 85-2017-15200) via LazioInnova spa.

Acknowledgments

The authors gratefully acknowledge A. Rastelli for support. Open Access Funding by the Austrian Science Fund (FWF).

Conflicts of Interest

The authors declare no conflicts of interest.

Appendix A

Figure A1 depicts a summary of the integrated PL intensities for the reference sample and the annealed samples at TA, as well as the samples that underwent low-energy proton irradiation treatment.
Figure A1. Integrated PL intensity for samples treated with different TA and hydrogen curing conditions. Red and black data points were extracted from measurements at TPL = 300 K and 10 K, respectively. Open symbols correspond to IPL from the DEQDs only, while full symbols indicate IPL from both DEQD emission and the light emission originating from the low energy proton irradiation.
Crystals 10 00351 g0a1

References

  1. Pavesi, L.; Lockwood, D.J. Photonics III: Systems and Applications; Springer: Berlin/Heidelberg, Germany, 2016. [Google Scholar]
  2. Reed, G.T.; Knights, A.P. Silicon Photonics: An Introduction; John Wiley: Chichester, UK, 2004. [Google Scholar]
  3. Tsybeskov, L.; Lockwood, D.J.; Ichikawa, M. Silicon photonics: CMOS going optical. Proc. IEEE 2009, 97, 1161–1165. [Google Scholar] [CrossRef]
  4. Baldassarre, L.; Sakat, E.; Frigerio, J.; Samarelli, A.; Gallacher, K.; Calandrini, E.; Isella, G.; Paul, D.J.; Ortolani, M.; Biagioni, P.; et al. Midinfrared plasmon-enhanced spectroscopy with germanium antennas on silicon substrates. Nano Lett. 2015, 15, 7225. [Google Scholar] [CrossRef] [PubMed] [Green Version]
  5. Chen, S.; Li, W.; Wu, J.; Jiang, Q.; Tang, M.; Shutts, S.; Elliott, S.N.; Sobiesierski, A.; Seeds, A.J.; Ross, I.; et al. Electrically pumped continuous-wave III–V quantum dot lasers on silicon. Nat. Photonics 2016, 10, 307–311. [Google Scholar] [CrossRef]
  6. Wang, T.; Liu, H.; Lee, A.; Pozzi, F.; Seeds, A. 1.3-μm InAs/GaAs quantum-dot lasers monolithically grown on Si substrates. Opt. Express 2011, 19, 11381–11386. [Google Scholar] [CrossRef] [PubMed]
  7. Shi, Y.; Wang, Z.; Van Campenhout, J.; Pantouvaki, M.; Guo, W.; Kunert, B.; Van Thourhout, D. Optical pumped InGaAs/GaAs nano-ridge laser epitaxially grown on a standard 300-mm Si wafer. Optica 2017, 4, 1468–1473. [Google Scholar] [CrossRef]
  8. Armand Pilon, F.T.; Lyasota, A.; Niquet, Y.-M.; Reboud, V.; Calvo, V.; Pauc, N.; Widiez, J.; Bonzon, C.; Hartmann, J.M.; Chelnokov, A.; et al. Lasing in strained germanium microbridges. Nat. Commun. 2019, 10, 2724. [Google Scholar] [CrossRef] [Green Version]
  9. Wirths, S.; Geiger, R.; von den Driesch, N.; Mussler, G.; Stoica, T.; Mantl, S.; Ikonic, Z.; Luysberg, M.I.; Chiussi, S.; Hartmann, J.-M.; et al. Lasing in direct-bandgap GeSn alloy grown on Si. Nat. Photonics 2015, 9, 88–92. [Google Scholar] [CrossRef] [Green Version]
  10. Grydlik, M.; Hackl, F.; Groiss, H.; Glaser, M.; Halilovic, A.; Fromherz, T.; Jantsch, W.; Schäffler, F.; Brehm, M. Lasing from glassy Ge quantum dots in crystalline Si. ACS Photonics 2016, 3, 298–303. [Google Scholar] [CrossRef] [Green Version]
  11. Persichetti, L.; Montanari, M.; Ciano, C.; Di Gaspare, L.; Ortolani, M.; Baldassarre, L.; Zoellner, M.; Mukherjee, S.; Moutanabbir, O.; Capellini, G.; et al. Intersubband transition engineering in the conduction band of asymmetric coupled Ge/SiGe quantum wells. Crystals 2020, 10, 179. [Google Scholar] [CrossRef] [Green Version]
  12. Zhou, Y.; Dou, W.; Du, W.; Ojo, S.; Tran, H.; Ghetmiri, S.A.; Liu, J.; Sun, G.; Soref, R.; Margetis, J.; et al. Optically pumped GeSn lasers operating at 270 K with broad waveguide structures on Si. ACS Photonics 2019, 6, 1434–1441. [Google Scholar] [CrossRef]
  13. Cornet, C.; Léger, Y.; Robert, C. Integrated Lasers on Si; ISTE-Elsevier: Amsterdam, The Netherlands, 2016. [Google Scholar]
  14. Takeuchi, H.; Wung, A.; Sun, X.; Howe, R.T.; King, T.-J. Thermal budget limits of quarter-micrometer foundry CMOS for post-processing MEMS devices. IEEE Trans. Electron Devices 2005, 52, 2081–2086. [Google Scholar] [CrossRef]
  15. Xiao, H. Introduction to Semiconductor Manufacturing Technology; Prentice-Hall: Upper Saddle River, NJ, USA, 2001. [Google Scholar]
  16. Hamann, H.F.; Weger, A.; Lacey, J.A.; Hu, Z.; Bose, P.; Cohen, E.; Wakil, J. Hotspot-limited microprocessors: Direct temperature and power distribution measurements. IEEE J. Solid-State Circuits 2007, 42, 56–65. [Google Scholar] [CrossRef]
  17. Bimberg, D.; Kirstaedter, N.; Ledentsov, N.N.; Alferov, Z.I.; Kop’ev, P.S.; Ustinov, V.M. InGaAs–GaAs quantum-dot lasers. IEEE J. Sel. Top. Quantum Electron. 1997, 3, 196–205. [Google Scholar] [CrossRef]
  18. Grydlik, M.; Lusk, M.T.; Hackl, F.; Polimeni, A.; Fromherz, T.; Jantsch, W.; Schäffler, F.; Brehm, M. Laser level scheme of self-interstitials in epitaxial Ge dots encapsulated in Si. Nano Lett. 2016, 16, 6802–6807. [Google Scholar] [CrossRef] [PubMed]
  19. Brehm, M.; Grydlik, M. Site-controlled and advanced epitaxial Ge/Si quantum dots: Fabrication, properties, and applications. Nanotechnology 2017, 28, 392001. [Google Scholar] [CrossRef]
  20. Groiss, H.; Spindlberger, L.; Oberhumer, P.; Schäffler, F.; Fromherz, T.; Grydlik, M.; Brehm, M. Photoluminescence enhancement through vertical stacking of defect-engineered Ge on Si quantum dots. Semicond. Sci. Technol. 2017, 32, 02LT01. [Google Scholar] [CrossRef]
  21. Rauter, P.; Spindlberger, L.; Schäffler, F.; Fromherz, T.; Freund, J.; Brehm, M. Room-temperature group-IV LED based on defect-enhanced Ge quantum dots. ACS Photonics 2018, 5, 431–438. [Google Scholar] [CrossRef]
  22. Hallam, B.; Chen, D.; Kim, M.; Stefani, B.; Hoex, B.; Abbott, M.; Wenham, S. The role of hydrogenation and gettering in enhancing the efficiency of next-generation Si solar cells: An industrial perspective. Phys. Status Solidi A 2017, 214, 1700305. [Google Scholar] [CrossRef] [Green Version]
  23. Cartier, E.; Stathis, J.H.; Buchanan, D.A. Passivation and depassivation of silicon dangling bonds at the Si/SiO2 interface by atomic hydrogen. Appl. Phys. Lett. 1993, 63, 1510. [Google Scholar] [CrossRef]
  24. Kern, W. The evolution of silicon wafer cleaning technology. J. Electrochem. Soc. 1990, 137, 1887–1892. [Google Scholar] [CrossRef]
  25. Tomita, H.; Kikuchi, T.; Furuya, K. Hydrogen desorption behaviors of HF-treated silicon wafer. Jpn. J. Appl. Phys. 1991, 30, 897. [Google Scholar] [CrossRef]
  26. Mo, Y.-W.; Savage, D.E.; Swartzentruber, B.S.; Lagally, M.G. Kinetic pathway in Stranski-Krastanov growth of Ge on Si (001). Phys. Rev. Lett. 1990, 65, 1020. [Google Scholar] [CrossRef] [PubMed]
  27. Capellini, G.; De Seta, M.; Evangelisti, F. Influence of the growth parameters on self-assembled Ge islands on Si(100). Mater. Sci. Eng. B 2001, 89, 184–187. [Google Scholar] [CrossRef]
  28. Brehm, M.; Montalenti, F.; Grydlik, M.; Vastola, G.; Lichtenberger, H.; Hrauda, N.; Beck, M.J.; Fromherz, T.; Schäffler, F.; Miglio, L.; et al. Key role of the wetting layer in revealing the hidden path of Ge/Si (001) Stranski-Krastanow growth onset. Phys. Rev. B 2009, 80, 205321. [Google Scholar] [CrossRef] [Green Version]
  29. Mazzucato, S.; Nardin, D.; Capizzi, M.; Polimeni, A.; Frova, A.; Seravalli, L.; Franchi, S. Defect passivation in strain engineered InAs/(InGa) As quantum dots. Mater. Sci. Eng. C 2005, 25, 830–834. [Google Scholar] [CrossRef]
  30. Felici, M.; Polimeni, A.; Salviati, G.; Lazzarini, L.; Armani, N.; Masia, F.; Capizzi, M.; Martelli, F.; Lazzarino, M.; Bais, G.; et al. In-plane bandgap engineering by modulated hydrogenation of dilute nitride semiconductors. Adv. Mater. 2006, 18, 1993–1997. [Google Scholar] [CrossRef]
  31. Klar, P.J.; Grüning, H.; Güngerich, M.; Heimbrodt, W.; Koch, J.; Torunski, T.; Stolz, W.; Polimeni, A.; Capizzi, M. Global changes of the band structure and the crystal lattice of Ga (N, As) due to hydrogenation. Phys. Rev. B 2003, 67, 121206. [Google Scholar] [CrossRef]
  32. Tedeschi, D.; Blundo, E.; Felici, M.; Pettinari, G.; Liu, B.; Yildrim, T.; Petroni, E.; Zhang, C.; Zhu, Y.; Sennato, S.; et al. Controlled micro/nanodome formation in proton-irradiated bulk transition-metal dichalcogenides. Adv. Mater. 2019, 31, 1903795. [Google Scholar] [CrossRef]
  33. Spindlberger, L.; Prucnal, S.; Aberl, J.; Brehm, M. Thermal stability of defect-enhanced Ge on Si quantum dot luminescence upon millisecond flash lamp annealing. Phys. Status Solidi A 2019, 216, 1900307. [Google Scholar] [CrossRef] [Green Version]
  34. Capellini, G.; De Seta, M.; Evangelisti, F. SiGe intermixing in Ge/Si (100) islands. Appl. Phys. Lett. 2001, 78, 303–305. [Google Scholar] [CrossRef]
  35. Brehm, M.; Grydlik, M.; Lichtenberger, H.; Fromherz, T.; Hrauda, N.; Jantsch, W.; Schäffler, F.; Bauer, G. Quantitative determination of Ge profiles across SiGe wetting layers on Si (001). Appl. Phys. Lett. 2008, 93, 121901. [Google Scholar] [CrossRef]
  36. Godbey, D.G.; Ancona, M.G. Modeling of Ge segregation in the limits of zero and infinite surface diffusion. J. Vac. Sci. Technol. A 1997, 15, 976. [Google Scholar] [CrossRef]
  37. Chen, P.; Etzelstorfer, T.; Hackl, F.; Katcho, N.A.; Chang, H.-T.; Nausner, L.; Lee, S.-W.; Fromherz, T.; Stangl, J.; Schmidt, O.G.; et al. Evolution of thermal, structural, and optical properties of SiGe superlattices upon thermal treatment. Phys. Status Solidi A 2016, 213, 533–540. [Google Scholar] [CrossRef]
  38. Majewski, J.A.; Birner, S.; Trellakis, A.; Sabathil, M.; Vogl, P. Advances in the theory of electronic structure of semiconductors. Phys. Status Solidi C 2004, 1, 2003. [Google Scholar] [CrossRef]
  39. Grydlik, M.; Brehm, M.; Hackl, F.; Groiss, H.; Fromherz, T.; Schäffler, F.; Bauer, G. Inverted Ge islands in {111} faceted Si pits—A novel approach towards SiGe islands with higher aspect ratio. New J. Phys. 2010, 12, 063002. [Google Scholar] [CrossRef] [Green Version]
  40. Kube, R.; Bracht, H.; Lundsgaard Hansen, J.; Nylandsted Larsen, A.; Haller, E.E.; Paul, S.; Lerch, W. Simultaneous diffusion of Si and Ge in isotopically controlled Si1−xGex heterostructures. Mater. Sci. Semicond. Process. 2008, 11, 378–383. [Google Scholar] [CrossRef]
  41. Kube, R.; Bracht, H.; Lundsgaard Hansen, J.; Nylandsted Larsen, A.; Haller, E.E.; Paul, S.; Lerch, W. Composition dependence of Si and Ge diffusion in relaxed Si1−xGex alloys. J. Appl. Phys. 2010, 107, 073520. [Google Scholar] [CrossRef]
  42. Heitjans, P.; Karger, J. Diffusion in Condensed Matter: Methods, Materials, Models, 2nd ed.; Birkhauser: Basel, Switzerland, 2005; pp. 19–65. [Google Scholar]
  43. Wang, S.; Mai, L.; Ciesla, A.; Hameiri, Z.; Payne, D.; Chan, C.; Hallam, B.; Chong, C.M.; Ji, J.; Shi, Z.; et al. Advanced passivation of laser-doped and grooved solar cells. Sol. Energy Mater. Sol. Cells 2019, 193, 403–410. [Google Scholar] [CrossRef]
  44. Fujimori, S.; Nagai, R.; Ikeda, M.; Makihara, K.; Miyazaki, S. Effect of H2-dilution in Si-cap formation on photoluminescence intensity of Si quantum dots with Ge core. Jpn. J. Appl. Phys. 2019, 58, SIIA01. [Google Scholar] [CrossRef]
  45. Hackl, F.; Grydlik, M.; Brehm, M.; Groiss, H.; Schäffler, F.; Fromherz, T.; Bauer, G. Microphotoluminescence and perfect ordering of SiGe islands on pit-patterned Si (001) substrates. Nanotechnology 2011, 22, 165302. [Google Scholar] [CrossRef]
  46. Davies, G. The optical properties of luminescence centres in silicon. Phys. Rep. 1989, 176, 83–188. [Google Scholar] [CrossRef]
Figure 1. Photoluminescence spectra of defect-enhanced quantum dots (DEQDs) samples recorded at TPL = 10 K (a) and room temperature (b). The DEQD samples were in-situ annealed for 2 h at temperatures TA of 500 °C (violet), 550 °C (dark blue), 600 °C (light blue), 625 °C (green), 650 °C (orange), and 675 °C (red). The spectrum of the pristine reference sample is depicted in grey.
Crystals 10 00351 g001
Figure 2. (a) Integrated photoluminescence (PL) intensity recorded at sample temperatures (TPL) = 10 K and TPL = 300 K versus sample annealing temperature, TA. The solid line in (a) is a fit to the activation energy for the decay of the integrated 300 K-PL intensity with increasing TA. (b) PL peak energy for samples in-situ annealed at temperatures ranging from TA = 500 °C to 675 °C, recorded at PL sample temperatures TPL of 10 K and 300 K. The color of the arrows links the data points to the spectra in Figure 1.
Crystals 10 00351 g002
Figure 3. Arrhenius plot of integrated PL intensity (IPL) versus 1000/TPL. Dark grey open squares denote the signal from the reference samples, green open upward triangles, orange open downward triangles, and light-blue open circles denote those of samples annealed in-situ at 600 °C, 625 °C, and 650 °C. The inset highlights the quenching of IPL with increasing TPL. The solid lines are fits of the activation energies with activation energy (EA) (ref) = 255 meV for the non-annealed sample, and EA(600) = 190 meV, EA(625) = 157 meV, and EA(650) = 124 meV for samples annealed at 600 °C, 625 °C, and 650 °C, respectively.
Crystals 10 00351 g003
Figure 4. (a,b) Simulated Ge composition profiles, the respective band offsets, and the heavy-hole ground state energies (dashed lines) for different TA for (a) a QD of 1.4 nm height, and (b) the surrounding wetting layer (WL) (height 0.7 nm), respectively. (c) Side-view scheme and (d) top-view scheme of thermal hole-escape from the QD potentials to higher-energy states in the WL potential, leading to spatial electron-hole-pair separation and thermally induced luminescence quenching.
Crystals 10 00351 g004
Figure 5. Cross-sectional TEM images of DEQDs grown at 500 °C and embedded in a crystalline Si matrix. (a) High-resolution phase-contrast image of a not-annealed reference sample. (b) Bright-field and (c) high angle annular dark field STEM images of DEQDs annealed at 625 °C for 2 h. No indications of extended defects are visible in the Si buffer and Si capping layers.
Crystals 10 00351 g005
Figure 6. PL spectra recorded at (a) TPL = 300 K and (b) TPL = 10 K of a reference sample annealed at TA = 600 °C. In addition to the untreated sample (black curve), samples have been investigated that underwent H-implantation with implantation dose of 5 × 1017 cm−2 (green curve), 1 × 1018 cm−2 (blue curve), and 2.5 × 1018 cm−2 (orange curve).
Crystals 10 00351 g006
Figure 7. Temperature-dependent PL spectra of DEQDs annealed at TA = 600 °C (blue spectra). Spectra of the same DEQD sample after proton irradiation (black curves). Pure silicon samples, i.e., without DEQDs, that underwent the same proton irradiation treatment (red curves).
Crystals 10 00351 g007
Figure 8. Arrhenius plots of the decay of the integrated PL decay with increasing temperature of the pristine DEQD reference sample, as well as the H-implanted DEQD sample and the irradiated silicon reference. The defect-related PL associated with the H-irradiation damage in Si has a much lower activation energy for thermal quenching (40 meV) than the DEQD-related PL.
Crystals 10 00351 g008

