Abstract
Anisotropic lattice expansion could be a source of misunderstanding in powder pattern recognitions, especially in the case of organic crystals where for the interpretation of room temperature patterns single crystal data at low temperature are usually used. Trying to rationalize the thermal lattice expansion, we studied two close related β-blocker molecules with similar packing in the solid state but with different thermal behavior. Solid state calculations, using the fast and accurate HF-3c method and the quasi harmonic approximation for the simulation of the lattice expansion, were able to reproduce the experimental trends with good accuracy. The complete analysis of the calculated thermal expansion of the two structures, as well as of other structures with similar packing found in a database survey, revealed the primary role of the hydrogen bonds. Secondary non-covalent interactions in the plane perpendicular to the hydrogen bond system could also play a role.
1. Introduction
Crystals are about equilibrium. In fact, in a crystal lattice, all repulsive and attractive forces are balanced [1]. An external stimulus could trigger a transformation, such as a chemical reaction, a phase change, and so on. The simplest is a change of the cell volume due to a temperature variation. In most cases, a volume enlargement is observed with the same change of all cell axes, but in other cases one axis could change at a different rate with respect to the other two. This phenomenon is called anisotropic thermal expansion. The latter is well-known for minerals and inorganic materials. A search on Scopus database with the term “Anisotropic thermal expansions” shows that only 2 of the 34 papers of the year 2019 are related to organic crystals [2,3]. Although organic crystals are less studied, it could be of great importance when we deal, for example, with APIs (Active Pharmaceutical Ingredients), given that their phase purity, as well as phase composition in formulations, is usually assessed by comparing powder diffraction patterns. In fact, as discussed by Stephenson [4], an unrecognized anisotropic thermal expansion could cause the wrong assignment of room temperature powder pattern recognitions, given that some peaks are unexpectedly more shifted with respect to those in the patterns simulated using single crystal data, usually obtained at low temperatures. The variation in 2θ is particularly significant in the diffraction patterns of crystal samples having unit cell axis dimension smaller than 10 Å [4].
We first encountered a case of anisotropic thermal expansion studying metoprolol salts [5,6]. Metoprolol is a β1 selective β-adrenoreceptor blocking drug used to treat heart failure and cardiovascular diseases, such as hypertension, angina, acute myocardial infarction, and ventricular tachycardia [7]. Because of its quite low melting point (323 K) metoprolol is usually administered in salt-based formulations as tartrate, succinate, or fumarate salts. The latter formulations have a different release dosage of API inside the organism. We observed that while metoprolol succinate and metoprolol fumarate salts undergo an anisotropic lattice expansion on raising the temperature [6], metoprolol tartrate behaves normally [5]. More recently, two of us (P.P. and P.R.) showed that the metoprolol free base undergoes an anisotropic thermal expansion [8], while the polymorph I of the closely related β-blocker drug betaxolol [9] (see Scheme 1) that gives rise to almost identical H-bond motifs ((10), vide infra) [10] (see Figure 1) shows an isotropic thermal expansion. The same holds for polymorph IV of betaxolol [11], i.e., its crystal lattice isotropically expands/contracts on changing the temperature; however, in this case, the H-bond network is slightly different (alternating (10) and (8) patterns).
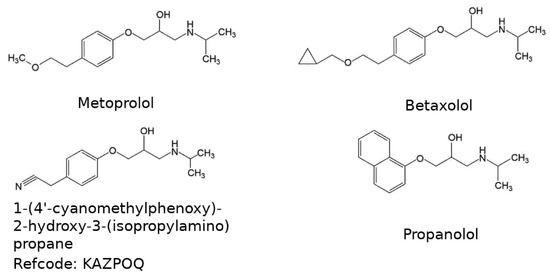
Scheme 1.
Drawings of the molecules used in this study.
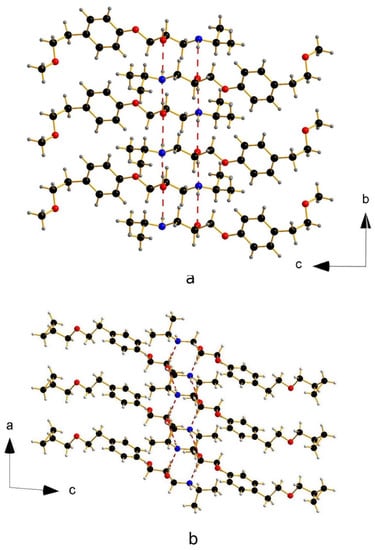
Figure 1.
Columns of Active Pharmaceutical Ingredients (API) in metoprolol (a) and betaxolol I (b).
As highlighted in Figure 1, in both metoprolol and betaxolol I crystal structures, infinite columns of API molecules extending along one axis direction (b and a, respectively) connected by two pair of intermolecular hydrogen bonds are present. The hydroxyl and amine groups act both as hydrogen-bond donors and acceptors, giving rise to a (10) hydrogen-bond pattern [10].
Three other structures having a molecular skeleton similar to metoprolol and showing an analogous hydrogen bond pattern were found in the Cambridge Database [12]. These are the structures of 1-(4’-cyanomethylphenoxy)-2-hydroxy-3-(isopropylamino) propane (refcode KAZPOQ) [13] of racemic propranolol (refcode PROPRA10) [14] and of (S)-propranolol (refcode IMITON) [15] (see Scheme 1). In all the structures, the length of the axis along which the hydrogen bonded chains propagate, varies from 4.980 Å for PROPRA10 to 5.449 Å for KAZPOQ.
In the past, we have used both X-ray diffraction data and theoretical chemistry to rationalize solid-state features and related behaviors of APIs, (e.g., isotropic vs. anisotropic thermal expansion, hydration/dehydration processes, polymorphs transformation/stability) [5,7,8,16,17,18,19], to shed light on the chemical properties of metal complexes (e.g., recognition and sensing, catalysis) [20,21] and of metal coordination in solid state in relation with the supramolecular arrangement [22,23,24,25] as well as the ability of the phosphorus lone pairs in phosphorene to form covalent bonds [26]. In these years, we have learnt that quantum chemistry calculations are more than a simulation tool and they can be fruitfully used for understanding and finding a correlation between the structural change and experimental observations. In the present work, we applied our expertise to study the anisotropic/isotropic expansion of free amine crystalline solid forms. These systems can be simulated using quantum mechanics methods, as demonstrated by several authors in the last few years [24,25,26,27,28,29]. One of the major advances was the introduction of the dispersion corrected Density Functional Theory (DFT-D) methods and their use in noncovalent interacting systems such as organic crystals [27]. Low mean absolute errors such as 1–3 kcal/mol are expected for computation of electronic lattice energies [30,31,32,33]. A good compromise in terms of accuracy and computational time is, on the other hand, the HF-3c method, which uses a minimal basis set with Hartree−Fock corrections for London dispersion and basis set errors [34]. This method was recently evaluated for the thermal expansion study of carbamazepine, an organic molecule comparable in size to the systems studied here [35]; thus, it was a convenient choice for our system.
In the present work, we aimed to find a correlation between structural arrangement and thermal behavior for the metoprolol and betaxolol structures. We first compared the calculated and experimental thermal expansion of metoprolol and betaxolol lattice, in order to verify the correct trend for the calculated values using the theoretical framework employed. Then, we present the results for other crystal structures with the same supramolecular arrangement and for a hypothetical polymorph of metoprolol optimized in betaxolol lattice. Finally, on the basis of the results of the calculations, we shed some light on the role of hydrogen bonding in the anisotropic thermal expansion for these systems.
2. Materials and Methods
The optimized geometries and energetics have been calculated at the HF-3c level of theory [36] by using the CRYSTAL17 software package (Colleretto Giacosa (Turin), Italy) [37].
The HF-3c method is based on the Hartree-Fock calculation optimized for speed using different corrections to include long-range London dispersion interactions, the basis set superposition error (BSSE), and the short-range basis set incompleteness. The basis set MINIX [36] is a set of different small basis set functions in dependence of atomic number of the atom. The method has a large semiempirical character, but it is tested to provide, on average, a good estimations of the bond lengths, it is self-interaction free, and it does not depend on the size of the grid for its analytical nature. The coupling with a small basis set assures a fast calculation time. For our systems, the HF-3c method can be used safely. Our structures are not too electronically complicated, and they do not contain anionic systems where the absence of Coulomb correlation and the too small basis set could lead to unrealistic results.
For each structure, as the starting point for geometrical optimization, the crystallographic coordinates have been taken from the cif files. The P21/n space group of metoprolol lattice was changed in P21/c as requested by the CRYSTAL17 code. The optimized geometries have been tested as minima with a frequency calculation.
The thermal expansion has been simulated using Quasi Harmonic Approximation (QHA). With this technique, it is possible to introduce the missing volume dependence of phonon frequencies by retaining the harmonic expression for the Helmholtz free energy. The CRYSTAL17 code implements a routine for automatically calculation of the thermal expansion after the required constrained volume optimizations, frequency phonon computations, and interpolation of modes [38,39,40,41]. Optimized coordinates and thermal properties calculated using Quasi Harmonic Approximation for all species are reported in Supplementary Materials.
3. Results and Discussion
The calculated variations of the cell volume and axes between 10 and 300 K for metoprolol and betaxolol I were compared with the experimental values and reported in Figure 2. The experimental trends were well reproduced, while the error on the cell volume was around 3% and 6%, a difference that is in accordance with the literature [34], confirming that our level of theory is adequate to reproduce the experimental behavior. As shown in Figure 2c, for metoprolol, the change was positive for the a and c axes, while a contraction was calculated for the b axis, confirming the anisotropic thermal expansion. On the other hand, the betaxolol lattice showed a consistent expansion of all the three axes.
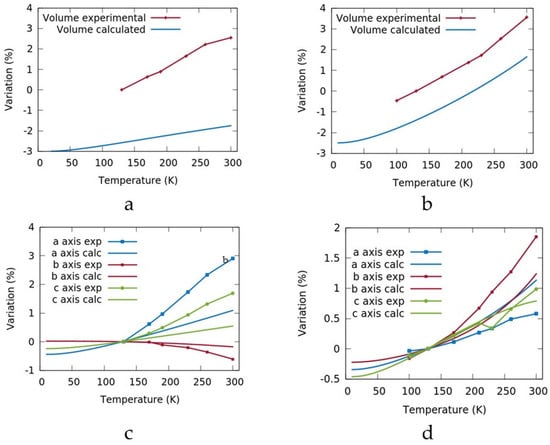
Figure 2.
Comparison of the calculated and experimental (dot plot) volume and axes for metoprolol (a,c) and betaxolol (b,d). The data are normalized with respect to the experimental value at 130 K.
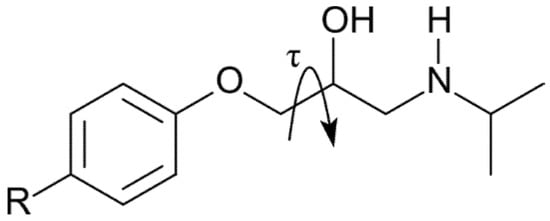
Having established the feasibility of the method, we calculated the thermal expansion for the molecules reported in the introduction and their corresponding crystal lattices, namely KAZPOQ, PROPRA10, and IMITON, as identified by the CCDC refcode as well as for a theoretical polymorph of metoprolol referred to as POLMET (see Figure 3 and Table 1). In fact, the strict structural similarity between the metoprolol and the betaxolol molecules gave us the chance to build a metoprolol polymorph that modifies the betaxolol structure. The two molecules have a different conformation given by the different torsion angles around the ether moiety as τ shown in Scheme 2, and betaxolol can be transformed in metoprolol just substituting the cyclopropane group with two hydrogen atoms. The model structure obtained was fully optimized and the new theoretical polymorph was obtained.
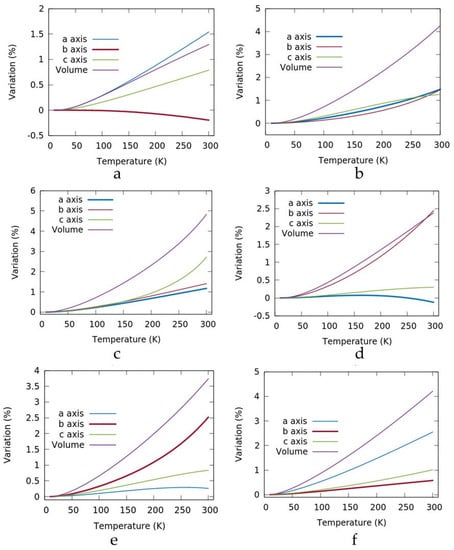
Figure 3.
Plots of the relative variations of the cell axes and the cell volume for metoprolol (a), betoxolol (b), POLMET (c), KAZPOQ (d), PROPRA10 (e), and IMITON (f) between 10 K and 300 K. The values are normalized respect the value at 10 K. The axis parallel to the hydrogen bond columns is highlighted with a broader line.

Table 1.
Cell parameters (Å) at 10 K and at 300 K and their calculated variations using Quasi Harmonic Approximation. The values in bold refer to the axis parallel to the hydrogen bond columns.
Scheme 2.
The torsion angle τ.
A close look at Table 1 and Figure 3 shows anisotropic thermal expansions for all considered crystals except for betaxolol and in part for POLMET. Only for PROPRA10, the largest change in the axes is correlated with the hydrogen bond column. In Figure 3 and in Table 1, the axis parallel to the hydrogen bond columns is highlighted with a broader line and a bold entry, respectively. In any case, a trend for the axis of the hydrogen bond column can be identified. If the axis is greater than 5 Å, as for metoprolol and KAZPOQ, a shrinkage was calculated. In the other crystals, an increase was observed instead.
In order to verify this behavior, a computational experiment was realized. We built a simplified model of our structures, namely the 1-(isopropylamino)-3-methoxy-2-propanol, 1, as shown in Figure 4a, where the skeleton of the compounds is maintained, while the phenyl moiety is substituted with a methyl group. We arranged 1 in the same mono-dimensional hydrogen bond column (see Figure 4b), and we fully optimized the structure.
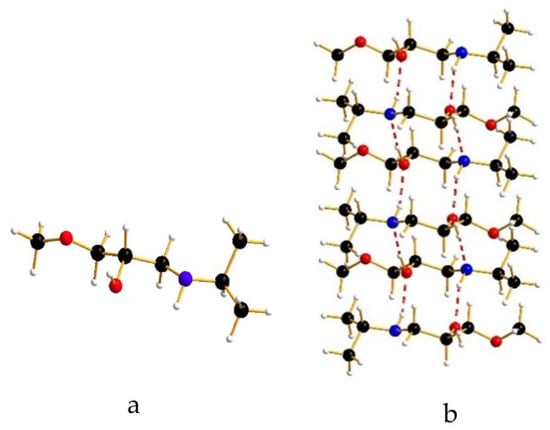
Figure 4.
(a) Drawing of the simplified model, 1; (b) Optimized hydrogen bond column of 1.
The calculated equilibrium value for the column axis is 4.86 Å, a value consistent with the 5 Å identified as the limit for the elongation or shrinkage of the axis of the hydrogen bond column. Additionally, we optimized again the system fixing the axis between 4.20 Å and 5.50 Å. The energy variation is reported in Figure 5, showing how the shrinkage of the axis is more or less twice easier than its elongation.
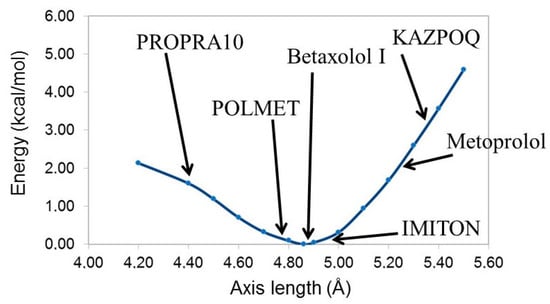
Figure 5.
Energy variation for the simplified model 1. Arrows indicate the axis length for the given structure.
The graph in Figure 5 is consistent with the calculated results. When in a system the axis of the hydrogen bond column is longer than the equilibrium distance calculated for 1 (e.g., metoprolol or KAZPOQ), at the increase of temperature, a shrinkage of the axis is favored and an anisotropic expansion is confirmed. On the other hand, when the axis is shorter, an elongation of the axis is expected. In other words, as one of the reviewers pointed out, the hydrogen bonds in these systems are stronger than the other forces acting in the crystals, and they will relax toward the preferred length when the temperature changes. Having this in mind, we can conclude that the anisotropic thermal expansion depends directly on the hydrogen bond column when the length of the hydrogen bond axis is far away from the equilibrium distance, as for metoprolol or KAZPOQ or for PROPRA10. When the axis is close to 5 Å the situation is more complicated and it is difficult to make predictions. In this case, the thermal behavior of the crystal should also be strongly influenced by the presence of other non-bonding interactions in the plane perpendicular to the hydrogen bond column.
4. Conclusions
In conclusion, we have analyzed, using the Quasi Harmonic Approximation, the thermal behavior of a series of β-blocker drugs with similar solid structures characterized by a particular type of hydrogen bond columns. The HF-3c method is able to reproduce the volume and axes trends with an overall accuracy between 3% and 6% with respect to the experimental values. While the number of cases is relatively low, a general trend was detected when the axis length parallel to the hydrogen bonds columns is compared with the calculated mono-dimensional hydrogen bond column. When the value of the crystal axis is far away for the calculated equilibrium distance of the mono-dimensional column, the anisotropic thermal expansion is predictable. In the other cases, other interactions could play an important role in determining the final thermal behavior of the crystals. Our observations could contribute to a deeper understanding of anisotropic thermal expansion in organic crystals.
Supplementary Materials
The following are available online at https://www.mdpi.com/2073-4352/10/5/350/s1, Optimized coordinates and thermal properties calculated using Quasi Harmonic Approximation of Metoprolol, Betaxolol I, POLMET, KAZPOQ, PROPRA10 and IMITON.
Author Contributions
Conceptualization, A.I. and P.P.; investigation, A.I., P.P., P.R., and S.M.; writing—original draft preparation, A.I.; writing—review and editing, A.I., P.P., P.R., and S.M. All authors have read and agreed to the published version of the manuscript.
Funding
P.P., P.R. and S.M. thank the Fondazione Cassa di Risparmio di Firenze (project 2018.0980).
Acknowledgments
The computing resources and the related technical support used for this work have been provided by CRESCO/ENEAGRID High Performance Computing infrastructure and its staff. [42] CRESCO/ENEAGRID High Performance Computing infrastructure is funded by ENEA, the Italian National Agency for New Technologies, Energy and Sustainable Economic Development, and by Italian and European research programs; see http://www.cresco.enea.it/english for information.
Conflicts of Interest
The authors declare no conflict of interest.
References
- Dunitz, J.D.; Gavezzotti, A. How molecules stick together in organic crystals: weak intermolecular interactions. Chem. Soc. Rev. 2009, 38, 2622–2633. [Google Scholar] [CrossRef] [PubMed]
- Jiao, X.; Maniam, S.; Langford, S.J.; McNeill, C.R. Influence of side-chain length and geometry on the thermal expansion behavior and polymorphism of naphthalene diimide-based thin films. Phys. Rev. Mater. 2019, 3, 013606. [Google Scholar] [CrossRef]
- Abraham, N.S.; Shirts, M.R. Adding Anisotropy to the Standard Quasi-Harmonic Approximation Still Fails in Several Ways to Capture Organic Crystal Thermodynamics. Cryst. Growth Des. 2019, 19, 6911–6924. [Google Scholar] [CrossRef]
- Stephenson, G.A. Anisotropic lattice contraction in pharmaceuticals: The influence of cryo-crystallography on calculated powder diffraction patterns. J. Pharm. Sci. 2006, 95, 821–827. [Google Scholar] [CrossRef]
- Paoli, P.; Rossi, P.; Macedi, E.; Ienco, A.; Chelazzi, L.; Bartolucci, G.L.; Bruni, B. Similar but different: The case of metoprolol tartrate and succinate salts. Cryst. Growth Des. 2016, 16, 789–799. [Google Scholar] [CrossRef]
- Rossi, P.; Paoli, P.; Chelazzi, L.; Conti, L.; Bencini, A. Metroprolol fumarate: crystal structure from powder X-ray diffraction data and comparison with the tartrate and succinate salts. Cryst. Growth Des. 2018, 18, 7015–7026. [Google Scholar] [CrossRef]
- Benfield, P.; Clissold, S.P.; Brogden, R.N. Metoprolol. Drugs 1986, 31, 376–429. [Google Scholar] [CrossRef]
- Rossi, P.; Paoli, P.; Chelazzi, L.; Conti, L.; Bencini, A. The solid-state structure of the β-blocker metoprolol: A combined experimental and in silico investigation. Acta Cryst. C 2019, 75, 87–96. [Google Scholar] [CrossRef]
- Canotilho, J.; Castro, R.A.E.; Rosado, M.T.S.; Ramos Silva, M.; Matos Beja, A.; Paixão, J.A.; Simões Redinha, J. The structure of betaxolol from single crystal X-ray diffraction and natural bond orbital analysis. J. Mol. Struct. 2008, 891, 437–442. [Google Scholar] [CrossRef]
- Bernstein, J.; Davis, R.E.; Shimoni, L.; Chang, N.-L. Patterns in hydrogen bonding: Functionality and graph set analysis in crystals. Angew. Chem. Int. Ed. Engl. 1995, 34, 1555–1573. [Google Scholar] [CrossRef]
- Rossi, P.; Paoli, P.; Milazzo, S.; Chelazzi, L.; Ienco, A.; Conti, L. Investigating differences and similarities between betaxolol polymorphs. Crystals 2019, 9, 509. [Google Scholar] [CrossRef]
- Groom, C.R.; Bruno, I.J.; Lightfoot, M.P.; Ward, S.C. The cambridge structural database. Acta Cryst. B 2016, 72, 171–179. [Google Scholar] [CrossRef] [PubMed]
- Akisanya, J.; Parkins, A.W.; Steed, J.W. A synthesis of atenolol using a nitrile hydration catalyst. Org. Process Res. Dev. 1998, 2, 274–276. [Google Scholar] [CrossRef]
- Ammon, H.L.; Howe, D.-B.; Erhardt, W.D.; Balsamo, A.; Macchia, B.; Macchia, F.; Keefe, W.E. The crystal structures of dichloroisoproterenol, propranolol and propranolol hydrochloride. Acta Cryst. B 1977, 33, 21–29. [Google Scholar] [CrossRef]
- Bredikhin, A.A.; Savel"ev, D.V.; Bredikhina, Z.A.; Gubaidullin, A.T.; Litvinov, I.A. Crystallization of chiral compounds. 2. Propranolol: Free base and hydrochloride. Russ. Chem. Bull. 2003, 52, 853–861. [Google Scholar] [CrossRef]
- Paoli, P.; Rossi, P.; Chelazzi, L.; Altamura, M.; Fedi, V.; Giannotti, D. Solid state investigation and characterization of a nepadutant precursor: Polymorphic and pseudopolymorphic forms of MEN11282. Cryst. Growth Des. 2016, 16, 5294–5304. [Google Scholar] [CrossRef]
- Rossi, P.; Macedi, E.; Paoli, P.; Bernazzani, L.; Carignani, E.; Borsacchi, S.; Geppi, M. Solid–solid transition between hydrated racemic compound and anhydrous conglomerate in Na-Ibuprofen: A combined X-ray diffraction, solid-state NMR, calorimetric, and computational study. Cryst. Growth Des. 2014, 14, 2441–2452. [Google Scholar] [CrossRef]
- Rossi, P.; Paoli, P.; Ienco, A.; Biagi, D.; Valleri, M.; Conti, L. A new crystal form of the NSAID dexketoprofen. Acta Cryst. C 2019, 75, 783–792. [Google Scholar] [CrossRef]
- Rossi, P.; Paoli, P.; Chelazzi, L.; Milazzo, S.; Biagi, D.; Valleri, M.; Ienco, A.; Valtancoli, B.; Conti, L. Relationships between anhydrous and solvated species of dexketoprofen trometamol: A solid-state point of view. Cryst. Growth Des. 2020, 20, 226–236. [Google Scholar] [CrossRef]
- Amatori, S.; Ambrosi, G.; Borgogelli, E.; Fanelli, M.; Formica, M.; Fusi, V.; Giorgi, L.; Macedi, E.; Micheloni, M.; Paoli, P.; et al. Modulating the sensor response to halide using NBD-based azamacrocycles. Inorg. Chem. 2014, 53, 4560–4569. [Google Scholar] [CrossRef]
- Crociani, B.; Antonaroli, S.; Burattini, M.; Paoli, P.; Rossi, P. Palladium complexes with a tridentate PNO ligand. Synthesis of η1-allyl complexes and cross-coupling reactions promoted by boron compounds. Dalton Trans. 2010, 39, 3665–3672. [Google Scholar] [CrossRef] [PubMed]
- Grirrane, A.; Pastor, A.; Galindo, A.; del Río, D.; Orlandini, A.; Mealli, C.; Ienco, A.; Caneschi, A.; Sanz, J.F. Supramolecular interactions as determining factors of the geometry of metallic building blocks: Tetracarboxylate dimanganese species. Angew. Chem. Int. Ed. 2005, 44, 3429–3432. [Google Scholar] [CrossRef] [PubMed]
- Grirrane, A.; Pastor, A.; Galindo, A.; Álvarez, E.; Mealli, C.; Ienco, A.; Orlandini, A.; Rosa, P.; Caneschi, A.; Barra, A.-L.; et al. Thiodiacetate–manganese chemistry with N ligands: Unique control of the supramolecular arrangement over the metal coordination mode. Chem. A Eur. J. 2011, 17, 10600–10617. [Google Scholar] [CrossRef] [PubMed]
- Mosquera, M.E.G.; Gomez-Sal, P.; Diaz, I.; Aguirre, L.M.; Ienco, A.; Manca, G.; Mealli, C. Intriguing I2 reduction in the iodide for chloride ligand substitution at a Ru(II) complex: Role of mixed trihalides in the redox mechanism. Inorg. Chem. 2016, 55, 283–291. [Google Scholar] [CrossRef] [PubMed]
- Canossa, S.; Bacchi, A.; Graiff, C.; Pelagatti, P.; Predieri, G.; Ienco, A.; Manca, G.; Mealli, C. Hierarchy of supramolecular arrangements and building blocks: Inverted paradigm of crystal engineering in the unprecedented metal coordination of methylene blue. Inorg. Chem. 2017, 56, 3512–3516. [Google Scholar] [CrossRef] [PubMed]
- Ienco, A.; Manca, G.; Peruzzini, M.; Mealli, C. Modelling strategies for the covalent functionalization of 2D phosphorene. Dalton Trans. 2018, 47, 17243–17256. [Google Scholar] [CrossRef]
- Klimeš, J.; Michaelides, A. Perspective: Advances and challenges in treating van der Waals dispersion forces in density functional theory. J. Chem. Phys. 2012, 137, 120901. [Google Scholar] [CrossRef]
- Grimme, S.; Hansen, A.; Brandenburg, J.G.; Bannwarth, C. Dispersion-corrected mean-field electronic structure methods. Chem. Rev. 2016, 116, 5105–5154. [Google Scholar] [CrossRef]
- Hoja, J.; Reilly, A.M.; Tkatchenko, A. First-principles modeling of molecular crystals: Structures and stabilities, temperature and pressure. WIREs Comput. Mol. Sci. 2017, 7, e1294. [Google Scholar] [CrossRef]
- Otero-de-la-Roza, A.; Johnson, E.R. A benchmark for non-covalent interactions in solids. J. Chem. Phys. 2012, 137, 054103. [Google Scholar] [CrossRef]
- Reilly, A.M.; Tkatchenko, A. Understanding the role of vibrations, exact exchange, and many-body van der waals interactions in the cohesive properties of molecular crystals. J. Chem. Phys. 2013, 139, 024705. [Google Scholar] [CrossRef] [PubMed]
- Brandenburg, J.G.; Grimme, S. Organic crystal polymorphism: A benchmark for dispersion corrected mean field electronic structure methods. Acta Cryst. Sect. B Struct. Sci. Cryst. Eng. Mater. 2016, 72, 502–513. [Google Scholar] [CrossRef] [PubMed]
- Brandenburg, J.G.; Maas, T.; Grimme, S. Benchmarking DFT and semiempirical methods on structures and lattice energies for ten ice polymorphs. J. Chem. Phys. 2015, 142, 124104. [Google Scholar] [CrossRef] [PubMed]
- Cutini, M.; Civalleri, B.; Corno, M.; Orlando, R.; Brandenburg, J.G.; Maschio, L.; Ugliengo, P. Assessment of different quantum mechanical methods for the prediction of structure and cohesive energy of molecular crystals. J. Chem. Theory Comput. 2016, 12, 3340–3352. [Google Scholar] [CrossRef] [PubMed]
- Brandenburg, J.G.; Potticary, J.; Sparkes, H.A.; Price, S.L.; Hall, S.R. Thermal expansion of carbamazepine: Systematic crystallographic measurements challenge quantum chemical calculations. J. Phys. Chem. Lett. 2017, 8, 4319–4324. [Google Scholar] [CrossRef] [PubMed]
- Sure, R.; Grimme, S. Corrected small basis set hartree-fock method for large systems. J. Comput. Chem. 2013, 34, 1672–1685. [Google Scholar] [CrossRef]
- Dovesi, R.; Erba, A.; Orlando, R.; Zicovich-Wilson, C.M.; Civalleri, B.; Maschio, L.; Rérat, M.; Casassa, S.; Baima, J.; Salustro, S.; et al. Quantum-mechanical condensed matter simulations with CRYSTAL. WIREs Comput. Mol. Sci. 2018, 8, e1360. [Google Scholar] [CrossRef]
- Erba, A. On combining temperature and pressure effects on structural properties of crystals with standard ab initio techniques. J. Chem. Phys. 2014, 141, 124115. [Google Scholar] [CrossRef]
- Erba, A.; Maul, J.; Itou, M.; Dovesi, R.; Sakurai, Y. Anharmonic thermal oscillations of the electron momentum distribution in lithium fluoride. Phys. Rev. Lett. 2015, 115, 117402. [Google Scholar] [CrossRef]
- Erba, A.; Shahrokhi, M.; Moradian, R.; Dovesi, R. On how differently the quasi-harmonic approximation works for two isostructural crystals: Thermal properties of periclase and lime. J. Chem. Phys. 2015, 142, 044114. [Google Scholar] [CrossRef]
- Erba, A.; Maul, J.; De La Pierre, M.; Dovesi, R. Structural and elastic anisotropy of crystals at high pressures and temperatures from quantum mechanical methods: The case of Mg2SiO4 forsterite. J. Chem. Phys. 2015, 142, 204502. [Google Scholar] [CrossRef] [PubMed]
- Ponti, G.; Palombi, F.; Abate, D.; Ambrosino, F.; Aprea, G.; Bastianelli, T.; Beone, F.; Bertini, R.; Bracco, G.; Caporicci, M.; et al. The role of medium size facilities in the HPC ecosystem: The case of the new CRESCO4 cluster integrated in the ENEAGRID infrastructure. In Proceedings of the 2014 International Conference on High Performance Computing Simulation (HPCS), Bologna, Italy, 21–25 July 2014; pp. 1030–1033. [Google Scholar]
© 2020 by the authors. Licensee MDPI, Basel, Switzerland. This article is an open access article distributed under the terms and conditions of the Creative Commons Attribution (CC BY) license (http://creativecommons.org/licenses/by/4.0/).