Article

Late Age Dynamic Strength of High-Volume Fly Ash Concrete with Nano-Silica and Polypropylene Fibres

by
Mohamed H. Mussa
1,2,*,
Ahmed M. Abdulhadi
2,
Imad Shakir Abbood
3,
Azrul A. Mutalib
1 and
Zaher Mundher Yaseen
4
1
Department of Civil Engineering, Faculty of Engineering & Built Environment, Universiti Kebangsaan Malaysia, Bangi 43600 UKM, Selangor, Malaysia
2
Department of Civil Engineering, University of Warith Al-Anbiyaa, Karbala 56001, Iraq
3
Engineering Affairs Department, Sunni Endowment Diwan, Baghdad, Iraq
4
Sustainable Developments in Civil Engineering Research Group, Faculty of Civil Engineering, Ton Duc Thang University, Ho Chi Minh City, Vietnam
*
Author to whom correspondence should be addressed.
Crystals 2020, 10(4), 243; https://doi.org/10.3390/cryst10040243
Submission received: 1 March 2020 / Revised: 21 March 2020 / Accepted: 23 March 2020 / Published: 26 March 2020
(This article belongs to the Special Issue Crystal Plasticity)

Abstract

:
The dynamic behaviour of high-volume fly ash concrete with nano-silica (HVFANS) and polypropylene fibres at curing ages of 7 to 90 days was determined by using a split Hopkinson pressure bar (SHPB) machine. At each curing age, the concrete samples were laboratory tested at different temperatures conditions under strain rates reached up to 101.42 s−1. At room temperature, the results indicated that the dynamic compressive strength of plain concrete (PC) was slightly higher than HVFANS concrete at early curing ages of 7 and 28 days, however, a considerable improvement in the strength of HVFANS concrete was noted at a curing age of 90 days and recorded greater values than PC owing to the increase of fly ash reactivity. At elevated temperatures, the HVFANS concrete revealed a superior behaviour than PC even at early ages in terms of dynamic compressive strength, critical strain, damage and toughness due to increase of nano-silica (NS) activity during the heating process. Furthermore, equations were suggested to estimate the dynamic increase factor (DIF) of both concretes under the investigated factors.

1. Introduction

Nowadays, the production process of one ton Portland cement could release about one ton of greenhouses gases to the air which mainly consisted of carbon dioxide CO2 [1]. The scientific community reported that CO2 contributes about 65% of global warming which means that the temperature of the planet will be raised between 1.4 and 5.8 °C during the next century so that several natural disasters might occur [2]. Therefore, scholars suggested several alternative binders as instant (fly ash (FA), silica fume, nano-silica (NS), slag, metakaolin, etc.) to reduce the reliance on Portland cement in construction.
Huge amounts of FA are produced annually worldwide about one billion tonnes as reported by Bakharev [3]. However, only a few amounts are used approximately 20% to 30% and the rest is landfilled with potential risks of environmental pollution [4]. Fly ash is gathered from thermal power plants during the pulverised coal combustion. Most of the FA particles are solid spheres with sizes between 1 to 100 μm, and a specific gravity of 1.9 to 2.8 with a surface area of 300 to 500 m2/kg. The classification of FA depends on its chemical composition and typically classified as Class F or Class C based on the percentages of iron, silica and aluminium oxide, which have to be a minimum of 70% or 50%, respectively. Recently, numerous studies have been conducted to investigate the ability to use a high quantity of fly ash in concrete as a cement replacement because of its beneficial effects on concrete behaviour and low cost [5].
The main disadvantage of using high-volume fly ash (HVFA) was the sharp reduction in the strength of concrete particularly at primary ages owing to the slow reactivity of fly ash which contained a high amount of oxide calcium (CaO) [6]. Montgomery et al. [7] revealed that CaO apparently had not reacted at early ages during the normal curing circumstances. The differences in strength between the plain concrete (PC) and HVFA concrete are diminished with the increase of curing age. At late ages, the strength of HVFA concrete might equalise or exceed the plain concrete (PC) strength according to the quantity, fineness and reactivity of FA, water to cementations material ratio ( w / ( c + p ) ) and curing conditions such as humidity and temperature.
Several scholars aimed to develop the static strength of HVFA concrete and mortar at early curing ages by adding nano-silica (NS) material due to its high pozzolanic reactivity and pore-filling effect. Li [8] revealed that using 4% of NS in concrete consisted of 50% of FA could increase the static compressive strength by 68.57%, 39.34%, 18.72% and 7.58% at curing ages of 7, 28, 56, and 112 days, respectively. In the same context, Zhang and Islam [9] stated that the strength of mortar samples consisted of 50% FA and 1% NS improved by 62.16%, 24.31%, 17.1%, 6.86% and 4.35% during curing ages of 1, 3, 7, 28 and 91 days, respectively. Furthermore, the fire resistance of HVFA concrete inclusion with NS was studied. Ibrahim [10,11] reported that high-volume fly ash nano-silica (HVFANS) concrete could maintain about 94.54% of its strength under a temperature of 700 °C at a curing age of 28 days via substituting the cement with 2.5% and 52.5% of nano-silica and fly ash, respectively.
Several structures as instant tunnels may be subject to accidental or man-made explosions during the service time [12,13,14,15,16,17,18,19]. It leads to the fact that the concrete material is in danger of fire exposure and dynamic loads simultaneously. The previous studies mainly focused on determining the response of normal strength concrete (NSC) under the combined effect of temperature and strain rate at a curing age of 28 days using the SHPB machine [20,21,22,23,24,25]. These studies concluded that the concrete strength reduced with temperature particularly above 400 °C and the dynamic increase factor (DIF) showed a linear relationship with strain rate. Chen et al. [26] investigated the behaviour of NSC containing 15% to 20% of FA under high temperatures reaching up to 950 °C and strain rate range between 10 and 205 s−1. The results showed a remarkable relation between the dynamic properties of concrete and strain rates at elevated temperature. Whereas, the failure of concrete samples under high strain rates were considerably different than those at room temperature. On the other hand, limited research was performed to investigate the dynamic response of high strength concrete (HSC) contained a high-volume of FA and nano-silica materials under the combined effect of temperatures and strain rate. Most of these studies were conducted at a curing age of 28 days. Li et al. [27] tested the HSC concrete consisting from 4.5% to 23% of silica fume and fly ash at a strain rate range between 33.70 and 194.12 s−1 and elevated temperatures reached up to 800 °C. The results revealed a linear increase of dynamic strength with the strain rate which obviously reduced after 400 °C. The tested concrete was able to maintain 51.85% and 24.3% of its original strength at 600 and 800 °C, respectively.
In the same context, Su et al. [28] studied the behaviour of HSC concrete consisting of 20% and 5% of FA and silica fume, respectively, under temperatures reached up to 800 °C within strain rate range between 27.5 to 121.6 s−1. The results indicated that the concrete strength was increased by 14% at 400 °C as compared to the ambient temperature. However, its strength was significantly decreased by 16% and 48% at temperatures of 600 and 800 °C, respectively. Furthermore, the concrete toughness showed a notable increase at temperatures of 200 and 400 °C by 31 and 95, respectively, as compared to ambient temperature but its toughness considerably declined at 800 °C. According to the previous studies, the curing age had a clear effect on the static properties of fly ash concrete with nano-silica materials. Nevertheless, the dynamic behaviour of this concrete type is still not further investigated at early or late curing age while most of the prior researchers determined its properties at 28 days only. Therefore, understanding the behaviour of HVFANS concrete under various curing ages will increase the dependability on this concrete in construction. The proportions of HVFANS concrete proposed by Ibrahim [10,11] were adopted in this study due to its high-fire resistance.

2. Materials and Equipment

2.1. Components of Concrete Mixture

The proportions of concrete samples with a target strength of 60MPa are selected based on (ACI 211.4R-93) with water to binder materials ratio of 0.29 as described in Table 1 [29]. The percentages of FA and NS as cement replacement were 52.5% and 2.5%, respectively. These percentages were chosen owing to the fire properties of its produced concrete at temperatures reached up to 700 °C [10,11].
The Portland cement (Type I) manufactured by Tasek Cement Company according to Malaysian standard (MS 522) was used [30]. The Fly ash class F was collected from a local power plant with 44.16% of silicon dioxide (SiO2), 24.6% of aluminium oxide (Al2O3) and 12.5% of ferric oxide (Fe2O3) was adopted as a cement replacement [31]. Colloidal nano-silica (Cembinder W8) was manufactured via AkzoNobel Company was used to improve the early compressive strength of concrete, thereby shortening the setting time of the cement slurry [10,11]. The surface area of NS particles was equal to 80 m2/g with an average size of 35 nm and a silica concentration of 50% with a bulk density of 1050 kg/m3 and pH of 10. Natural river sand was used as a fine aggregate passed via a sieve size of 4.75 mm with fineness modulus of 2.98 [32,33]. The bulk specific gravity of the sand was 2.53 with a compacted and loose bulk density of 1721.83 and 1510.18 kg/m3 [34]. Coarse aggregate with a maximum size of 10 mm with a specific gravity of 2.07 was used in the mix design.
Fibrillated Polypropylene fibres (PPF) with a 1% dosage were added to the concrete samples exposed to the high temperature to increase the ductility of concrete and eliminate the surface spalling by providing new pores after melting which work as channels to relieve the internal energy of water vapour pressure [35,36,37,38,39,40]. These fibres manufactured by Timuran Company with the length of 12 mm and a specific gravity of 0.9 have a white colour with a melting point ranging between 160 and 170 °C and tensile strength of 0.36 kN/mm2. Furthermore, superplasticiser with a dosage of 1% was added to provide the required workability and improve the compressive strength of concrete via decreasing the amount of water in the mixture.

2.2. Samples Preparation and Curing Conditions

The feeding sequence of concrete materials into a horizontal pan mixer was carried out according to American Society for Testing and Materials (ASTM) C192 [41]. However, cement balls were formed mainly in the case of HVFANS concrete samples as shown in Figure 1. Therefore, a part of coarse aggregate with fine aggregate was firstly mixed with fly ash and cement to avoid the above problem. Afterwards, the water and colloidal NS were added to the mixture. Lastly, the other parts of the aggregate and fibres were added to destroy any noodles of a mixture [42]. The concrete mixture was cast into three layers inside cubic and cylindrical steel moulds with dimensions of 150 × 150 × 150 mm and 50 × 50 mm, respectively, and then each layer was compacted by a vibration table for ten seconds. Before the curing process, the casted samples were covered by a plastic membrane to reduce the moisture evaporation. The PC samples remained in moulds for 24 h, while the HVFANS concrete samples were de-moulded after 48 h. Afterwards, all the casted cubes and cylinders are cured into a water tank for 7, 28 and 90 days within room temperature. Water with a pH of 8 was used for making the mixes and curing the specimens. The water was free of chloride and deleterious salts according to the American Society for Testing and Materials (ASTM) specifications for mixing water used in the production of hydraulic cement concrete [43].

2.3. Laboratory Tests
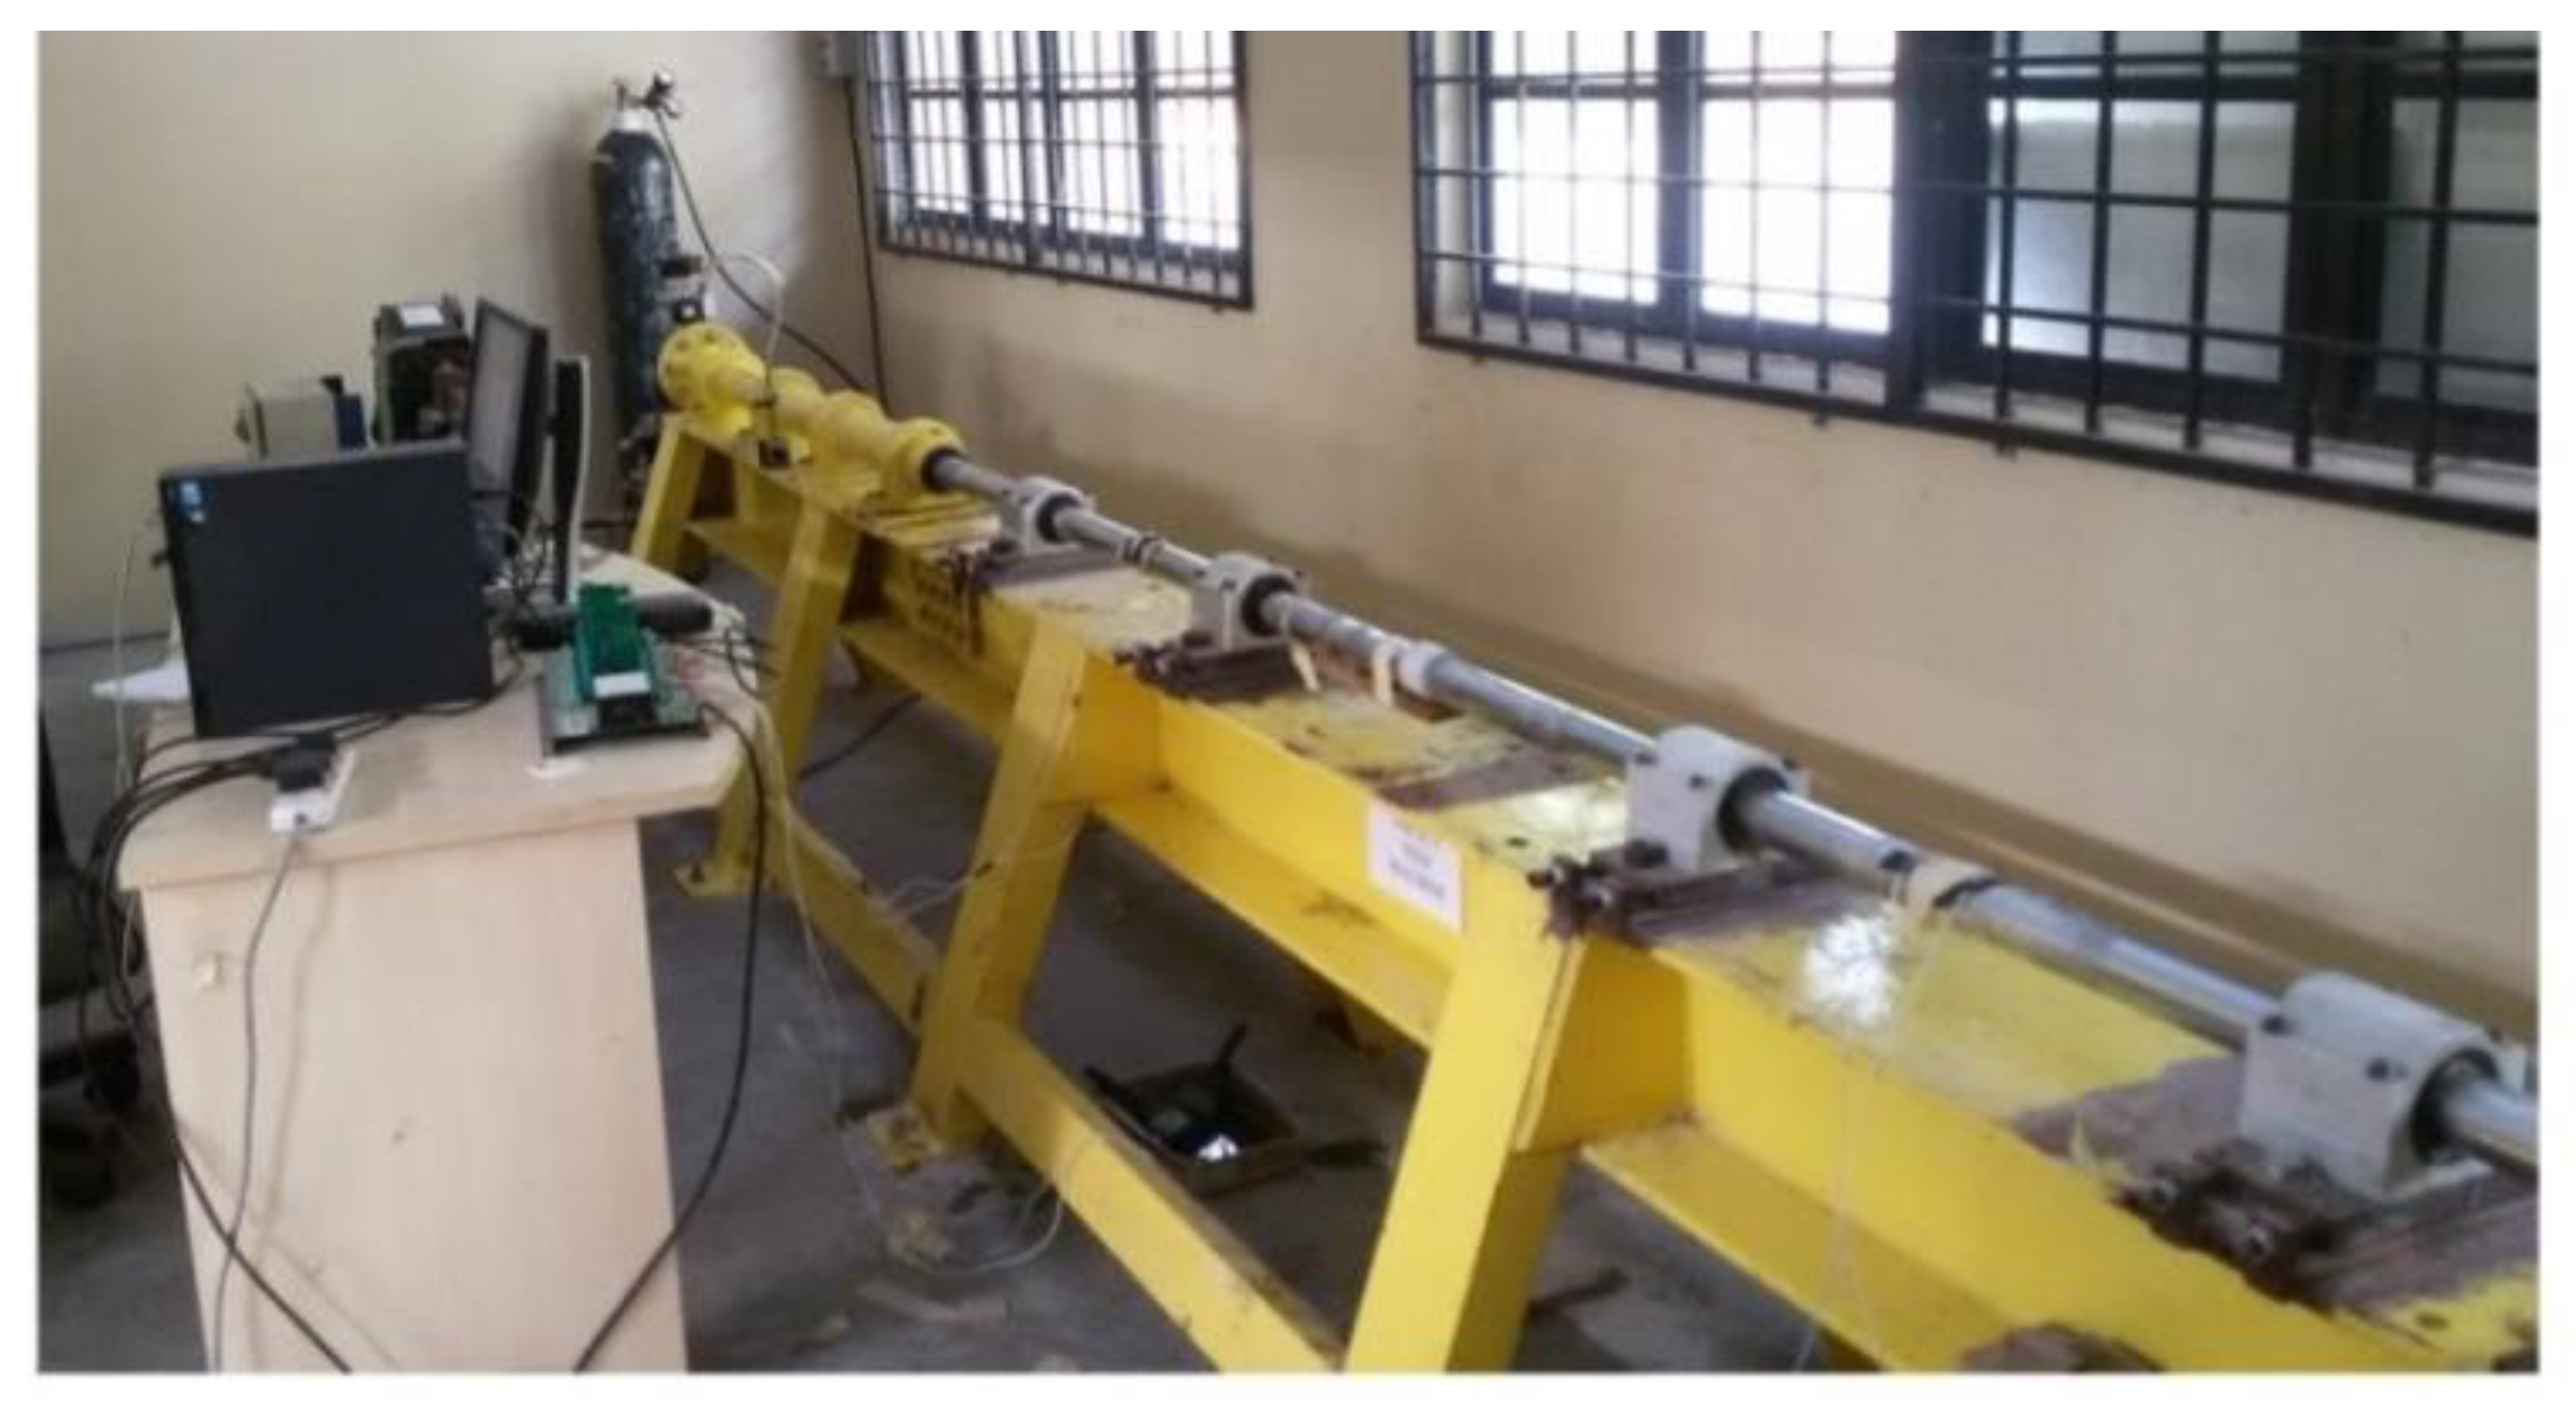
2.3.1. Equipment

An electric kiln with a maximum temperature of 1000 °C and capacity of three concrete cubes was used to carry out the heating process according to ISO 834 fire curve [44]. After two hours, the heating process was stopped and the specimens were left to gradually cool down within the room temperature. The average static compressive strength of three cubic samples for both concrete was recorded at curing ages of 7, 28 and 90 days within room temperatures of 400 and 700 °C according to British standards by using a compression machine with a maximum load capacity of 5000 kN [45]. The SHPB machine was used to perform the dynamic test at strain rates between 30.09 and 102.48 s−1 as shown in Figure 2 [46,47]. The machine bars were manufactured from a stainless steel material with a diameter of 50 mm which was selected to reduce the wave dispersion and increase the accuracy of the recorded signals [46]. A hand grinder was used to decrease and achieve good contact between the bars and concrete samples. Moreover, an alignment by a laser with a precision reached up to 0.01 mm was used to accomplish a good coaxial and fulfil the force equilibrium condition [46]. The average dynamic strength of five cylindrical samples (350 samples) for both concrete was recorded at each exposing temperature and curing age.

2.3.2. Recorded Signals of Dynamic Test

In the current study, cylinder specimens with a ratio of length to the diameter of 1 were used during the dynamic test. Davies and Hunter [48] indicated that there is no clear influence for the size of a concrete cylinder sample if its length to diameter ratio kept within 0.31 to 1.55 [46,47]. Besides, Lindholm [49] reported that the length of concrete specimens should be short enough to achieve a uniform state of stress throughout the test. During the test, the incident bar was a strike and a uniaxial incident pulse within amplitude primarily depends on the velocity of the striker bar that is calculated by Newton’s law [50,51]. A part of the incident pulse was reflected as a reflected pulse along the incident bar because of the impedance mismatch between the concrete sample and incident bar while the rest of the pulse was moved to the transmitter bar and recorded as a transmitted pulse as shown in Figure 3.
Quarterly connected strain gauges (SGD-3/350-LY11) were utilised to record the elongation of incident and transmitter bars during the test. These gauges were connected to bridge sensors model (OM2-163) to amplify the voltage change. The voltage signals were converted into digital data that can be saved into a computer and analysed via MATLAB software by using a data logger (OMB-DAQ-3000). All the recorded pulses were used to calculate the stress σ ( t ) , strain rate ε ˙ ( t ) , and strain ε ( t ) , respectively, according to the following equations [47,52,53,54]:
σ ( t ) = A E 2 A s [ ε i ( t ) + ε r ( t ) + ε t ( t ) ]
ε ˙ ( t ) = C 0 L s [ ε i ( t ) ε r ( t ) ε t ( t ) ]
ε ( t ) = C 0 L s 0 t [ ε i ( t ) ε r ( t ) ε t ( t ) ]   d t
where ε i ( t ) is the incident pulse, ε r ( t ) reflected pulse and ε t ( t ) is the transmitted pulse, A is the area of the bar cross-section, E is the bar modulus of elasticity equals to 210 GPa, C 0 is the bar wave velocity equalling 5190 m/s and l s , A s are the sample length and area.

3. Results of Laboratory Tests

3.1. Static Test

Table 2 revealed that the static compressive strength of HVFANS concrete was slightly lesser than PC at early curing ages of 7 and 28 days within room temperature by 6.87% and 4.21%, respectively. This behaviour attributed to the presence of fly ash (class F) within high quantities in the mixture which has a low amount of cement-like properties ( CaO ), besides, the slow pozzolanic reactivity of FA at an early age [55]. Montgomery et al. [7] observed that CaO was not significantly able to react at an early age under normal curing conditions. However, the differences between both concrete at room temperature were diminished at late curing age of 90 days and the strength of HVFANS concrete exceeded the PC by 2.24% due to the increase of FA reactivity that expressively enhanced the calcium silicate hydrate (C–S–H) structure [56].
The HVFANS concrete showed an excellent performance than PC at all the investigated curing ages within elevated temperatures of 400 and 700 °C as shown in Table 3 and Table 4. This performance, owing to the filler effect of nano-silica on the concrete mixture, caused a great increase in the C–S–H content [55]. Whereas the maximum differences between HVFANS concrete and PC were observed at 70 °C. by 34.07%, 26.01% and 39.37% at curing ages of 7, 28 and 90 days, respectively. As can be noted that the compressive strength of both concrete was considerably reduced in most curing age cases under elevated temperatures particularly at 700 °C. due to the massive growth of vapour pressure into the samples which resulted in numerous cracks beside that the cement paste binder products could significantly dehydrate at this temperature [10,11]. The relative error was less than 7.78% and fairly reflected the reliability of the laboratory records.
British standards (BS 1881-101) [57] defined the satisfactory failure modes of cubic concrete samples under compression load as shown in Figure 4a. The results appeared a good agreement with the British standard for both concrete samples that mainly failed by cracking the four faces of concrete cube equally within slight damage in its connected face with plates as shown in Figure 4b.

3.2. Dynamic Test

3.2.1. Dynamic Compressive Strength ( f c d )

The peak value of the stress–strain diagrams is considered as the ultimate dynamic strength ( f c d ) of both concrete samples. The downward part of the diagrams signified the strain relaxing and fragmentation of concrete specimens after the ultimate stress [58]. The average of five strain rates is recorded at each curing age tested within different temperatures and strain rates as shown in Figure 5, Figure 6 and Figure 7. The diagrams indicated that the dynamic strength of both concrete linearly increased with the strain rate at all the investigated curing age as shown in Table 5. The dependency of dynamic strength with strain rate was noted by several scholars on concrete and other materials such as steel [59], ceramics [60], composites [61] and rocks [62,63]. Grady [64] attributed this behaviour to the growing of tensile micro-cracks on the rocks. While Ross et al. [65] revealed that the moisture of concrete could add inertia forces and increase the fracture strength of wet concrete compared with dry.
The results indicated that the curing age has a significant effect on the dynamic behaviour of both concrete, particularly on HVFANS concrete samples. At room temperature, the dynamic strength of HVFANS concrete was smaller than PC at curing ages of 7 and 28 days under all the investigated strain rates and the maximum difference is observed at strain rates above 100 s−1 by 11.78% and 4.55%, respectively, due to the slow reactivity of FA at these ages. However, the strength of HVFANS concrete is significantly increased at a curing age of 90 days under room temperature and recorded higher values than PC at all the investigated strain rates owing to the improvement of FA reactivity at the late ages. At elevated temperatures, the dynamic compressive strength of both concrete was declined at all the investigated curing ages as compared to room temperature due to the gradual dehydration of the binder products and also massive induced vapour pressure into the concrete samples [10,11]. Nevertheless, the HVFANS concrete showed a superior behaviour than PC at all the studied curing ages and strain rates owing to the filler effect of nano-silica material [55]. The highest differences between both concretes were noted at exposing temperature of 700 °C under strain rates above 100 s−1. Whereas the strength of HVFANS concrete was higher than PC by 59.59%, 36.68% and 43.59% at curing ages of 7, 28 and 90, respectively. These results proved that HVFANS concrete has superior fire and explosion resistance than PC even at early curing ages and reflected the possibility of using this concrete in the structure that might be exposed to these kinds of threats during service life.

3.2.2. Critical Strain ( ε c r )

The values of critical strain ( ε c r ) described in Figure 5, Figure 6 and Figure 7 clarify the ductility of both concrete at curing ages of 7, 28 and 90 days within exposing temperatures of 25, 400 and 700 °C under different ranges of strain rate. The results showed that the strain increased linearly with the strain rate at all the investigated cases owing to the lateral confinement that could form high quantities of micro-cracks and prevent the formation of macro cracks [66,67]. Moreover, the outcomes revealed the important role of PP fibres under dynamic loads due to its ability to improve the concrete ductility as well as produce channels to release vapour pressure at high temperatures which clearly reduced the critical strain values particularly at temperatures of 25 and 400 °C [68,69,70]. The highest values of critical strain for both concretes are recorded at a curing age of seven days and exposing temperature 700 °C, however, HVFANS concrete showed smaller values as compared to PC within a maximum difference of 43.56% at a strain rate above 100 s–1 owing to improve nano-silica at elevated temperatures [68,69]. On the other hand, the critical strain showed a positive relationship with the increase of curing age and recorded the smallest values at 90 days at the same exposing temperature due to the increase of fly ash reactivity and hydration process which enhance the concrete structure.

3.2.3. Toughness

The toughness of both concretes was represented in term of energy absorption (SEA) calculated as the following [27,71,72]:
SEA = AEc A s l s 0 T [ ε i 2 ( t ) ε r 2 ( t ) ε t 2 ( t ) ] dt
where c is the bar’s wave speed and T is the failure moment of the concrete sample. The results proved that the toughness of both concretes improved linearly with strain rate as shown in Figure 8. This behaviour was noted by other scholars who tested the concrete via SHPB machine under room or high temperatures [72,73].
The results indicated that HVFANS concrete has lower toughness than PC at early ages of 7 and 28 days within room temperature condition. However, the toughness of HVFANS concrete significantly increased than PC at the late age of 90 days and recorded a difference of 11.68% at strain rates above 100 s−1. At elevated temperatures, the toughness of HVFANS concrete considerably increased even at an early age and recorded values higher than PC that attribute to the high pozzolanic reactivity of NS as well as its filler ability. The lowest toughness values of both concrete are recorded at exposing temperature of 700 °C, nevertheless, the HVFANS concrete showed strong resistance to dynamic loads at all the investigated curing ages and strain rates as compared to PC as can be clearly noted at average strain rate above 100 s−1 at curing ages of 7, 28 and 90 by differences of 59.57%, 36.74% and 43.66%, respectively.

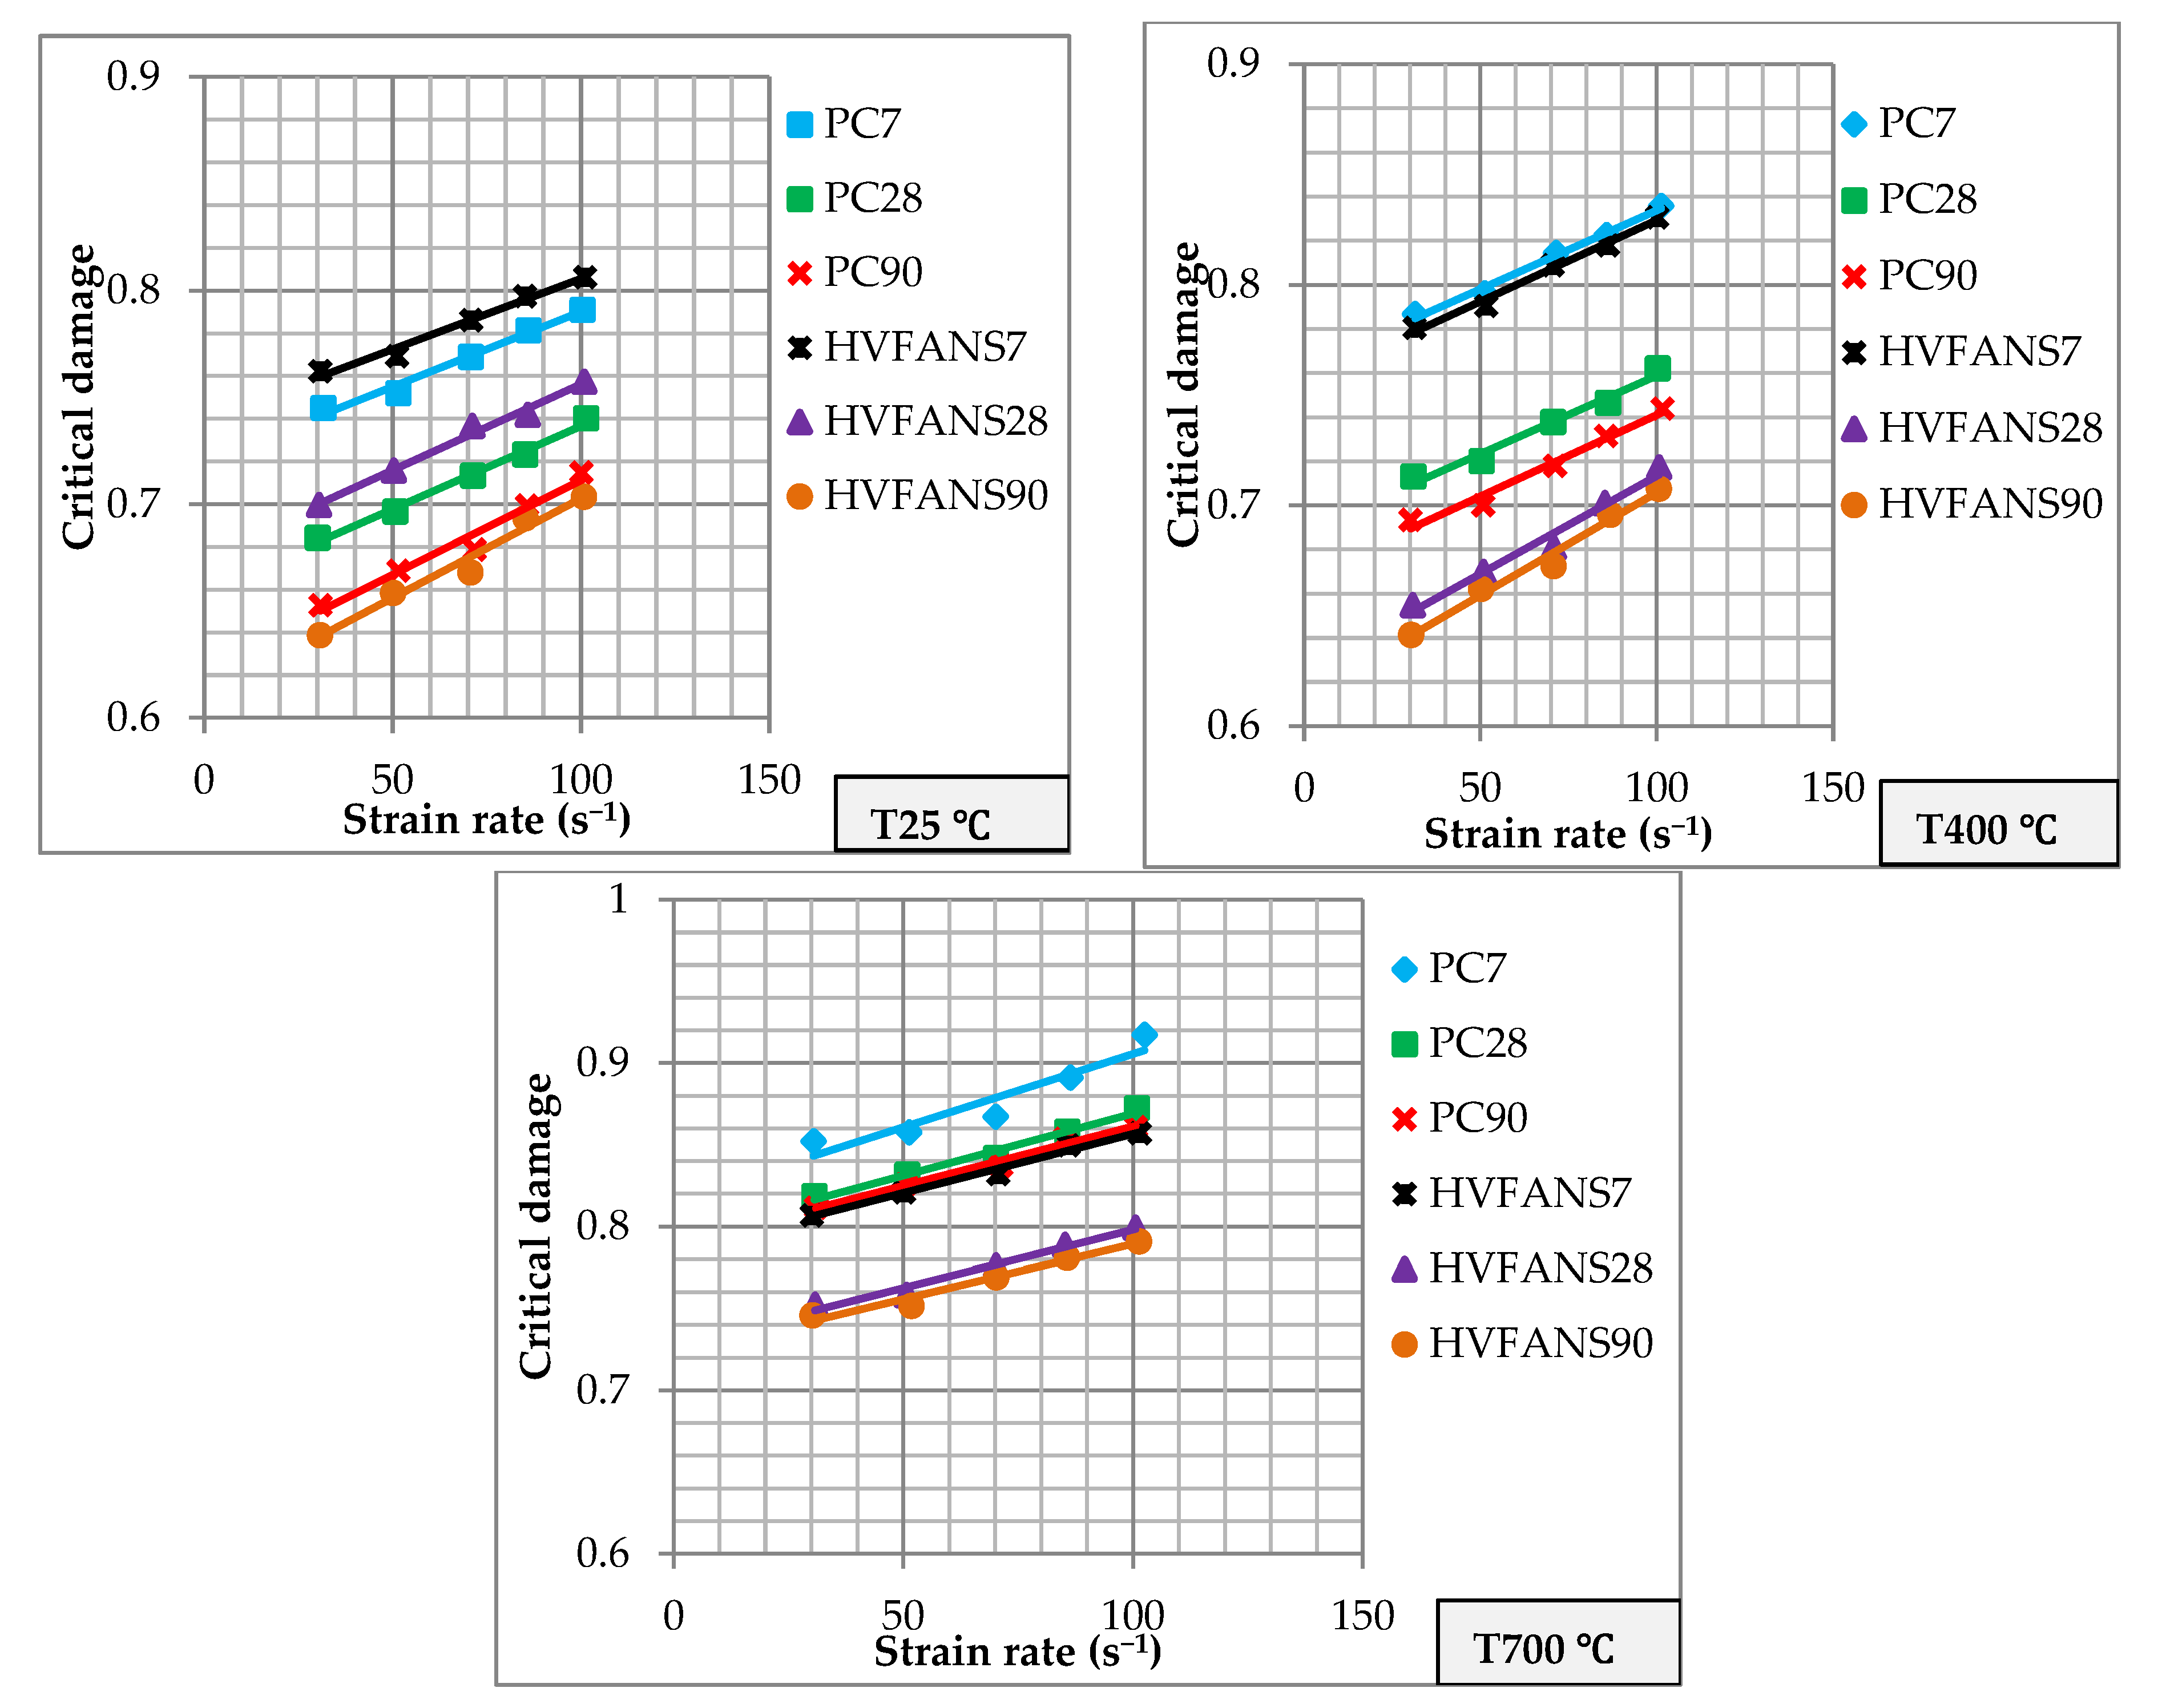
3.2.4. Critical Damage

The critical damage of both concretes is determined by using mechanics theory of continuous damage based on the variances of stress–strain diagrams with strain rate. A variable ( D c r ) is used to define the critical damage as following [74,75,76]:
D c r = { 0 For   ε = 0 1 σ p E o ε c r For   ε > 0
where σ p is the peak stress, and E o is the initial Young’s modulus. The above formula represented the damage of concrete samples in terms of a kinematic variable according to the voids density as well as the cracks in a certain area that could cause a gradual demolition in the concrete sample [77,78]. Moreover, the state of D c r = 1 signifies that the concrete sample is not capable of sustaining the applied dynamic loads. The experimental results indicated that the damage of both concretes improved linearly with strain rate as shown in Figure 9. At room temperature, the damage of HVFANS concrete at early ages of 7 and 28 days was higher than PC; however, the increase of NS reactivity at a late age of 90 days reduced the damage of HVFANS concrete and recorded lower values as compared to PC at all investigated strain rates. At elevated temperatures, the failure of HVFANS concrete was lesser as compared to PC even at early ages owing to the increase of NS reactivity and hydration process [55].
Figure 10 showed that the failure of both concretes was violent whereas the cylindrical specimens were destroyed into pieces at high strain rates. Three crack patterns were observed for both concrete with the increase of curing age. The cracks were clearly straight and passed through a large area that has more broken aggregate that occurred at a curing age of seven days with a strain rate of 30 s−1 as well as at 28 and 90 days within strain rates above 70 s−1. The number of cracks in concrete samples was considerably increased and resulted in serious destruction into small pieces to release the internal energy that occurred at a curing age of seven days with strain rate above 50 s−1 as well as at curing ages of 28 and 90 days within strain rates above 85 s−1. While the crack path was passed through the concrete mortar only at curing ages of 28 and 90 days within strain rates between 30 and 70 s−1.

3.2.5. Dynamic Increase Factor (DIF)

The effect of strain rate on the dynamic behaviour of both concrete is described in terms of dynamic increase factor (DIF) which represents the ratio of the dynamic to static strength. The DIF curves showed linear increases with strain rate values at all the investigated curing ages and temperatures as shown in Figure 11. Design-Expert Software was used to statistically analyse the experimental data and derive a formula gather between curing age ( C A ), temperature (T) and strain rate ( ε d ˙ ) by using response surface methodology (RSM) [79]. The 2FI model with inverse transformation was found to be the most appropriate to fit the DIF data of both concrete as follows:
1 DIF = 0.905844 + 0.000385 CA + 0.000156 T   0.003549 ε ˙ d 1.19369 10 6 C A T 3.94641 10 6 C A ε ˙ d 3.1153 10 7 T ε ˙ d     For   PC
1 DIF = 0.952904 0.000460 CA 0.000033 T   0.003811 ε ˙ d 2.40444 10 7 CA T   + 1.56509 10 6 CA ε ˙ d + 3.94112 10 7   T ε ˙ d     For   HVFANS   concrete
where C A is the curing age between 7 and 90 days, T is the exposing temperature range between 25 and 700 °C, and ε ˙ d is the strain rate between 30.09 to 102.48 s−1.
The outcomes of ANOVA variance analysis indicated an excellent accuracy for the adopted model to estimate the DIF of both concretes within correlation coefficient ( R 2 ) values close to one as indicated in Table 6 [80,81]. Furthermore, the differences between Predicted and Adjusted R2″ was less than 0.2 within Adequate Precision (AP) of more than four that measured the noise-to-signal ratio [82].
The normal probability and predicted vs. actual values plots of both concrete types were determined to confirm the accuracy of the selected model to provide an adequate approximation of the real system. The results clearly indicated that the data were normally distributed since almost all the points followed the straight line as described in Figure 12. Therefore, the predicted values can be considered in good agreement with actual values.

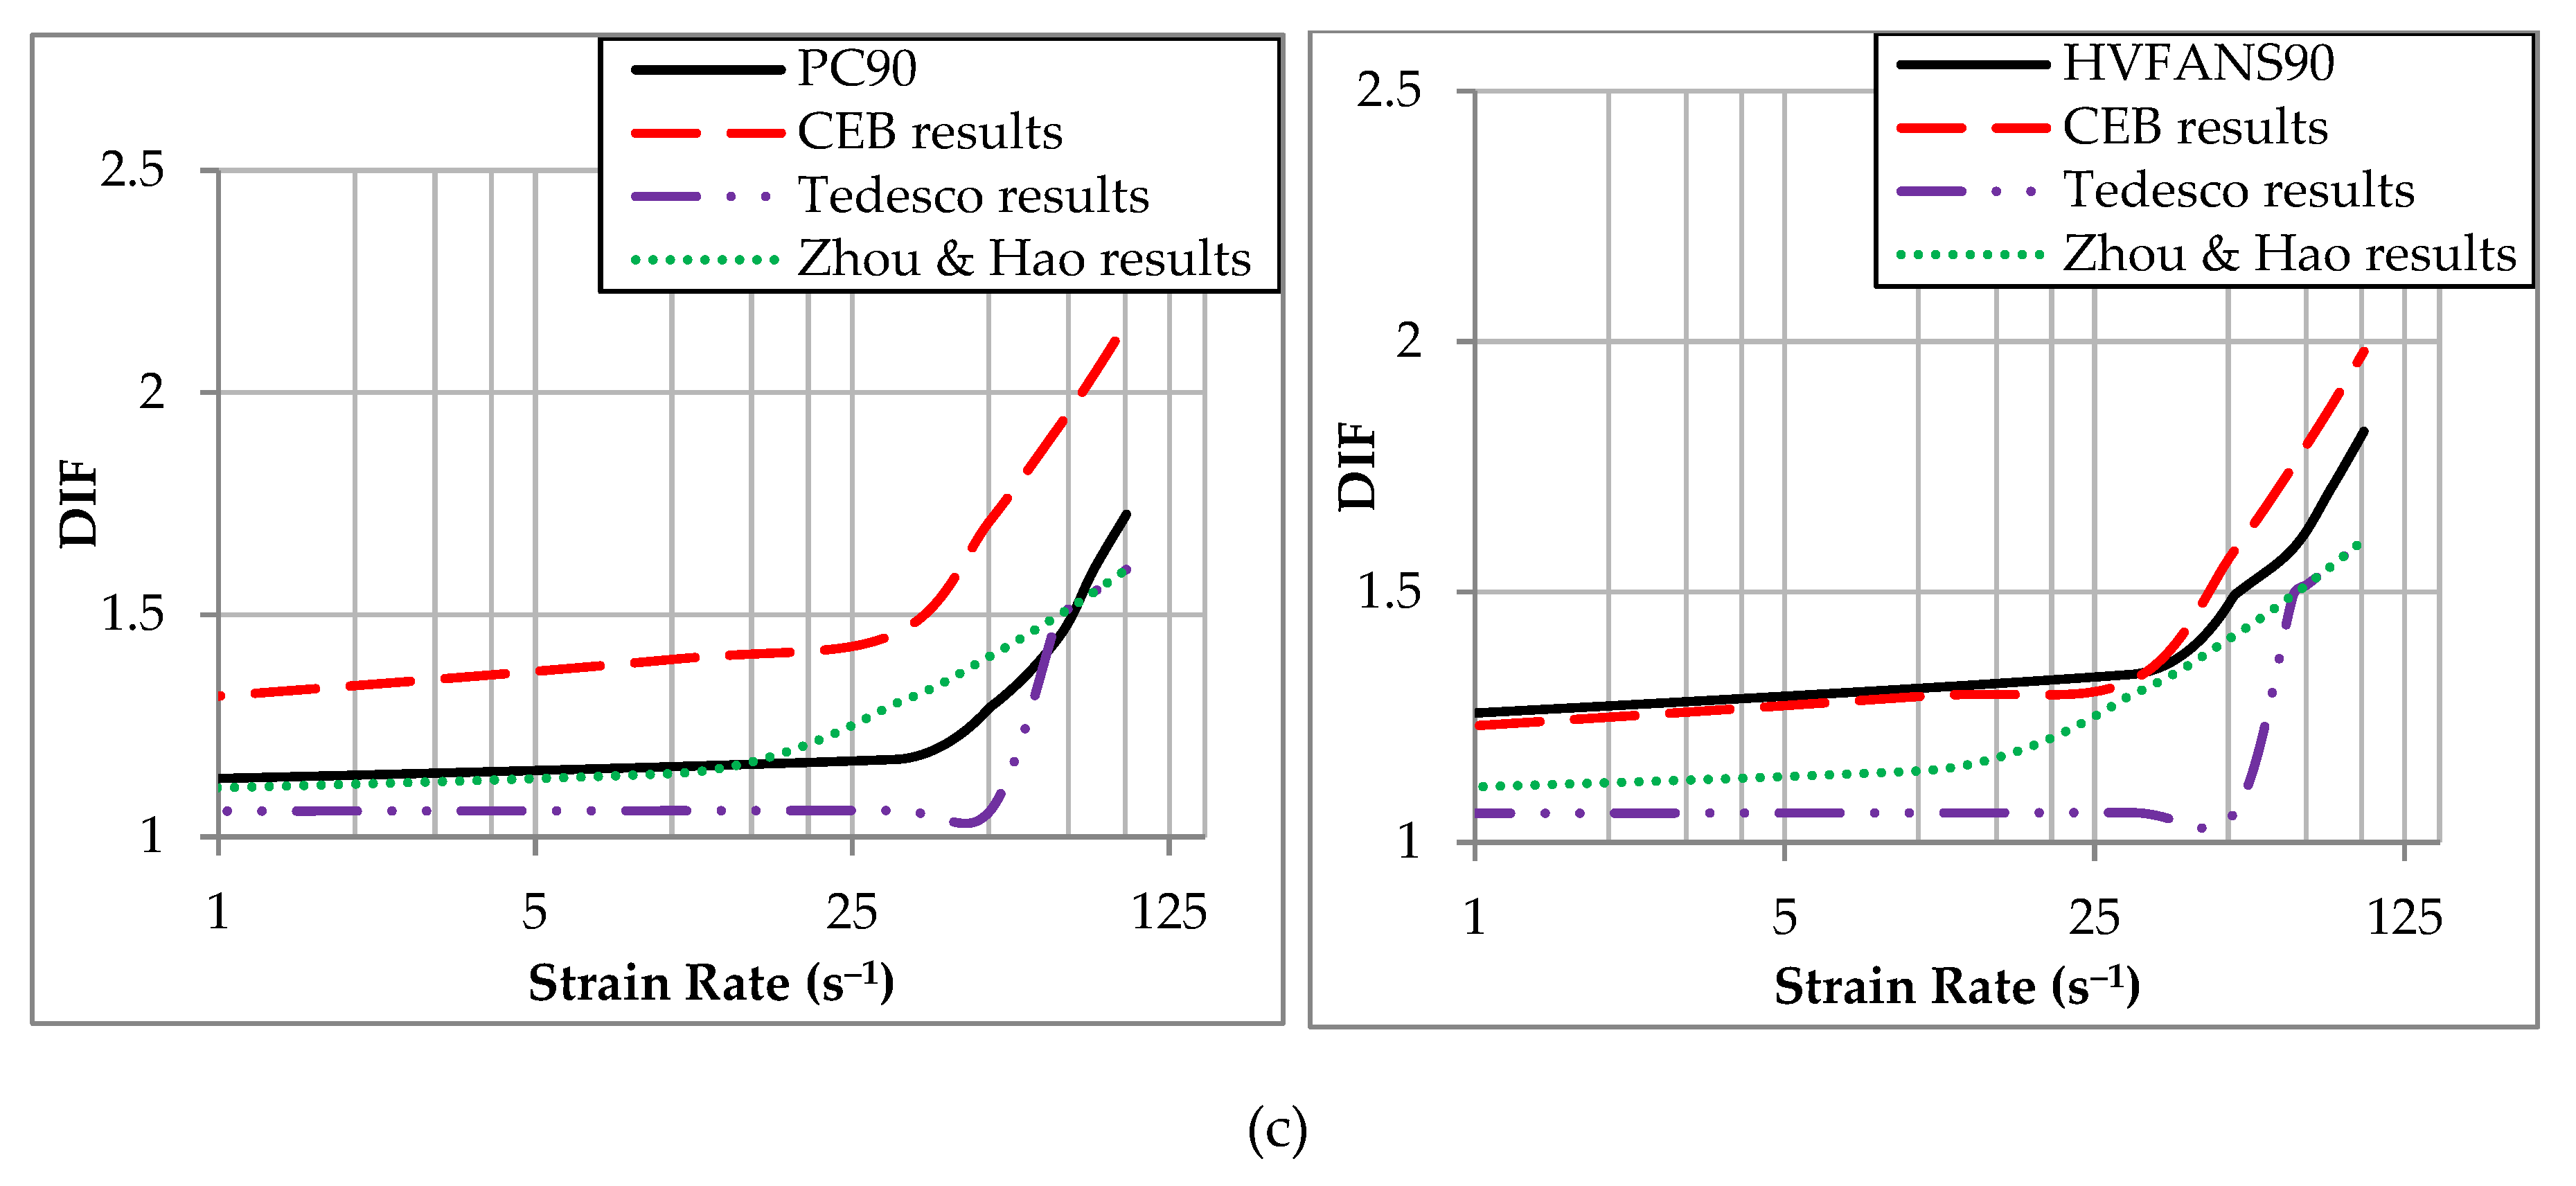
3.2.6. Comparison of DIF with Previous Recommended Expressions

Prior scholars widely utilised the DIF curves to calculate the effects of strain rate on the compression strength of concrete [66,83]. Therefore, several equations were recommended to estimate the DIF diagrams:
(a)
In 1993, CEB [84] proposed a formula to estimate the DIF of concrete in compression within a strain rate range reached up to 300 s−1:
DIF CEB = { ( ε ˙ d / ε ˙ s ) 1.026 α s For   ε ˙ d 30   s 1 γ s ( ε ˙ d / ε ˙ s ) 1 / 3 For   ε ˙ d > 30   s 1
where ε ˙ s is static strain rate that equals to 30 × 10 6 s 1 , α s = 1 / ( 5 + 9 f c s / 10 ) , log γ s = 6.156 α 2 , and f c s is static compressive strength in MPa.
(b)
In 1997, Tedesco et al. [85] reported that the transition from low strain rate to higher values occurred at 63.1 s–1 as follows:
DIF Tedesco = { 0.000965 log ε ˙ d + 1.058 For   ε ˙ d 63.1   s 1 0.758 log ε ˙ d 0.289 For   ε ˙ d > 63.1   s 1
(c)
In 2008, Zhou and Hao [86] determined an empirical formula to predict the DIF diagrams for the concrete-like materials as follows:
DIF ZhouandHao = { 0.0225 log ε ˙ d + 1.12 For   ε ˙ d 10   s 1 0.2713 ( log ε ˙ d ) 2 0.3563 log ε ˙ d + 1.2275 For   ε ˙ d > 10   s 1  
The DIF diagrams of both concrete compared with the outcomes of the above equations at different curing ages and exposing temperatures within strain rate range reached up to 102.48 s−1 as shown in Figure 13. At room temperature, the CEB expression was more accurate to estimate the DIF of both concrete within differences range between 0.092% and 25.30% particularly observed at higher strain rate above 30 s−1 within curing ages of 7 and 28 days. At 400 °C, the results of the proposed expression by Zhou and Hao [86] were more close to the determined DIF especially at early ages of 7 and 28 days. However, some variances were noted at an age of 90 days in the case of HVFANS concrete and the comparison proved that the CEB model is more appropriate to predict the performance of this concrete type at 400 °C that may attribute to the increase of the FA and NS reactivity at late age during the heating process. At 700 °C, Tedesco’s expression was more appropriate to estimate the behaviour of PC at the early age of seven days. Zhou and Hao’s expression revealed good ability to predict the performance of PC with the increase of curing age to 28 and 90 days as well as in the case of HVFANS concrete at seven days. On the other hand, the CEB model showed the good capability to estimate the DIF of HVFANS concrete at curing ages of 28 and 90 days as compared to other expressions due to the low degradation in strength at 700 °C.

4. Conclusions

The results of the current study can be concluded as follows:
  • At room temperature, the PC concrete showed better static and dynamic behaviour than HVFANS concrete at curing ages of 7 and 28 days. However, the behaviour of HVFANS concrete was significantly improved at a curing age of 90 days and recorded superior performance than PC during the static and dynamic tests.
  • At elevated temperatures, the dynamic strength of HVFANS concrete exceeded the PC at all the studied curing ages. The maximum differences between both concretes were noted at 700 °C by 59.59%, 36.68% and 43.59% at curing ages of 7, 28 and 90, respectively. Accordingly, the HVFANS concrete recorded lower strain values than PC within a maximum difference of 43.56% at a strain rate above 100 s−1.
  • The formulas were suggested to estimate the dynamic increase factors of PC and HVFANS concrete at a curing age between 7 and 90 days under temperatures range of 25 to 700 °C subjected to strain rates reached up to 102.48 s−1.
  • The CEB expression was more accurate to estimate the DIF of HVFANS concrete at different curing age within room temperature as well as at elevated temperatures of 400 and 700 °C at curing ages of 28 and 90 days, respectively. While the proposed expression by Zhou and Hao was more appropriate to determine the DIF of HVFANS concrete at a curing age of seven under 400 and 700 °C.
The above results indicated that the dynamic resistance of the HVFANS concrete significantly improved with the increase of curing age under room and elevated temperatures as compared with PC. This behaviour revealed a good possibility to utilize this concrete to protect the engineering structures exposed to a massive fire and dynamic loads.

Author Contributions

Conceptualization, M.H.M.; methodology, M.H.M.; investigation, M.H.M.; formal analysis, M.H.M.; supervision, A.A.M.; project administration, A.A.M. and M.H.M.; Funding acquisition, I.S.A. and A.A.M.; resources, A.M.A. and Z.M.Y.; data curation, M.H.M.; visualization, M.H.M.; writing—original draft preparation, M.H.M.; writing—review and editing, M.H.M. All authors have read and agreed to the published version of the manuscript.

Funding

This research was funded by the Research University Grant, GUP-2018-029.

Conflicts of Interest

The authors declare that they have no conflict of interest.

References

  1. Guo, X.; Shi, H.; Dick, W.A. Compressive strength and microstructural characteristics of class C fly ash geopolymer. Cem. Concr. Compos. 2010, 32, 142–147. [Google Scholar] [CrossRef]
  2. Rehan, R.; Nehdi, M. Carbon dioxide emissions and climate change: Policy implications for the cement industry. Environ. Sci. Policy. 2005, 8, 105–114. [Google Scholar] [CrossRef]
  3. Bakharev, T. Geopolymeric materials prepared using class F fly ash and elevated temperature curing. Cem. Concr. Res. 2005, 35, 1224–1232. [Google Scholar] [CrossRef]
  4. Fernández-Jiménez, A.; Palomo, A.; Criado, M. Microstructure development of alkali-activated fly ash cement: A descriptive model. Cem. Concr. Res. 2005, 35, 1204–1209. [Google Scholar] [CrossRef]
  5. Jaturapitakkul, C.; Kiattikomol, K.; Sata, V.; Leekeeratikul, T. Use of ground coarse fly ash as a replacement of condensed silica fume in producing high-strength concrete. Cem. Concr. Res. 2004, 34, 549–555. [Google Scholar] [CrossRef]
  6. Jiang, L.; Guan, Y. Pore structure and its effect on strength of high-volume fly ash paste. Cem. Concr. Res. 1999, 29, 631–633. [Google Scholar] [CrossRef]
  7. Montgomery, D.; Hughes, D.; Williams, R. Fly ash in concrete—A microstructure study. Cem. Concr. Res. 1981, 11, 591–603. [Google Scholar] [CrossRef]
  8. Li, G. Properties of high-volume fly ash concrete incorporating nano-SiO2. Cem. Concr. Res. 2004, 34, 1043–1049. [Google Scholar] [CrossRef]
  9. Zhang, M.H.; Islam, J. Use of nano-silica to reduce setting time and increase early strength of concretes with high volumes of fly ash or slag. Constr. Build. Mater. 2012, 29, 573–580. [Google Scholar] [CrossRef]
  10. Ibrahim, R.K. The Strength and Micro Structures of Sustainable High Strength High-Volume Fly Ash Concrete with Nano Materials Exposed to High Temperature. Ph.D. Thesis, Universiti Kebangsaan Malaysia (UKM), Bangi, Malaysia, 2013. [Google Scholar]
  11. Ibrahim, R.K.; Hamid, R.; Taha, M.R. Fire resistance of high-volume fly ash mortars with nanosilica addition. Constr. Build. Mater. 2012, 36, 779–786. [Google Scholar] [CrossRef]
  12. Mussa, M.H.; Mutalib, A.A.; Hamid, R.; Naidu, S.R.; Radzi, N.A.M.; Abedini, M. Assessment of damage to an underground box tunnel by a surface explosion. Tunn. Undergr. Space Technol. 2017, 66, 64–76. [Google Scholar] [CrossRef]
  13. Mussa, M.H.; Mutalib, A.A.; Hamid, R.; Raman, S.N. Blast damage assessment of symmetrical box–shaped underground tunnel according to peak particle velocity (PPV) and single degree of freedom (SDOF) criteria. Symmetry 2018, 10, 158. [Google Scholar] [CrossRef] [Green Version]
  14. Abedini, M.; Mutalib, A.A.; Raman, S.N.; Akhlaghi, E.; Mussa, M.H.; Ansari, M. Numerical investigation on the non-linear response of reinforced concrete (RC) columns subjected to extreme dynamic loads. J. Asian Sci. Res. 2017, 7, 86. [Google Scholar] [CrossRef] [Green Version]
  15. Saadun, A.; Mutalib, A.A.; Hamid, R.; Mussa, M.H. Behaviour of polypropylene fiber reinforced concrete under dynamic impact load. J. Eng. Sci. Technol. 2016, 11, 684–693. [Google Scholar]
  16. Abedini, M.; Mutalib, A.A.; Mehrmashhadi, J.; Raman, S.N.; Alipour, R.; Momeni, T.; Mussa, M.H. Large Deflection Behavior Effect in Reinforced Concrete Columns Exposed to Extreme Dynamic Loads. 2019. Available online: https://engrxiv.org/6n5fs/ (accessed on 25 July 2019).
  17. Abedini, M.; Khlaghi, E.A.; Mehrmashhadi, J.; Mussa, M.H.; Ansari, M.; Momeni, T. Evaluation of concrete structures reinforced with fiber reinforced polymers bars: A review. J. Asian Sci. Res. 2017, 7, 165. [Google Scholar] [CrossRef] [Green Version]
  18. Mutalib, A.A.; Mussa, M.H.; Hao, H. Effect of CFRP strengthening properties with anchoring systems on PI diagrams of RC panels under blast loads. Constr. Build. Mater. 2019, 200, 648–663. [Google Scholar] [CrossRef]
  19. Abbood, I.S.; Mahmod, M.; Hanoon, A.N.; Jaafar, M.S.; Mussa, M.H. Seismic response analysis of linked twin tall buildings with structural coupling. Int. J. Civ. Eng. Technol. 2018, 9, 208–219. [Google Scholar]
  20. Ziyan, L.; Yuzhuo, G.W.G. Dynamic compression behavior of heated concrete. China Civ. Eng. J. 2011, 4, 013. [Google Scholar]
  21. Huo, J.S.; He, Y.M.; Xiao, L.P.; Chen, B.S. Experimental study on dynamic behaviours of concrete after exposure to high temperatures up to 700 °C. Mater. Struct. 2013, 46, 255–265. [Google Scholar] [CrossRef]
  22. Huo, J.; Wang, P.; Yu, Q.; He, Y. Dynamic behaviour of normal-strength carbonate aggregate concrete at temperatures up to 800 °C. Mag. Concr. Res. 2014, 66, 975–990. [Google Scholar] [CrossRef]
  23. He, Y.; Huo, J.; Xiao, Y. Experimental study on dynamic behavior of concrete at elevated temperatures. Adv. Sci. Lett. 2011, 4, 1128–1131. [Google Scholar] [CrossRef]
  24. Zhai, C.; Chen, L.; Fang, Q.; Chen, W.; Jiang, X. Experimental study of strain rate effects on normal weight concrete after exposure to elevated temperature. Mater. Struct. 2017, 50, 40. [Google Scholar] [CrossRef]
  25. Mussa, M.H.; Mutalib, A.A. Effect of geometric parameters (β and τ) on behaviour of cold formed stainless steel tubular X-joints. Int. J. Steel Struct. 2018, 18, 821–830. [Google Scholar] [CrossRef]
  26. Chen, L.; Fang, Q.; Jiang, X.; Ruan, Z.; Hong, J. Combined effects of high temperature and high strain rate on normal weight concrete. Int. J. Impact Eng. 2015, 86, 40–56. [Google Scholar] [CrossRef]
  27. Li, Z.; Xu, J.; Bai, E. Static and dynamic mechanical properties of concrete after high temperature exposure. Mater. Sci. Eng. A 2012, 544, 27–32. [Google Scholar] [CrossRef]
  28. Su, H.; Xu, J.; Ren, W. Experimental study on the dynamic compressive mechanical properties of concrete at elevated temperature. Mater. Des. 2014, 56, 579–588. [Google Scholar] [CrossRef]
  29. Committee, A. Guide for Selecting Proportions for High-Strength Concrete with Portland Cement & Fly ASH-ACI 211.4 R-93; American Concrete Institute: Farming-ton Hills, MI, USA, 1998. [Google Scholar]
  30. Standard, M. Portland Cement (Ordinary and Rapid-Hardening): Part 1, 2nd ed.; MS: Bangi, Malaysia, 2003; p. 522. [Google Scholar]
  31. Standard, B. Fly ASH for Concrete—Part 1: Definition, Specifications and Conformity Criteria; European Committee for Standardization: Brussels, Belgium, 2005. [Google Scholar]
  32. Standard, A. C136 Standard Test Method for Sieve Analysis of Fine and Coarse Aggregates; ASTM International: West Conshohocken, PA, USA, 2006. [Google Scholar]
  33. ASTM, A. C128-07a Standard Test Method for Density, Relative Density (Specific Gravity), and Absorption of Fine Aggregate; ASTM International: West Conshohocken, PA, USA, 2007. [Google Scholar]
  34. ASTM, C. Standard Test Method for Bulk Density (“Unit Weight”) and Voids in Aggregate; American Society for Testing and Materials, Annual Book: West Conshohocken, PA, USA, 2009. [Google Scholar]
  35. Nishida, A. Study in the Properties of High Strength Concrete with Short Polypropylene Fiber for Spalling Reasistance, Concrete under Severe Condetions. In Proceedings of the International Conference on Concrete under Severe Conditions, Sapporo, Japan, 2–4 August 1995; Volume 2, pp. 1141–1150. [Google Scholar]
  36. Kalifa, P.; Chene, G.; Galle, C. High-temperature behaviour of HPC with polypropylene fibres: From spalling to microstructure. Cem. Concr. Res. 2001, 31, 1487–1499. [Google Scholar] [CrossRef]
  37. Noumowe, A. Mechanical properties and microstructure of high strength concrete containing polypropylene fibres exposed to temperatures up to 200 °C. Cem. Concr. Res. 2005, 35, 2192–2198. [Google Scholar] [CrossRef]
  38. Zeiml, M.; Leithner, D.; Lackner, R.; Mang, H.A. How do polypropylene fibers improve the spalling behavior of in-situ concrete? Cem. Concr. Res. 2006, 36, 929–942. [Google Scholar] [CrossRef]
  39. Bilodeau, A.; Kodur, V.; Hoff, G. Optimization of the type and amount of polypropylene fibres for preventing the spalling of lightweight concrete subjected to hydrocarbon fire. Cem. Concr. Compos. 2004, 26, 163–174. [Google Scholar] [CrossRef] [Green Version]
  40. Mutalib, A.A.; Mussa, M.; Mohd Taib, A. Behaviour of prestressed box beam strengthened with CFRP under effect of strand snapping. Gradevinar 2020, 72, 103–113. [Google Scholar]
  41. Standard, A. C192 Standard Practice for Making and Curing Concrete Test Specimens in the Laboratory (ASTM C192-07); ASTM International: West Conshohocken, PA, USA, 2007. [Google Scholar]
  42. Neville, A.M. Properties of Concrete; Longman Publisher: London, UK, 1995. [Google Scholar]
  43. ASTM, C. 1602/C 1602M-12 Standard Specification for Mixing Water Used in the Hydraulic Cement Concrete; ASTM International: West Conshohocken, PA, USA, 2012. [Google Scholar]
  44. Standard, M.J. Thermal Insulation—Determination of Steady-State Thermal Resistance and Related Properties—Guarded Hot Plate Apparatus (ISO 8302: 1991, IDT); Department of Standards Malaysia: Cyberjaya, Malaysia, 2003.
  45. EN, B. Testing Hardened Concret—Part 3: Compressive Strength of Test Specimens. Available online: http://home.aktor.qa/External%20Documents/Intenational%20Specifications/British%20Standards/BS%20EN/BS%20EN%2012390-3-2009.pdf (accessed on 31 May 2009).
  46. Al-Masoodi, A.H.H.; Kawan, A.; Kasmuri, M.; Hamid, R.; Khan, M.N.N. Static and dynamic properties of concrete with different types and shapes of fibrous reinforcement. Constr. Build. Mater. 2016, 104, 247–262. [Google Scholar] [CrossRef]
  47. Chien Yet, T.; Hamid, R.; Kasmuri, M. Dynamic stress-strain behaviour of steel fiber reinforced high-performance concrete with fly ash. Adv. Civ. Eng. 2012, 2012, 907431. [Google Scholar] [CrossRef] [Green Version]
  48. Davies, E.; Hunter, S. The dynamic compression testing of solids by the method of the split Hopkinson pressure bar. J. Mech. Phys. Solids. 1963, 11, 155–179. [Google Scholar] [CrossRef]
  49. Lindholm, U.S. High strain rate tests. Meas. Mech. Prop. 1971, 5, 199–271. [Google Scholar]
  50. Kirby, M.S.P. Designing a Data Acquisition System for a Split Hopkinson Pressure Bar. Available online: https://pdfs.semanticscholar.org/36d6/e475d65a484381a88dfb064e8d99b8d389b5.pdf (accessed on 14 June 2015).
  51. Dyab, M.M. Providing Learning Opportunities by Designing a Split Hopkinson Pressure Bar. Age 2013, 23, 1. [Google Scholar]
  52. Lok, T.; Zhao, P.; Lu, G. Using the split Hopkinson pressure bar to investigate the dynamic behaviour of SFRC. Mag. Concr. Res. 2003, 55, 183–191. [Google Scholar] [CrossRef]
  53. Lu, Y.; Li, Q. Appraisal of pulse-shaping technique in split Hopkinson pressure bar tests for brittle materials. Int. J. Prot. Struct. 2010, 1, 363–390. [Google Scholar] [CrossRef]
  54. Mussa, M.H.; Mutalib, A.A.; Hamid, R.; Raman, S.N. Dynamic properties of high volume fly ash nanosilica (HVFANS) concrete subjected to combined effect of high strain rate and temperature. Lat. Am. J. Solids Struct. 2018, 15. [Google Scholar] [CrossRef] [Green Version]
  55. Berndt, M. Properties of sustainable concrete containing fly ash, slag and recycled concrete aggregate. Constr. Build. Mater. 2009, 23, 2606–2613. [Google Scholar] [CrossRef]
  56. Ji, T. Preliminary study on the water permeability and microstructure of concrete incorporating nano-SiO2. Cem. Concr. Res. 2005, 35, 1943–1947. [Google Scholar] [CrossRef]
  57. Institutions, B.S. Method for Determination of Compressive Strength of Concrete Cubes; BS: London, UK, 1881. [Google Scholar]
  58. Miller, O.; Freund, L.; Needleman, A. Modeling and simulation of dynamic fragmentation in brittle materials. Int. J. Fract. 1999, 96, 101–125. [Google Scholar] [CrossRef]
  59. Cadoni, E.; Fenu, L.; Forni, D. Strain rate behaviour in tension of austenitic stainless steel used for reinforcing bars. Constr. Build. Mater. 2012, 35, 399–407. [Google Scholar] [CrossRef]
  60. Johnstone, C.; Ruiz, C. Dynamic testing of ceramics under tensile stress. Int. J. Solids Struct. 1995, 32, 2647–2656. [Google Scholar] [CrossRef]
  61. Lee, O.; Kim, G.H. Thickness effects on mechanical behavior of a composite material (1001P) and polycarbonate in split Hopkinson pressure bar technique. J. Mater. Sci. Lett. 2000, 19, 1805–1808. [Google Scholar] [CrossRef]
  62. Zhao, J.; Li, H. Experimental determination of dynamic tensile properties of a granite. Int. J. Rock Mech. Min. Sci. 2000, 37, 861–866. [Google Scholar] [CrossRef]
  63. Cadoni, E. Dynamic characterization of orthogneiss rock subjected to intermediate and high strain rates in tension. Rock Mech. Rock Eng. 2010, 43, 667–676. [Google Scholar] [CrossRef] [Green Version]
  64. Grady, D.E.; Kipp, M.E. The micromechanics of impact fracture of rock. In International Journal of Rock Mechanics and Mining Sciences & Geomechanics Abstracts; Elsevier: Amsterdam, The Netherlands, 1979. [Google Scholar]
  65. Ross, C.A.; Jerome, D.M.; Tedesco, J.W.; Hughes, M.L. Moisture and strain rate effects on concrete strength. Mater. J. 1996, 93, 293–300. [Google Scholar]
  66. Bischoff, P.; Perry, S. Compressive behaviour of concrete at high strain rates. Mater. Struct. 1991, 24, 425–450. [Google Scholar] [CrossRef]
  67. Lai, J.; Sun, W. Dynamic behaviour and visco-elastic damage model of ultra-high performance cementitious composite. Cem. Concr. Res. 2009, 39, 1044–1051. [Google Scholar] [CrossRef]
  68. Köksal, F.; Altun, F.; Yiğit, İ.; Şahin, Y. Combined effect of silica fume and steel fiber on the mechanical properties of high strength concretes. Constr. Build. Mater. 2008, 22, 1874–1880. [Google Scholar] [CrossRef]
  69. Shannag, M. High strength concrete containing natural pozzolan and silica fume. Cem. Concr. Compos. 2000, 22, 399–406. [Google Scholar] [CrossRef]
  70. Nili, M.; Afroughsabet, V. The effects of silica fume and polypropylene fibers on the impact resistance and mechanical properties of concrete. Constr. Build. Mater. 2010, 24, 927–933. [Google Scholar] [CrossRef]
  71. Li, W.; Xu, J. Mechanical properties of basalt fiber reinforced geopolymeric concrete under impact loading. Mater. Sci. Eng. A 2009, 505, 178–186. [Google Scholar] [CrossRef]
  72. Li, W.; Xu, J. Impact characterization of basalt fiber reinforced geopolymeric concrete using a 100-mm-diameter split Hopkinson pressure bar. Mater. Sci. Eng. A 2009, 513, 145–153. [Google Scholar] [CrossRef]
  73. Wang, S.; Zhang, M.-H.; Quek, S.T. Effect of specimen size on static strength and dynamic increase factor of high-strength concrete from SHPB test. J. Test. Eval. 2011, 39, 1–10. [Google Scholar]
  74. Clayton, J.D. A model for deformation and fragmentation in crushable brittle solids. Int. J. Impact Eng. 2008, 35, 269–289. [Google Scholar] [CrossRef]
  75. Wang, Z.L.; Liu, Y.; Shen, R. Stress—Strain relationship of steel fiber-reinforced concrete under dynamic compression. Constr. Build. Mater. 2008, 22, 811–819. [Google Scholar] [CrossRef]
  76. Hamdi, E.; Romdhane, N.B.; le Cléac’h, J.M. A tensile damage model for rocks: Application to blast induced damage assessment. Comput. Geotech. 2011, 38, 133–141. [Google Scholar] [CrossRef]
  77. Addessio, F.L.; Johnson, J.N. A constitutive model for the dynamic response of brittle materials. J. Appl. Phys. 1990, 67, 3275–3286. [Google Scholar] [CrossRef]
  78. Wang, Z.L.; Li, Y.C.; Wang, J. A damage-softening statistical constitutive model considering rock residual strength. Comput. Geosci. 2007, 33, 1–9. [Google Scholar] [CrossRef]
  79. Vaughn, N.; Polnaszek, C. Design-Expert® Software; Stat-Ease, Inc.: Minneapolis, MN, USA, 2007. [Google Scholar]
  80. Joglekar, A.; May, A. Product excellence through design of experiments. Cereal Foods World 1987, 32, 857. [Google Scholar]
  81. Noordin, M.Y.; Venkatesh, V.C.; Sharif, S.; Elting, S.; Abdullah, A. Application of response surface methodology in describing the performance of coated carbide tools when turning AISI 1045 steel. J. Mater. Process. Technol. 2004, 145, 46–58. [Google Scholar] [CrossRef] [Green Version]
  82. Montgomery, D.C. Design and Analysis of Experiments 6th Edition with Design Expert Software; John Wiley & Sons: Hoboken, NJ, USA, 2004. [Google Scholar]
  83. Malvar, L.J.; Ross, C.A. Review of strain rate effects for concrete in tension. Mater. J. 1998, 95, 735–739. [Google Scholar]
  84. MC90, C. Design of Concrete Structures. CEB-FIP Model Code 1990; Thomas, T., Ed.; British Standard Institution: London, UK, 1993. [Google Scholar]
  85. Tedesco, J.W.; Powell, J.C.; Ross, C.A.; Hughes, M.L. A strain-rate-dependent concrete material model for ADINA. Comput. Struct. 1997, 64, 1053–1067. [Google Scholar] [CrossRef]
  86. Zhou, X.; Hao, H. Modelling of compressive behaviour of concrete-like materials at high strain rate. Int. J. Solids Struct. 2008, 45, 4648–4661. [Google Scholar] [CrossRef] [Green Version]
Figure 1. Formation of cement balls during the mixing process.
Crystals 10 00243 g001
Figure 2. Split Hopkinson pressure bar (SHPB) machine components.
Crystals 10 00243 g002
Figure 3. Displacement time-history records of the incident, reflected and transmitted pulses during the test.
Crystals 10 00243 g003
Figure 4. Comparison of failure modes between (a) British standard and (b) static test results.
Crystals 10 00243 g004
Figure 5. Stress–strain diagrams at 25 °C: (a) PC and (b) HVFANS concrete.
Crystals 10 00243 g005aCrystals 10 00243 g005b
Figure 6. Stress–strain diagrams at 400 °C: (a) PC and (b) HVFANS concrete.
Crystals 10 00243 g006aCrystals 10 00243 g006b
Figure 7. Stress–strain diagrams at 700 °C: (a) PC and (b) HVFANS concrete.
Crystals 10 00243 g007
Figure 8. Effect of curing age on the toughness of concrete specimens at different temperatures and strain rates.
Crystals 10 00243 g008
Figure 9. Effect of curing age on the critical damage of concrete specimens at different temperatures and strain rates.
Crystals 10 00243 g009
Figure 10. Effect of curing age on the damage mode of PC and HVFANS concrete specimens at different curing ages.
Crystals 10 00243 g010
Figure 11. Effect of curing age on the dynamic increase factor (DIF) of concrete specimens at different temperatures and strain rates.
Crystals 10 00243 g011
Figure 12. Plots of normal probability and predicted vs. actual values: (a) PC and (b) HVFANS concrete.
Crystals 10 00243 g012
Figure 13. Comparison of DIF with the previously recommended expressions at different curing ages and temperatures of (a) 25 °C, (b) 400 °C and (c) 700 °C.
Crystals 10 00243 g013aCrystals 10 00243 g013bCrystals 10 00243 g013cCrystals 10 00243 g013d
Table 1. Proportions of concrete samples.
SamplesCementSandGravelWaterFly AshNano-SilicaPPF %
PC531.30780.06942.64170.16--1
HVFANS225.80682.01942.64154.85278.9326.561
Table 2. Curing age effect on the response of plain concrete (PC) and high-volume fly ash concrete with nano-silica (HVFANS) concrete at 25 °C.
Sample No.Time (days)
72890
PCHVFANSPCHVFANSPCHVFANS
150.8149.1261.8257.9561.4867.82
249.6245.3462.6661.5566.8666.54
351.7447.9159.0856.6865.7264.06
Average (MPa)50.7247.4661.1958.7264.6966.14
Maximum relative error (%)2.174.473.454.824.963.14
Table 3. Curing age effect on the response of PC and HVFANS concrete at 400 °C.
Sample No.Time (days)
72890
PCHVFANSPCHVFANSPCHVFANS
142.3144.3758.6167.7959.6764.81
240.4841.8156.4861.0162.3167.12
343.1343.5059.4864.8661.1565.60
Average (MPa)41.9743.2358.1964.5561.0465.84
Maximum relative error (%)3.553.282.945.482.241.94
Table 4. Curing age effect on the response of PC and HVFANS concrete at 700 °C.
Sample No.Time (days)
72890
PCHVFANSPCHVFANSPCHVFANS
128.9140.1438.8751.639.8153.12
230.6838.5033.5452.1337.1150.44
327.2237.7736.7146.2635.8149.91
Average (MPa)28.9438.8036.3749.9937.5851.16
Maximum relative error (%)5.943.457.787.465.933.83
Table 5. Effect of curing age on dynamic compressive strength of PC and HVFANS concrete at different temperatures and strain rates.
ConcreteTemperature ( °C)Curing Age (days)Average Strain Rate (s−1)Dynamic Compressive Strength (MPa)
C1C2C3C4C5C1C2C3C4C5
PC25731.6451.5570.7886.12100.4465.7771.3276.982.4289.56
2830.1250.7271.3285.24101.4273.3981.2588.6698.61113.77
9030.8851.5671.7785.66100.1779.8887.6196.23105.33123.6
HVFANS25730.8251.1870.9285.11101.1559.8964.1167.7774.1680.12
2830.4950.3871.2285.89100.9170.6879.286.6394.18108.82
9030.7150.1170.6585.28100.8383.1191.23100.65111.24127.87
PC400731.4551.2271.4485.77101.2448.4355.1260.1267.8873.15
2831.0250.3570.6186.17100.2668.6977.8685.1493.3997.46
9030.1950.871.2385.59101.6173.1180.8887.9598.11113.2
HVFANS400731.3351.6470.4786.18100.1252.1358.264.8771.2376.79
2830.8450.9170.8385.3100.6777.7385.893.38102.82119.43
9030.3750.1370.7686.81100.6181.7690.1699.31110.98127.11
PC700730.4451.2570.186.34102.4831.233.5236.6641.1243.78
2830.6450.8370.1785.68100.8142.8647.1852.3957.7261.77
9031.0250.4371.2485.12100.5744.1348.5854.4360.1564.86
HVFANS700730.0950.1670.6685.91101.4544.1252.7857.964.7669.83
2830.7850.6970.4285.17100.5464.8870.373.2880.3184.43
9030.1751.7670.2185.61101.2668.3176.4581.2287.493.13
Table 6. ANOVA analysis results.
Concrete TypeTransformationModelR2Adjusted R2Predicted R2AP
PCinverse2FI0.95340.94600.934136.9194
HVFANSInverse2FI0.95570.94870.928335.9574

