Article

Numerical Analysis of a Novel Shaft Lining Structure in Coal Mines Consisting of Hybrid-Fiber-Reinforced Concrete

School of Civil Engineering and Architecture, Anhui University of Science and Technology, Huainan 232001, China
*
Author to whom correspondence should be addressed.
Crystals 2020, 10(10), 928; https://doi.org/10.3390/cryst10100928
Submission received: 17 August 2020 / Revised: 29 September 2020 / Accepted: 11 October 2020 / Published: 12 October 2020
(This article belongs to the Special Issue Numerical Study of Concrete)

Abstract

:
To address the temperature cracking of concrete in frozen shaft linings in extra-thick alluvial layers in coal mines, a novel shaft lining structure of coal mines consisting of hybrid-fiber-reinforced concrete (HFRC) was developed. Using the Finite Element Method (FEM), a numerical simulation test of the HFRC shaft lining structure with four factors and three levels was carried out, and the mechanical characteristics of the shaft lining structure were obtained. The results show that under a uniform surface load, the maximum hoop stress position of the HFRC shaft lining presents a transition trend from the inside surface to the outside surface; the hoop strain of shaft lining concrete is always a compressive strain, and the inside surface is greater than the outside surface. The empirical formula for the ultimate capacity of this new type of shaft lining structure was obtained by fitting. Compared with the model test results, the maximum relative error of the calculated value is only 6.69%, which provides a certain reference value for designing this kind of shaft lining structure.

1. Introduction

The shafts of coal mines are very significant to the safety of production in coal mines. Once the shaft lining breaks, it will not only cause great economic losses, but also pose a serious threat to the safety of underground miners. The artificial freeze method is usually used to construct vertical shafts passing through extra-thick alluvial layers, which is also called freezing shaft sinking. However, water gushing, or leakage, often occurs after the frozen soil thaws. For mass concrete pouring projects, such as freezing shafts, the internal temperature of the concrete can reach 60 to 80 °C [1,2], and at this time, the temperature inside the freezing wall is about −10 to −5 °C, and the air temperature inside the shaft is about 0 °C. The huge temperature difference will cause the shaft lining concrete to undergo additional temperature shrinkage, and the shrinkage of the shaft lining concrete is bound to be constrained by the freezing wall or the outside shaft lining, which will produce large temperature stress in the shaft lining concrete [3,4]. However, the early tensile strength of high-strength concrete is low. When the tensile stress caused by temperature stress is greater than its tensile strength, the shaft lining will produce temperature cracks. When the frozen wall is completely thawed, under the action of high-pressure water in the extra-thick alluvium, the temperature cracks in the shaft lining concrete will continue to expand and even penetrate, and then water leakage will occur [5,6], which will seriously threaten the mine safety production. Because of the freezing shaft lining of freezing shaft sinking in extra-thick alluvium, it is urgent to apply high-performance shaft lining concrete with good crack resistance and strong toughness.
Certain amounts of polypropylene plastic steel fiber (PPSF) and polyvinyl alcohol fiber (PVAF) can be added to concrete, which will greatly enhance its crack resistance and toughness [7,8,9]. At the same time, the synergistic effect and superposition effect resulting from multi-scale and multi-element mixing of fibers can delay the formation of cracks in the hardening stage of concrete, enhance the impermeability and crack resistance of concrete [10,11,12,13] and improve the mechanical properties of hybrid-fiber-reinforced concrete (HFRC) compared with those of concrete mixed with single fibers [14,15]. Because of its good anti-cracking and impermeability properties, many scholars have applied fiber concrete to shaft lining structure model tests and studied the force characteristics and failure mechanism of the fiber concrete shaft lining structure model. Yao et al. [16] carried out a model failure test of HFRC shaft lining based on similarity theory and verified that, as a shaft lining construction material, HFRC is superior to ordinary concrete. Qin et al. [17] studied the compressive strength and failure characteristics of ordinary high-strength concrete and HFRC shaft lining models through indoor model tests. The mixed-use of steel fiber and PPSF restricts the expansion of cracks, improves the stress performance of the shaft lining, and mitigates the problems of hoop cracking, water permeability, and uneven deformation during use. However, when mixing shaft lining concrete, the dispersion of steel fibers is difficult to control, and steel fibers will greatly reduce the fluidity of concrete, which is not convenient for engineering applications. Taking into account the workability of concrete during the construction of the project, Yao et al. [18] studied the mechanical properties of concrete with hybrid PPSF and PVAF and then carried out a similar model test on the shaft lining structure based on similarity theory. By comparing it with the ordinary concrete group, it was found that hybrid-fiber had little effect on improving the uniaxial compressive strength of concrete. However, it can greatly reduce the cracking of concrete and improve the ultimate capacity of the shaft lining.
With the rapid development of computer technology, many scholars have carried out numerical simulations of fiber-reinforced concrete, thereby enriching the research theory and research methods of fiber-reinforced concrete. Qureshi et al. [19] calibrated the mechanical parameters of concrete and steel bars by basic mechanical property tests and carried out finite element modeling. It was found that the FEM was in good agreement with the experimental results. This research provided a reference for the numerical simulation of concrete structures. The interaction between the fiber and concrete interface is also a major difficulty in the process of modeling. Carozzi et al. [20] used the tangential stress of the non-linear interface to characterize the interaction between the fibers and the surrounding mortar. The meshes were divided by non-linear truss elements. This research provided a reference for defining the interaction between the fiber and concrete interface. Radtke et al. [21] modeled fibers by applying discrete force to the meshes. The background meshes represent the matrix, while the discrete force represents the interaction between the fibers and the matrix. This is a novel calculation method for describing fiber-reinforced concrete.
The above research is mainly focused on mechanical property tests of fiber-reinforced concrete specimens or shaft lining structure models, but numerical simulation research on the HFRC shaft lining structure is less involved. Therefore, using the ANSYS finite element analysis software, this research first studies the influence of the thickness-diameter ratio, concrete design strength, PVAF content, and PPSF content on the HFRC shaft lining structure and explores the mechanical characteristics of the shaft lining structure. Next, according to the simulation results, the empirical calculation formula for the ultimate capacity of this new type of shaft lining structure is obtained by fitting. Then, the rationality of the empirical calculation formula is verified through a shaft lining structure model test. Finally, through a range analysis of the ultimate capacity of the shaft lining structure, the order of influence on the ultimate capacity of the shaft lining structure is analyzed. The research results are expected to provide a certain reference for designing this kind of shaft lining structure.

2. Establishment of the Numerical Model of the HFRC Shaft Lining Structure

In the analysis of reinforced concrete structures, ANSYS can not only provide data on the basic mechanical characteristics analysis, including the displacement, strain, and stress caused by the structure under load, but also record and analyze the concrete compression yield, plastic creep of steel bars and bond-slip between steel bars and concrete. Therefore, it is a feasible method to simulate the freezing shaft lining structures by ANSYS [20,21,22,23,24].

2.1. Element Type

For modeling the shaft lining structure, separate models were adopted. In this process, HFRC was simulated by SOLID65 element, which can be used to simulate reinforced composite materials (such as steel bars and fibers), concrete cracking (three orthogonal directions), crushing, plastic deformation, etc. The steel bars were simulated by LINK180 element, which is a spatial rod element with functions, such as plasticity, creep, large deformation, large strain, etc. It has a wide range of engineering applications and can be used to simulate steel bars, trusses, springs, etc. It was assumed that there was no relative slip between the two types of elements, and the coordination of the displacement of the concrete elements and the steel bar elements was realized by sharing the nodes [25,26].

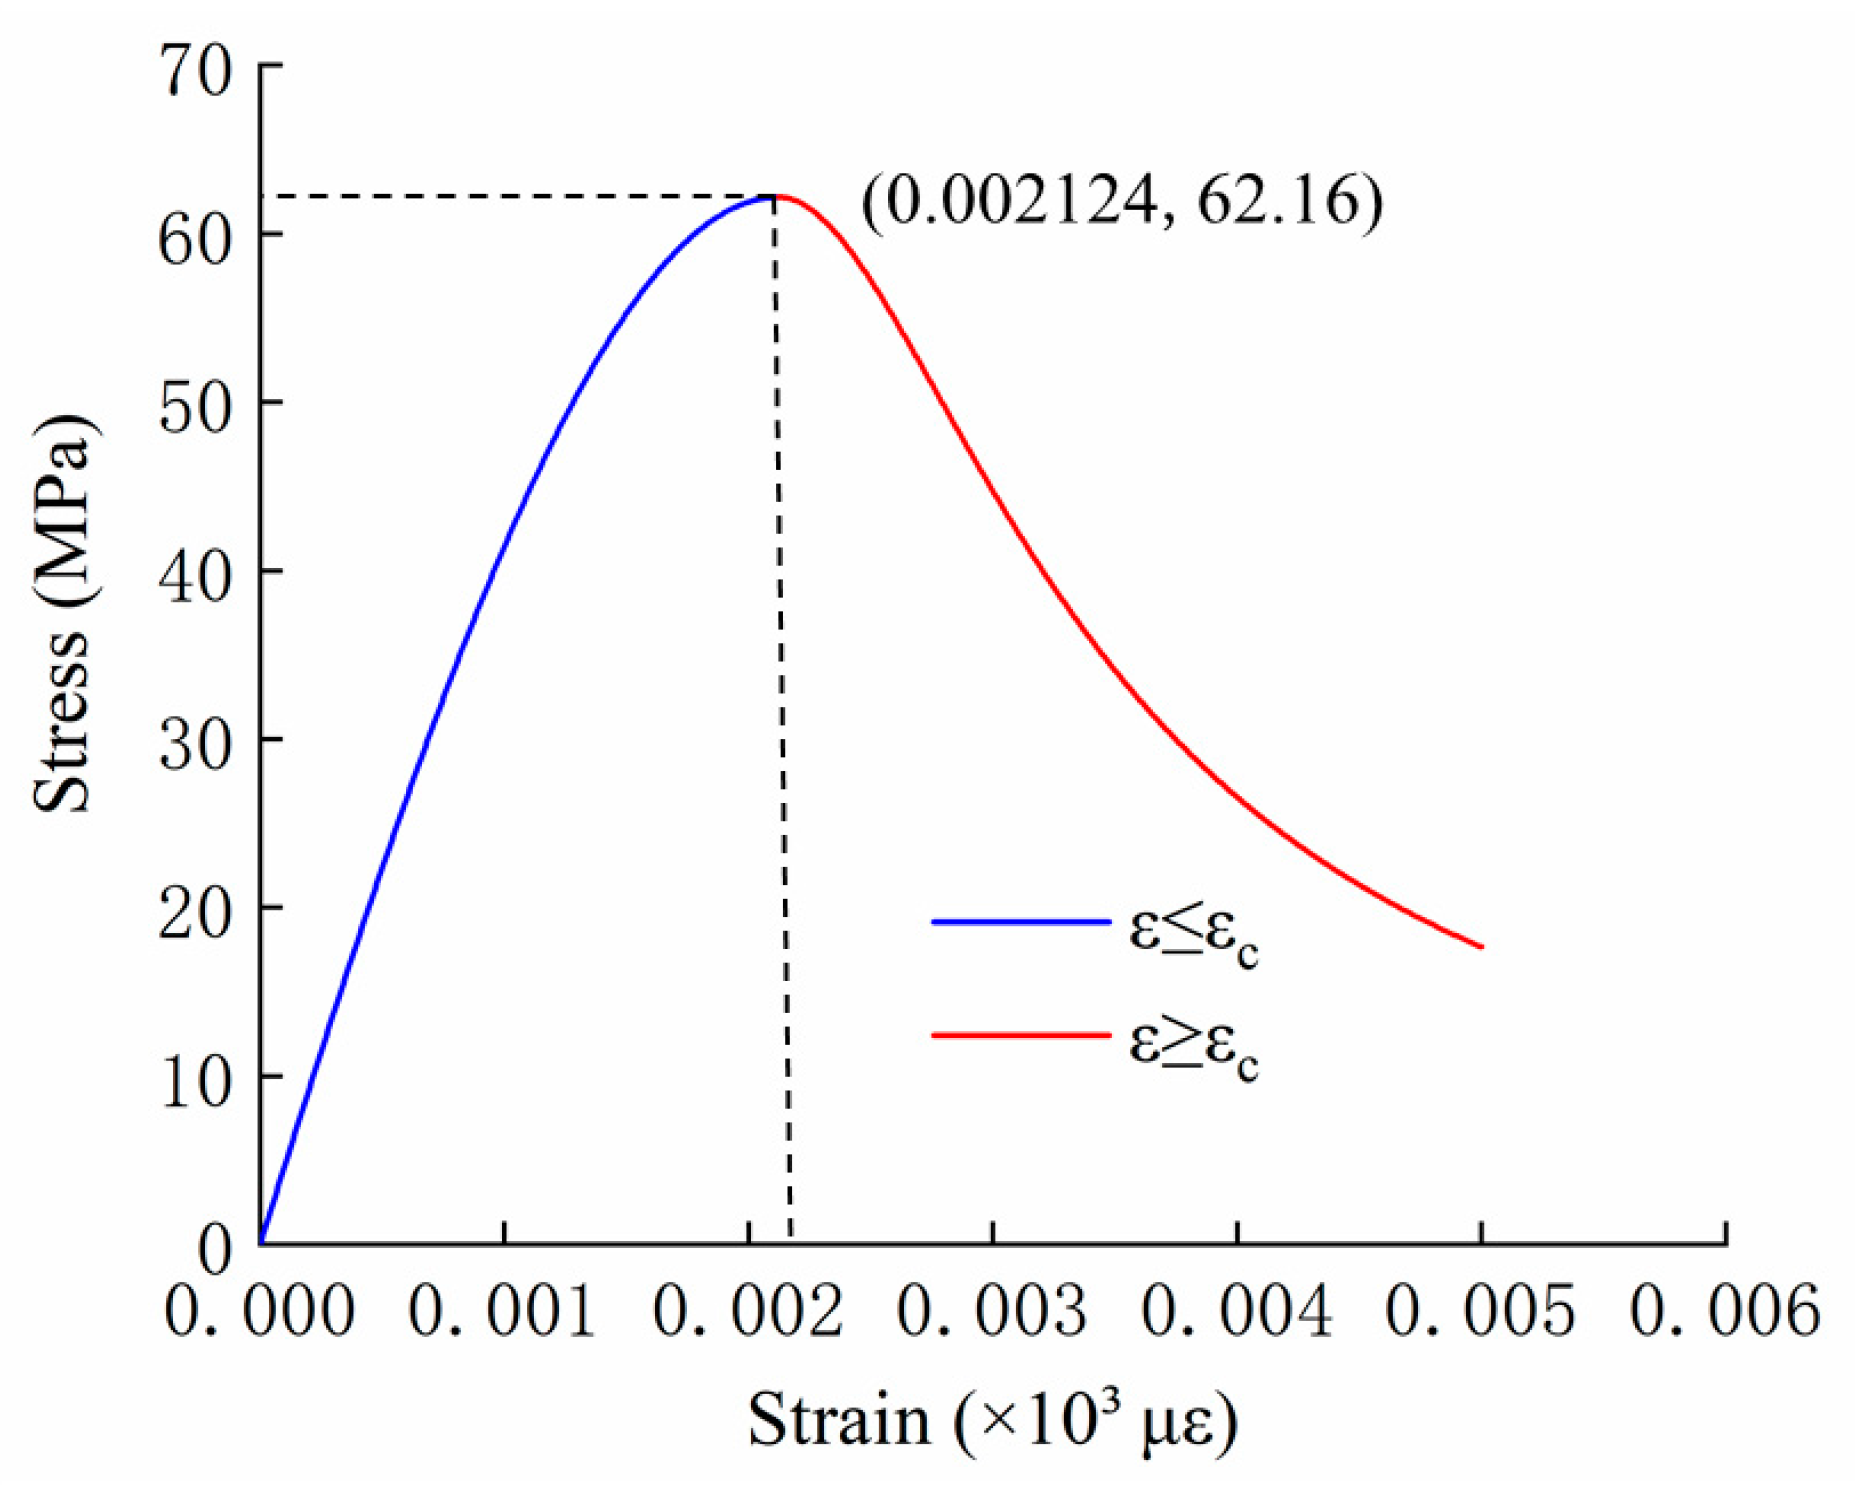
2.2. Material Constitutive Model and Parameters

In this numerical simulation, the uniaxial compression constitutive relation of HFRC was selected according to Formula (1), which can better reflect the rising and falling parts of the stress–strain relationship curve [27].
y = α a x + ( 3 2 α a ) x 2 + ( α a 2 ) x 3 ,   when   x 1 y = x α d ( x 1 ) 2 + x ,   when   x 1
In the above equations,
x = ε ε c   ,   y = σ f c
In these formulas, σ and ε stand for the stress and strain of concrete; α a and α d stand for the parameter values of the rising and falling parts of the concrete stress–strain curve and were calculated by Formulas (3) and (4); f c stands for the axial compressive strength of concrete; ε c stands for the peak strain of concrete under compression.
α a = 2.4 0.01 f cu
α d = 0.132 f cu 0.785 0.905
In these formulas, f cu stands for the cubic compressive strength.
On the falling part of the concrete uniaxial compressive stress–strain curve, when the stress was reduced to 0.5 f c , the corresponding compressive strain was ε u . When calculating and analyzing the concrete structures, the uniaxial compressive strain should not exceed ε u , which is given by Formula (5):
ε u ε c = 1 2 α d ( 1 + 2 α d + 1 + 4 α d )
Before the numerical simulation, a uniaxial compression test and an axial compression test of HFRC were carried out. The obtained mechanical parameters of concrete are shown in Table 1. In this table, C-1 to C-9 represents the number of concretes selected for the nine shaft linings in this numerical simulation. The elastic strain modulus is the ratio between a load of 40% of the axial compressive strength and the corresponding strain. In addition, Poisson’s ratio was uniformly taken as 0.2.
The axial compressive strength of C-1 concrete was 62.16 MPa, the cubic compressive strength was 80.6 MPa, and the peak compressive strain of concrete was 2.124 × 10³ μ ε . The uniaxial compressive strength of concrete can be obtained from Formula (1) to Formula (5). The pressure constitutive relationship curve is shown in Figure 1. Similarly, the uniaxial compression constitutive relationship curves from C-2 to C-9 can be obtained.
The selected failure criterion of concrete was Willam and Warnke’s five-parameter strength criterion, as shown in Formula (6), which takes into account the multiaxial stress state of concrete.
F f c S = 0
In the above formula, F = F ( σ 1 , σ 2 , σ 3 ) is the principal stress state function; S = S ( f t , f c , f c b , f 1 , f 2 ) is the failure surface function; f t , f c , f c b , f 1 and f 2 are the uniaxial tensile strength, uniaxial compressive strength, biaxial compressive strength under hydrostatic pressure, and multiaxial compressive strength under hydrostatic pressure of concrete, respectively, and f c b = 1.2 f c , f 1 = 1.45 f c , and f 2 = 1.725 f c .
The ideal elastic–plastic model was adopted for the steel bars, and the yield condition obeys the Mises criterion. In the numerical calculation, the elastic modulus was 2.1 × 10⁵ MPa, Poisson’s ratio was 0.3, and the yield strength was 240 MPa.

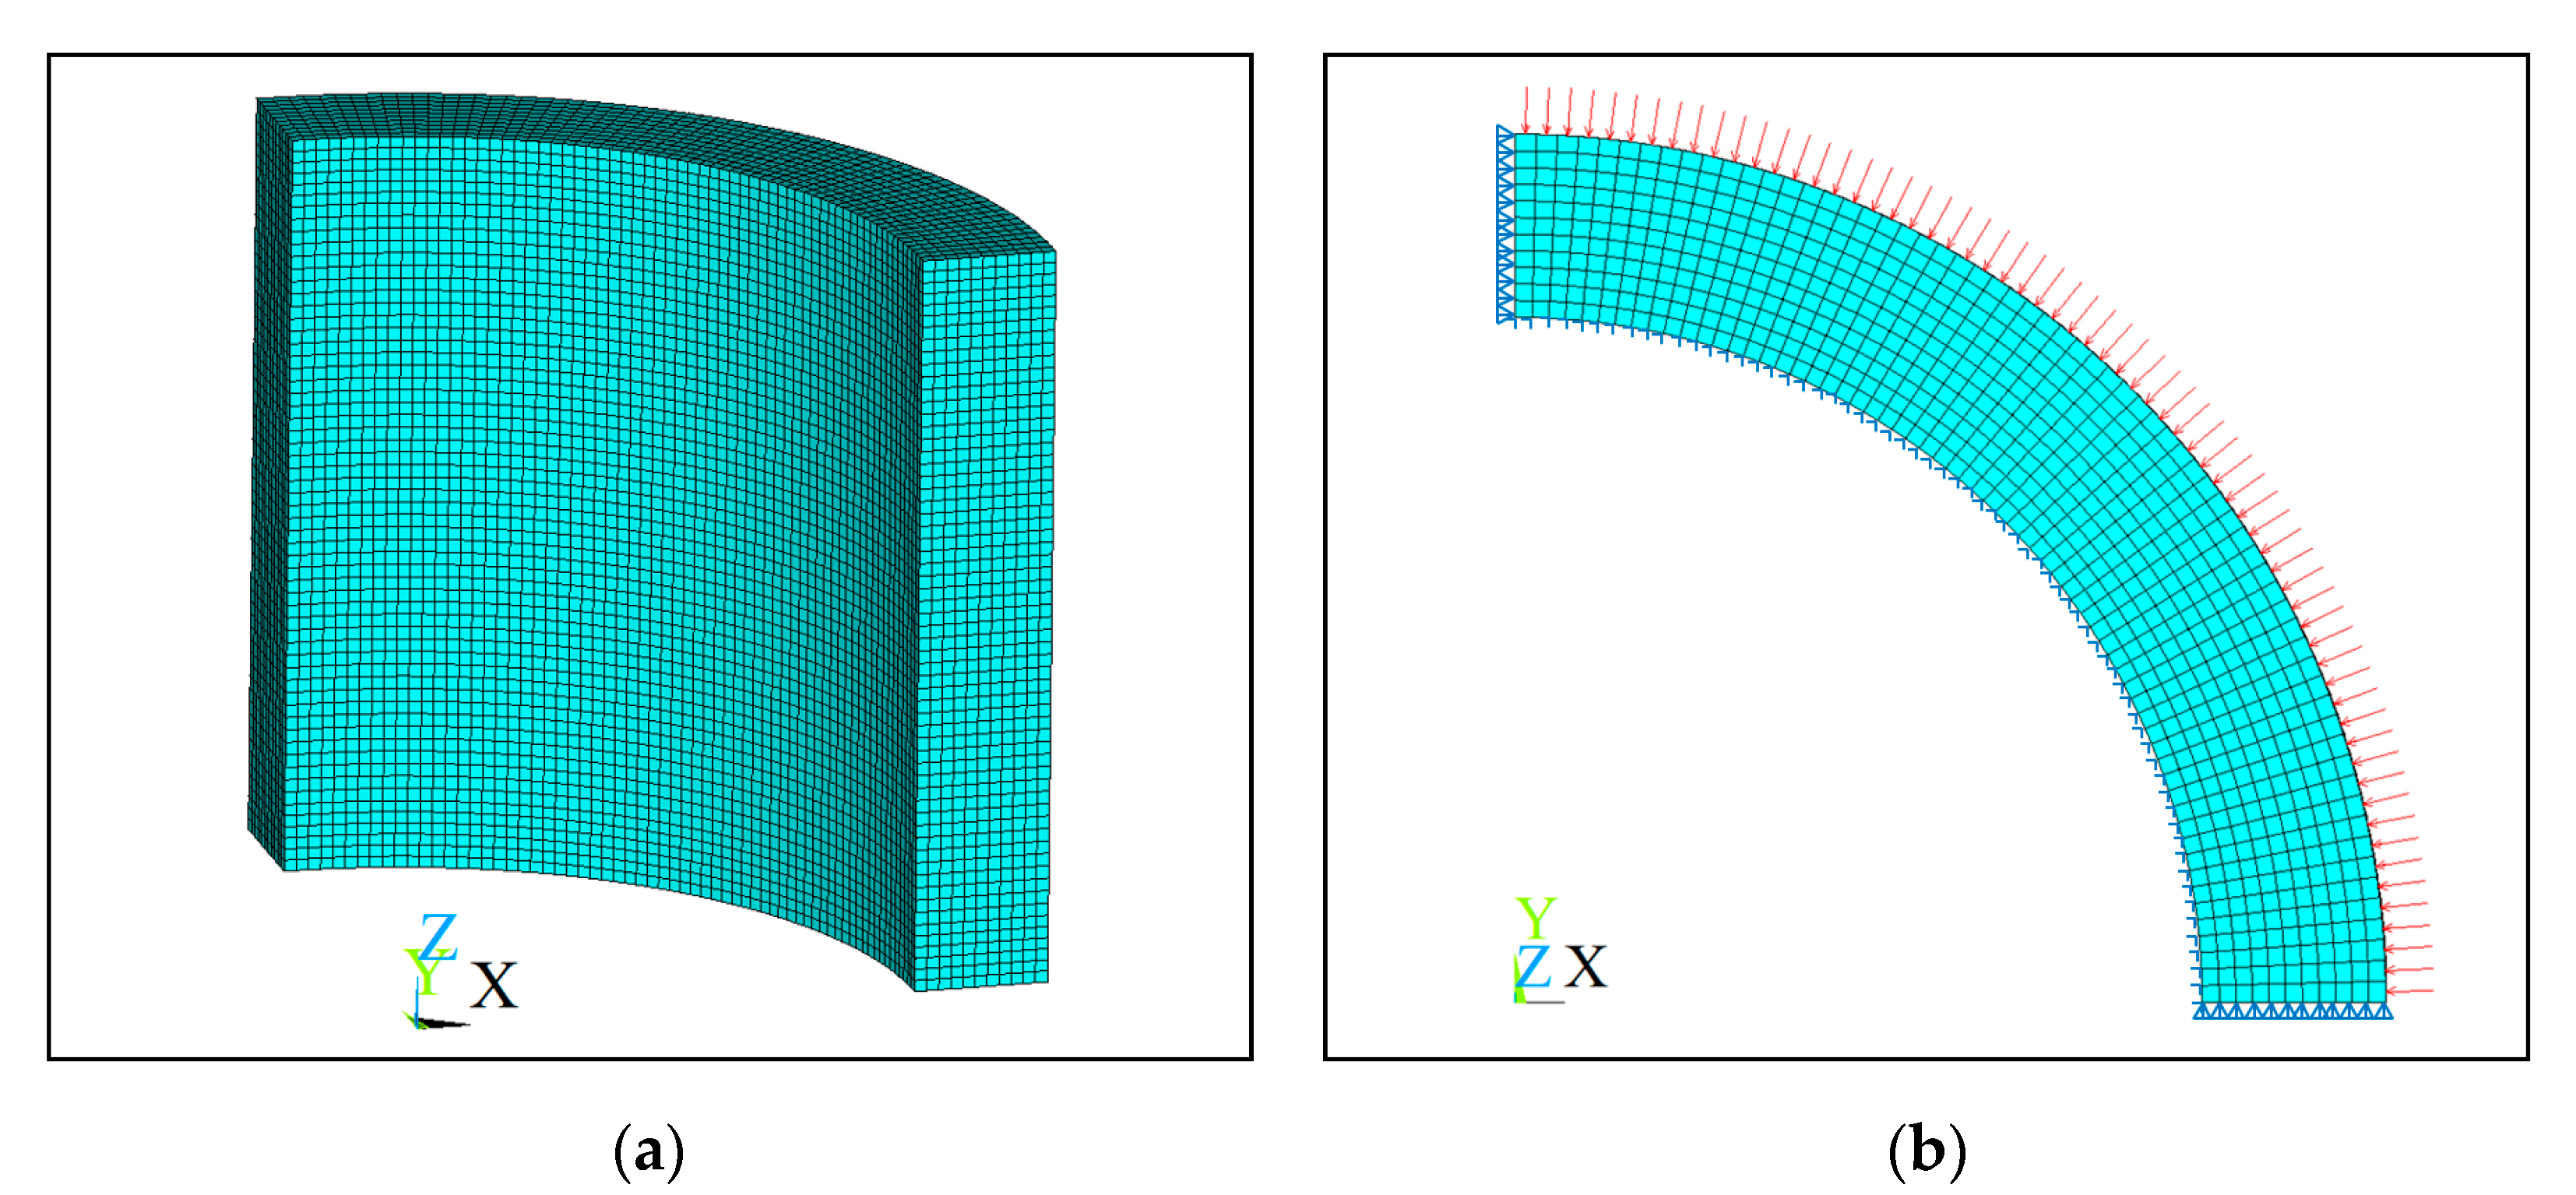
2.3. Shaft Lining Simulation Scheme and Boundary Conditions

In the numerical simulation of this research, the only four factors considered were the thickness–diameter ratio, shaft concrete strength, PVAF content, and PPSF content, and it mainly analyzed the stress–strain characteristics of the HFRC shaft lining structure model under loads. The value of the thickness–diameter ratio was selected according to the thickness–diameter ratio of the shaft lining at the engineering site. The three levels of the thickness–diameter ratio were 0.2675, 0.2908, and 0.3140. The concrete of the shaft lining was selected from C-1 to C-9 in Table 1. The PVAF content was 0.728 kg/m3, 1.092 kg/m3 and 1.456 kg/m3. The PPSF content was 4 kg/m3, 5 kg/m3 and 6 kg/m3. According to the four-factor three-level orthogonal test method, it was necessary to carry out the numerical simulation on the shaft lining structure with nine different parameters. The specific design parameters are shown in Table 2.
In this simulation of the shaft lining, the hoop reinforcement ratio was 0.6%, the vertical reinforcement ratio was 0.3%, and the reinforcement diameter was 5 mm. According to the size of the test equipment, the outside diameter of the model was 925 mm, the height was 562.5 mm, and the thicknesses of the shaft lining corresponding to thickness–diameter ratios of 0.2675, 0.2908, and 0.3140 were 97.6 mm, 104.2 mm and 110.5 mm, respectively.
Considering the axial symmetry of the shaft lining structure in this numerical simulation, the ¼ 3D finite element calculation model was established according to the design parameters of the shaft lining [28]. In the process of mesh generation, it is necessary to pay attention to the node sharing of steel bars and concrete. The surface load was simulated by applying a larger horizontal load. The boundary condition of the shaft lining model was that the upper and lower end faces were constrained by longitudinal displacement, two ¼ cross-sections were constrained by hoop displacement, and then a uniform surface load was applied on the outside surface of the model. The mesh division diagram and boundary conditions of the shaft lining model are shown in Figure 2.

3. Analysis of Numerical Simulation Results

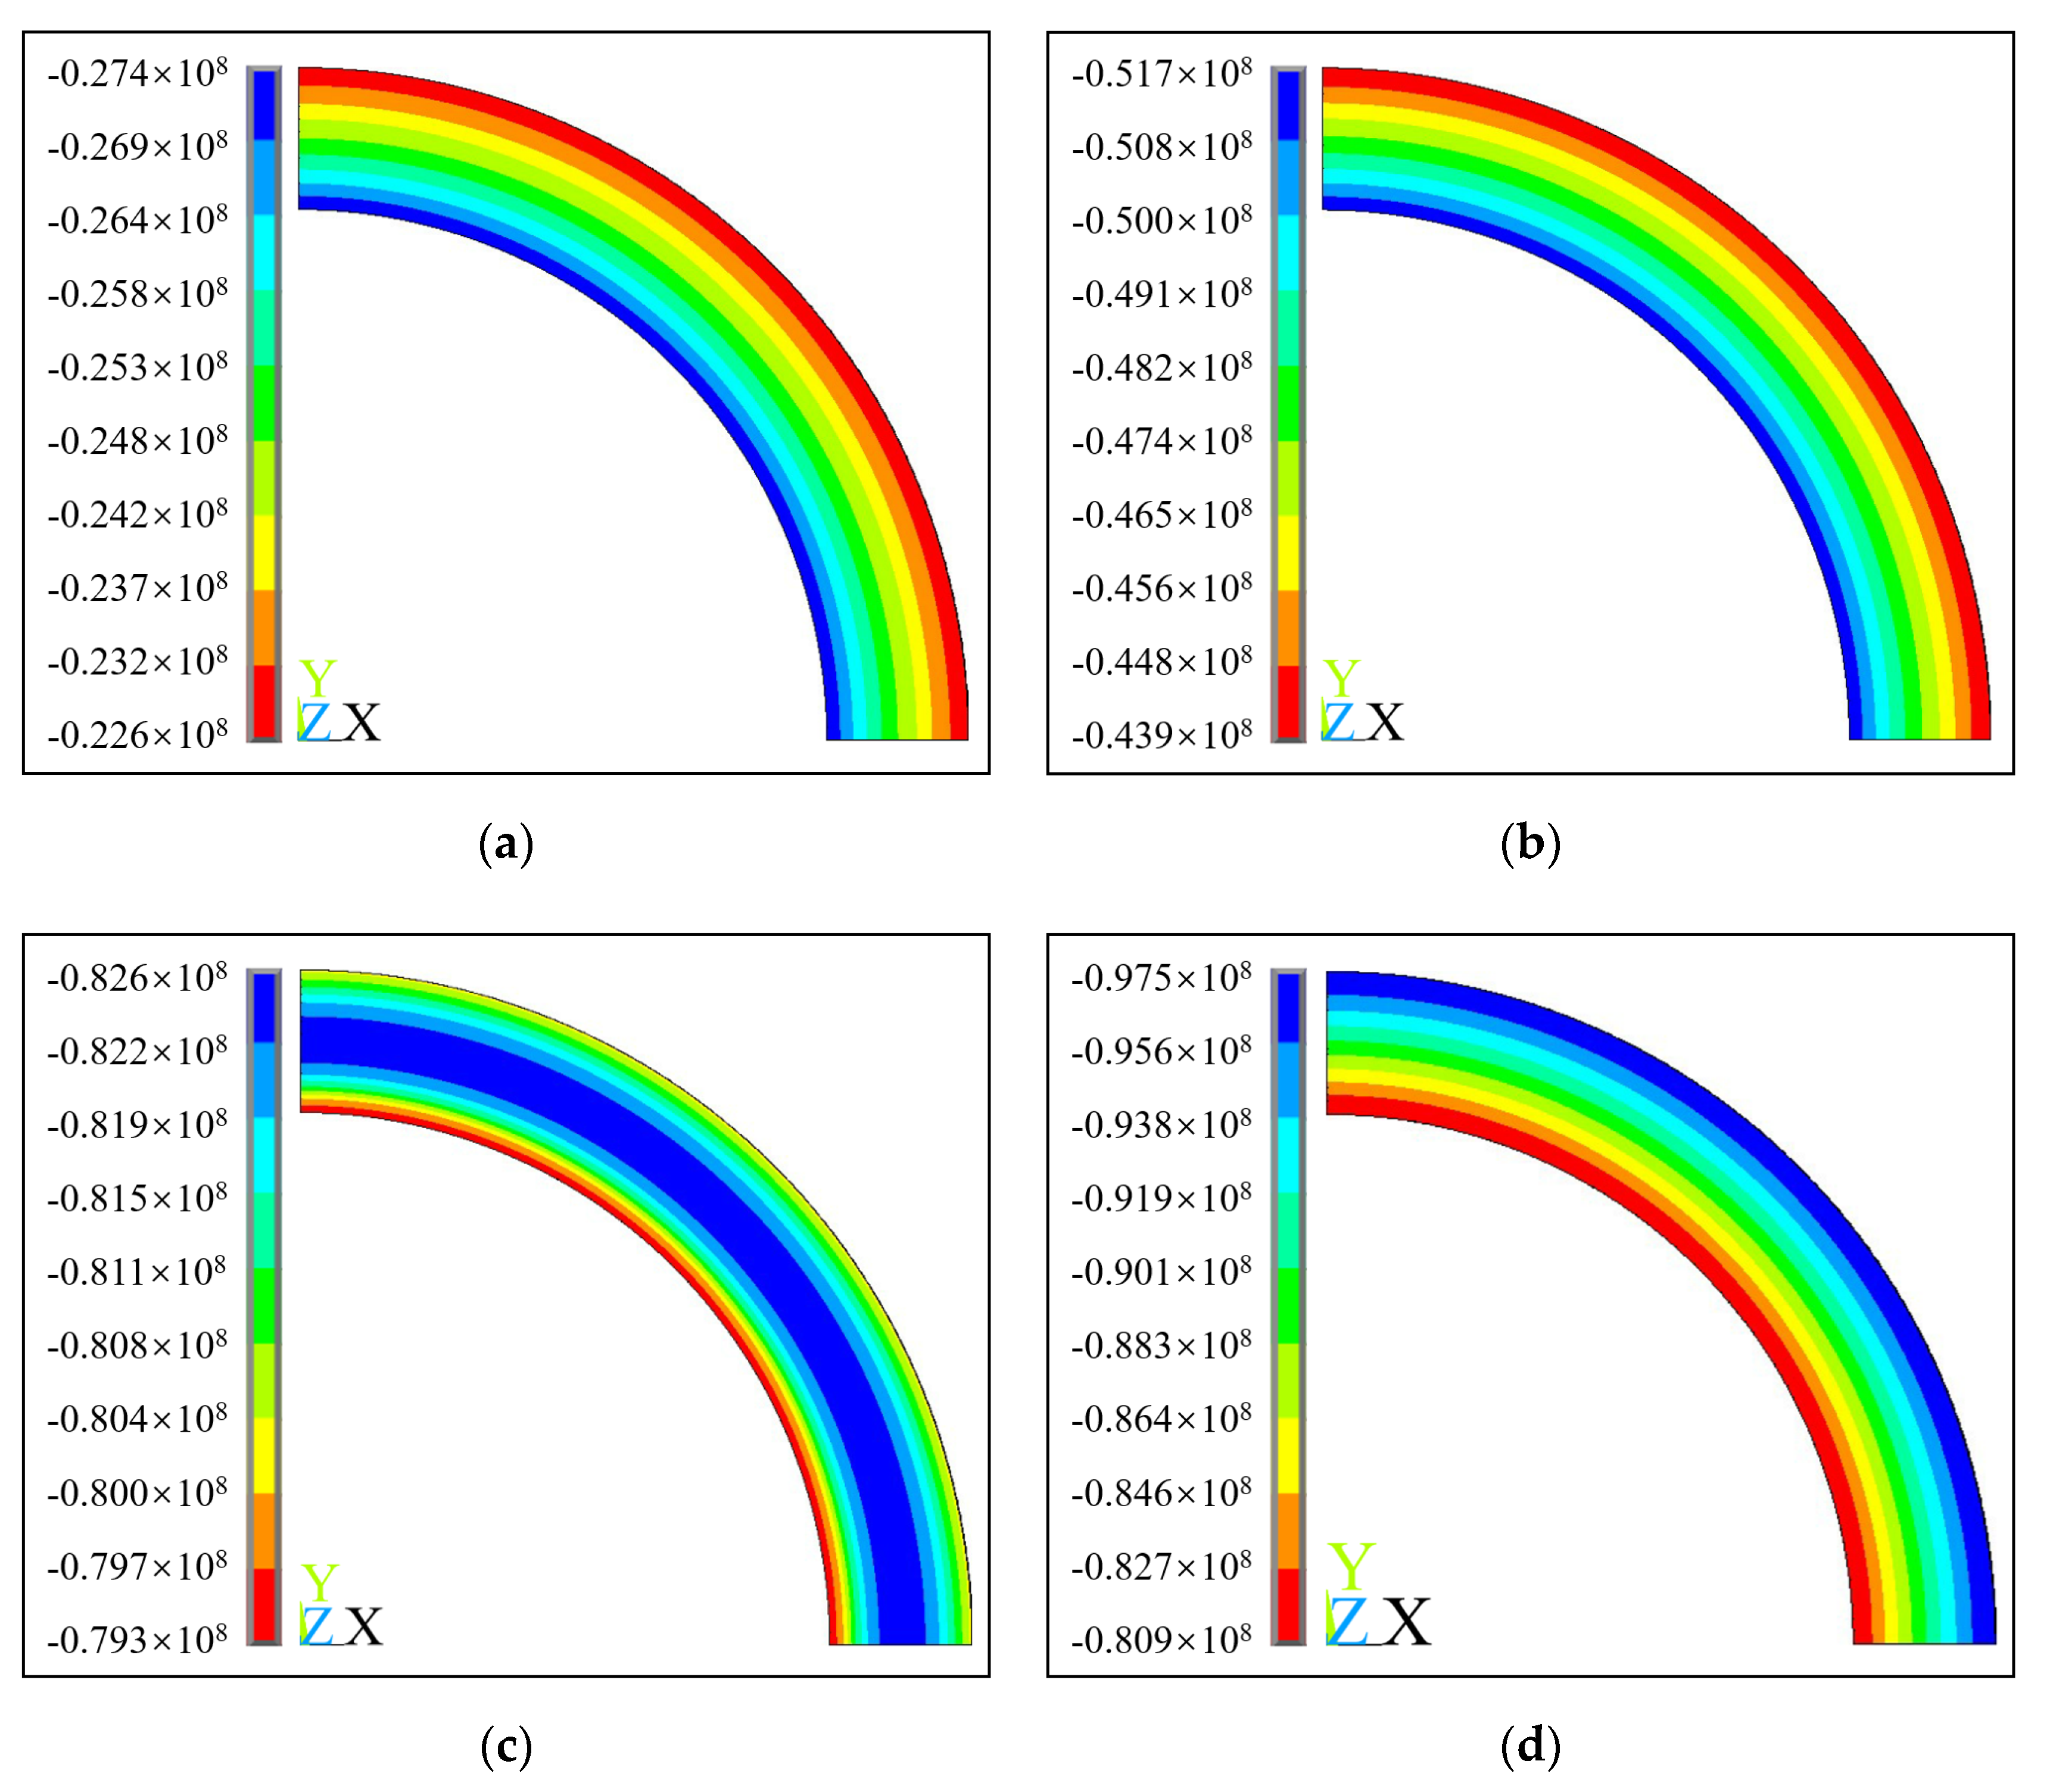
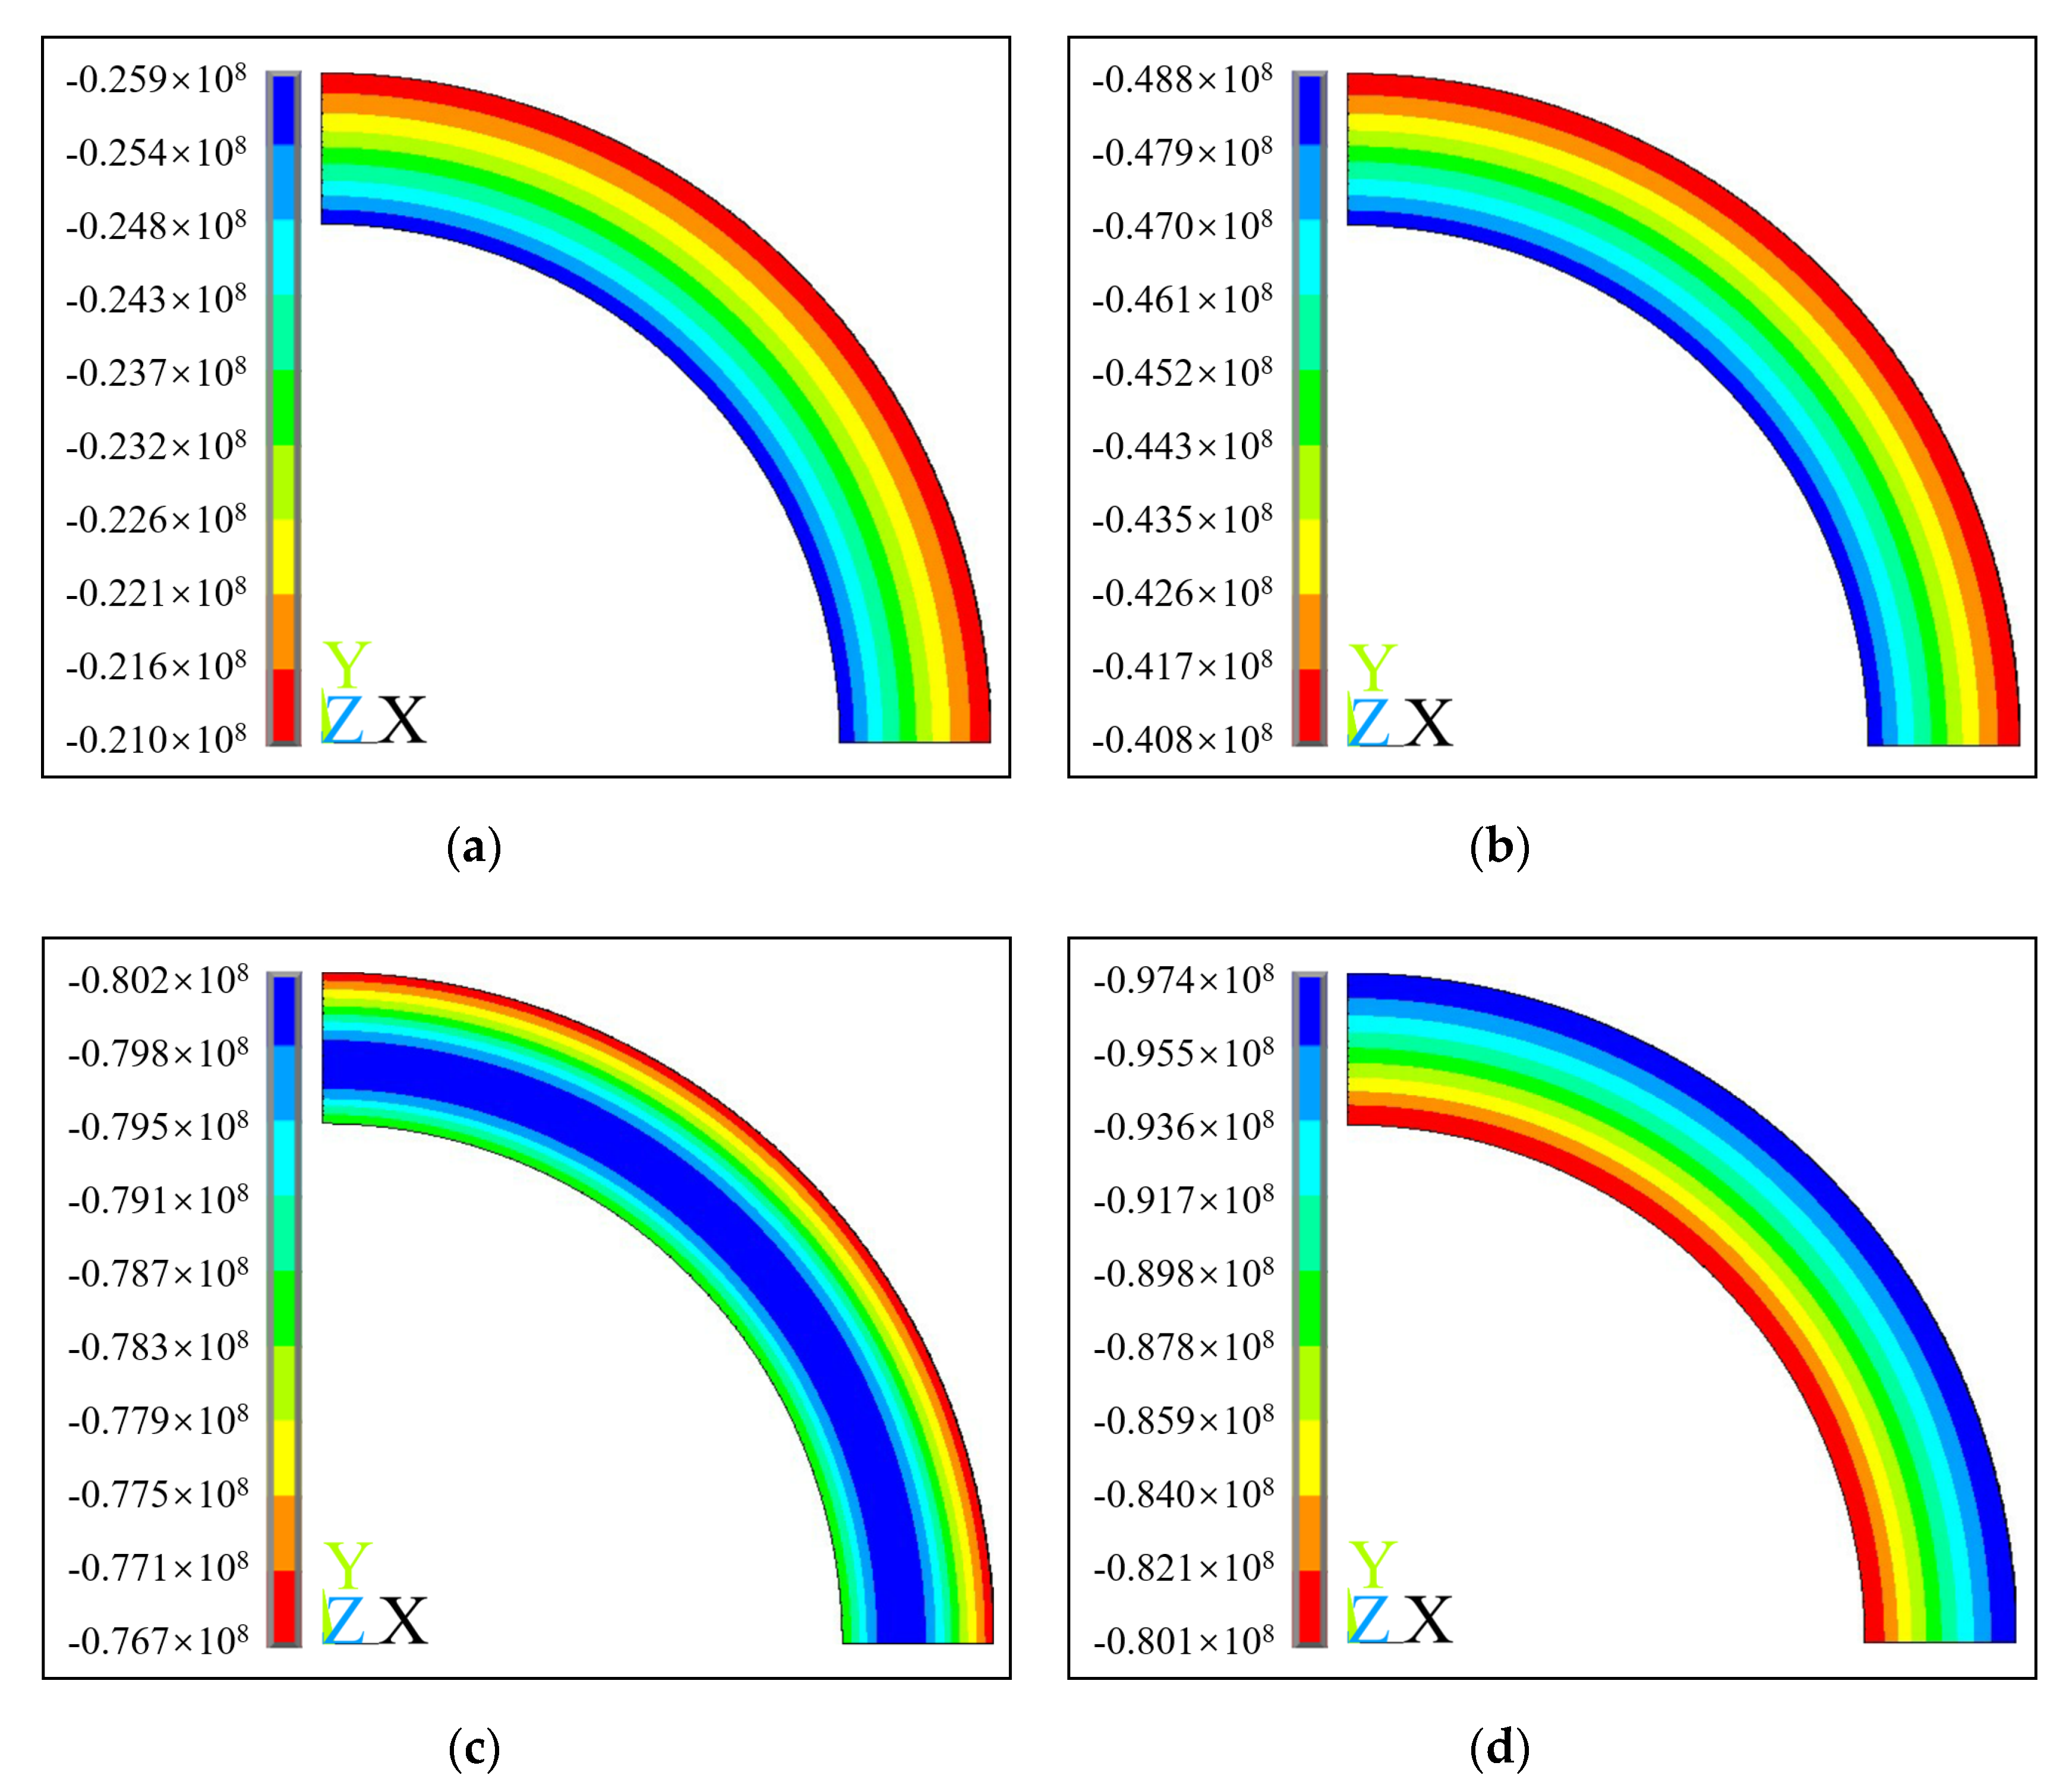
3.1. Relationship between Hoop Stress and Surface Load

In the general postprocessor, the data on hoop stress and the surface load of the shaft lining under each sub-step were obtained to analyze and study the mechanical characteristics and failure mechanism of the shaft lining structure. Based on the control variable method and the idea of taking the median, the representative D-2, D-5, and D-8 were selected to analyze the stress characteristics of shaft lining concrete under a surface load. The hoop stress cloud diagrams of shaft lining concrete obtained by ANSYS simulation calculations are shown in Figure 3, Figure 4 and Figure 5.
It can be seen from Figure 3, Figure 4 and Figure 5 that under the action of a uniform surface load, the hoop stress of shaft lining concrete is not always unchanged. From Figure 3c, Figure 4c and Figure 5c, it can be seen that when the corresponding surface load reaches 17 MPa, 18 MPa, and 19 MPa, the maximum hoop stress of shaft lining concrete appears in the middle of the shaft lining structure, and the hoop stress of the inside surface reaches the minimum. From Figure 3d, Figure 4d and Figure 5d, it can be seen that the maximum hoop stress presents a transition trend from the inside surface to the outside surface with the increasing surface load.
In order to clearly and intuitively visualize the change in the hoop stress of the shaft lining concrete during the whole loading process, the relationship between the hoop stress and surface load of the inside and outside surfaces of the shaft lining with different shaft thicknesses is drawn, as shown in Figure 6.
It can be seen from Figure 6 that the relationship curve between the hoop stress and surface load of the inside and outside surfaces of concrete can be roughly divided into two sections. In the first stage, the hoop stresses of the inside and outside surfaces of the concrete present highly similar linear growth, and the hoop stress of the inside surface of the concrete is greater than that of the outside surface. In the second stage, with the further increase in the surface load, the hoop stress at the outside surface of the concrete continues to increase, but the growth rate is significantly reduced, while the hoop stress at the inside surface of the concrete tends to stabilize. The outside surface is greater than the inside surface. When the surface load of D-1–D-9 exceeds 15 MPa, 17 MPa, 18 MPa, 17 MPa, 18 MPa, 20 MPa, 18 MPa, 19 MPa, and 21 MPa, respectively, the hoop stress of the outside surface begins to exceed that of the inside surface. In addition, when the shaft lining is damaged, the maximum hoop stress values of each model concrete reach 87.8 MPa, 97.5 MPa, 105 MPa, 92.5 MPa, 103 MPa, 111 MPa, 97.3 MPa, 103 MPa, and 111 MPa, respectively, which all exceed the uniaxial compressive strength of the concrete. According to the analysis, when the surface load acts on the shaft lining structure model, the concretes of the inside and outside surfaces of the shaft lining model are in a bidirectional compression state and three-dimensional compression state, respectively. According to the “Code for Design of Concrete Structures” (GB 50010-2010) [29], the compressive strength of concrete under multiaxial stress conditions would increase relative to that under uniaxial stress conditions.

3.2. Relationship between Hoop Strain and Surface Load

D-2, D-5, and D-8 are selected to study the strain characteristics of shaft lining concrete under a surface load. The strain cloud diagrams of the shaft lining concrete obtained by ANSYS simulation calculations are shown in Figure 7, Figure 8 and Figure 9.
It can be seen from Figure 7, Figure 8 and Figure 9 that, firstly, under the action of the surface load, the hoop strain produced by the concrete of the shaft lining structure model is always a compressive strain. Secondly, with the hoop strain value of the inside and outside surfaces of the concrete during the entire process from loading to failure, the inside surface is always larger than the outside surface, which is different from the regular hoop stresses on the inside and outside surfaces of concrete.
In order to more clearly and intuitively visualize the changes in the hoop strain of the shaft lining concrete during the entire loading process, the relationship between the hoop strain and the surface load of the inside and outside surfaces of the shaft lining concrete with different shaft thicknesses is drawn, as shown in Figure 10.
It can be seen from Figure 10 that the hoop strain can be roughly divided into two stages for the entire loading process. In the first stage, when the surface load values of the different groups do not exceed 15 MPa, 18 MPa, 19 MPa, 18 MPa, 19 MPa, 21 MPa, 19 MPa, 20 MPa, and 22 MPa, respectively, the hoop strain and surface load show a linear relationship. In the second stage, as the surface load increases until the shaft lining breaks, the hoop strain and the surface load show a non-linear relationship, and the hoop strain value rises rapidly. The analysis shows that the first stage can be regarded as the elastic deformation stage, which corresponds to the rising part of the stress–strain curve in the concrete constitutive model, so the hoop strain of the concrete in each relationship curve is highly similar. In the second stage, due to the action of the hybrid-fiber, the trend of the stress–strain curve of the concrete is continuous and gentle. Therefore, when the failure is approaching, the concrete undergoes substantial plastic deformation, resulting in a rapid increase in the hoop strain of the concrete in the figures.

3.3. Analysis of the Ultimate Capacity of the Shaft Lining Structure

Table 3 summarizes the ultimate capacity of the shaft lining structure models calculated by ANSYS numerical simulation.
The next part of this study examines the relationship between the ultimate bearing capacity of the shaft lining and the thickness–diameter ratio, the axial compressive strength of the HFRC, and the volume fraction of the hybrid-fibers. According to the dimensional analysis theory, combined with the results of the numerical simulation of the shaft lining model, the empirical formula for calculating the ultimate capacity of the HFRC shaft lining can be derived as follows:
P b = a ρ 1 b ρ 2 c λ d f c e
In this formula, P b stands for the ultimate capacity of the shaft lining, MPa; ρ 1 stands for the volume ratio of PVAF, %; ρ 2 stands for the volume ratio of PPSF, %; λ stands for the thickness–diameter ratio, which is the ratio of the thickness of the shaft lining to the inner radius of the shaft lining; f c stands for the axial compressive strength of concrete, MPa; a, b, c, d and e stand for the constant to be solved.
From the data in Table 3, the empirical calculation formula for the ultimate capacity of the HFRC shaft lining was obtained by using Origin fitting:
P b = 12.09677 ρ 1 0.01652 ρ 2 0.0049 λ 1.32888 f c 0.57726

3.4. Model Test Verification of the Shaft Lining Structure

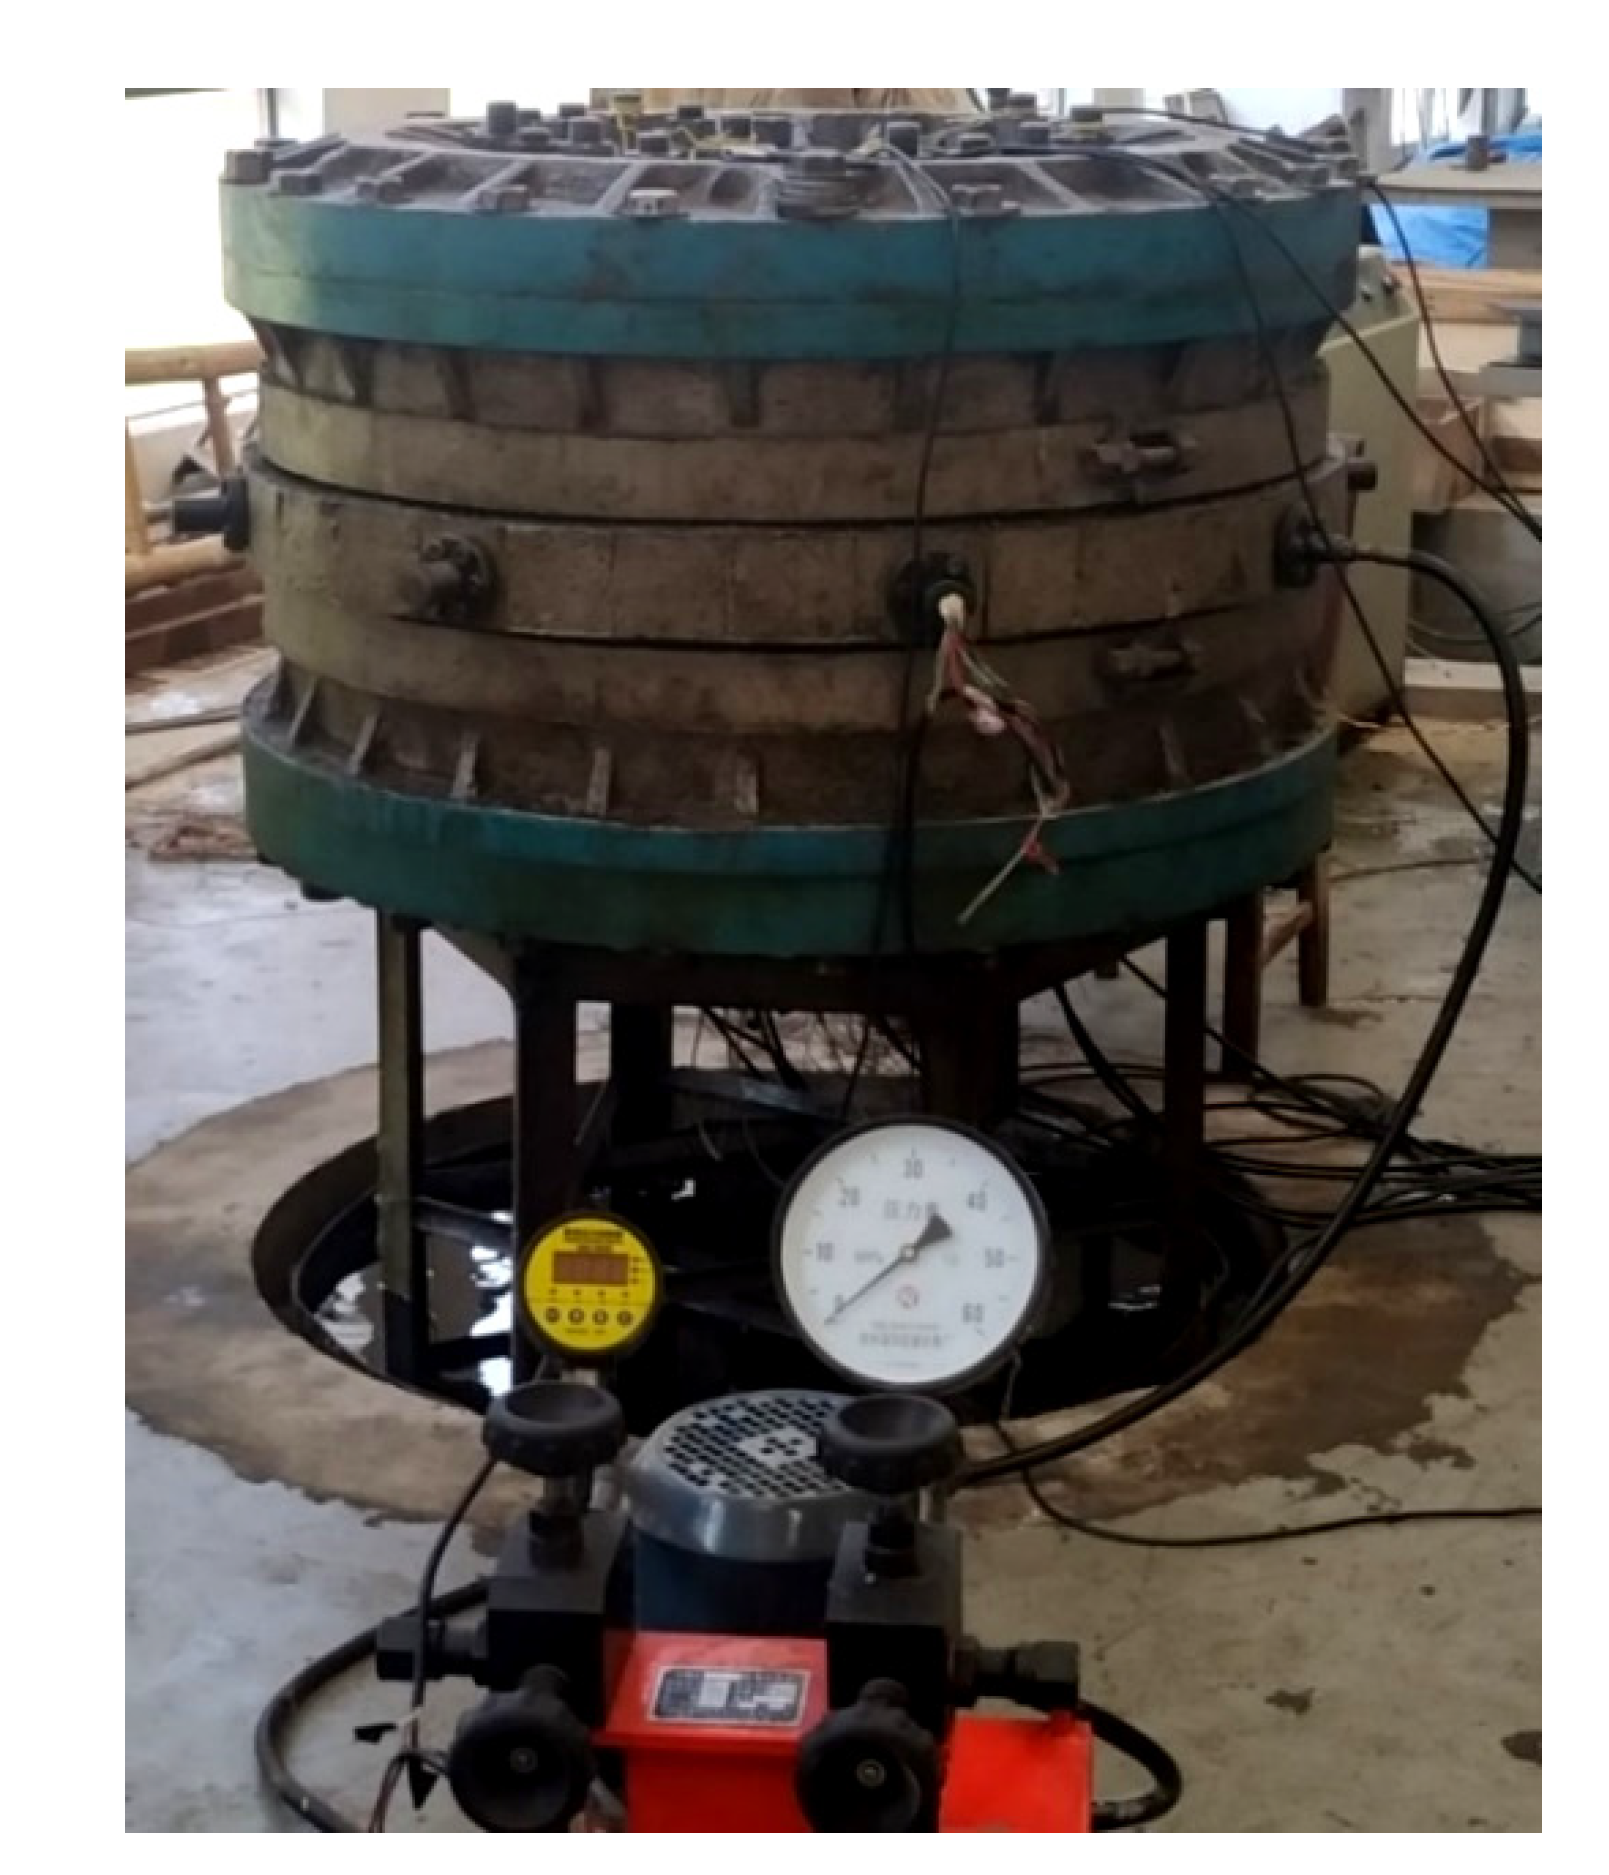
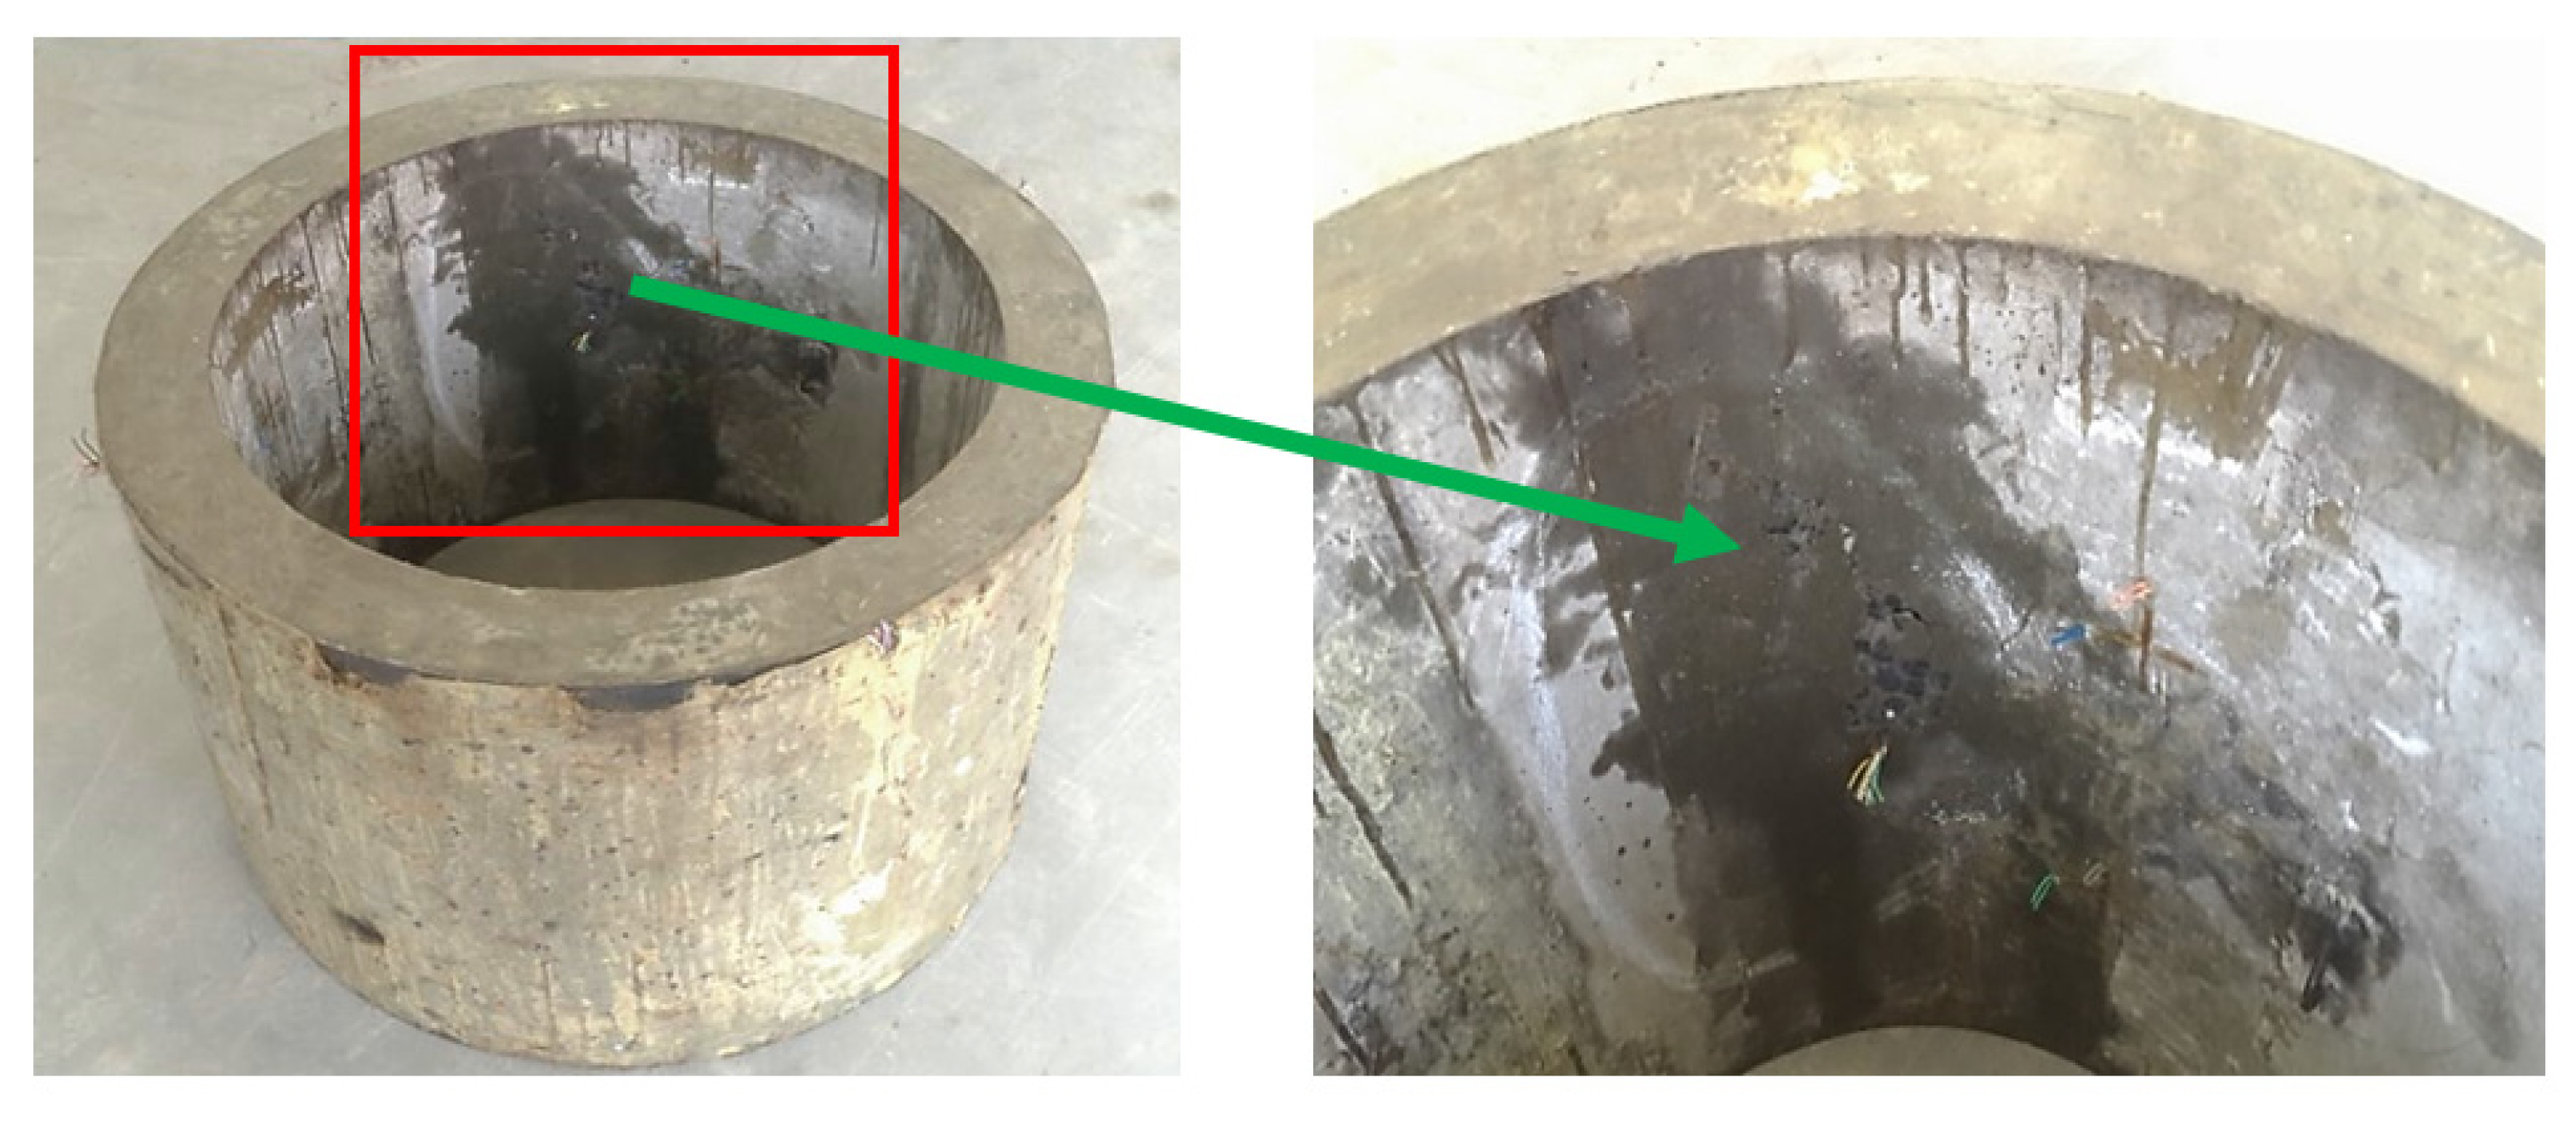
3.4.1. Model Test of the Shaft Lining Structure

In order to verify the correctness of Formula (8), a high-strength shaft lining structure high-pressure loading device that was independently developed by Anhui University of Science and Technology was used to conduct a model test of the shaft lining structure. The outer diameter and height of the shaft lining model are 925 mm and 562.5 mm, respectively. The parameters of the shaft lining structure model are shown in Table 4.
The loading device and the damaged shaft lining model are shown in Figure 11 and Figure 12.
It can be seen from Figure 12 that the HFRC shaft lining has no obvious fracture surface when it is destroyed, and it is only partially damaged. The outside surface of the shaft lining structure is relatively complete, and there is a little damage to the concrete where it is cracking and falling off from the inside surface. As a result of the addition of PVAF and PPSF to the concrete, the brittleness of the shaft lining concrete is improved, and the deformability of the shaft lining structure is significantly improved. Therefore, the use of the HFRC shaft lining will greatly improve the deformation characteristics of the shaft lining structure, and at the same time, improve the anti-cracking and seepage resistance performance of the shaft lining structure, which has a significant effect on preventing the shaft lining from flooding.

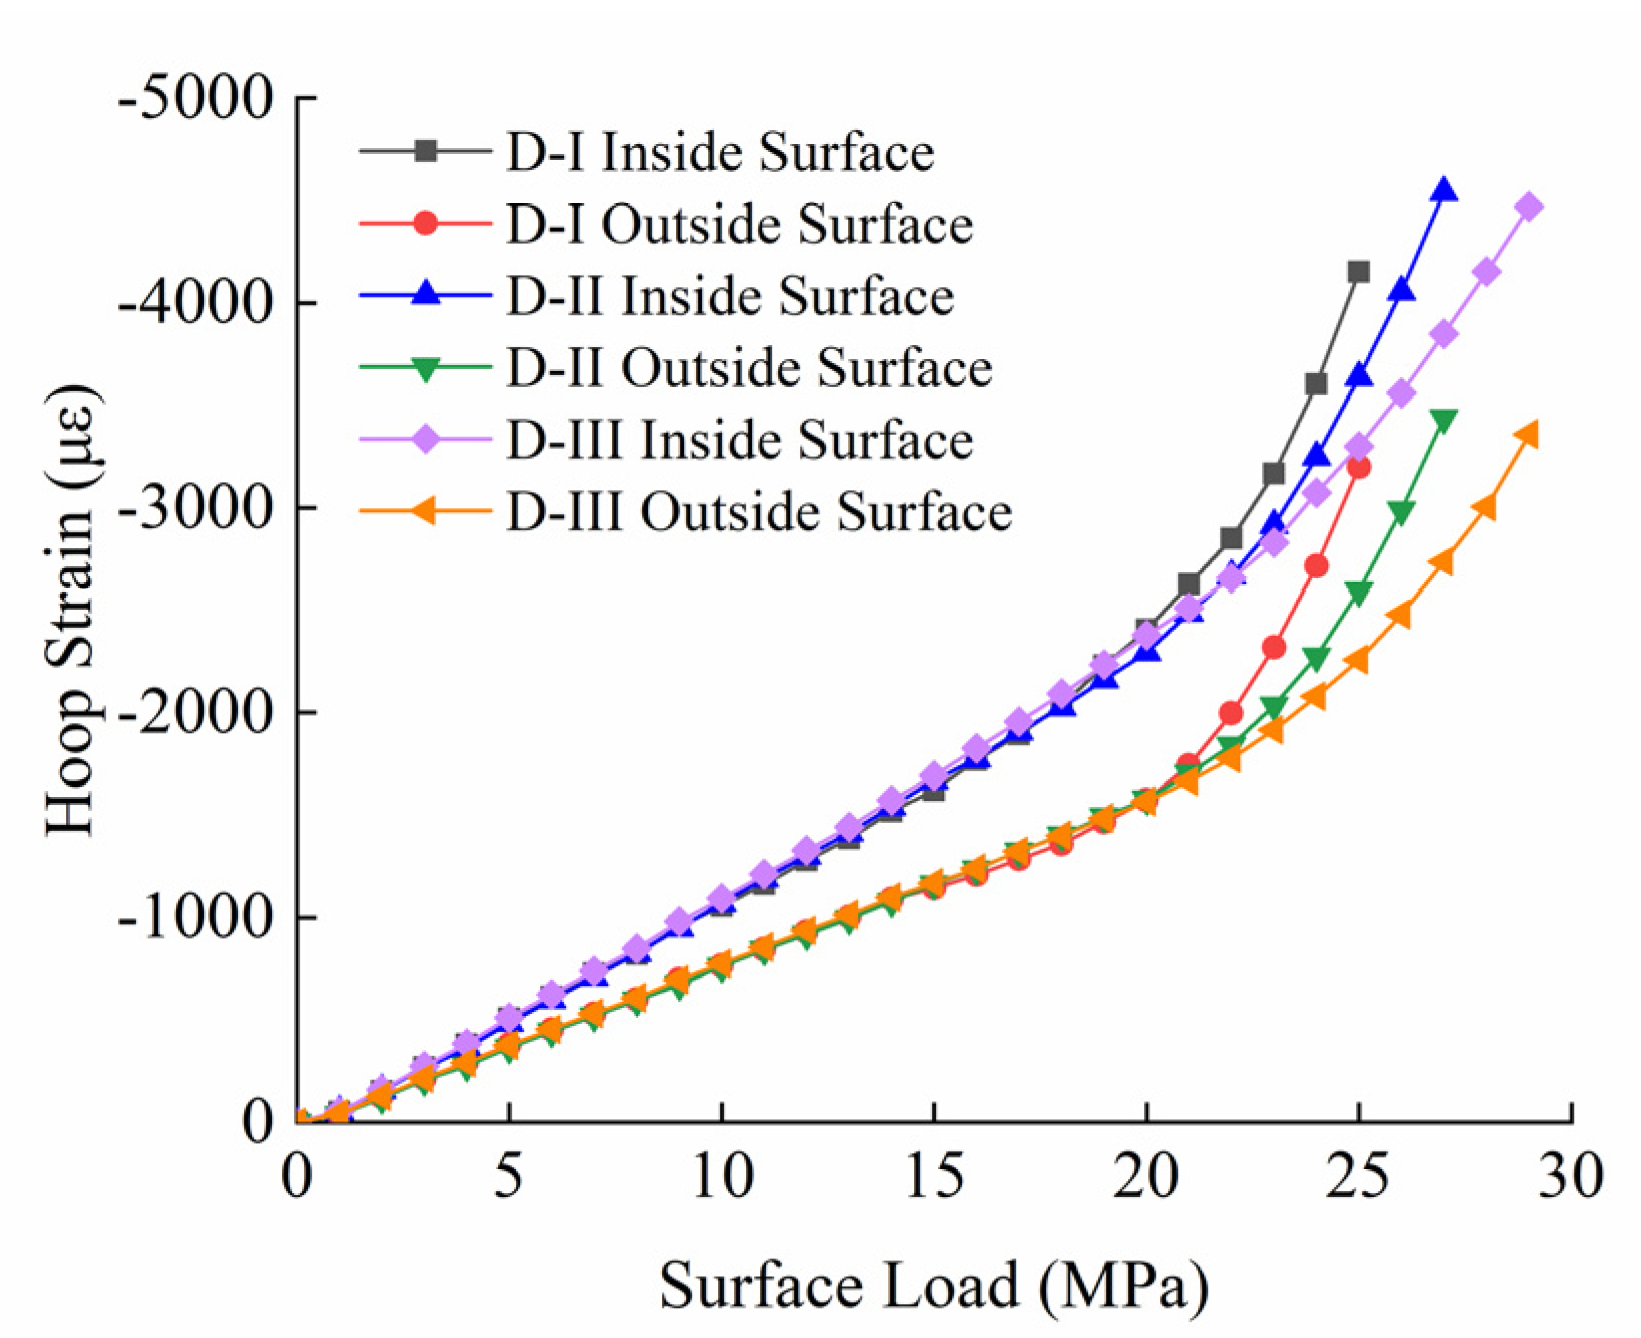
3.4.2. The Relationship between Shaft Lining Hoop Strain and Surface Load

According to the test results collected by the strain gauge, the relationship curve between the hoop strain of the inside and outside surfaces of the HFRC shaft lining model and the surface load is drawn, as shown in Figure 13.
It can be seen from Figure 13 that the relationship curve between the hoop strain and surface load of the hybrid-fiber shaft lining concrete can be roughly divided into two stages. In the first stage, when the surface load is 0~20 MPa, the hoop strain values of the inside and outside surfaces increase linearly with the gradual increase in the surface load. In the second stage, the surface load exceeds 20 MPa until the shaft lining model breaks. The growth rate of the hoop strain value is significantly increased. The results are basically consistent with the relationship curve between the hoop strain and surface load of the inside and outside surfaces of the shaft lining obtained by the numerical simulation in Figure 10, which verifies that the parameter selection was reasonable when the shaft lining model was simulated in this research. When the shaft lining model specimen is damaged, the maximum hoop strain of the inside surface concrete reaches −4539 μ ε . The HFRC shaft lining structure shows obvious plastic characteristics, which is beneficial for improving the brittleness of the ordinary high-strength concrete shaft lining structure and plays a positive role in improving the deformation resistance of the frozen shaft lining and the safety and reliability of the shaft lining structure.

3.4.3. Verification of the Empirical Formula for the Ultimate Capacity of the Shaft Lining

The relevant parameters of shaft lining models were substituted into Formula (8), and the calculated values of the shaft lining ultimate capacity were obtained, as shown in Table 5.
It can be seen from Table 5 that the maximum relative error between the calculated value of the ultimate capacity of the shaft lining model and the test value is only 6.69%, indicating that the fitted empirical formula for the ultimate capacity of the shaft lining can better estimate this type of shaft lining structure. This provides a certain reference value for this kind of shaft lining structure design.

4. Range Analysis of the Ultimate Capacity of the Shaft Lining Structure

In order to study the influence of various factors on the ultimate capacity of the shaft lining, a range analysis of the ultimate bearing capacity was carried out. The analysis results are shown in Table 6. The thickness–diameter ratio, shaft concrete design strength, PVAF content, and PPSF content are reported as factors A, B, C, and D, respectively.
From the comparison of the R value and k value in Table 6, it can be seen that the order of influence on the ultimate capacity of the shaft lining structure is the thickness–diameter ratio, the design strength of the concrete, the content of PPSF and the content of PVAF. The greater the thickness–diameter ratio and the design strength of the shaft lining concrete, the greater the k value, that is, the greater the ultimate capacity of the shaft lining structure. In addition, the k value of the hybrid-fiber reaches the maximum under the second-level combination.
In order to more intuitively observe the influence of each factor level on the ultimate capacity of the shaft lining structure model, the relationship curve between each factor and the ultimate capacity of the shaft lining structure is drawn, as shown in Figure 14.

5. Conclusions

Temperature cracking of concrete is easy to occur in frozen shaft linings in extra-thick alluvial layers in coal mines. This research proposed to use the novel shaft lining structure of coal mines consisting of HFRC to solve this problem. Blending PPSF and PVAF into concrete, the synergistic effect and superimposition effect resulting from multi-scale and multi-element mixing of fibers greatly enhance the crack resistance and toughness of the shaft lining concrete, and delay the formation of cracks in the hardening stage of concrete. It can effectively solve the temperature cracking problem in frozen shaft linings in extra-thick alluvial layers in coal mines. With the use of the FEM, a numerical simulation test of the HFRC shaft lining structure was carried out. The following conclusions can be drawn:
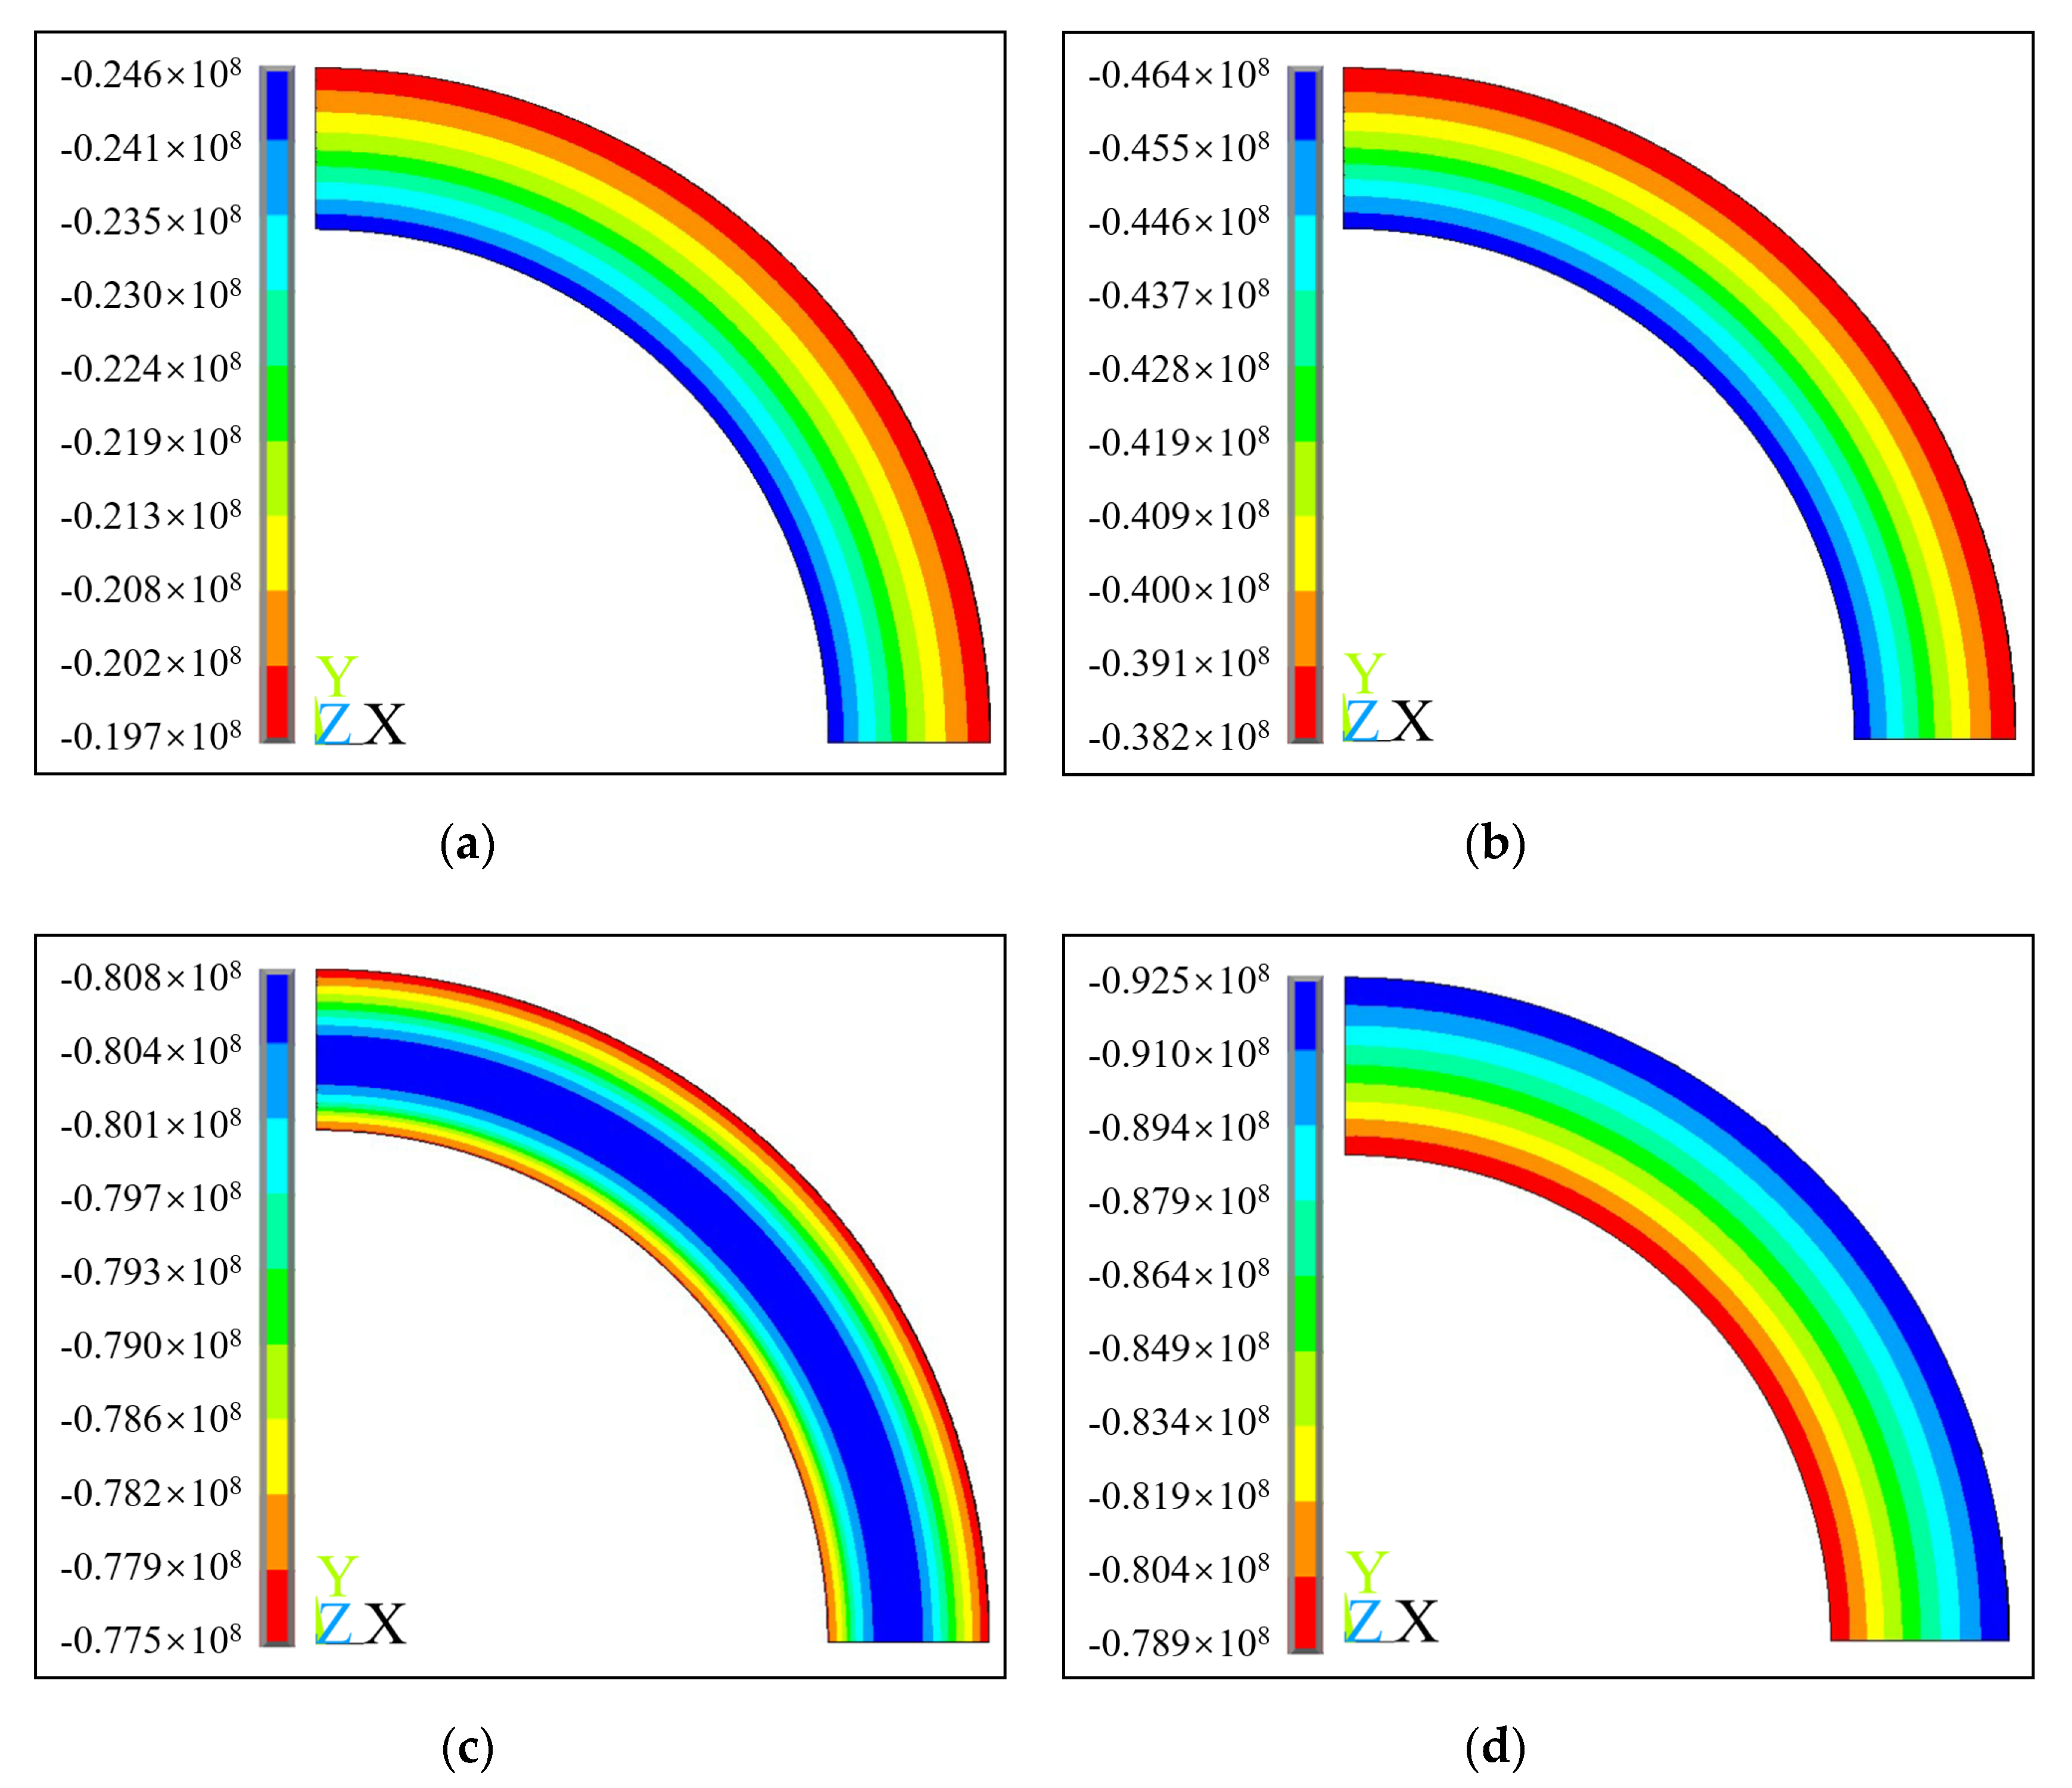
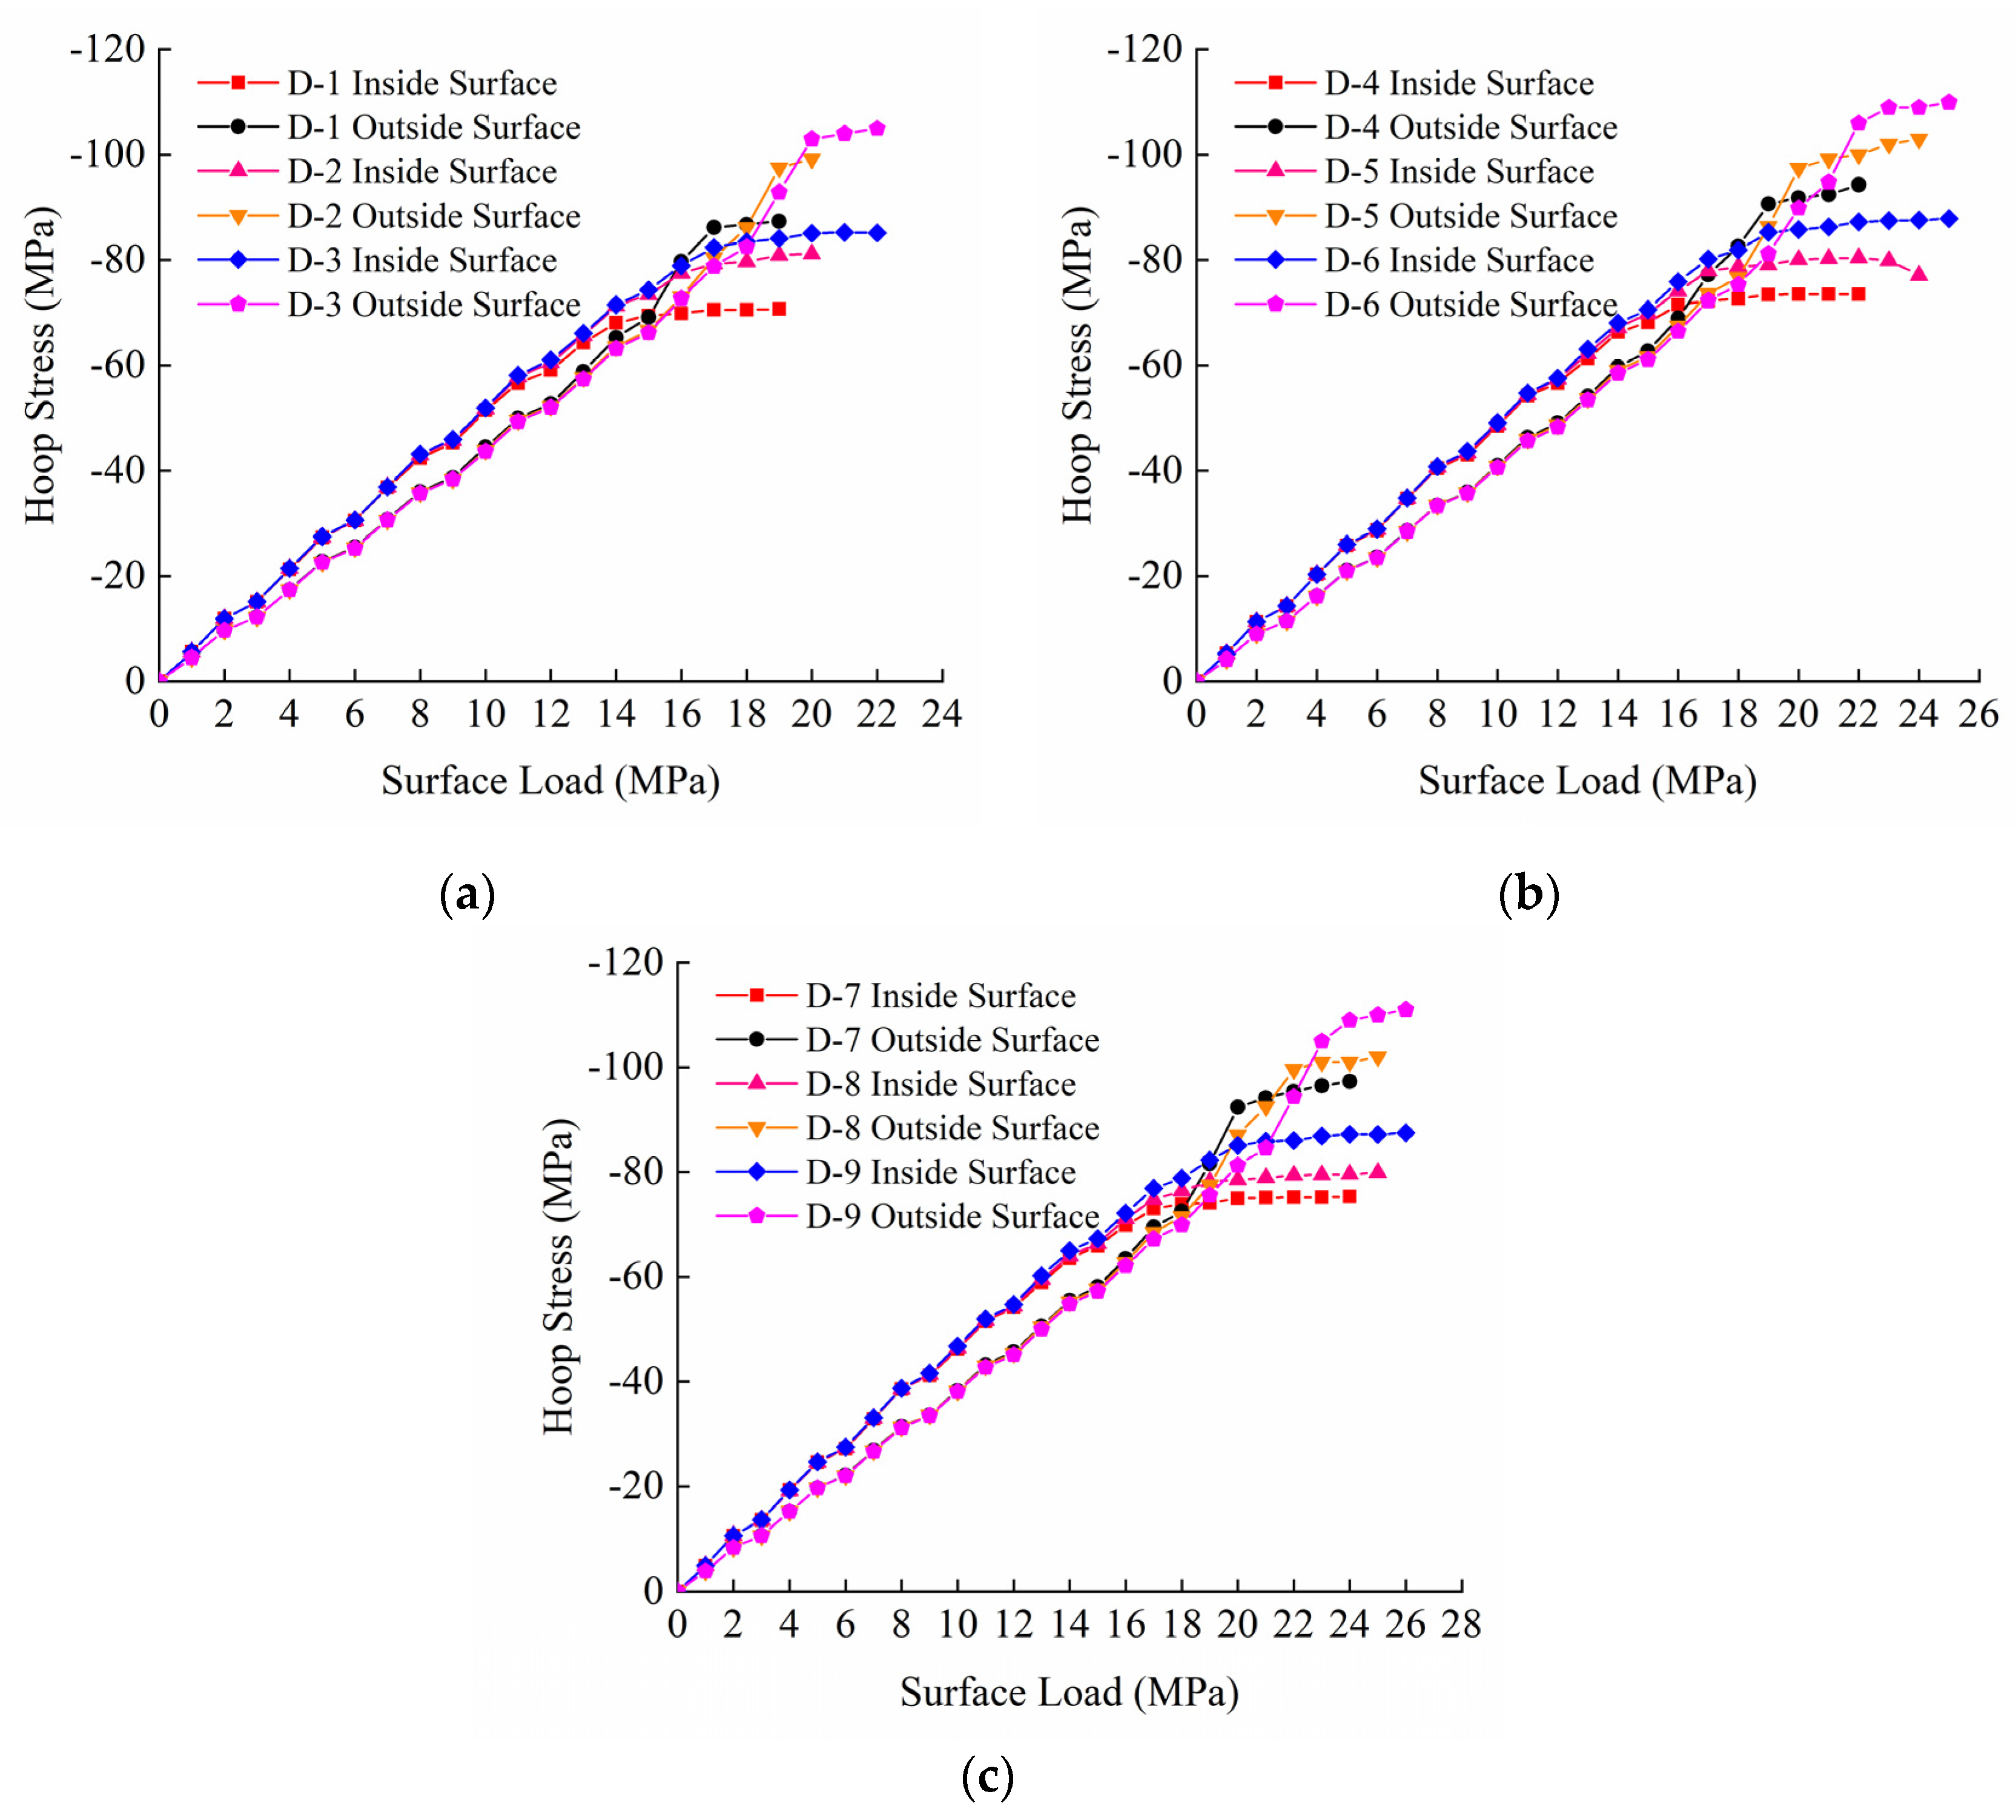
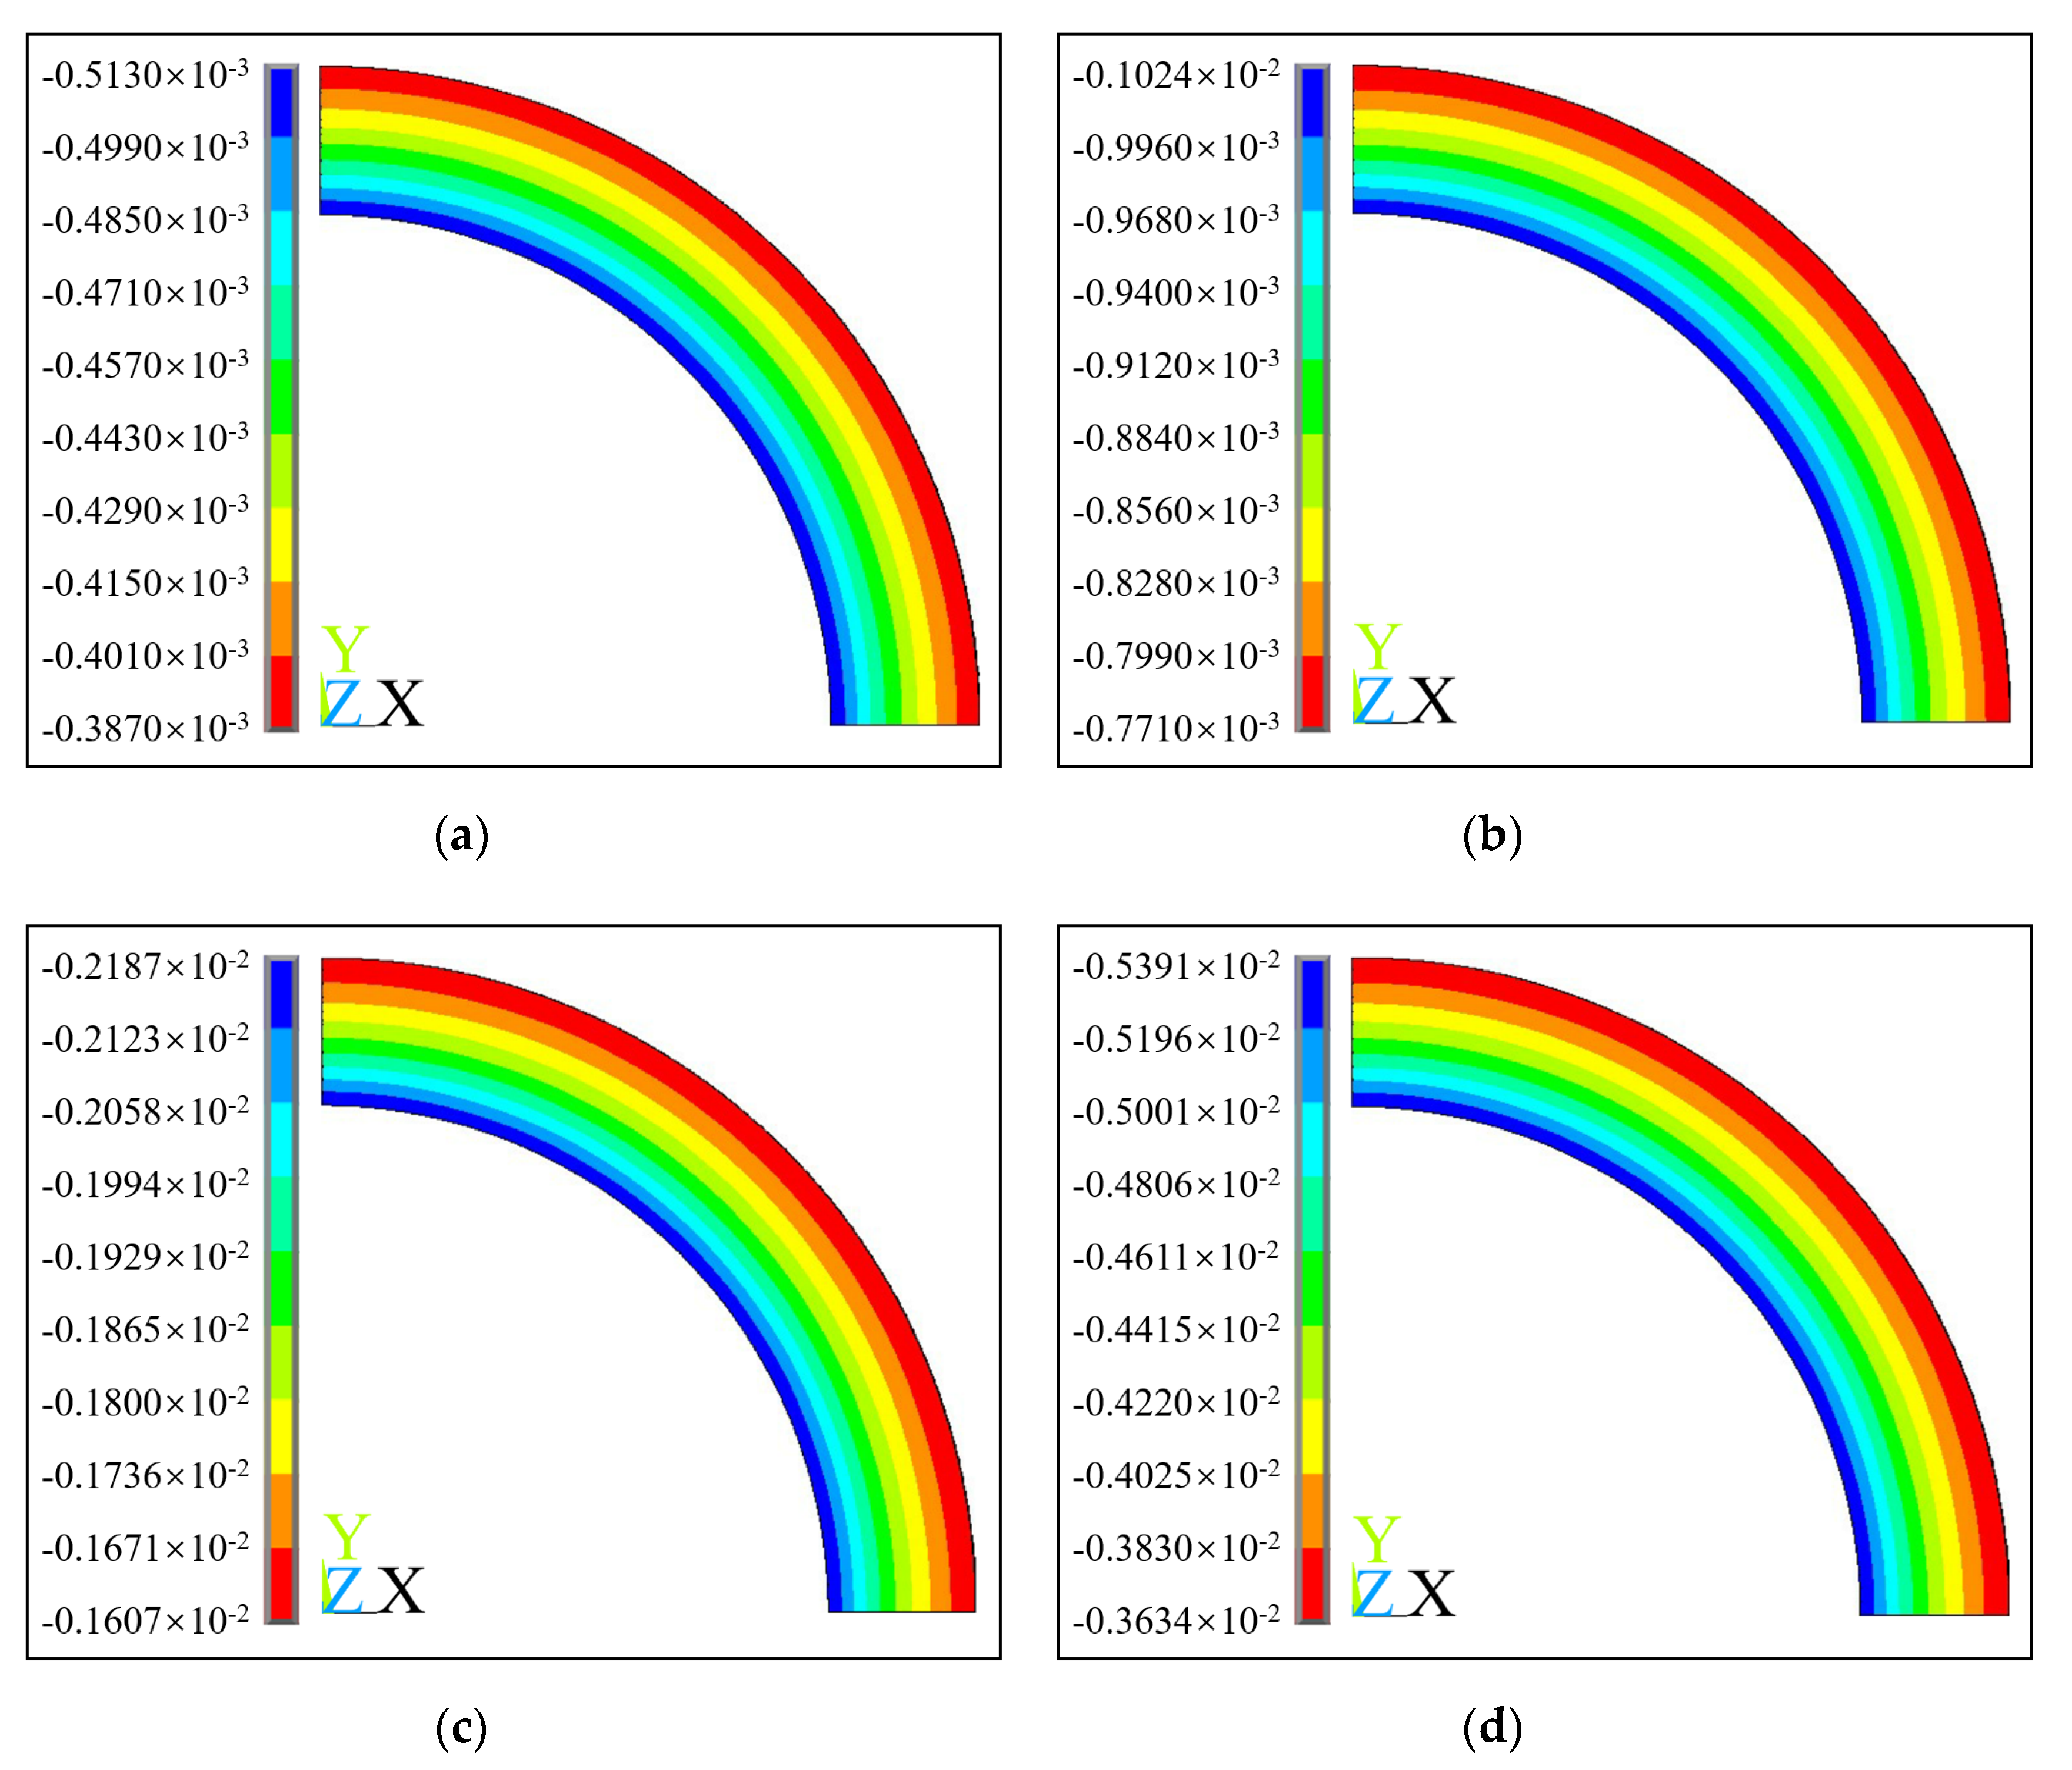
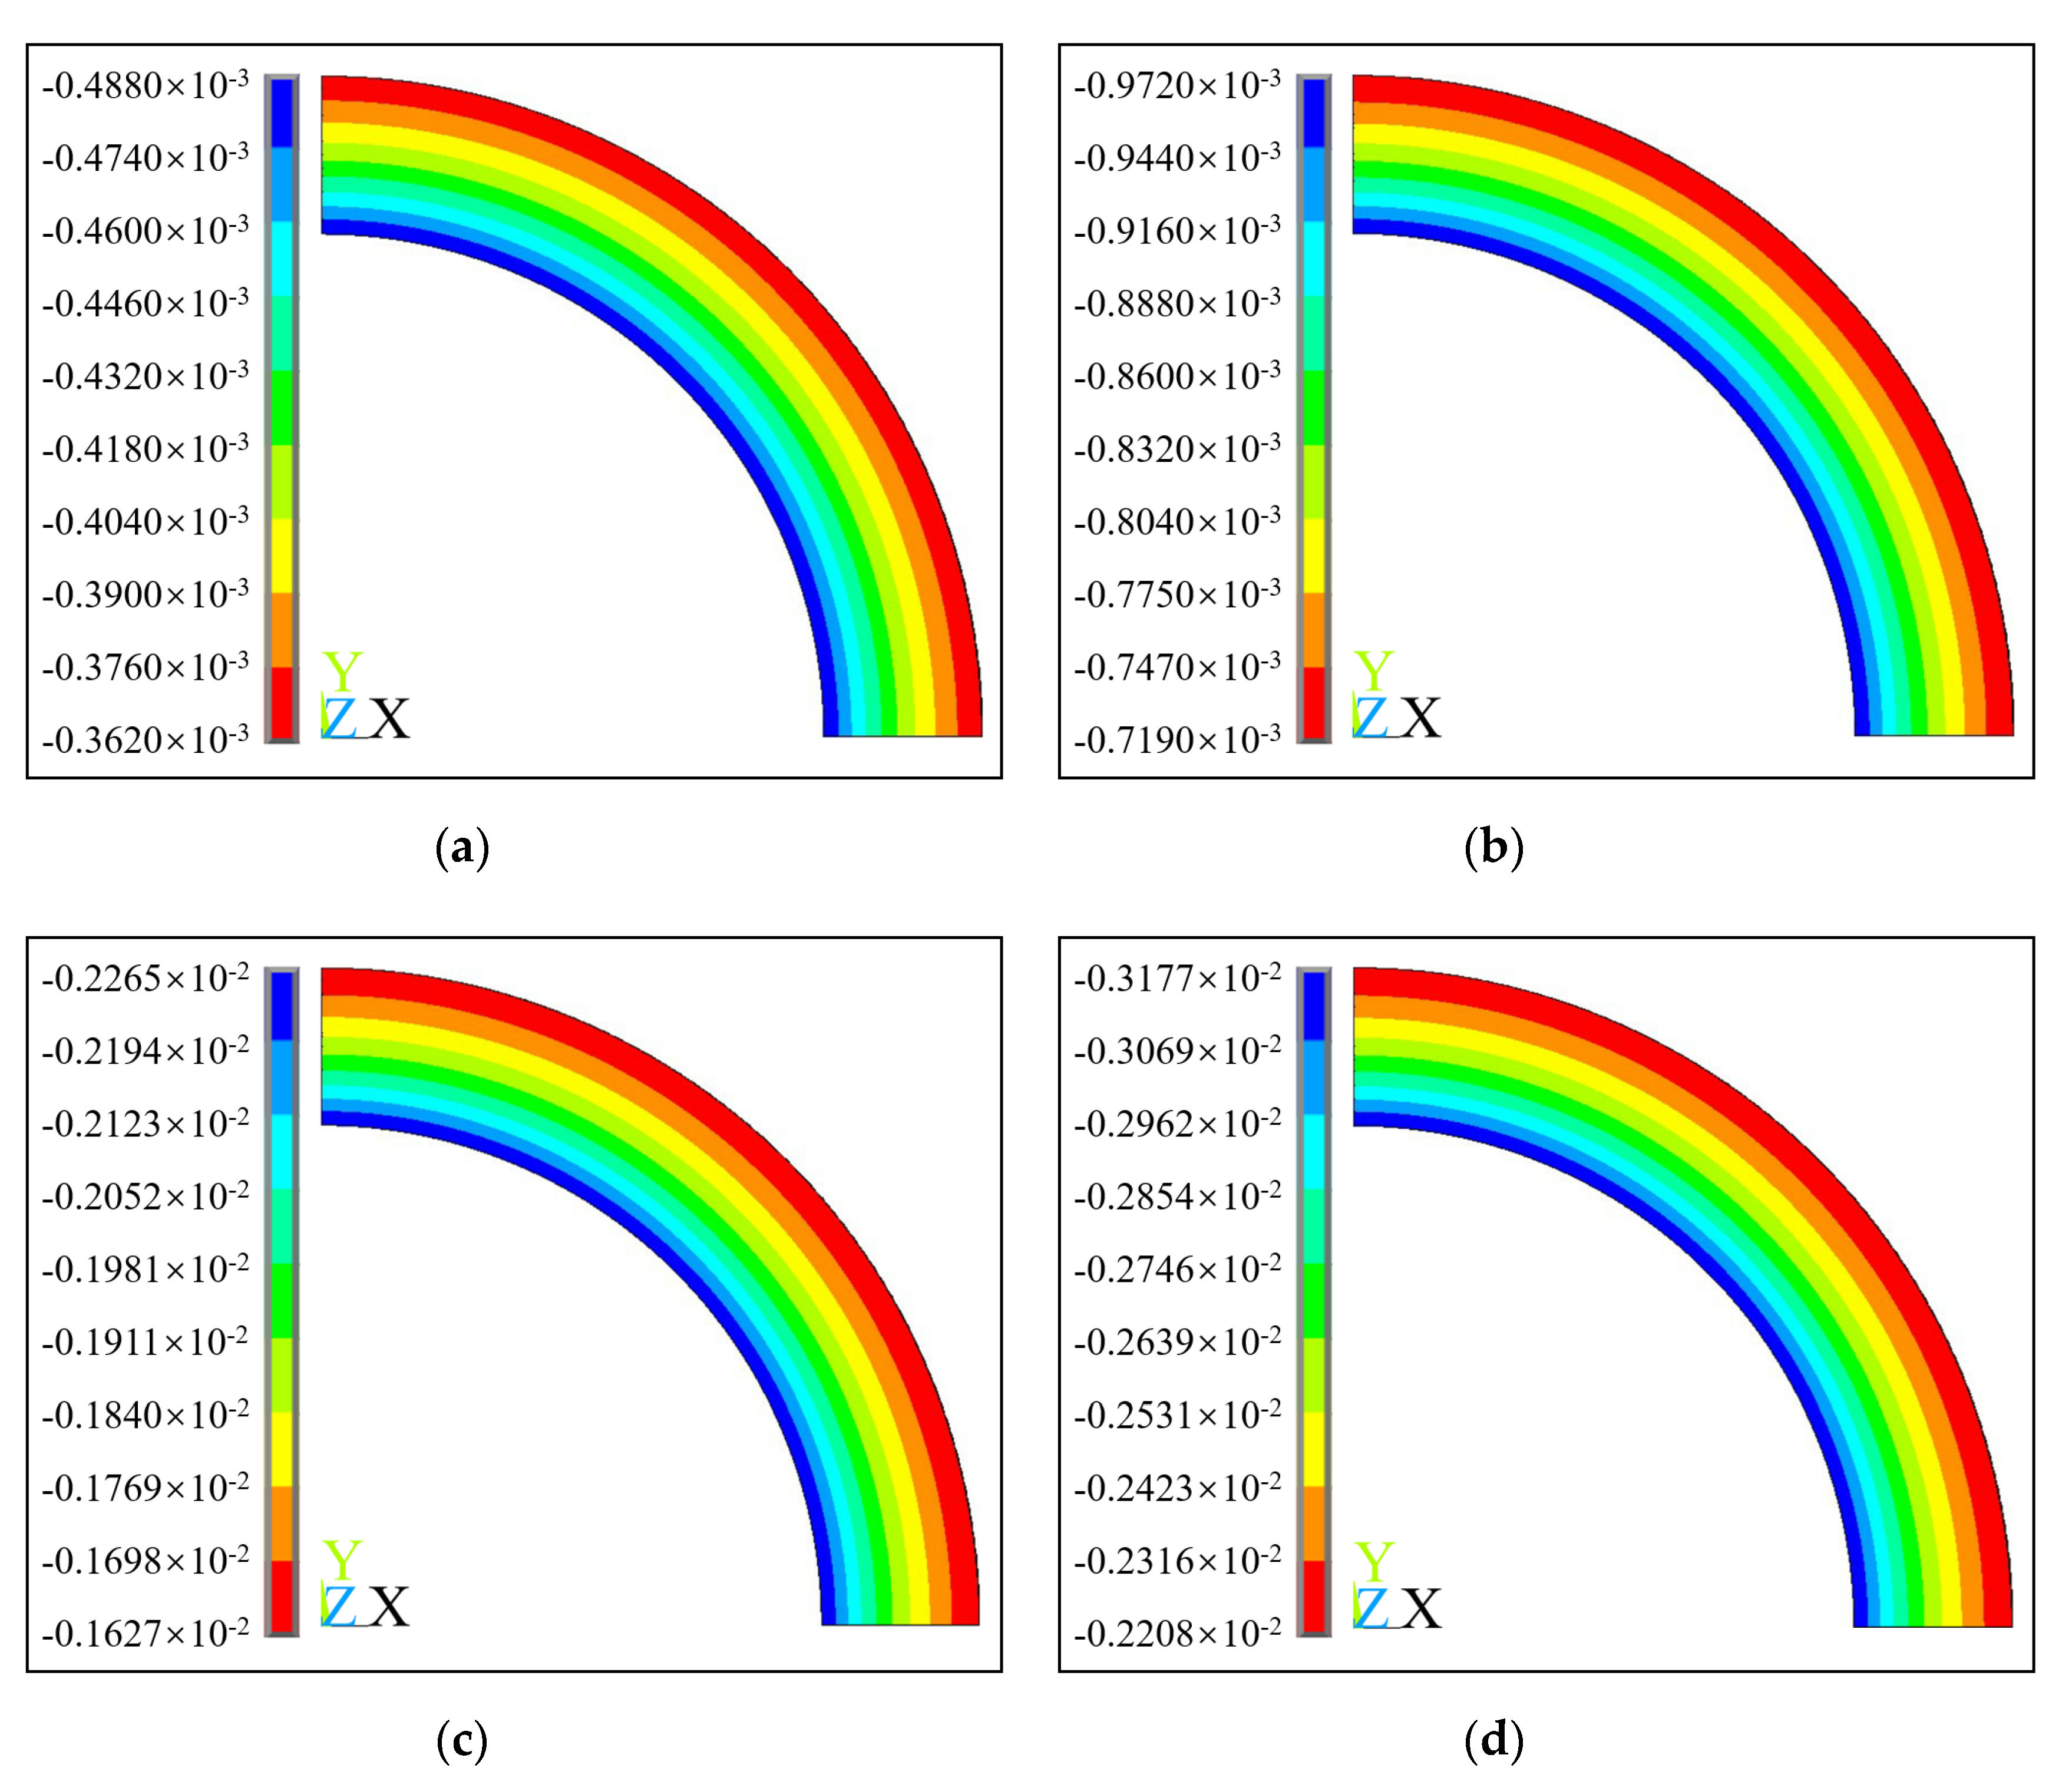
  • From the hoop stress surface load curve and hoop strain surface load curve obtained from the numerical simulation, it can be seen that the maximum hoop stress gradually increases with the surface load, showing a trend of gradual transition from the inside surface to the outside surface. When the shaft lining is broken, the hoop stress at the outside surface is greater than that at the inside surface. The hoop strain at the inside and outside surfaces of the shaft lining is always a compressive strain, and the hoop strain at the inside surface is always greater than that at the outside surface.
  • The results of numerical simulation show that the compressive strength of concrete is improved to a certain extent because the concrete in the inside and outside surfaces of the shaft lining model is in a bidirectional compression state and three-dimensional compression state, respectively. When the shaft lining is damaged, the maximum hoop stress values of concrete on the inside and outside surfaces of each shaft lining reach 87.8 MPa, 97.5 MPa, 105 MPa, 92.5 MPa, 103 MPa, 111 MPa, 97.3 MPa, and 103 MPa, respectively. The maximum hoop stress exceeds the uniaxial compressive strength of this kind of concrete.
  • According to the results of numerical simulation, an empirical formula for the ultimate capacity of the HFRC shaft lining was obtained by fitting, and the rationality of the empirical formula was verified by the shaft lining model test. The maximum relative error between the calculated value of the shaft lining ultimate capacity and the test value is only 6.69%, and the relative error is small, which provides a reference for designing this type of shaft lining structure.
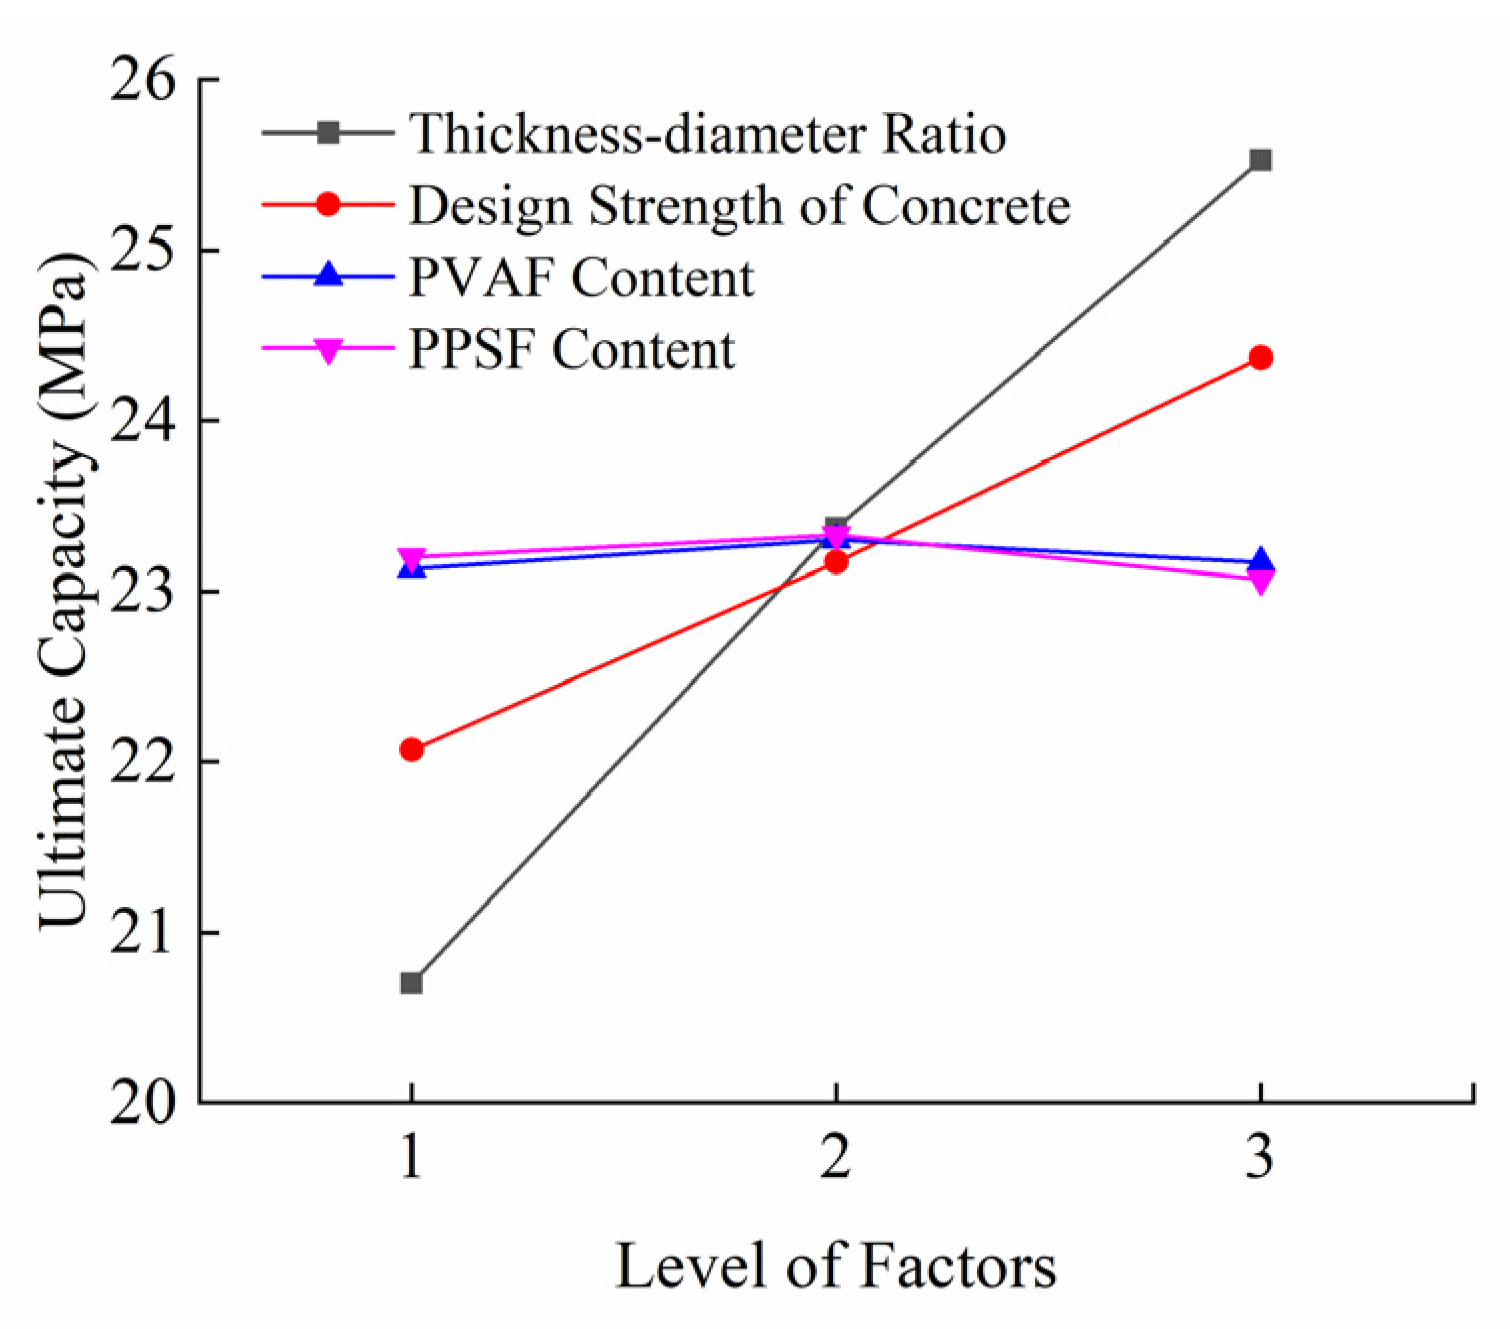
  • The order of influence on the ultimate capacity of this kind of HFRC shaft lining structure is the thickness–diameter ratio, design strength of concrete, PPSF content and PVAF content. The ultimate capacity of the shaft lining structure markedly increases with the increase in the thickness–diameter ratio and the design strength of the concrete. However, the increase in the amount of hybrid-fiber cannot significantly enhance the ultimate capacity of the shaft lining structure, and the effect of adding more fibers is slightly worse. Therefore, the optimal blending amount of hybrid-fiber is 1.092 kg/m3 of PVAF and 5 kg/m3 of PPSF.

Author Contributions

Design and manuscript writing, X.W.; methodology and validation, H.C.; data analysis and collection, T.W.; guidance and revision of manuscript, Z.Y.; drawing and tabulating, X.H. All authors have read and agreed to the published version of the manuscript.

Funding

This research was supported by the National Natural Science Foundation of China (No. 51674006) and the Anhui University discipline professional talented person (No. gxbjZD09), Anhui Provincial Natural Science Foundation Youth Project (1908085QE185), Anhui Provincial College of Natural Science Research Key Project (KJ2018A0098), Project funded by China Postdoctoral Science Foundation (2018M642502), and the Science Research Foundation for Young Teachers in Anhui University of Science and Technology (QN2017211).

Conflicts of Interest

The authors declare no conflict of interest.

References

  1. Zhang, T.; Yang, W.H.; Chen, G.H.; Huang, J.H.; Han, T.; Zhang, C. Monitoring and analysis of hydration heat temperature field for high performance mass concrete freezing shaft lining. J. Min. Saf. Eng. 2016, 33, 290–296. [Google Scholar]
  2. Yao, Z.S.; Cheng, H.; Zhang, G.Y.; Wang, X.Q. Research on site measurement of outer shaft wall stressing in freezing sinking shaft in special thick alluvium. Coal Sci. Technol. 2004, 32, 49–52. [Google Scholar]
  3. Song, L.; Yang, W.H.; Li, H.P. Monitoring of freezing shaft sinking in ultra-deep alluvium of guotun coal mine. J. Min. Saf. Eng. 2010, 27, 19–23. [Google Scholar]
  4. Xue, W.P.; Zhu, Q.; Yao, Z.S.; Song, H.Q.; Yang, L. Influence of high permeability pore water pressure on physical and mechanical properties of shaft lining concrete. J. Mater. Eng. 2019, 37, 262–265, 270. [Google Scholar]
  5. Xue, W.P.; Yao, Z.S.; Kong, G.; Xie, D.Z.; Wu, H. Experimental study on mechanical properties of shaft lining concrete under stress-seepage coupling. Bull. Chin. Ceram. Soc. 2018, 37, 985–989. [Google Scholar]
  6. Yao, Z.S.; Gao, Y.; Song, H.Q. Experimental study on crack control and anti-permeability of high performance concrete in freezing shaft lining. Bull. Chin. Ceram. Soc. 2014, 33, 918–922. [Google Scholar]
  7. Barr, B.; Newman, P.D. Toughness of polypropylene fibre-reinforced concrete. Composites 1985, 16, 48–53. [Google Scholar] [CrossRef]
  8. Noushini, A.; Samali, B.; Vessalas, K. Effect of poly vinyl alcohol (PVA) fibre on dynamic and material properties of fibre reinforced concrete. Constr. Build. Mater. 2013, 49, 374–383. [Google Scholar] [CrossRef]
  9. Zhang, R.; Jin, L.; Tian, Y.; Dou, G.; Du, X. Static and dynamic mechanical properties of eco-friendly polyvinyl alcohol fiber-reinforced ultra-high-strength concrete. Struct. Concr. 2019, 20, 1051–1063. [Google Scholar] [CrossRef]
  10. Liang, N.H.; Liu, X.R.; Sun, J. Experimental study of crack resistance of multi-scale polypropylene fiber reinforced concrete. J. China Coal Soc. 2012, 37, 1304–1309. [Google Scholar]
  11. Banthia, N.; Gupta, R. Hybrid fiber reinforced concrete (HyFRC): Fiber synergy in high strength matrices. Mater. Struct. 2004, 37, 707–716. [Google Scholar] [CrossRef]
  12. Kang, S.T.; Jeong, C.; Kyung-Taek, K.; Seok, L.K.; Yeon, L.B. Hybrid effects of steel fiber and microfiber on the tensile behavior of ultra-high performance concrete. Compos. Struct. 2016, 145, 37–42. [Google Scholar] [CrossRef]
  13. Sanchayan, S.; Foster, S.J. High temperature behaviour of hybrid steel–PVA fibre reinforced reactive powder concrete. Mater. Struct. 2016, 49, 769–782. [Google Scholar] [CrossRef]
  14. Yao, Z.S.; Li, X.; Fu, C.; Xue, W.P. Mechanical Properties of Polypropylene Macrofiber-Reinforced Concrete. Adv. Mater. Sci. Eng. 2019, 2019, 7590214. [Google Scholar] [CrossRef] [Green Version]
  15. Ramesh, B.; Gokulnath, V.; Krishnan, S.V. Influence of M-Sand in self compacting concrete with addition of glass powder in M-25 grade. Mater. Today Process. 2020, 22, 535–540. [Google Scholar]
  16. Yao, Z.S. An experimental study on steel fiber reinforced high strength concrete shaft lining in deep alluvium. Chin. J. Rock Mech. Eng. 2005, 24, 1253–1258. [Google Scholar]
  17. Qin, B.D.; Liu, X.L.; Liu, S.F. Experimental study on ultimate strength and failure features of shaft wall with hybrid fiber reinforced high strength concrete. Rail. Eng. 2017, 156–159. [Google Scholar]
  18. Yao, Z.S.; Li, X.; Wu, T.L.; Yang, L.; Liu, X.H. Hybrid-Fiber-Reinforced Concrete Used in Frozen Shaft Lining Structure in Coal Mines. Materials 2019, 12, 3988. [Google Scholar] [CrossRef] [Green Version]
  19. Qureshi, L.A.; Muhammad, U. Effects of Incorporating Steel and Glass Fibers on Shear Behavior of Concrete Column-Beam Joints. KSCE J. Civ. Eng. 2018, 22, 2970–2981. [Google Scholar] [CrossRef]
  20. Carozzi, F.G.; Milani, G.; Poggi, C. Mechanical properties and numerical modeling of Fabric Reinforced Cementitious Matrix (FRCM) systems for strengthening of masonry structures. Compos. Struct. 2014, 107, 711–725. [Google Scholar] [CrossRef]
  21. Radtke, F.K.F.; Simone, A.; Sluys, L.J. A computational model for failure analysis of fibre reinforced concrete with discrete treatment of fibres. Eng. Fract. Mech. 2010, 77, 597–620. [Google Scholar] [CrossRef]
  22. Jiao, L.; Tao, F. Bonding property and seismic behavior of reinforced concrete and finite element analysis. Arab. J. Geosci. 2020, 13, 45. [Google Scholar] [CrossRef]
  23. Palanivelu, S. Flexural Behaviour of a Cold-Formed Steel-Concrete Composite Beam with Channel Type Shear Connector—An Experimental and Analytical Study. Civ. Environ. Eng. Rep. 2019, 29, 228–240. [Google Scholar] [CrossRef] [Green Version]
  24. Xue, J. Crack Analysis of Reinforced Concrete Structure based on ANSYS. Int. J. Civ. Eng. Mach. Manu. 2019, 4, 27–33. [Google Scholar]
  25. Yao, Z.S.; Gui, J.G.; Cheng, H.; Rong, C.X. Numerical simulation of composite shift lining of inner steel cylinder and high strength reinforced concrete. J. Guangxi Univ. Nat. Sci. Ed. 2010, 35, 35–38. [Google Scholar]
  26. Wu, J. Study on Mechanical Characteristics of inner Shaft Lining at Frozen Shaft in West Area. Master’s Thesis, Anhui University Science Technology, Huainan, China, 2013. [Google Scholar]
  27. Lu, H.L.; Cui, G.X. Mechanical mechanism of shaft lining structure in thick alluvium. J. China Univ. Min. Technol. 1999, 28, 539–543. [Google Scholar]
  28. Cai, H.B.; Li, X.F.; Cheng, H.; Yao, Z.S.; Wang, F.; Qian, W.W. Research on the structure of shaft lining with asphalt block and steel-reinforced concrete at deep shaft ingate and its application. J. Min. Saf. Eng. 2018, 35, 27–33. [Google Scholar]
  29. Chinese Standard GB50010-2010. China Ministry of Housing and Urban-Rural Development. In Code for Design of Concrete Structures; China Architecture and Building Press: Beijing, China, 2013. (In Chinese)
Figure 1. Constitutive relationship of C-1 concrete under axial compression.
Crystals 10 00928 g001
Figure 2. (a) Mesh division of the shaft lining model; (b) boundary conditions of the shaft lining model.
Crystals 10 00928 g002
Figure 3. Hoop stress cloud diagrams of D-2 model shaft lining concrete under a surface load: (a) 5 MPa; (b) 10 MPa; (c) 17 MPa; (d) 20.9 MPa.
Crystals 10 00928 g003
Figure 4. Hoop stress cloud diagrams of D-5 model shaft lining concrete under a surface load: (a) 5 MPa; (b) 10 MPa; (c) 18 MPa; (d) 23.3 MPa.
Crystals 10 00928 g004
Figure 5. Hoop stress cloud diagrams of D-8 model shaft lining concrete under a surface load: (a) 5 MPa; (b) 10 MPa; (c) 19 MPa; (d) 25.3 MPa.
Crystals 10 00928 g005
Figure 6. Relationship between hoop stresses and surface loads of shaft lining: (a) D-1~3 (shaft thickness 97.6 mm); (b) D-4~6 (shaft thickness 104.2 mm); (c) D-7~9 (shaft thickness 110.5 mm).
Crystals 10 00928 g006
Figure 7. Hoop strain cloud diagrams of D-2 model shaft lining concrete under a surface load: (a) 5 MPa; (b) 10 MPa; (c) 17 MPa; (d) 20.9 MPa.
Crystals 10 00928 g007
Figure 8. Hoop strain cloud diagrams of D-5 model shaft lining concrete under a surface load: (a) 5 MPa; (b) 10 MPa; (c) 18 MPa; (d) 23.3 MPa.
Crystals 10 00928 g008
Figure 9. Hoop strain cloud diagrams of D-8 model shaft lining concrete under a surface load: (a) 5 MPa; (b) 10 MPa; (c) 19 MPa; (d) 25.3 MPa.
Crystals 10 00928 g009
Figure 10. Relationship between hoop strain and surface loads of the shaft lining: (a) D-1~3 (shaft thickness 97.6 mm); (b) D-4~6 (shaft thickness 104.2 mm); (c) D-7~9 (shaft thickness 110.5 mm).
Crystals 10 00928 g010
Figure 11. Shaft lining structure high-pressure loading device.
Crystals 10 00928 g011
Figure 12. The failure mode of the HFRC shaft lining model.
Crystals 10 00928 g012
Figure 13. Relationship between hoop strain and surface loads of the shaft lining.
Crystals 10 00928 g013
Figure 14. Relation curve of each factor and ultimate capacity of the shaft lining structure.
Crystals 10 00928 g014
Table 1. Mechanical parameters of concretes for shaft lining structures.
NO.Compressive Strength/MPaAxial Compressive Strength/MPaPeak Compressive Strain/μεElastic Modulus/MPa
C-180.662.162.124 × 1033.787 × 104
C-286.868.832.203 × 1033.838 × 104
C-389.773.112.246 × 1033.860 × 104
C-481.562.572.141 × 1033.784 × 104
C-584.168.122.182 × 1033.832 × 104
C-692.474.542.258 × 1033.875 × 104
C-778.261.452.137 × 1033.798 × 104
C-882.967.692.195 × 1033.825 × 104
C-990.773.682.269 × 1033.873 × 104
Table 2. Orthogonal design parameters for numerical simulation of shaft lining structures. PVAF, polyvinyl alcohol fiber; PPSF, polypropylene plastic steel fiber.
NO.Thickness-Diameter Ratio/λDesign Strength of Concrete/MPaPVAF Content/kg·m−3PPSF Content/kg·m−3
D-10.2675C700.7284
D-20.2675C751.0925
D-30.2675C801.4566
D-40.2908C701.0926
D-50.2908C751.4564
D-60.2908C800.7285
D-70.3140C701.4565
D-80.3140C750.7286
D-90.3140C801.0924
Table 3. The numerical ultimate capacity of shaft lining structure.
NO.Thickness–Diameter RatioConcrete Strength Grade/MPaPVAF Volume Fraction/%PPSF Volume Fraction/%Axial Compressive Strength of Concrete/MPaUltimate Capacity/MPa
D-10.2675C700.05640.439662.1619.5
D-20.2675C750.08470.549568.8320.9
D-30.2675C800.11290.659373.1121.7
D-40.2908C700.08470.659362.5722.2
D-50.2908C750.11290.439668.1223.3
D-60.2908C800.05640.549574.5424.6
D-70.3140C700.11290.549561.4524.5
D-80.3140C750.02640.659367.6925.3
D-90.3140C800.08470.439673.6826.8
Table 4. Design parameters of the hybrid-fiber-reinforced concrete (HFRC) shaft lining model.
NO.Inner Radius/mmThickness/mmThickness–Diameter RatioDesign Strength of Concrete/MPaReinforcement Ratio/%PVAF Content/kg·m−3PPSF Content/kg·m−3
D-I729.897.60.2675C700.61.0925
D-II716.6104.20.2908C750.61.0925
D-III704.0110.50.3140C800.61.0925
Note: The reinforcement ratio in the table is the hoop reinforcement ratio; the vertical reinforcement ratio is 0.3%; the reinforcement diameter is 5 mm.
Table 5. The ultimate capacity of the shaft lining structure in the model test.
NO.Thickness-Diameter Ratio/λDesign Strength of Concrete/MPaPVAF Volume Rate/%PPSF Volume Rate/%Axial Compressive Strength of Concrete/MPaUltimate Capacity/MPaRelative Error/%
Test Value/MPaCalculated Value/MPa
D-I0.2675C700.08470.549563.3523.622.026.69
D-II0.2908C750.08470.549569.2326.225.891.18
D-III0.3140C800.08470.549574.5928.729.944.32
Table 6. Factor optimization analysis.
Level of FactorsABCDOptimal CombinationOrder of Factors
Ultimate capacityk120.7022.0723.1323.20A3B3C2D2ABDC
k223.3723.1723.3023.33
k325.5324.3723.1723.07
R4.832.300.170.26

