Article

Role of Strain Reversal in Microstructure and Texture of Pure Al during Non-Monotonic Simple Shear Straining

1
Brunel Centre for Advanced Solidification Technology, Brunel University London, Uxbridge, Middlesex UB8 3PH, UK
2
Department of Materials Science and Engineering, Faculty of Engineering, Shahid Chamran University of Ahvaz, Ahvaz 61357-83151, Iran
3
Department of Materials Science and Engineering, School of Engineering, Shiraz University, Shiraz 71348-51154, Iran
4
Faculty of Metallurgical and Materials Engineering, Semnan University, Semnan 35131-19111, Iran
5
Department of Mechanical Engineering, Doshisha University, Kyotanabe, Kyoto 610-0394, Japan
*
Author to whom correspondence should be addressed.
Crystals 2020, 10(10), 926; https://doi.org/10.3390/cryst10100926
Submission received: 9 September 2020 / Revised: 2 October 2020 / Accepted: 8 October 2020 / Published: 12 October 2020
(This article belongs to the Special Issue Strain Reversal in Metals and Alloys: Origins and Consequences)

Abstract

:
The effect of reverse straining on the microstructure, texture, and hardness of the pure Al during the single cycle of the simple shear extrusion (SSE) process is investigated. Electron backscattering diffraction (EBSD), transmission electron microscopy (TEM), and scanning transmission electron microscopy (STEM) are used for microstructural evaluations. Due to the nature of the SSE process, the direction of the shear is reversed in the second half channel. As a result, the mean misorientation angle, dislocation density, and hardness decrease. The grain size increases to some extent in the exit of the channel compared with that in the middle. The structural evolution during the single pass of SSE is described in terms of the dislocation cancelling, “untangling” of the cell walls and disintegration of the “forward” cell structure due to the reverse straining in the second half channel. Some simple shear components replace the first texture component in the middle of the channel. At the exit of the channel, the primary texture components appear somewhat confirming the strain reversal effect in the second half channel.

Graphical Abstract

1. Introduction

When a material is loaded in tension and subsequently in compression, the yield stress in compression is lower than the tensile yield stress. This is called the Bauschinger effect [1]. The same effect occurs when the loading path is changed. For example, when the direction of torsion is reversed, the yield stress is less than the last one [2]. The strain reversal can also affect its impact on microstructure and mechanical behaviour. After strain reversing, the deformation behaviour of the material differs during forward and reverse straining. The competition between dislocation storage and the disappearance of the dislocations accumulated during the forward straining attribute to such action [3,4]. Though the reversal deformation mode cannot significantly affect the grain refinement, the strain reversal potentially delays the formation of high angle grain boundaries (HAGBs) compared with the monotonic deformation one [5,6]. Texture evolution in pure Al subjected to the monotonous and reversal mode in high pressure torsion (HPT) indicates a similar texture in low strain regimes. At the same time, significantly different behaviour is observed at high strain regimes [7]. The modelling of equal channel angular pressing (ECAP) proves that the texture can return to its initial random state when the strain path is reversed through route C (where the sample is rotated 180 degrees between passes) under the simple shear conditions [8]. However, the experimental results reveal that the shear texture is still observed, though the deformation mode is shear and is reversed every second pass [9].
The reversal deformation mode can also affect other microstructural features, such as martensitic transformation and austenite to ferrite transformation. The cyclic forward-reverse torsion accumulates lower dislocation density and less martensitic transformation compared with monotonic torsion under the same accumulative strain [10]. The strain reversal can delay the start of the austenite to ferrite transformation [11] and influence the evolution of austenite grain boundaries through inhomogeneous deformation, affecting the dynamic transformation [12]. The role of strain reversal on static recrystallization and precipitation kinetics [13,14] and the fracture behaviour [15,16,17] has also been documented by other researchers.
The strain reversal takes place during several processing routes such as the cyclic tension-compression [18,19], cyclic torsion [20,21,22], cyclic HPT [7,23,24,25], ECAP [6,8,9], and simple shear extrusion (SSE) [26,27,28]. Among many processing routes that involve reverse straining, SSE is the newest, and more detailed studies need to be done to understand this phenomenon. The previous works consider the SSE process mainly as a severe plastic deformation (SPD) method with the capability of grain refinement [29,30,31,32,33,34,35]. Less attention has been paid to the strain reversal feature of the process. The strain reversal effect in the SSE process has been previously evaluated just in Cu and twinning-induced plasticity steel (TWIP) steal as a medium [36,37,38] and a low stacking fault energy (SFE) material [39], respectively. The SFE can affect the degree of reversibility of dislocation slip and the resulting microstructural evolution. Therefore, the impact of reverse straining on a material with a high SFE during a single pass of SSE needs to be investigated. In the present work, pure Al, a typical high SFE material, is conducted through the SSE process. The microstructure, texture, and hardness of the pure Al after forward and shear reversing is investigated during a single pass of SSE as a non-monotonic simple shear straining mode.

2. Materials and Methods

A bisection SSE die with maximum distortion (αmax) and inclination (βmax) angles of 45° and 22.2°, respectively, was used for SSE processing. The cross-section had a square shape at the channel inlet, changing to a parallelogram with a maximum distortion angle in the middle, and restoring to the square at the outlet (Figure 1a). The material’s microstructure characterization in the deformation zone was examined at three different locations (Figure 1b) named as annealed, forward-shear, and reverse-shear segment through this article. The die has a square cross-section with a 10 mm side length and the deformation channel length of 24.2 mm. The AA1060 aluminium alloy billets with dimensions of 10   mm × 10   mm × 50   mm were machined and annealed for 2 h at 620 °C and then cooled gradually in the furnace to reach the room temperature. The chemical composition of the Al samples used in the present study is given in Table 1. All samples were wrapped with polytetrafluoroethylene (PTFE) tape, and tools were sprayed by a silicon-based lubricant in order to reduce the friction.
For a SSE process with the αmax = π/4, the shear strain, γ, in the forward-shear segment is given by tan (αmax) [26]. The same shear strain was accumulated in the reversed-shear segment. According to the Mises criterion, the equivalent strain was calculated by γ / 3 . Therefore, the segments in the entrance (unstrained/annealed), in the middle (forward-shear segment), and in the exit of the channel (reverse-shear segment) experienced an equivalent strain of 0, 0.575, and 1.15 respectively. While the forward-shear segment experienced the highest amount of forward shear, the reverse-shear segment was affected by the highest amount of the reverse strain.
The microstructure of each segment was investigated by electron backscattering diffraction (EBSD) (JEOL Ltd., Tokyo, Japan), transmission electron microscopy (TEM) (JEOL JEM-2100F, JEOL Ltd., Tokyo, Japan), and scanning transmission electron microscopy (STEM) (JEOL JEM-2100F, JEOL Ltd., Tokyo, Japan). For the EBSD, each segment was ground and polished by cloths and a suspension of Al2O3. Then, the obtained surfaces were electrically polished in 20% HClO4-80% C2H5OH using a DC voltage of 35 V for 20 s at 273 K. EBSD observations were undertaken by a JEOL 7001F SEM equipped with a field emission gun, running at 20 kV. The INCA suite 4.09 software package (Oxford Instruments, Abingdon, UK) was used for the analysis of the EBSD data. For TEM studies, specimens were cut from the central region of each segment by application of a microcutter. After polishing of the specimens’ surface to the thickness of 100 µm using abrasive papers, thinning by a twin-jet polishing Tenupole 5 facility (Struers Co., Ltd., Cleveland, UT, USA) using the same solution as that of EBSD sample preparation in the 35 V at 273 K. Then, the specimens were polished by an ion beam using a Gatan 691 precision ion polishing system (PIPS) (Gatan Inc., USA). A JEOL JEM-2100F TEM with an acceleration voltage of 200 kV was used for TEM observations.
Ham’s intersection method was used to evaluate internal dislocation density [40]. By this method, the detectable dislocations in the grains are identified by the STEM. A grid is placed on the STEM image of a grain, fulfilling the diffraction condition. By measuring the overall length of the grid, L, and counting the number of intersections, m, of the grid with dislocations, the dislocation density was calculated through ρ = 2 m / L t where t is the thickness of the TEM foil. The TEM foil thickness was approximated from the thickness fringes in the high angle grain boundaries [41]. The extinction distance was determined to measure the foil thickness. The relationship between the reflection and the extinction distance for Al is given in Ref. [42]. Three grains with different crystallographic orientations were detected at the central region of each sample for the dislocation density measurements.
Hardness tests were used to investigate the effect of microstructural changes on the mechanical properties of each segment. Vickers microhardness was performed by applying 100 g for 15 s of dwell time on a polished surface. It is noted that the non-standard cutting may result in the trimmed surface state and affect the testing results [43]. However, the authors used the hardness test, not tensile testing, to evaluate the mechanical properties of the processed samples. Therefore, the effect of the sample preparation method is not applicable here.

3. Results

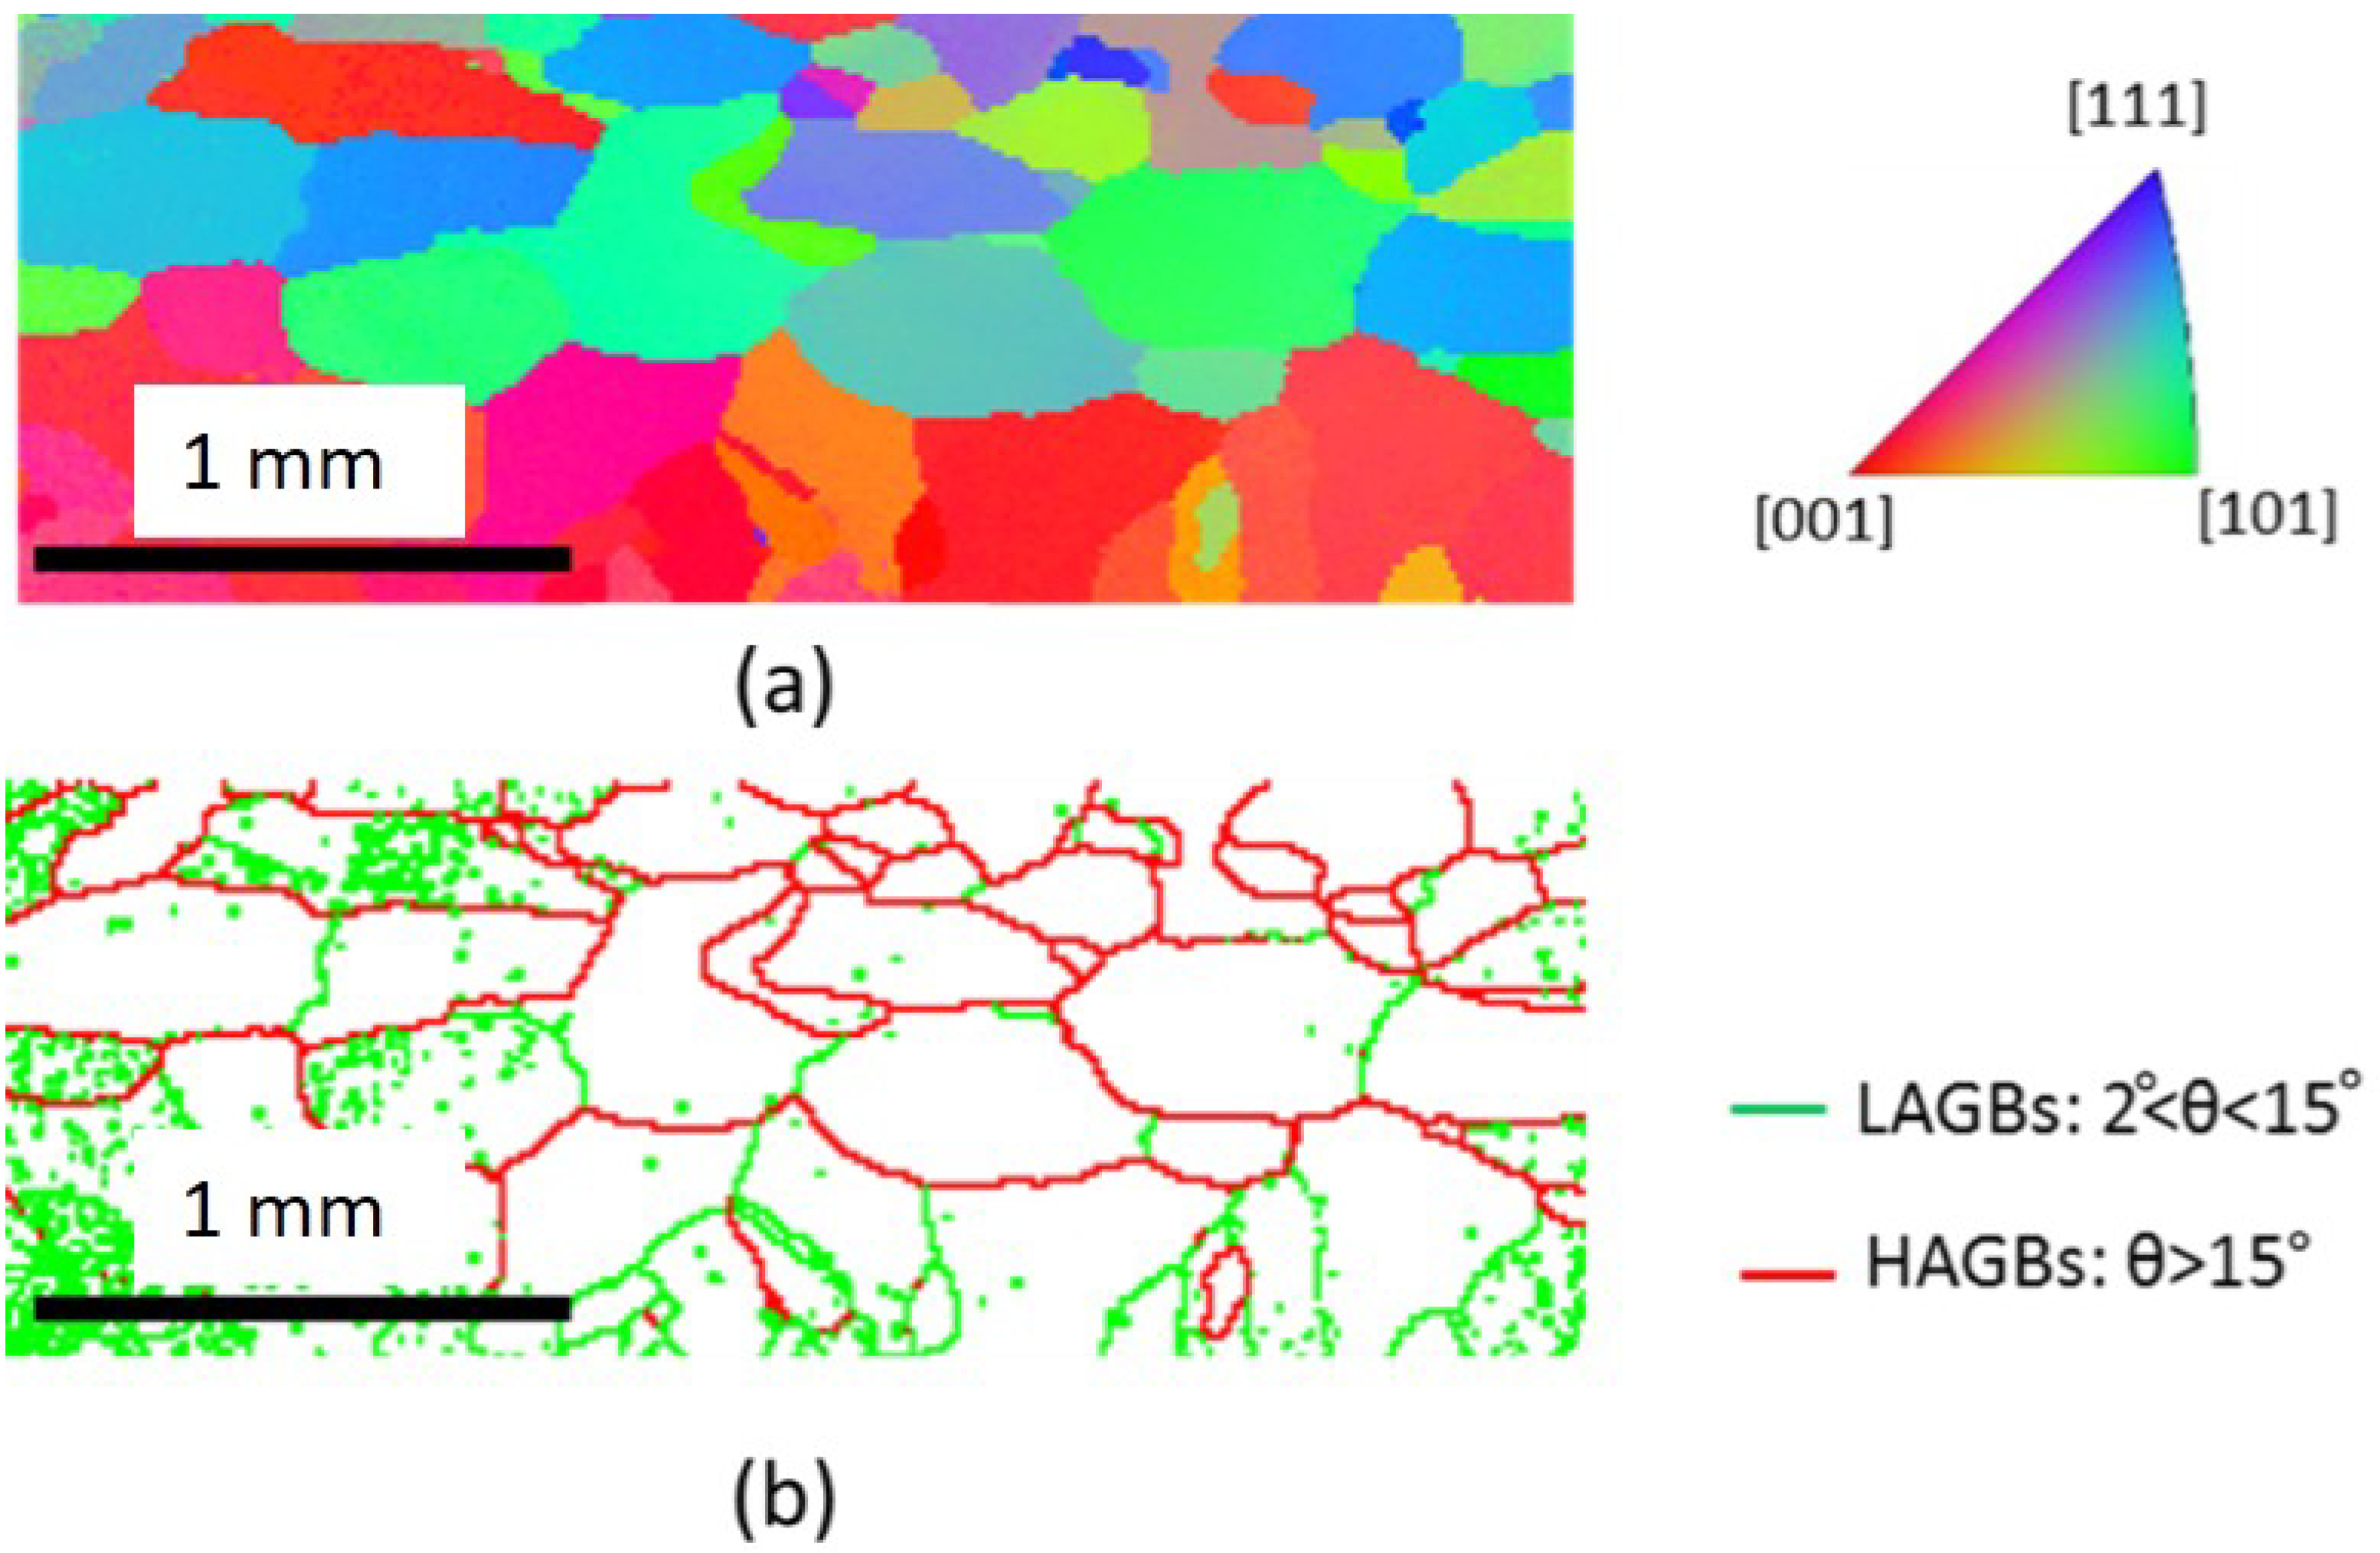
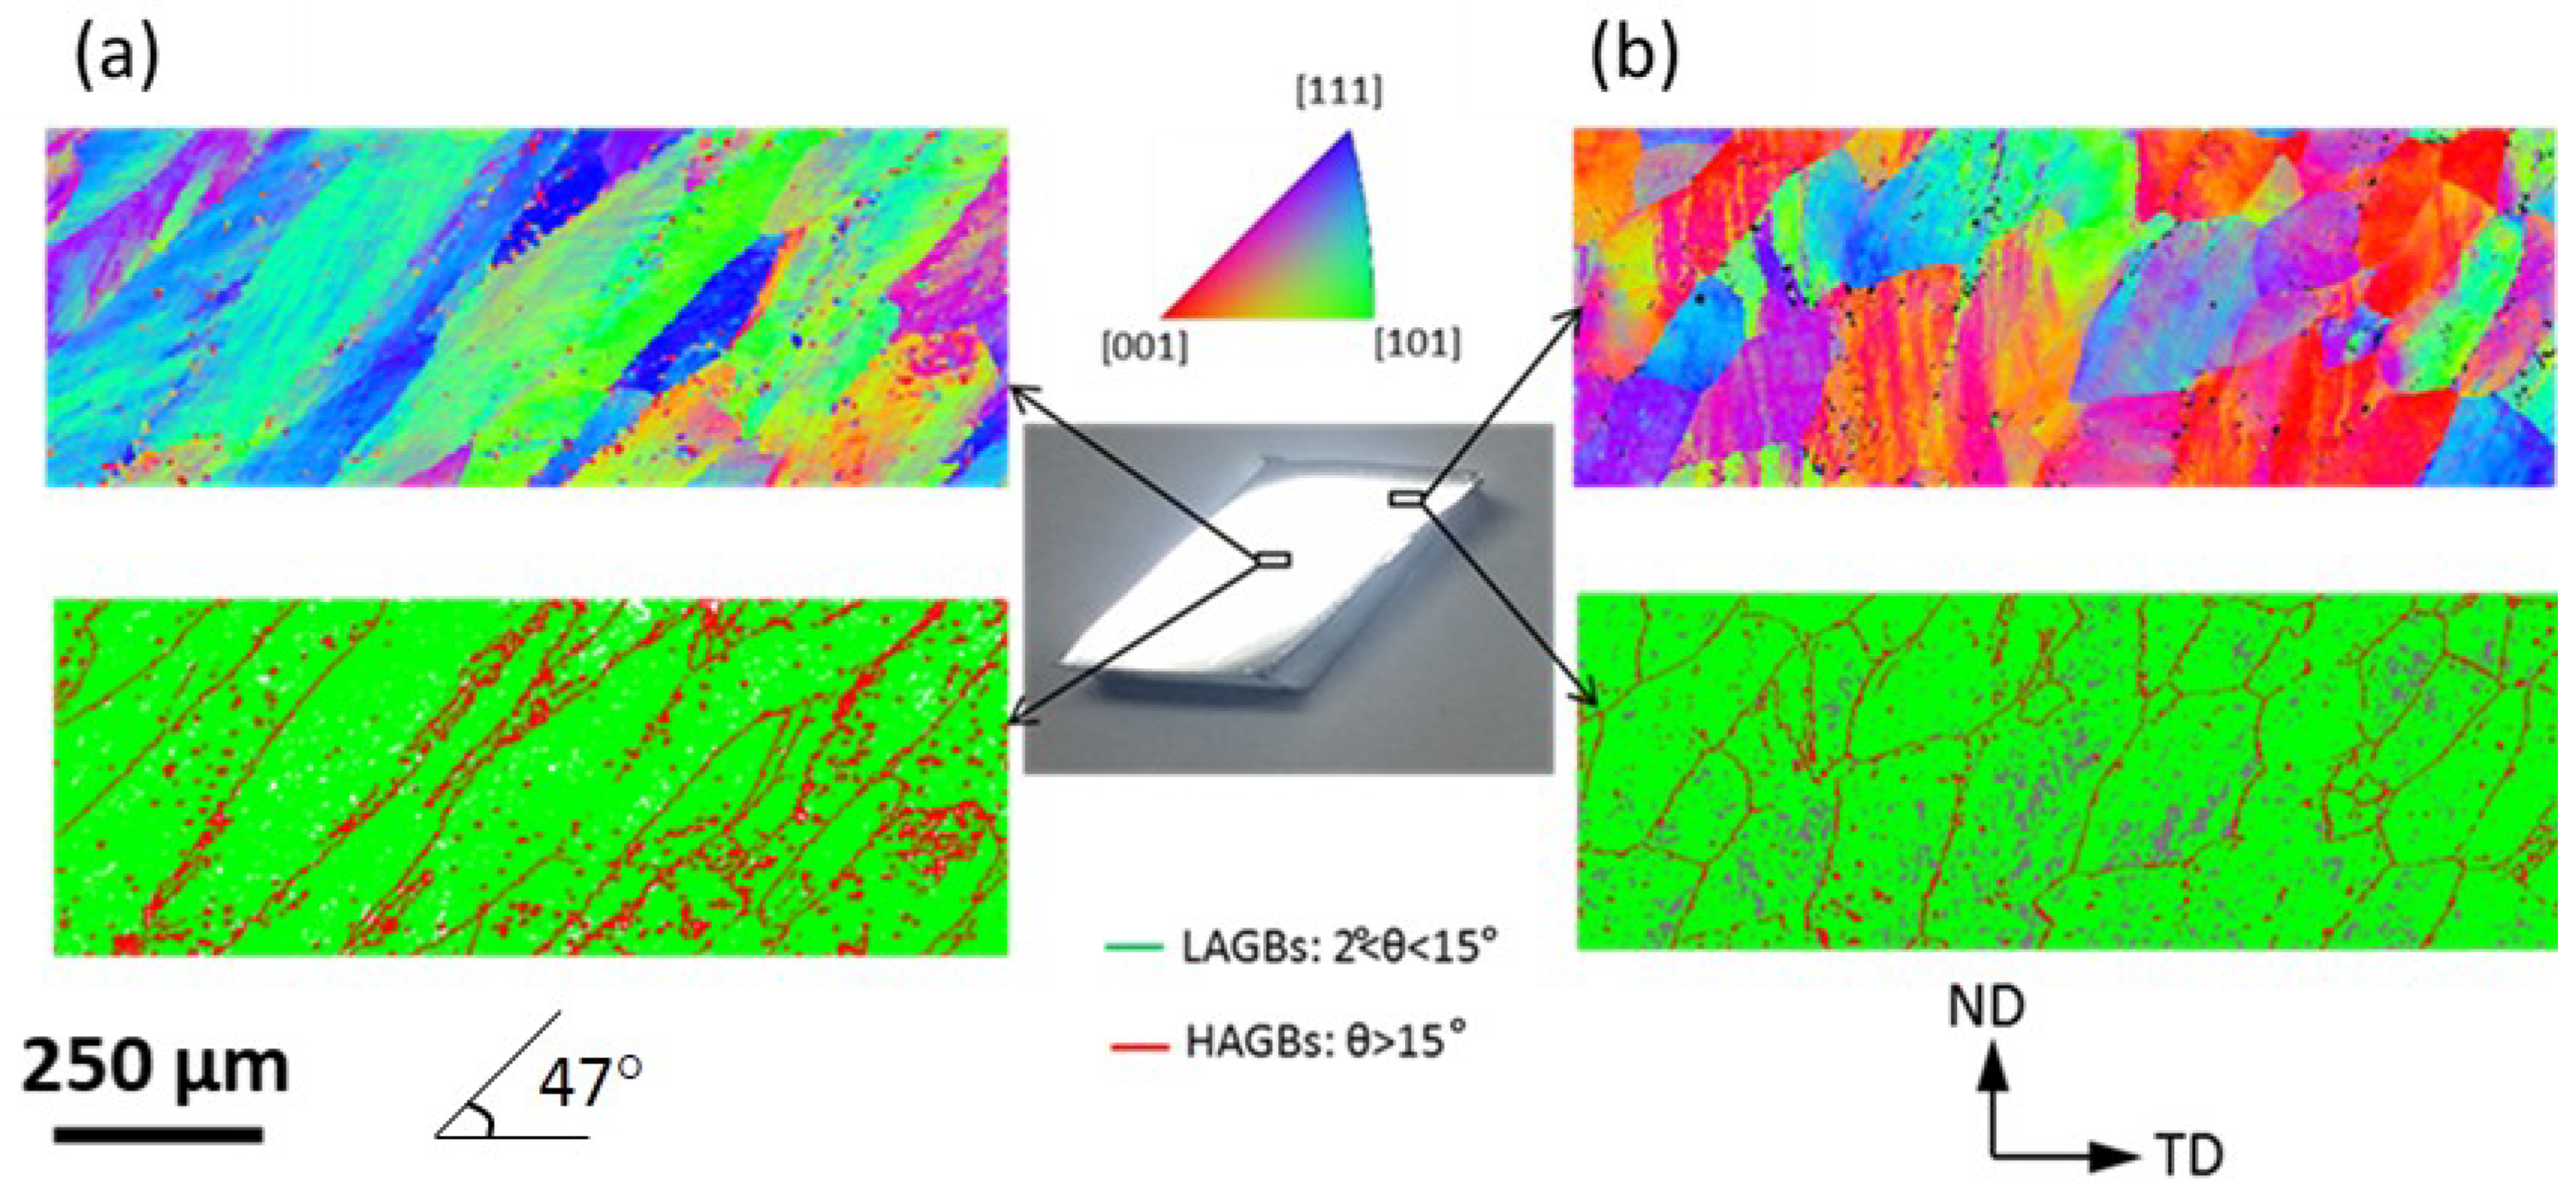
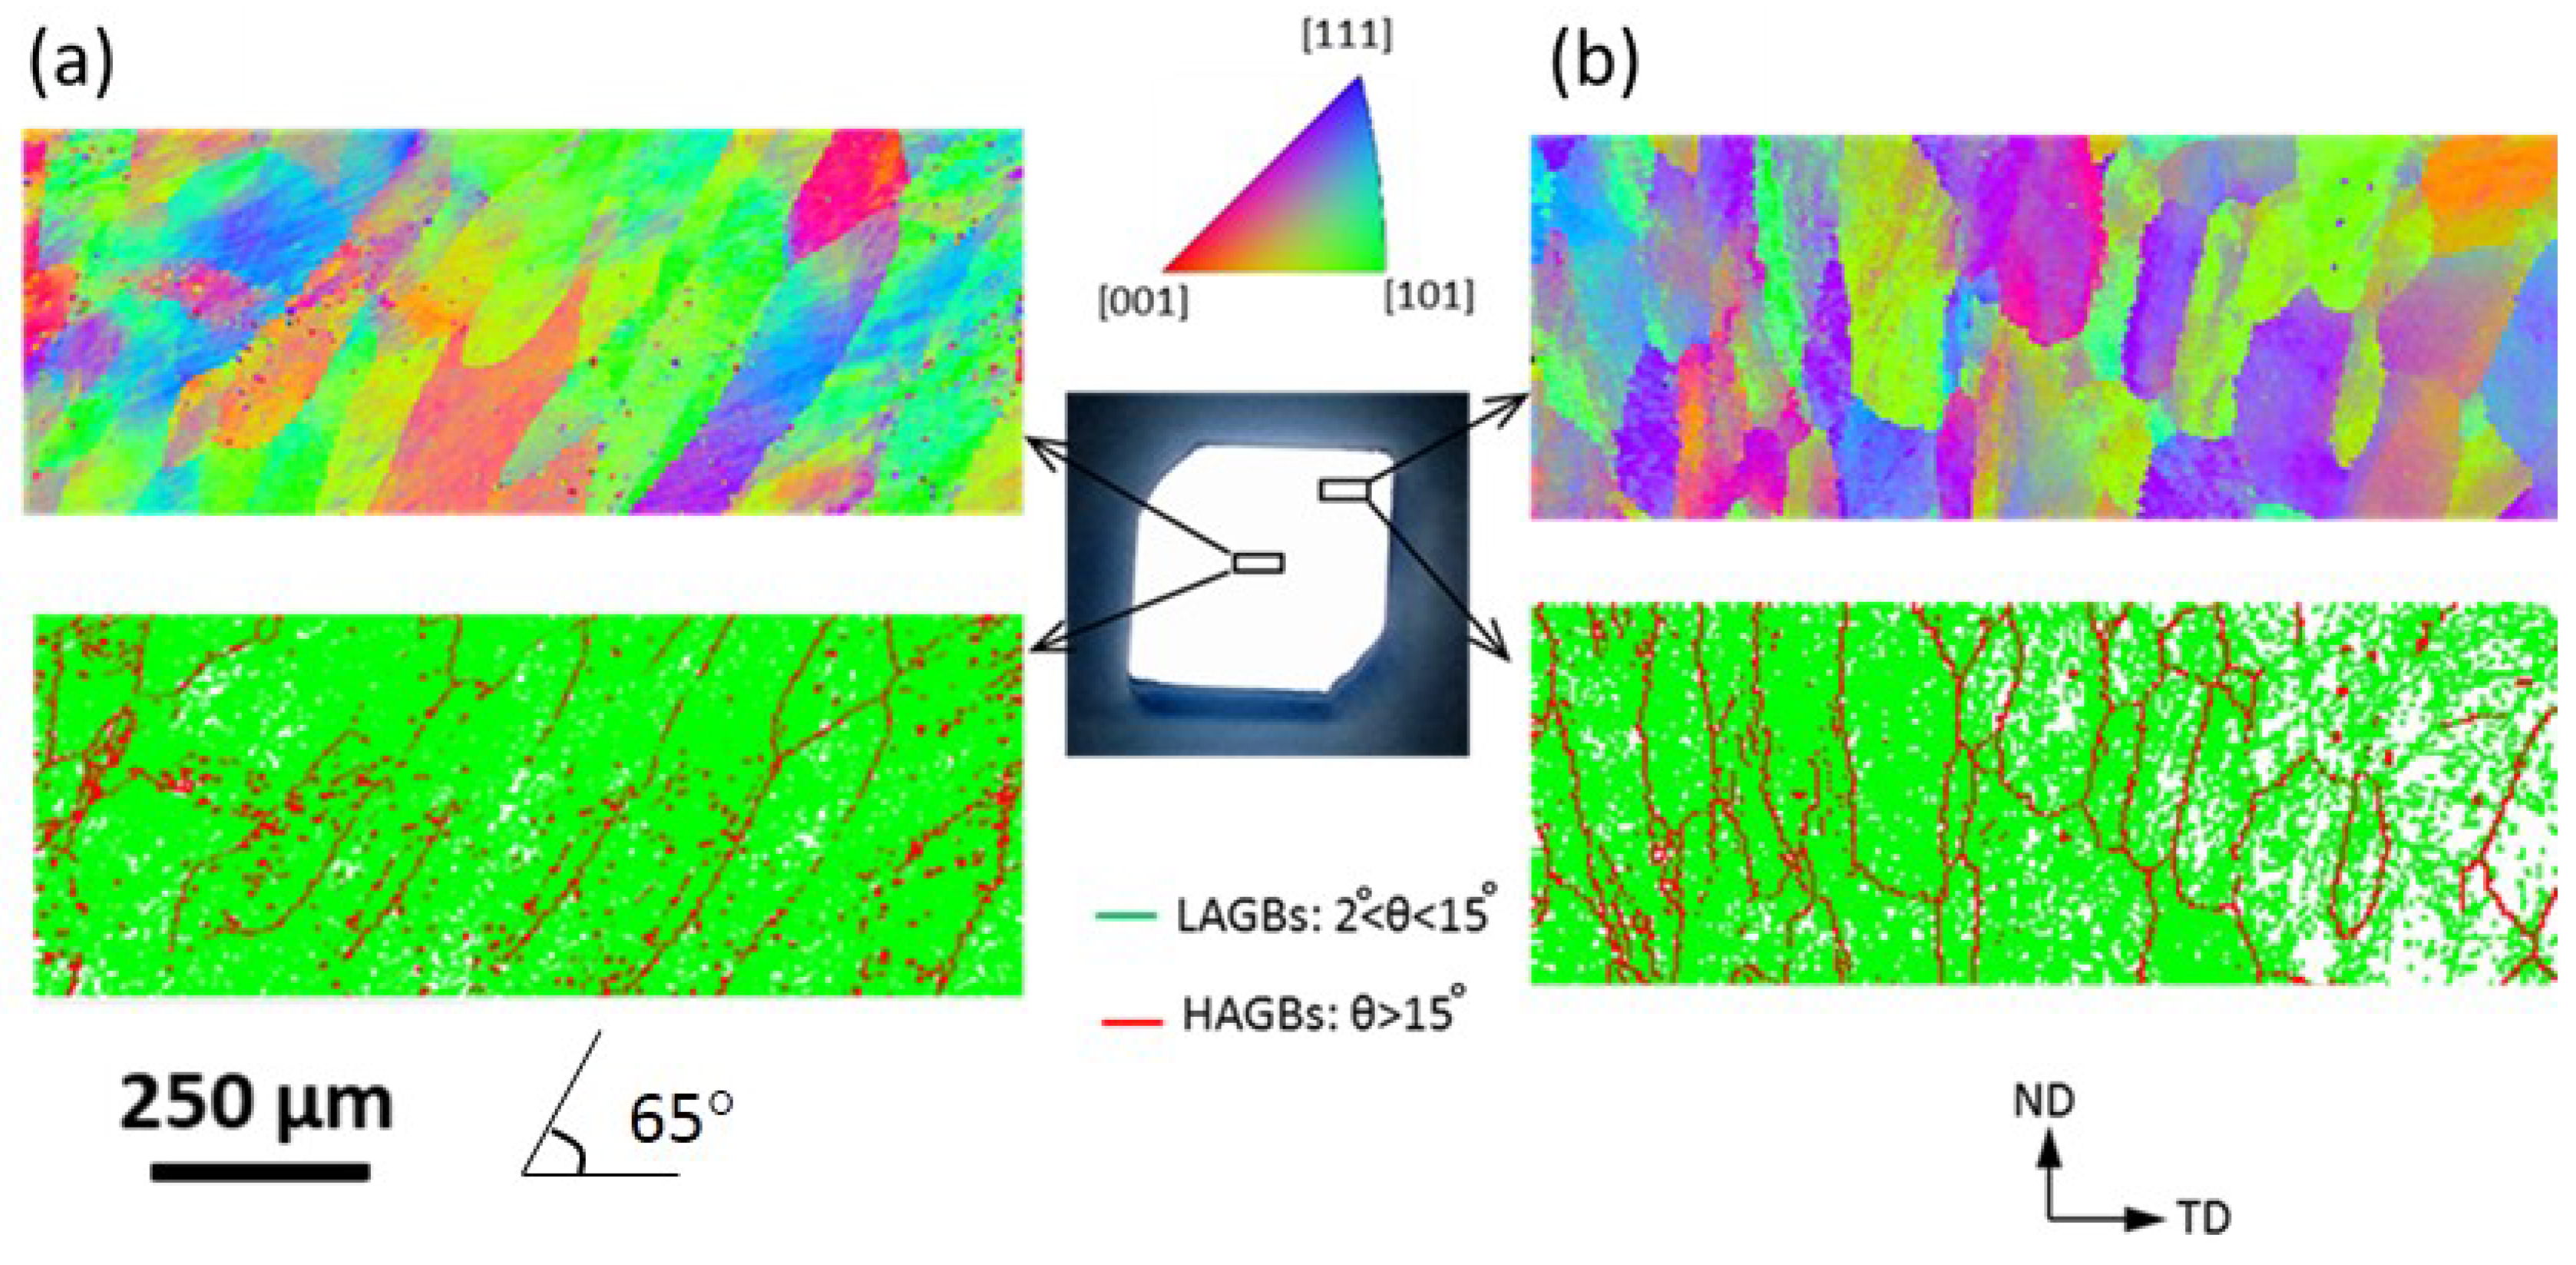
3.1. EBSD Characterisation

Figure 2 shows the initial EBSD colour (Figure 2a) and boundary (Figure 2b) map of the Al sample before the SSE process. Under the fully annealed conditions, the grains were mainly equiaxed and large (with a size of about 240 µm). The colour map indicates a somewhat random texture, and the boundary map shows that the fraction of high angle grain boundaries (HAGBs) was more than 60%.
The colour and the boundary misorientation maps of the forward- and reverse-shear segments are presented in Figure 3 and Figure 4 respectively. The geometry of the forward- and reverse-shear segments were parallelogram (Figure 3) and nearly square (Figure 4) in shape, respectively. The reason for the aforementioned cross-sectional changes was the reversion of the shear direction occurred in the second half of the SSE channel. The complete square-shape of the cross-section was more likely to be achieved in the presence of sufficient backpressure [26]. The microstructure of these two segments was characterized both at the central and peripheral regions. In the central part of the forward-shear segment (Figure 3a), most grains were elongated and oriented about 47° to the transverse direction (TD) direction. In a die with maximum distortion angle of 45°, the theoretical analysis [30] demonstrated that the angle between the maximum principal strain and transverse direction would be 31.7° (about 32°). The deviation from ideal calculation might be due to the insufficient backpressure, friction resistance to metal flow in the transverse direction, and the assumption of homogeneous material properties in strain calculations; despite the fact that the local mechanical behavior varies from grain to grain. The grains at the periphery of the forward-shear segment (Figure 3b) are considerably less elongated since this area is more affected by friction. The fraction of HAGBs in the centre and periphery of the forward-shear segment were 8% and 15% respectively, suggesting that most of the grains both in the centre and in the periphery had low misorientation angles. The average grain size at the centre and periphery of the forward-shear segment were about 65 µm and 83 µm respectively. It is noted that the boundaries with low misorientation angles were not considered in grain size measurements, and the grain size evaluated by EBSD includes only the HAGBs.
The colour and the boundary misorientation maps of the reverse-shear segment at the central and peripheral regions are shown in Figure 4. The average grain size in the centre and periphery of the reverse-shear segment was about 81 µm and 98 µm respectively, which was larger than that of the forward-shear segment, indicating that some HAGBs were eliminated in the second half channel. Similar to the forward-shear segment, the grains at the centre were elongated while they were less elongated in the periphery. The elongation angle of grains in the reverse-shear segment increased to about 65° due to shear in the opposite direction in the second half channel. The fraction of HAGBs in the centre and periphery of the reverse-shear segment was 7.2% and 11.5%, respectively, which was lower than that measured in the forward-shear segment. It was consistent with the grain size measurements that show an increase in the grain size and the elimination of some HAGBs in the reverse-shear segment.

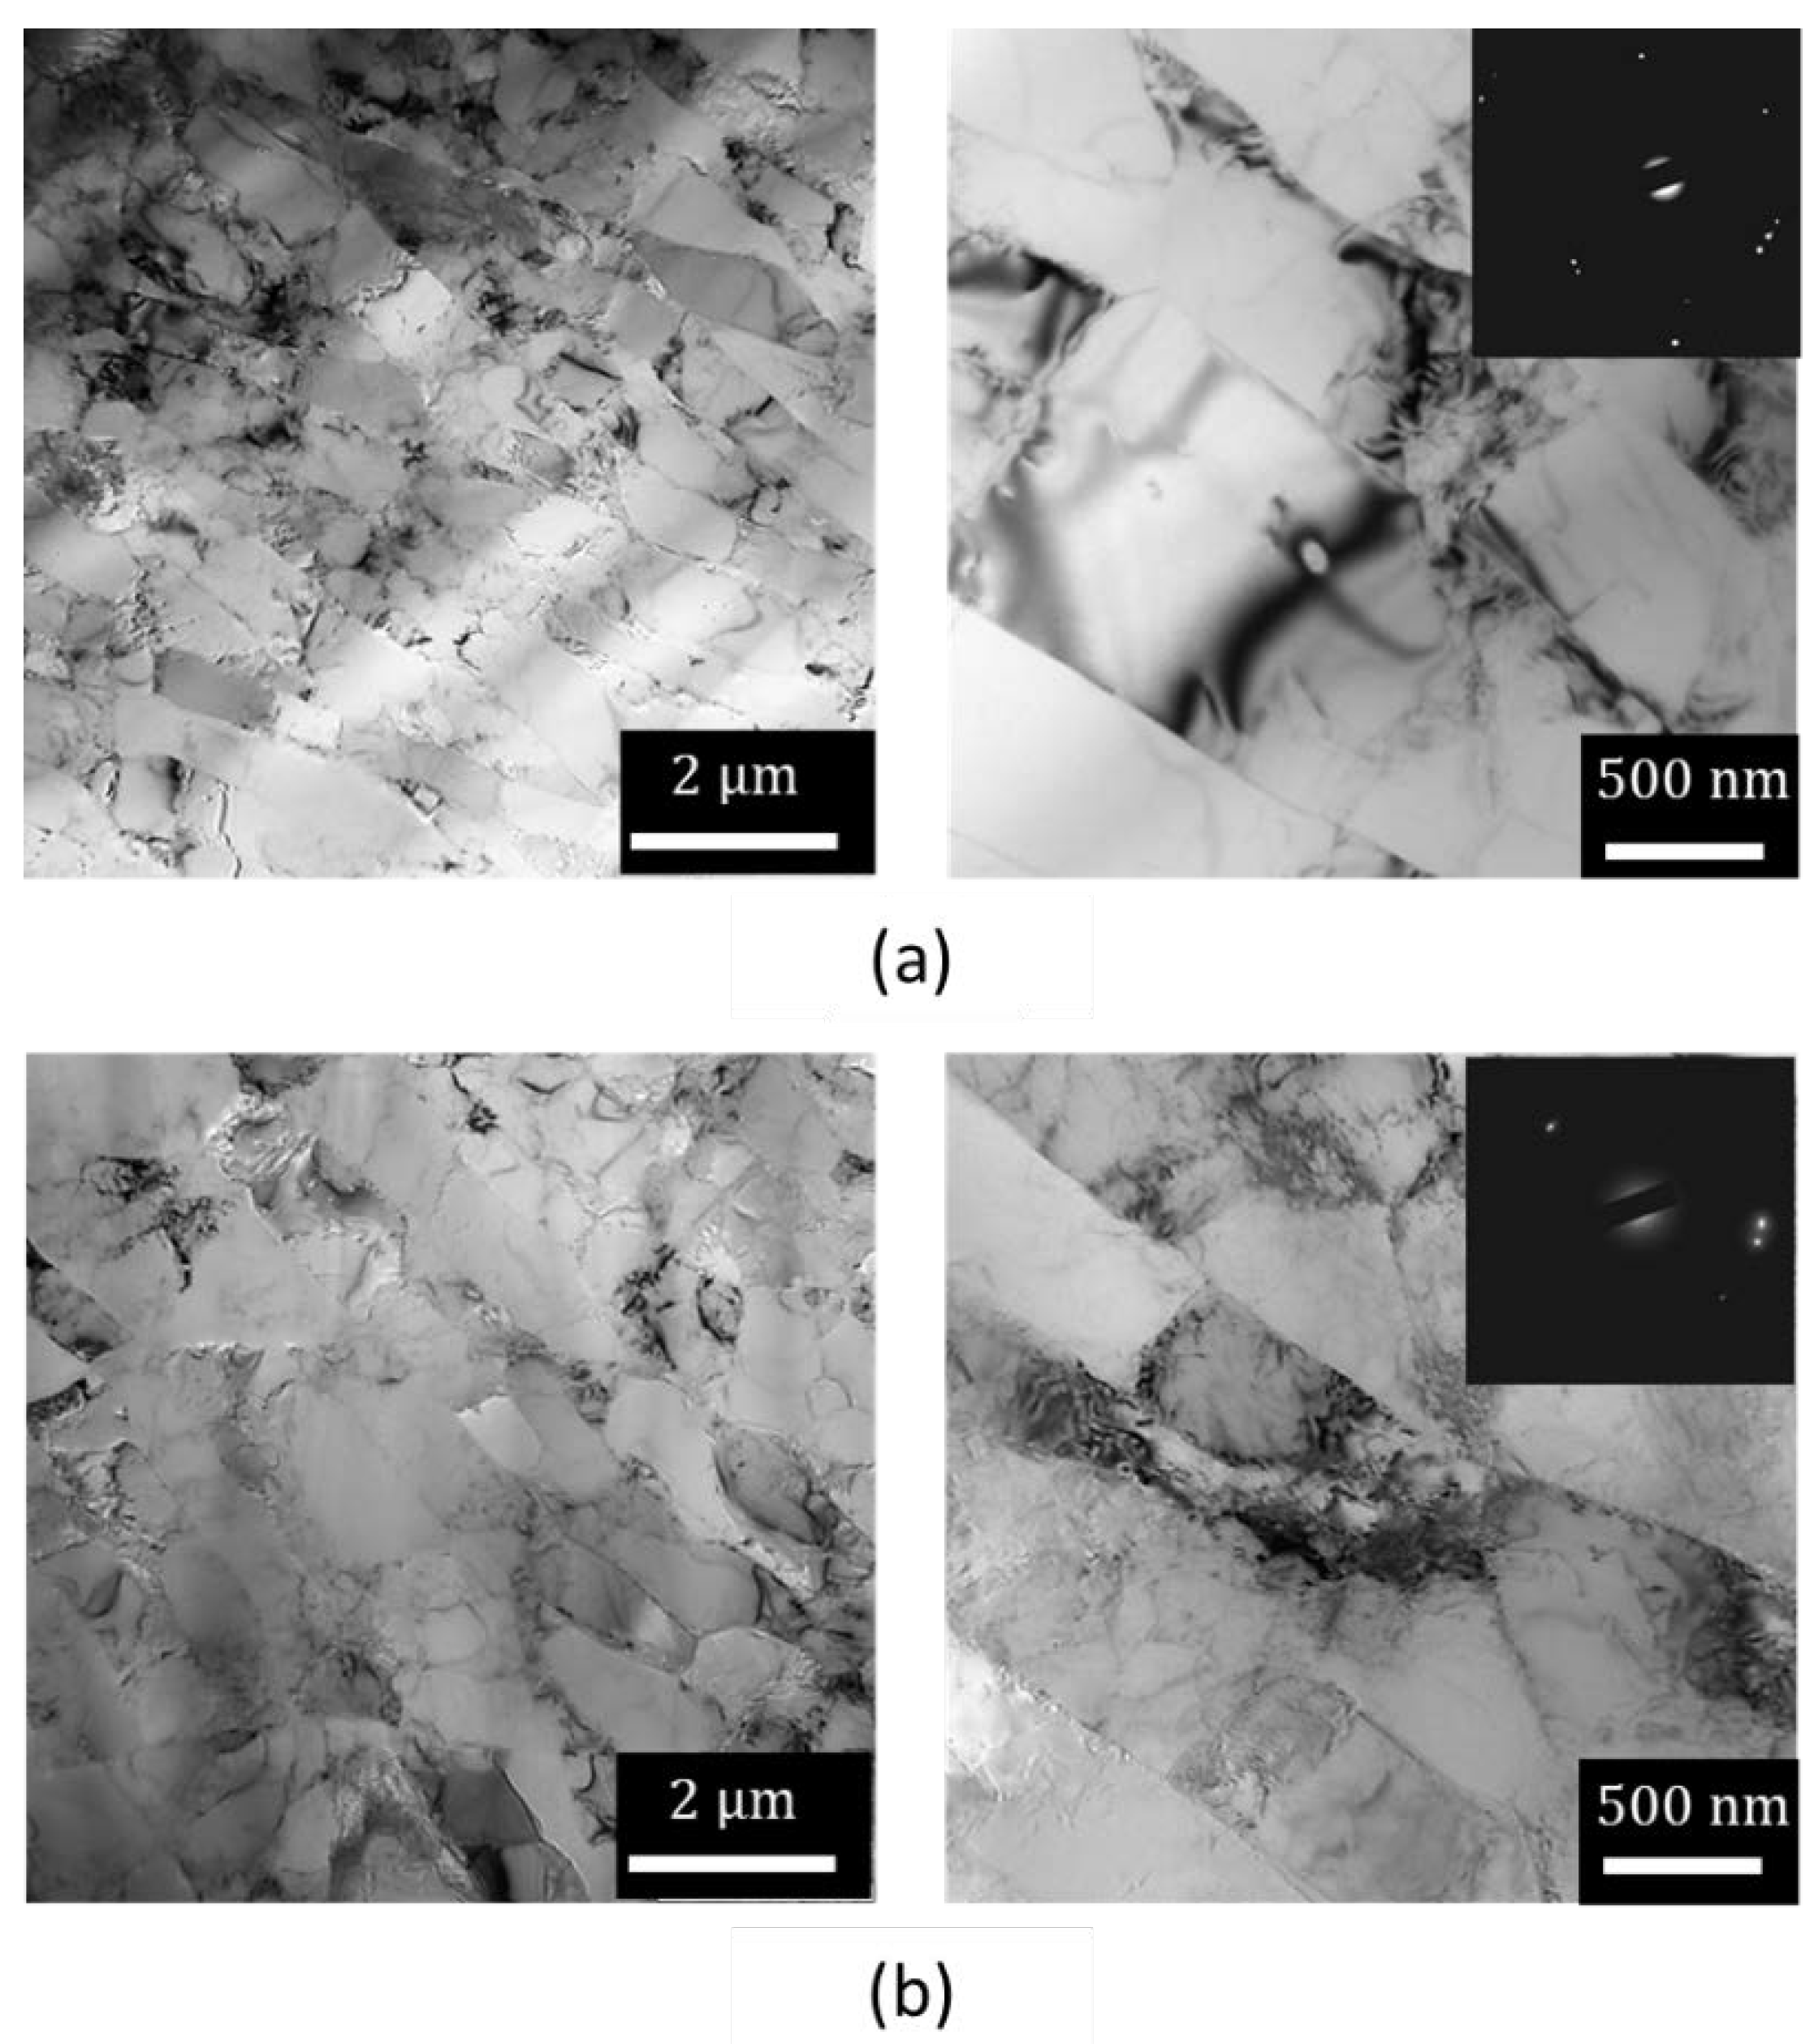
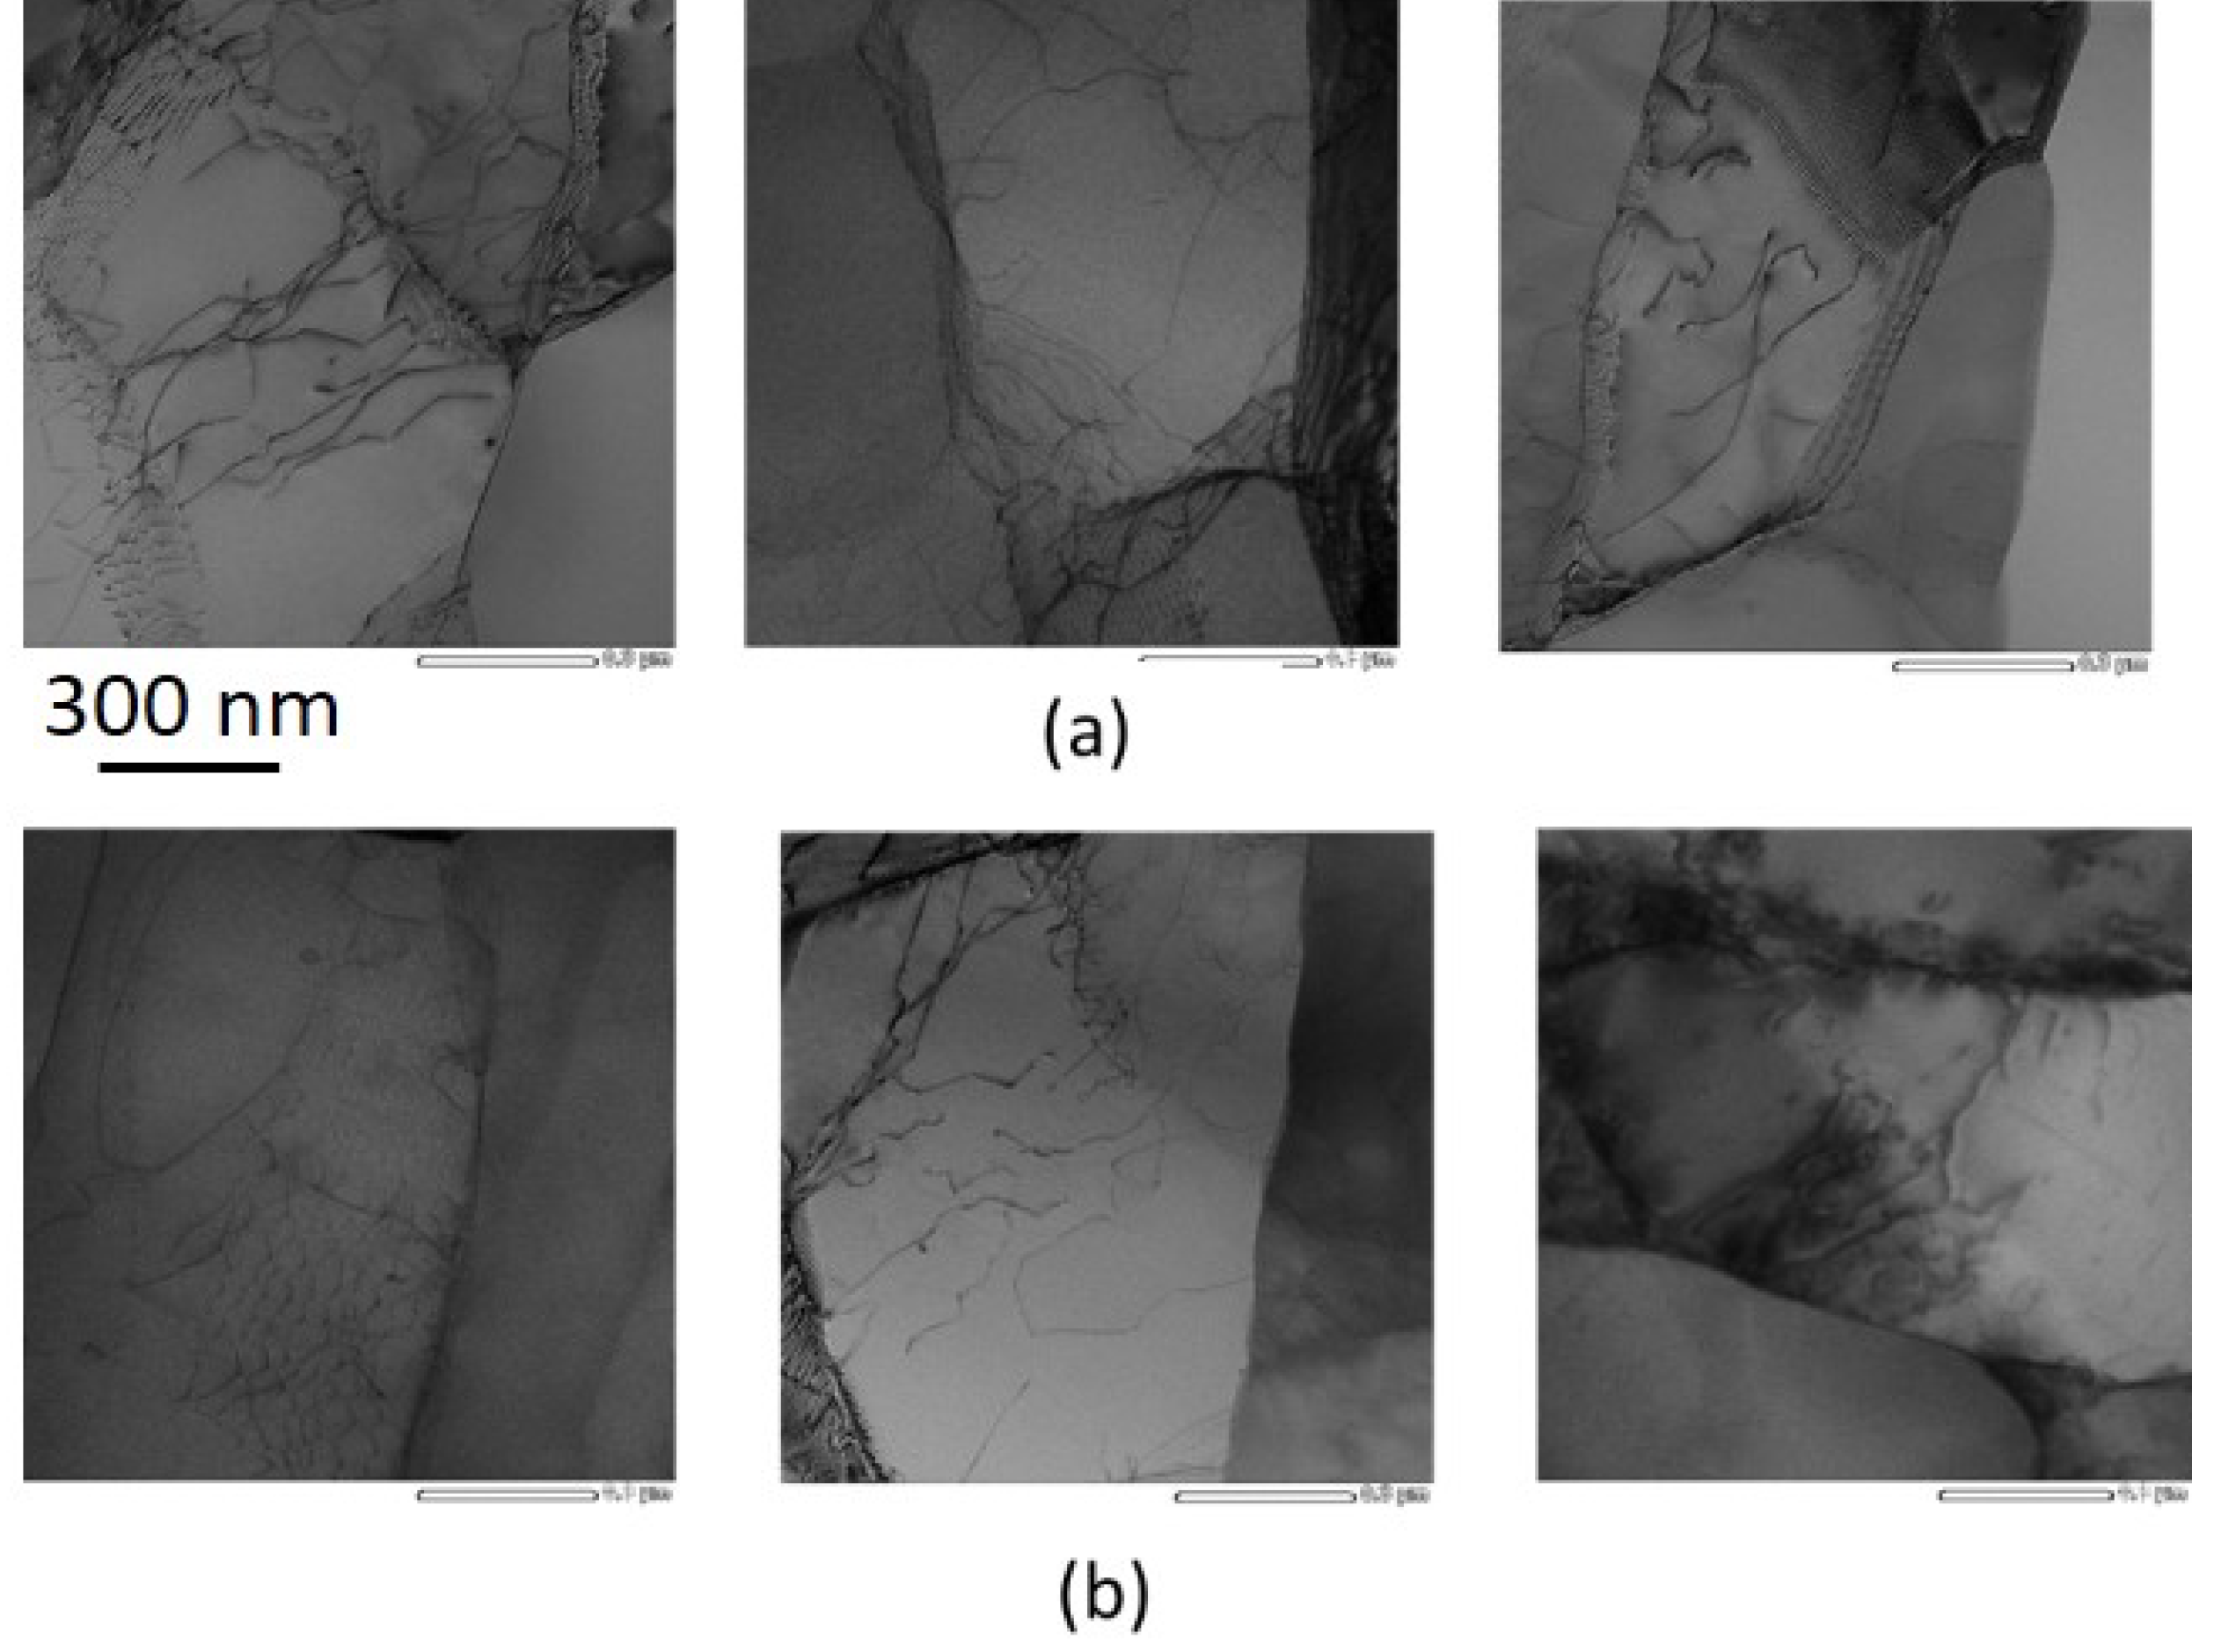
3.2. TEM/STEM Characterisation

TEM micrographs and the corresponding selected area diffraction (SAD) patterns (with 1.3 mm aperture size) taking from the central part of the forward- and reverse-shear segments are illustrated in Figure 5. It is seen that the microstructure is characterized by lamellar boundaries with about 580 nm and 710 nm boundary spacing in forward- and reverse-shear segments respectively. The main difference between these two microstructures is that subgrain boundaries were less elongated after reversion, while the angular spread of the spots was approximately the same for the forward- and reverse-shear segments. Besides, the number of SAD spots was higher in the forward-shear segment, indicating a higher number of LAGBs.
Figure 6 shows the STEM images of the segments in the central region. The STEM images were used to indicate dislocation arrangement and to measure the dislocation density. Results show that the dislocations were arranged randomly in a tangled array between the extended boundaries. Several dislocations having a random orientation subdivided the extended boundaries. The measured dislocation density in the forward- and reverse-shear segments were about 5.1 × 10⁻¹⁴ m−2 and 3.8 × 10⁻¹⁴ m−2, respectively, showing a 25% decrease in the dislocation density as a result of reversing the shear direction.

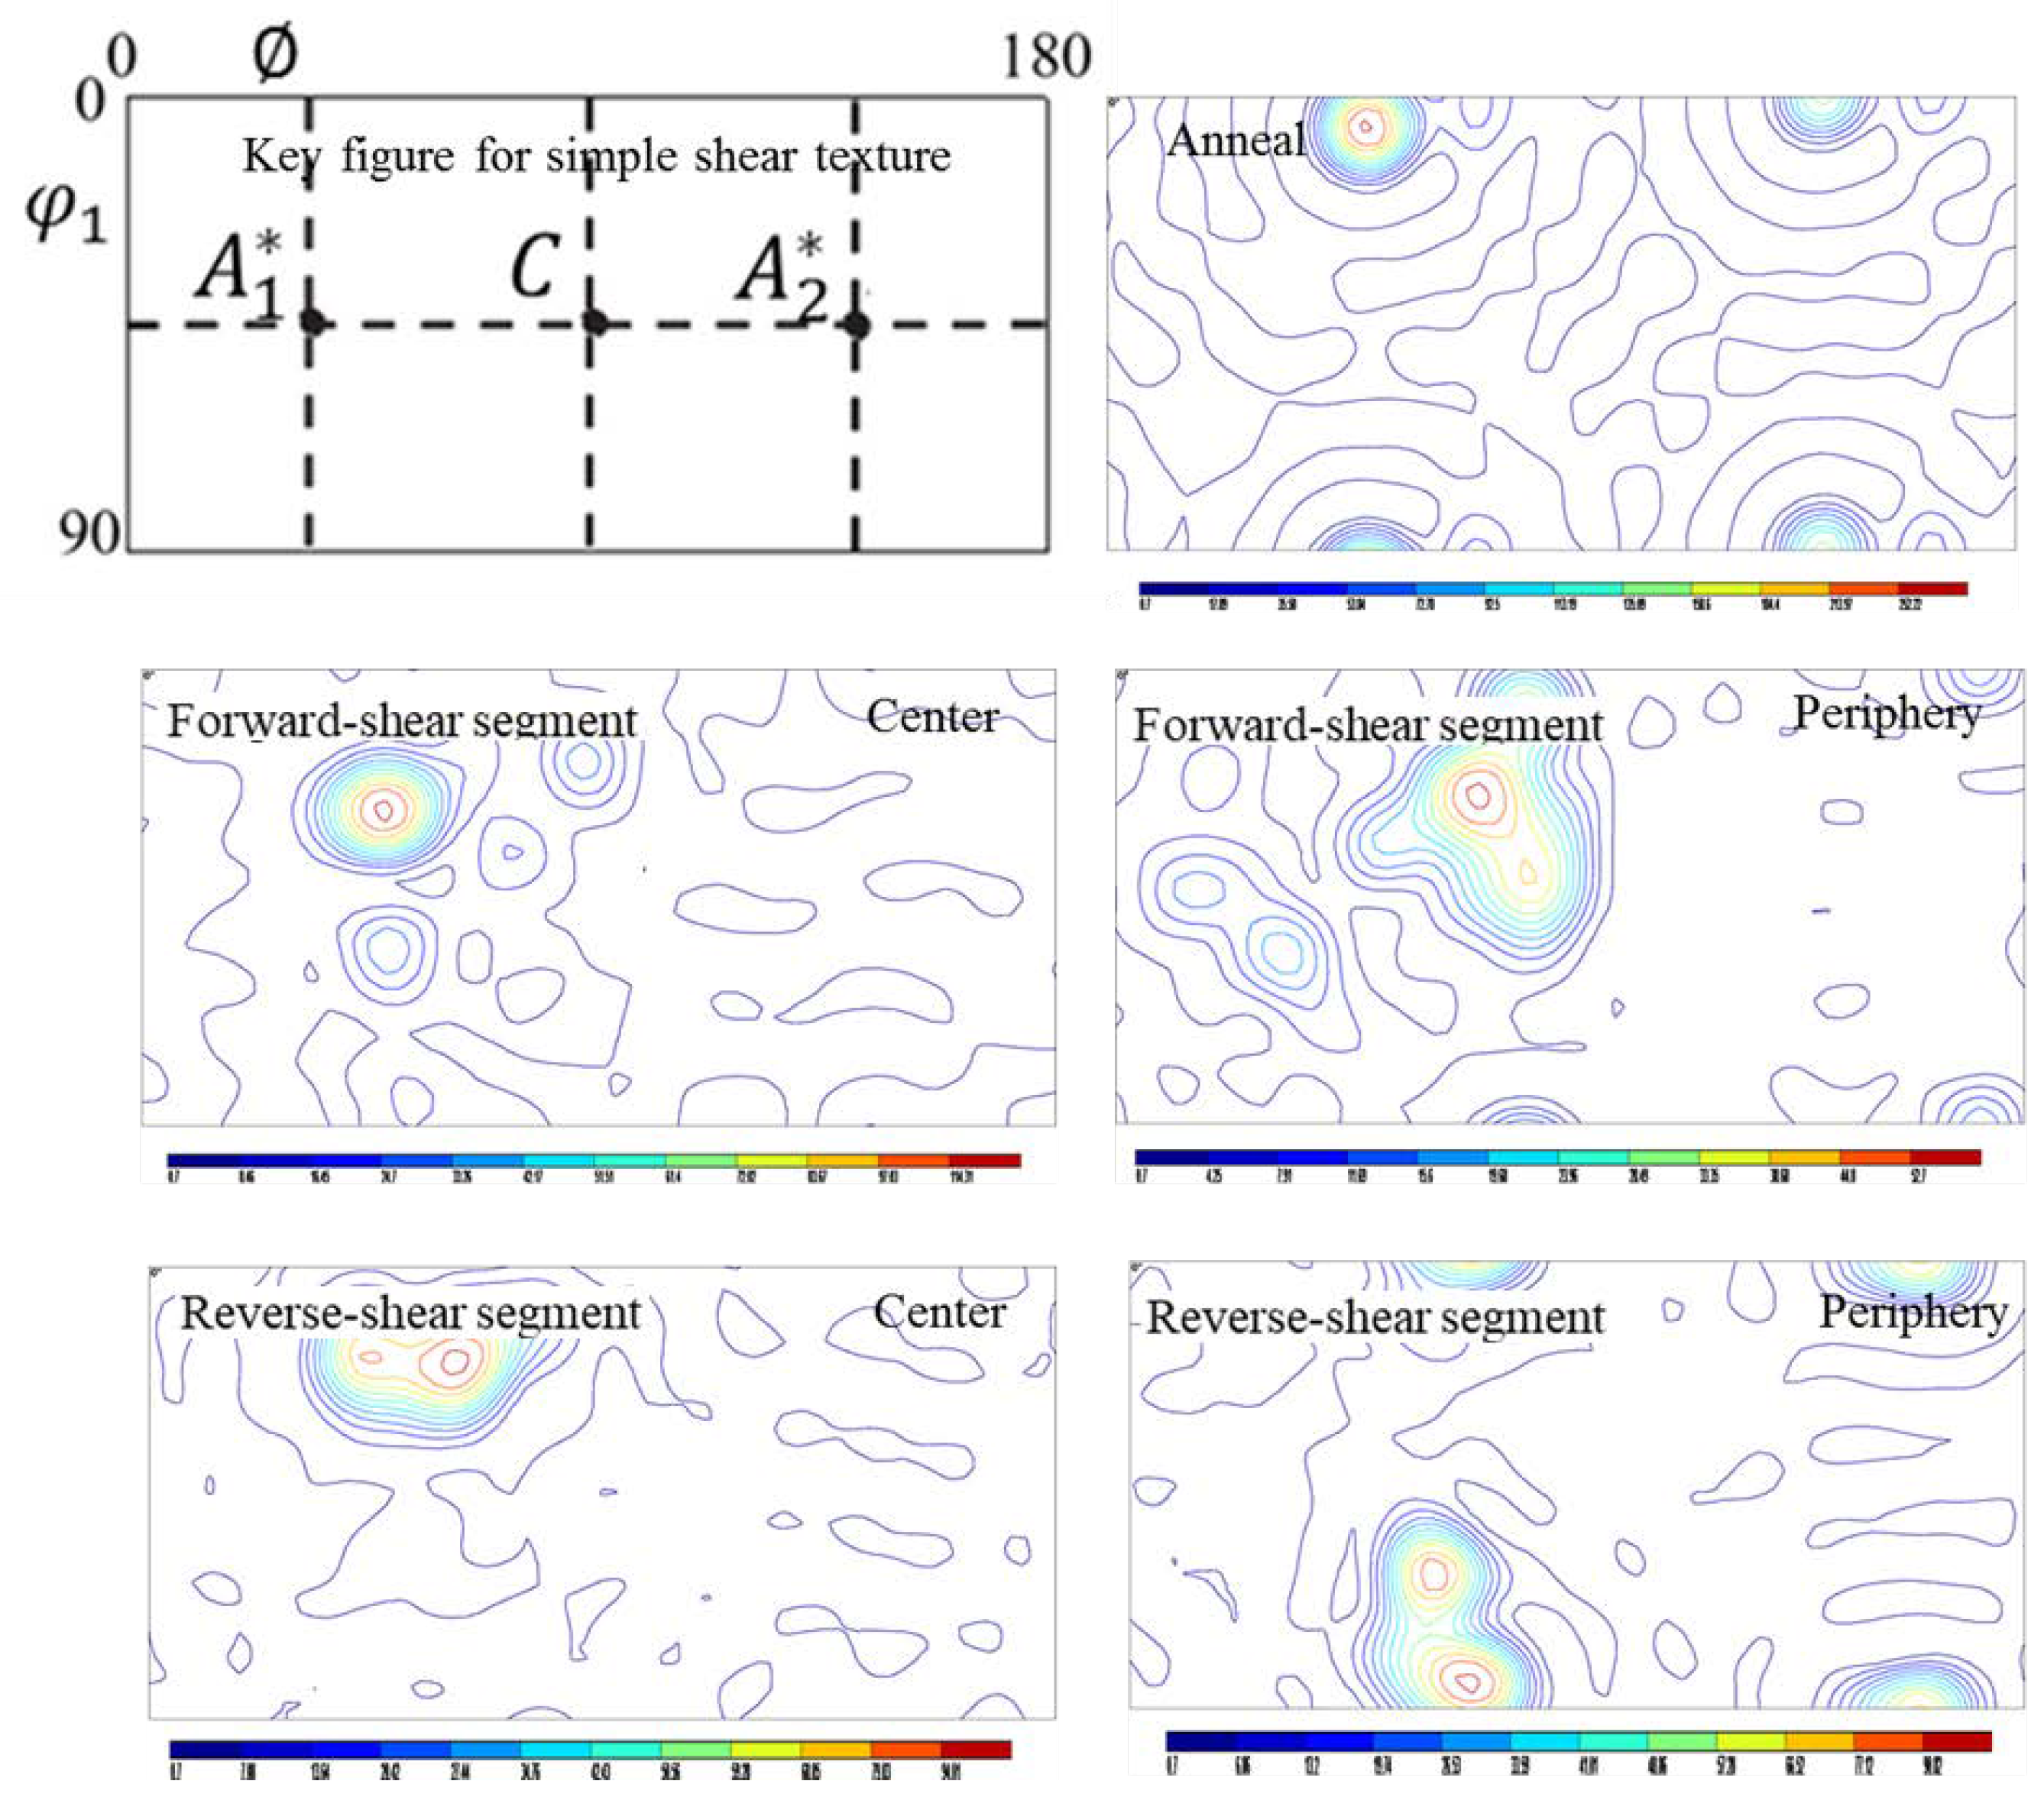
3.3. Texture Evaluation

The development of texture through the forward- and reverse-shear segments of the Al sample is shown by the orientation distribution function (ODF) obtained by the EBSD analysis (Figure 7 and Figure 8). For this purpose ϕ 2 = 0 and ϕ 2 = 45 ° sections of the ODFs of the forward- and reverse-shear segments are shown in Figure 7 and Figure 8, respectively. The essential simple shear texture components and their corresponding Euler angles in an face-centred cubic (FCC) metal are listed in Table 2. The ODF key figure with the overlaid texture components on the ϕ 2 = 0 and ϕ 2 = 45 ° sections were used for the texture interpretation.
The ϕ 2 = 0 section of the ODF of the annealed Al (Figure 7) shows the presence of the strong cube texture components, which is one of the proved recrystallization textures formed during annealing of cold deformed FCC materials having medium to high SFE [44]. During the SSE process, in the middle of the channel (forward-shear segment), the annealing components were eliminated. Instead, due to the activation of the maximum shear, a strong A 1 * component developed in the centre and the periphery. In the exit of the channel (reverse-shear segment), the A 1 * component with its strong intensity was retained in the central area. The annealing components restored in the periphery as a result of the reversion of the shear through the second half channel. The ϕ 2 = 45 ° section of the ODF (Figure 8) revealed the cube texture in the annealed sample as well. The annealing texture was wholly diminished in the central region of both forward- and reverse-shear segments. No visible texture component was observed in the central area. However, some components of the initial texture were re-established in the periphery of the segments. The most crucial point was that the intensity of the initial texture was reduced in the middle of the channel (forward-shear segment). At the same time, it increased at the exit of the channel, confirming the strain reversal effect in the second half of the channel.

3.4. Hardness Investigation

Figure 9a shows the Vickers hardness values measured on various locations from the centre to the surface of the forward- and reverse-shear segments. The hardness of the undeformed segment was also included for comparison. In both segments, the hardness decreased with increasing the distance from the centre. However, the hardness of the forward-shear segment was higher than that of the reverse-shear segment. The average hardness at the exit was 7% lower than the middle and was 53% larger than that of the entrance. The variation in the average hardness from the entrance to the exit of the channel is plotted in Figure 9b. The highest average hardness, about 42 VHN (Vickers hardness number), was achieved in the middle of the channel. To evaluate the hardness non-uniformity from the centre to surface, the hardness non-uniformity factor is defined as ( V H N max V H N min ) / V H N a v e , where V H N max , V H N min , and V H N a v e are the maximum, minimum, and average hardness values, respectively. The higher the non-uniformity factor, the lower the uniformity of hardness. As it is shown in Figure 9b, the hardness non-uniformity was more significant at the reverse-shear segment than at the forward-shear one.

4. Discussion

4.1. Grain’s Elongation Angle

In contrast to many SPD processes in which the strain reversal was developed by changing the processing route, the strain reversal in SSE (Figure 1) occurred innately in the second half of the deformation channel. The microstructural investigation of Al (Figure 2, Figure 3 and Figure 4) indicates that strain reversal affected the grain size, fraction of HAGBs, and formation of subgrains. In the first half of the SSE channel, where the forward shear was imposed into the material, the grains were elongated and rotated in a clockwise direction to the normal direction (ND). The highest angle of elongated grains was achieved in the middle of the channel and, theoretically, must be around 32° to the TD or 58° to the ND. In the second half of the channel, the angle of elongated grains increased due to changing the direction of shear in an anticlockwise rotation. Theoretically, after the complete reversion of the strain, the grain’s elongation angle must be around 90° to the TD (and 0° to the ND). However, in practice, the grain’s elongation angle in the forward- and reverse-shear segments was about 47° and 65° (to the TD), respectively. The same trend was observed in the pure Cu samples during shear strain reversal [36]. The grain’s elongation angle in the forward-shear segment was approximately reported 46° (for Cu), which was 14° higher than the ideal angle of 32°. It confirmed the non-ideal deformation in both forward- and reverse-shear segments.

4.2. Grain Size

By applying the forward shear, the grain size in the centre decreased by about 73%. After the complete return of the geometry, grain size increased by about 25% compared to the maximum forward-sheared situation. However, the reverse-shear segment’s grain size was still smaller (about 67%) than that of the undeformed sample. The reduction in the grain size in Cu after the same amount of forward shear was almost 60% and 8% lower than the undeformed and fully reversed sample [36], respectively. This confirms the more significant impact of forwarding and reversing shear on the microstructural evolution of the Al in comparison to the Cu. The same trend was observed in the variation of dislocation density. However, it is noted that the strain reversal could not completely restore the initial microstructure. These results were consistent with the cyclic HPT of commercially pure Al, where the strain reversal did not have a significant effect on grain refinement. Simultaneously, it can prevent the formation and reduce the development rate of HAGBs [5,23]. The comparison between the central and periphery areas (Figure 3 and Figure 4) indicates that in the periphery, the grains remained approximately equiaxed due to lower strains in the peripheral regions. The lower strain in the peripheral areas is related to the process geometry [26,36] and the effect of frictional forces. Moreover, the formation of LAGBs in the centre was more substantial; thus, the fraction of HAGBs in the periphery was more significant than in the centre was that. Therefore, a higher fraction of HAGBs was measured in the edge, while the average grain size was more abundant.

4.3. Dislocation Density

The cell walls and sub-boundaries are unstable against the strain reversal, and they can be dissolved and reformed during the reversed straining [46]. Additionally, the total dislocation density decreased by about 16% at the early of the reversed straining of Al. These microstructural effects can be a consequence of the Bauschinger effect in metals and alloys capable of forming cells or subgrains during prestraining. The strain reversal caused the dislocations at dislocation boundaries or the tangle dislocations to move and annihilate at the initial source of dislocations [47]. The TEM and STEM images at the middle and exit of the channel (Figure 5 and Figure 6) shows that the lamellar boundaries in the middle were sharper and distinguishable. The “untangling” of the cell walls due to the reverse flow can be a reason for the disintegration of the “forward” cell structure [48]. The “untangling” of the cell wall has also been observed in Cu under cyclic shear straining [36]. The annihilation of dislocations in high SFE metals occurred more easily during reversed deformation while it was more difficult in lower SFE metals due to the difficulty of cross slipping. Therefore, in the present study, higher dislocation density was recovered in Al (about 24%) compared with Cu (about 14%) in the previous research [36]. Besides, theoretical investigations demonstrate that, compared with the monotonic ones, the effective strain is lesser in the cyclic SPD processes that involve strain reversal [49]. Therefore, the saturation rate of HAGBs can be retarded also in terms of the total effective strain. It is noted that during strain reversing, the initial structure cannot wholly reoriginate at the channel exit because the microstructure is not fully reversible.

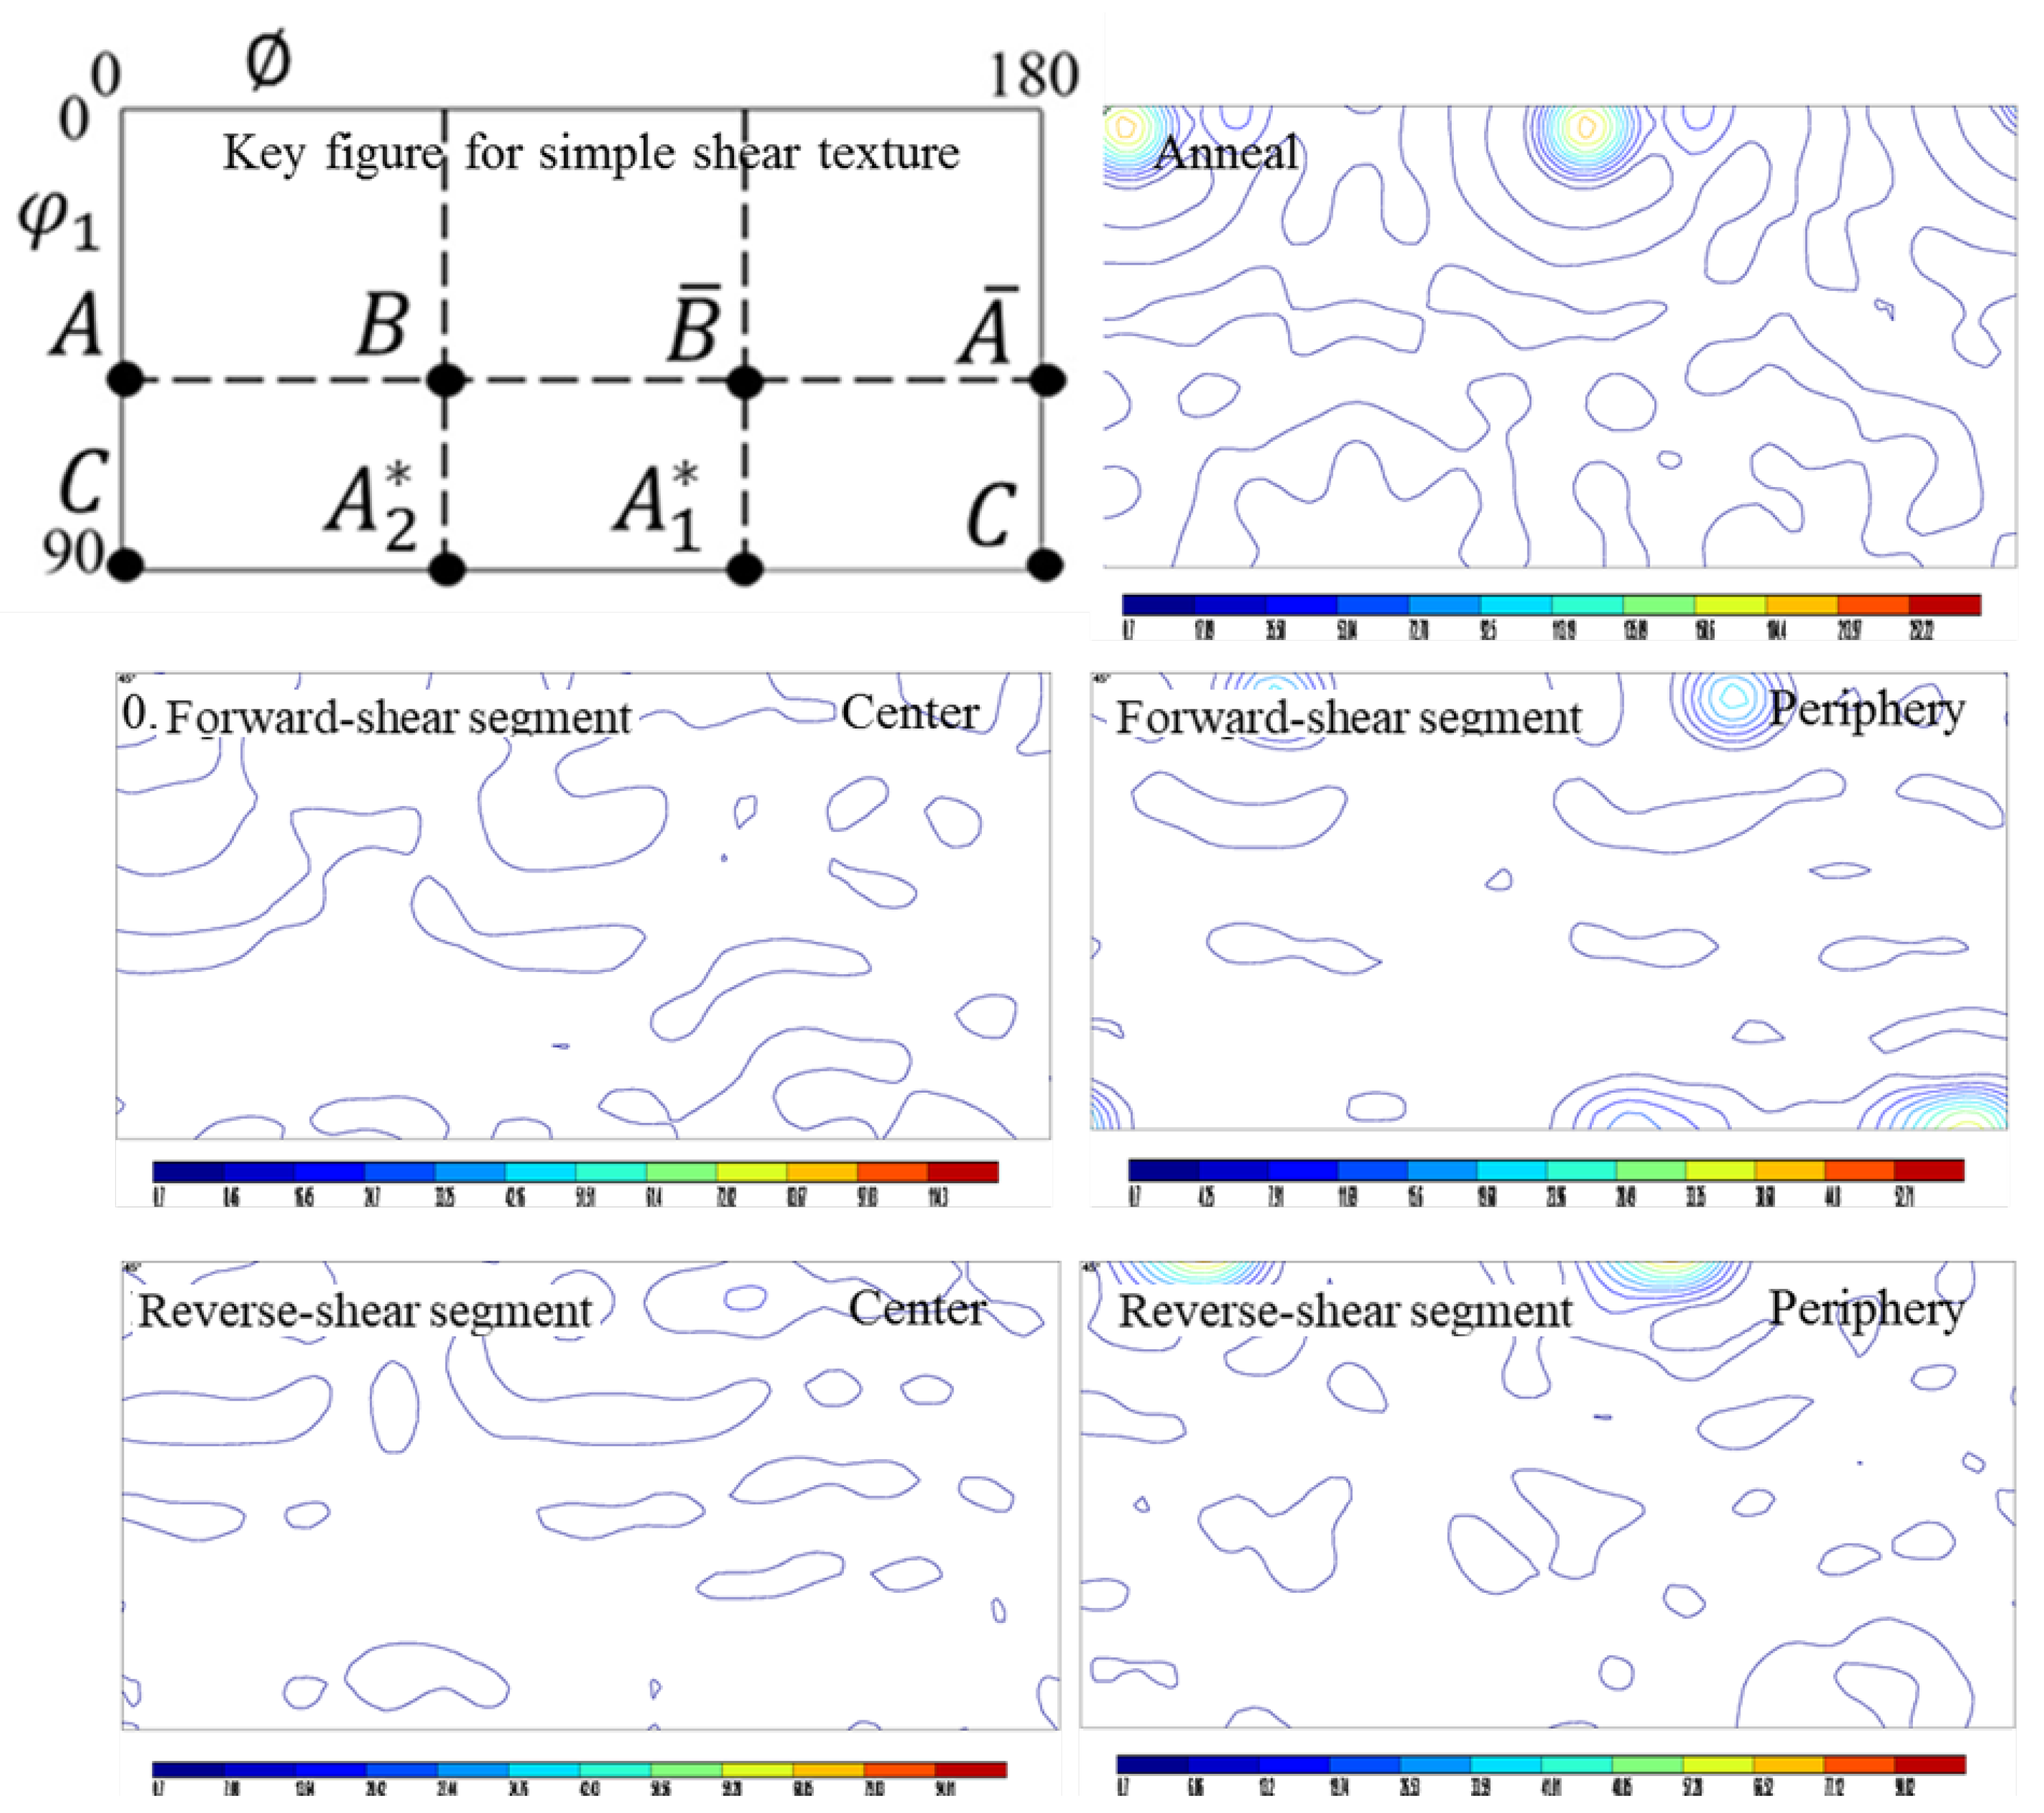
4.4. Texture Evolution

The comparison between the texture evolution in Al (Figure 7 and Figure 8) and Cu [37] revealed some differences in the texture evolution during the single pass of the SSE process. First, the initial texture restored more significantly at the exit of the channel in Al while it was not entirely recovered in Cu. Second, A 1 * was the major component developed in Al, whereas in Cu, approximately all the simple shear components were developed. Third, the intensity of the texture component was not the same. These differences can be attributed to several factors, including the intensity of initial texture, initial grain size, and the SFE.
The polycrystal model of the texture after ECAE via route BC of pure Cu and Al samples revealed that the difference in texture evolution between these two materials was mainly attributed to their initial textures, despite the differences between the initial microstructure and mechanical properties [50]. In route BC the billet is rotated in the same sense by 90 degrees around the longitudinal axis between each pass while in route A the sample is pressed repetitively without any rotation. The study of the initial texture effect in ECAP through routes A and Bc suggests that after a large number of ECAP passes, the impact of initial texture on the texture strength is more significant than on the texture components [51] although it is negligibly small on grain size [52]. In contrast, it has been reported that despite having a robust initial fibre texture, a similar texture is developed after the third pass ECAP of Cu through route A [53]. It is suggested that the initial texture has a strong impact on the final texture when the strain per pass is low, or the deformation mode is simple shear [54]. Therefore, the effect of the initial texture of Al and Cu during a single pass of the SSE process can be substantial.
Al and Cu with the SFE of about 160 mJ/m2 and 78 mJ/m2 are considered as typical high and medium SFE materials, respectively. The SFE can influence the texture by affecting the formation of subgrains and deformation bands and changing the ability of cross slip and altering the deformation mode between slip and twinning. The texture development during torsion as a function of SFE at intermediate to large strains indicates that [55] for a high SFE material, the major components were A, B, C, A 1 * , and A 2 * , and did not change from medium to large strains. The major components for a medium SFE material identified as A, B, C, and A 1 * for intermediate deformation, and C for large deformations. For a low SFE, the components of A, B, and A 1 * was retained with deformation for medium to high strains. With decreasing SFE, the C component was replaced by B / B ¯ components during ECAP (route A) due to the occurrence of twinning or hindering in the slip activity [56]. In the present study, the A 1 * component was the only texture component in Al likely because the imposed strain during the first pass of SSE was low.

4.5. Hardness

The forward shear segment shows the highest hardness (see Figure 9), which was entirely consistent with the microstructural evolutions. By reversing the direction of the shear, a kind of work softening occurred by decreasing the dislocation density. At the same time, the hardness distribution homogeneity decreased by changing the direction of the shear. The same trend was reported during the shear strain reversal in pure Cu [6,33] and TWIP steel [39]. In the present study, the hardness of Al was decreased by almost 7% after strain reversal, while the decrease in hardness of Cu was 3% after the same amount of strain reversal. This confirmed the higher impact of strain reversal in hardness changes in the Al in comparison to the Cu.

5. Conclusions

The EBSD, TEM, and STEM were used for microstructure, texture, and hardness evaluation in pure Al through a cycle of non-monotonic simple shear strain to investigate the effect of the strain reversal. The significant results are summarized below:
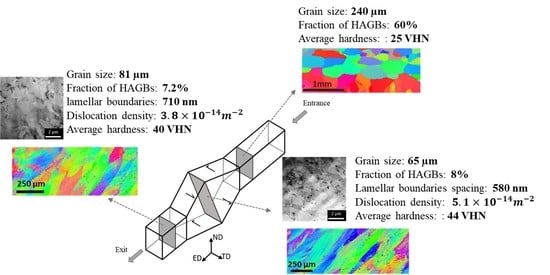
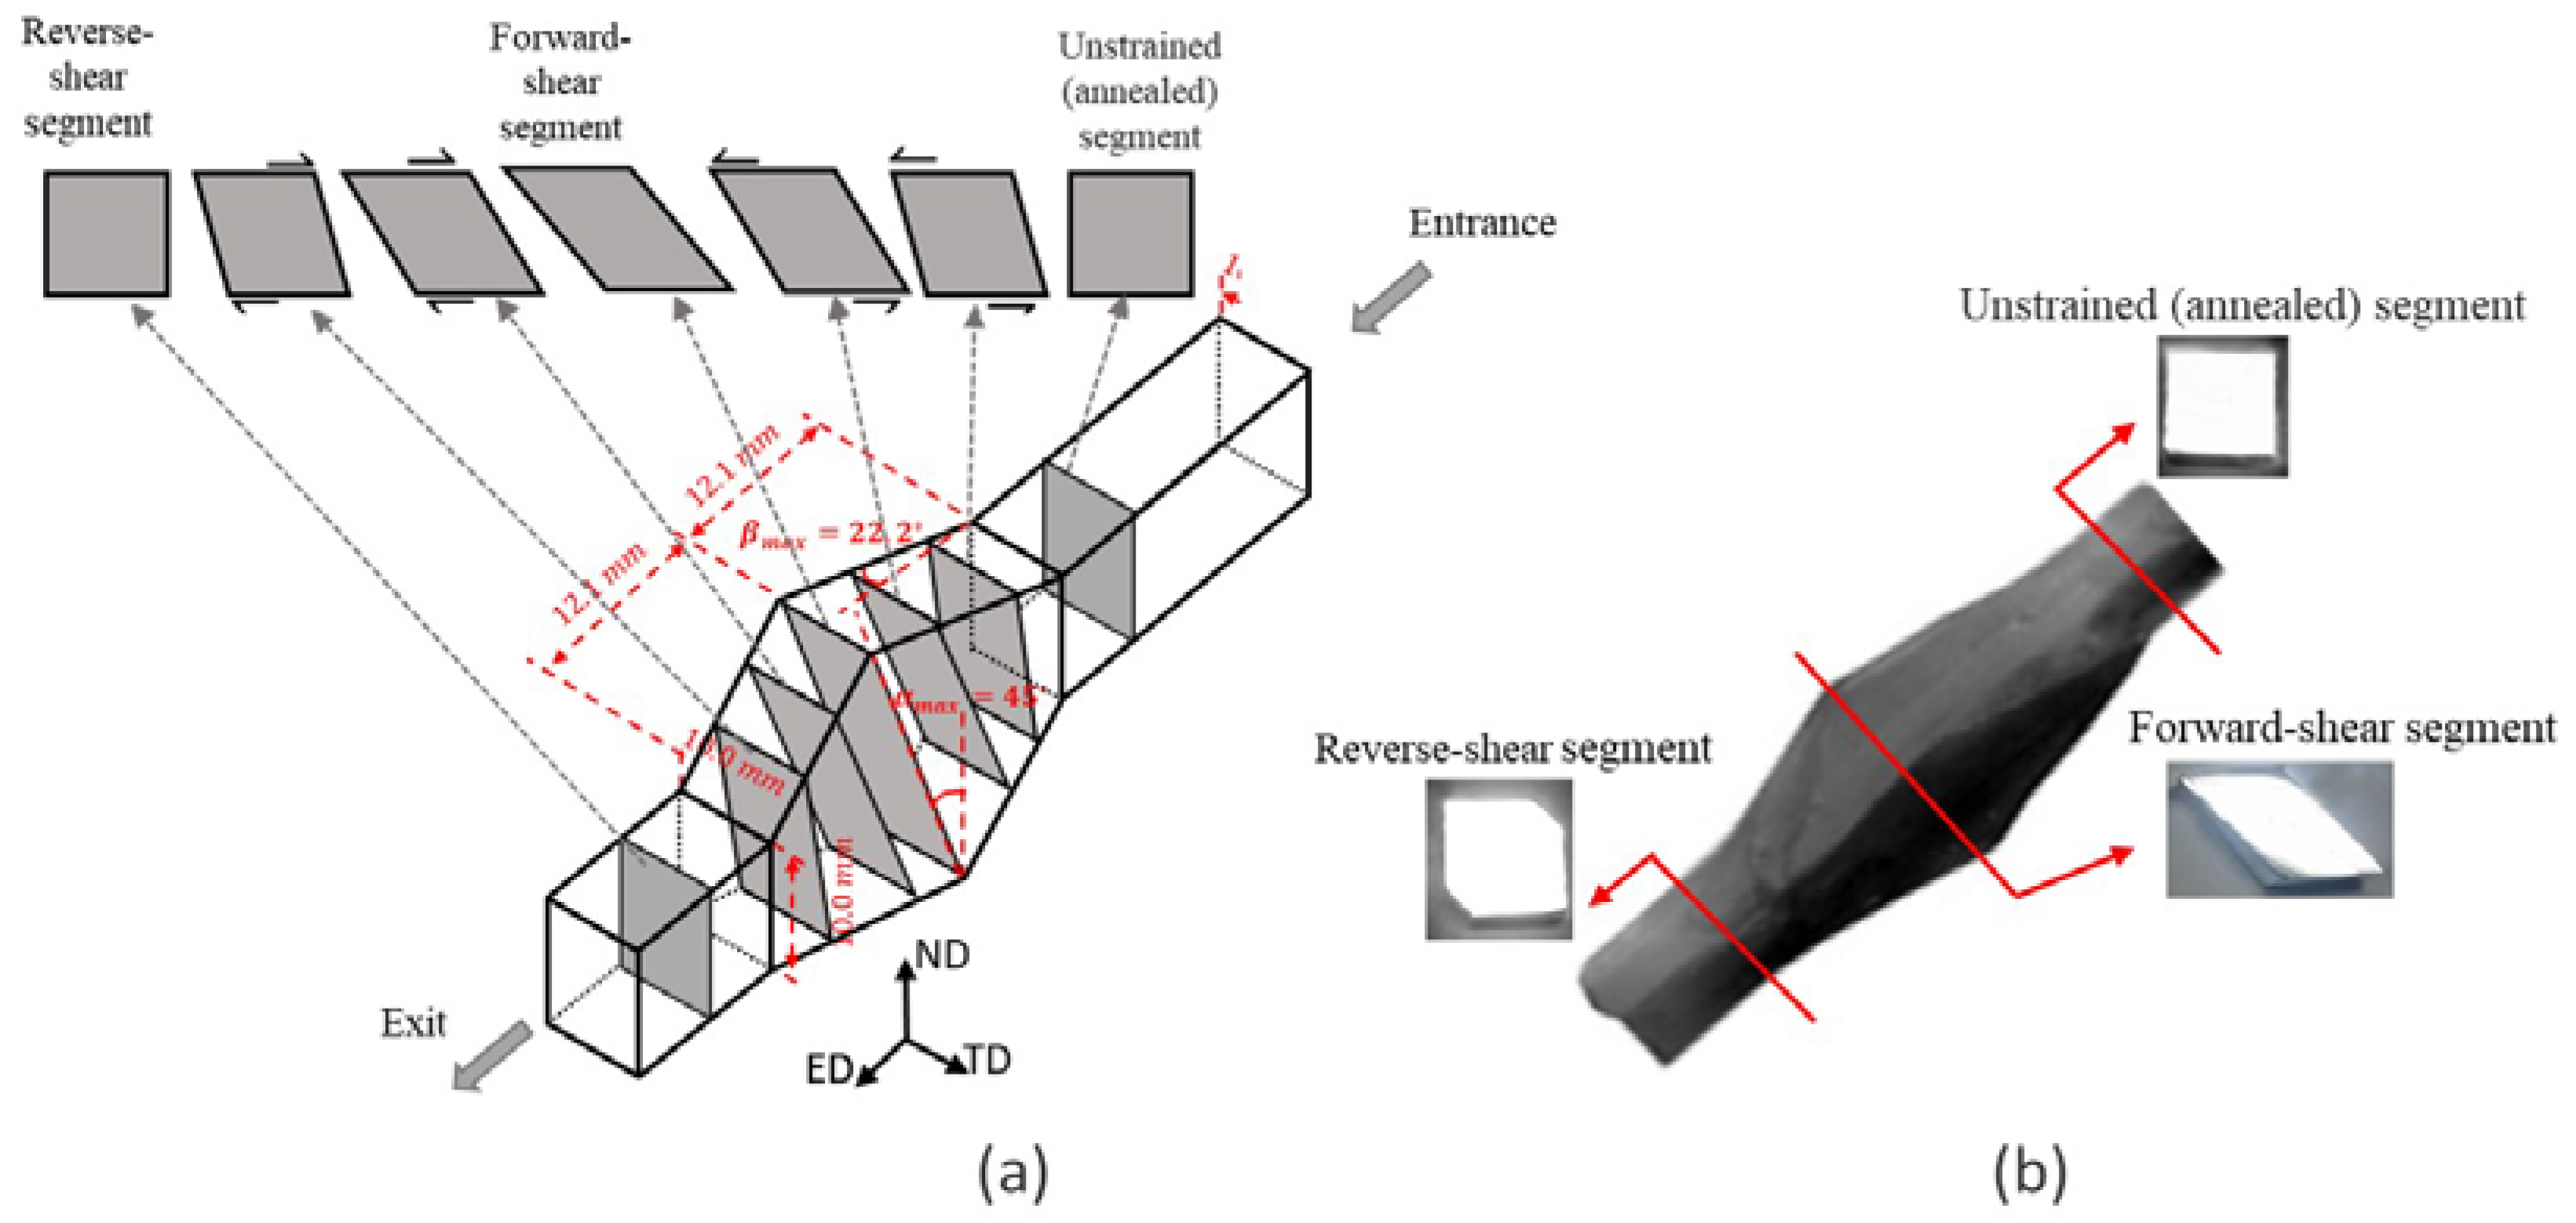
  • Application of a single cycle of SSE caused the large and equiaxed grain structure to replace with fully elongated grains at the centre and less elongated ones at the samples’ surface.
  • The grain size decreased from 240 µm at the initial stage to 65 µm and 83 µm at the central and peripheral regions respectively, after reaching the highest forward shear strain. Interestingly, after a full reversion of the strain, the grain size was 81 µm and 98 µm at the central and surface peripheral regions.
  • The fraction of HAGBs on the centre and periphery of the reverse-shear segment was 7.2% and 11.5%, showing a decrease in comparison to that of forward-shear segment, which was 8% and 15% respectively.
  • TEM image characterized a structure with lamellar boundaries before and after strain reversal, with a higher number of LAGBs in the forward-shear-segment. The dislocation density decreased from 5.1 × 10⁻¹⁴ m−2 in the forward-shear segment to 3.8 × 10⁻¹⁴ m−2 in the reverse-shear segment due to the strain reversal.
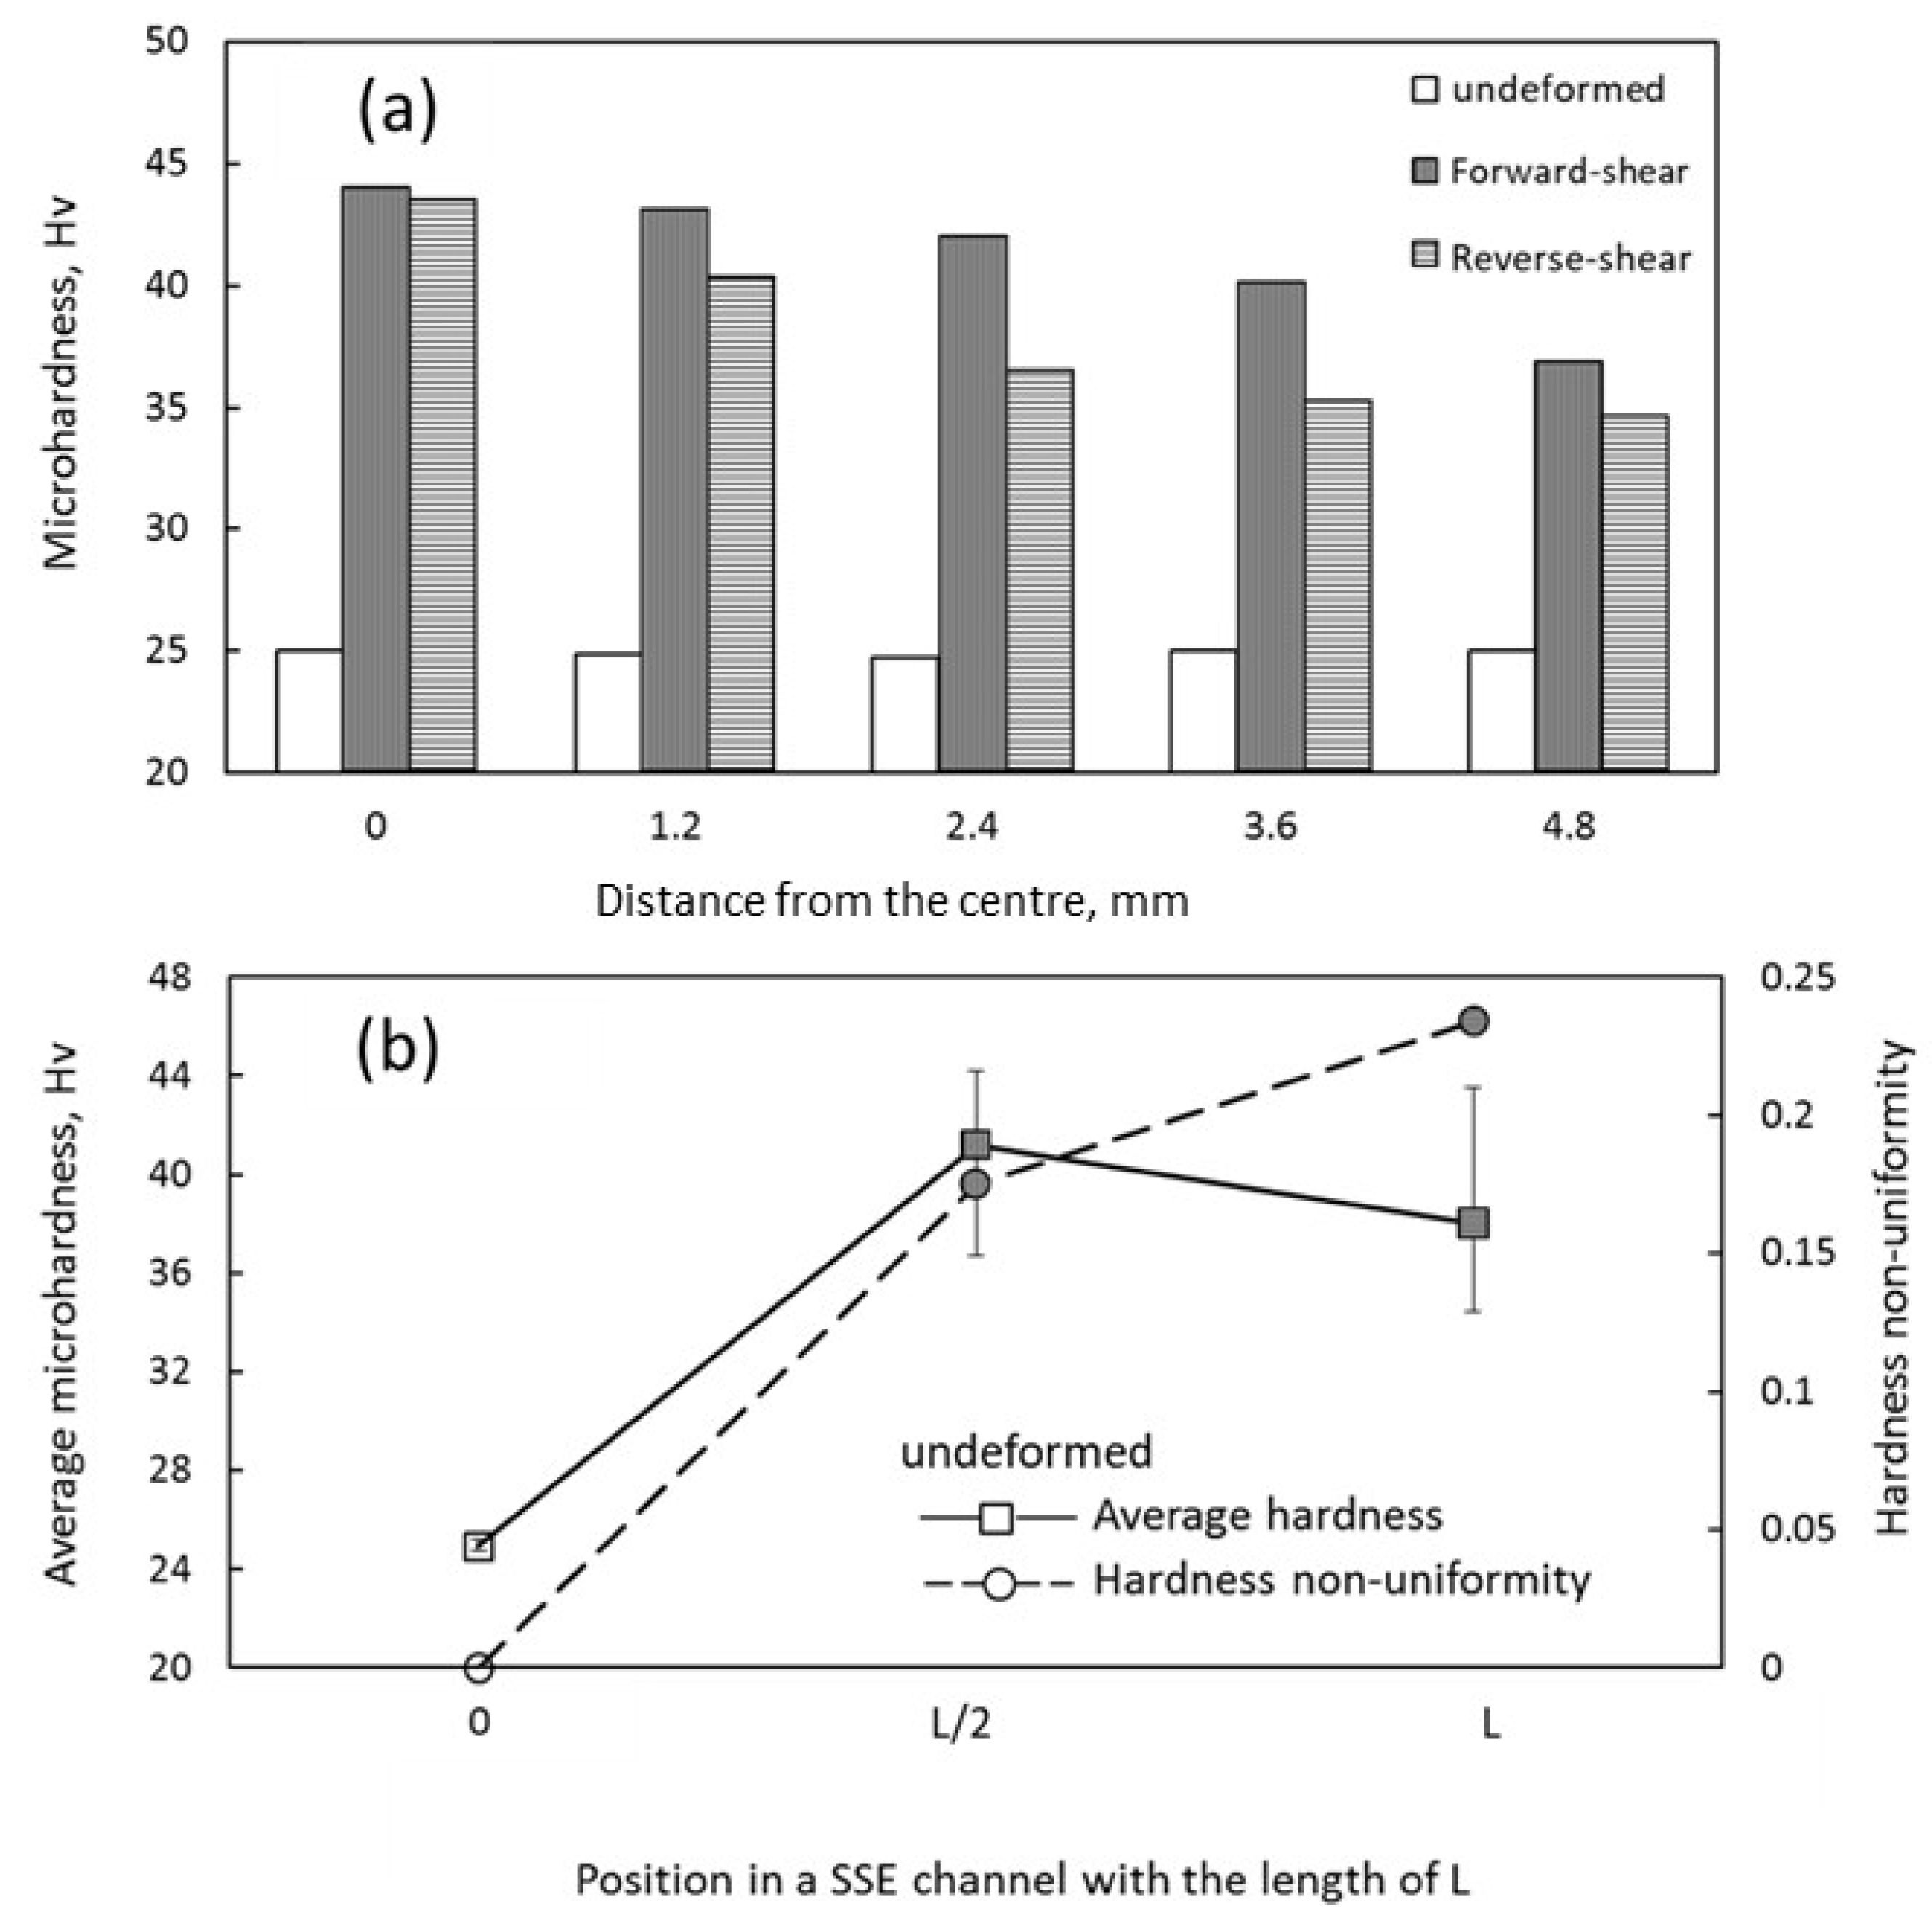
  • The hardness of the initial sample rose from 25 VHN to 42 VHN by applying of the forward shear and decreased to 36 VHN after strain reversal. Additionally, the hardness distribution inhomogeneity increased by changing the direction of the shear.
  • The cube texture was diminished and/or replaced with the simple shear texture in the forward-shear segment and restored to some extent in the reverse-shear segment.
  • Strain reversal resulted in the increase in the grain size, reduction in the dislocation density, hardness and mean misorientation angle, and restoring the texture in the reverse-shear segment. This behaviour was contributed to a kind of Bauschinger effect that affected the microstructure and mechanical properties during strain reversal.

Author Contributions

Investigation and writing—review and editing, E.B.; writing—original draft preparation and methodology, M.R.; supervision and data curation, R.E. and F.Q.; resources, funding acquisition and formal analysis, H.M. All authors have read and agreed to the published version of the manuscript.

Funding

This research received no external funding.

Acknowledgments

The financial support of the Shiraz and Semnan Universities is gratefully appreciated. The authors would also like to thank the Doshisha University for providing the SEM-EBSD/TEM facilities to characterize the materials.

Conflicts of Interest

The authors declare that they have no conflict of interest.

Data Availability

The raw/processed data required to reproduce these findings cannot be shared at this time due to legal or ethical reasons.

References

  1. Meyers, M.A.; Chawla, K.K. Mechanical Behavior of Materials; Cambridge University Press: New York, NY, USA, 2009. [Google Scholar]
  2. Hosford, W.F. Mechanical Behavior of Materials; Cambridge University Press: New York, NY, USA, 2005. [Google Scholar]
  3. Rauch, E.F.; Gracio, J.J.; Barlat, F. Work-hardening model for polycrystalline metals under strain reversal at large strains. Acta Mater. 2007, 55, 2939–2948. [Google Scholar] [CrossRef]
  4. Hu, Z.; Rauch, E.F.; Teodosiu, C. Work-hardening behavior of mild steel under stress reversal at large strains. Int. J. Plast. 1992, 8, 839–856. [Google Scholar] [CrossRef]
  5. Orlov, D.; Todaka, Y.; Umemoto, M.; Tsuji, N. Role of strain reversal in grain refinement by severe plastic deformation. Mater. Sci. Eng. A 2009, 499, 427–433. [Google Scholar] [CrossRef]
  6. Miyamoto, H.; Ikeda, T.; Uenoya, T.; Vinogradov, A.; Hashimoto, S. Reversible nature of shear bands in copper single crystals subjected to iterative shear of ECAP in forward and reverse directions. Mater. Sci. Eng. A 2011, 528, 2602–2609. [Google Scholar] [CrossRef]
  7. Orlov, D.; Bhattacharjee, P.P.; Todaka, Y.; Umemoto, M.; Tsuji, N. Texture evolution in pure aluminum subjected to monotonous and reversal straining in high-pressure torsion. Scr. Mater. 2009, 60, 893–896. [Google Scholar] [CrossRef]
  8. Gu, C.F.; Tóth, L.S.; Davies, C.H.J. Effect of strain reversal on texture and grain refinement in route C equal channel angular pressed copper. Scr. Mater. 2011, 65, 167–170. [Google Scholar] [CrossRef]
  9. Gu, C.F.; Tóth, L.S. The origin of strain reversal texture in equal channel angular pressing. Acta Mater. 2011, 59, 5749–5757. [Google Scholar] [CrossRef]
  10. Ma, X.; Li, F.; Fang, X.; Li, Z.; Sun, Z.; Hou, J.; Cao, J. Effect of strain reversal on the stress-induced martensitic transformation and tensile properties of a metastable β titanium alloy. J. Alloy. Compd. 2019, 784, 111–116. [Google Scholar] [CrossRef]
  11. Lanzagorta, J.L.; Jorge-Badiola, D.; Gutiérrez, I. Effect of the strain reversal on austenite–ferrite phase transformation in a Nb-microalloyed steel. Mater. Sci. Eng. A 2010, 527, 934–940. [Google Scholar] [CrossRef]
  12. Sun, L.; Muszka, K.; Wynne, B.P.; Palmiere, E.J. Influence of strain reversal on dynamic transformation in microalloyed steels deformed above the Ae3 temperature. J. Mater. Sci. 2017, 52, 12427–12444. [Google Scholar] [CrossRef]
  13. Sun, L.; Muszka, K.; Wynne, B.P.; Palmiere, E.J. On the interactions between strain path reversal and dynamic recrystallisation in 316L stainless steel studied by hottorsion. Mater. Sci. Eng. A 2013, 568, 160–170. [Google Scholar] [CrossRef]
  14. Jorge-Badiola, D.; Gutiérrez, I. Study of the strain reversal effect on the recrystallization and strain-induced precipitation in a Nb-microalloyed steel. Acta Mater. 2004, 52, 333–341. [Google Scholar] [CrossRef]
  15. Marcadet, S.J.; Mohr, D. Effect of compression–tension loading reversal on the strain to fracture of dual phase steel sheets. Int. J. Plast. 2015, 72, 21–43. [Google Scholar] [CrossRef]
  16. Appel, F.; Paul, J.D.H.; Staron, P.; Oehring, M.; Kolednik, O.; Predan, J.; Fischer, F.D. The effect of residual stresses and strain reversal on the fracture toughness of TiAl alloys. Mater. Sci. Eng. A 2018, 709, 17–29. [Google Scholar] [CrossRef]
  17. Nicolaou, P.D.; Semiatin, S.L. The effect of strain-path reversal on cavitation during hot torsion of Ti-6Al-4V. Metall. Mater. Trans. A 2006, 37, 3697–3705. [Google Scholar] [CrossRef]
  18. Yu, Q.; Zhang, J.; Jiang, Y. Direct observation of twinning–detwinning–retwinning on magnesium single crystal subjected to strain-controlled cyclic tension–compression in [0 0 0 1] direction. Philos. Mag. Lett. 2011, 91, 757–765. [Google Scholar] [CrossRef]
  19. Toribio, J.; Kharin, V.; Ayaso, F.-J.; Lorenzo, M.; González, B.; Matos, J.-C.; Aguado, L. Analysis of the Bauschinger Effect in Cold Drawn Pearlitic Steels. Metals 2020, 10, 114. [Google Scholar] [CrossRef] [Green Version]
  20. Ma, X.; Li, F.; Mao, X.; Yuan, S.; Wang, J. Effect of strain reversal on microstructure and mechanical properties of Ti-6Al-4V alloy under cyclic torsion deformation. Procedia Eng. 2017, 207, 1469–1474. [Google Scholar] [CrossRef]
  21. Liu, D.; He, Y.; Dunstan, D.J.; Zhang, B.; Gan, Z.; Hu, P.; Ding, H. Anomalous Plasticity in the Cyclic Torsion of Micron Scale Metallic Wires. Phys. Rev. Lett. 2013, 110, 244301. [Google Scholar] [CrossRef] [Green Version]
  22. Ma, X.; Li, F.; Cao, J.; Li, J.; Chen, H.; Zhao, C. Vickers microhardness and microstructure relationship of Ti-6Al-4V alloy under cyclic forward-reverse torsion and monotonic torsion loading. Mater. Des. 2017, 114, 271–281. [Google Scholar] [CrossRef]
  23. Kawasaki, M.; Langdon, T.G. The significance of strain reversals during processing by high-pressure torsion. Mater. Sci. Eng. A 2008, 498, 341–348. [Google Scholar] [CrossRef]
  24. Zhang, J.; Gao, N.; Starink, M.J. Microstructure development and hardening during high pressure torsion of commercially pure aluminium: Strain reversal experiments and a dislocation based model. Mater. Sci. Eng. A 2011, 528, 2581–2591. [Google Scholar] [CrossRef] [Green Version]
  25. Kawasaki, M.; Ahn, B.; Langdon, T.G. Significance of strain reversals in a two-phase alloy processed by high-pressure torsion. Mater. Sci. Eng. A 2010, 527, 7008–7016. [Google Scholar] [CrossRef]
  26. Pardis, N.; Ebrahimi, R. Deformation behavior in Simple Shear Extrusion (SSE) as a new severe plastic deformation technique. Mater. Sci. Eng. A 2009, 527, 355–360. [Google Scholar] [CrossRef]
  27. Pardis, N.; Ebrahimi, R. Different processing routes for deformation via simple shear extrusion (SSE). Mater. Sci. Eng. A 2010, 527, 6153–6156. [Google Scholar] [CrossRef]
  28. Rezvani, A.; Bagherpour, E.; Ebrahimi, R. Circular Simple Shear Extrusion as an Alternative to Simple Shear Extrusion Technique. Iran. J. Sci. Technol. Trans. Mech. Eng. 2020, 44, 193–201. [Google Scholar] [CrossRef]
  29. Tork, N.B.; Pardis, N.; Ebrahimi, R. Investigation on the feasibility of room temperature plastic deformation of pure magnesium by simple shear extrusion process. Mater. Sci. Eng. A 2013, 560, 34–39. [Google Scholar] [CrossRef]
  30. Ebrahimi, R.; Rezvani, A.; Bagherpour, E. Circular simple shear extrusion as an alternative for simple shear extrusion technique for producing bulk nanostructured materials. Procedia Manuf. 2018, 15, 1502–1508. [Google Scholar] [CrossRef]
  31. Bagherpour, E.; Qods, F.; Ebrahimi, R.; Miyamoto, H. Microstructure quantification of ultrafine grained pure copper fabricated by simple shear extrusion (SSE) technique. Mater. Sci. Eng. A 2016, 674, 221–231. [Google Scholar] [CrossRef]
  32. Balali, M.; Limouei, M.B.; Balali, M. Study on Optimization of Parameters Affecting Simple Shear Extrusion of Pure Copper to Fabricate Fine Grain Structure. Trans. Indian Inst. Met. 2018, 71, 605–616. [Google Scholar] [CrossRef]
  33. Bagherpour, E.; Qods, F.; Ebrahimi, R.; Miyamoto, H. Nanostructured pure copper fabricated by simple shear extrusion (SSE): A correlation between microstructure and tensile properties. Mater. Sci. Eng. A 2017, 679, 465–475. [Google Scholar] [CrossRef]
  34. Bayat Tork, N.; Saghafian, H.; Razavi, S.H.; Al-Fadhalah, K.J.; Ebrahimi, R.; Mahmudi, R. Microstructure and texture characterization of Mg–Al and Mg–Gd binary alloys processed by simple shear extrusion. J. Mater. Res. Technol. 2019, 8, 1288–1299. [Google Scholar] [CrossRef]
  35. Bagherpour, E.; Mortezaei, S.; Ebrahimi, R.; Miyamoto, H.; Qods, F. On the Production of Severely Deformed Workpieces in Large Scales: A Step towards Industrialization. JOM 2019, 71, 4424–4435. [Google Scholar] [CrossRef] [Green Version]
  36. Bagherpour, E.; Qods, F.; Ebrahimi, R.; Miyamoto, H. Microstructure evolution of pure copper during a single pass of simple shear extrusion (SSE): Role of shear reversal. Mater. Sci. Eng. A 2016, 666, 324–338. [Google Scholar] [CrossRef]
  37. Bagherpour, E.; Qods, F.; Ebrahimi, R.; Miyamoto, H. Texture Changes during Simple Shear Extrusion (SSE) Processing of Pure Copper. Mater. Trans. 2016. [Google Scholar] [CrossRef] [Green Version]
  38. Bagherpour, E.; Qods, F.; Ebrahimi, R.; Miyamoto, H. Microstructure and Texture Inhomogeneity after Large Non-Monotonic Simple Shear Strains: Achievements of Tensile Properties. Metals 2018, 8, 583. [Google Scholar] [CrossRef] [Green Version]
  39. Bagherpour, E.; Reihanian, M.; Ebrahimi, R. Processing twining induced plasticity steel through simple shear extrusion. Mater. Des. 2012, 40, 262–267. [Google Scholar] [CrossRef]
  40. Ham, R.K. The determination of dislocation densities in thin films. Philos. Mag. A J. Theor. Exp. Appl. Phys. 1961, 6, 1183–1184. [Google Scholar] [CrossRef]
  41. Miyajima, Y.; Mitsuhara, M.; Hata, S.; Nakashima, H.; Tsuji, N. Quantification of internal dislocation density using scanning transmission electron microscopy in ultrafine grained pure aluminium fabricated by severe plastic deformation. Mater. Sci. Eng. A 2010, 528, 776–779. [Google Scholar] [CrossRef]
  42. Bardal, A.; Lie, K. Measuring the Thickness of Aluminium Alloy Thin Foils Using Electron Energy Loss Spectroscopy. Mater. Charact. 2000, 44, 329–343. [Google Scholar] [CrossRef]
  43. Krahmer, D.M.; Polvorosa, R.; López de Lacalle, L.N.; Alonso-Pinillos, U.; Abate, G.; Riu, F. Alternatives for Specimen Manufacturing in Tensile Testing of Steel Plates. Exp. Tech. 2016, 40, 1555–1565. [Google Scholar] [CrossRef]
  44. Kestens, L.A.I.; Pirgazi, H. Texture formation in metal alloys with cubic crystal structures. Mater. Sci. Technol. 2016, 32, 1303–1315. [Google Scholar] [CrossRef] [Green Version]
  45. Li, S.; Beyerlein, I.J.; Bourke, M.A.M. Texture formation during equal channel angular extrusion of fcc and bcc materials: Comparison with simple shear. Mater. Sci. Eng. A 2005, 394, 66–77. [Google Scholar] [CrossRef]
  46. Hasegawa, T.; Yakou, T.; Karashima, S. Deformation behaviour and dislocation structures upon stress reversal in polycrystalline aluminium. Mater. Sci. Eng. 1975, 20, 267–276. [Google Scholar] [CrossRef]
  47. Todaka, Y.; Umemoto, M.; Yamazaki, A.; Sasaki, J.; Tsuchiya, K. Effect of Strain Path in High-Pressure Torsion Process on Hardening in Commercial Purity Titanium. Mater. Trans. 2008, 49, 47–53. [Google Scholar] [CrossRef] [Green Version]
  48. Hasegawa, T.; Yakou, T.; Kocks, U.F. Forward and reverse rearrangements of dislocations in tangled walls. Mater. Sci. Eng. 1986, 81, 189–199. [Google Scholar] [CrossRef]
  49. Petryk, H.; Stupkiewicz, S. A quantitative model of grain refinement and strain hardening during severe plastic deformation. Mater. Sci. Eng. A 2007, 444, 214–219. [Google Scholar] [CrossRef]
  50. Li, S.; Beyerlein, I.J.; Alexander, D.J.; Vogel, S.C. Texture evolution during equal channel angular extrusion: Effect of initial texture from experiment and simulation. Scr. Mater. 2005, 52, 1099–1104. [Google Scholar] [CrossRef]
  51. Ferrasse, S.; Segal, V.M.; Kalidindi, S.R.; Alford, F. Texture evolution during equal channel angular extrusion: Part I. Effect of route, number of passes and initial texture. Mater. Sci. Eng. A 2004, 368, 28–40. [Google Scholar] [CrossRef]
  52. Miyamoto, H.; Fushimi, J.; Mimaki, T.; Vinogradov, A.; Hashimoto, S. The Effect of the Initial Orientation on Microstructure Development of Copper Single Crystals Subjected to Equal-Channel Angular Pressing. Mater. Sci. Forum 2006, 503–504, 799–804. [Google Scholar] [CrossRef]
  53. Suwas, S.; Arruffat-Massion, R.; Tóth, L.S.; Eberhardt, A.; Fundenberger, J.-J.; Skrotzki, W. Evolution of crystallographic texture during equal channel angular extrusion of copper: The role of material variables. Metall. Mater. Trans. A 2006, 37, 739–753. [Google Scholar] [CrossRef]
  54. Li, S.; Gazder, A.A.; Beyerlein, I.J.; Davies, C.H.J.; Pereloma, E.V. Microstructure and texture evolution during equal channel angular extrusion of interstitial-free steel: Effects of die angle and processing route. Acta Mater. 2007, 55, 1017–1032. [Google Scholar] [CrossRef]
  55. Hughes, D.A.; Lebensohn, R.A.; Wenk, H.R.; Kumar, A. Stacking fault energy and microstructure effects on torsion texture evolution. Proc. R. Soc. Lond. Ser. A Math. Phys. Eng. Sci. 2000, 456, 921–953. [Google Scholar] [CrossRef]
  56. Suwas, S.; Tóth, L.S.; Fundenberger, J.-J.; Grosdidier, T.; Skrotzki, W. Texture Evolution in FCC Metals during Equal Channel Angular Extrusion (ECAE) as a Function of Stacking Fault Energy. Solid State Phenom. 2005, 105, 345–350. [Google Scholar] [CrossRef]
Figure 1. (a) The gradual change in the sample’s cross section in the SSE channel and (b) an experimental sample processed by SSE showing the selected segments for the microstructural investigations.
Crystals 10 00926 g001
Figure 2. (a) The initial electron backscattering diffraction (EBSD) colour and (b) the boundary map of the undeformed Al sample.
Crystals 10 00926 g002
Figure 3. The colour and the boundary misorientation maps of the forward-shear segment at the (a) central and (b) peripheral regions.
Crystals 10 00926 g003
Figure 4. The colour and the boundary misorientation maps of the reverse-shear segment at the (a) central and (b) peripheral regions.
Crystals 10 00926 g004
Figure 5. TEM micrographs and the corresponding selected area diffraction (SAD) patterns taking from the central region of the (a) forward- and (b) reverse-shear segments.
Crystals 10 00926 g005
Figure 6. STEM images of the (a) forward- and (b) reverse- shear segments in the central region.
Crystals 10 00926 g006
Figure 7. The ϕ 2 = 0 sections of the orientation distribution functions (ODFs) of the annealed and forward- and reverse-shear segments.
Crystals 10 00926 g007
Figure 8. The ϕ 2 = 45 ° sections of the ODFs of the annealed and forward- and reverse-shear segments.
Crystals 10 00926 g008
Figure 9. (a) Vickers hardness values measured on various locations from the centre to the surface of the forward- and reverse-shear segments and (b) the variation in the average hardness from the entrance to the exit of the channel.
Crystals 10 00926 g009
Table 1. Chemical composition of AA 1060 aluminium alloy (wt %).
AlSiMnMgZnTiFev
99.270.210.050.030.040.030.340.03
Table 2. Main ideal orientations in the simple shear deformation of FCC materials [45].
Notation { h k l } u v w Euler Angles (°)
ϕ 1 Φ ϕ 2
A 1 * ( 111 ) [ 1 ¯ 1 ¯ 2 ] 35.26/215.26450/90
125.269045
A 2 * ( 111 ) [ 11 2 ¯ ] 144.74450/90
54.74/234.749045
A ( 1 1 ¯ 1 ) [ 110 ] 035.2645
A ¯ ( 1 ¯ 1 1 ¯ ) [ 1 ¯ 1 ¯ 0 ] 18035.2645
B ( 1 1 ¯ 2 ) [ 110 ] 0/120/24054.7445
B ¯ ( 1 ¯ 1 2 ¯ ) [ 1 ¯ 1 ¯ 0 ] 60/18054.7445
C { 001 } 110 90/270450/90
0/1809045

